Embed Size (px)
Citation preview
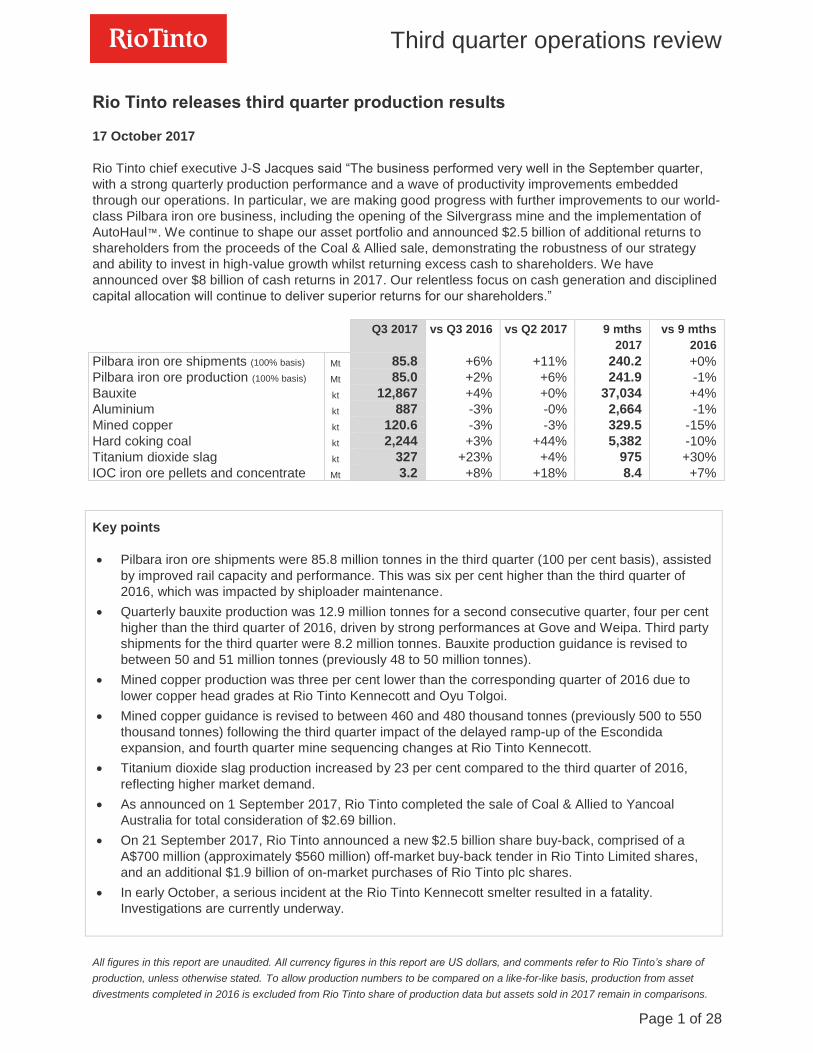
Third quarter operations review
Page 1 of 28
Rio Tinto releases third quarter production results
17 October 2017
Rio Tinto chief executive J-S Jacques said “The business performed very well in the September quarter,
with a strong quarterly production performance and a wave of productivity improvements embedded
through our operations. In particular, we are making good progress with further improvements to our world-
class Pilbara iron ore business, including the opening of the Silvergrass mine and the implementation of
AutoHaul™. We continue to shape our asset portfolio and announced $2.5 billion of additional returns to
shareholders from the proceeds of the Coal & Allied sale, demonstrating the robustness of our strategy
and ability to invest in high-value growth whilst returning excess cash to shareholders. We have
announced over $8 billion of cash returns in 2017. Our relentless focus on cash generation and disciplined
capital allocation will continue to deliver superior returns for our shareholders.”
Q3 2017 vs Q3 2016 vs Q2 2017 9 mths
2017
vs 9 mths
2016
Pilbara iron ore shipments (100% basis) Mt 85.8 +6% +11% 240.2 +0%
Pilbara iron ore production (100% basis) Mt 85.0 +2% +6% 241.9 -1%
Bauxite kt 12,867 +4% +0% 37,034 +4%
Aluminium kt 887 -3% -0% 2,664 -1%
Mined copper kt 120.6 -3% -3% 329.5 -15%
Hard coking coal kt 2,244 +3% +44% 5,382 -10%
Titanium dioxide slag kt 327 +23% +4% 975 +30%
IOC iron ore pellets and concentrate Mt 3.2 +8% +18% 8.4 +7%
Key points
Pilbara iron ore shipments were 85.8 million tonnes in the third quarter (100 per cent basis), assisted
by improved rail capacity and performance. This was six per cent higher than the third quarter of
2016, which was impacted by shiploader maintenance.
Quarterly bauxite production was 12.9 million tonnes for a second consecutive quarter, four per cent
higher than the third quarter of 2016, driven by strong performances at Gove and Weipa. Third party
shipments for the third quarter were 8.2 million tonnes. Bauxite production guidance is revised to
between 50 and 51 million tonnes (previously 48 to 50 million tonnes).
Mined copper production was three per cent lower than the corresponding quarter of 2016 due to
lower copper head grades at Rio Tinto Kennecott and Oyu Tolgoi.
Mined copper guidance is revised to between 460 and 480 thousand tonnes (previously 500 to 550
thousand tonnes) following the third quarter impact of the delayed ramp-up of the Escondida
expansion, and fourth quarter mine sequencing changes at Rio Tinto Kennecott.
Titanium dioxide slag production increased by 23 per cent compared to the third quarter of 2016,
reflecting higher market demand.
As announced on 1 September 2017, Rio Tinto completed the sale of Coal & Allied to Yancoal
Australia for total consideration of $2.69 billion.
On 21 September 2017, Rio Tinto announced a new $2.5 billion share buy-back, comprised of a
A$700 million (approximately $560 million) off-market buy-back tender in Rio Tinto Limited shares,
and an additional $1.9 billion of on-market purchases of Rio Tinto plc shares.
In early October, a serious incident at the Rio Tinto Kennecott smelter resulted in a fatality.
Investigations are currently underway.
All figures in this report are unaudited. All currency figures in this report are US dollars, and comments refer to Rio Tinto’s share of
production, unless otherwise stated. To allow production numbers to be compared on a like-for-like basis, production from asset
divestments completed in 2016 is excluded from Rio Tinto share of production data but assets sold in 2017 remain in comparisons.

Page 2 of 28
IRON ORE
Rio Tinto share of production (million tonnes)
Q3 2017 vs Q3 2016 vs Q2 2017 9 mths
2017
vs 9 mths
2016
Pilbara Blend Lump 20.7 +4% +5% 59.7 +4%
Pilbara Blend Fines 30.1 +2% +7% 85.2 -2%
Robe Valley Lump 1.6 +6% +8% 4.5 -0%
Robe Valley Fines 2.9 +6% +30% 7.5 -11%
Yandicoogina Fines (HIY) 14.5 -2% +7% 41.6 -3%
Total Pilbara production 69.7 198.4
Total Pilbara production (100% basis) 85.0 241.9
Pilbara operations
Pilbara operations produced 241.9 million tonnes (Rio Tinto share 198.4 million tonnes) in the first nine
months of 2017, one per cent lower than the same period of 2016, mainly due to weather disruptions in the
first half of the year. Third quarter production of 85.0 million tonnes (Rio Tinto share 69.7 million tonnes)
was two per cent higher than the third quarter of 2016 and six per cent higher than the previous quarter,
reflecting productivity enhancement projects across most sites.
Year-to-date sales of 240.2 million tonnes (Rio Tinto share 197.2 million tonnes) were in line with the same
period of 2016. Strong third quarter sales of 85.8 million tonnes (Rio Tinto share 70.0 million tonnes) were
assisted by improved rail capacity and performance. This was six per cent higher than the same period of
last year, which was impacted by shiploader maintenance, and 11 per cent higher than the previous
quarter.
Approximately 18 per cent of sales in the quarter were priced with reference to the prior quarter’s average
index lagged by one month. The remainder was sold either on current quarter average, current month
average or on the spot market.
Approximately 65 per cent of sales in the quarter were made on a cost and freight (CFR) basis, with the
remainder sold free on board (FOB).
Pilbara projects
Silvergrass mine was officially opened on 30 August this year by the Premier of Western Australia.
Commissioning of the conveyor system will commence in October and remains on target for completion in
the fourth quarter of this year. Silvergrass will ramp up to capacity in 2018.
The automation of the Pilbara train system (AutoHaul™) is continuing to progress well, with the successful
completion of the first autonomous train, without on-board supervision, on the mainline between Tom Price
and Paraburdoo (~100km). More than 50 per cent of all train kilometres are now completed in autonomous
mode with drivers on-board for supervision. Operational improvements from AutoHaul™ are already being
realised including reduced variability and increased speed across the network, helping to reduce average
cycle times. The project is on schedule to be completed by the end of 2018.
2017 guidance Rio Tinto’s expected Pilbara shipments in 2017, subject to weather, remain unchanged at around 330 million tonnes on a 100 per cent basis.
Page 3 of 28
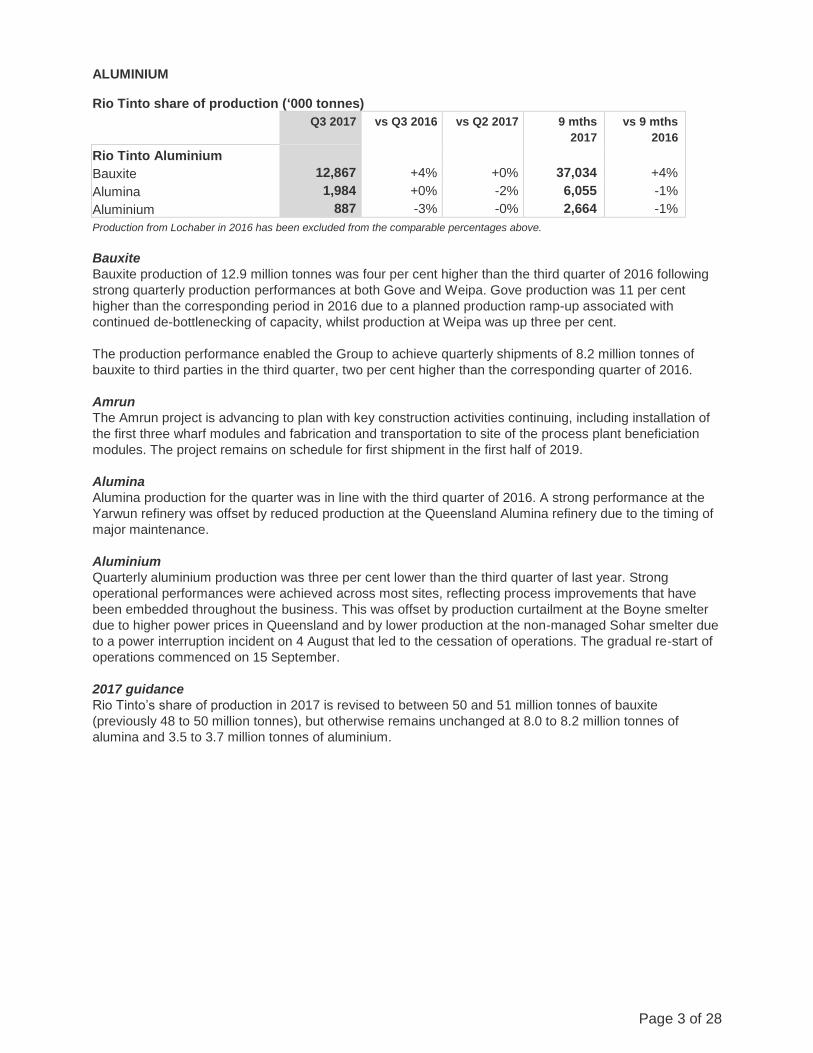
ALUMINIUM
Rio Tinto share of production (‘000 tonnes)
Q3 2017 vs Q3 2016 vs Q2 2017 9 mths
2017
vs 9 mths
2016
Rio Tinto Aluminium
Bauxite 12,867 +4% +0% 37,034 +4%
Alumina 1,984 +0% -2% 6,055 -1%
Aluminium 887 -3% -0% 2,664 -1%
Production from Lochaber in 2016 has been excluded from the comparable percentages above.
Bauxite
Bauxite production of 12.9 million tonnes was four per cent higher than the third quarter of 2016 following
strong quarterly production performances at both Gove and Weipa. Gove production was 11 per cent
higher than the corresponding period in 2016 due to a planned production ramp-up associated with
continued de-bottlenecking of capacity, whilst production at Weipa was up three per cent.
The production performance enabled the Group to achieve quarterly shipments of 8.2 million tonnes of
bauxite to third parties in the third quarter, two per cent higher than the corresponding quarter of 2016.
Amrun
The Amrun project is advancing to plan with key construction activities continuing, including installation of
the first three wharf modules and fabrication and transportation to site of the process plant beneficiation
modules. The project remains on schedule for first shipment in the first half of 2019.
Alumina
Alumina production for the quarter was in line with the third quarter of 2016. A strong performance at the
Yarwun refinery was offset by reduced production at the Queensland Alumina refinery due to the timing of
major maintenance.
Aluminium
Quarterly aluminium production was three per cent lower than the third quarter of last year. Strong
operational performances were achieved across most sites, reflecting process improvements that have
been embedded throughout the business. This was offset by production curtailment at the Boyne smelter
due to higher power prices in Queensland and by lower production at the non-managed Sohar smelter due
to a power interruption incident on 4 August that led to the cessation of operations. The gradual re-start of
operations commenced on 15 September.
2017 guidance
Rio Tinto’s share of production in 2017 is revised to between 50 and 51 million tonnes of bauxite
(previously 48 to 50 million tonnes), but otherwise remains unchanged at 8.0 to 8.2 million tonnes of
alumina and 3.5 to 3.7 million tonnes of aluminium.
Page 4 of 28
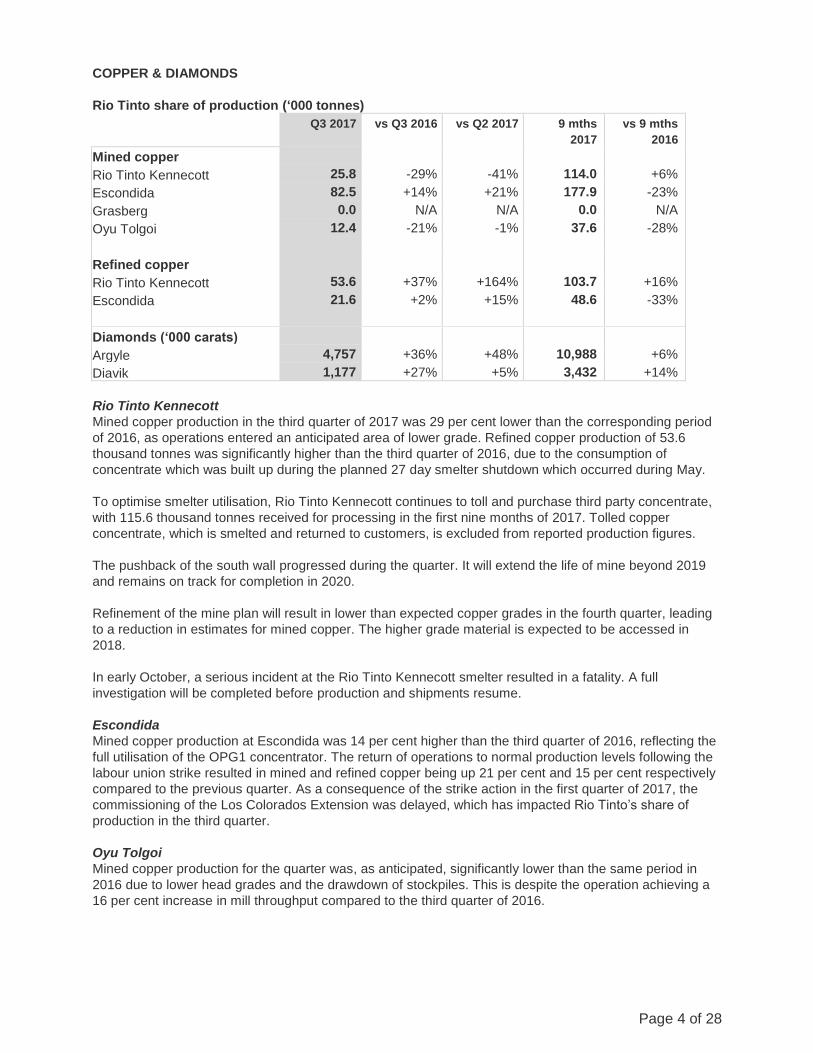
COPPER & DIAMONDS
Rio Tinto share of production (‘000 tonnes)
Q3 2017 vs Q3 2016 vs Q2 2017 9 mths
2017
vs 9 mths
2016
Mined copper
Rio Tinto Kennecott 25.8 -29% -41% 114.0 +6%
Escondida 82.5 +14% +21% 177.9 -23%
Grasberg 0.0 N/A N/A 0.0 N/A
Oyu Tolgoi 12.4 -21% -1% 37.6 -28%
Refined copper
Rio Tinto Kennecott 53.6 +37% +164% 103.7 +16%
Escondida 21.6 +2% +15% 48.6 -33%
Diamonds (‘000 carats)
Argyle 4,757 +36% +48% 10,988 +6%
Diavik 1,177 +27% +5% 3,432 +14%
Rio Tinto Kennecott
Mined copper production in the third quarter of 2017 was 29 per cent lower than the corresponding period
of 2016, as operations entered an anticipated area of lower grade. Refined copper production of 53.6
thousand tonnes was significantly higher than the third quarter of 2016, due to the consumption of
concentrate which was built up during the planned 27 day smelter shutdown which occurred during May.
To optimise smelter utilisation, Rio Tinto Kennecott continues to toll and purchase third party concentrate,
with 115.6 thousand tonnes received for processing in the first nine months of 2017. Tolled copper
concentrate, which is smelted and returned to customers, is excluded from reported production figures.
The pushback of the south wall progressed during the quarter. It will extend the life of mine beyond 2019
and remains on track for completion in 2020.
Refinement of the mine plan will result in lower than expected copper grades in the fourth quarter, leading
to a reduction in estimates for mined copper. The higher grade material is expected to be accessed in
2018.
In early October, a serious incident at the Rio Tinto Kennecott smelter resulted in a fatality. A full
investigation will be completed before production and shipments resume.
Escondida
Mined copper production at Escondida was 14 per cent higher than the third quarter of 2016, reflecting the
full utilisation of the OPG1 concentrator. The return of operations to normal production levels following the
labour union strike resulted in mined and refined copper being up 21 per cent and 15 per cent respectively
compared to the previous quarter. As a consequence of the strike action in the first quarter of 2017, the
commissioning of the Los Colorados Extension was delayed, which has impacted Rio Tinto’s share of
production in the third quarter.
Oyu Tolgoi
Mined copper production for the quarter was, as anticipated, significantly lower than the same period in
2016 due to lower head grades and the drawdown of stockpiles. This is despite the operation achieving a
16 per cent increase in mill throughput compared to the third quarter of 2016.
Page 5 of 28
Oyu Tolgoi Underground Project
New contractors continue to mobilise and the project workforce is now almost 3,000 on site, 89 per cent of
whom are Mongolian nationals. Key project activities, including the sinking of shaft #2 and shaft #5,
underground mine development and the conveyor to surface decline continue to progress. The first two
buildings of the accommodation camp will be completed in the fourth quarter of 2017. Construction of the
first draw bell is still expected in mid-2020.
Grasberg
Through a joint venture agreement with Freeport-McMoRan Inc. (Freeport), Rio Tinto is entitled to the cash
flow associated with 40 per cent of material mined above an agreed threshold as a consequence of
expansions and developments of the Grasberg facilities since 1998.
On 12 January 2017, the Government of Indonesia issued new mining regulations to address exports of
unrefined metals, including copper concentrates, and other matters related to the mining sector. These
regulations impact PT Freeport Indonesia’s (‘PT-FI’) operating rights, including its right to continue to
export concentrate without restriction, and, as a result, have a significant impact on Rio Tinto’s share of
production in 2017. Rio Tinto's full participation beyond 2021 is likely to be delayed due to the application
of force majeure provisions in the joint venture agreement between Rio Tinto and PT-FI.
In April 2017, Freeport reached agreement with the Indonesian government to resume concentrate exports
(which had been suspended) for a six month period expiring in October 2017. A further three month permit
extension to January 2018 was granted by the government in October 2017. During this period, Freeport
will continue to negotiate the new operating licenses and investment stability agreement. Discussions are
continuing between Freeport and the Indonesian government to reach a mutually satisfactory longer-term
agreement.
Rio Tinto is reporting its metal share for the third quarter as zero.
Diamonds
At Argyle, quarterly carat production was 36 per cent higher than the third quarter of 2016 due to the
processing of higher grade alluvial tailings.
At Diavik, carats recovered in the third quarter of 2017 were 27 per cent higher than the corresponding
period in 2016 due to higher recovered grades. Development of the A21 pipe remains on schedule.
2017 guidance
Rio Tinto’s expected share of mined copper production for 2017 is revised to between 460 and 480
thousand tonnes (previously 500 to 550 thousand tonnes) after assessing the impact of the delayed ramp-
up of the Los Colorados Extension project at Escondida and the impact of mine sequencing changes at
Rio Tinto Kennecott. Refined copper production guidance remains unchanged at 185 to 225 thousand
tonnes, subject to the impact of the investigation at the Rio Tinto Kennecott smelter.
Diamond production guidance for 2017 has been revised to between 19 and 22 million carats (previously
19 to 24 million carats).
Page 6 of 28
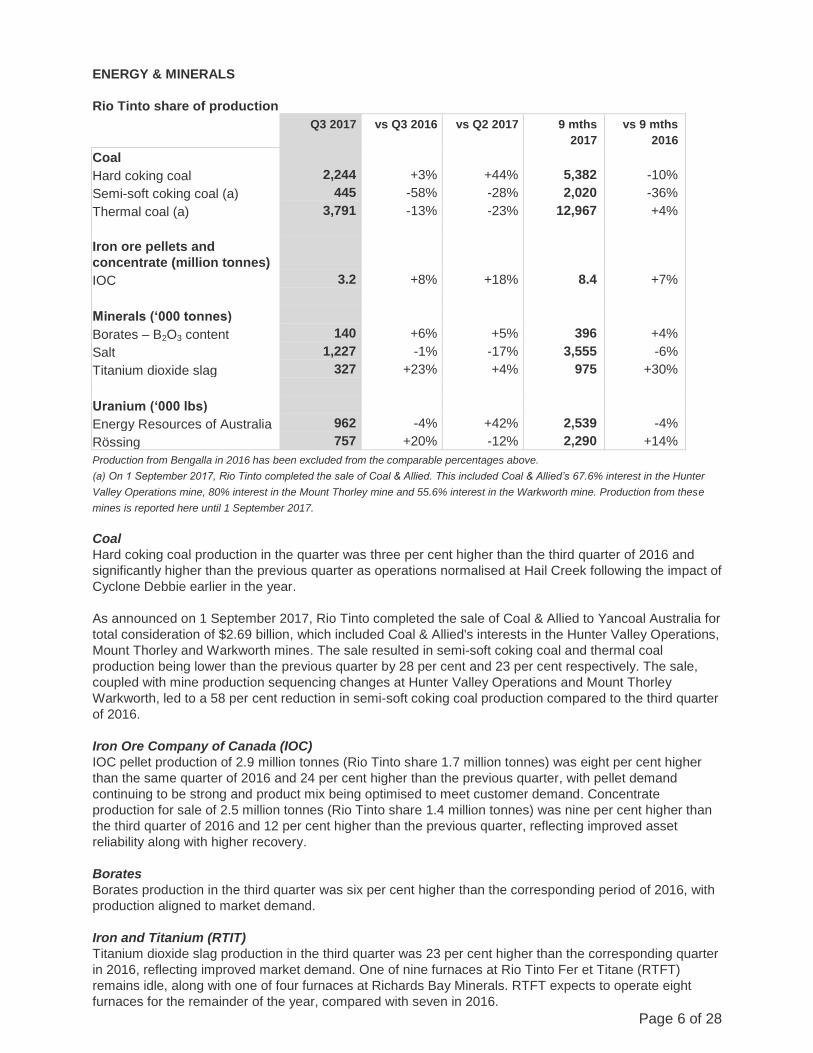
ENERGY & MINERALS
Rio Tinto share of production
Q3 2017 vs Q3 2016 vs Q2 2017 9 mths
2017
vs 9 mths
2016
Coal
Hard coking coal 2,244 +3% +44% 5,382 -10%
Semi-soft coking coal (a) 445 -58% -28% 2,020 -36%
Thermal coal (a) 3,791 -13% -23% 12,967 +4%
Iron ore pellets and
concentrate (million tonnes)
IOC 3.2 +8% +18% 8.4 +7%
Minerals (‘000 tonnes)
Borates – B2O3 content 140 +6% +5% 396 +4%
Salt 1,227 -1% -17% 3,555 -6%
Titanium dioxide slag 327 +23% +4% 975 +30%
Uranium (‘000 lbs)
Energy Resources of Australia 962 -4% +42% 2,539 -4%
Rössing 757 +20% -12% 2,290 +14%
Production from Bengalla in 2016 has been excluded from the comparable percentages above.
(a) On 1 September 2017, Rio Tinto completed the sale of Coal & Allied. This included Coal & Allied’s 67.6% interest in the Hunter
Valley Operations mine, 80% interest in the Mount Thorley mine and 55.6% interest in the Warkworth mine. Production from these
mines is reported here until 1 September 2017.
Coal
Hard coking coal production in the quarter was three per cent higher than the third quarter of 2016 and
significantly higher than the previous quarter as operations normalised at Hail Creek following the impact of
Cyclone Debbie earlier in the year.
As announced on 1 September 2017, Rio Tinto completed the sale of Coal & Allied to Yancoal Australia for
total consideration of $2.69 billion, which included Coal & Allied's interests in the Hunter Valley Operations,
Mount Thorley and Warkworth mines. The sale resulted in semi-soft coking coal and thermal coal
production being lower than the previous quarter by 28 per cent and 23 per cent respectively. The sale,
coupled with mine production sequencing changes at Hunter Valley Operations and Mount Thorley
Warkworth, led to a 58 per cent reduction in semi-soft coking coal production compared to the third quarter
of 2016.
Iron Ore Company of Canada (IOC)
IOC pellet production of 2.9 million tonnes (Rio Tinto share 1.7 million tonnes) was eight per cent higher
than the same quarter of 2016 and 24 per cent higher than the previous quarter, with pellet demand
continuing to be strong and product mix being optimised to meet customer demand. Concentrate
production for sale of 2.5 million tonnes (Rio Tinto share 1.4 million tonnes) was nine per cent higher than
the third quarter of 2016 and 12 per cent higher than the previous quarter, reflecting improved asset
reliability along with higher recovery.
Borates
Borates production in the third quarter was six per cent higher than the corresponding period of 2016, with
production aligned to market demand.
Iron and Titanium (RTIT)
Titanium dioxide slag production in the third quarter was 23 per cent higher than the corresponding quarter
in 2016, reflecting improved market demand. One of nine furnaces at Rio Tinto Fer et Titane (RTFT)
remains idle, along with one of four furnaces at Richards Bay Minerals. RTFT expects to operate eight
furnaces for the remainder of the year, compared with seven in 2016.
Page 7 of 28
Salt
Salt production in the third quarter was marginally lower than the same period in 2016.
Uranium
Energy Resources of Australia continues to process existing stockpiles. Third quarter production in 2017
was four per cent lower than the corresponding period in 2016.
Production at Rössing was 20 per cent higher than the third quarter in 2016 due to higher grades and mill
throughput.
2017 guidance
Following the divestment of Coal & Allied, guidance for Rio Tinto’s expected share of 2017 production is
revised to 13 to 14 million tonnes of thermal coal (previously 17 to 18 million tonnes) and 2.0 million tonnes
of semi-soft coking coal (previously 3.3 to 3.9 million tonnes). Otherwise, guidance for Rio Tinto’s expected
share of 2017 production is unchanged at 7.2 to 7.8 million tonnes of hard coking coal, 11.4 to 12.4 million
tonnes of iron ore pellets and concentrates, 0.5 million tonnes of boric oxide equivalent production, 1.2 to
1.3 million tonnes of titanium dioxide slag, and 6.5 to 7.5 million pounds of uranium.
CORPORATE On 21 September 2017, Rio Tinto announced a new $2.5 billion share buy-back, returning the proceeds of the sale of Coal & Allied to its shareholders. The buy-back is to be executed through a combination of an off-market buy-back tender, targeting approximately A$700 million (approximately $560 million) of Rio Tinto Limited shares, with the balance of approximately $1.9 billion of additional funds being allocated to Rio Tinto’s existing on-market purchase of Rio Tinto plc shares. The off-market buy-back of Rio Tinto Limited shares is expected to be undertaken in the fourth quarter of 2017, with the on-market buy-back of Rio Tinto plc shares expected to be completed by the end of 2018.
Page 8 of 28
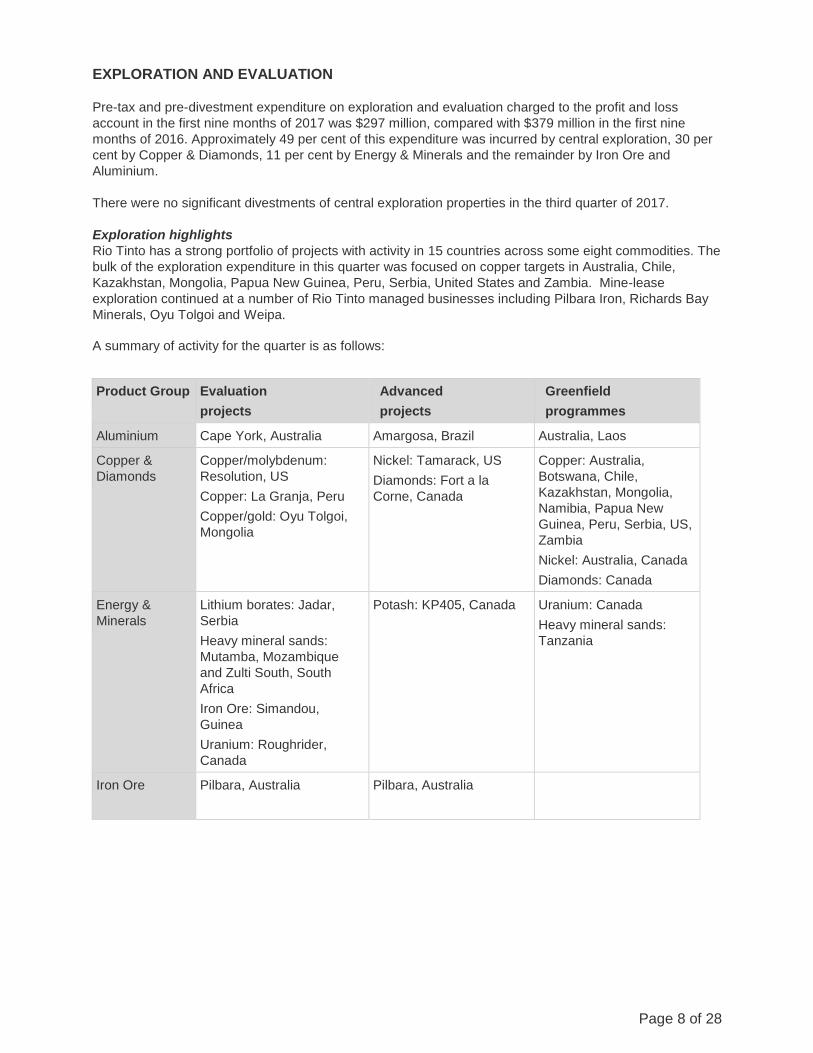
EXPLORATION AND EVALUATION
Pre-tax and pre-divestment expenditure on exploration and evaluation charged to the profit and loss
account in the first nine months of 2017 was $297 million, compared with $379 million in the first nine
months of 2016. Approximately 49 per cent of this expenditure was incurred by central exploration, 30 per
cent by Copper & Diamonds, 11 per cent by Energy & Minerals and the remainder by Iron Ore and
Aluminium.
There were no significant divestments of central exploration properties in the third quarter of 2017.
Exploration highlights
Rio Tinto has a strong portfolio of projects with activity in 15 countries across some eight commodities. The
bulk of the exploration expenditure in this quarter was focused on copper targets in Australia, Chile,
Kazakhstan, Mongolia, Papua New Guinea, Peru, Serbia, United States and Zambia. Mine-lease
exploration continued at a number of Rio Tinto managed businesses including Pilbara Iron, Richards Bay
Minerals, Oyu Tolgoi and Weipa.
A summary of activity for the quarter is as follows:
Product Group Evaluation
projects
Advanced
projects
Greenfield
programmes
Aluminium Cape York, Australia Amargosa, Brazil Australia, Laos
Copper &
Diamonds
Copper/molybdenum:
Resolution, US
Copper: La Granja, Peru
Copper/gold: Oyu Tolgoi,
Mongolia
Nickel: Tamarack, US
Diamonds: Fort a la
Corne, Canada
Copper: Australia,
Botswana, Chile,
Kazakhstan, Mongolia,
Namibia, Papua New
Guinea, Peru, Serbia, US,
Zambia
Nickel: Australia, Canada
Diamonds: Canada
Energy &
Minerals
Lithium borates: Jadar,
Serbia
Heavy mineral sands:
Mutamba, Mozambique
and Zulti South, South
Africa
Iron Ore: Simandou,
Guinea
Uranium: Roughrider,
Canada
Potash: KP405, Canada Uranium: Canada
Heavy mineral sands:
Tanzania
Iron Ore Pilbara, Australia Pilbara, Australia
Page 9 of 28
Forward-looking statements
This announcement may include "forward-looking statements" within the meaning of the US Private Securities Litigation Reform Act of 1995. All statements other than statements of historical facts included in this announcement, including, without limitation, those regarding Rio Tinto’s production forecast or guidance, financial position, business strategy, plans and objectives of management for future operations (including development plans and objectives relating to Rio Tinto’s products and reserve and resource positions), are forward-looking statements. The words “intend”, “aim”, “project”, “anticipate”, “estimate”, “plan”, “believes”, “expects”, “may”, “should”, “will”, “target”, “set to”, “assumes” or similar expressions, commonly identify such forward looking statements. Such forward-looking statements involve known and unknown risks, uncertainties and other factors which may cause the actual production, performance or results of Rio Tinto to be materially different from any future production, performance or results expressed or implied by such forward-looking statements. Such forward-looking statements could be influenced by such risk factors as identified in Rio Tinto's most recent Annual Report and Accounts in Australia and the United Kingdom and the most recent Annual Report on Form 20-F filed with the United States Securities and Exchange Commission (the "SEC") or Form 6-Ks furnished to, or filed with, the SEC. Forward-looking statements should, therefore, be construed in light of such risk factors and undue reliance should not be placed on forward-looking statements. These forward-looking statements speak only as of the date of this announcement. Rio Tinto expressly disclaims any obligation or undertaking (except as required by applicable law, the UK Listing Rules, the Disclosure and Transparency Rules of the Financial Conduct Authority and the Listing Rules of the Australian Securities Exchange) to release publicly any updates or revisions to any forward-looking statement contained herein to reflect any change in Rio Tinto’s expectations with regard thereto or any change in events, conditions or circumstances on which any such statement is based. Nothing in this announcement should be interpreted to mean that future earnings per share of Rio Tinto plc or Rio Tinto Limited will necessarily match or exceed its historical published earnings per share.

Page 10 of 28
Contacts
www.riotinto.com
Follow @riotinto on Twitter
Media Relations
Illtud Harri
T +44 20 7781 1152
M +44 7920 503 600
David Outhwaite
T +44 20 7781 1623
M +44 7787 597 493
David Luff
T + 44 20 7781 1177
M + 44 7780 226 422
Investor Relations, EMEA/Americas
John Smelt
T +44 20 7781 1654
M +44 7879 642 675
David Ovington
T +44 20 7781 2051
M +44 7920 010 978
Nick Parkinson
T +44 20 7781 1552
M +44 7810 657 556
Investor Relations, Australia/Asia
Natalie Worley
T +61 3 9283 3063
M +61 409 210 462
Rachel Storrs
T +61 3 9283 3628
M +61 417 401 018
Rio Tinto plc
6 St James’s Square
London SW1Y 4AD
United Kingdom
T +44 20 7781 2000
Registered in England
No. 719885
Rio Tinto Limited
Level 7, 360 Collins Street
Melbourne 3000
Australia
T +61 3 9283 3333
Registered in Australia
ABN 96 004 458 404
Page 11 of 28
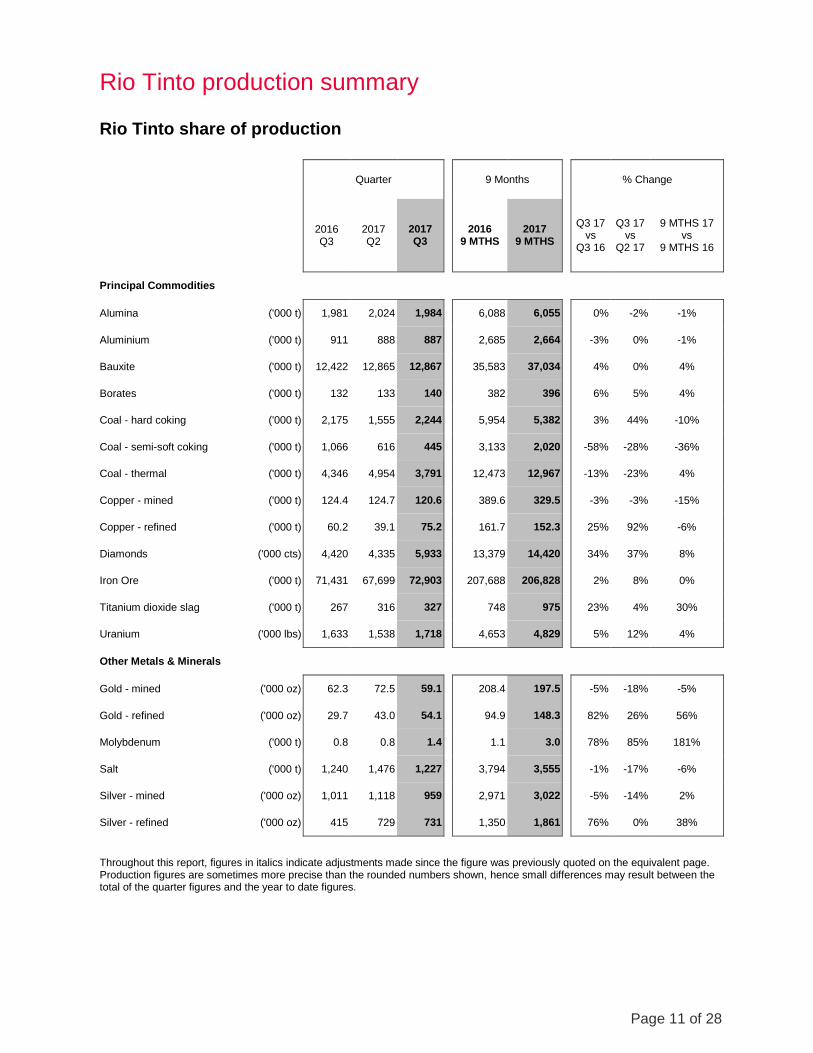
Rio Tinto production summary
Rio Tinto share of production
Quarter
9 Months % Change
2016 Q3
2017 Q2
2017 Q3
2016
9 MTHS 2017
9 MTHS
Q3 17 vs
Q3 16
Q3 17 vs
Q2 17
9 MTHS 17 vs
9 MTHS 16
Principal Commodities
Alumina ('000 t) 1,981 2,024 1,984 6,088 6,055 0% -2% -1%
Aluminium ('000 t) 911 888 887 2,685 2,664 -3% 0% -1%
Bauxite ('000 t) 12,422 12,865 12,867 35,583 37,034 4% 0% 4%
Borates ('000 t) 132 133 140 382 396 6% 5% 4%
Coal - hard coking ('000 t) 2,175 1,555 2,244 5,954 5,382 3% 44% -10%
Coal - semi-soft coking ('000 t) 1,066 616 445 3,133 2,020 -58% -28% -36%
Coal - thermal ('000 t) 4,346 4,954 3,791 12,473 12,967 -13% -23% 4%
Copper - mined ('000 t) 124.4 124.7 120.6 389.6 329.5 -3% -3% -15%
Copper - refined ('000 t) 60.2 39.1 75.2 161.7 152.3 25% 92% -6%
Diamonds ('000 cts) 4,420 4,335 5,933 13,379 14,420 34% 37% 8%
Iron Ore ('000 t) 71,431 67,699 72,903 207,688 206,828 2% 8% 0%
Titanium dioxide slag ('000 t) 267 316 327 748 975 23% 4% 30%
Uranium ('000 lbs) 1,633 1,538 1,718 4,653 4,829 5% 12% 4%
Other Metals & Minerals
Gold - mined ('000 oz) 62.3 72.5 59.1 208.4 197.5 -5% -18% -5%
Gold - refined ('000 oz) 29.7 43.0 54.1 94.9 148.3 82% 26% 56%
Molybdenum ('000 t) 0.8 0.8 1.4 1.1 3.0 78% 85% 181%
Salt ('000 t) 1,240 1,476 1,227 3,794 3,555 -1% -17% -6%
Silver - mined ('000 oz) 1,011 1,118 959 2,971 3,022 -5% -14% 2%
Silver - refined ('000 oz) 415 729 731 1,350 1,861 76% 0% 38%
Throughout this report, figures in italics indicate adjustments made since the figure was previously quoted on the equivalent page. Production figures are sometimes more precise than the rounded numbers shown, hence small differences may result between the total of the quarter figures and the year to date figures.
Page 12 of 28
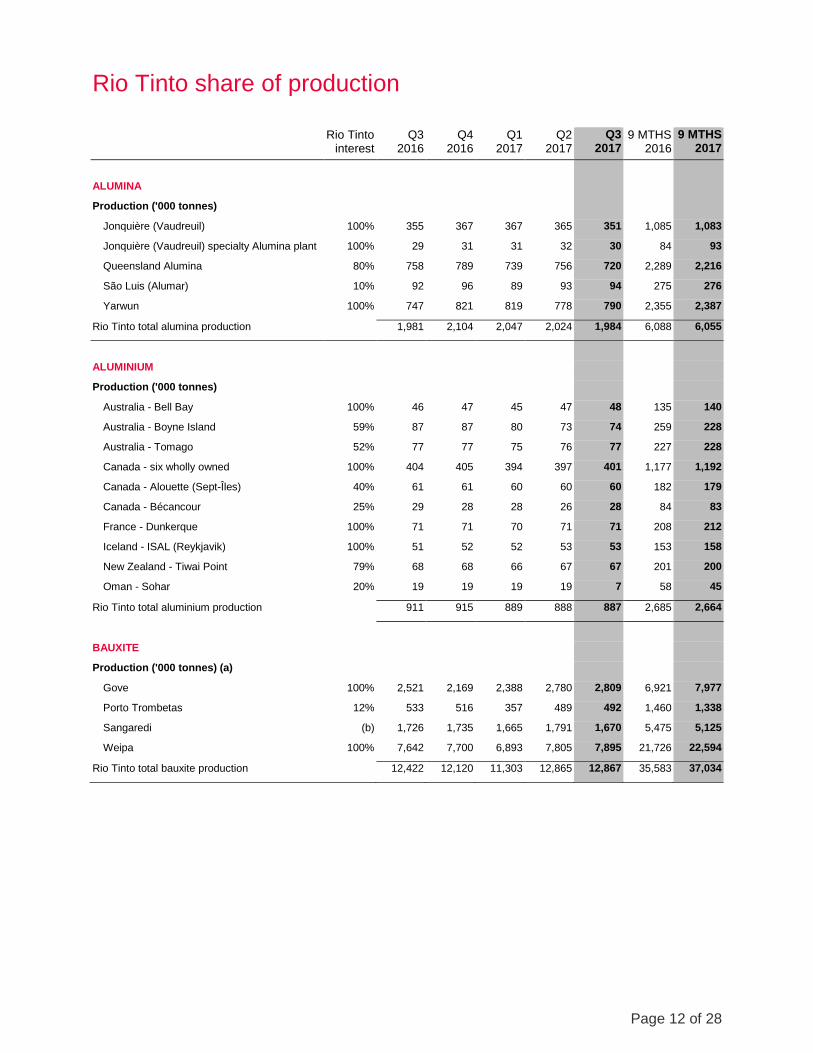
Rio Tinto share of production
Rio Tinto interest
Q3 2016
Q4 2016
Q1 2017
Q2 2017
Q3 2017
9 MTHS 2016
9 MTHS 2017
ALUMINA
Production ('000 tonnes)
Jonquière (Vaudreuil) 100% 355 367 367 365 351 1,085 1,083
Jonquière (Vaudreuil) specialty Alumina plant 100% 29 31 31 32 30 84 93
Queensland Alumina 80% 758 789 739 756 720 2,289 2,216
São Luis (Alumar) 10% 92 96 89 93 94 275 276
Yarwun 100% 747 821 819 778 790 2,355 2,387
Rio Tinto total alumina production 1,981 2,104 2,047 2,024 1,984 6,088 6,055
ALUMINIUM
Production ('000 tonnes)
Australia - Bell Bay 100% 46 47 45 47 48 135 140
Australia - Boyne Island 59% 87 87 80 73 74 259 228
Australia - Tomago 52% 77 77 75 76 77 227 228
Canada - six wholly owned 100% 404 405 394 397 401 1,177 1,192
Canada - Alouette (Sept-Îles) 40% 61 61 60 60 60 182 179
Canada - Bécancour 25% 29 28 28 26 28 84 83
France - Dunkerque 100% 71 71 70 71 71 208 212
Iceland - ISAL (Reykjavik) 100% 51 52 52 53 53 153 158
New Zealand - Tiwai Point 79% 68 68 66 67 67 201 200
Oman - Sohar 20% 19 19 19 19 7 58 45
Rio Tinto total aluminium production 911 915 889 888 887 2,685 2,664
BAUXITE
Production ('000 tonnes) (a)
Gove 100% 2,521 2,169 2,388 2,780 2,809 6,921 7,977
Porto Trombetas 12% 533 516 357 489 492 1,460 1,338
Sangaredi (b) 1,726 1,735 1,665 1,791 1,670 5,475 5,125
Weipa 100% 7,642 7,700 6,893 7,805 7,895 21,726 22,594
Rio Tinto total bauxite production 12,422 12,120 11,303 12,865 12,867 35,583 37,034
Page 13 of 28
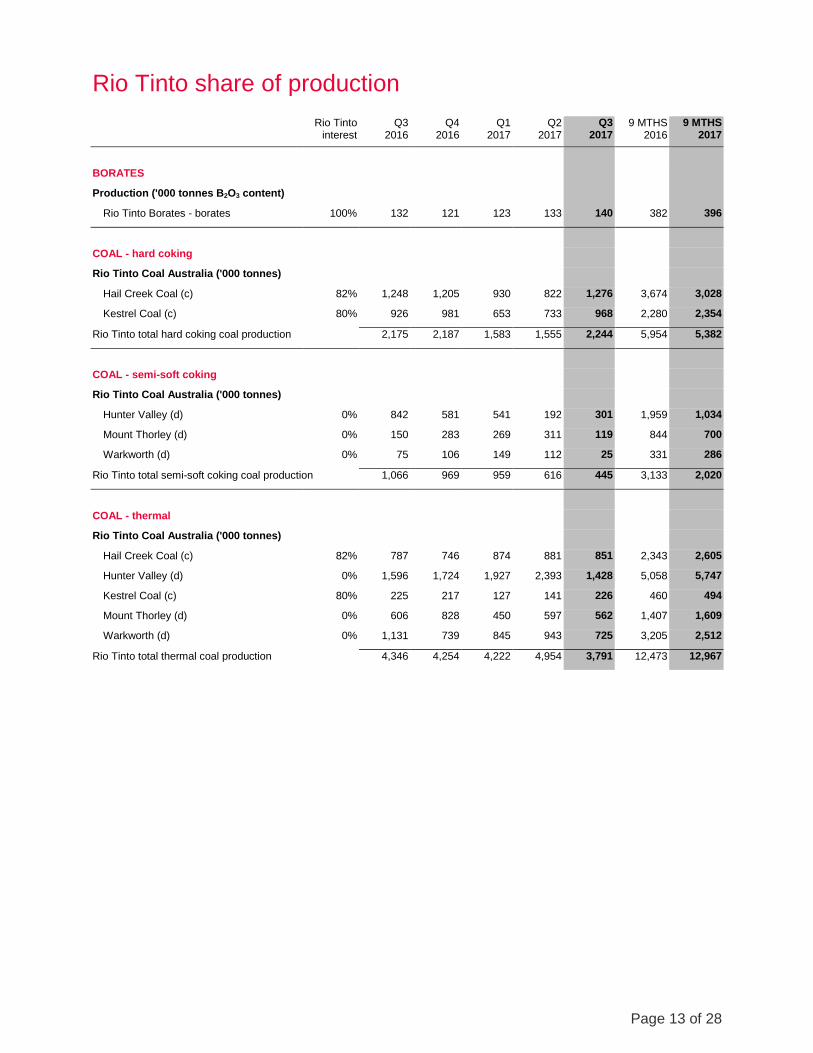
Rio Tinto share of production
Rio Tinto interest
Q3 2016
Q4 2016
Q1 2017
Q2 2017
Q3 2017
9 MTHS 2016
9 MTHS 2017
BORATES
Production ('000 tonnes B2O3 content)
Rio Tinto Borates - borates 100% 132 121 123 133 140 382 396
COAL - hard coking
Rio Tinto Coal Australia ('000 tonnes)
Hail Creek Coal (c) 82% 1,248 1,205 930 822 1,276 3,674 3,028
Kestrel Coal (c) 80% 926 981 653 733 968 2,280 2,354
Rio Tinto total hard coking coal production 2,175 2,187 1,583 1,555 2,244 5,954 5,382
COAL - semi-soft coking
Rio Tinto Coal Australia ('000 tonnes)
Hunter Valley (d) 0% 842 581 541 192 301 1,959 1,034
Mount Thorley (d) 0% 150 283 269 311 119 844 700
Warkworth (d) 0% 75 106 149 112 25 331 286
Rio Tinto total semi-soft coking coal production 1,066 969 959 616 445 3,133 2,020
COAL - thermal
Rio Tinto Coal Australia ('000 tonnes)
Hail Creek Coal (c) 82% 787 746 874 881 851 2,343 2,605
Hunter Valley (d) 0% 1,596 1,724 1,927 2,393 1,428 5,058 5,747
Kestrel Coal (c) 80% 225 217 127 141 226 460 494
Mount Thorley (d) 0% 606 828 450 597 562 1,407 1,609
Warkworth (d) 0% 1,131 739 845 943 725 3,205 2,512
Rio Tinto total thermal coal production 4,346 4,254 4,222 4,954 3,791 12,473 12,967
Page 14 of 28
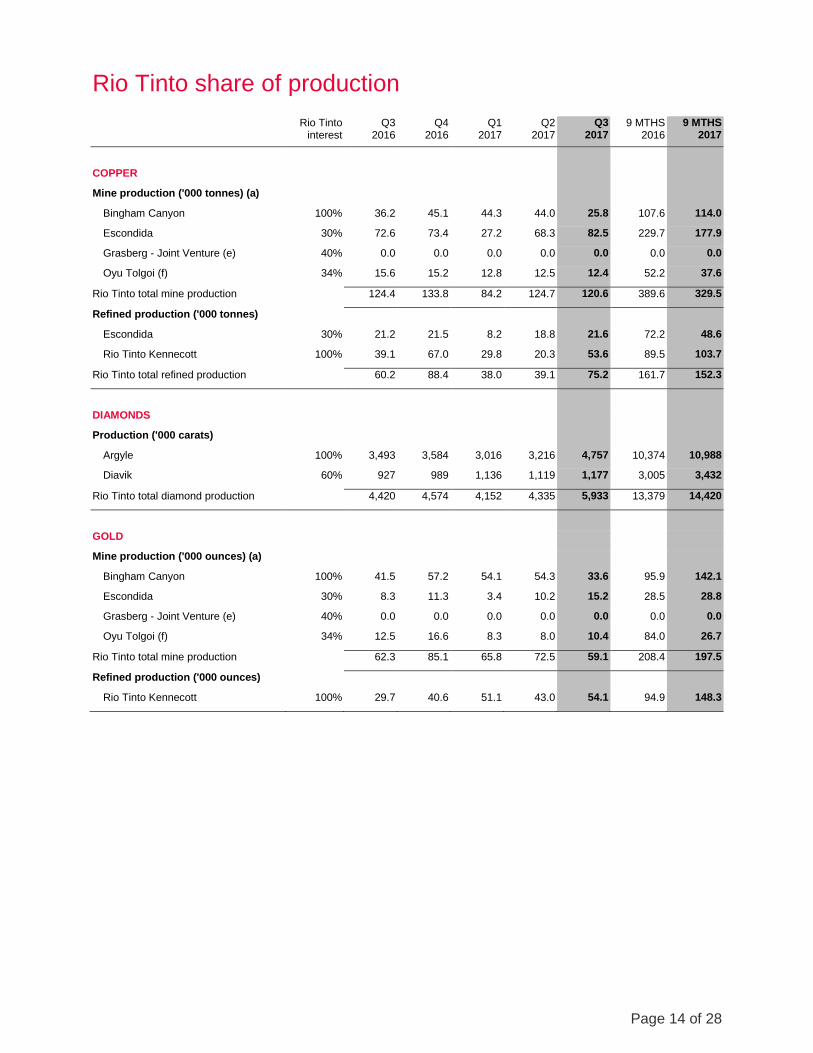
Rio Tinto share of production
Rio Tinto interest
Q3 2016
Q4 2016
Q1 2017
Q2 2017
Q3 2017
9 MTHS 2016
9 MTHS 2017
COPPER
Mine production ('000 tonnes) (a)
Bingham Canyon 100% 36.2 45.1 44.3 44.0 25.8 107.6 114.0
Escondida 30% 72.6 73.4 27.2 68.3 82.5 229.7 177.9
Grasberg - Joint Venture (e) 40% 0.0 0.0 0.0 0.0 0.0 0.0 0.0
Oyu Tolgoi (f) 34% 15.6 15.2 12.8 12.5 12.4 52.2 37.6
Rio Tinto total mine production 124.4 133.8 84.2 124.7 120.6 389.6 329.5
Refined production ('000 tonnes)
Escondida 30% 21.2 21.5 8.2 18.8 21.6 72.2 48.6
Rio Tinto Kennecott 100% 39.1 67.0 29.8 20.3 53.6 89.5 103.7
Rio Tinto total refined production 60.2 88.4 38.0 39.1 75.2 161.7 152.3
DIAMONDS
Production ('000 carats)
Argyle 100% 3,493 3,584 3,016 3,216 4,757 10,374 10,988
Diavik 60% 927 989 1,136 1,119 1,177 3,005 3,432
Rio Tinto total diamond production 4,420 4,574 4,152 4,335 5,933 13,379 14,420
GOLD
Mine production ('000 ounces) (a)
Bingham Canyon 100% 41.5 57.2 54.1 54.3 33.6 95.9 142.1
Escondida 30% 8.3 11.3 3.4 10.2 15.2 28.5 28.8
Grasberg - Joint Venture (e) 40% 0.0 0.0 0.0 0.0 0.0 0.0 0.0
Oyu Tolgoi (f) 34% 12.5 16.6 8.3 8.0 10.4 84.0 26.7
Rio Tinto total mine production 62.3 85.1 65.8 72.5 59.1 208.4 197.5
Refined production ('000 ounces)
Rio Tinto Kennecott 100% 29.7 40.6 51.1 43.0 54.1 94.9 148.3
Page 15 of 28
Rio Tinto share of production
Rio Tinto interest
Q3 2016
Q4 2016
Q1 2017
Q2 2017
Q3 2017
9 MTHS 2016
9 MTHS 2017
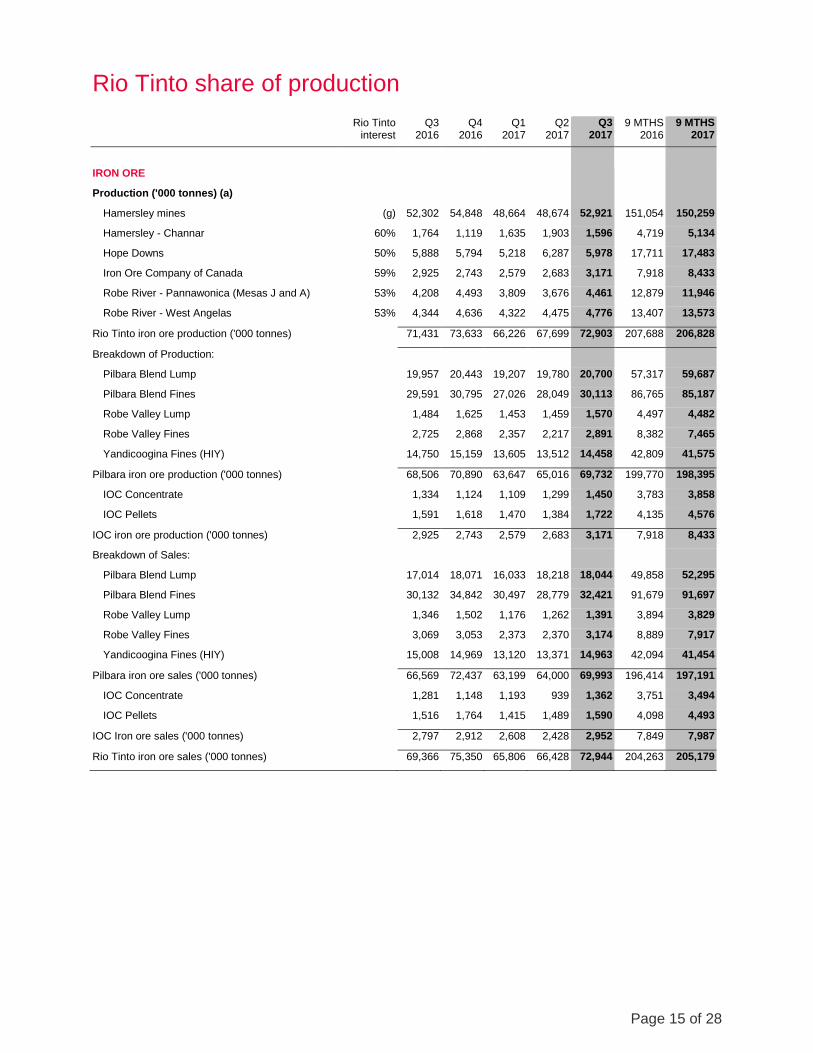
IRON ORE
Production ('000 tonnes) (a)
Hamersley mines (g) 52,302 54,848 48,664 48,674 52,921 151,054 150,259
Hamersley - Channar 60% 1,764 1,119 1,635 1,903 1,596 4,719 5,134
Hope Downs 50% 5,888 5,794 5,218 6,287 5,978 17,711 17,483
Iron Ore Company of Canada 59% 2,925 2,743 2,579 2,683 3,171 7,918 8,433
Robe River - Pannawonica (Mesas J and A) 53% 4,208 4,493 3,809 3,676 4,461 12,879 11,946
Robe River - West Angelas 53% 4,344 4,636 4,322 4,475 4,776 13,407 13,573
Rio Tinto iron ore production ('000 tonnes) 71,431 73,633 66,226 67,699 72,903 207,688 206,828
Breakdown of Production:
Pilbara Blend Lump 19,957 20,443 19,207 19,780 20,700 57,317 59,687
Pilbara Blend Fines 29,591 30,795 27,026 28,049 30,113 86,765 85,187
Robe Valley Lump 1,484 1,625 1,453 1,459 1,570 4,497 4,482
Robe Valley Fines 2,725 2,868 2,357 2,217 2,891 8,382 7,465
Yandicoogina Fines (HIY) 14,750 15,159 13,605 13,512 14,458 42,809 41,575
Pilbara iron ore production ('000 tonnes) 68,506 70,890 63,647 65,016 69,732 199,770 198,395
IOC Concentrate 1,334 1,124 1,109 1,299 1,450 3,783 3,858
IOC Pellets 1,591 1,618 1,470 1,384 1,722 4,135 4,576
IOC iron ore production ('000 tonnes) 2,925 2,743 2,579 2,683 3,171 7,918 8,433
Breakdown of Sales:
Pilbara Blend Lump 17,014 18,071 16,033 18,218 18,044 49,858 52,295
Pilbara Blend Fines 30,132 34,842 30,497 28,779 32,421 91,679 91,697
Robe Valley Lump 1,346 1,502 1,176 1,262 1,391 3,894 3,829
Robe Valley Fines 3,069 3,053 2,373 2,370 3,174 8,889 7,917
Yandicoogina Fines (HIY) 15,008 14,969 13,120 13,371 14,963 42,094 41,454
Pilbara iron ore sales ('000 tonnes) 66,569 72,437 63,199 64,000 69,993 196,414 197,191
IOC Concentrate 1,281 1,148 1,193 939 1,362 3,751 3,494
IOC Pellets 1,516 1,764 1,415 1,489 1,590 4,098 4,493
IOC Iron ore sales ('000 tonnes) 2,797 2,912 2,608 2,428 2,952 7,849 7,987
Rio Tinto iron ore sales ('000 tonnes) 69,366 75,350 65,806 66,428 72,944 204,263 205,179
Page 16 of 28
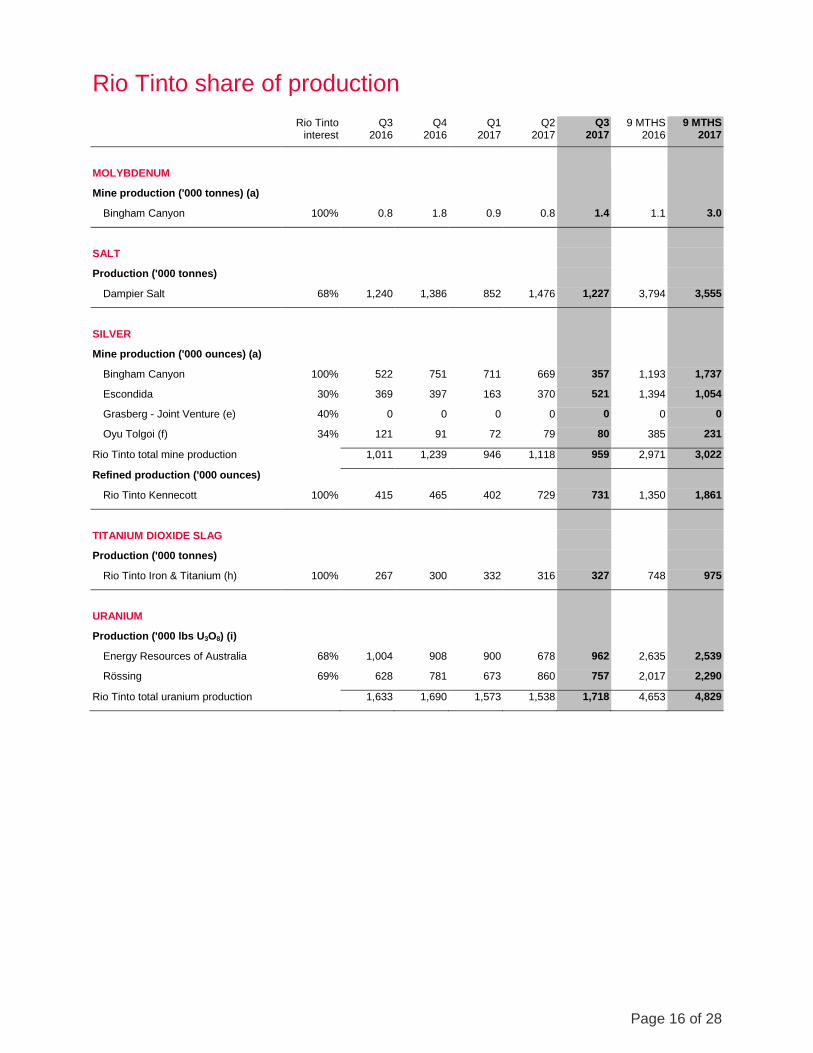
Rio Tinto share of production
Rio Tinto interest
Q3 2016
Q4 2016
Q1 2017
Q2 2017
Q3 2017
9 MTHS 2016
9 MTHS 2017
MOLYBDENUM
Mine production ('000 tonnes) (a)
Bingham Canyon 100% 0.8 1.8 0.9 0.8 1.4 1.1 3.0
SALT
Production ('000 tonnes)
Dampier Salt 68% 1,240 1,386 852 1,476 1,227 3,794 3,555
SILVER
Mine production ('000 ounces) (a)
Bingham Canyon 100% 522 751 711 669 357 1,193 1,737
Escondida 30% 369 397 163 370 521 1,394 1,054
Grasberg - Joint Venture (e) 40% 0 0 0 0 0 0 0
Oyu Tolgoi (f) 34% 121 91 72 79 80 385 231
Rio Tinto total mine production 1,011 1,239 946 1,118 959 2,971 3,022
Refined production ('000 ounces)
Rio Tinto Kennecott 100% 415 465 402 729 731 1,350 1,861
TITANIUM DIOXIDE SLAG
Production ('000 tonnes)
Rio Tinto Iron & Titanium (h) 100% 267 300 332 316 327 748 975
URANIUM
Production ('000 lbs U3O8) (i)
Energy Resources of Australia 68% 1,004 908 900 678 962 2,635 2,539
Rössing 69% 628 781 673 860 757 2,017 2,290
Rio Tinto total uranium production 1,633 1,690 1,573 1,538 1,718 4,653 4,829
Page 17 of 28
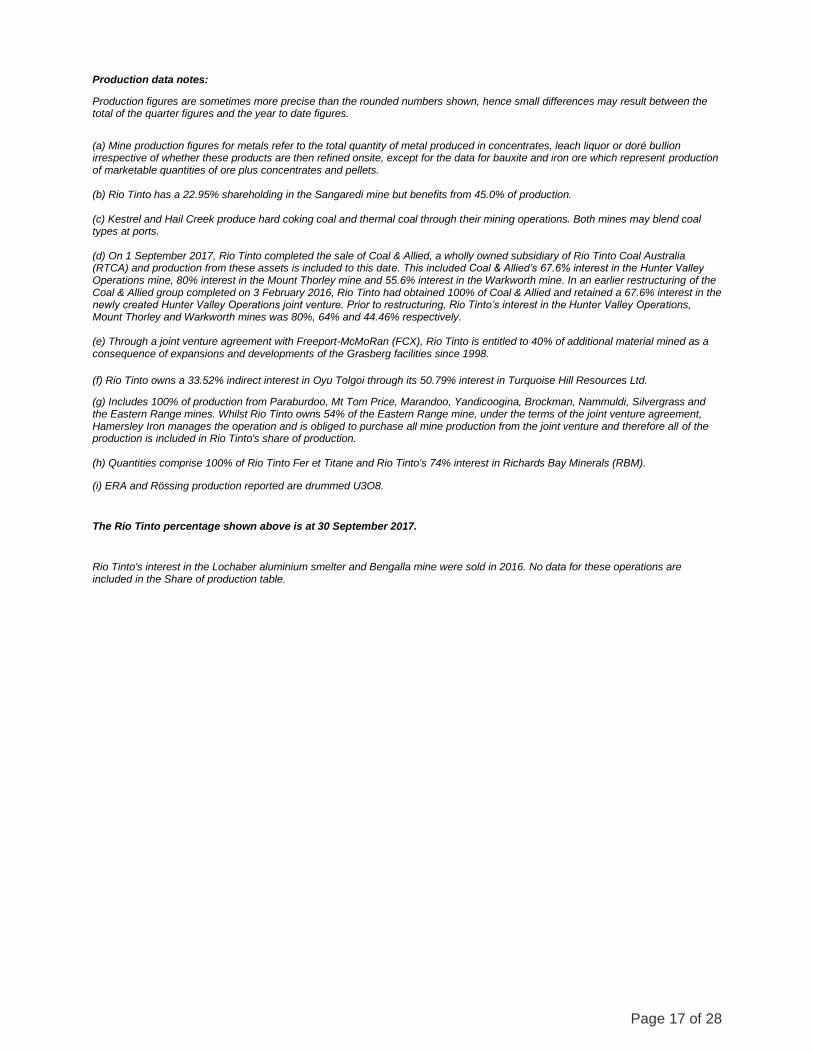
Production data notes:
Production figures are sometimes more precise than the rounded numbers shown, hence small differences may result between the total of the quarter figures and the year to date figures.
(a) Mine production figures for metals refer to the total quantity of metal produced in concentrates, leach liquor or doré bullion irrespective of whether these products are then refined onsite, except for the data for bauxite and iron ore which represent production of marketable quantities of ore plus concentrates and pellets. (b) Rio Tinto has a 22.95% shareholding in the Sangaredi mine but benefits from 45.0% of production. (c) Kestrel and Hail Creek produce hard coking coal and thermal coal through their mining operations. Both mines may blend coal types at ports. (d) On 1 September 2017, Rio Tinto completed the sale of Coal & Allied, a wholly owned subsidiary of Rio Tinto Coal Australia (RTCA) and production from these assets is included to this date. This included Coal & Allied’s 67.6% interest in the Hunter Valley Operations mine, 80% interest in the Mount Thorley mine and 55.6% interest in the Warkworth mine. In an earlier restructuring of the Coal & Allied group completed on 3 February 2016, Rio Tinto had obtained 100% of Coal & Allied and retained a 67.6% interest in the newly created Hunter Valley Operations joint venture. Prior to restructuring, Rio Tinto’s interest in the Hunter Valley Operations, Mount Thorley and Warkworth mines was 80%, 64% and 44.46% respectively. (e) Through a joint venture agreement with Freeport-McMoRan (FCX), Rio Tinto is entitled to 40% of additional material mined as a consequence of expansions and developments of the Grasberg facilities since 1998.
(f) Rio Tinto owns a 33.52% indirect interest in Oyu Tolgoi through its 50.79% interest in Turquoise Hill Resources Ltd.
(g) Includes 100% of production from Paraburdoo, Mt Tom Price, Marandoo, Yandicoogina, Brockman, Nammuldi, Silvergrass and the Eastern Range mines. Whilst Rio Tinto owns 54% of the Eastern Range mine, under the terms of the joint venture agreement, Hamersley Iron manages the operation and is obliged to purchase all mine production from the joint venture and therefore all of the production is included in Rio Tinto's share of production. (h) Quantities comprise 100% of Rio Tinto Fer et Titane and Rio Tinto's 74% interest in Richards Bay Minerals (RBM).
(i) ERA and Rössing production reported are drummed U3O8.
The Rio Tinto percentage shown above is at 30 September 2017.
Rio Tinto's interest in the Lochaber aluminium smelter and Bengalla mine were sold in 2016. No data for these operations are included in the Share of production table.
Page 18 of 28
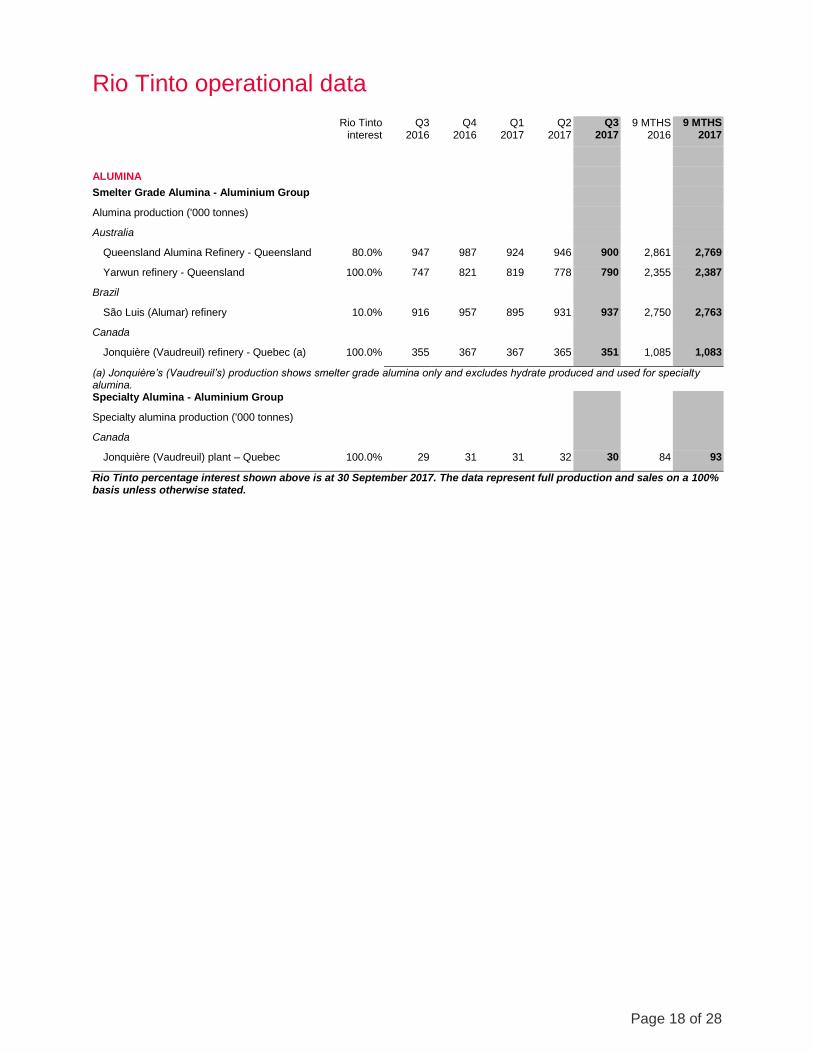
Rio Tinto operational data
Rio Tinto interest
Q3 2016
Q4 2016
Q1 2017
Q2 2017
Q3 2017
9 MTHS 2016
9 MTHS 2017
ALUMINA
Smelter Grade Alumina - Aluminium Group
Alumina production ('000 tonnes)
Australia
Queensland Alumina Refinery - Queensland 80.0% 947 987 924 946 900 2,861 2,769
Yarwun refinery - Queensland 100.0% 747 821 819 778 790 2,355 2,387
Brazil
São Luis (Alumar) refinery 10.0% 916 957 895 931 937 2,750 2,763
Canada
Jonquière (Vaudreuil) refinery - Quebec (a) 100.0% 355 367 367 365 351 1,085 1,083
(a) Jonquière’s (Vaudreuil’s) production shows smelter grade alumina only and excludes hydrate produced and used for specialty alumina. Specialty Alumina - Aluminium Group
Specialty alumina production ('000 tonnes)
Canada
Jonquière (Vaudreuil) plant – Quebec 100.0% 29 31 31 32 30 84 93
Rio Tinto percentage interest shown above is at 30 September 2017. The data represent full production and sales on a 100% basis unless otherwise stated.
Page 19 of 28
Rio Tinto operational data
Rio Tinto interest
Q3 2016
Q4 2016
Q1 2017
Q2 2017
Q3 2017
9 MTHS 2016
9 MTHS 2017
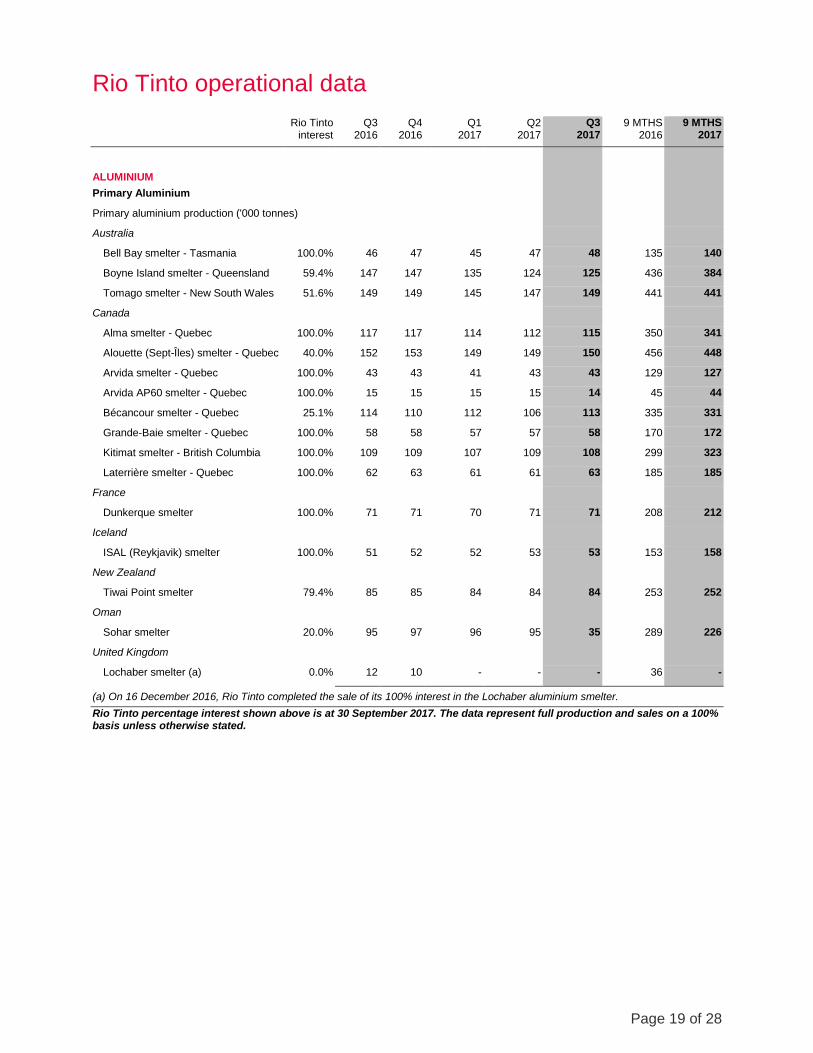
ALUMINIUM
Primary Aluminium
Primary aluminium production ('000 tonnes)
Australia
Bell Bay smelter - Tasmania 100.0% 46 47 45 47 48 135 140
Boyne Island smelter - Queensland 59.4% 147 147 135 124 125 436 384
Tomago smelter - New South Wales 51.6% 149 149 145 147 149 441 441
Canada
Alma smelter - Quebec 100.0% 117 117 114 112 115 350 341
Alouette (Sept-Îles) smelter - Quebec 40.0% 152 153 149 149 150 456 448
Arvida smelter - Quebec 100.0% 43 43 41 43 43 129 127
Arvida AP60 smelter - Quebec 100.0% 15 15 15 15 14 45 44
Bécancour smelter - Quebec 25.1% 114 110 112 106 113 335 331
Grande-Baie smelter - Quebec 100.0% 58 58 57 57 58 170 172
Kitimat smelter - British Columbia 100.0% 109 109 107 109 108 299 323
Laterrière smelter - Quebec 100.0% 62 63 61 61 63 185 185
France
Dunkerque smelter 100.0% 71 71 70 71 71 208 212
Iceland
ISAL (Reykjavik) smelter 100.0% 51 52 52 53 53 153 158
New Zealand
Tiwai Point smelter 79.4% 85 85 84 84 84 253 252
Oman
Sohar smelter 20.0% 95 97 96 95 35 289 226
United Kingdom
Lochaber smelter (a) 0.0% 12 10 - - - 36 -
(a) On 16 December 2016, Rio Tinto completed the sale of its 100% interest in the Lochaber aluminium smelter.
Rio Tinto percentage interest shown above is at 30 September 2017. The data represent full production and sales on a 100% basis unless otherwise stated.
Page 20 of 28
Rio Tinto operational data
Rio Tinto interest
Q3 2016
Q4 2016
Q1 2017
Q2 2017
Q3 2017
9 MTHS 2016
9 MTHS 2017
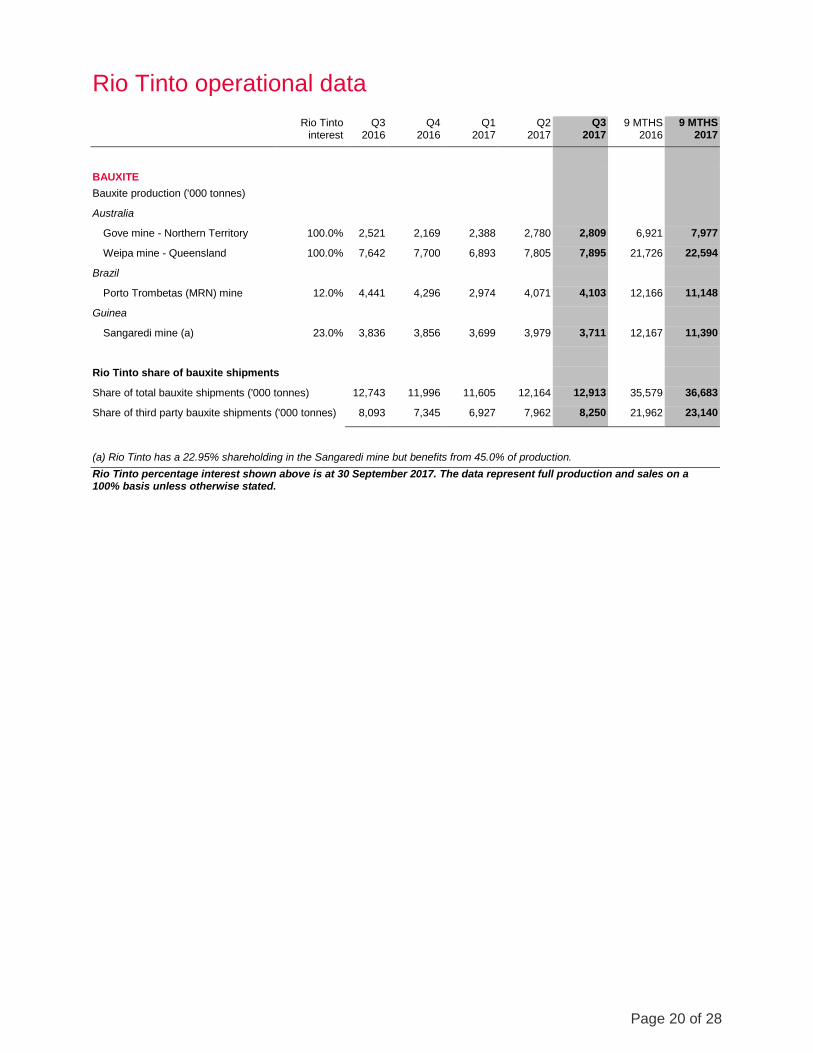
BAUXITE
Bauxite production ('000 tonnes)
Australia
Gove mine - Northern Territory 100.0% 2,521 2,169 2,388 2,780 2,809 6,921 7,977
Weipa mine - Queensland 100.0% 7,642 7,700 6,893 7,805 7,895 21,726 22,594
Brazil
Porto Trombetas (MRN) mine 12.0% 4,441 4,296 2,974 4,071 4,103 12,166 11,148
Guinea
Sangaredi mine (a) 23.0% 3,836 3,856 3,699 3,979 3,711 12,167 11,390
Rio Tinto share of bauxite shipments
Share of total bauxite shipments ('000 tonnes) 12,743 11,996 11,605 12,164 12,913 35,579 36,683
Share of third party bauxite shipments ('000 tonnes) 8,093 7,345 6,927 7,962 8,250 21,962 23,140
(a) Rio Tinto has a 22.95% shareholding in the Sangaredi mine but benefits from 45.0% of production.
Rio Tinto percentage interest shown above is at 30 September 2017. The data represent full production and sales on a 100% basis unless otherwise stated.
Page 21 of 28
Rio Tinto operational data
Rio Tinto interest
Q3 2016
Q4 2016
Q1 2017
Q2 2017
Q3 2017
9 MTHS 2016
9 MTHS 2017
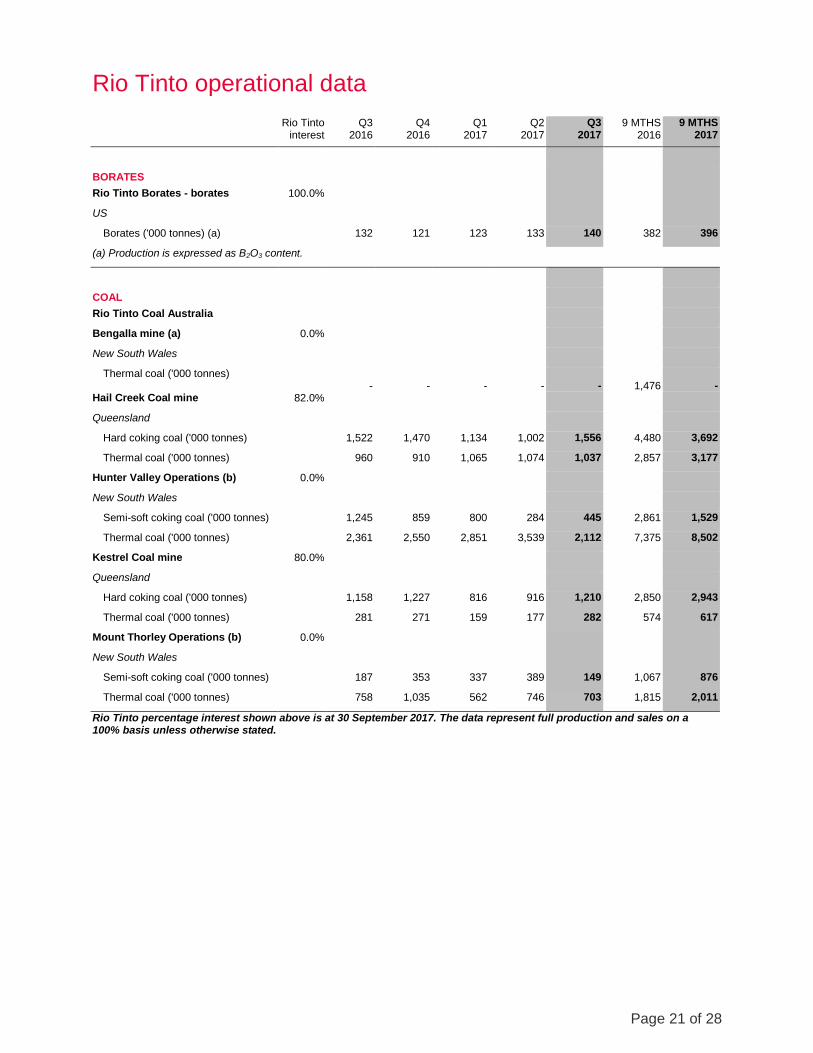
BORATES
Rio Tinto Borates - borates 100.0%
US
Borates ('000 tonnes) (a) 132 121 123 133 140 382 396
(a) Production is expressed as B2O3 content.
COAL
Rio Tinto Coal Australia
Bengalla mine (a) 0.0%
New South Wales
Thermal coal ('000 tonnes) -
-
-
-
-
1,476
-
Hail Creek Coal mine 82.0%
Queensland
Hard coking coal ('000 tonnes) 1,522 1,470 1,134 1,002 1,556 4,480 3,692
Thermal coal ('000 tonnes) 960 910 1,065 1,074 1,037 2,857 3,177
Hunter Valley Operations (b) 0.0%
New South Wales
Semi-soft coking coal ('000 tonnes) 1,245 859 800 284 445 2,861 1,529
Thermal coal ('000 tonnes) 2,361 2,550 2,851 3,539 2,112 7,375 8,502
Kestrel Coal mine 80.0%
Queensland
Hard coking coal ('000 tonnes) 1,158 1,227 816 916 1,210 2,850 2,943
Thermal coal ('000 tonnes) 281 271 159 177 282 574 617
Mount Thorley Operations (b) 0.0%
New South Wales
Semi-soft coking coal ('000 tonnes) 187 353 337 389 149 1,067 876
Thermal coal ('000 tonnes) 758 1,035 562 746 703 1,815 2,011
Rio Tinto percentage interest shown above is at 30 September 2017. The data represent full production and sales on a 100% basis unless otherwise stated.

Page 22 of 28
Rio Tinto operational data
Rio Tinto interest
Q3 2016
Q4 2016
Q1 2017
Q2 2017
Q3 2017
9 MTHS 2016
9 MTHS 2017
COAL (continued)
Warkworth mine (b) 0.0%
New South Wales
Semi-soft coking coal ('000 tonnes) 135 190 268 202 44 620 514
Thermal coal ('000 tonnes) 2,035 1,330 1,520 1,696 1,305 5,895 4,521
Total hard coking coal production ('000 tonnes) 2,680 2,697 1,950 1,918 2,766 7,331 6,635
Total semi-soft coking coal production ('000 tonnes) 1,567 1,402 1,405 875 639 4,547 2,919
Total thermal coal production ('000 tonnes) 6,395 6,096 6,156 7,232 5,439 19,993 18,827
Total coal production ('000 tonnes) 10,642 10,196 9,512 10,026 8,844 31,871 28,382
Total coal sales ('000 tonnes) 10,129 10,241 8,792 9,871 9,298 31,532 27,962
Rio Tinto Coal Australia share (c)
Share of hard coking coal sales ('000 tonnes) 2,332 2,395 1,524 1,717 2,511 6,309 5,753
Share of semi-soft coal sales ('000 tonnes) (d) 904 1,043 765 759 485 3,101 2,010
Share of thermal coal sales ('000 tonnes) (d) 3,958 3,979 3,946 4,539 3,804 12,504 12,289
(a) Rio Tinto sold its interest in the Bengalla Joint Venture with an effective date of 1 March 2016. (b) On 1 September 2017, Rio Tinto completed the sale of Coal & Allied, a wholly owned subsidiary of Rio Tinto Coal Australia (RTCA) and production from these assets is included to this date. This included Coal & Allied’s 67.6% interest in the Hunter Valley Operations mine, 80% interest in the Mount Thorley mine and 55.6% interest in the Warkworth mine. In an earlier restructuring of the Coal & Allied group completed on 3 February 2016, Rio Tinto had obtained 100% of Coal & Allied and retained a 67.6% interest in the newly created Hunter Valley Operations joint venture. Prior to restructuring, Rio Tinto’s interest in the Hunter Valley Operations, Mount Thorley and Warkworth mines was 80%, 64% and 44.46% respectively. (c) Kestrel and Hail Creek produce hard coking coal and thermal coal through their mining operations. Both mines may blend coal types at ports. (d) Sales relate only to coal mined by the operations and exclude traded coal.
Rio Tinto percentage interest shown above is at 30 September 2017. The data represent full production and sales on a 100% basis unless otherwise stated.

Page 23 of 28
Rio Tinto operational data
Rio Tinto interest
Q3 2016
Q4 2016
Q1 2017
Q2 2017
Q3 2017
9 MTHS 2016
9 MTHS 2017
COPPER & GOLD
Escondida 30.0%
Chile
Sulphide ore to concentrator ('000 tonnes) 20,787 19,866 8,054 18,777 24,080 64,881 50,911
Average copper grade (%)
0.87 1.02 1.01 1.07 1.06 0.94 1.06
Mill production (metals in concentrates):
Contained copper ('000 tonnes) 153.2 168.6 67.7 167.0 204.1 510.6 438.8
Contained gold ('000 ounces) 28 38 11 34 51 95 96
Contained silver ('000 ounces) 1,229 1,323 543 1,234 1,737 4,648 3,514
Recoverable copper in ore stacked for leaching ('000 tonnes) (a) 88.9 76.4 22.8 60.7 70.8 255.0 154.3
Refined production from leach plants:
Copper cathode production ('000 tonnes) 70.5 71.5 27.2 62.8 71.9 240.6 161.9
(a) The calculation of copper in material mined for leaching is based on ore stacked at the leach pad.
Freeport-McMoRan
Grasberg mine (a) 0.0% (b)
Papua, Indonesia
Ore treated ('000 tonnes) 16,608 15,630 7,849 11,242 16,625 44,998 35,715
Average mill head grades:
Copper (%)
1.02 1.08 1.15 1.03 0.92 0.86 1.00
Gold (g/t)
0.69 0.97 1.17 1.16 0.94 0.57 1.06
Silver (g/t)
3.45 3.67 5.26 4.09 2.23 2.89 3.48
Production of metals in concentrates:
Copper in concentrates ('000 tonnes) 153.8 153.1 81.0 103.9 139.6 346.2 324.5
Gold in concentrates ('000 ounces) 310 409 248 358 420 685 1,025
Silver in concentrates ('000 ounces) 1,170 1,237 667 900 709 2,558 2,276
Sales of payable metals in concentrates: (c)
Copper in concentrates ('000 tonnes) 153.7 140.6 61.7 124.6 131.1 337.4 317.4
Gold in concentrates ('000 ounces) 307 374 183 429 394 681 1,007
Silver in concentrates ('000 ounces) 928 907 404 851 532 2,001 1,787
(a) Through a joint venture agreement with Freeport-McMoRan (FCX), Rio Tinto is entitled to 40% of additional material mined as a consequence of expansions and developments of the Grasberg facilities since 1998. The Q3 2017 results show the forecast from FCX's most recent five-year plan, because FCX is not releasing its actual 100% operating data for Q3 2017 until the release of its 2017 third-quarter results on 25 October 2017. (b) Rio Tinto share of Grasberg production is 40% of the expansion. (c) Net of smelter deductions.
Rio Tinto percentage interest shown above is at 30 September 2017. The data represent full production and sales on a 100% basis unless otherwise stated.
Page 24 of 28
Rio Tinto operational data
Rio Tinto interest
Q3 2016
Q4 2016
Q1 2017
Q2 2017
Q3 2017
9 MTHS 2016
9 MTHS 2017
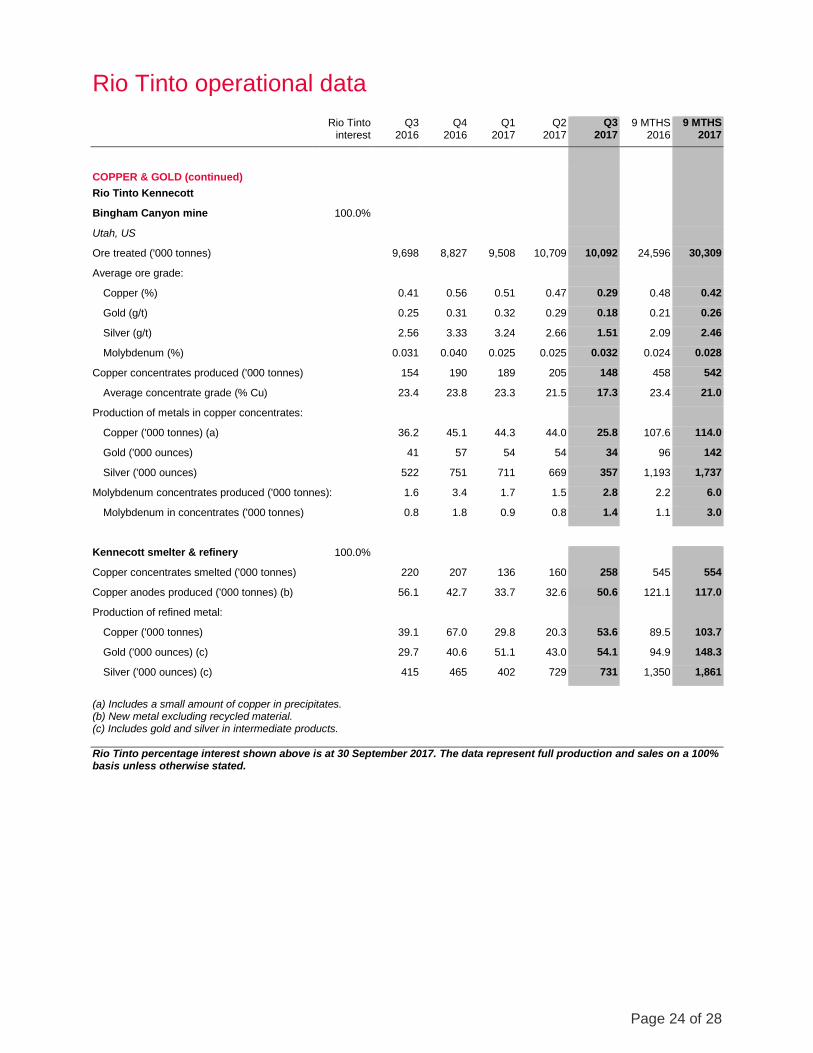
COPPER & GOLD (continued)
Rio Tinto Kennecott
Bingham Canyon mine 100.0%
Utah, US
Ore treated ('000 tonnes) 9,698 8,827 9,508 10,709 10,092 24,596 30,309
Average ore grade:
Copper (%)
0.41 0.56 0.51 0.47 0.29 0.48 0.42
Gold (g/t)
0.25 0.31 0.32 0.29 0.18 0.21 0.26
Silver (g/t)
2.56 3.33 3.24 2.66 1.51 2.09 2.46
Molybdenum (%)
0.031 0.040 0.025 0.025 0.032 0.024 0.028
Copper concentrates produced ('000 tonnes) 154 190 189 205 148 458 542
Average concentrate grade (% Cu) 23.4 23.8 23.3 21.5 17.3 23.4 21.0
Production of metals in copper concentrates:
Copper ('000 tonnes) (a) 36.2 45.1 44.3 44.0 25.8 107.6 114.0
Gold ('000 ounces) 41 57 54 54 34 96 142
Silver ('000 ounces) 522 751 711 669 357 1,193 1,737
Molybdenum concentrates produced ('000 tonnes): 1.6 3.4 1.7 1.5 2.8 2.2 6.0
Molybdenum in concentrates ('000 tonnes) 0.8 1.8 0.9 0.8 1.4 1.1 3.0
Kennecott smelter & refinery 100.0%
Copper concentrates smelted ('000 tonnes) 220 207 136 160 258 545 554
Copper anodes produced ('000 tonnes) (b) 56.1 42.7 33.7 32.6 50.6 121.1 117.0
Production of refined metal:
Copper ('000 tonnes) 39.1 67.0 29.8 20.3 53.6 89.5 103.7
Gold ('000 ounces) (c) 29.7 40.6 51.1 43.0 54.1 94.9 148.3
Silver ('000 ounces) (c) 415 465 402 729 731 1,350 1,861
(a) Includes a small amount of copper in precipitates. (b) New metal excluding recycled material. (c) Includes gold and silver in intermediate products.
Rio Tinto percentage interest shown above is at 30 September 2017. The data represent full production and sales on a 100% basis unless otherwise stated.
Page 25 of 28
Rio Tinto operational data
Rio Tinto interest
Q3 2016
Q4 2016
Q1 2017
Q2 2017
Q3 2017
9 MTHS 2016
9 MTHS 2017
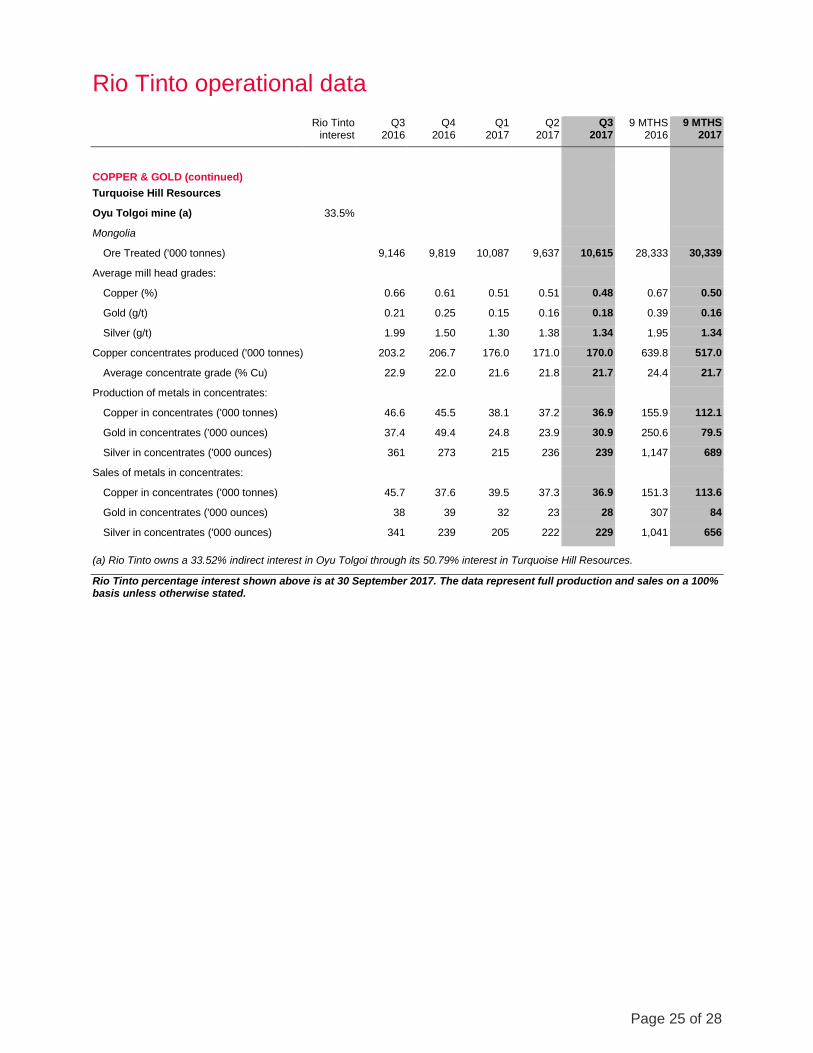
COPPER & GOLD (continued)
Turquoise Hill Resources
Oyu Tolgoi mine (a) 33.5%
Mongolia
Ore Treated ('000 tonnes) 9,146 9,819 10,087 9,637 10,615 28,333 30,339
Average mill head grades:
Copper (%)
0.66 0.61 0.51 0.51 0.48 0.67 0.50
Gold (g/t)
0.21 0.25 0.15 0.16 0.18 0.39 0.16
Silver (g/t)
1.99 1.50 1.30 1.38 1.34 1.95 1.34
Copper concentrates produced ('000 tonnes) 203.2 206.7 176.0 171.0 170.0 639.8 517.0
Average concentrate grade (% Cu)
22.9 22.0 21.6 21.8 21.7 24.4 21.7
Production of metals in concentrates:
Copper in concentrates ('000 tonnes) 46.6 45.5 38.1 37.2 36.9 155.9 112.1
Gold in concentrates ('000 ounces) 37.4 49.4 24.8 23.9 30.9 250.6 79.5
Silver in concentrates ('000 ounces) 361 273 215 236 239 1,147 689
Sales of metals in concentrates:
Copper in concentrates ('000 tonnes) 45.7 37.6 39.5 37.3 36.9 151.3 113.6
Gold in concentrates ('000 ounces) 38 39 32 23 28 307 84
Silver in concentrates ('000 ounces) 341 239 205 222 229 1,041 656
(a) Rio Tinto owns a 33.52% indirect interest in Oyu Tolgoi through its 50.79% interest in Turquoise Hill Resources.
Rio Tinto percentage interest shown above is at 30 September 2017. The data represent full production and sales on a 100% basis unless otherwise stated.
Page 26 of 28
Rio Tinto operational data
Rio Tinto interest
Q3 2016
Q4 2016
Q1 2017
Q2 2017
Q3 2017
9 MTHS 2016
9 MTHS 2017
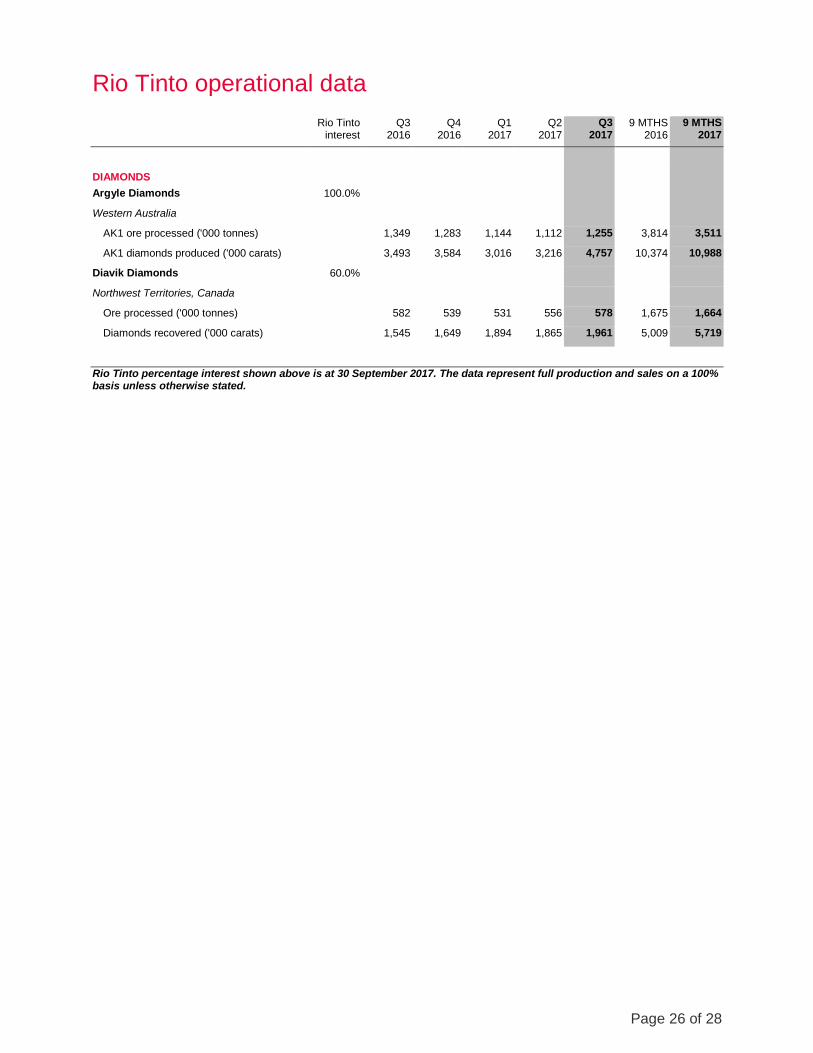
DIAMONDS
Argyle Diamonds 100.0%
Western Australia
AK1 ore processed ('000 tonnes)
1,349 1,283 1,144 1,112 1,255 3,814 3,511
AK1 diamonds produced ('000 carats) 3,493 3,584 3,016 3,216 4,757 10,374 10,988
Diavik Diamonds 60.0%
Northwest Territories, Canada
Ore processed ('000 tonnes)
582 539 531 556 578 1,675 1,664
Diamonds recovered ('000 carats) 1,545 1,649 1,894 1,865 1,961 5,009 5,719
Rio Tinto percentage interest shown above is at 30 September 2017. The data represent full production and sales on a 100% basis unless otherwise stated.
Page 27 of 28
Rio Tinto operational data
Rio Tinto interest
Q3 2016
Q4 2016
Q1 2017
Q2 2017
Q3 2017
9 MTHS 2016
9 MTHS 2017
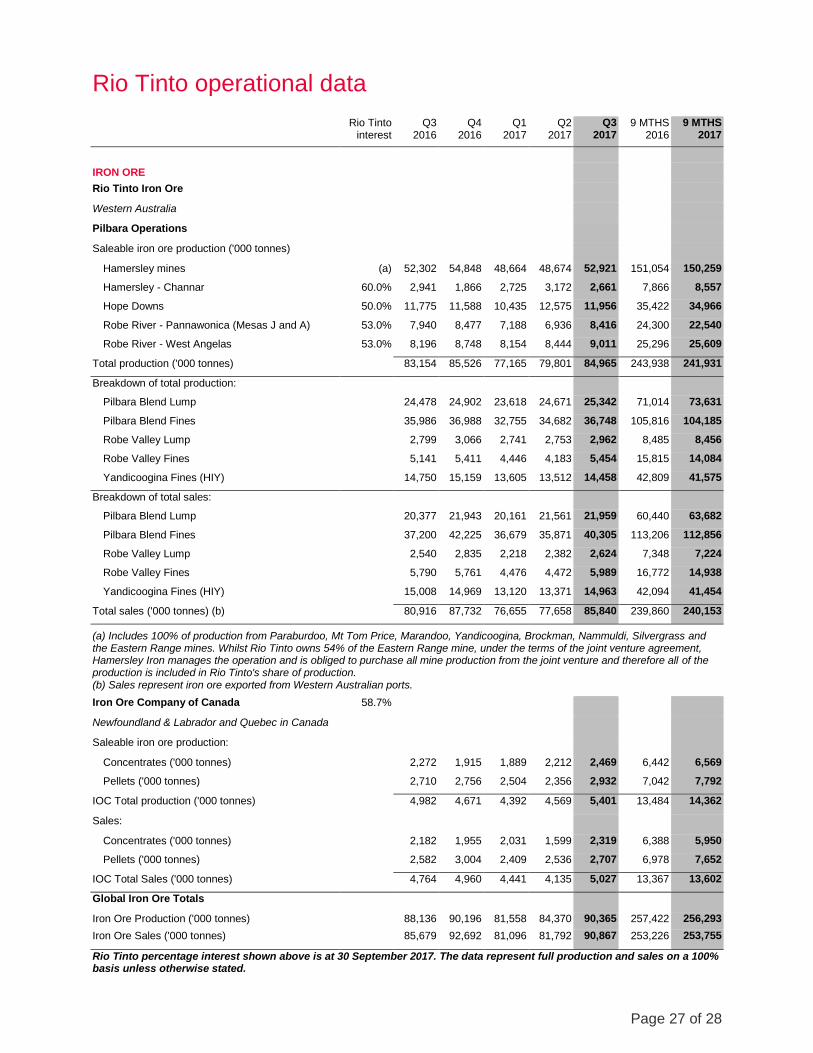
IRON ORE
Rio Tinto Iron Ore
Western Australia
Pilbara Operations
Saleable iron ore production ('000 tonnes)
Hamersley mines (a) 52,302 54,848 48,664 48,674 52,921 151,054 150,259
Hamersley - Channar 60.0% 2,941 1,866 2,725 3,172 2,661 7,866 8,557
Hope Downs 50.0% 11,775 11,588 10,435 12,575 11,956 35,422 34,966
Robe River - Pannawonica (Mesas J and A) 53.0% 7,940 8,477 7,188 6,936 8,416 24,300 22,540
Robe River - West Angelas 53.0% 8,196 8,748 8,154 8,444 9,011 25,296 25,609
Total production ('000 tonnes) 83,154 85,526 77,165 79,801 84,965 243,938 241,931
Breakdown of total production:
Pilbara Blend Lump 24,478 24,902 23,618 24,671 25,342 71,014 73,631
Pilbara Blend Fines 35,986 36,988 32,755 34,682 36,748 105,816 104,185
Robe Valley Lump 2,799 3,066 2,741 2,753 2,962 8,485 8,456
Robe Valley Fines 5,141 5,411 4,446 4,183 5,454 15,815 14,084
Yandicoogina Fines (HIY) 14,750 15,159 13,605 13,512 14,458 42,809 41,575
Breakdown of total sales:
Pilbara Blend Lump 20,377 21,943 20,161 21,561 21,959 60,440 63,682
Pilbara Blend Fines 37,200 42,225 36,679 35,871 40,305 113,206 112,856
Robe Valley Lump 2,540 2,835 2,218 2,382 2,624 7,348 7,224
Robe Valley Fines 5,790 5,761 4,476 4,472 5,989 16,772 14,938
Yandicoogina Fines (HIY) 15,008 14,969 13,120 13,371 14,963 42,094 41,454
Total sales ('000 tonnes) (b) 80,916 87,732 76,655 77,658 85,840 239,860 240,153
(a) Includes 100% of production from Paraburdoo, Mt Tom Price, Marandoo, Yandicoogina, Brockman, Nammuldi, Silvergrass and the Eastern Range mines. Whilst Rio Tinto owns 54% of the Eastern Range mine, under the terms of the joint venture agreement, Hamersley Iron manages the operation and is obliged to purchase all mine production from the joint venture and therefore all of the production is included in Rio Tinto's share of production. (b) Sales represent iron ore exported from Western Australian ports.
Iron Ore Company of Canada 58.7%
Newfoundland & Labrador and Quebec in Canada
Saleable iron ore production:
Concentrates ('000 tonnes) 2,272 1,915 1,889 2,212 2,469 6,442 6,569
Pellets ('000 tonnes) 2,710 2,756 2,504 2,356 2,932 7,042 7,792
IOC Total production ('000 tonnes) 4,982 4,671 4,392 4,569 5,401 13,484 14,362
Sales:
Concentrates ('000 tonnes) 2,182 1,955 2,031 1,599 2,319 6,388 5,950
Pellets ('000 tonnes) 2,582 3,004 2,409 2,536 2,707 6,978 7,652
IOC Total Sales ('000 tonnes) 4,764 4,960 4,441 4,135 5,027 13,367 13,602
Global Iron Ore Totals
Iron Ore Production ('000 tonnes) 88,136 90,196 81,558 84,370 90,365 257,422 256,293
Iron Ore Sales ('000 tonnes) 85,679 92,692 81,096 81,792 90,867 253,226 253,755
Rio Tinto percentage interest shown above is at 30 September 2017. The data represent full production and sales on a 100% basis unless otherwise stated.
Page 28 of 28
Rio Tinto operational data
Rio Tinto interest
Q3 2016
Q4 2016
Q1 2017
Q2 2017
Q3 2017
9 MTHS 2016
9 MTHS 2017
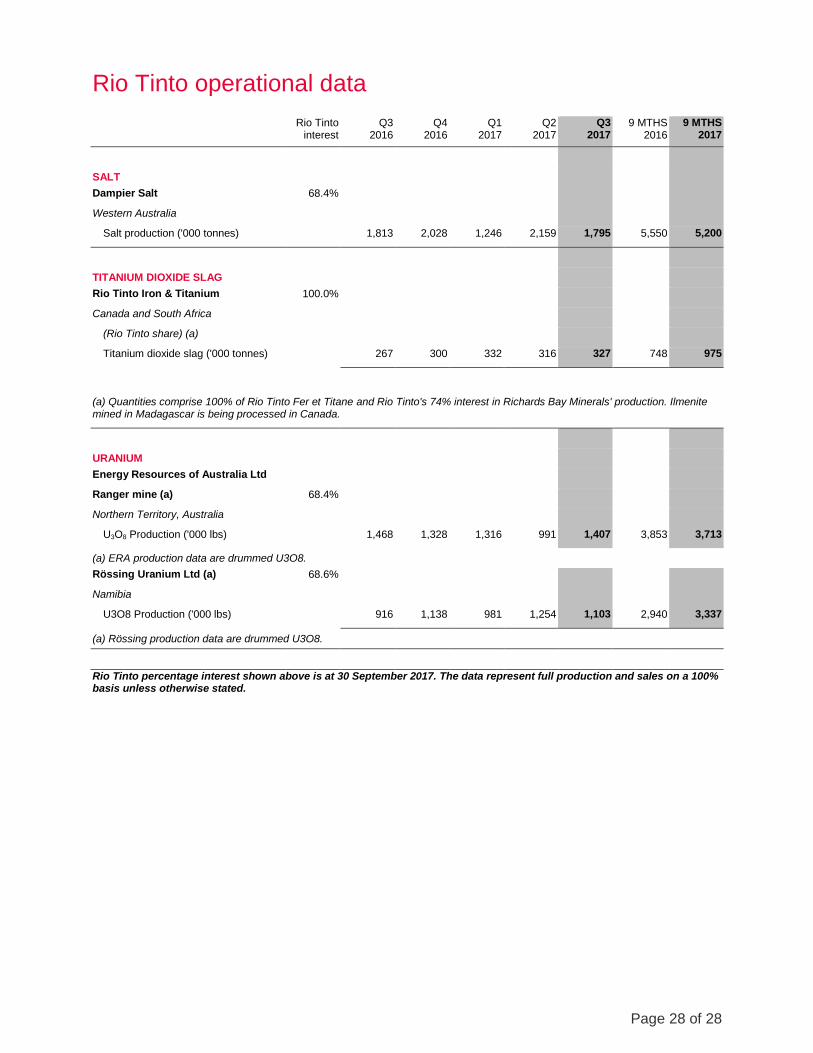
SALT
Dampier Salt 68.4%
Western Australia
Salt production ('000 tonnes) 1,813 2,028 1,246 2,159 1,795 5,550 5,200
TITANIUM DIOXIDE SLAG
Rio Tinto Iron & Titanium 100.0%
Canada and South Africa
(Rio Tinto share) (a)
Titanium dioxide slag ('000 tonnes) 267 300 332 316 327 748 975
(a) Quantities comprise 100% of Rio Tinto Fer et Titane and Rio Tinto's 74% interest in Richards Bay Minerals' production. Ilmenite mined in Madagascar is being processed in Canada.
URANIUM
Energy Resources of Australia Ltd
Ranger mine (a) 68.4%
Northern Territory, Australia
U3O8 Production ('000 lbs) 1,468 1,328 1,316 991 1,407 3,853 3,713
(a) ERA production data are drummed U3O8.
Rössing Uranium Ltd (a) 68.6%
Namibia
U3O8 Production ('000 lbs) 916 1,138 981 1,254 1,103 2,940 3,337
(a) Rössing production data are drummed U3O8.
Rio Tinto percentage interest shown above is at 30 September 2017. The data represent full production and sales on a 100% basis unless otherwise stated.