Embed Size (px)
Citation preview

Third Quarter Presentation 2017
9 November 2017

Agenda
• Highlights
• Financials
• Operational review/Strategy
• Market update and prospects

Highlights
• The challenging market for chemical tankers continued into 3Q as we had expected. The market for terminals was under pressure from falling forward prices of oil/products
• EBITDA of USD 37 mill in 3Q, compared with USD 41 mill previous quarter 2017
• Net results of USD -11 mill compared to USD -5 mill previous quarter 2017
• Odfjell chemical freight index (ODFIX) down 4.1% compared with previous quarter 2017
• Chemical Tankers EBITDA was USD 28 mill in 3Q, compared with USD 31 mill previous quarter 2017
• Odfjell Terminals EBITDA of USD 9 mill in 3Q, compared to 10 mill previous quarter 2017
• We continue to pursue an exit from Gas
• We announced the sale of Odfjell Terminals 50% ownership share in Singapore terminal, with an expected book gain of USD 135 mill and with net proceeds of around USD 150 mill likely to close in 4Q
Highlights
Key figures, USD mill¹
«3Q was a challenging quarter for our tanker and terminal divisions. Our balance sheet remains robust and our
competitiveness continues to increase, so we are positioned to benefit once our markets recover. The sale of our Singapore terminal in line with our strategy will result in a significant gain. We expect 4Q 2017 to be in line with 3Q
2017»
Kristian Mørch, CEO Odfjell SE
1. Proportional consolidation method according to actual historical ownership share
3
(USD mill, unaudited) 1Q17 2Q17 3Q17 3Q16 YTD17 YTD16
Odfjell Tankers 212.8 208.9 207.6 206.9 629.3 628.2Odfjell Terminals 27.8 27.5 27.0 30.1 82.4 92.1Revenues* 243.0 238.5 236.7 239.7 718.2 729.5Odfjell Tankers 36.0 30.5 28.0 48.1 94.5 151.5Odfjell Terminals 9.5 10.3 8.7 11.6 28.5 35.8EBITDA* 46.2 41.4 37.3 60.2 125.0 189.6EBIT 17.7 14.2 3.6 28.4 35.5 99.4Net profit 1.5 (4.7) (10.5) 16.5 (13.7) 56.5EPS** 0.02 (0.06) (0.13) 0.21 (0.17) 0.72ROE*** 0.6% (1.2%) (7.0%) 8.4% (2.5%) 10.8%ROCE*** 3.8% 3.1% 0.5% 6.2% 2.4% 7.1%
*Includes figures from Odfjell Gas** Based on 78.6 million outstanding shares*** Ratios are annualised

Agenda
• Highlights
• Financials
• Operational review/Strategy
• Market update and prospects
Financials
USD mill2Q
20173Q
20172016 YTD
2017 YTD
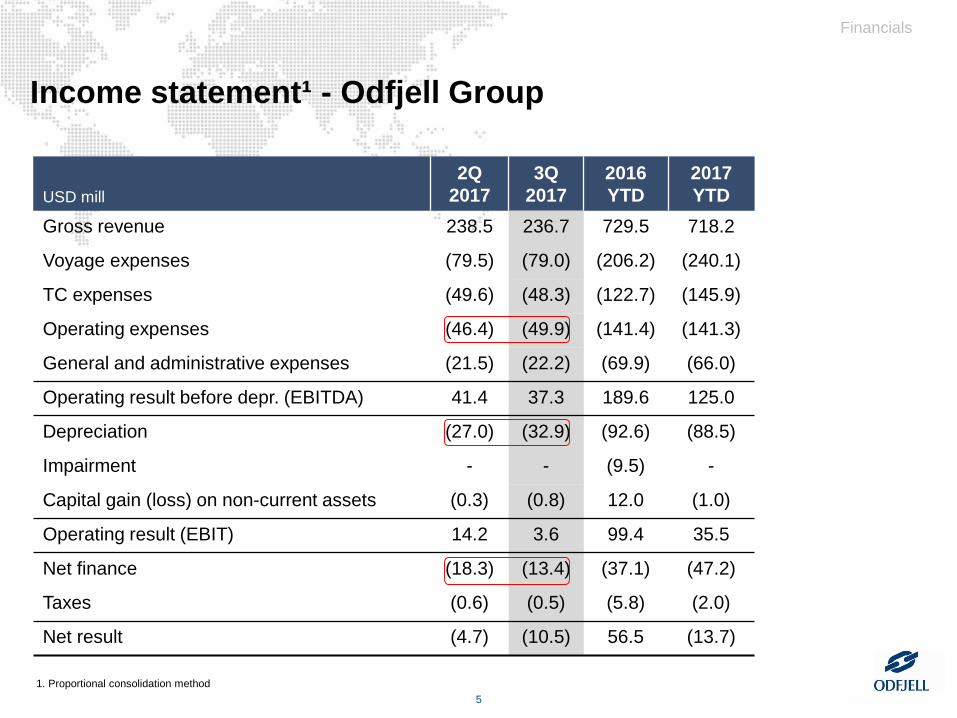
Gross revenue 238.5 236.7 729.5 718.2
Voyage expenses (79.5) (79.0) (206.2) (240.1)
TC expenses (49.6) (48.3) (122.7) (145.9)
Operating expenses (46.4) (49.9) (141.4) (141.3)
General and administrative expenses (21.5) (22.2) (69.9) (66.0)
Operating result before depr. (EBITDA) 41.4 37.3 189.6 125.0
Depreciation (27.0) (32.9) (92.6) (88.5)
Impairment - - (9.5) -
Capital gain (loss) on non-current assets (0.3) (0.8) 12.0 (1.0)
Operating result (EBIT) 14.2 3.6 99.4 35.5
Net finance (18.3) (13.4) (37.1) (47.2)
Taxes (0.6) (0.5) (5.8) (2.0)
Net result (4.7) (10.5) 56.5 (13.7)
1. Proportional consolidation method
Income statement¹ - Odfjell Group
5

Financials
USD mill Tankers Terminals Total*2Q17 3Q17 2Q17 3Q17 2Q17 3Q17
Gross revenue 208.9 207.6 27.5 27.0 238.5 236.7
Voyage expenses (78.5) (78.0) - - (79.5) (79.0)
TC expenses (49.6) (48.3) - - (49.6) (48.3)
Opex (33.2) (36.0) (12.7) (13.4) (46.4) (49.9)
G&A (17.0) (17.3) (4.5) (4.9) (21.5) (22.2)EBITDA 30.5 28.0 10.3 8.7 41.4 37.3Depreciation (18.2) (23.9) (8.5) (8.7) (27.0) (32.9)Impairment - - - - - -Capital gain/loss 0.2 (0.5) (0.4) (0.3) (0.3) (0.8)EBIT 12.5 3.6 1.5 (0.3) 14.2 3.6Net finance (16.7) (11.1) (1.3) (2.2) (18.3) (13.4)Taxes (0.4) (1.0) (0.3) 0.5 (0.6) (0.5)Net result (4.5) (8.5) (0.1) (2.0) (4.7) (10.5)
EPS (0.06) (0.11) (0.00) (0.03) (0.06) (0.13)
1. Proportional consolidation method
Income statement¹ - Odfjell Group by division
6
• Opex in Odfjell Tankers up on three new vessels delivered to the fleet
• Depreciation increased due to reduced life time of Asian built vessels and delivery of three vessels to our fleet
• Lower net finance costs due to non-recurring cost related to bond purchase in 2Q 17
Key quarterly deviations:
* Total includes contribution from Gas Carriers now classified as held for sale

Bunker development
Financials
• Net bunker cost in 3Q USD 382 per tonne before hedging vs. USD 377 in 2Q• Bunker clauses in CoAs cover about 64% of the exposure • 6% of 2017 exposure is hedged at USD 230 per tonne
2Q17
37.3
34.3
3.3
-0.3
1Q17
38.6
9.9
3Q17
37.8
4.2
35.8
3.3
-0.5
4Q16
34.1
28.0
6.2
-0.1
3Q16
36.7
26.734.1
-0.4
Quarterly net bunker costUSD mill 3Q 2016 - 3Q 2017
Platts 3.5% FOB RotterdamJanuary 2013 - September 2017
USD per metric tonne
7
Bunker clausesincl. in revenue
Bunker hedging Bunker purchase0
100
200
300
400
500
600
700
01.2013 01.201601.2014 01.2015 01.2017

Balance sheet 30.09.2017 – Odfjell Group¹
Financials
1. Equity method
8
• Delivery of new vessels• Assets classified as held for sale are included in investment in JVs• Cash balance of USD 112 mill
Assets, USD mill 2Q 17 3Q 17
Ships and newbuilding contracts 1 250.3 1 329.0
Investment in associates and JVs 335.2 339.9Other non-current assets/receivables 22.7 20.7
Total non-current assets 1 608.2 1 689.7
Cash and cash equivalent 189.7 111.7
Other current assets 113.8 122.0
Total current assets 303.6 233.8
Total assets 1 911.9 1 923.4
Equity and liabilities, USD mill 2Q 17 3Q 17
Total equity 718.0 711.7
Non-current liabilities and derivatives 35.0 19.8
Non-current interest bearing debt 907.0 995.3
Total non-current liabilities 942.1 1 015.1
Current portion of interest bearing debt 162.4 129.1
Other current liabilities and derivatives 89.4 67.6
Total current liabilities 251.8 196.6
Total equity and liabilities 1 911.9 1 923.4
* New leasing standard (IFRS 16) to be implemented from January 2019. We have done a simulation on how this will effect figures of Odfjell SE in note 1 of our quarterly report

Financial ratios – Odfjell Group
9
9.2x4.8x
8.5x
17.6x
27.7x
2013 2017 YTD annualised
201620152014
Gross interest bearing debt / EBITDA
37%38%33%31%
37%
3Q 20172016201520142013
Equity ratio
Return on capital employed (ROCE)1 Return on equity (ROE)
2%
8%
2%
-1%-3%
2017 YTD annualised
2016201520142013
-3%
15%
-6%-12%-14%
20142013 2015 2016 2017 YTD annualised
Note figures are by the equity method, year-end (or annualised) and not adjusted for extraordinary items such as impairments, capital gains, etc.1. EBIT divided by end of period total equity plus net interest-bearing debt
Equity method method
Financials
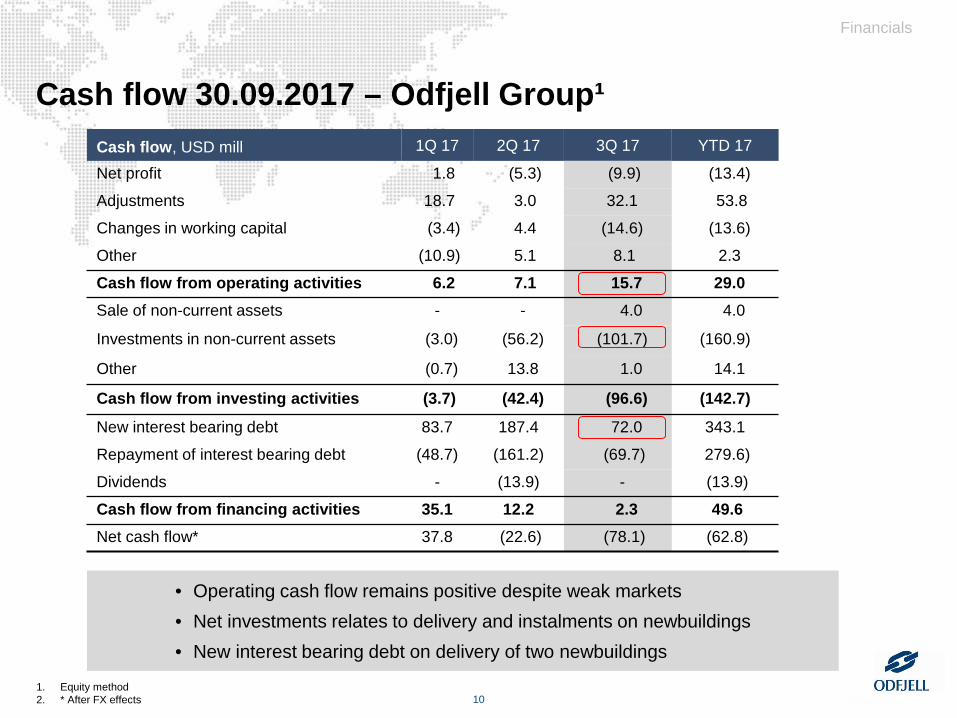
Cash flow, USD mill 1Q 17 2Q 17 3Q 17 YTD 17
Net profit 1.8 (5.3) (9.9) (13.4)
Adjustments 18.7 3.0 32.1 53.8
Changes in working capital (3.4) 4.4 (14.6) (13.6)
Other (10.9) 5.1 8.1 2.3
Cash flow from operating activities 6.2 7.1 15.7 29.0Sale of non-current assets - - 4.0 4.0
Investments in non-current assets (3.0) (56.2) (101.7) (160.9)
Other (0.7) 13.8 1.0 14.1
Cash flow from investing activities (3.7) (42.4) (96.6) (142.7)
New interest bearing debt 83.7 187.4 72.0 343.1
Repayment of interest bearing debt (48.7) (161.2) (69.7) 279.6)
Dividends - (13.9) - (13.9)
Cash flow from financing activities 35.1 12.2 2.3 49.6Net cash flow* 37.8 (22.6) (78.1) (62.8)
Financials
1. Equity method2. * After FX effects 10
• Operating cash flow remains positive despite weak markets • Net investments relates to delivery and instalments on newbuildings• New interest bearing debt on delivery of two newbuildings
Cash flow 30.09.2017 – Odfjell Group¹

Debt Portfolio, USD mill Debt Repayments, USD mill
Financials
0
50
100
150
200
250
300
20212020201920182017NB & planned refinancing
NOK Bond 12/18NOK Bond 16/19NOK Bond 17/21
Secured loansBalloonLeasing
Debt development – corporate and chemical tankers 30.09.2017
11
500
0
1 250
-500
1 000
250
750
1 500
-250
20212020201920182017
Ending balanceNewbuildings & refinancingRepayment
• Newbuildings have been fully financed• Strong interest from lenders on future refinancing• USD 84 mill in bonds maturing in December 2018

USD mill Remaining2017 2018 2019 2020 2021
Chemical Tankers
Hudong 4 x 49,000 dwt (USD 60 mill) 6 24 144 42 -
Hudong 2 x 38,000 dwt (USD 58 mill) - 6 12 87 -
AVIC 3 x 25,000 dwt (USD 40 mill) 108 - - -
Docking 2 22 13 14 19
Other investments 2 12 7 8 -
Total 10 172 176 151 19
Instalment structure – Newbuildings
Debt instalment - 126 144 130 -
Equity instalment 6 12 12 - -
Tank Terminals, 100%
Planned capex 27 62 37 34 -
Financials
Capital expenditure programme – 30.09.2017
12

Agenda
• Highlights
• Financials
• Operational review/Strategy
• Market update and prospects

Odfjell Compass – Progress on key strategic objectives Growth
We have completed our basic fleet growth/renewal programme. The first three owned vessels was delivered to our fleet late 2Q and during 3Q (Bow Neon, Bow Palladium and Bow Compass)
Participated in consolidation through the acquisition of CTG
• Operational excellence• Project Moneyball: 90% of the strategy has been implemented. Meaningful improvement in port
efficiency compared to historic benchmark and we are ahead of our targets• Terminals: Value creation programme in progress
• Financial strength• Solid balance sheet: Our balance sheet will improve further following our sale of the Singapore
terminal • Competitive cost of capital: Stronger balance sheet should lead to improved cost of capital
• Terminals – back to meaningful profitability levels• Focus on improving and growing our core terminals: Singapore and Oman sale reflected
divestment of non-core terminals. • Terminals to remain self-funded
14
Operational review

Odfjell Tankers fleet profile includes the flexibility to adjust to changing markets
15
Operational review
• Large portion of timecharter portfolio up for renewal in 2018 and 2019
• We expect renewals to be concluded at lower levels based on the current cycle, which has the potential to reduce our costs base further
• TC portfolio gives flexibility to reduce fleet in case of an extended weakness in the market
• Current TC market is below historic averages and below replacement cost for new tonnage
Future fleet composition
Source: Odfjell SE, Clarksons Platou Securities AS
0
10
2030
40
50
60
7080
90
100
Q4-19
Q3-19
Q2-19
Q1-20
Q4-18
Q2-20
Q3-20
Q3-18
Q4-20
Q1-19
Q2-18
Q3-17
Q4-17
Q1-18
Ves
sels
TC-in tonnage
Growth assuming renewals
Target fleet (100 vessels)
Owned/Leased/Pooled vessels
Historical timecharter rates

Sale of Singapore terminal expected to close during December 2017
16
Operational review
• Odfjell Terminals (OTBV) sold its 50% ownership share in Singapore terminal in October at attractive valuation
• Enterprise value for OTBV’s 50% ownership share of USD 330 mill and equity value of USD 300 mill
• Odfjell SE (51% ownership) equal to a USD 135 mill gain after completion of transaction expected in 4Q. Equity IRR has been 23%
• Transaction multiple in the higher range compared to historical transactions
• Majority of cash proceeds will be paid out to shareholders of OTBV
• Odfjell Terminals delivers on its strategy of divesting non-core terminals
• Remaining terminal capacity is 2 mill cbmchemical storage and 1.1 mill oil mineral storage
Historical tank terminal transaction multiples
Source: Odfjell SE, HSBC
0
5
10
15
20
mai
-17
apr-1
7ok
t-16
mar
-16
jan-
16
des-
15ja
n-16
mai
-14
des-
13
jun-
14
feb-
12ja
n-12
jan-
11fe
b-08
aug-
07
EV
/EB
ITD
A (x
)
sep-
12m
ai-1
2
des-
12de
s-12
jul-1
3m
ai-1
3
sep-
15
nov-
14au
g-15
aug-
14
jul-1
4ju
l-14
aug-
14
okt-0
6ju
n-06
apr-0
6
okt-1
2ok
t-12
aug-
13de
s-13

Strategy update - Odfjell Terminals Possible Ethylene project Houston
We have finalised the basic engineering and have all the required permits
We are ready to start construction if we obtain satisfactory commitments from customers, with whom we are in continuous dialogue to finalise agreements
Potential final investment decision can be made in 1Q 2018
• Final permit for terminal in China received• Odfjell Terminals new terminal in Tianjin received its final permit to operate • Opening of the port for foreign vessels is expected in 4Q
• Development in Rotterdam• The value creation programme in Rotterdam is progressing• Impacted negatively by departure of some “contango” based customers• PID production is stable at expected levels
17
Operational review

Agenda
• Highlights
• Financials
• Operational review/Strategy
• Market update and prospects

Financials
19
2.82.92.9
4.14.04.04.0
0.0
3.0
6.0
2Q16 3Q16 4Q16 2Q17 3Q171Q17
Mill
ion
CBM
1Q16
Odfjell Terminals: Commercial available capacity
Odfjell Terminals: Utilisation development
Util
isat
ion
Terminals: The end of the “contango” in the oil/products market has a negative impact on the terminal business
1 000
500
0
2 500
2 000
1 500
Oil Minerals
1 100
Chemicals
2 417
Odfjell Terminals: Contango development
Odfjell Terminals: Capacity by cargo-type*
1,00
0 cb
m
* Includes capacity from Singapore terminal
50%
55%
60%
65%
70%
75%
80%
85%
90%
95%
100%
3Q171Q174Q16 2Q171Q16 3Q162Q16
Chemical storageOil mineral storage (Rotterdam)Odfjell Terminals total

Financials
Tankers: our volumes are up, but the market continues to be weak. Our COA portfolio softens the impact
20
3.02.82.82.82.82.93.1
0.0
3.0
6.0
Milli
on to
nnes
3Q172Q171Q174Q163Q162Q161Q16
Volumes carried
60
70
80
90
100
110
120
130
140
150
-0.6%
-4.1%
2017201620152014201320122011201020092008
Chemical tanker spot earnings index (midcycle = 100)Source: Clarkson Platou
Odfix indexOdfix average 2008-2016
Odfjell Tankers: Volume development Odfjell Tankers: ODFIX versus chemical tanker spot rates*
* ODFIX relative underperformance related to Hurricane Harvey and delivery of newbuildings
6 200
5 600
5 800
6 800
6 600
6 000
6 400
5 4001Q16
6 363
6 172
2Q16
6 310
4Q16
6 234
3Q16 3Q17
6 735
2Q17
6 593
1Q17
6 511
Voyage days
Odfjell Tankers: Voyage days development Odfjell Tankers: COA coverage
0%
10%
20%
30%
40%
50%
60%
70%
80%
90%
2Q17 3Q171Q172Q15 4Q163Q15 2Q164Q15 1Q16 3Q16
COA coverageAverage

Market update and prospects
Market dynamics – Chemical tankers
Source: Clarksons Platou Securities AS
21
DEMAND:
• Clarksons Platou forecast tonne-mile demand to grow around 4% through 2019
• Demand growth driven by new plant capacity in the US and ME driven by its feedstock advantages
• This will drive longer hauls of chemical cargoes and potentially pushing tonne-mile demand on top of GDP growth
SUPPLY
• Clarksons Platou forecasts chemical tanker net fleet growth to be 0.8% in 2019
• We are at the peak of deliveries and going forward demand will outgrow supply
• Very limited ordering of new tonnage
MARKET DYNAMICS
• High competitive pressure from swing tonnage
• Utlilization is expected to improve from 2018
• A recovery is contingent on limited newbuilding orders and continued global growth. CPP market remains a «joker»
• We expect consolidation to continue within chemical tankers
Supply/Demand forecast
Fleet utilisation forecast

22
Prospects
• We believe that chemical tanker markets will gradually
improve through 2018 as tonne-mile demand is expected
to surpass net fleet growth
• We expect storage demand for oil minerals to remain
challenging while we expect stable demand and results
for chemical storage
• We expect 4Q results to be in line with 3Q 17

ODFJELL SE - Conrad Mohrs veg 29, P.O. Box 6101 Postterminalen - 5892 Bergen, Norway Tel: +47 55 27 00 00 - Fax: +47 55 28 47 41 - E-mail: [email protected] - Org. no: 930 192 503
Odfjell.com
Company representatives:
Kristian Mørch, CEO | Tel: +47 55 27 00 00 | E-mail: [email protected]
Terje Iversen, CFO | Tel: +47 55 27 00 00 | Mobile: +47 93 24 03 59 | E-mail: [email protected]
IR Contact: Bjørn Kristian Røed, Research & IR | Tel: +47 55 27 47 33 | Mobile: +47 40 91 98 68 | E-mail: [email protected]
Media Contact: Anngun Dybsland, Communications Manager | Mobile: + 47 41 54 88 54 |E-mail: [email protected]