Embed Size (px)
Citation preview

Third Quarter Retail Performance Stalls
Oahu | Hawaii Research & Forecast Report
RETAIL MARKETThird Quarter 2018
Mike Hamasu Director of Research | Hawaii
Market IndicatorsRelative to previous quarter
3Q2018 vs. 2Q2018
VACANCY
YTD NET ABSORPTION
CONSTRUCTION
RENTAL RATE
Oahu Retail Net Absorption vs. Vacancy Rate21
3,58
5
7.33%6.08%
0.00%
2.00%
4.00%
6.00%
8.00%
(100,000)
0
100,000
200,000
300,000
400,000
500,000
600,000
2008 2009 2010 2011 2012 2013 2014 2015 2016 2017 3Q2018
sq. ft.
Net Absorption (SF) Vacancy
©2018 Colliers International Research and Consulting. All rights reserved.
Summary Statistics 3Q2018 Retail Market
YTD Net Absorption 213,585 SF
Vacancy Rate 6.08%
Average Asking Rent Range $3.60 to $4.61 psf/mo
Average Asking Rent NNN $4.16 psf/mo
Average Operating Exp. $1.38 psf/mo
“2018’s outlook is positive as new, national brand retailers have opened in Hawaii, demonstrating confidence in our market and economy. Increased tourism expenditures will propel Hawaii’s retail market to finish the year strong.” Erin Mitsuyoshi (S), Associate
After gaining nearly 1.3 million square feet of net absorption during the past fifteen quarters, Oahu’s retail market’s momentum slowed. The third quarter of 2018 posted a loss of 9,334 square feet of occupancy as vacancy rates remained relatively static at 6.08%. Despite the slight third quarter loss in occupancy, year-to-date net absorption remained a robust 213,585 square feet.
Flourishing during the year, regional malls, power centers, and resort retail centers are responsible for most of the occupancy gains. As mentioned in previous reports, newly-built space located at Ala Moana Center, Ka Makana Ali’i, and International Market Place has monopolized the retail headlines with numerous new leases. This year’s opening of Uniqlo at Ala Moana Center, Whole Foods within Ward Center’s complex coupled with the delivery of Kamehameha Schools’ new retail center at 4618 Kilauea Avenue in Kahala, helped to offset losses incurred when restaurants Baku and Yauatcha closed at International Market Place.
Colliers anticipates that the retail market will strengthen in the near term when several new centers are delivered to the market (i.e. Lau Hala Shops in Kailua and Kealanani Plaza in Kapolei). Oahu will also benefit from several new retail concepts and the expansion of national retailers to Hawaii that are planning new store openings within the next few quarters (Guitar Center, Ulta Beauty, HomeGoods, and Buffalo Wild Wings).
2 Oahu Retail Research & Forecast Report | 3Q2018 | Oahu, Hawaii | Colliers International
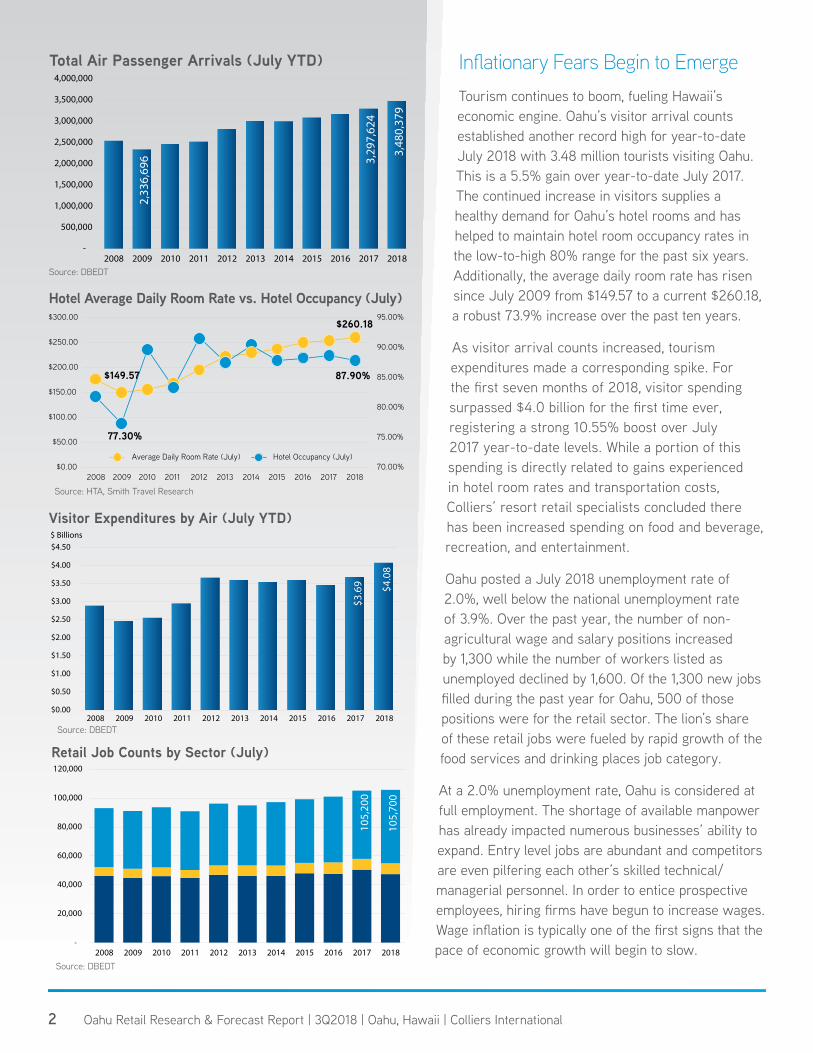
Total Air Passenger Arrivals (July YTD)
2,33
6,69
6 3,29
7,62
4
3,48
0,37
9
-
500,000
1,000,000
1,500,000
2,000,000
2,500,000
3,000,000
3,500,000
4,000,000
2008 2009 2010 2011 2012 2013 2014 2015 2016 2017 2018
Inflationary Fears Begin to EmergeTourism continues to boom, fueling Hawaii’s economic engine. Oahu’s visitor arrival counts established another record high for year-to-date July 2018 with 3.48 million tourists visiting Oahu. This is a 5.5% gain over year-to-date July 2017. The continued increase in visitors supplies a healthy demand for Oahu’s hotel rooms and has helped to maintain hotel room occupancy rates in the low-to-high 80% range for the past six years. Additionally, the average daily room rate has risen since July 2009 from $149.57 to a current $260.18, a robust 73.9% increase over the past ten years.
As visitor arrival counts increased, tourism expenditures made a corresponding spike. For the first seven months of 2018, visitor spending surpassed $4.0 billion for the first time ever, registering a strong 10.55% boost over July 2017 year-to-date levels. While a portion of this spending is directly related to gains experienced in hotel room rates and transportation costs, Colliers’ resort retail specialists concluded there has been increased spending on food and beverage, recreation, and entertainment.
Oahu posted a July 2018 unemployment rate of 2.0%, well below the national unemployment rate of 3.9%. Over the past year, the number of non-agricultural wage and salary positions increased by 1,300 while the number of workers listed as unemployed declined by 1,600. Of the 1,300 new jobs filled during the past year for Oahu, 500 of those positions were for the retail sector. The lion’s share of these retail jobs were fueled by rapid growth of the food services and drinking places job category.
At a 2.0% unemployment rate, Oahu is considered at full employment. The shortage of available manpower has already impacted numerous businesses’ ability to expand. Entry level jobs are abundant and competitors are even pilfering each other’s skilled technical/managerial personnel. In order to entice prospective employees, hiring firms have begun to increase wages. Wage inflation is typically one of the first signs that the pace of economic growth will begin to slow.
Visitor Expenditures by Air (July YTD)
Source: DBEDT
$3.6
9 $4.0
8
$0.00
$0.50
$1.00
$1.50
$2.00
$2.50
$3.00
$3.50
$4.00
$4.50
2008 2009 2010 2011 2012 2013 2014 2015 2016 2017 2018
$ Billions
Hotel Average Daily Room Rate vs. Hotel Occupancy (July)
Source: HTA, Smith Travel Research
$149.57
$260.18
77.30%
87.90%
70.00%
75.00%
80.00%
85.00%
90.00%
95.00%
$0.00
$50.00
$100.00
$150.00
$200.00
$250.00
$300.00
2008 2009 2010 2011 2012 2013 2014 2015 2016 2017 2018
Average Daily Room Rate (July) Hotel Occupancy (July)
Retail Job Counts by Sector (July)
-
20,000
40,000
60,000
80,000
100,000
120,000
2008 2009 2010 2011 2012 2013 2014 2015 2016 2017 2018Retail Trade Jobs Arts, Entertainment, Recreation
Food Services & Drinking Places
105,
700
105,
200
Source: DBEDT
Source: DBEDT

3 Oahu Retail Research & Forecast Report | 3Q2018 | Oahu, Hawaii | Colliers International
©2018 Colliers International Research and Consulting. All rights reserved.
$3.2
4
$4.0
0
$4.1
6
$2.00
$2.50
$3.00
$3.50
$4.00
$4.50
2008 2009 2010 2011 2012 2013 2014 2015 2016 2017 3Q2018
PSF/MoOahu Retail Average Asking Base Rent
Oahu Retail Net Absorption vs. Vacancy Rate Forecast
©2018 Colliers International Research and Consulting. All rights reserved.
FORECAST
5.75%
0.00%
1.00%
2.00%
3.00%
4.00%
5.00%
6.00%
7.00%
8.00%
9.00%
(100,000)
(50,000)
0
50,000
100,000
150,000
200,000
250,000
300,000
350,000
400,000
450,000Sq. Ft.
Net Absorption (SF) Vacancy
Oahu SFH Median Home Price (July) vs. Unit Sales (July YTD)
2,12
4
2,09
0
$750,000$789,500
-
500
1,000
1,500
2,000
2,500
$0
$100,000
$200,000
$300,000
$400,000
$500,000
$600,000
$700,000
$800,000
$900,000
2008 2009 2010 2011 2012 2013 2014 2015 2016 2017 2018
Oahu Single Family Home Unit SalesOahu Single Family Home Median Price
Source: DBEDT, HBR
As inflationary fears increase and become realized, the Federal Reserve increases its efforts to curb upward price pressures by boosting interest rates. Higher borrowing costs, typically slows business investment, real estate acquisition and development activities.
The pricing for single family median homes hit a July year-to-date high of $789,500. This 5.3% increase in pricing also corresponded to a 1.6% decline in the total number of residential transactions to 2,090. Residential home sales and median prices affect the retail marketplace as they correlate to consumer confidence levels. It is typical that a boost in consumer confidence will lead to an increase in retail spending. Moreover, the purchase of a new home also boosts spending on household items such as appliances, furniture and gardening supplies.
Rental Rate Growth Stalls During Third QuarterAfter a healthy 4% increase in rents for the first six months of the year, the third quarter average retail asking base rent remained static at $4.16 per square foot per month (psf/mo). The greatest drops in rents occurred in Waikiki which fell by roughly 1.0%, but was offset by a 1.0% gain in East Oahu.
New Retail Developments to Boost Occupancy GainsBarring any black swan event, Colliers projects that the Oahu retail marketplace will remain positive despite the near term likelihood of interest rate hikes from the Federal Reserve. The short term outlook for Oahu’s economy is that it appears stable with nominal 1.0% to 2.0% gross state product growth. Colliers forecasts that an additional 100,000 square feet of new retail occupancy, bolstered by the delivery of several new developments, will likely result in vacancy rates falling below 6.0% by the end of the first quarter of 2019. For the longer term, Colliers anticipates that a rising interest rate environment coupled with shortages of available manpower will inhibit future retail development and store expansion plans.
Lau Hala Shops

4
Copyright © 2018 Colliers International.The information contained herein has been obtained from sources deemed reliable. While every reasonable effort has been made to ensure its accuracy, we cannot guarantee it. No responsibility is assumed for any inaccuracies. Readers are encouraged to consult their professional advisors prior to acting on any of the material contained in this report.
Colliers International | Hawaii
220 S. King Street, Suite 1800 | Honolulu, Hawaii 96813+1 808 524 2666
colliers.com/hawaii
EXECUTIVE MANAGEMENTSarah Lee Morihara (B)President/Managing Director+1 808 523 [email protected]
Andrew D. Friedlander (B) SIORPrincipal Broker+1 808 523 [email protected]
CONSULTING & RESEARCHMike Y. HamasuDirector of Consulting & Research+1 808 523 [email protected]
Nanette Vinton (S)Research Consultant / Project Manager+1 808 523 [email protected]
*Greene Property Group, LLC **Bratton Realty Advisers, Ltd.
***Rokit, Inc. Exclusively contracted to Colliers International HI, LLC
RETAIL SERVICESJon-Eric Greene* (B)+1 808 330 [email protected]
Mark D. Bratton** (B) CCIM+1 808 523 [email protected]
Nathan A. Fong (B)+1 808 523 [email protected]
Kim F. Scoggins*** (B) CCIM+1 808 523 [email protected]
Emalia Pietsch (S)+1 808 523 [email protected]
Julia Matsuura (S)+1 808 523 [email protected]
Byron “Biff” Graper (S) +1 808 523 [email protected]
Erin Mitsuyoshi (S)+1 808 523 [email protected]
Cathy Kong (S)+1 808 523 [email protected]
Jodi A. Webb (S) +1 808 523 [email protected]
Andy Y. Kazama (S)+1 808 523 [email protected]
Maria Su (S)+1 808 691 [email protected]
TERMS AND DEFINITIONS > TOTAL INVENTORY - Total rentable square footage in shopping centers greater than 20,000 square feet. > NET ABSORPTION - The net change in occupied space over a period of time. Year-to-date net absorption is the difference in occupied space between the end of the previous year and the current quarter. > AVERAGE ASKING RENT - The ratio of aggregate landlord asking rents divided by the total available space within a specific geography or building class. > VACANT SPACE - Space that is not occupied by a tenant. This includes sublease space that is unoccupied.
> VACANCY RATE - The ratio of vacant space divided by the total inventory square footage. > AVERAGE OPERATING EXPENSE - The ratio of tenant expenses, such as building utilities, management fees, building maintenance, real property taxes and insurance, divided by the total available space within a specific geography or building class.
> NNN “TRIPLE-NET” RENT - Rents paid to the landlord that do not include building operating expenses and additional taxes and fees.
Third Quarter 2018 - Oahu Retail Market Statistics RETAIL MARKET INVENTORY - BY SUBMARKET AREA
TOTAL INVENTORY (SF)
VACANT SPACE (SF) VACANCY RATE YTD NET ABSORPTION
(SF)AVG. LOW NNN ASKING
RENTS (PSF/MO)AVG. HIGH NNN ASKING
RENTS (PSF/MO)AVG. CAM EXPENSES
(PSF/MO)
CENTRAL OAHU 889,235 22,123 2.49% 1,592 $3.75 $4.00 $1.07
EAST OAHU 1,521,774 34,413 2.26% 2,602 $5.41 $6.82 $1.57
HONOLULU* 4,741,464 194,932 4.11% 133,620 $3.32 $4.96 $1.53
LEEWARD OAHU 4,407,948 389,803 8.84% (22,592) $3.50 $3.85 $1.19
NORTH SHORE 198,125 1,125 0.57% 8,639 $3.55 $3.75 $1.58
WAIANAE 342,060 35,019 10.24% 31,763 $1.83 $3.17 $1.00
WAIKIKI 1,658,067 150,821 9.10% 69,432 $9.38 $18.88 $2.59
WEST OAHU 1,721,637 150,804 8.76% (4,218) $4.29 $4.77 $1.31
WINDWARD OAHU 1,621,750 60,761 3.75% (7,253) $2.99 $4.65 $1.61
TOTALS* 17,102,060 1,039,801 6.08% 213,585 $3.61 $4.61 $1.38*Islandwide total for average rents and CAM calculations exclude Waikiki and Ala Moana Center
RETAIL MARKET INVENTORY - BY BUILDING CLASSTOTAL INVENTORY
(SF)VACANT SPACE
(SF) VACANCY RATE YTD NET ABSORPTION (SF)
AVG. LOW NNN ASKING RENTS (PSF/MO)
AVG. HIGH NNN ASKING RENTS (PSF/MO)
AVG. CAM EXPENSES (PSF/MO)
COMMUNITY/POWER CENTER 3,269,784 300,706 9.20% 47,512 $3.93 $4.75 $1.55
NEIGHBORHOOD 4,725,648 239,731 5.07% 8,823 $3.73 $4.46 $1.26
REGIONAL* 5,682,175 243,015 4.28% 92,786 $4.51 $10.15 $2.89
RESORT/SPECIALTY 1,829,264 158,300 8.65% 75,601 $8.70 $17.22 $2.47
STRIP 1,595,189 98,049 6.15% (11,137) $3.55 $4.81 $1.39
TOTALS** 17,102,060 1,039,801 6.08% 213,585 $3.61 $4.61 $1.38
* Includes Ala Moana Center in calculations **Islandwide total for average rents and CAM calculations exclude Waikiki and Ala Moana Center ©2018 Colliers International Research and Consulting. All rights reserved.