Embed Size (px)
Citation preview

Schedule 1
1
Number of APs 15 Population : 1292920
Number of GPs 163 Area: 2315.61 Sq.Km
Number of MBs 1 Population : 152001
Number of TCs 1 Area: 17.42 Sq.Km
2
3
Enclosed : Annexure- I & II
4
Enclosed : Annexure- I & II
5
(Rs.in crores)
Assignment of
taxes
Devolution of tax
revenueGrants-in-aid Others (specify)
2nd SFC NIL 15.0207
PRIs
ULBs 1.6390 1.4944
3 nd SFC NIL
PRIs
2007-08 16.1963 0.9130
2008-09 39.2747 6.1319 2.4272
2009-10 41.5520 8.0536 2.6214
2010-11 43.8539 3.0536 2.8310
ULBs
2007-08 4.6732 1.2670
2008-09 11.3322 0.5545
2009-10 11.9893 0.2528
2010-11 12.6534 0.4213
Transfer of resources to PRIs/ULBs set out by the State Finance Commission
Average population covered by PRIs and ULBs at each level as on 1.4.2001
(as per Census 2001). Please append in an extra sheets (in excel sheet) population figures of all PRIs and ULBs
from which the average is obtained.
Average area covered by PRIs and ULBs at each level as on 1.4.2001
(as per Census 2001). Please append in an extra sheets (in excel sheet) area figures of all PRIs and ULBs from
which the average is obtained.
THIRTEENTH FINANCE COMMISSION
NAME OF THE DISTRICT CACHAR, ASSAM
INFORMATION ON LOCAL BODIES
Number of Local Bodies at each tier of Panchayati Raj Institutions (PRIs) and each level of Urban Local Bodies
(ULBs) in the States (as on 1.4.2008)
Date of Last PRI Election; Last ULB Election
107 S1

Schedule -2A
Recommended
by SFC*
Actual
transfers
Recommended
by SFC*
Actual
transfers**
Recommended
by SFC*
Actual
transfers
Recommended
by SFC*
Actual
transfers
2002-03 NIL NIL 0.3109 NIL NIL NIL 0.3109 NIL
2003-04 NIL NIL 0.3502 NIL NIL NIL 0.3502 NIL
2004-05 NIL NIL 0.3947 NIL NIL NIL 0.3947 NIL
2005-06 NIL NIL 0.4460 NIL NIL NIL 0.4460 NIL
2006-07
2007-08 3.2393 0.9130
2008-09 7.8549 6.1319 2.4272
2009-10 8.3104 8.0536 2.6214
2010-11 8.7708 3.0536 2.8310
2011-12
2012-13
2013-14
2014-15
* If SFC not constituted or where the first SFC has been consititued and its award is yet to be made or yet to be implemented, leave this column blank.
** Actual transfer against devolution has been shown as nil because the entire salary expenditure of provincialised Panchayat staff has been met out of the
Consolidated Fund of the State.
Transfer of Resources to Local Bodies
(actuals upto 2006-07 and estimated for 2007-08 onwards)
Grants-in-Aid Others (Specify) Total
Year
Collection
from
assigned
taxes
Amount
actually
passed on
Devolution
(Rs. in crores)Transfer of resources to District Panchayats
108 S2-A

Recommended
by SFC*
Actual
transfers
Recommended
by SFC*
Actual
transfers**
Recommended
by SFC*
Actual
transfers
Recommended
by SFC*
Actual
transfers
2002-03 NIL NIL 0.9315 NIL 0.9315 NIL
2003-04 NIL NIL 1.0512 NIL 1.0512 NIL
2004-05 NIL NIL 1.1847 NIL 1.1847 NIL
2005-06 NIL NIL 1.3387 NIL 1.3387 NIL
2006-07
2007-08 4.8589
2008-09 11.7824
2009-10 12.4656
2010-11 13.1562
2011-12
2012-13
2013-14
2014-15
* If SFC not constituted or where the first SFC has been consititued and its award is yet to be made or yet to be implemented, leave this column blank.
** Actual transfer against devolution has been shown as nil because the entire salary expenditure of provincialised Panchayat staff has been met out of the
Consolidated Fund of the State.
Grants-in-Aid Others (Specify) Total
Year
Collection
from
assigned
taxes
Amount
actually
passed on
Devolution
Transfer of Resources to Local Bodies
(actuals upto 2006-07 and estimated for 2007-08 onwards)
Schedule -2B
(Rs. in crores)Transfer of resources to Block Panchayats
109 S2-B

Recommended
by SFC*
Actual
transfers
Recommended
by SFC*
Actual
transfers**
Recommended
by SFC*
Actual
transfers
Recommended
by SFC*
Actual
transfers
2002-03 NIL NIL 1.8629 NIL 1.8629 NIL
2003-04 NIL NIL 2.1019 NIL 2.1019 NIL
2004-05 NIL NIL 2.3700 NIL 2.3700 NIL
2005-06 NIL NIL 2.6780 NIL 2.6780 NIL
2006-07
2007-08 8.0982
2008-09 19.6373
2009-10 20.7760
2010-11 21.9269
2011-12
2012-13
2013-14
2014-15
* If SFC not constituted or where the first SFC has been consititued and its award is yet to be made or yet to be implemented, leave this column blank.
** Actual transfer against devolution has been shown as nil because the entire salary expenditure of provincialised Panchayat staff has been met out of the
Consolidated Fund of the State.
Year
Others (Specify) TotalCollection
from
assigned
taxes
Amount
actually
passed
on
Devolution Grants-in-Aid
Transfer of Resources to Local Bodies
(actuals upto 2006-07 and estimated for 2007-08 onwards)
Schedule -2C
Transfer of resources to Village Panchayats (Rs. in crores)
110 S2-C

Recommended
by SFC*
Actual
transfers
Recommended
by SFC*
Actual
transfers
Recommended
by SFC*
Actual
transfers
Recommended
by SFC*
Actual
transfers
2002-03
2003-04
2004-05
2005-06
2006-07
2007-08
2008-09
2009-10
2010-11
2011-12
2012-13
2013-14
2014-15
* If SFC not constituted or where the first SFC has been consititued and its award is yet to be made or yet to be implemented, leave this column blank.
Does not arises
Transfer of Resources to Local Bodies
(actuals upto 2006-07 and estimated for 2007-08 onwards)
Schedule -2D
(Rs. in Crores)Transfer of resources to Municipal Corporations
Grants-in-Aid Others (Specify) Total
Year
Collection
from
assigned
taxes
Amount
actually
passed on
Devolution
111 S2-D

Recommended
by SFC*
Actual
transfers
Recommended
by SFC*
Actual
transfers
Recommended
by SFC*
Actual
transfers
Recommended
by SFC*
Actual
transfers
2002-03 0.3284 NIL 0.3619 0.6903 NIL
2003-04 0.3703 0.1500 0.3619 0.7322 0.1500
2004-05 0.4174 0.1000 0.3619 0.7793 0.1000
2005-06 0.4715 0.1000 0.3619 0.8334 0.1000
2006-07 0.1000 0.1000
2007-08 4.3189 1.0799
2008-09 10.4729 0.3710
2009-10 11.0802 0.2435
2010-11 11.6940 0.1298
2011-12
2012-13
2013-14
2014-15
* If SFC not constituted or where the first SFC has been consititued and its award is yet to be made or yet to be implemented, leave this column blank.
Schedule -2E
Transfer of resources to Municipalities ( Silchar MB) (Rs. in Crores)
Grants-in-Aid Others (Specify) Total
Year
Collection
from
assigned
taxes
Amount
actually
passed on
Devolution
Note:- The figure shown against the column actual transfer under devolution is not based on the recommendations of SFC. As per government decision only
the proceeds of M.V. Tax were shared with MBs & TCs.
Transfer of Resources to Local Bodies
(actuals upto 2006-07 and estimated for 2007-08 onwards)
112 S2-E

Recommended
by SFC*
Actual
transfers
Recommended
by SFC*
Actual
transfers
Recommended
by SFC*
Actual
transfers
Recommended
by SFC*
Actual
transfers
2002-03 0.0106 NIL 0.0117 0.0223 NIL
2003-04 0.0120 0.0275 0.0117 0.0237 0.0275
2004-05 0.0135 0.0300 0.0117 0.0252 0.0300
2005-06 0.0153 0.0300 0.0117 0.0270 0.0300
2006-07 0.1436 0.1436
2007-08 0.3543 0.1872
2008-09 0.8592 0.1835
2009-10 0.9091 0.0093
2010-11 0.9594 0.2915
2011-12
2012-13
2013-14
2014-15
* If SFC not constituted or where the first SFC has been consititued and its award is yet to be made or yet to be implemented, leave this column blank.
Note:- The figure shown against the column actual transfer under devolution is not based on the recommendations of SFC. As per government decision only the
proceeds of M.V. Tax were shared with MBs & TCs.
Grants-in-Aid Others (Specify) Total
Schedule -2F
Transfer of resources to Town Panchayats ( Lakhipur TC) (Rs. in Crores)
Year
Collection
from
assigned
taxes
Amount
actually
passed on
Devolution
Transfer of Resources to Local Bodies
(actuals upto 2006-07 and estimated for 2007-08 onwards)
113 S2-F
Budget Head/s
(Sub Head/s)
Amount (Rs. In
thousand)
1 2 3 4 5 6
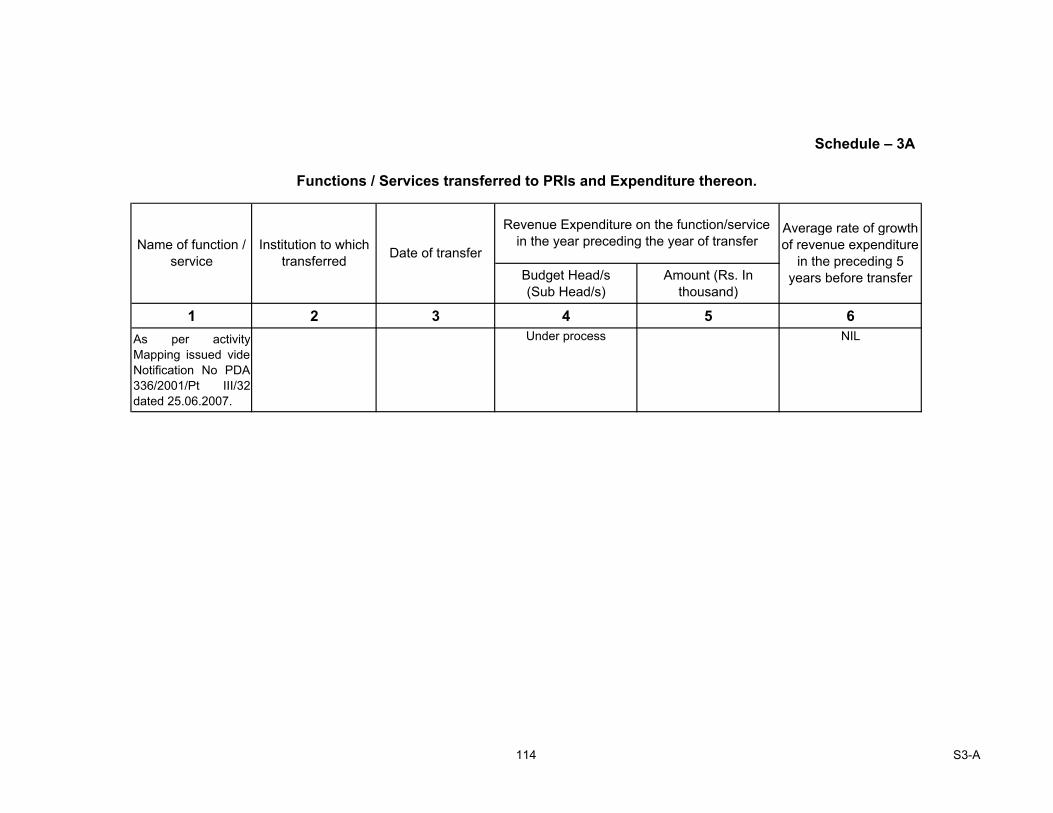
As per activity
Mapping issued vide
Notification No PDA
336/2001/Pt III/32
dated 25.06.2007.
Under process NIL
Schedule – 3A
Functions / Services transferred to PRIs and Expenditure thereon.
Revenue Expenditure on the function/service
in the year preceding the year of transferAverage rate of growth
of revenue expenditure
in the preceding 5
years before transfer
Date of transferInstitution to which
transferred
Name of function /
service
114 S3-A
Budget Head/s
(Sub Head/s)
Amount (Rs. In
thousand)
1 2 3 4 5 6
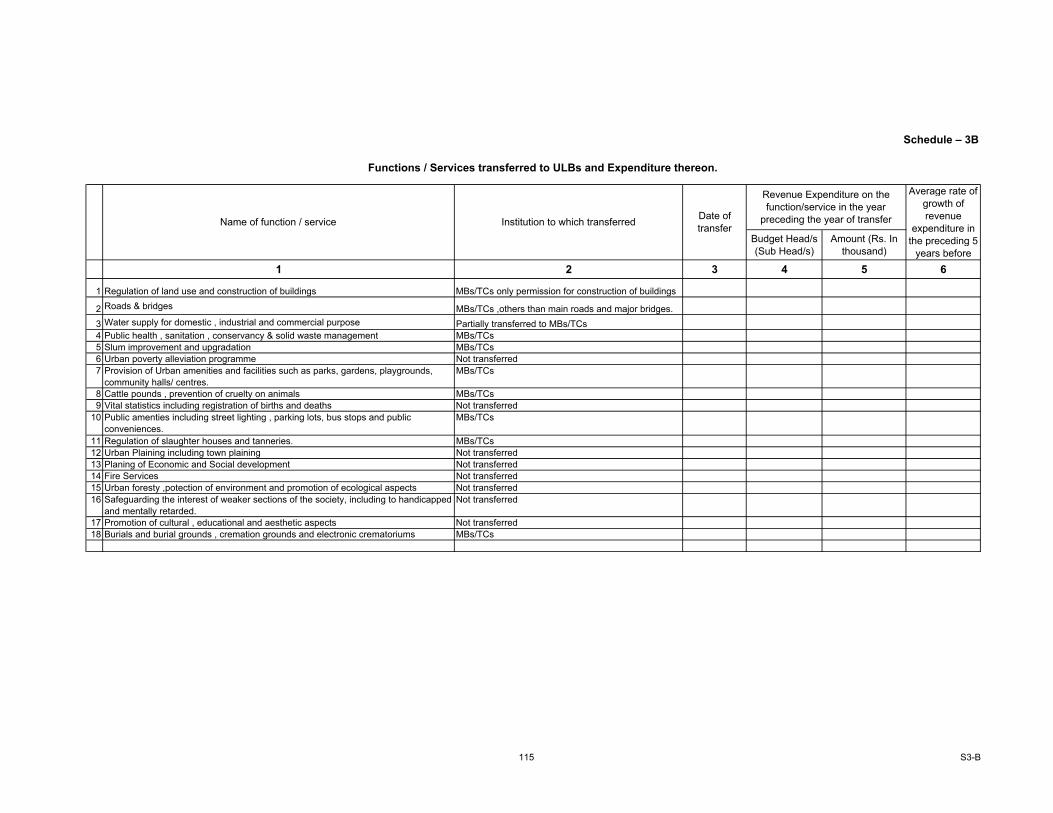
1 Regulation of land use and construction of buildings MBs/TCs only permission for construction of buildings
2 Roads & bridges MBs/TCs ,others than main roads and major bridges.
3 Water supply for domestic , industrial and commercial purpose Partially transferred to MBs/TCs
4 Public health , sanitation , conservancy & solid waste management MBs/TCs
5 Slum improvement and upgradation MBs/TCs
6 Urban poverty alleviation programme Not transferred
7 Provision of Urban amenities and facilities such as parks, gardens, playgrounds,
community halls/ centres.
MBs/TCs
8 Cattle pounds , prevention of cruelty on animals MBs/TCs
9 Vital statistics including registration of births and deaths Not transferred
10 Public amenties including street lighting , parking lots, bus stops and public
conveniences.
MBs/TCs
11 Regulation of slaughter houses and tanneries. MBs/TCs
12 Urban Plaining including town plaining Not transferred
13 Planing of Economic and Social development Not transferred
14 Fire Services Not transferred
15 Urban foresty ,potection of environment and promotion of ecological aspects Not transferred
16 Safeguarding the interest of weaker sections of the society, including to handicapped
and mentally retarded.
Not transferred
17 Promotion of cultural , educational and aesthetic aspects Not transferred
18 Burials and burial grounds , cremation grounds and electronic crematoriums MBs/TCs
Schedule – 3B
Functions / Services transferred to ULBs and Expenditure thereon.
Revenue Expenditure on the
function/service in the year
preceding the year of transfer
Average rate of
growth of
revenue
expenditure in
the preceding 5
years before
Date of
transferInstitution to which transferredName of function / service
115 S3-B

Tax
Non Tax
(Incl. user
charges)
2002-03 0.1030 1.0920 0.0095 0.0152 0.9400 0.0000 0.1520 SGRY 0.9400
State Share 0.1520
IWDP
EFC
SGSY
HARIYALI
PMGSY
2003-04 0.1656 16.5428 0.0042 0.0738 16.4000 0.0008 0.1420 SGRY 2.4900
State Share 0.1420
IWDP
EFC 0.0008
SGSY
HARIYALI
PMGSY 13.9100
2004-05 0.1768 15.3791 0.0051 0.0732 15.0783 0.0008 0.3000 SGRY 2.9383
State Share 0.3000
IWDP
EFC 0.0008
SGSY
HARIYALI
PMGSY 12.1400
2005-06 0.1757 43.0072 0.0078 0.0492 42.2828 0.0008 0.7236 SGRY 2.4128
State Share 0.7236
IWDP
EFC 0.0008
SGSY
HARIYALI
PMGSY 39.8700
2006-07 0.2034 54.3553 0.0798 53.4638 0.2303 0.6612 SGRY 2.6638
State Share 0.6612
IWDP
TFC 0.2303
SGSY
HARIYALI
PMGSY 50.8000
2007-08
(if available)0.2131 40.4429 0.1037 33.8726 0.2303 6.3400 SGRY 2.6226
State Share 0.3100
IWDP
TFC 0.2303
SGSY
HARIYALI
BRGF 10.1000
DDP 6.0300
PMGSY 21.1500
Schedule -4A
Expenditure and sources of Revenue/Capital of PRIs
Expenditure of Panchayati Raj Institutions and Sources of Revenue/Capital
(Rs. in Crores)
Year Own Revenue
District Panchayats : CACHAR
Expenditure Sources of Revenue Sources of Capital (Specify)
Transfers from
Central
Government
Source Amount
Grant-in-Aid
from State
Government
Assigned +
DevolutionRevenue Capital
Transfers from
TFC/EFC
Others
(specify)
116 S4-A

Tax
Non Tax
(Incl. user
charges)2002-03 0.4603 8.0067 0.1565 5.9167 2.0900 SGRY 3.1327
State Share 2.0900
IAY 2.7840
IWDP
EFC
SGSY
HARIYALI
NREGA
PMGSY
2003-04 0.4658 16.9256 0.1303 13.5983 0.0180 3.3093 SGRY 4.1158
State Share 3.3093
IAY 9.0700
IWDP 0.4125
EFC 0.0180
SGSY
HARIYALI
NREGA
PMGSY
2004-05 0.6268 18.3785 0.1474 13.6270 0.0184 4.7331 SGRY 2.5127
State Share 4.7331
IAY 10.2893
IWDP 0.4125
EFC 0.0184
SGSY
HARIYALI 0.4125
NREGA
PMGSY
2005-06 0.8698 16.2915 0.1691 12.0718 0.0180 4.2017 SGRY 5.3328
State Share 4.2017
IAY 6.7390
IWDP
EFC 0.0180
SGSY
HARIYALI
NREGA
PMGSY
2006-07 1.0003 28.6449 0.2367 21.1399 0.6910 6.8140 SGRY 6.0589
State Share 6.8140
IAY 14.5860
IWDP
TFC 0.6910SGSY
HARIYALI 0.4950
NREGA
PMGSY
2007-08
(if available)1.1503 82.2599 0.3078 73.8706 0.6910 7.6983 SGRY 3.1916
State Share 7.6983
IAY 17.5230
IWDP
TFC 0.6910
SGSY
HARIYALI
NREGA 53.1560
PMGSY
Transfers from
TFC/EFC
Assigned +
Devolution
Grant-in-Aid
from State
Government
Others
(specify)Amount
Year
Block Panchayats
Expenditure Sources of Revenue Sources of Capital (Specify)
Revenue Capital
Own RevenueTransfers from
Central
Government
Source
117 S4-A
Tax
Non Tax
(Incl. user
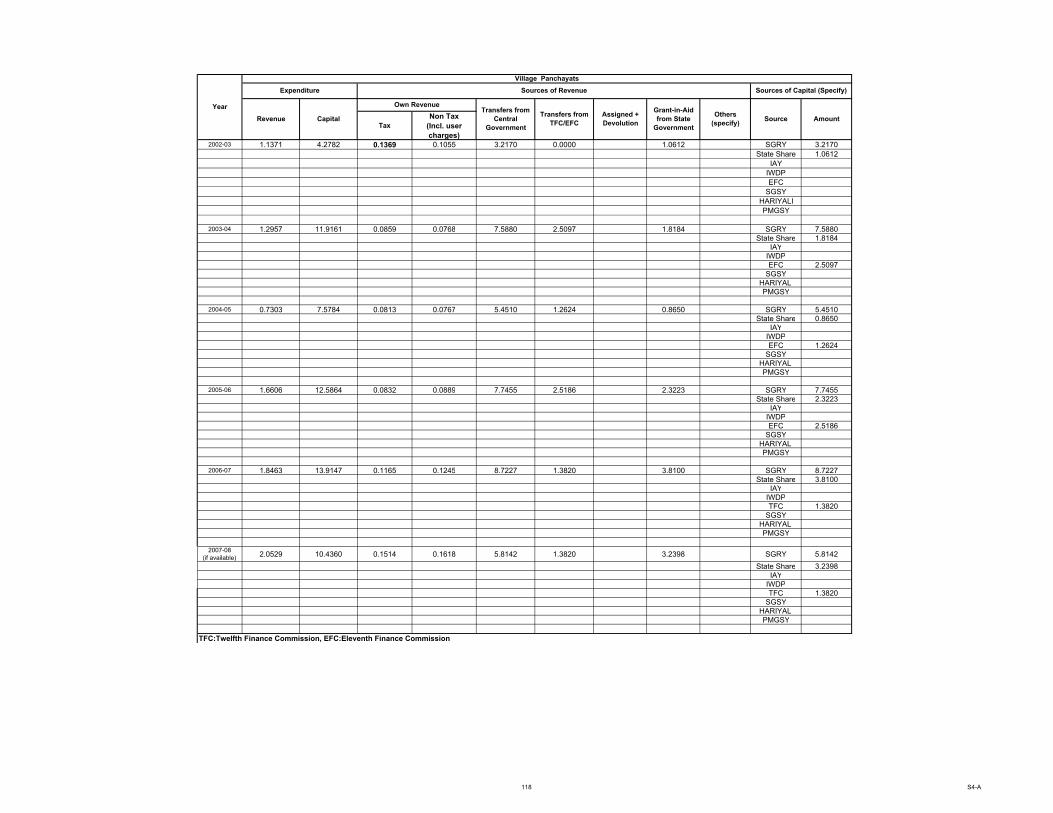
charges)2002-03 1.1371 4.2782 0.1369 0.1055 3.2170 0.0000 1.0612 SGRY 3.2170
State Share 1.0612
IAY
IWDP
EFC
SGSY
HARIYALI
PMGSY
2003-04 1.2957 11.9161 0.0859 0.0768 7.5880 2.5097 1.8184 SGRY 7.5880
State Share 1.8184
IAY
IWDP
EFC 2.5097
SGSY
HARIYALI
PMGSY
2004-05 0.7303 7.5784 0.0813 0.0767 5.4510 1.2624 0.8650 SGRY 5.4510
State Share 0.8650
IAY
IWDP
EFC 1.2624
SGSY
HARIYALI
PMGSY
2005-06 1.6606 12.5864 0.0832 0.0889 7.7455 2.5186 2.3223 SGRY 7.7455
State Share 2.3223
IAY
IWDP
EFC 2.5186
SGSY
HARIYALI
PMGSY
2006-07 1.8463 13.9147 0.1165 0.1245 8.7227 1.3820 3.8100 SGRY 8.7227
State Share 3.8100
IAY
IWDP
TFC 1.3820
SGSY
HARIYALI
PMGSY
2007-08
(if available)2.0529 10.4360 0.1514 0.1618 5.8142 1.3820 3.2398 SGRY 5.8142
State Share 3.2398
IAY
IWDP
TFC 1.3820
SGSY
HARIYALI
PMGSY
TFC:Twelfth Finance Commission, EFC:Eleventh Finance Commission
Expenditure Sources of Revenue Sources of Capital (Specify)
Assigned +
Devolution
Transfers from
TFC/EFC
Transfers from
Central
Government
Grant-in-Aid
from State
Government
Others
(specify)Revenue Capital
Own RevenueYear
Village Panchayats
Source Amount
118 S4-A

(Rs. In Crore)
Name of the District Panchayat 15 163
Total Area of District Panchayat 2315.61 Sq.km 2315.61 Sq.km
Total Population of District Panchayat 1292920 1292920
S.N. Items 2004-05 2005-06 2006-07 2007-08 2004-05 2005-06 2006-07 2007-08 2004-05 2005-06 2006-07 2007-08
I Expenditure
A Revenue 0.1768 0.1757 0.2034 0.2132 0.6268 0.8698 1.0003 1.1503 0.7303 1.6606 1.8463 2.0529
B Capital 15.3791 43.0072 54.3553 24.3129 18.3785 16.2915 28.6449 82.2599 7.5784 12.5864 13.9147 10.4360
II Sources of Revenue
A Own Revenue
i. Own tax 0.0051 0.0078 0.0109 0.0142 0.0813 0.0832 0.1165 0.1514
ii. Own non-tax 0.0732 0.0492 0.0798 0.1037 0.1474 0.1691 0.2367 0.3078 0.0767 0.0889 0.1245 0.1618
B Transfers from Central Government #
I SGRY 2.9383 2.4128 2.6638 2.6226 2.5127 5.3328 6.0589 3.1916 5.4510 7.7455 8.7227 5.8142
ii SGSY
iii PMGSY 12.1400 39.8700 50.8000 21.1500
iv NREGA 53.1560
v BRGF 10.1000
vi Hariyali 0.4125 0.4950
vii IAY 10.2893 6.7390 14.5860 17.5230
viii IWDP 0.4125
C. Transfers from TFC/EFC 0.0008 0.0008 0.2303 0.2303 0.0184 0.0180 0.6910 0.6910 1.2624 2.5186 1.3820 1.3820
D. Assigned + Devolution
E. Grant-in-Aid from State Government 0.3000 0.7236 0.6612 6.3400 4.7331 4.2017 6.8140 7.6983 0.8650 2.3223 3.8100 3.2398
F. Others (specify)
Total population of block panchayats:
District Panchayat
No. of Block panchayats:
Total area of block panchayats:
Schedule - 4B
No. of Village panchayats:
Total area of village panchayats:
Total population of village panchayats:
Village Panchayats
(aggregate information of all block panchayats in a district to be provided ) (aggregate information of all block panchayats in a district to be provided )
CACHAR
2315.61 Sq Km
1292920
# : Provide information on each of the CSS like SGRY, NREGS, IAY, PMGSY etc from which money is received in the space provided below. Insert additional rows if needed.
TFC:Twelfth Finance Commission, EFC:Eleventh Finance Commission
Separate format to be filled for each district.
Expenditure and Sources of Revenue of PRIs - District-wise CACHAR
Year Year
(detail information on each of the CSS to be given
below)
Expenditure and source of Revenue of Panchayati Raj Institutions(Information to be provided District-wise)
Block Panchayats
Year
119 S4-B

Tax
Non Tax
(Incl. user
charges)
2002-03
2003-04
2004-05
2005-06
2006-07
2007-08
(if available)
Tax
Non Tax
(Incl. user
charges)
2002-03 2.6052 0.0000 0.7104 1.2237 0.0000 0.0000 0.0000 0.0000 SJSRY
State Share
NSDP
MV
EFC
IDSMT
UIDSSMT
IHSDP
2003-04 3.2164 0.8395 0.8357 1.4395 0.5032 0.1863 0.1500 0.0000 SJSRY 0.5032
State Share
NSDP
MV 0.1500
EFC 0.1863
IDSMT
UIDSSMT
IHSDP
2004-05 3.7839 0.4741 0.9390 1.6175 0.2241 0.1500 0.1000 0.0000 SJSRY 0.2241
State Share
NSDP
MV 0.1000
EFC 0.1500
IDSMT
UIDSSMT
IHSDP
Revenue
Year
Municipalities SILCHAR MB
Expenditure Sources of Revenue Sources of Capital (Specify)
Transfers from
Central
Government
Amount Capital
Own Revenue
Assigned +
Devolution
Transfers from
TFC/EFC
Grant-in-Aid
from State
Government
Others
(specify)Source
Assigned +
DevolutionAmount
Own RevenueGrant-in-Aid
from State
Government
Others
(specify)Source
Transfers from
TFC/EFC
Transfers from
Central
Government
Year
Municipal Corporations
Expenditure Sources of Revenue Sources of Capital (Specify)
Revenue Capital
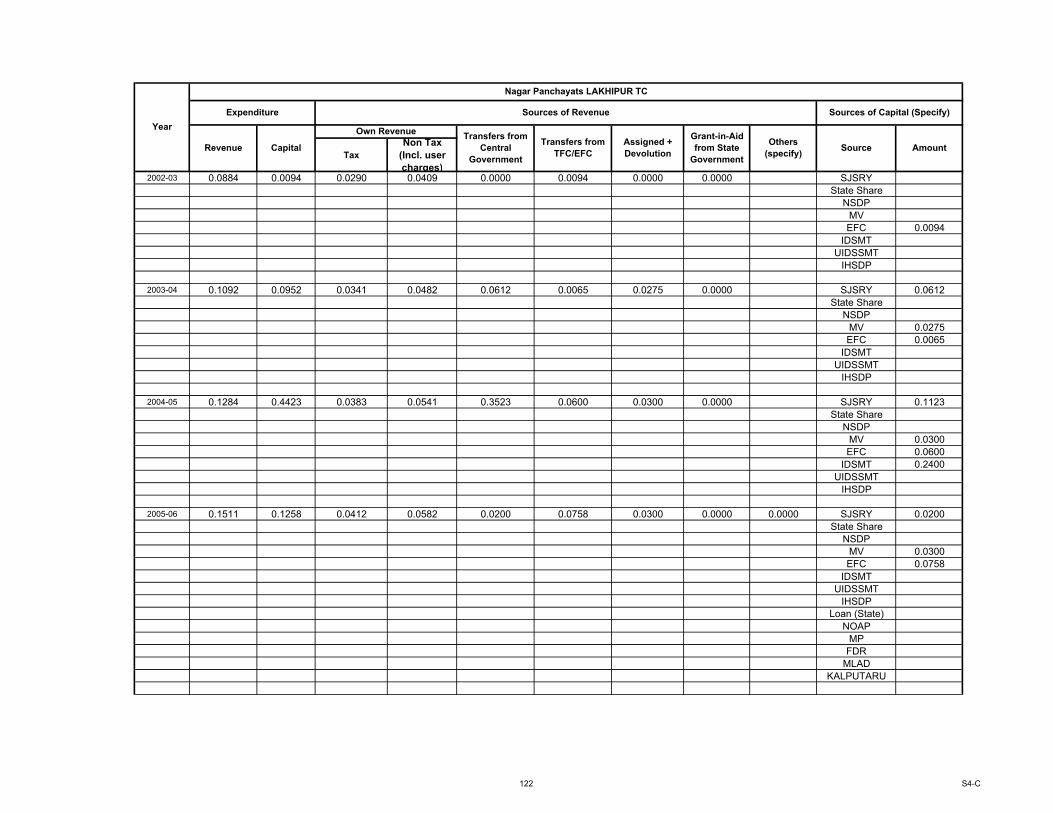
Schedule -4C
Expenditure and sources of Revenue/Capital of Urban Local Bodies
Expenditure of Urban Local Bodies and Sources of Revenue/Capital
(Rs. in Crores)
120 S4-C
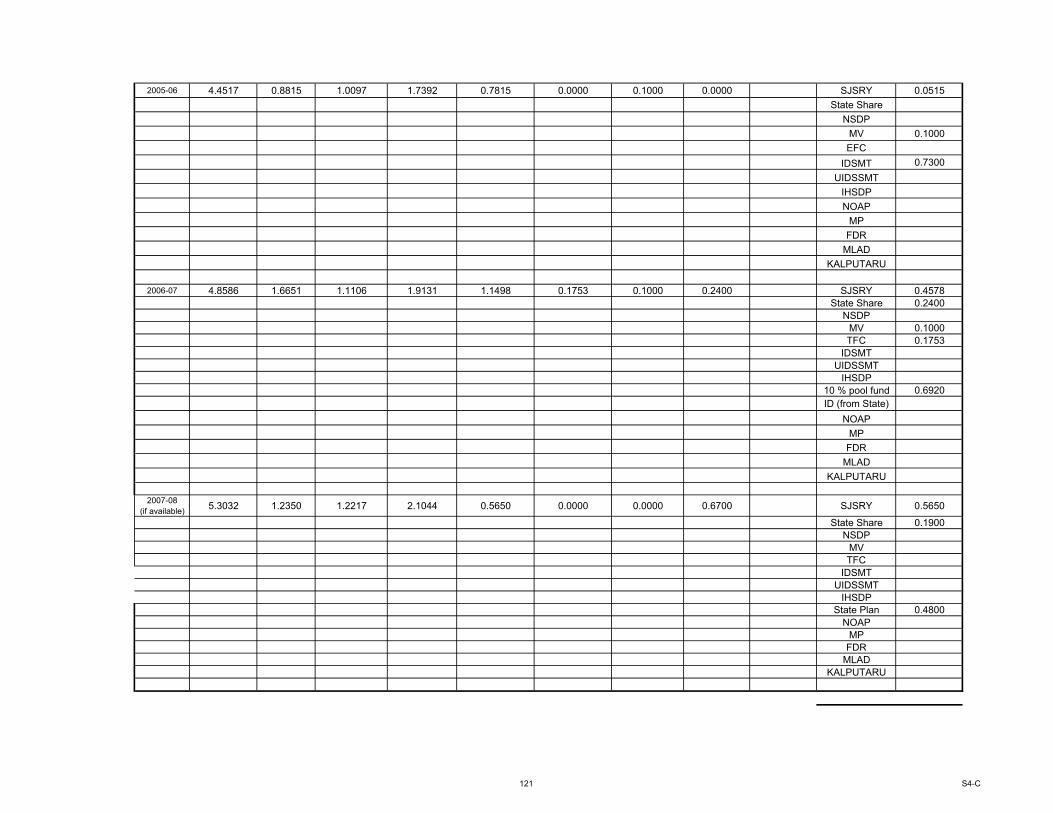
2005-06 4.4517 0.8815 1.0097 1.7392 0.7815 0.0000 0.1000 0.0000 SJSRY 0.0515
State Share
NSDP
MV 0.1000
EFC
IDSMT 0.7300
UIDSSMT
IHSDP
NOAP
MP
FDR
MLAD
KALPUTARU
2006-07 4.8586 1.6651 1.1106 1.9131 1.1498 0.1753 0.1000 0.2400 SJSRY 0.4578
State Share 0.2400
NSDP
MV 0.1000
TFC 0.1753
IDSMT
UIDSSMT
IHSDP
10 % pool fund 0.6920
ID (from State)
NOAP
MP
FDR
MLAD
KALPUTARU
2007-08
(if available)5.3032 1.2350 1.2217 2.1044 0.5650 0.0000 0.0000 0.6700 SJSRY 0.5650
State Share 0.1900
NSDP
MV
TFC
IDSMT
UIDSSMT
IHSDP
State Plan 0.4800
NOAP
MP
FDR
MLAD
KALPUTARU
121 S4-C
Tax
Non Tax
(Incl. user
charges)2002-03 0.0884 0.0094 0.0290 0.0409 0.0000 0.0094 0.0000 0.0000 SJSRY
State Share
NSDP
MV
EFC 0.0094
IDSMT
UIDSSMT
IHSDP
2003-04 0.1092 0.0952 0.0341 0.0482 0.0612 0.0065 0.0275 0.0000 SJSRY 0.0612
State Share
NSDP
MV 0.0275
EFC 0.0065
IDSMT
UIDSSMT
IHSDP
2004-05 0.1284 0.4423 0.0383 0.0541 0.3523 0.0600 0.0300 0.0000 SJSRY 0.1123
State Share
NSDP
MV 0.0300
EFC 0.0600
IDSMT 0.2400
UIDSSMT
IHSDP
2005-06 0.1511 0.1258 0.0412 0.0582 0.0200 0.0758 0.0300 0.0000 0.0000 SJSRY 0.0200
State Share
NSDP
MV 0.0300
EFC 0.0758
IDSMT
UIDSSMT
IHSDP
Loan (State)
NOAP
MP
FDR
MLAD
KALPUTARU
Grant-in-Aid
from State
Government
Own Revenue
RevenueOthers
(specify)
Expenditure
Transfers from
TFC/EFC
Transfers from
Central
Government
CapitalAssigned +
Devolution
Sources of Capital (Specify)Sources of Revenue
Amount
Year
Nagar Panchayats LAKHIPUR TC
Source
122 S4-C

2006-07 0.1650 0.7839 0.0453 0.0640 0.4646 0.0157 0.1436 0.1600 SJSRY 0.4646
State Share 0.1600
NSDP
MV 0.1436
TFC 0.0157
IDSMT
UIDSSMT
IHSDP
ID (from State)
NOAP
MP
FDR
MLAD
KALPUTARU
2007-08
(if available)0.1797 9.4011 0.0498 0.0704 8.6811 0.0000 0.0000 0.7200 SJSRY 0.7000
State Share
NSDP
MV
TFC
IDSMT
UIDSSMT 6.6158
IHSDP
10 % pool fund 1.3653
State Plan 0.7200
NOAP
MP
FDR
MLAD
KALPUTARU
TFC:Twelfth Finance Commission, EFC:Eleventh Finance Commission
UIDSSMT: Urban Infrastructure Development Scheme for Small and Medium Towns
IDSMT: Integrated Development of Small and Medium Towns
IHSDP : Integrated Housing and Slum Development Programme
123 S4-C

(Rs. In Crore)
(aggregate information of all Municipal Corporation in the District to be provided if there are more than one in the district)
Name of the Municipal Corporations: 1 1
Total Area of Municipal Corporations: 15.76 Sq.Km 1.66 Sq.Km
Total Population of Municipal Corporations: 15.76 9802
S.N. Items 2004-05 2005-06 2006-07 2007-08 2004-05 2005-06 2006-07 2007-08 2004-05 2005-06 2006-07 2007-08
I Expenditure
A Revenue 3.7839 4.4517 4.8586 5.3032 0.1284 0.1511 0.1650 0.1797
B Capital 0.4741 0.8815 1.6651 1.2350 0.4423 0.1258 0.7839 9.4011
II Sources of Revenue
A Own Revenue
i. Own tax 0.9390 1.0097 1.1106 1.2217 0.0383 0.0412 0.0453 0.0498
ii. Own non-tax 1.6175 1.7392 1.9131 2.1044 0.0541 0.0582 0.0640 0.0704
B Transfers from Central Government #
i SJSRY 0.2241 0.0515 0.4578 0.5650 0.1123 0.0200 0.4646 0.7000
ii NSDP
iii IDSMT 0.7300 0.2400
iv UIDSSMT 6.6158
v IHSDP
vi 10% Pool fund 0.6920 1.3653
vii. NOAP
viii. MP
ix. FDR
C. Transfers from TFC/EFC 0.1500 0.1753 0.0600 0.0758 0.0157
D. Assigned + Devolution 0.1000 0.1000 0.1000 0.0300 0.0300 0.1436
E. Grant-in-Aid from State Government 0.2400 0.6700 0.1600 0.7200
F. Others (specify)
# : Provide information on each of the CSS from which money is received in the space provided below. Insert additional rows if there are many CSS.
TFC:Twelfth Finance Commission, EFC:Eleventh Finance Commission
Separate format to be filled for each district.
Schedule - 4D
Expenditure and Sources of Revenue of ULBs - District-wise CACHAR
Expenditure and source of Revenue of Urban Local Bodies (Information to be provided District-wise)
Municipality Town Panchayats
(aggregate information of all Municipalities in a district to be provided ) (aggregate information of all town panchayats in a district to be provided )
No. of Town panchayats:
Total area of Municipalities: Total area of Townpanchayats:
Total population of Town panchayats:
Year Year Year
(detail information on each of the CSS to be given
below)
Municipal Corporation
Total population of Municipalities:
No. of Municipalities:
124 S4-D