Embed Size (px)
Citation preview

D E V E L O P I N G I N D E P E N D E N C E F R O M I M P O R T E D W A T E R
C H I N O B A S I N WA T E R M A S T E R
THIRTY- FOURTH ANNUAL REPORTFISCAL YEAR 2010-11

1
CHINO BASIN WATERMASTER
A MESSAGE FROM CHINO BASIN WATERMASTEREnd of Statewide Drought. The 2010-2011 fiscal year brought many changes to Chino Basin Watermaster and its partners. Rainfall data showed that 2007-2009 was the twelfth driest three-year period in the state’s history. The next year had improved rainfall, though it was still below average. This fiscal year, California experienced the second wettest year on record, filling the State’s surface reservoirs and allowing the Governor to officially proclaim an end to California’s drought.
Replenishment Water Available for First Time Since 2007—Watermaster is First to Place an Order. As a result of the State’s plentiful water supply, Metropolitan Water District of Southern California made imported water available at the replenishment rate for the first time since 2007. Watermaster took full advantage of the water that was available for purchase.
Personnel Changes, but Spirit of Collaboration Continues. There were many key changes in the fiscal year. Notably, Watermaster CEO, Kenneth Manning, left in March 2011. There were also leadership changes at Basin partner agencies, such as the Inland Empire Utilities Agency’s appointment of Tom Love as General Manager. Change can bring opportunity and Watermaster stakeholders continue to carry on the tradition of collaboration within the Basin.
Focus on Cost-Effectiveness and Working Together. With the economic downturn continuing, a drop in growth, and with water use trends on the decline, the amount of new water supplies needed in the future may be less than previously thought. As a result, Watermaster and its partners are evaluating how to best implement the 2010 Recharge Master Plan Update and other programs to most cost-effectively meet water supply and water quality goals.
As always, Watermaster is utilizing the best scientific and technology tools, forward thinking, and collaborative decision-making to steer its way into the future on behalf of all water users in the region.
Chino Basin Watermaster Board of Directors and Staff
ADAPTING TO CHANGE THROUGH COLLABORATION
P A R T N E R S I N B A S I N M A N A G E M E N T

2
FROM CONFLICT TO PEACE AND BEYONDOver many years, Watermaster has developed an effective, consensus-based governance structure that has allowed stakeholders to actively participate in decision-making through participation in various committees, pools and the Board of Directors.
Early 1970s and Before: Conflict Over Water Supplies Basin stakeholders had endured decades of conflict over water supplies, but this began to change in 1974 when they signed a Memorandum of Agreement. Within a year, the state authorized a $2 assessment per acre-foot of water to help support this effort by funding development of a Chino Groundwater Plan.
1978: Watermaster Provides a Permanent ForumBy 1978 a permanent structure was created by the San Bernardino Superior Court when it formed Watermaster. In subsequent years, Watermaster developed a governance structure, technical understanding and funding to manage the Basin.
Late 1990s: Optimum Basin Management Program, a Major Technical AdvanceIn the late 1990s, Watermaster developed a detailed program consisting of hundreds of specific actions designed to resolve Basin water supply and quality challenges. This program, required by the Court, is being systematically implemented and continually refined.
2000 and 2007: Peace Agreements Represent a Major Institutional AdvanceFollowing years of negotiation, Basin stakeholders and the Court approved the Peace (I) Agreement in 2000, formalizing and making permanent the Watermaster governance structure. In 2007, a more profound level of collaboration became possible through signing of the Peace II Agreement that provides hundreds of millions of dollars in cost-savings and other benefits through basin reoperation.
WATERMASTER’S HISTORY OF PROBLEM SOLVING
199019801970
Early 1970s and Before: Conflict Over Water Supplies
1974 and 1975: First Region-
Wide Agreement
1978: Watermaster Provides a Permanent Forum

3
CHINO BASIN WATERMASTER
2008-2010: Recharge Master Plan Update DevelopmentThe most important single initiative of the past two years was the 2010 Recharge Master Plan Update. Work on the Plan was initiated at the 2008 Strategic Planning Conference. During the rest of the year and through 2009 the Recharge Master Plan Update was developed and finalized. Implementation of the Recharge Master Plan Update will begin during the 2012-2013 fiscal year.
2010 and Beyond: Increasing Capabilities and Successfully Managing Water Supply and QualityWatermaster will continue to work in many arenas to increase water management capabilities and successes with more technical sophistication, better cost effectiveness and continually improved results. The lower than expected water demand provides opportunity to further update the Recharge Master Plan and implement it in a cost-effective manner to meet needs.
What distinguishes progress in 2010-2011, and in recent years, are achievements that build on each other to make it possible to monitor, protect, and expand our water supply and quality in ways that simply could not be achieved in the past.
• Improved working relationships and governance tools through Watermaster that allow stakeholders to work together and resolve complex challenges in a sustained way.
• Regional partnerships that make it possible to plan and implement large, cost-effective projects involving multiple parties, and that utilize multiple sources: recycled water, stormwater, imported water and groundwater.
• Extensive physical facilities: desalters, recharge basins, pipelines and channels that allow Watermaster to collect, spread and move water.
• Unique regulatory and management tools: such as hydraulic control and maximum benefit that will provide up to 140,000 acre-feet of new water and a massive avoidance of wastewater treatment costs.
WATERMASTER’S HISTORY OF PROBLEM SOLVING
3
202020102000
2000: Peace (I) Agreement
2008-2010: Recharge Master Plan Update
2007: Peace II Agreement
2010 and Beyond: Increasing Capabilities and Successfully Managing Water Supply and Quality
Late 1990s: Optimum Basin Management Program, a Major Technical Advance

4
Watermaster carries out extensive monitoring programs that help manage the Basin water supply and water quality with improved cost-effectiveness and sustainability. It is a big job, with hundreds of wells being monitored across 220 square miles.
GROUNDWATER LEVEL MONITORING FROM APPROXIMATELY 900 WELLS The current groundwater level monitoring program is comprised of approximately 900 wells. Most are measured by well owners and collected via the Chino Basin Data Collection (CBDC) program. The remaining 200 wells are primarily in the southern Chino Basin where water levels are measured manually once per month or with a pressure transducer every 15 minutes. Groundwater level monitoring helps manage hydraulic control, land subsidence, desalter impacts on private wells, and more.
EXTENSIVE GROUNDWATER QUALITY MONITORING PROGRAM FROM APPROXIMATELY 750 WELLS1. Annual key well water quality monitoring program consisting of approximately 120 wells,
targeting primarily privately-owned agricultural wells in the southern portion of Chino Basin. About 60 wells are sampled each year.
2. Annual desalter water quality sampling at nine monitoring well clusters strategically placed between the Chino Basin desalter well fields and the Santa Ana River to analyze the effect of desalter pumping.
3. Chino Basin Data Collection program, in which stakeholders supply groundwater quality data to Watermaster from about 670 wells.
OTHER MONITORING ACTIVITIESGroundwater-Production Monitoring from Approximately 750 Active Production Wells. Appropriative Pool and Non-Agricultural Pool Parties report well production data quarterly. All active Agricultural Pool wells, except for minimum user wells, are now metered and read quarterly by Watermaster staff.
Alcoa Monitoring Wells Transferred to Watermaster. The transfer of three Alcoa monitoring wells to Watermaster was finalized to preserve the wells for the regional groundwater monitoring program.
Surface Water Monitoring for Recharge. Watermaster measures the quantity of storm and supplemental water entering the recharge basins. Pressure transducers are used to measure water levels during recharge. Imported water quality data are also obtained. These data are used in the accounting of diluent water for the Chino Basin Recycled Water Groundwater Recharge Program.
Bi-Weekly Surface Water Monitoring. To assess hydraulic control, Watermaster measures the discharge of the River and water quality parameters to determine where the River is gaining flow from the Basin and/or losing flow into the Basin. Water quality measurements, including monthly sampling at four near-river wells, are combined with discharge data from permanent USGS stream gauges and watermaster treatment plant data.
COMPREHENSIVE MONITORING SUPPORTS EFFECTIVE MANAGEMENT
Near record rainfall in 2011 filled Southern California storage reservoirs.
The current groundwater level monitoring program is comprised of approximately 900 wells. Most are measured by well owners and collected via the Chino Basin Data Collection (CBDC) program. The remaining 200 wells are primarily in the southern Chino
transducer everylevel monitoring helps manage hydraulic control, land subsidence, desalter impacts on private wells, and more.
Appropriative Pool and Non-Agricultural Pool Parties report well production data quarterly. All active Agricultural Pool wells, except for minimum user wells, are now metered and read quarterly by Watermaster staff.
The transfer of three Alcoa monitoring wells to Watermaster was finalized to preserve the wells for the regional groundwater monitoring program.
Watermaster measures the quantity of storm and supplemental water entering the recharge basins. Pressure transducers are used to measure water levels during recharge. Imported water quality data are also obtained. These data are used in the accounting of diluent
To assess hydraulic control, Watermaster measures the discharge of the River and water quality parameters to determine where the River is gaining flow from the Basin and/or losing flow into the Basin. Water quality measurements, including monthly sampling at four near-river wells, are combined with discharge data from permanent USGS
The current groundwater level monitoring program is comprised of approximately 900 wells. Most are measured by well owners and collected via the Chino Basin Data Collection (CBDC) program. The remaining 200 wells are primarily in the southern Chino
transducer every 15 minutes. Groundwater level monitoring helps manage hydraulic control, land subsidence, desalter impacts on private wells, and more.
Appropriative
Pool wells, except for minimum user wells, are now metered and read quarterly by Watermaster staff.
The transfer of three Alcoa monitoring wells to
Watermaster measures the quantity of storm and supplemental
recharge. Imported water quality data are also obtained. These data are used in the accounting of diluent
To assess hydraulic control, Watermaster measures the discharge of the River and water quality parameters to determine where the River is gaining flow from the Basin and/or losing flow into the Basin. Water quality measurements, including monthly sampling at four near-river wells, are combined with discharge data from permanent USGS
Bedrock
4
2010
2011
FullEmpty

5
CHINO BASIN WATERMASTER
Chino Groundwater Basin: Two Trillion Gallons, 750 Production Wells, One Million Residents
High-Quality Groundwater
Stormwater
RechargeTreatment
Unsaturated Zone (unused storage)
Storage
Well
Desalter
Santa Ana River
Wastewater/Recycled Water Treatment Plant
Imported Surface Water
Nonpotable GroundwaterTreated in Desalters
5
Data from 1,000 Wells in a Single Database
All the data from about 1,000 monitoring and production wells across the Basin are
checked by staff and uploaded to a centralized relational database with a map-based
interface. This improves Watermaster’s ability to provide overall management of water
supply and quality.
Making the Massive Monitoring Program More Cost Effective
Watermaster petitioned the Regional Water Quality Control Board to make
the monitoring program more cost-effective by targeting monitoring more
accurately to just where it is needed, eliminating unneeded monitoring
in some areas and increasing monitoring in other areas. The end
result will be cost-savings and better data collection while meeting Basin
management requirements.

6
A collaborative agreement is saving $4.5 million on construction of the Turner Exchange Basin.
COLLABORTIVE RECHARGE: KEY TO SOLVING LONG-TERM WATER SUPPLY CHALLENGES
6
The recharge program is a comprehensive, ongoing water supply program to enhance water supply reliability and improve the groundwater quality in drinking water wells throughout the Chino Basin by increasing groundwater recharge of stormwater, imported water and recycled water.
2010-2011: A YEAR OF RECORDSDrought Ends with California’s Second Wettest Year on Record, filling the State’s surface reservoirs and allowing the Governor to officially proclaim an end to California’s drought.
Record Rainfall Capture. The total rainfall captured in December alone was over 7,200 acre-feet. The December 2010 storms brought enough rain to fill all of the recharge basins overlying the Chino Basin. This was a record month for rainfall, as well as for water captured and recharged.
First Imported Replenishment Water Available Since 2007. Watermaster moved quickly to purchase as much imported replenishment water as it could.
Second Highest Stormwater Recharge in History. Approximately 17,000 acre-feet of stormwater were recharged during the fiscal year, the second-highest year on record.
Recycled Water Recharge. Approximately 8,000 acre-feet of recycled water were recharged during the fiscal year, the highest recorded, despite large amounts of stormwater and imported water recharge competing for space.
RECHARGE MASTER PLAN BACKGROUNDThe Chino Basin Groundwater Recharge Program is jointly sponsored by Chino Basin Watermaster, Inland Empire Utilities Agency (IEUA), Chino Basin Water Conservation District, and the San Bernardino County Flood Control District.
The recharge program has multiple sources of water—imported, recycled and storm—and is managed by Watermaster. In addition, Watermaster holds the water right permits to divert, percolate and store stormwater. Operation of the facilities is handled by IEUA, which defers to County Flood Control during storm periods. Watermaster and IEUA have a joint recharge permit from the Regional Water Quality Control Board for the recharge of imported, storm and recycled water.
Watermaster is Working with IEUA, Ontario and SANBAG to Save $4.5 Million
Watermaster and IEUA are working together to develop two new retention facilities at the Turner Basin. The City of Ontario and San Bernardino Associated Governments (SANBAG) agreed to spend $4.5 million to dig out 175,000 cubic yards of soil to form a new water retention basin. In exchange they are keeping the soil for a railroad crossing project.
There is also discussion of enlarging the 5th retention basin east of Archibald. The project, which is being managed by IEUA with the support of Watermaster parties, is promising to increase groundwater recharge by several hundred acre-feet per year.
6
7
CHINO BASIN WATERMASTERCOLLABORTIVE RECHARGE: KEY TO SOLVING LONG-TERM WATER SUPPLY CHALLENGES
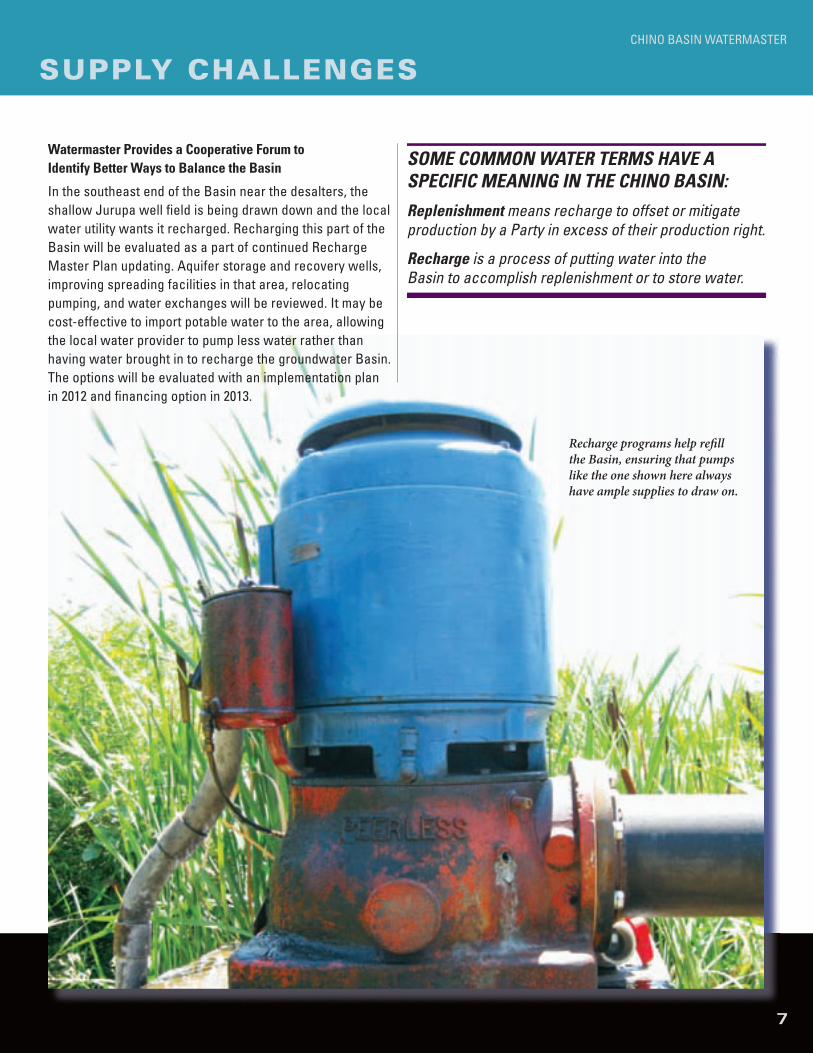
SOME COMMON WATER TERMS HAVE A SPECIFIC MEANING IN THE CHINO BASIN:
Replenishment means recharge to offset or mitigate production by a Party in excess of their production right.
Recharge is a process of putting water into the Basin to accomplish replenishment or to store water.
Recharge programs help refill the Basin, ensuring that pumps like the one shown here always have ample supplies to draw on.
Watermaster Provides a Cooperative Forum to Identify Better Ways to Balance the Basin
In the southeast end of the Basin near the desalters, the shallow Jurupa well field is being drawn down and the local water utility wants it recharged. Recharging this part of the Basin will be evaluated as a part of continued Recharge Master Plan updating. Aquifer storage and recovery wells, improving spreading facilities in that area, relocating pumping, and water exchanges will be reviewed. It may be cost-effective to import potable water to the area, allowing the local water provider to pump less water rather than having water brought in to recharge the groundwater Basin. The options will be evaluated with an implementation plan in 2012 and financing option in 2013.
8
MILESTONES ACHIEVED IN PROGRESS TOWARD WATER INDEPENDENCE
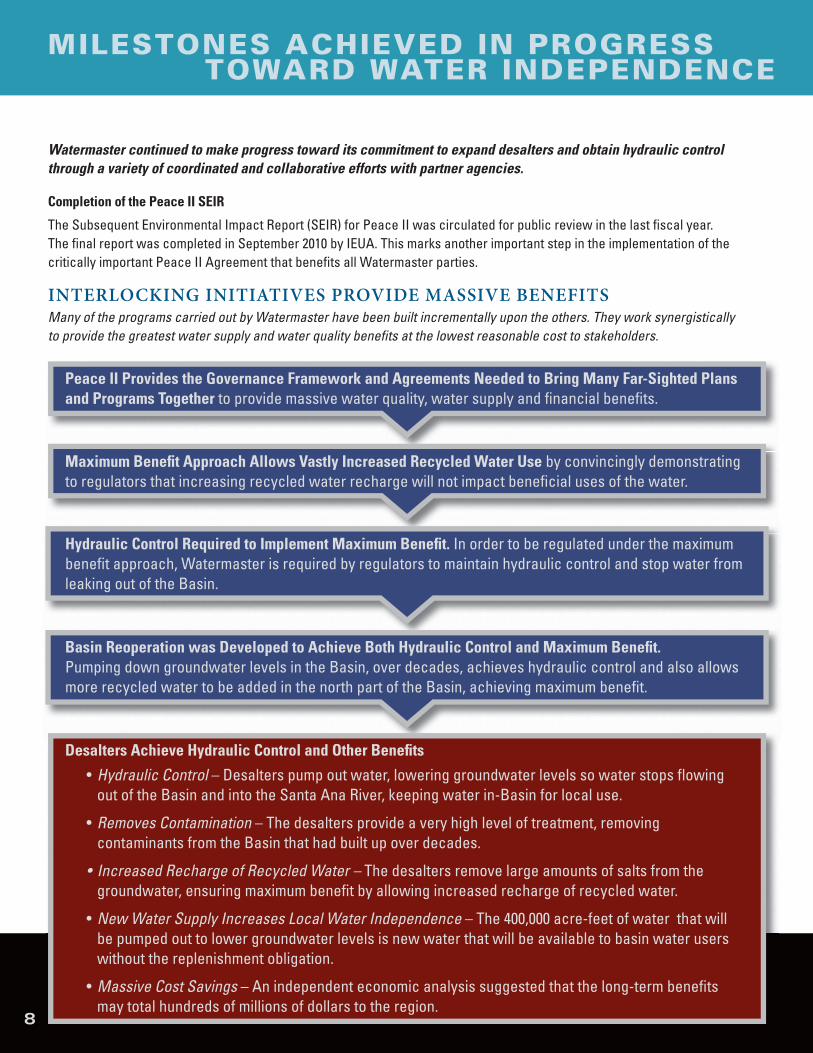
Watermaster continued to make progress toward its commitment to expand desalters and obtain hydraulic control through a variety of coordinated and collaborative efforts with partner agencies.
Completion of the Peace II SEIR
The Subsequent Environmental Impact Report (SEIR) for Peace II was circulated for public review in the last fiscal year. The final report was completed in September 2010 by IEUA. This marks another important step in the implementation of the critically important Peace II Agreement that benefits all Watermaster parties.
INTERLOCKING INITIATIVES PROVIDE MASSIVE BENEFITSMany of the programs carried out by Watermaster have been built incrementally upon the others. They work synergistically to provide the greatest water supply and water quality benefits at the lowest reasonable cost to stakeholders.
Peace II Provides the Governance Framework and Agreements Needed to Bring Many Far-Sighted Plans and Programs Together to provide massive water quality, water supply and financial benefits.
Maximum Benefit Approach Allows Vastly Increased Recycled Water Use by convincingly demonstrating to regulators that increasing recycled water recharge will not impact beneficial uses of the water.
Hydraulic Control Required to Implement Maximum Benefit. In order to be regulated under the maximum benefit approach, Watermaster is required by regulators to maintain hydraulic control and stop water from leaking out of the Basin.
Basin Reoperation was Developed to Achieve Both Hydraulic Control and Maximum Benefit. Pumping down groundwater levels in the Basin, over decades, achieves hydraulic control and also allows more recycled water to be added in the north part of the Basin, achieving maximum benefit.
Desalters Achieve Hydraulic Control and Other Benefits
•Hydraulic Control – Desalters pump out water, lowering groundwater levels so water stops flowing out of the Basin and into the Santa Ana River, keeping water in-Basin for local use.
•Removes Contamination – The desalters provide a very high level of treatment, removing contaminants from the Basin that had built up over decades.
• IncreasedRechargeofRecycledWater– The desalters remove large amounts of salts from the groundwater, ensuring maximum benefit by allowing increased recharge of recycled water.
•New Water Supply Increases Local Water Independence – The 400,000 acre-feet of water that will be pumped out to lower groundwater levels is new water that will be available to basin water users without the replenishment obligation.
•Massive Cost Savings – An independent economic analysis suggested that the long-term benefits may total hundreds of millions of dollars to the region.

9
CHINO BASIN WATERMASTER
FINAL ACTIONS AND FUNDING APPROVED TO OBTAIN HYDRAULIC CONTROLThe southwest portion of the Basin is the only remaining area where desalter wells are not pumping enough groundwater to achieve hydraulic control. A number of steps were taken or approved that will allow Watermaster and its partners to achieve full hydraulic control.
Planning has continued between the Chino Desalter Authority (CDA) and Western Municipal Water District (WMWD) to expand the Chino desalters by 11,800 acre-feet per year (10.5 MGD). The program will improve hydraulic control and provide new water supplies. At least six wells are being constructed with three already begun. Completion of these wells will satisfy commitments of the Basin Plan, and the Peace II Agreement to achieve hydraulic control.
Local Resources Program Grant to Expand Desalter II Facilities. On June 14, 2011, the Metropolitan Water District of Southern California (MWD) Board approved a Local Resources Program (LRP) grant for the desalters. This local subsidy will make it possible to complete the final build-out of the desalters, including the Chino Creek Well Field, to achieve hydraulic control.
Facilitated Development and Regulatory Approval of Implementation Schedule and Well Locations. Watermaster worked with the involved parties to develop a realistic implementation schedule that was approved by the Regional Water Quality Control Board in June 2010. Raw water will be drawn from existing CDA II wells, along with possible additional new wells, if needed. In addition, a new Chino Creek Well Field (CCWF), required for the hydraulic control
commitment associated with maximum benefit, will provide additional raw water to the Chino I Desalter, enabling some existing wells to direct production to the expanded Chino II Desalter facility. The well field locations were approved by Watermaster.
Actions to Minimize Subsidence. Watermaster must ensure that pumping at the Chino Creek Well Field does not cause land subsidence. To accomplish this, Watermaster conducted a subsidence study, is requiring that wells be located in the shallow aquifer, and is expanding its subsidence monitoring program in this area. These steps were approved in the 2010-2011 fiscal year.
View of a desalter well being drilled.
MILESTONES ACHIEVED IN PROGRESS TOWARD WATER INDEPENDENCE
PEACE II IS RESULTING IN IMPROVED FLEXIBILITY IN MANAGING THE BASIN’S WATER SUPPLY, AND HUNDREDS OF MILLIONS OF DOLLARS IN LONG-TERM COST SAVINGS.
COMPLETING THE CHINO CREEK WELL FIELD IS THE FINAL MAJOR STEP NEEDED TO ACHIEVE HYDRAULIC CONTROL. THIS IS A MAJOR MILESTONE THAT WILL SATISFY COMMITMENTS OF THE BASIN PLAN AND THE PEACE II AGREEMENTS.

COLLABORATIVE PROGRAMS PROVIDE FOR A RELIABLE, COST EFFECTIVE WATER SUPPLY
THE CUMULATIVE UNMET REPLENISHMENT OBLIGATION IS FULLY SATISFIEDIn years when Watermaster cannot purchase replenishment water, an unmet replenishment obligation is created by pumpers that take more than their water rights. The sum of these obligations becomes the Cumulative Unmet Replenishment Obligation (CURO). In recent years, when no imported replenishment water was available, a concern developed that the replenishment obligation could get too large to achieve—leading to a perpetual overdraft of the Basin. As a result, Watermaster began working with stakeholders to resolve the policy, water supply and financial issues of the CURO.
The CURO was fully satisfied in May 2011 by purchasing water from Appropriators. In the next fiscal year Watermaster will be re-evaluating its recharge needs based on the recently updated Urban Water Management Plans (UWMPs) from the Appropriators.
DECISIVE ACTION TO PURCHASE PREEMPTIVE REPLENISHMENT WATER Replenishment Water Became Available for the First Time Since 2007. As a result of the State’s abundant water supply this fiscal year, the MWD was able to make 225,000 acre-feet of water available at the replenishment rate to groundwater agencies, for the first time in four years. Watermaster set a goal to recharge 50,000 acre-feet of this water to meet future replenishment needs and was the first agency, via IEUA, to place an order. As of June 30, over 8,000 acre-feet of imported water have been
recharged. More is expected to be recharged through December 2011 until the 225,000 acre-feet supply is depleted. The first 26,000 acre-feet of replenishment water recharged will be placed into storage accounts for Fontana Water Company (20,000 acre-feet) and Niagara Bottling LLC (6,000 acre-feet) as preemptive replenishment. The concept of preemptive replenishment, which will offset future overproduction, has been contemplated during the last few years, but this is the first application of it.
Long-Term Replenishment Needs Being Evaluated. Because of factors such as successful conservation efforts, and slower growth than expected due to the economy, long-term replenishment demands are lower than previously estimated. Watermaster is currently in the process of reevaluating long-term water demands and how to most cost-effectively meet them.
10
WATERMASTER’S APPROACH IS TO UTILIZE TECHNICAL AND MANAGEMENT TECHNIQUES THAT ARE GUIDED BY RESEARCH, FACTUAL KNOWLEDGE, FORWARD THINKING, AND COLLABORATIVE GOVERNANCE.
Watermaster staff in the field.

11
CHINO BASIN WATERMASTERCOLLABORATIVE PROGRAMS PROVIDE FOR A RELIABLE, COST EFFECTIVE WATER SUPPLY
OTHER IMPORTANT ACTIONS IN 2010-2011Legal: Judgment Restated. Watermaster is preparing a restated Judgment at the request of the Court. The reason is that portions of the Judgment have been superseded by amendments. This leads to confusion, since there is no way to know what the governing language is without going through the various documents. The plan is to add footnotes to the Judgment that references portions that have been superseded. Ultimately, perhaps, the Judgment, Rules and Regulations, Peace (I) Agreement, and Peace II Agreement will be cross-referenced with one-another.
Participate in Watershed Action Plan. Watermaster is participating in the Watershed Action Plan (WAP). The WAP group is working on the new MS-4 stormwater permit implementation for San Bernardino County. One of the watershed principles is the retention of stormwater and infiltration on-site and the potential participation in a regional solution to improve water supply and quality.
Digitizing Old Documents for Cost-Efficiency and Reliability. In the 2010-2011 fiscal year, Watermaster began a program to scan all of the old hard copy documents that date back to the 1970s, and even earlier. These are irreplaceable documents that are being archived for long-term safe keeping. Because they are referred to frequently, they are scanned into the file management system as text for easy search-ability. This effort will continue over several years until completed.
ALL WATER EXTRACTED FROM DRY YEAR YIELD PROGRAM The Dry Year Yield Program (DDY) provided the MWD the right to store groundwater in the Basin as a hedge against drought, in exchange for paying the costs of developing the facilities that deliver the stored water. In spring 2010, the MWD made the final call on the remaining stored water, and as of spring 2011, all of the water in the Dry-Year Yield storage account was extracted, leaving the account with a zero balance. Discussions with the MWD are underway regarding changes to the program in the future.
11
Watermaster is scanning, digitizing and archiving old documents.

12
PROGRESS ON WATER QUALITY AND SUBSIDENCE MANAGEMENT
Watermaster’s role in water quality is to provide detailed monitoring data, review plans and cleanup options, support the Regional Water Quality Control Board, and help bring stakeholders together to develop solutions.
CLEANUP PROGRESS ON CONTAMINATION PLUMESFinding Common Ground for the Archibald South Plume. Watermaster monitored the collaborative progress made by involved parties associated with the Archibald South Plume, including parties that had been located at Ontario International Airport and the City of Ontario. The parties continue to refine the delineation of the plume with an eye towards near-term future remediation.
Establishing Long-Term Monitoring for the California Institute for Men Site. Watermaster continued to coordinate with the State on a Memorandum of Understanding that would allow Watermaster to continue to use monitoring wells at this former plume that has been remediated.
Chino Airport. Watermaster has been working with the San Bernardino County Department of Airports on a joint remedy, desalting and plume mitigation. Watermaster presented groundwater model results, as well as a letter report of modeling results of the Peace II alternative with updated well locations for the Chino Creek Well Field, along with pumping rates for all Chino desalter wells. When completed and in operation, these wells will achieve hydraulic control and will not conflict with the Optimum Basin Management Plan (OBMP) goal to minimize or abate permanent subsidence.
Sought Cost Savings in Monitoring Wells. Watermaster pursued an alternative well location for one of the County’s monitoring wells at Chino Airport with the goal of lowering costs to Watermaster while meeting County needs.
Flatiron Plume. There are three main plumes under remediation, but progress had halted because of problems
getting a permit to discharge the treated water. Watermaster helped facilitate a solution that involves
injecting the highly treated water into the ground for later use. Final regulatory approval has not been obtained, but Watermaster is hopeful this will provide
a win/win, cost-saving, water supply solution for all involved parties.
12
Watermaster gathers extensive groundwater quality data and uses it to support groundwater cleanup programs.
13
CHINO BASIN WATERMASTERPROGRESS ON WATER QUALITY AND SUBSIDENCE MANAGEMENT
13
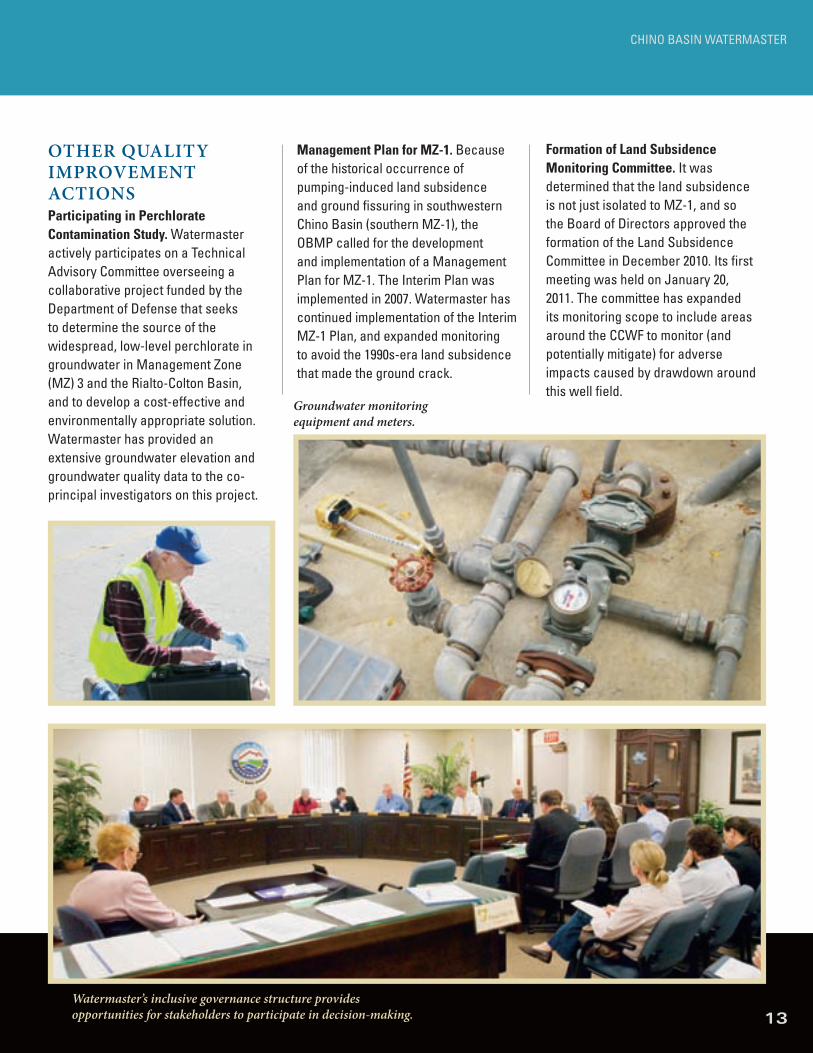
OTHER QUALITY IMPROVEMENT ACTIONSParticipating in Perchlorate Contamination Study. Watermaster actively participates on a Technical Advisory Committee overseeing a collaborative project funded by the Department of Defense that seeks to determine the source of the widespread, low-level perchlorate in groundwater in Management Zone (MZ) 3 and the Rialto-Colton Basin, and to develop a cost-effective and environmentally appropriate solution. Watermaster has provided an extensive groundwater elevation and groundwater quality data to the co-principal investigators on this project.
Management Plan for MZ-1. Because of the historical occurrence of pumping-induced land subsidence and ground fissuring in southwestern Chino Basin (southern MZ-1), the OBMP called for the development and implementation of a Management Plan for MZ-1. The Interim Plan was implemented in 2007. Watermaster has continued implementation of the Interim MZ-1 Plan, and expanded monitoring to avoid the 1990s-era land subsidence that made the ground crack.
Formation of Land Subsidence Monitoring Committee. It was determined that the land subsidence is not just isolated to MZ-1, and so the Board of Directors approved the formation of the Land Subsidence Committee in December 2010. Its first meeting was held on January 20, 2011. The committee has expanded its monitoring scope to include areas around the CCWF to monitor (and potentially mitigate) for adverse impacts caused by drawdown around this well field.
Groundwater monitoring equipment and meters.
Watermaster’s inclusive governance structure provides opportunities for stakeholders to participate in decision-making.

14
WATERMASTER GOVERNANCE AND MEMBERSHIP – CALENDAR YEAR 2011Watermaster Board
Agricultural Pool RepresentativesMEMBER REPRESENTINGPaul Hofer CropsAlternates: Bob Feenstra/Jeff Pierson
Geoffrey Vanden Heuvel DairyAlternates: Jeff Pierson/Bob Feenstra
Non-Agricultural Pool RepresentativesREPRESENTATIVE MEMBER ENTITYBob Bowcock Vulcan Materials Company (Calmat Division)Alternate: Ken Jeske California Steel Industries (CSI)
Appropriative Pool RepresentativesREPRESENTATIVE MEMBER ENTITYTom Haughey, Secretary/Treasurer Chino, City ofAlternate: Earl Elrod
Paula Lantz Pomona, City ofAlternate: Danielle Soto
Ken Willis, Chair West End Consolidated Water Company Alternates: Tom Thomas
Municipal Water District RepresentativesREPRESENTATIVE MEMBER ENTITYSteve Elie Inland Empire Utilities AgencyAlternate: Terry Catlin
Bob Kuhn, Vice-Chair Three Valleys Municipal Water District Alternate: David DeJesus
Charles Field Western Municipal Water DistrictAlternate: John Rossi
Advisory CommitteeAgricultural Pool Representatives
REGULAR MEMBERS REPRESENTING Nathan deBoom Dairy Glen Durrington Crops Robert Feenstra Dairy Pete Hall State Michael Hughes State Gene Koopman Dairy Jennifer Novak State Jeff Pierson, Vice-Chair Crops Rob Vanden Heuvel Dairy
Non-Agricultural Pool RepresentativesREPRESENTATIVE MEMBER ENTITYBrian Geye Auto Club Speedway Alternate: Bob Bowcock Vulcan Materials Company (Calmat Division) Ken Jeske, Chair California Steel Industries (CSI) Alternate: Dennis Poulsen Scott Burton Ontario City Non-Ag) Alternate: Tom O’Neill
Appropriative Pool RepresentativesJohn Mura Chino Hills, City of Alternate: Ron Craig Dave Crosley Chino, City of Marty Zvirbulis Cucamonga Valley Water District Josh Swift Fontana Union Water Company Robert Young, 2nd Vice-Chair Fontana Water Company Tom Harder Jurupa Community Services District Alternate: Robert Tock Mark Kinsey Monte Vista Water District Mohamed El-Amamy Ontario, City of Raul Garibay Pomona, City of Charles Moorrees San Antonio Water Company (Minor Rep) J. Arnold Rodriguez Santa Ana River Water Company (Minor Rep) Anthony La** Upland, City of Shaun Stone** Rosemary Hoerning**
Municipal Water DistrictsTom Love Inland Empire Utilities Agency Rick Hansen Three Valleys Municipal Water District John Rossi Western Municipal Water District
Kenneth R. Manning, (Jan.-Feb.) Chief Executive Officer
Desi Alvarez, PE, (May-Dec.) Chief Executive Officer
Danielle Maurizio, PE, Senior Engineer
Ben Pak, (Jan.-July) Senior Project Engineer
Gerald Greene, Denv, PE, QEP, (Aug.-Dec.) Senior Environmental Engineer
Joseph Joswiak, MBA, Chief Financial Officer
Jim Theirl, Water Resource Engineer
Frank Yoo, GIS Specialist
Justin Nakano, Environmental Specialist
Sherri Molino, Executive Assistant
Janine Wilson, Accountant
Alexandra Perez, Office Specialist
Maricha Ramirez, (Jan.-Feb.) Office Assistant
Staff
** Served Partial Year

15
Agricultural Pool CommitteeREGULAR MEMBERS REPRESENTINGJulie Cavender State of California-CIMNathan deBoom Dairy Glen Durrington CropsRobert Feenstra, Chair DairyPete Hall State of California-CIMJohn Huitsing DairyGene Koopman DairyRobert Nobles State of California-CIWJennifer Novak State of California-CIMJeff Pierson, Vice-Chair CropsRob Vanden Heuvel Dairy
ALTERNATES REPRESENTING
Peter Hettinga DairyMichael Hughes State of CaliforniaDan Hostetler CropsBrian Pahel State of CaliforniaSyp Vander Dussen Dairy
Non-Agricultural Pool CommitteeREPRESENTATIVE MEMBER ENTITYMark Ward Ameron Inc. — Angelica Textile ServiceDavid Penrice Aqua Capital Management LPBrian Geye Auto Club Speedway Ken Jeske, Vice-Chair California Steel Industries (CSI)Alternate: Dennis Poulsen — CCG Ontario, LLC (Catellus)Lisa Hamilton General Electric CompanyBob Lawhn Genon Electric — Kaiser Ventures Inc.Gerald Yahr KCO LLC / The Koll Company — Loving Savior of the HillsDavid Starnes Mobile Community ManagementAlternate: Michael Alder (Swan Lake Mobile Home Park)Scott Burton Ontario City Non-AgAlternate: Tom O’Neill Curtis Stubbings Praxair Inc.Alternate: Roger Han Steve Riboli San Antonio WineryJames Jenkins San Bernardino County Department of Airports Jorge Rosa, Jr. Southern California EdisonMichael Thies Space Center Mira Loma Inc.Alternate: Tom CruikshankTed Leaman Sunkist Growers Inc.Alternate: John AyersBob Bowcock, Chair Vulcan Materials CompanyAlternate: Kevin Sage (Calmat Division) — West Venture Development
Appropriative Pool CommitteeREPRESENTATIVE MEMBER ENTITYPatrick Bauer Arrowhead Mountain Spring Water* Dave Crosley Chino, City ofJohn Mura, Chair Chino Hills, City ofAlternate: Ron CraigMarty Zvirbulis, Vice-Chair Cucamonga Valley Water District Chuck Hays Fontana, City of Josh Swift Fontana Union Water CompanyRobert Young Fontana Water Company Ben Lewis Golden State Water Company* Eldon Horst Jurupa Community Services District Alternate: Robert Tock Justin Brokaw Marygold Mutual Water Company* Mark Kinsey Monte Vista Irrigation Company*Mark Kinsey Monte Vista Water DistrictAlternate: Justin Scott-CoeGeoff Kamansky Niagara Bottling LLC*Robert Young Nicholson Trust*Bill Thompson Norco, City of* Mohamed El-Amamy Ontario, City ofRaul Garibay Pomona, City of Charles Moorrees San Antonio Water Company*Alternate: Teri LaytonPhil Krause San Bernardino, County of (Prado Shooting Park)*J. Arnold Rodriguez Santa Ana River Water Company*Anthony La** Upland, City of Shaun Stone** Rosemary Hoerning** Anthony La** West End Consolidated Water Co.* Shaun Stone** Rosemary Hoerning** A.W. “Butch” Araiza West Valley Water District*
* Minor Producer
** Served Partial Year
Watermaster Represents All Key Stakeholder GroupsTo draw together in a single organization all the diverse interests in the Basin, a governing structure was formed that represents all stakeholder groups, including a Board, Advisory Committee and three Producer Pools:
• AgriculturalPooltorepresentdairymen,farmers, the State, and other property owners.
• Non-AgriculturalPooltorepresentcommercialandindustrial producers.
• AppropriativePooltorepresentcities,waterdistricts,and water companies.
CHINO BASIN WATERMASTER

LEFT
INTENTIONALLY
BLANK

Appendices
A - AA

Appendix A
COURT HEARINGS AND ORDERS FISCAL YEAR 2010-2011
During the fiscal year 2010-11, several hearings were held relating to implementation of the Optimum Basin Management Program (OBMP). Hearings and orders were as follows:
Hearing Date Primary Subject Matter
February 3, 2011 Court of Appeal Order Regarding Paragraph 31 Appeal Briefing Schedule
January 26, 2011 Order Granting Motion to Re-Appoint Nine Member Watermaster Board for a Further Five-Year Term
January 21, 2011 Chino Basin Watermaster Court Hearing – Regarding Motion to Re-Appoint Nine Member Board for a Further Five-Year Term
December 6, 2010 Court of Appeal Order Setting Time and Attendance Requirements Regarding Settlement Conference
November 29, 2010 Court of Appeal Order Regarding Settlement Conference Program
October 11, 2010 Order Approving Watermaster Compliance with Condition Subsequent Number Eight and Approving Procedures to Be Used To Allocate Surplus Agricultural Pool Water in the Event of Decline in Safe Yield
October 8, 2010 Chino Basin Watermaster Court Hearing – Regarding Non-Agricultural Pool Pooling Plan and Recharge Master Plan Update
Order Approving Watermaster Compliance with Condition Subsequent Number Eight and Approving Procedures to Be Used To Allocate Surplus Agricultural Pool Water in the Event of Decline in Safe Yield
September 16, 2010 Court of Appeal Order Regarding Non-Agricultural Pool Paragraph 31 Motion Appeal

Appendix B
RESOLUTIONS CALENDAR YEAR 2011
Resolution Adopted Summary of Resolution
11-05 August 25, 2011
To Tax Defer Member Paid Contributions - For Employer Pick-Up The Chino Basin Watermaster will implement the provisions of section 414(h)(2)
Internal Revenue Code by making employee contributions pursuant to California Government Code section 20691 to the Public Employees’ Retirement System on behalf of its employees who are members of the Public Employees Retirement System. “Employee contributions” shall mean those contributions to the Public Employees’ Retirement System which are deducted from the salary of employees and are credited to individual employee’s accounts pursuant to California Government Code section 20691.
The contributions made by the Chino Basin Watermaster to the Public Employees’ Retirement System, although designated as employee contributions, are being paid by the Chino Basin Watermaster in lieu of contributions by the employees who are members of the Public Employees’ Retirement System.
Employees shall not have the option of choosing to receive the contributed amounts directly instead of having them paid by the Chino Basin Watermaster to the Public Employees’ Retirement System.
The Chino Basin Watermaster shall pay to the Public Employees’ Retirement System the contributions designated as employee contributions from the same source of funds as used in paying salary.
The amount of the contributions designated as employee contributions and paid by the Chino Basin Watermaster to the Public Employees’ Retirement System on behalf of an employee shall be the entire contribution required of the employee by the Public Employees’ Retirement Law (California Government Code sections 20000, et seq.).
The contributions designated as employee contributions made by Chino Basin Watermaster to the Public Employees’ Retirement System shall be treated for all purposes, other than taxation, in the same way that member contributions are treated by the Public Employees’ Retirement System.
Revised 11-02
May 26, 2011
Authorizing Investment of Monies in the Local Agency Investment Fund The Board of Directors does hereby authorize the deposit and withdrawal of Chino
Basin Watermaster monies in the Local Agency Investment Fund in the State Treasury in accordance with the provisions of Section 16429.3 of the Government Code for the purpose of investment as stated therein, and verification by the State Treasurer’s Office of all banking information provided in that record.
The following Chino Basin Watermaster officers and designated employees or their successors in office/position shall be authorized to order the deposit or withdrawal of monies in the Local Agency Investment Fund: Chairman of the Board, Vice-Chair, Board Secretary/Treasurer, Chief Executive Officer/Secretary, and Chief Financial Officer.
11-02 January 27, 2011
Authorizing Investment of Monies in the Local Agency Investment Fund The Board of Directors does hereby authorize the deposit and withdrawal of Chino
Basin Watermaster monies in the Local Agency Investment Fund in the State Treasury in accordance with the provisions of Section 16429.1 of the Government Code for the purpose of investment as stated therein, and verification by the State Treasurer’s Office of all banking information provided in that record.
The following Chino Basin Watermaster officers and designated employees or their successors in office/position shall be authorized to order the deposit or withdrawal of monies in the Local Agency Investment Fund: Chairman of the Board, Vice-Chair, Board Secretary/Treasurer, Chief Executive Officer/Secretary, and Chief Financial Officer.
11-01 January 27, 2011
Establishing a Watermaster Investment Policy The authority to invest and reinvest funds of Watermaster is hereby delegated to the
Watermaster Chief Executive Officer (and his/her designees) subject to the provisions of said Investment Policy and the ongoing review and control of Watermaster and the Watermaster Advisory Committee.
This resolution shall take effect from and after its date of adoption and Resolution 09-01 is rescinded in its entirety.
Appendix C
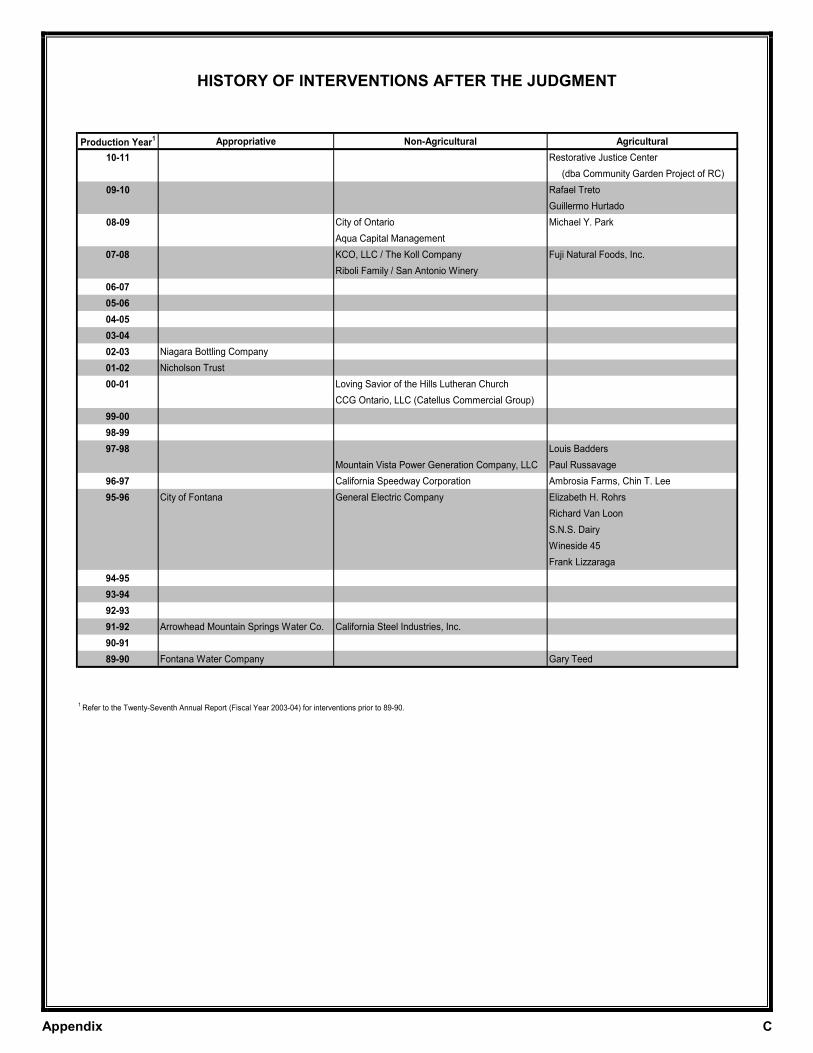
HISTORY OF INTERVENTIONS AFTER THE JUDGMENT
Production Year1 Appropriative Non-Agricultural Agricultural
10-11 Restorative Justice Center
(dba Community Garden Project of RC)
09-10 Rafael Treto
Guillermo Hurtado
08-09 City of Ontario Michael Y. Park
Aqua Capital Management
07-08 KCO, LLC / The Koll Company Fuji Natural Foods, Inc.
Riboli Family / San Antonio Winery
06-07
05-06
04-05
03-04
02-03 Niagara Bottling Company
01-02 Nicholson Trust
00-01 Loving Savior of the Hills Lutheran Church
CCG Ontario, LLC (Catellus Commercial Group)
99-00
98-99
97-98 Louis Badders
Mountain Vista Power Generation Company, LLC Paul Russavage
96-97 California Speedway Corporation Ambrosia Farms, Chin T. Lee
95-96 City of Fontana General Electric Company Elizabeth H. Rohrs
Richard Van Loon
S.N.S. Dairy
Wineside 45
Frank Lizzaraga
94-95
93-94
92-93
91-92 Arrowhead Mountain Springs Water Co. California Steel Industries, Inc.
90-91
89-90 Fontana Water Company Gary Teed
1 Refer to the Twenty-Seventh Annual Report (Fiscal Year 2003-04) for interventions prior to 89-90.

Appendix D
WATERMASTER’S “NOTICE OF INTENT” TO CHANGE THE OPERATING SAFE YIELD OF THE
CHINO GROUNDWATER BASIN
PLEASE TAKE NOTICE that on this 27th day of January 2011, Chino Basin
Watermaster hereby files this ‘NOTICE OF INTENT’ to change the operating safe yield of the Chino Groundwater Basin Pursuant to the Judgment entered in Chino Basin Municipal Water District v. City of Chino, et al., San Bernardino Superior Court, Case No. RCV 51010 (formerly Case No. 164327) (Exhibit I, Paragraph 2b, Page 80). Approved by CHINO BASIN WATERMASTER CHINO BASIN WATERMASTER ADVISORY COMMITTEE BOARD OF DIRECTORS By: /s/ Ken Jeske By: /s/ Kenneth Willis Chair Chair ATTEST: By: /s/ Tom Haughey Secretary

Appendix E-1
APPROPRIATIVE RIGHTS (ORIGINAL PER JUDGMENT)
Appropriative Share of Initial Share of
Party Right Operating Safe Yield Operating Safe Yield
(Acre-Feet) (Acre-Feet) (Percent)
City of Chino 5,271.7 3,670.067 6.693
City of Norco 289.5 201.545 0.368
City of Ontario 16,337.4 11,373.816 20.742
City of Pomona 16,110.5 11,215.852 20.454
City of Upland 4,097.2 2,852.401 5.202
Cucamonga County Water District 4,431.0 3,084.786 5.626
Jurupa Community Services District 1,104.1 768.655 1.402
Monte Vista County Water District 5,958.7 4,148.344 7.565
West San Bernardino County Water District 925.5 644.317 1.175
Etiwanda Water Company 768.0 534.668 0.975
Feldspar Gardens Mutual Water Company 68.3 47.549 0.087
Fontana Union Water Company 9,188.3 6,396.736 11.666
Marygold Mutual Water Company 941.3 655.317 1.195
Mira Loma Water Company 1,116.0 776.940 1.417
Monte Vista Irrigation Company 972.1 676.759 1.234
Mutual Water Company of Glen Avon Heights 672.2 467.974 0.853
Park Water Company 236.1 164.369 0.300
Pomona Valley Water Company 3,106.3 2,162.553 3.944
San Antonio Water Company 2,164.5 1,506.888 2.748
Santa Ana River Water Company 1,869.3 1,301.374 2.373
Southern California Water Company 1,774.5 1,235.376 2.253
West End Consolidated Water Company 1,361.3 947.714 1.728
Total 78,763.8 54,834.000 100.000

Appendix E-2
APPROPRIATIVE RIGHTS (AS OF JUNE 30, 2011)
Appropriative Share of Initial Share of
Party Right Operating Safe Yield Operating Safe Yield
(Acre-Feet) (Acre-Feet) (Percent)
City of Chino A 5,794.25 4,033.857 7.356
City of Chino Hills B 3,032.86 2,111.422 3.851
City of Norco 289.50 201.545 0.368
City of Ontario 16,337.40 11,373.816 20.742
City of Pomona 16,110.50 11,215.852 20.454
City of Upland 4,097.20 2,852.401 5.202
Cucamonga Valley Water District C 5,199.00 3,619.454 6.601
Jurupa Community Services District D 2,960.60 2,061.118 3.759
Monte Vista Water District E 6,929.15 4,823.954 8.797
West Valley Water District F 925.50 644.317 1.175
Fontana Union Water Company G 9,181.12 6,391.736 11.657
Fontana Water Company H 1.44 1.000 0.002
Los Serranos County Club I - - -
Marygold Mutual Water Company 941.30 655.317 1.195
Monte Vista Irrigation Company 972.10 676.759 1.234
Niagara Bottling, LLC J - - -
Nicholson Trust K 5.75 4.000 0.007
San Antonio Water Company 2,164.50 1,506.888 2.748
Santa Ana River Water Company 1,869.30 1,301.374 2.373
Golden State Water Company L 591.05 411.476 0.750
West End Consolidated Water Company 1,361.30 947.714 1.728
San Bernardino County (Shooting Park) M - - -
Arrowhead Mountain Springs Water Company N - - -
City of Fontana O - - -
Total 78,763.82 54,834.000 100.000
L GSWC permanently transferred 823.900 AF OSY to Park Water Company in 1980. Park Water Co was acquired by WW#8 which was
E MVCWD changed its name to MVWD in 1980. In 1990, MVWD received 675.610 AF of WW#8 OSY as a result of a permanent transfer.
B City of Chino Hills incorporated in 1991 and assumed the responsibility for providing the public services formerly provided by WW#8.
WW#8 acquired a portion of the rights of Park and Pomona Valley Water Companies in 1983.
D JCSD acquired the rights of Mira Loma Water Company in 1979 (776.940 AF OSY), Feldspar Gardens in 1988 (47.549AF OSY) and Mutual
N Arrowhead intervened in 1992 with 0.000 AF OSY.
O City of Fontana intervened in 1996 with 0.000 AF OSY.
M San Bernardino County Prado Tiro (now known as Prado Shooting Park) was involuntarily reassigned to the Appropriative Pool from the
Agricultural Pool in 1985.
K Nicholson Trust intervened in FY 01-02 and was assigned 4.000 AF OSY as a result of a permanent transfer of water rights from FUWC.
subsequently acquired by the City of Chino Hills. SCWC changed its name to GSWC in 2005.
I Los Serranos intervened into the Appropriative Pool in 1990 with 0.000 AF OSY, and it was later determined that they are not within the Basin.J Niagara Bottling intervened in FY 02-03 with 0.000 AF OSY.
H FWC intervened in 1989 and was assigned 1.000 AF OSY as a result of a permanent transfer of water rights from FUWC.
G In FY 01-02, 5.000 AF OSY was reassigned: 1.000 AF to FWC and 4.000 AF to the Nicholson Trust.
F WSBCWD changed its name to WVWD in 2003.
A In 1990, Chino received a portion of San Bernardino County Water Works #8 (WW#8) OSY (363.790 AF) as a result of a permanent transfer.
C CCWD acquired the rights to Etiwanda Water Company (upon dissolution) in 1986. CCWD changed its name to CVWD in 2004.
Water Company of Glen Avon Heights in 1997 (467.974 AF OSY).
Appendix F-1
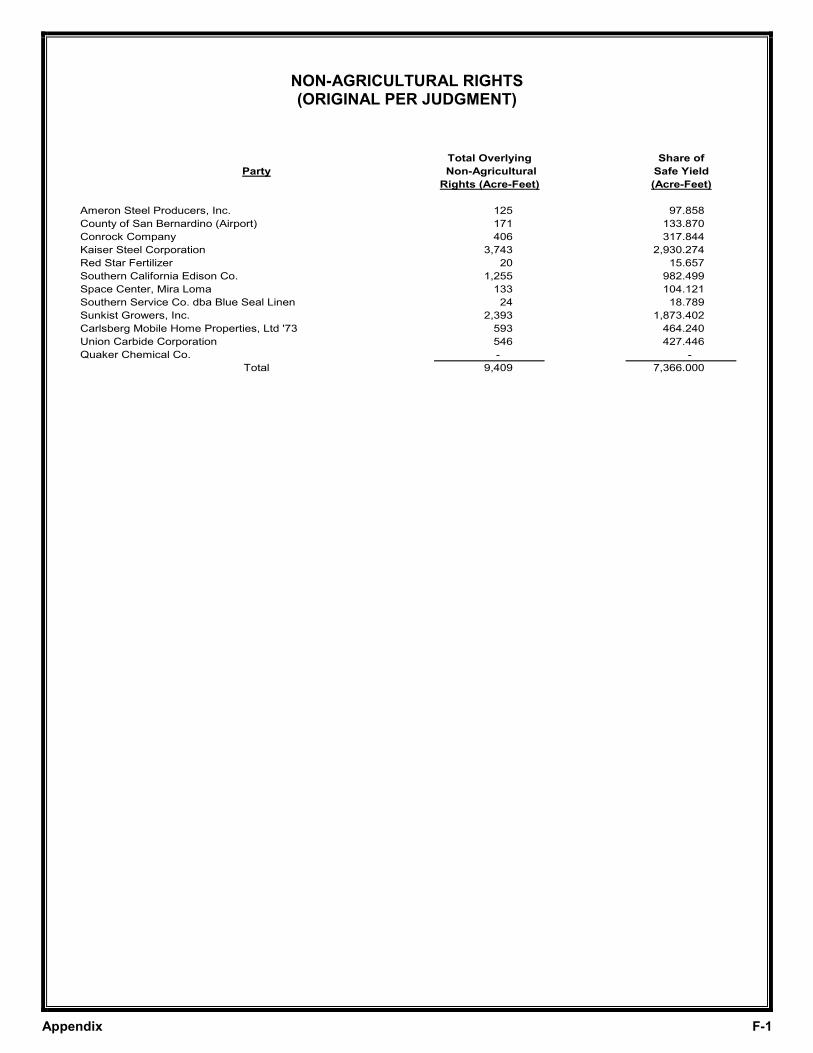
NON-AGRICULTURAL RIGHTS (ORIGINAL PER JUDGMENT)
Total Overlying Share of
Party Non-Agricultural Safe Yield
Rights (Acre-Feet) (Acre-Feet)
Ameron Steel Producers, Inc. 125 97.858
County of San Bernardino (Airport) 171 133.870
Conrock Company 406 317.844
Kaiser Steel Corporation 3,743 2,930.274
Red Star Fertilizer 20 15.657
Southern California Edison Co. 1,255 982.499
Space Center, Mira Loma 133 104.121
Southern Service Co. dba Blue Seal Linen 24 18.789
Sunkist Growers, Inc. 2,393 1,873.402
Carlsberg Mobile Home Properties, Ltd '73 593 464.240
Union Carbide Corporation 546 427.446
Quaker Chemical Co. - -
Total 9,409 7,366.000

Appendix F-2
NON-AGRICULTURAL RIGHTS (AS OF JUNE 30, 2011)
Total Overlying Share of
Party Non-Agricultural Safe Yield
Rights (Acre-Feet) (Acre-Feet)
Ameron Steel Producers, Inc. 125.00 97.858
County of San Bernardino (Airport) 171.00 133.870
Vulcan Materials Company A - -
Kaiser Steel Corporation B - -
West Venture Development Co. C - -
Southern California Edison Co. D - -
GenOn West, LP E 1,219.29 954.540
Space Center, Mira Loma 133.00 104.121
Angelica Rental Service F 24.00 18.789
Sunkist Growers, Inc. G - -
Swan Lake Mobile Home Park H 593.00 464.240
Praxair I 1.28 1.000
Quaker Chemical Company J - -
California Steel Industries K, T 1,660.56 1,300.000
General Electric Company L - -
Auto Club Speedway M 1,277.36 1,000.000
Loving Savior of the Hills Lutheran Church N - -
CCG Ontario LLC O - -
KCO, LLC/The Koll Company P - -
San Antonio Winery Q - -
Ontario City Non-Ag R 2,973.44 2,327.807
Aqua Capital Management S,T 1,211.08 948.118
Total 9,389.00 7,350.343
abandoned its rights to production in FY 90-91.
West, Inc. changed its name to GenOn West, LP in FY 10-11.
27.959 AF SY to Ontario City Non-Ag.
T A dispute has arisen between Aqua Capital Management and CSI concerning allocation of the right attributed to Aqua Capital Management.
S Aqua Capital Management intervened in FY 08-09 after purchasing land from CCG Ontario. On December 18, 2008, CCG Ontario permanently
1,873.402 AF SY to Ontario City Non-Ag. On May 28, 2009, Koll's 22.000 AF SY was permanently transferred to Ontario City Non-Ag. On
P KCO/Koll intervened in FY 07-08 after purchasing land from Sunkist. On May 22, 2008, Sunkist permanently transferred 22.000 AF SY to Koll. On
May 28, 2009, the 22.000 AF SY was permanently transferred to Ontario City Non-Ag.Q San Antonio Winery intervened in FY 07-08 with 0.000 AF SY.
K California Steel Industries (CSI) intervened in FY 91-92 after purchasing land from Kaiser.
August 16, 2000. On December 18, 2009, CCG Ontario permanently transferred its 630.274 AF SY to Aqua Capital Management.
L General Electric Company intervened in FY 95-96 with 0.000 AF SY.
G On May 22, 2008, Sunkist permanently transferred 22.000 AF SY to Koll. On October 23, 2008 Sunkist permanently transferred 1,873.402 AF SY
to Ontario City Non-Ag.
R Ontario City Non-Ag intervened in FY 08-09 after purchasing land from Sunkist. On October 23, 2008, Sunkist permanently transferred
B Kaiser Steel Corporation became Kaiser Resources and then Kaiser Venture, Inc. Kaiser sold portions of its property to CSI & Speedway, then its
O CCG Ontario LLC intervened in FY 00-01. Kaiser sold its last property holdings and all its remaining water rights to CCG Ontario LLP on
to Aqua Capital Management.
last property holdings and all its remaining water rights to CCG Ontario LLP on August 16, 2000.
Ontario City Non-Ag.
transferred 630.274 AF SY to Aqua Capital. On July 23, 2009, Vulcan permanently transferred 317.844 AF SY to Aqua Capital.
H Carlsberg Mobile Home Properties became Mobile Community Management and is known as Swan Lake Mobile Home Park.
Reliant Energy, Etiwanda with 954.540 AF SY. Reliant Energy, Etiwanda changed its name to RRI Energy West, Inc. in FY 08-09. RRI Energy
M California Speedway intervened in FY 96-97 after purchasing land from Kaiser. On August 16, 2000, Catellus permanently transferred 525.000 AF
SY to Speedway. California Speedway changed its name to Auto Club Speedway in FY 07-08.
F Southern Service Company became Angelica Rental Service in FY 90-91.
N Loving Savior of the Hills Lutheran Church intervened in FY 00-01 with 0.000 AF SY.
I Union Carbide Corp. became Praxair, Inc. On May 27, 2010, Praxair permanently transferred 426.446 AF SY to Ontario City Non-Ag.
May 27, 2010, Praxair permanently transferred 426.446 AF SY to Ontario City Non-Ag. On March 24, 2011, SCE permanently transferred
J Quaker Chemical Company went out of business in FY 93-94.
D A portion of SCE was sold in FY 98-99; SCE retained 27.959 AF SY. On March 24, 2011, SCE permanently transferred 27.959 AF SY to
E Mountain Vista Power Generating Company (MVPG) purchased the Etiwanda Generating Facility owned by SCE in FY 98-99. MVPG became
C Red Star Fertilizer became Anaheim Citrus then was acquired by West Venture Development. West Venture went out of business in 91-92 and
A Conrock became Calmat and in FY 99-00 became Vulcan Materials Co. On July 23, 2009, Vulcan permanently transferred its 317.844 AF SY

Appendix G-1
HISTORY OF TOTAL ANNUAL GROUNDWATER PRODUCTION BY POOL (ACRE-FEET)
74-75 70,312 96,567 8,878 175,757
75-76 79,312 95,349 6,356 181,017
76-77 72,707 91,450 9,198 173,355
77-78 60,659 83,934 10,082 1 154,675
78-79 60,597 73,688 7,127 141,412
79-80 63,834 69,369 7,363 140,566
80-81 70,726 68,040 5,650 144,416
81-82 66,731 65,117 5,684 137,532
82-83 63,481 56,759 2,395 122,635
83-84 70,558 59,033 3,208 132,799
84-85 76,912 55,543 2,415 134,870
85-86 80,859 52,061 3,193 136,113
86-87 84,662 59,847 2,559 147,068
87-88 91,579 2 57,865 2,958 152,402
88-89 93,617 3 46,762 3,619 143,998
89-90 101,344 4 48,420 4,856 154,620
90-91 86,658 5 48,085 5,407 140,150
91-92 91,982 6 44,682 5,240 141,904
92-93 86,367 7 44,092 5,464 135,923
93-94 80,798 8 44,298 4,586 129,682
94-95 93,419 9 55,022 4,327 152,768
95-96 101,606 10, 11 43,639 5,424 150,669
96-97 110,163 11 44,809 6,309 161,281
97-98 97,435 12 43,345 4,955 13 145,735
98-99 107,723 47,538 7,006 162,267
99-00 126,645 44,401 7,774 178,820
00-01 113,437 11,14 39,954 8,084 161,475
01-02 121,489 11,15 39,494 5,548 166,531
02-03 120,557 11,16 38,487 11 4,853 163,897
03-04 136,834 17 41,978 2,915 181,727
04-05 127,811 18 34,450 2,327 164,588
05-06 124,315 19 33,900 3,026 161,241
06-07 130,826 20 37,295 3,369 171,491
07-08 103,078 21 30,910 3,440 137,427
08-09 84,716 22 32,143 4,394 121,253
09-10 78,733 23 31,855 3,908 114,496
10-11 78,410 24 31,342 3,914 113,667
1 Includes 3,945 AF of mined water pumped by Edison as agent for IEUA.
2 Does not include 7,674.3 AF exchanged with MWDSC.
3 Does not include 6,423.6 AF exchanged with MWDSC.
4 Does not include 16,377.1 AF exchanged with MWDSC.
5 Does not include 14,929.1 AF exchanged with MWDSC.
6 Does not include 12,202.4 AF exchanged with MWDSC.
7 Does not include 13,657.3 AF exchanged with MWDSC.
8 Does not include 20,194.7 AF exchanged with MWDSC.
9 Does not include 4,221.9 AF exchanged with MWDSC.
10 Does not include 6,167.2 AF exchanged with MWDSC.
11 Reflects corrected production after reporting errors were accounted for.
12 Does not include 4,275.4 AF exchanged with MWDSC.
13 Does not include 216.5 AF exchanged with MWDSC.
14 Does not include 7,989 AF Desalter production or 99.8 AF Dept. of Toxic Substances Control (DTSC) production.
15 Does not include 9,458 AF Desalter production or 80.8 AF Dept. of Toxic Substances Control (DTSC) production.
16 Does not include 10,439 AF Desalter production or 79.1 AF Dept. of Toxic Substances Control (DTSC) production.
17 Does not include 10,605 AF Desalter production or 79.1 AF Dept. of Toxic Substances Control (DTSC) production.
18 Does not include 9,854 AF Desalter production or 80.7 AF Dept. of Toxic Substances Control (DTSC) production.
19 Does not include 16,476 AF Desalter production or 79.5 AF Dept. of Toxic Substances Control (DTSC) production.
20 Does not include 26,356 AF Desalter production or 79.3 AF Dept. of Toxic Substances Control (DTSC) production.
21 Does not include 26,972 AF Desalter production or 81.1 AF Dept. of Toxic Substances Control (DTSC) production.
22 Does not include 32,920 AF Desalter production or 82.6 AF Dept. of Toxic Substances Control (DTSC) production.
23 Does not include 28,517 AF Desalter production or 85.1 AF Dept. of Toxic Substances Control (DTSC) production.
24 Does not include 29,319 AF Desalter production or 87.3 AF Dept. of Toxic Substances Control (DTSC) production.
Production Year TotalAppropriative Agricultural Non-Agricultural

Appendix G-2
HISTORY OF TOTAL ANNUAL GROUNDWATER PRODUCTION BY POOL

Appendix H
HISTORY OF REALLOCATION OF UNPRODUCED AGRICULTURAL POOL SAFE YIELD1
(ACRE-FEET)
Production Remaining Balance
Year 50% Allocated Available
83-84 297 297 25,762 26,355 2
84-85 297 297 18,543 19,136
85-86 406 406 21,091 21,902
86-87 406 406 36,348 37,159
87-88 2,028 2,028 74,433 78,489 3
88-89 406 406 24,124 24,935
89-90 406 406 35,227 36,038
90-91 406 406 33,569 34,380
91-92 406 406 33,904 34,715
92-93 406 406 37,307 38,118
93-94 406 406 37,897 38,708
94-95 3,246 406 34,850 38,502
95-96 5,855 5,855 16,067 27,778
96-97 6,310 6,310 26,541 39,161
97-98 7,213 7,213 23,565 37,991
98-99 8,511 8,511 22,433 39,455
99-00 10,471 N/A 63,191 73,662 4
00-01 13,920 N/A 28,926 42,846
01-02 14,133 N/A 29,173 43,306
02-03 16,480 N/A 27,833 44,313
03-04 17,510 5
N/A 23,312 40,822
04-05 19,013 N/A 29,336 48,350
05-06 20,370 N/A 28,530 48,900
06-07 22,158 N/A 23,346 45,505
07-08 22,461 N/A 23,346 45,505
08-09 22,730 N/A 27,927 50,657
09-10 22,731 N/A 28,214 50,945
10-11 23,033 N/A 28,425 51,458
1 Source: Watermaster Annual Reports and Assessment Packages.
2 First-year reallocation occurred under the Judgment.
3 Appropriators agree to pay Ag Pool assessments. Reallocation procedure changed by agreement.
4 Peace Agreement signed. Appropriators agree to pay Ag Pool assessments for life of Peace Agreement. Procedure
changed by agreement. Ag Pool Annual Safe Yield is 82,800 AF.5 After duplication of conversion areas were identified, Jurupa's Pre-Peace Agreement acres were adjusted (337.6 acres),
and Post-Peace Agreement acres were adjusted (846.4 acres).
Conversions
Land Use Reallocated to
Appropriators
Total Ag Pool

Appendix I
TOTAL WATER CONSUMPTION WITHIN THE CHINO BASIN1 (ACRE-FEET)
74-75 175,757 49,383 225,140
75-76 181,017 57,686 238,703
76-77 173,355 55,765 229,120
77-78 154,675 61,567 216,242
78-79 142,412 4
75,864 218,276
79-80 140,566 70,727 211,293
80-81 144,416 77,765 222,181
81-82 137,532 67,491 205,023
82-83 122,635 76,000 198,635
83-84 132,799 99,257 232,056
84-85 134,870 92,952 227,822
85-86 136,113 114,624 250,737
86-87 147,068 126,493 273,561
87-88 152,402 116,175 268,577
88-89 143,998 128,167 272,165
89-90 154,620 139,004 293,624
90-91 140,151 116,493 256,644
91-92 141,904 104,480 246,384
92-93 135,923 117,205 253,128
93-94 129,682 136,038 265,720
94-95 152,768 116,797 269,565
95-96 150,669 4
130,494 281,163
96-97 161,281 4
115,031 276,312
97-98 145,735 106,360 252,095
98-99 162,267 113,040 275,307
99-00 178,820 129,208 308,028
00-01 161,475 4
128,596 290,071
01-02 165,898 140,907 306,805
02-03 163,897 134,154 4
298,051
03-04 181,727 143,989 325,716
04-05 164,588 145,644 310,232
05-06 161,241 171,896 333,137
06-07 171,491 176,807 4
348,297
07-08 137,427 162,465 299,893
08-09 121,253 131,819 4
253,072
09-10 114,496 144,354 258,849
10-11 113,667 154,760 268,427
3 Total does not include cyclic deliveries, water delivered by exchange, or water from direct spreading that was used
for replenishment.4 Reflects corrected value.
2 See Appendix G-1, "History of Total Annual Groundwater Production by Pool."
Total
1 Total includes water used over Cucamonga Basin.
Chino Basin
Extractions2Production Year
Other Imported
Supplies3

Appendix J
SUMMARY OF SUPPLEMENTAL SUPPLIES FISCAL YEAR 2010-2011
(ACRE-FEET)
Chino, City of - - - 7,299.8 7,299.8
Chino Hills, City of - - - 2,350.1 2,350.1
Cucamonga Valley Water District 1
3,284.9 4,902.5 - 2,401.6 10,588.9
Inland Empire Utilities Agency 2
- - - 520.2 520.2
Fontana Water Company 3
17,908.7 13,856.1 1,394.1 - 33,158.9
Jurupa Community Services District 4
1,227.3 - - 403.0 1,630.3
Marygold Mutual Water Company 5
- - - - -
MWDSC 6
- - 46,786.1 - 46,786.1
Monte Vista Water District - - - 641.9 641.9
Ontario, City of - - - 9,027.4 9,027.4
Pomona, City of 7
4,005.0 3,236.9 1,216.8 - 8,458.7
San Antonio Water Company 8
4,946.9 4,623.4 - - 9,570.3
San Bernardino, County of - - - 1,250.7 1,250.7
State of California, CIM 9
- - - 972.5 972.5
Upland, City of 10
6,967.0 4,176.0 - 789.3 11,932.3
West End Consolidated Water Company 11
3,751.0 - - - 3,751.0
West Valley Water District 12
6,821.0 - - - 6,821.0
Total 48,911.8 30,794.8 49,397.0 25,656.4 154,760.0
9 Recycled wastewater that was applied to fields, including water held in storage ponds.
Recycled
Water TotalMember Agency
Other
Basins
Surface
Diversions
SBVMWD &
MWDSC
Imported
Deliveries
1 Includes groundwater produced from Cucamonga Basin and surface water from Lloyd Michaels, Royer-Nesbit, and Arthur H.
Bridge WTPs, and Deer Canyon. 2
IEUA provided 24,683.9 AF of recycled water as follows: 7,472.9 AF to the City of Chino, 1,631.4 AF to the City of Chino Hills,
733.6 AF to Cucamonga Valley Water District, 520.2 AF to IEUA, 303.6 AF to Monte Vista Water District, 5,743.6 AF to Ontario,
12 Listed amount was delivered to "meter book" service area.
8 An amount of 4,623.4 AF was treated local canyon flow used in the overlying Chino Basin. The imported groundwater
was 239.5 AF from San Antonio Tunnel, 3,970.7 AF from Cucamonga Basin, and 736.7 AF from Six Basins.
10 Imported groundwater produced from Six Basins. Surface water deliveries are from the San Antonio Water Company and
treated at the San Antonio Canyon WTP. 11
Imported groundwater produced from Cucamonga and Six Basins.
1,250.7 AF to San Bernardino County, and 0.0 AF to the City of Upland. Additionally, recycled water groundwater recharge in
3 Imported groundwater produced from Colton/Rialto, Lytle, and "unnamed" Basins. Surface water deliveries are from Lytle Creek.
7 Includes 3,802.7 AF of groundwater from Six Basins and 202.3 AF of groundwater from Spadra Basin. Imported water was
delivered through TVMWD.
5 Imported groundwater produced from wells located in the Rialto Basin.
6 MWDSC and SBVMWD deliveries (See Appendix K, "Summary of MWDSC Deliveries," for individual agencies breakdown).
4 Imported groundwater produced from Rubidoux Basin. Recycled water is purchased through IEUA.
the amount of 8,028.0 AF is shown as allocated within each service area.
Imported deliveries are via both IEUA/MWD and SVBMWD.

Appendix K
SUMMARY OF MWDSC DELIVERIES1 FISCAL YEAR 2010-2011
(ACRE-FEET)
Upland MVWD Ontario Chino Chino Hills2
Total
July 474 1,028 983 379 1,028 3,892
August 519 1,091 1,467 366 1,091 4,534
September 498 1,000 1,418 316 990 4,222
October 153 581 1,068 161 581 2,543
November - 184 697 177 392 1,450
December 25 31 533 133 274 994
January 64 86 487 136 332 1,104
February 4 51 430 170 275 930
March 85 - 441 144 57 727
April 357 - 581 136 82 1,155
May 420 - 852 233 182 1,687
June 754 10 868 270 254 2,155
Total 3,353 4,061 9,824 2,620 5,536 25,393
FontanaWater Co.
CB-01 CB-19 CB-07 CB-16 Sub-Total
July - 216 - 2,641 2,641 196 6,946
August - 307 - 2,900 2,900 270 8,011
September - 296 - 2,367 2,367 271 7,156
October - 233 - 1,209 1,209 119 4,105
November - 72 - 1,241 1,241 60 2,822
December - - - 1,705 1,705 40 2,739
January - - - 1,703 1,703 11 2,818
February - - - 658 658 29 1,617
March - - - 672 672 - 1,399
April - - - 952 952 26 2,132
May - 43 - 1,735 1,735 64 3,529
June - 229 - 2,214 2,214 131 4,729
Total - 1,398 - 19,995 19,995 1,217 48,003
1 Does not include Dry Year Yield activity ("puts" or "takes").
2 Total includes water delivered directly from WFA and from WFA through MVWD by agreement.
MonthWater Facilities Authority - CB-12
MonthReliant Cucamonga Valley Water District
Pomona Total

Appendix L
SUMMARY OF CONJUNCTIVE USE, REPLENISHMENT, AND CYCLIC ACTIVITIES FISCAL YEAR 2010-2011
(ACRE-FEET)
Jul Aug Sep Oct Nov Dec Jan Feb Mar Apr May Jun Total
Direct
Monte Vista Water District - - - - - - - - - - - - -
- - - - - - - - - - - - -
In-Lieu
Chino Basin Watermaster - - - - - - - - - - - - -
Chino, City of - - - - (17.1) - - - - - - - (17.1)
Chino Hills, City of - - - - - - - - - - - 0.3 0.3
Cucamonga Valley Water District (1,002.9) - - - - - - - - - - 20.1 (982.8)
Jurupa Community Services District (155.0) (165.0) (160.0) (170.0) (92.5) - - - - - - 14.9 (727.6)
Monte Vista Water District (510.0) (510.0) (545.0) (545.0) (540.4) (400.0) - - - - - 61.2 (2,989.2)
Ontario, City of - (1,900.0) (686.6) (298.7) (436.6) (408.8) - - - - - 74.8 (3,655.9)
Pomona, City of - - - - - - - - - - - - -
Upland, City of - - - - - - - - - - - - -
(1,667.9) (2,575.0) (1,391.6) (1,013.7) (1,086.6) (808.8) - - - - - 171.4 (8,372.2)
Total Storage / (Withdrawals) (1,667.9) (2,575.0) (1,391.6) (1,013.7) (1,086.6) (808.8) - - - - - 171.4 (8,372.2)
Replenishment (and Preemptive Replenishment) Deliveries Watermaster Obligation = 4,521.401 AF + 4,367.684 AF (CURO) = 8,889.085 AF
Direct*
ASR (Monte Vista Water District) - - - - - - - - - - - 185.5 185.5
CB-11 (Deer Creek) - - - - - - - - - - - - -
CB-13 (San Sevaine) - - - - - - - - - - 455.4 675.1 1,130.5
CB-14 (Etiwanda) - - - - - - - - - - 215.9 - 215.9
CB-15 (Day Creek) - - - - - - - - - - 412.6 480.9 893.5
CB-18 (Etiwanda Inter-tie) - - - - - - - - - - 300.9 591.1 892.0
CB-20 (West Cucamonga) - - - - - - - - - - 218.0 408.1 626.1
OC-59 (San Antonio) - - - - - - - - - - 2,044.0 3,086.5 5,130.5
- - - - - - - - - - 3,646.8 5,427.2 9,074.0
In-Lieu
Service Connections
CB-12 - - - - - - - - - - - - -
CB-16 - - - - - - - - - - - - -
- - - - - - - - - - - - -
Purchased from Appropriators - - - - - - - - - 8,889.1 - 8,889.1
Purchased from Cyclic Account - - - - - - - - - - - - -
Pre-Purchased Previous Year(s) - - - - - - - - - - - - -
Total Replenishment - - - - - - - - - - 12,535.9 5,427.2 17,963.1
* Direct replenishment deliveries during FY 2010-2011 were purchased as preemptive replenishment by Fontana Water Company (6,980.0 acre-feet) and Niagara Bottling LLC (2,094.0 acre-feet) and credited to their "New" Supplemental Storage accounts.
Conjunctive Use, All Parties - Storage

Appendix M
SUMMARY OF STORMWATER RECHARGE FISCAL YEAR 2010-2011
(ACRE-FEET)
Jul Aug Sep Oct Nov Dec Jan Feb Mar Apr May Jun Total
MANAGEMENT ZONE 1:
San Antonio Channel / CB-59
Brooks 1 1 1 24 44 282 - 122 141 1 10 1 628
College Heights - - - 1 - 315 223 - 54 - - - 593
Montclair 1, 2 3 & 4 - - - 41 70 901 325 215 199 - 11 - 1,762
Upland - - - 7 38 722 318 90 133 - - - 1,308
West Cucamonga Channel / CB-20
15th Street - - - - - - - - - - - - -
7th Street 17 19 5 4 24 96 8 60 71 - 1 7 312
8th Street 13 9 31 85 163 403 102 216 179 24 32 14 1,271
MANAGEMENT ZONE 2:
Cucamonga / Deer Creek Channels
Turner 1 & 2 23 53 57 90 141 365 190 233 264 76 138 90 1,720
Turner 3 & 4 95 84 54 55 39 161 1 50 49 - - - 588
Day Creek Channel -
Lower Day 2 1 1 17 11 351 17 91 152 56 3 1 703
Etiwanda Channel
Etiwanda Debris Basin - - - 8 31 698 - 90 294 90 2 - 1,213
Victoria 3 2 2 15 34 242 18 72 59 5 6 3 461
Minor Drainage
Grove - - - 65 60 94 68 59 61 - 24 - 431
San Sevaine Channel
San Sevaine 1, 2, 3 & 4 - - - 86 63 385 1 94 68 - 2 - 699
San Sevaine 5 - - - 9 18 192 12 49 65 - 5 - 350
West Cucamonga Channel
Ely 1, 2 & 3 - - - 29 127 572 104 323 236 3 13 8 1,415
West Fontana Channel
Hickory - - 12 13 36 149 12 79 70 - - - 371
MANAGEMENT ZONE 3:
Day Creek Channel
Riverside - - - - - - - - - - - - -
Wineville - - - - - - - - - - - - -
DeClez Channel
DeClez 3 8 2 45 95 313 52 196 138 2 14 9 877
RP3 Cell 1, 3, & 4 - - 5 42 117 644 220 211 306 134 52 28 1,759
RP3 Cell 2 7 6 20 29 29 100 15 104 108 8 10 6 442
Etiwanda Channel
Etiwanda Conservation - - - - - - - - - - - - -
San Sevaine Channel
Jurupa - - - - - - - - - - - - -
West Fontana Channel
Banana - - - 5 16 51 10 41 26 - - - 149
Totals 164 183 190 670 1,156 7,036 1,696 2,395 2,673 399 323 167 17,052
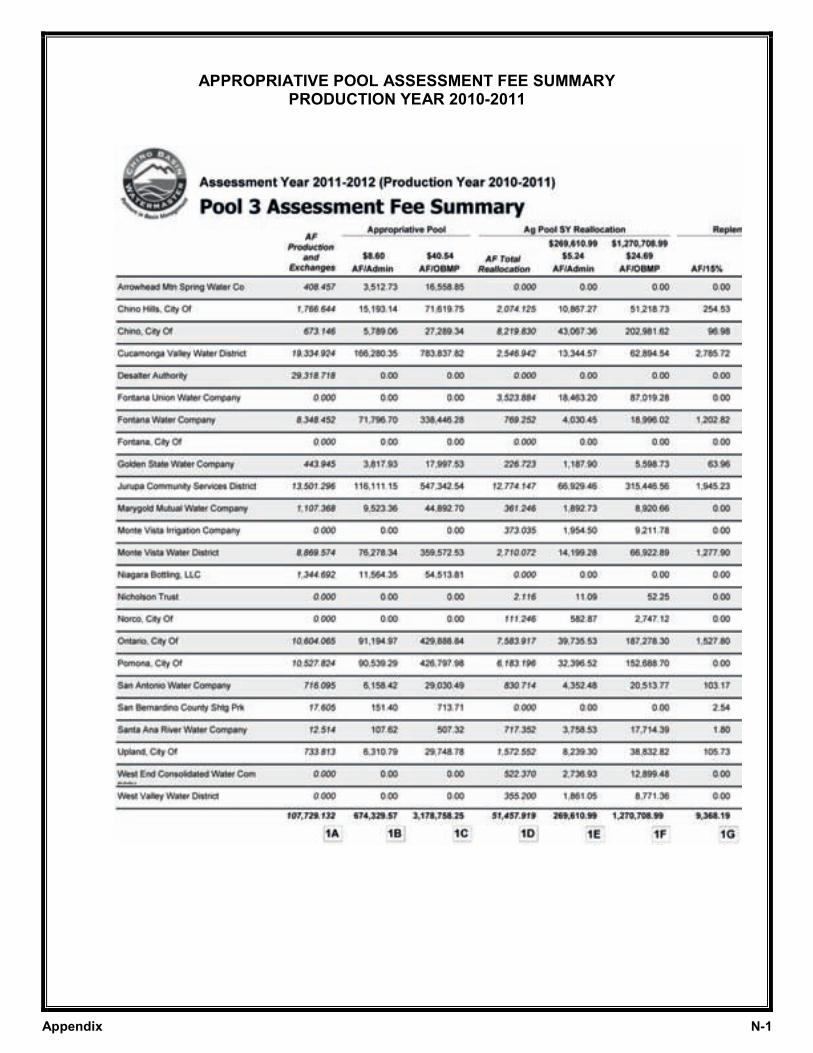
Appendix N-1
APPROPRIATIVE POOL ASSESSMENT FEE SUMMARY PRODUCTION YEAR 2010-2011

Appendix N-2
APPROPRIATIVE POOL FISCAL YEAR

Appendix O-1
APPROPRIATIVE POOL WATER PRODUCTION SUMMARY PRODUCTION YEAR 2010-2011
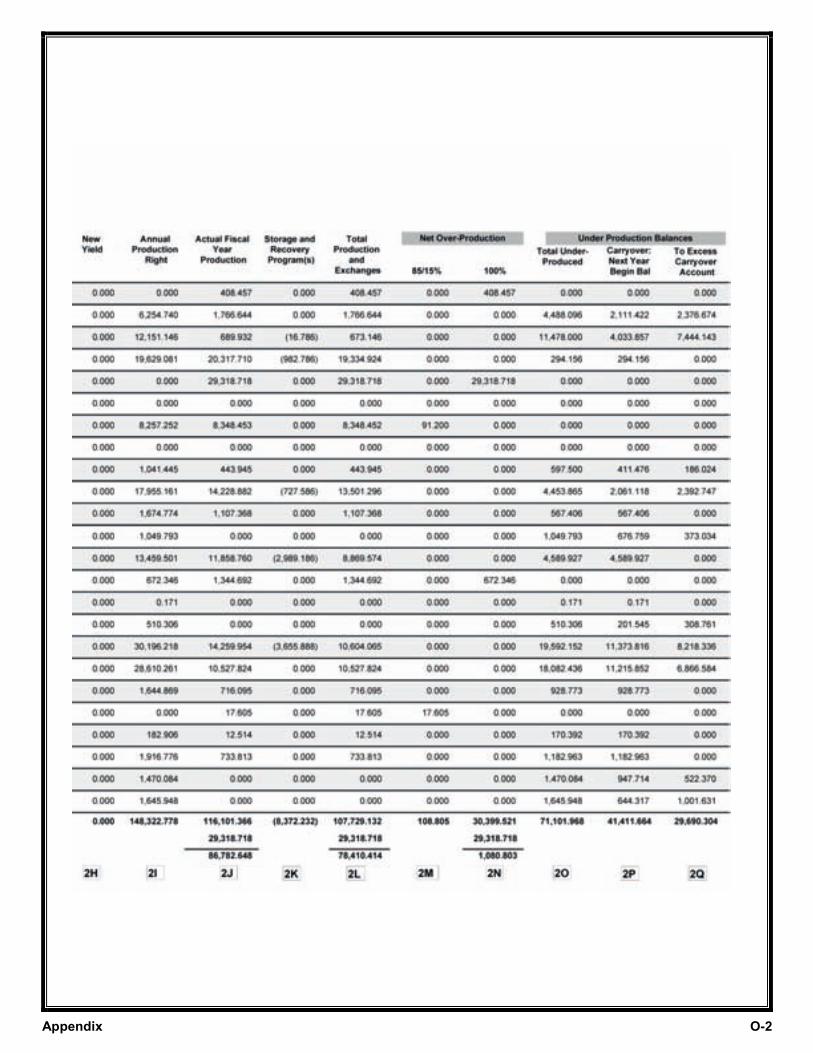
Appendix O-2
APPROPRIATIVE POOL FISCAL YEAR
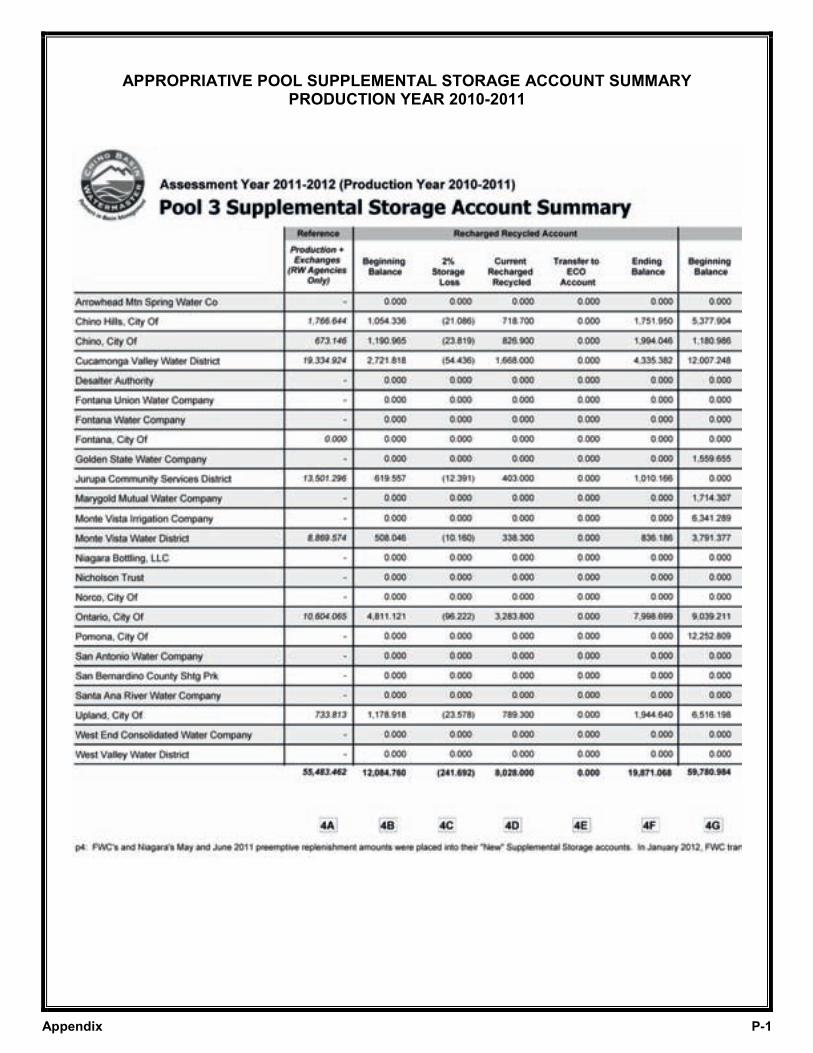
Appendix P-1
APPROPRIATIVE POOL SUPPLEMENTAL STORAGE ACCOUNT SUMMARY PRODUCTION YEAR 2010-2011

Appendix P-2
APPROPRIATIVE POOL FISCAL YEAR
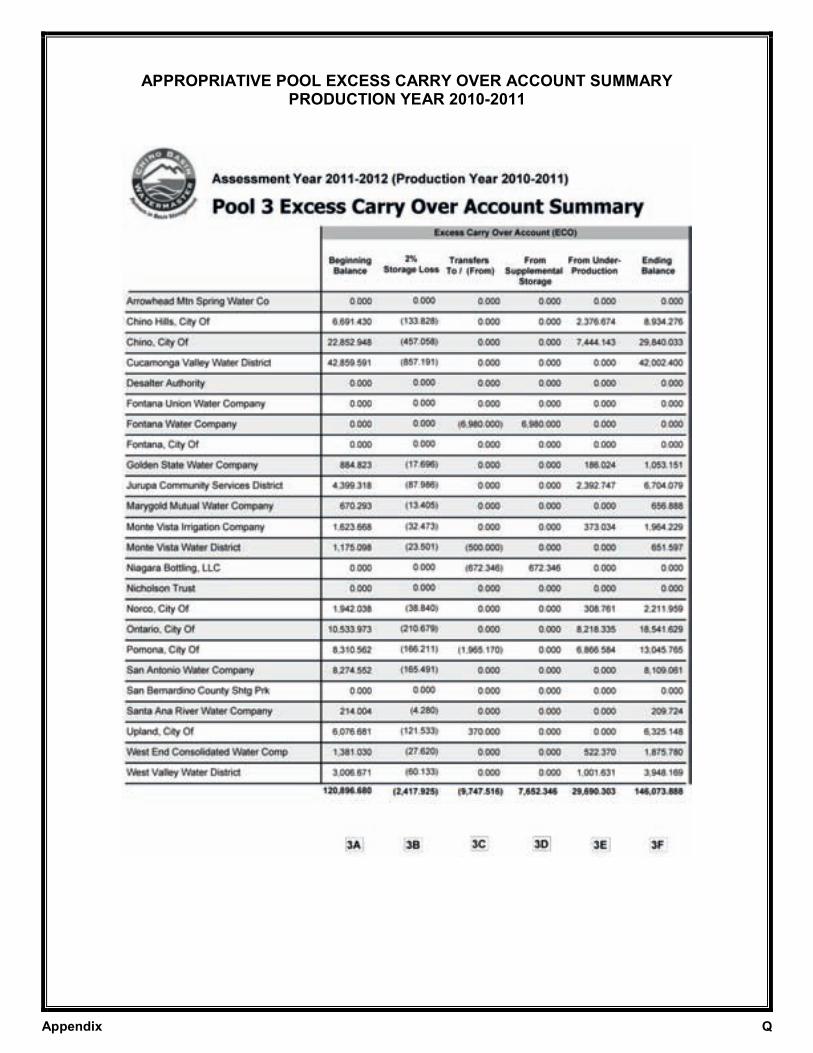
Appendix Q
APPROPRIATIVE POOL EXCESS CARRY OVER ACCOUNT SUMMARY PRODUCTION YEAR 2010-2011

Appendix R
APPROPRIATIVE POOL OTHER STORAGE ACCOUNTS SUMMARY PRODUCTION YEAR 2010-2011

Appendix S-1
APPROPRIATIVE POOL WATER TRANSACTION SUMMARY PRODUCTION YEAR 2010-2011
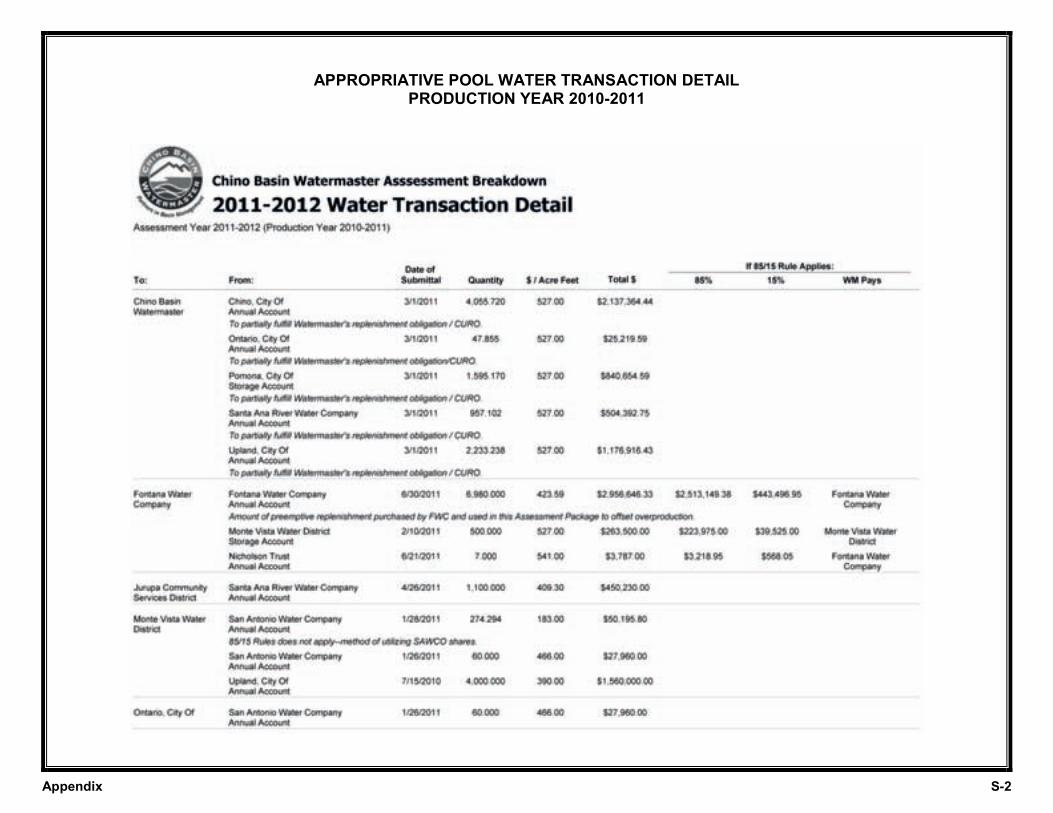
Appendix S-2
APPROPRIATIVE POOL WATER TRANSACTION DETAIL PRODUCTION YEAR 2010-2011

Appendix S-3
APPROPRIATIVE POOL WATER TRANSACTION DETAIL CONT. PRODUCTION YEAR 2010-2011

Appendix S-4
APPROPRIATIVE POOL RECURRING WATER TRANSACTION DETAIL PRODUCTION YEAR 2010-2011

Appendix S-5
APPROPRIATIVE POOL ANALYSIS OF THE APPLICATION OF THE 85/15 RULE TO WATER TRANSFERS PRODUCTION YEAR 2010-2011
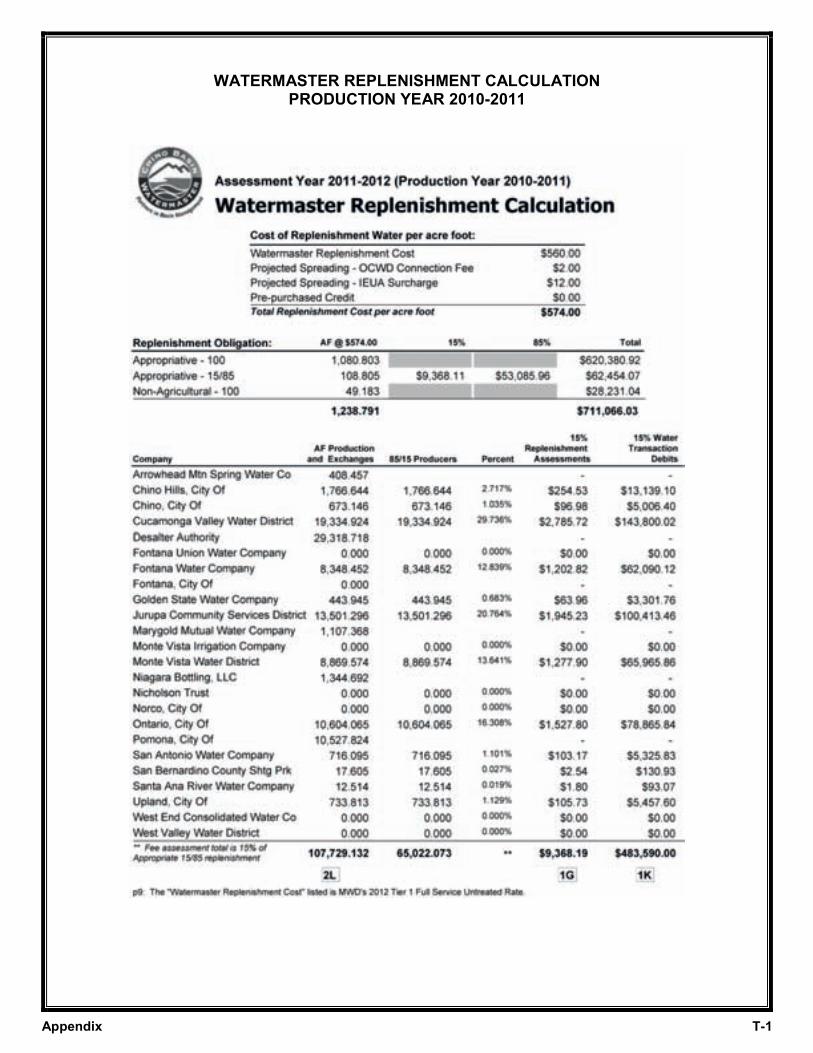
Appendix T-1 S-2
WATERMASTER REPLENISHMENT CALCULATION PRODUCTION YEAR 2010-2011

Appendix T-2
WATERMASTER CUMULATIVE UNMET REPLENISHMENT OBLIGATION (CURO) PRODUCTION YEAR 2010-2011

Appendix T-3
WATERMASTER CUMULATIVE UNMET REPLENISHMENT OBLIGATION (CURO) CONT. PRODUCTION YEAR 2010-2011

Appendix U-1
APPROPRIATIVE POOL LAND USE CONVERSION SUMMARY PRODUCTION YEAR 2010-2011

Appendix U-2
APPROPRIATIVE POOL AGRICULTURAL POOL REALLOCATION SUMMARY PRODUCTION YEAR 2010-2011
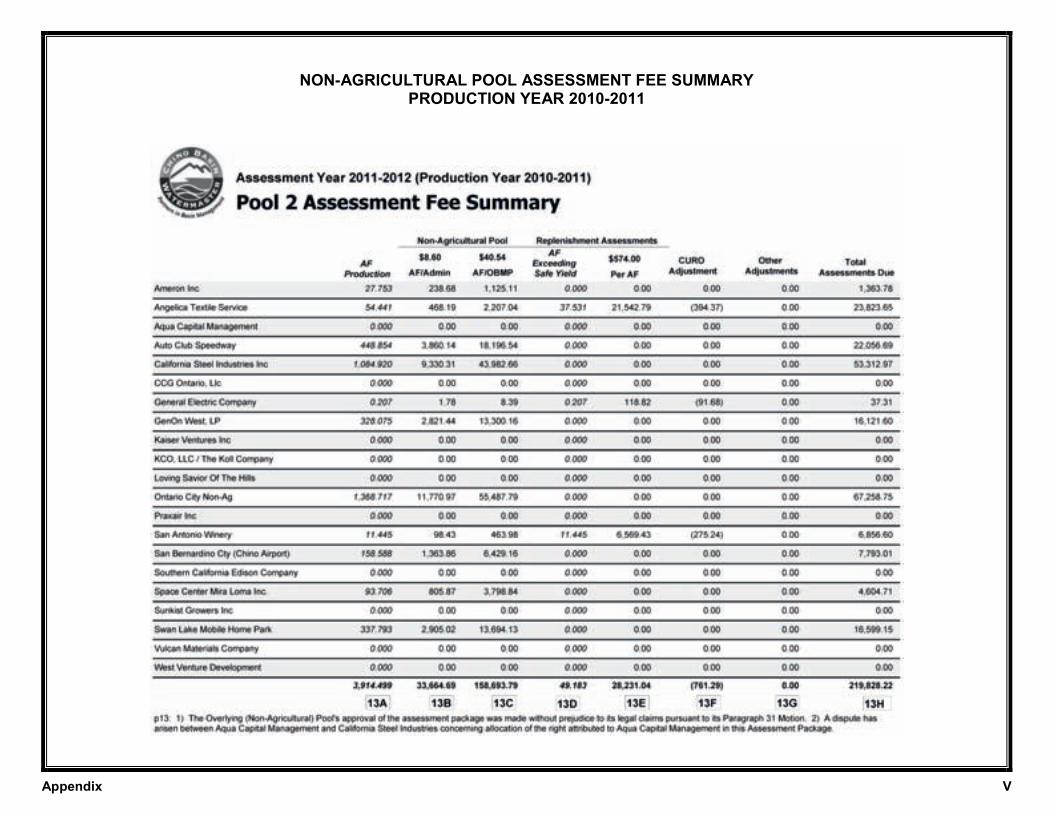
Appendix V
NON-AGRICULTURAL POOL ASSESSMENT FEE SUMMARY PRODUCTION YEAR 2010-2011

Appendix W
NON-AGRICULTURAL POOL WATER PRODUCTION SUMMARY PRODUCTION YEAR 2010-2011

Appendix X
NON-AGRICULTURAL POOL STORAGE ACCOUNT SUMMARY PRODUCTION YEAR 2010-2011

Appendix Y
HISTORIC ASSESSMENTS PER ACRE-FOOT OF PRODUCTION
Agricultural Non-Ag Appropriative Gross Replenishment
Assessment Pool 1Pool Pool 2
Water Rate
Year ($/AF) ($/AF) ($/AF) ($/AF)
77-78 0.29 0.32 0.42
78-79 0.65 1.29 0.77 51.00
79-80 0.54 0.20 0.51 56.20
80-81 0.32 0.00 0.00 62.51
81-82 0.10 0.00 0.00 63.78
82-83 0.10 0.00 0.00 81.46
83-84 0.10 0.00 0.00 102.18
84-85 0.10 0.00 0.10 154.00
85-86 0.10 0.00 0.45 149.39
86-87 0.10 0.00 0.41 155.10
87-88 0.10 0.00 0.25 155.42
88-89 0.09 0.00 0.67 155.33
89-90 3.27 0.00 0.48 115.00
90-91 2.31 0.00 0.43 117.55
91-92 3.53 0.12 0.11 132.55
92-93 7.03 4.07 3.41 169.89
93-94 12.37 6.67 2.51 210.69
94-95 9.86 3.24 2.06 222.00
95-96 11.68 3.43 1.57 233.15
96-97 19.70 7.55 3.69 233.15
97-98 15.19 6.56 2.73 237.15
98-99 19.04 9.85 7.77 243.00
99-00 26.30 14.12 11.75 243.00
00-01 18.15 25.79 24.74 242.00
01-02 34.37 29.93 25.42 243.00
02-03 35.69 26.72 21.35 244.00
03-04 34.10 25.39 22.90 244.00
04-05 26.15 25.43 25.43 250.00
05-06 19.91 27.94 27.94 251.00
06-07 28.23 40.72 40.72 251.00
07-08 29.76 36.30 36.30 257.00
08-09 29.93 50.24 50.24 309.00
09-10 32.50 51.21 51.21 380.00
10-11 30.90 49.41 49.41 541.00
11-12 29.93 49.14 49.14 574.00
1 $/AF of water reallocated to the Appropriative Pool.
2 Excludes amounts related to the debt service of the Recharge Improvement Project, and supplemental and
replenishment water purchases.

Appendix Z
SUMMARY BUDGET FISCAL YEAR 2010-2011
FY 08-09 FY 09-10 FY 09-10 FY 09-10 FY 10-11 Current
June December Approved Amended Approved vs.
Actual Actual Budget Budget Budget Proposed
Ordinary Income
4000 Mutual Agency Revenue $51,217 $111,000 $148,410 $148,410 $148,410 $0
4110 Appropriative Pool Assessments 7,993,307 7,115,654 7,185,411 7,185,411 6,153,067 -1,032,344
4120 Non-Agricultural Pool Assessments 172,817 225,016 155,427 155,427 205,003 49,576
4730 Prorated Interest Income 123,949 20,844 191,540 191,540 175,010 -16,530
4900 Miscellaneous Income 1,028 0 0 0 0 0
Total Income 8,342,318 7,472,514 7,680,788 7,680,788 6,681,490 -999,298
Administrative Expenses
6010 Salary Costs 493,409 244,694 487,838 487,838 464,944 -22,894
6020 Office Building Expense 94,093 47,238 102,500 102,500 103,196 696
6030 Office Supplies & Equip. 44,822 19,903 46,500 46,500 40,500 -6,000
6040 Postage & Printing Costs 70,332 33,639 84,300 84,300 78,300 -6,000
6050 Information Services 142,730 67,913 148,500 148,500 147,200 -1,300
6060 WM Special Contract Services 69,660 68,136 98,000 98,000 75,000 -23,000
6080 Insurance Expense 15,713 15,934 16,730 16,730 17,575 845
6110 Dues and Subscriptions 10,053 17,205 17,000 17,000 16,000 -1,000
6150 Field Supplies & Equipment 1,091 271 2,800 2,800 1,800 -1,000
6170 Travel & Transportation 36,287 14,905 37,800 37,800 33,160 -4,640
6190 Conferences & Seminars 24,133 11,593 26,500 26,500 23,000 -3,500
6200 Advisory Committee Expenses 17,033 9,314 18,078 18,078 22,470 4,392
6300 Watermaster Board Expenses 41,232 18,882 43,823 43,823 50,603 6,780
6500 Education Fund Expenditures 375 0 375 375 375 0
8300 Appropriative Pool Administration 20,294 13,864 23,069 23,069 26,710 3,641
8400 Agricultural Pool Administration 167,194 70,569 200,114 200,114 223,147 23,033
8500 Non-Agricultural Pool Administration 5,117 2,891 6,677 6,677 11,666 4,989
9400 Depreciation Expense 0 0 0 0 0 0
9500 Allocated G&A Expenditures -472,182 -234,302 -488,230 -488,230 -488,129 101
Total Administrative Expenses 781,386 422,649 872,374 872,374 847,517 -24,857
General OBMP Expenditures
6900 Optimum Basin Mgmt Program 1,765,585 655,248 1,399,371 1,568,880 1,197,734 -201,637
6950 Cooperative Efforts 10,000 0 10,000 10,000 10,000 0
9501 Allocated G&A Expenditures 164,541 74,567 148,448 148,448 142,656 -5,792
Total General OBMP Expenses 1,940,126 729,815 1,557,819 1,727,328 1,350,390 -207,429
7000 OBMP Implementation Projects
7101 Production Monitoring 108,441 49,881 107,047 107,047 104,219 -2,828
7102 In-Line Meter Installation/Maintenance 55,732 20,440 56,179 56,179 66,679 10,500
7103 Groundwater Quality Monitoring 183,368 111,425 214,362 214,362 202,996 -11,366
7104 Groundwater Level Monitoring 378,889 175,844 366,956 366,956 336,282 -30,674
7105 Recharge Basin Water Quality Monitoring 4,812 2,659 43,912 43,912 4,280 -39,632
7106 Water Level Sensors Install 0 0 0 0 0 0
7107 Ground Level Monitoring-MZ1 396,028 85,367 550,059 381,406 815,620 265,561
7108 Hydraulic Control Monitoring Program 600,571 188,615 567,022 533,543 493,700 -73,322
7109 Recharge & Well Monitoring Program 0 2,413 9,152 9,152 8,440 -712
7200 OBMP Pgm Element 2 - Comp Recharge 1,263,711 923,590 1,478,560 1,492,772 1,017,022 -461,538
7300 OBMP Pgm Element 3 & 5 - Water Supply Plan - Desalter 80,713 31,911 96,003 85,694 72,111 -23,892
7400 OBMP Pgm Element 4 - Mgmt Zone Strategies 241,019 63,880 91,985 120,705 91,955 -30
7500 OBMP Pgm Element 6 & 7 - Coop Efforts/Salt Mgmt 70,454 76,635 163,727 163,727 154,180 -9,547
7600 OBMP Pgm Element 8 & 9 Storage Mgmt/Conj Use 28,359 28,317 29,550 29,550 68,250 38,700
7700 Inactive Well Protection Program 0 0 5,066 5,066 1,412 -3,654
7690 Recharge Improvement Debt Payment 1,261,894 567,042 1,131,233 1,131,233 700,964 -430,269
9502 Allocated G&A Expenditures 309,220 159,735 339,782 339,782 345,473 5,691
Total OBMP Implementation Projects 4,983,211 2,487,754 5,250,595 5,081,086 4,483,583 -767,012
Total Expenses 7,704,723 3,640,218 7,680,788 7,680,788 6,681,490 -999,298
Net Ordinary Income 637,595 3,832,296 0 0 0 0
Other Income
4225 Interest Income 54,889 13,504 0 0 0 0
4210 Approp Pool-Replenishment 6,427,596 4,887,365 0 0 0 0
4220 Non-Ag Pool-Replenishment 10,047 9,478 0 0 0 0
4230 Groundwater Recharge Activity 0 0 0 0 0 0
4600 Groundwater Sales 0 2,176,962 0 0 0 0
Total Other Income 6,492,532 7,087,309 0 0 0 0
Other Expense
5010 Groundwater Recharge 2,326,075 1,019,746 0 0 0 0
Total Other Expense 2,326,075 1,019,746 0 0 0 0
Net Other Income 4,166,457 6,067,563 0 0 0 0
9900 From / (To) Reserves -4,804,052 -10,139,076 0 0 0 0
Net Income $0 -$239,217 $0 $0 $0 $0
Appendix AA-1

Appendix AA-2

Appendix AA-3

Appendix AA-4

Appendix AA-5

Appendix AA-6

Appendix AA-7
Appendix AA-8

Appendix AA-9

Appendix AA-10

Appendix AA-11

Appendix AA-12
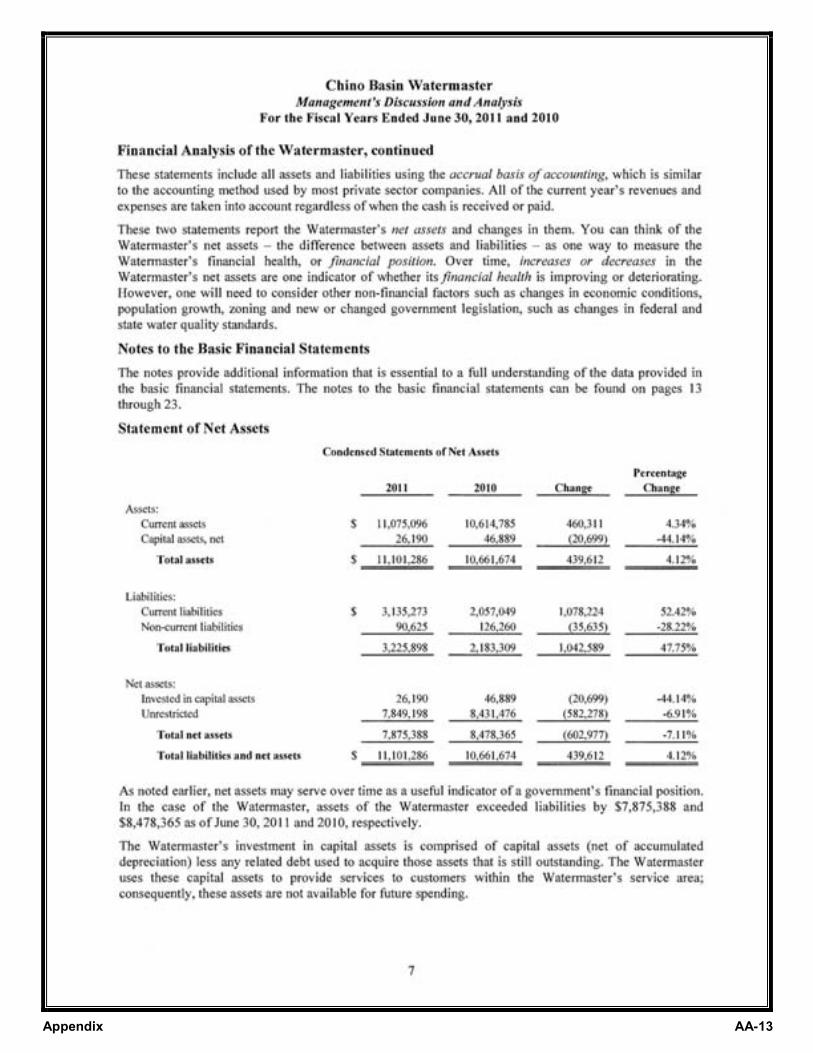
Appendix AA-13

Appendix AA-14
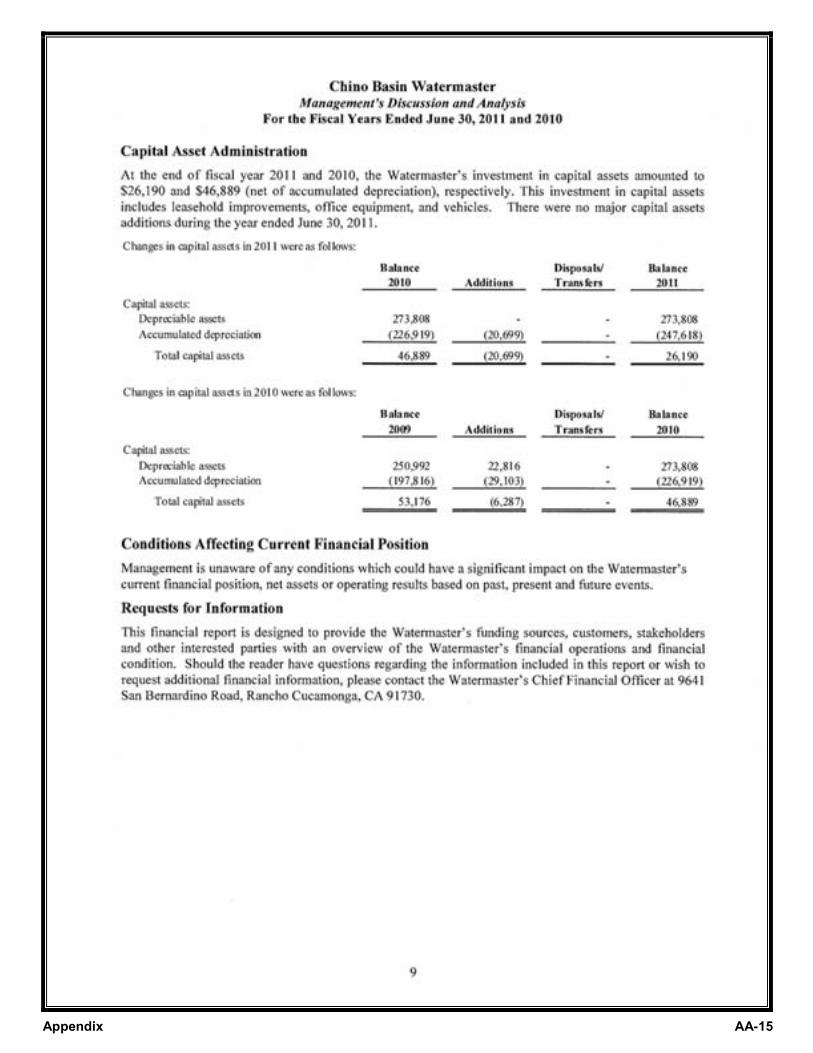
Appendix AA-15

Appendix AA-16

Appendix AA-17
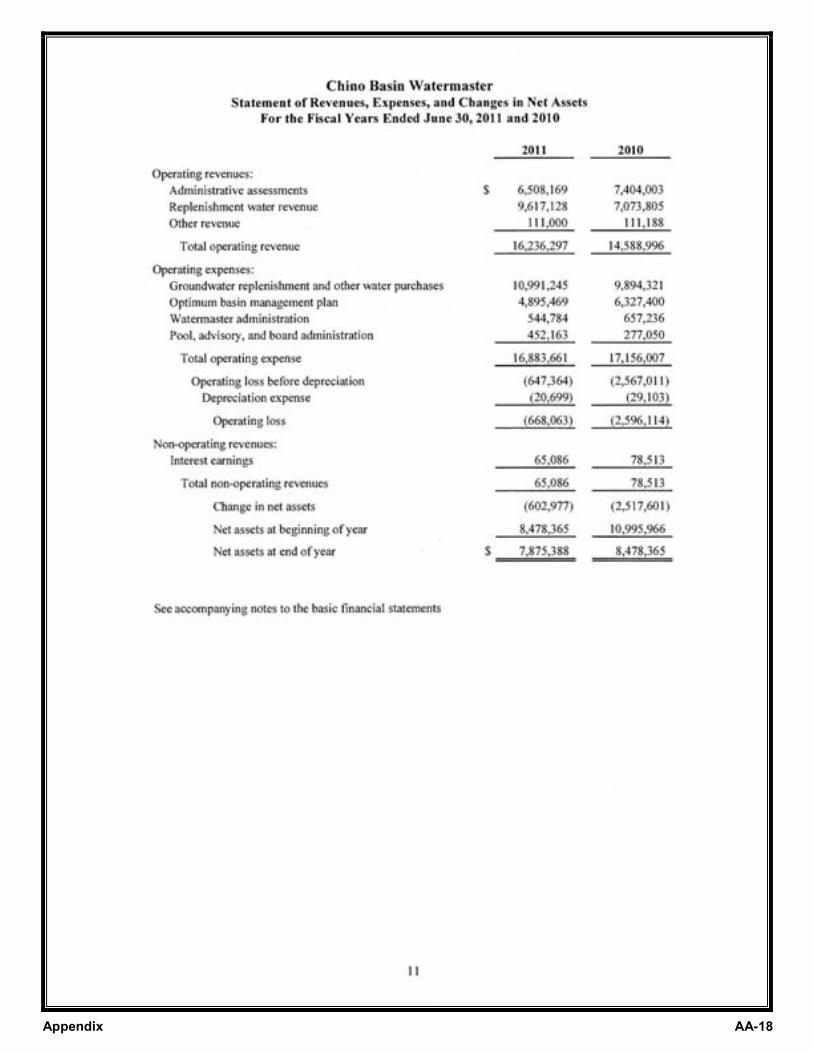
Appendix AA-18

Appendix AA-19
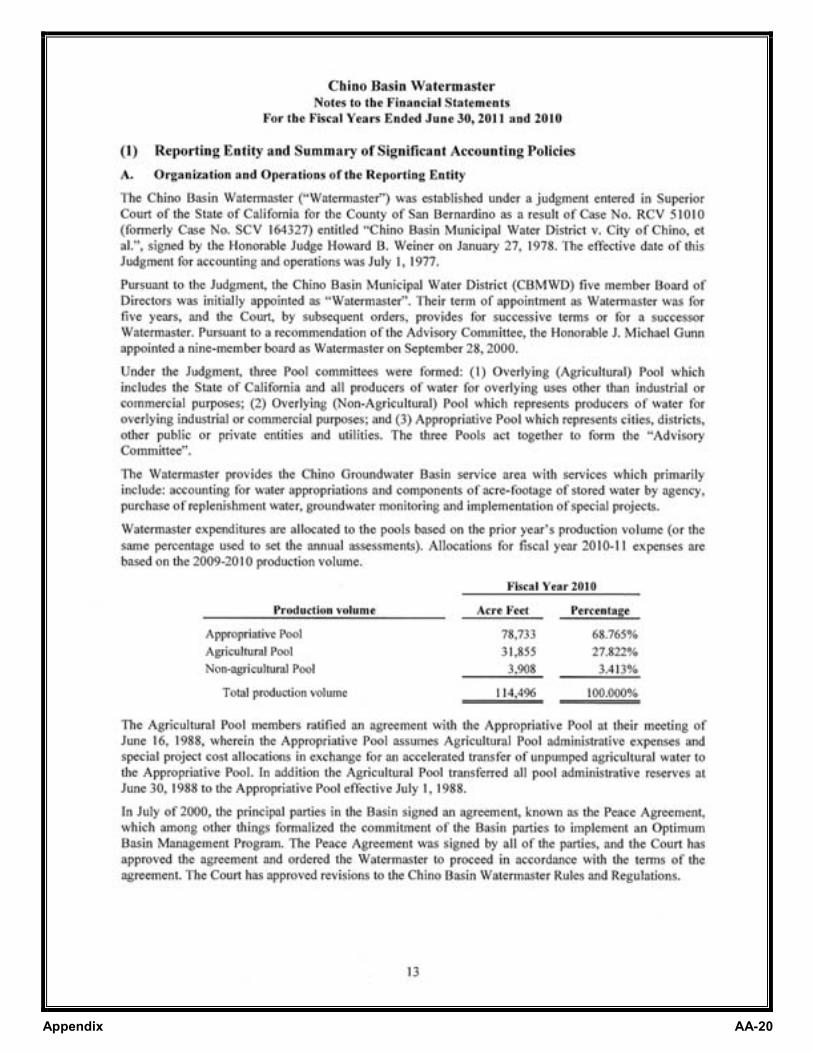
Appendix AA-20

Appendix AA-21

Appendix AA-22

Appendix AA-23
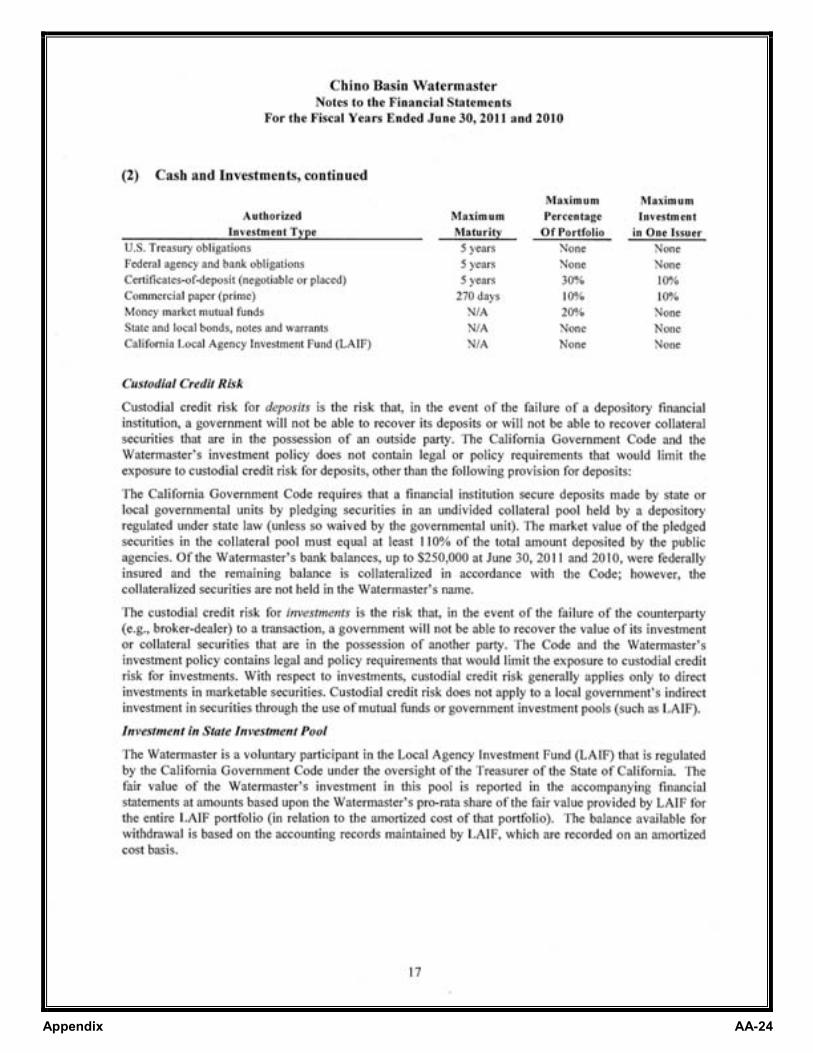
Appendix AA-24

Appendix AA-25
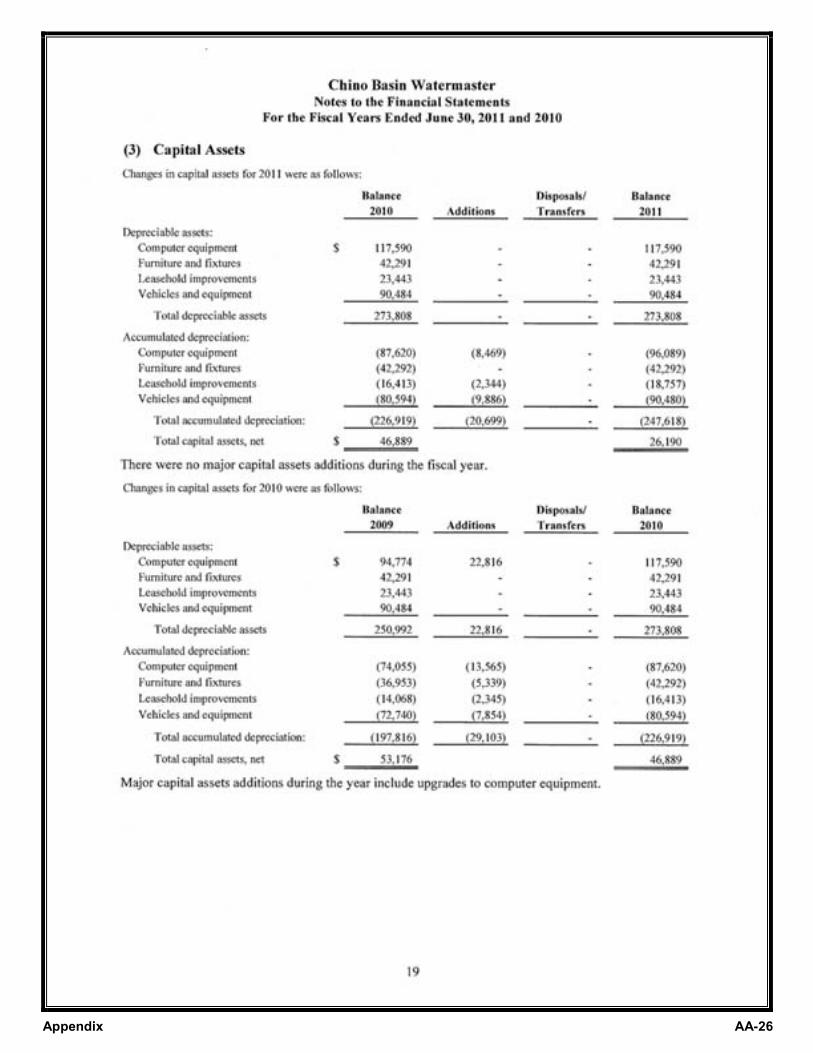
Appendix AA-26
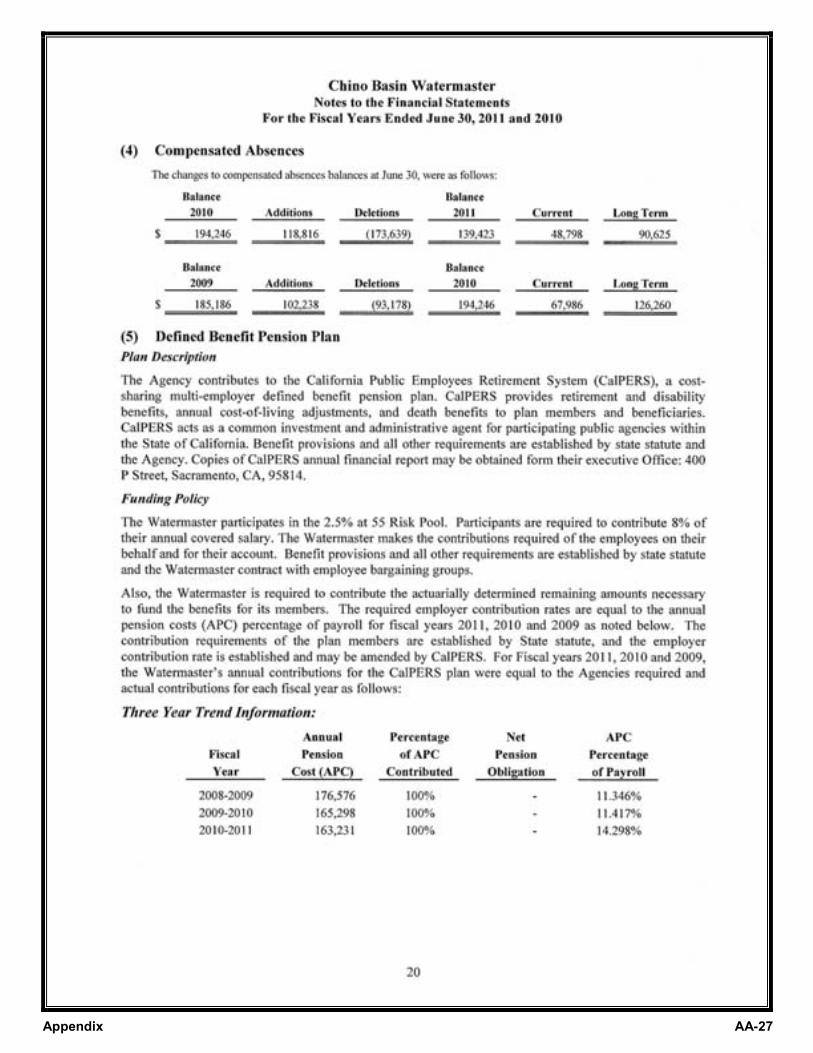
Appendix AA-27

Appendix AA-28
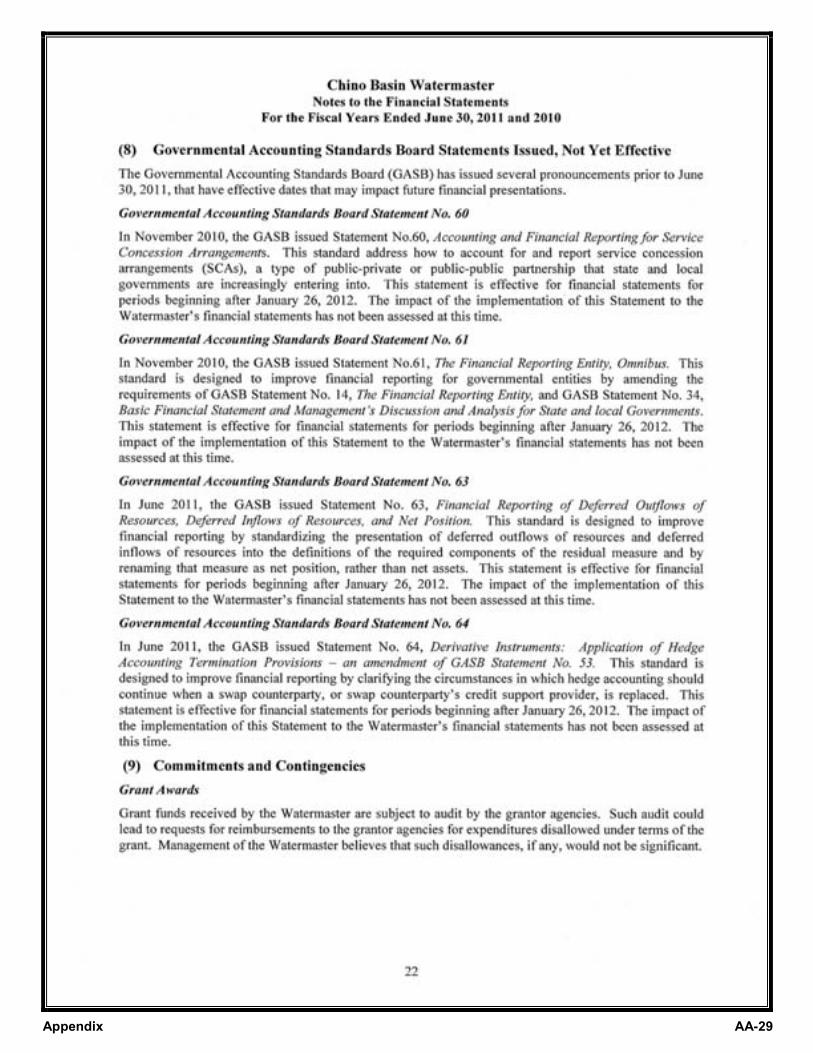
Appendix AA-29

Appendix AA-30
Appendix AA-31
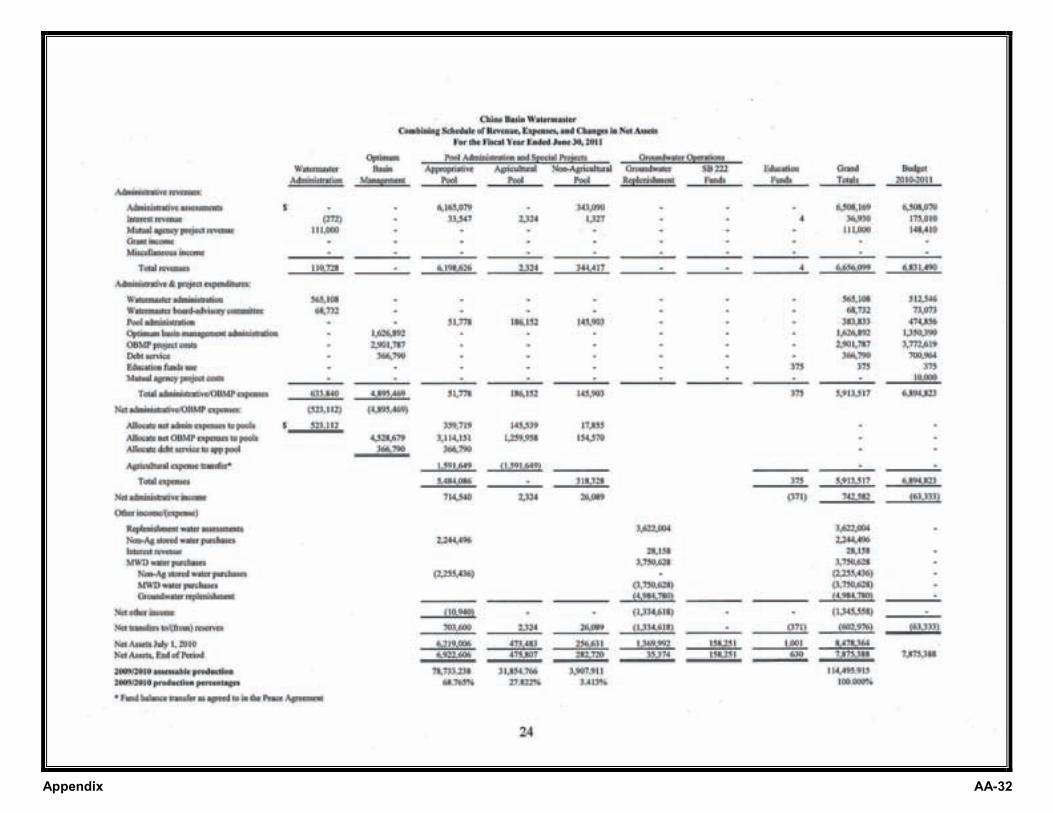
Appendix AA-32

Appendix AA-33
Appendix AA-34

Appendix AA-35
LEFT
INTENTIONALLY
BLANK

C H I NO BASI N WAT E R MAST E RA DJ U DIC AT E D B OU N DA RY
THIRTY- FOURTH ANNUAL REPORTFISCAL YEAR 2010-11
9641 San Bernardino Road • Rancho Cucamonga, CA 91730(909) 484-3888 • www.cbwm.org