Embed Size (px)
Citation preview
ASSET
PLAN2021-2031

Contents Contents ....................................................................................................................................... 2
The Asset Plan ............................................................................................................................. 6
Introduction ........................................................................................................................................................... 6
Community Engagement .................................................................................................................................... 6
The Assets .................................................................................................................................... 7
Roads ..................................................................................................................................................................... 7
Bridges and Major Culverts ................................................................................................................................. 7
Buildings and Other Structures .......................................................................................................................... 7
Footpaths and Pathways .................................................................................................................................... 8
Stormwater Drainage .......................................................................................................................................... 8
Recreation and Open Space ............................................................................................................................... 8
Summary of Assets .............................................................................................................................................. 8
Service Levels ........................................................................................................................... 10
Roads ................................................................................................................................................................... 10
Bridges and Major Culverts ............................................................................................................................... 10
Buildings and Other Structures ........................................................................................................................ 10
Footpaths and Pathways .................................................................................................................................. 11
Stormwater Drainage ........................................................................................................................................ 11
Recreation and Open Space ............................................................................................................................. 11
Hierarchy ............................................................................................................................................................. 12
Roads ......................................................................................................................................................... 12
Bridges and Major Culverts ...................................................................................................................... 13
Buildings, Recreation and Open Spaces .................................................................................................. 13
Footpaths and Pathways ........................................................................................................................... 15
Stormwater Drainage ................................................................................................................................ 15
Condition Assessments ..................................................................................................................................... 15
Stormwater Drainage ................................................................................................................................ 18
Recreation and Open Space ..................................................................................................................... 19
Demand and Capacity ............................................................................................................. 20
Financial Summary .................................................................................................................. 23
Current Costs ...................................................................................................................................................... 23
Future Costs ........................................................................................................................................................ 23
Roads ................................................................................................................................................................... 24
Sealed Roads ............................................................................................................................................. 24
Unsealed Roads ........................................................................................................................................ 24
Kerbs and Channels .................................................................................................................................. 25
Bridges and Major Culverts ............................................................................................................................... 25
Buildings .............................................................................................................................................................. 26
Footpaths and Pathways .................................................................................................................................. 26
Stormwater Drainage ........................................................................................................................................ 27
Recreation and Open Space ............................................................................................................................. 27
Unlimited fund service criteria 1 .............................................................................................................. 27
Unlimited fund-service criteria 2 .............................................................................................................. 28
Modelling Scenarios .......................................................................................................................................... 28
Life Cycle Costs......................................................................................................................... 31
The Asset Life Cycle ........................................................................................................................................... 31
Operations/Maintenance .......................................................................................................................... 31
Renewal ..................................................................................................................................................... 32
Upgrades .................................................................................................................................................... 33
Acquisition ................................................................................................................................................. 34
Expansion ................................................................................................................................................... 34
Disposal ..................................................................................................................................................... 35
Decommission ........................................................................................................................................... 35
Long Term Capex Plan ............................................................................................................ 36
Development of Long Term Capex Plan ......................................................................................................... 36
Prioritisation ........................................................................................................................................................ 36
Community Panel Recommendations ............................................................................................................ 36
Draft Long Term Capex Plan Expenditure ...................................................................................................... 38
Long Term Financial Projection ............................................................................................. 39
Tables
Table 1 Summary of Replacement cost by Asset Class ....................................................................... 9
Table 2 Road and related assets hierarchy ........................................................................................ 13
Table 3 Footpath hierarchy .................................................................................................................. 15
Table 4 Infrastructure asset condition ................................................................................................ 15

Table 5 Asset demand and capacity .................................................................................................... 20
Table 6 Historic maintenance expenditure ......................................................................................... 23
Table 7 Average annual renewal expenditure 2017 to 2019 ............................................................ 23
Table 8 Actual annual renewal expenditure v average annual demand ........................................... 28
Table 9 Proposed annual renewal expenditure v average annual demand ..................................... 29
Table 10 Long Term Capital Expenditure by Asset Class ..................................................................... 38
Table 11 Long Term Capital Expenditure by Project Type .................................................................... 38
Table 12 Projected operations, maintenance, capital renewal and capital new/upgrade ................ 39
Figures
Figure 1 Summary of assets .................................................................................................................... 9
Figure 2 Buildings, recreation and open spaces hierarchy ................................................................. 14
Figure 3 Seal Road condition profile 2018 .......................................................................................... 16
Figure 4 Unsealed Road condition profile 2018 .................................................................................. 16
Figure 5 Bridge and Major Culvert condition profile 2018 .................................................................. 17
Figure 6 Buildings and Other Structure condition profile 2021 .......................................................... 17
Figure 7 Footpath and Pathways condition profile 2018 .................................................................... 18
Figure 8 Stormwater Drainage condition profile 2019 ........................................................................ 18
Figure 9 Recreation and Open Space condition profile 2020 ............................................................ 19
Figure 10 Unlimited budget scenario for Sealed Roads ........................................................................ 24
Figure 11 Unlimited budget scenario for Unselaed Roads ...................................................................... 24
Figure 12 Unlimited budget scenario for Kerbs ..................................................................................... 25
Figure 13 Unlimited budget scenario for Bridges and Major Culverts .................................................. 25
Figure 14 Unlimited budget scenario for Buildings ................................................................................ 26
Figure 15 Unlimited budget scenario for Footpaths and Pathways ...................................................... 26
Figure 16 Unlimited budget scenario for Stormwater ............................................................................ 27
Figure 17 Unlimited budget scenario Service Criteria 1 Open Space condition profile ....................... 27
Figure 18 Unlimited budget scenario Service Criteria 2 Open Space condition profile ....................... 28
Figure 19 Proposed annual renewal expenditure v average annual demand and actual spend ....... 29
Figure 20 Impact on condition in 2041 .................................................................................................. 30
Figure 21 Projected operations and maintenance expenditure ............................................................ 32
Figure 22 Projected capital renewal expenditure .................................................................................. 33
Figure 23 Projected capital, operations and maintenance expenditure. ............................................. 40
Appendices

Appendix A Levels of Service
Appendix B Funding Prioritisation
Map of Horsham Rural City Municipality

The Asset Plan Introduction This Asset Plan has been prepared to provide information to the community about Council’s long-term approach to managing the assets Council holds in order to provide the range of services to the community.
The Asset Plan identifies the strategic and operational practices which will ensure that Council manages assets across their life cycle in a financially sustainable manner. The Asset Plan, and associated asset management policies provide Council with a sound base to understand the risk associated with managing its assets for the community’s benefit.
The Asset Plan integrates with the Long Term Financial Plan to inform Council’s strategic financial planning. This integration occurs through the identification of the amount of capital and maintenance expenditure that is required over the life of each asset category. The level of funding incorporates knowledge of asset condition, risk assessment, and the impact of reviewing and setting intervention and service levels for each asset class.
A key component of the Asset Plan is the Long Term Capex Plan (LTCP) which compiles the range of capital projects proposed for renewal, upgrade and new capital works over the next 10-year period.
In addition to identifying the operational and strategic practices that ensure that Council manages assets across their life cycle in a financially sustainable manner, the Asset Plan quantifies the asset portfolio and the financial implications of those practices.
Community Engagement This Asset Plan has been prepared to address the requirements of section 92 of the Local Government Act (2020), including the various phases of the asset life cycle listed in point (3)(a) of that section of the Act, and the requirement for deliberative engagement in the development of the Plan.
The deliberative engagement process included the establishment of a Community Panel, which developed the Community Vision, and provided recommendations to Council on the Council Plan, Long Term Financial Plan and Asset Plan. A later section of this document describes how Council will give effect to the recommendations from the Community Panel on this Plan.

The Assets Roads Council’s road network includes both urban roads within the townships and the rural roads outside the townships. Note that the main (arterial) roads within the municipality are managed by Regional Roads Victoria. These arterial roads can be distinguished as they are named with a route identifier (e.g. A8 is the Western Highway, C222 is the Northern Grampians Road).
The main components within the roads asset class are typically:
• sealed surfaces, pavements and kerbs in the urban areas
• sealed surfaces, pavements and shoulders for the rural sealed network
• unsealed pavements for the rural unsealed network.
Associated with this asset class are traffic control devices, signs, roundabouts, guideposts and delineators, on road bike paths, on-road and off-street car parking, line marking and raised pavement markers, guardrails, minor drainage structures and drains.
A summary of the road assets managed by Council is:
• 144 km of sealed urban roads
• 814 km of sealed rural roads
• 936 km gravel rural roads
• 1,006 km earthen rural roads
• 249 km kerb and channel (gutters)
• 48 car parks.
Bridges and Major Culverts Within the road network there are major structures that cross waterways including bridges, major culverts (defined as those larger than 375 mm diameter or box culverts of equivalent cross section) and footbridges and boardwalks.
There are 71 bridges/culverts of which 25 are bridges with piers and girders. Council’s largest bridges are the Wimmera River bridges at Polkemmet, Riverside and Drung Drung.
Buildings and Other Structures This asset class primarily includes buildings, but also includes several other structures such as retaining walls, shelters and swimming pools.
There are 167 buildings ranging from the Horsham Town Hall to community halls, kindergartens and many more.
Examples of some of the key other structures included in this category are Horsham Regional Livestock Exchange (HRLE), the Wimmera Intermodal Freight Terminal, Horsham Aquatic Centre, and the Aerodrome.

Footpaths and Pathways This asset class includes footpaths, tracks and trails and includes cycling paths, ramps, railing, signs and DDA (Disability Discrimination Act) and other non-slip surfacing.
Council manages 176.3 km of footpaths and pathways, of which:
• 29.6 km are link footpaths (F1 – refer hierarchy on p14)
• 31.08 km are collector footpaths (F2)
• 115.6 km are local footpaths (F3)
In addition, there is 64.5 km of bike paths.
Stormwater Drainage The urban stormwater drainage network includes underground pipes, open drains, pits and drainage structures including retention basins, litter traps and erosion structures. These assets are only found in the urban areas of Horsham and Natimuk, and at some key facilities, e.g. WIFT, Aerodrome, Horsham Regional Livestock Exchange (HRLE).
There are approximately 147.6 km of stormwater pipes and 4721 pits and headwalls included in the stormwater category.
Recreation and Open Space This asset class includes playgrounds, recreation reserves, parks and gardens, wetlands and trees. There is a vast range of asset types including, but not limited to, the following:
• Playground equipment and under surfacing.
• Recreation reserves including recreation playing surfaces, lighting and drainage together with fencingand irrigation systems.
• Parks and gardens including street and park furniture including seats, tables, bins, fixtures and signs.
• Wetlands.
• Trees in parks and street trees, garden beds, plants, shrubs, lawns and all included in open spacehowever are not categorised as assets from a financial perspective.
There are approximately 4,900 open space assets including 27 playgrounds and associated assets, recreational reserves, assets in the Botanic Gardens and various open space furniture around Horsham’s CBD.
Summary of Assets Each class of asset has been valued. The summary is provided in Table 1 together with an overall condition of the asset class.
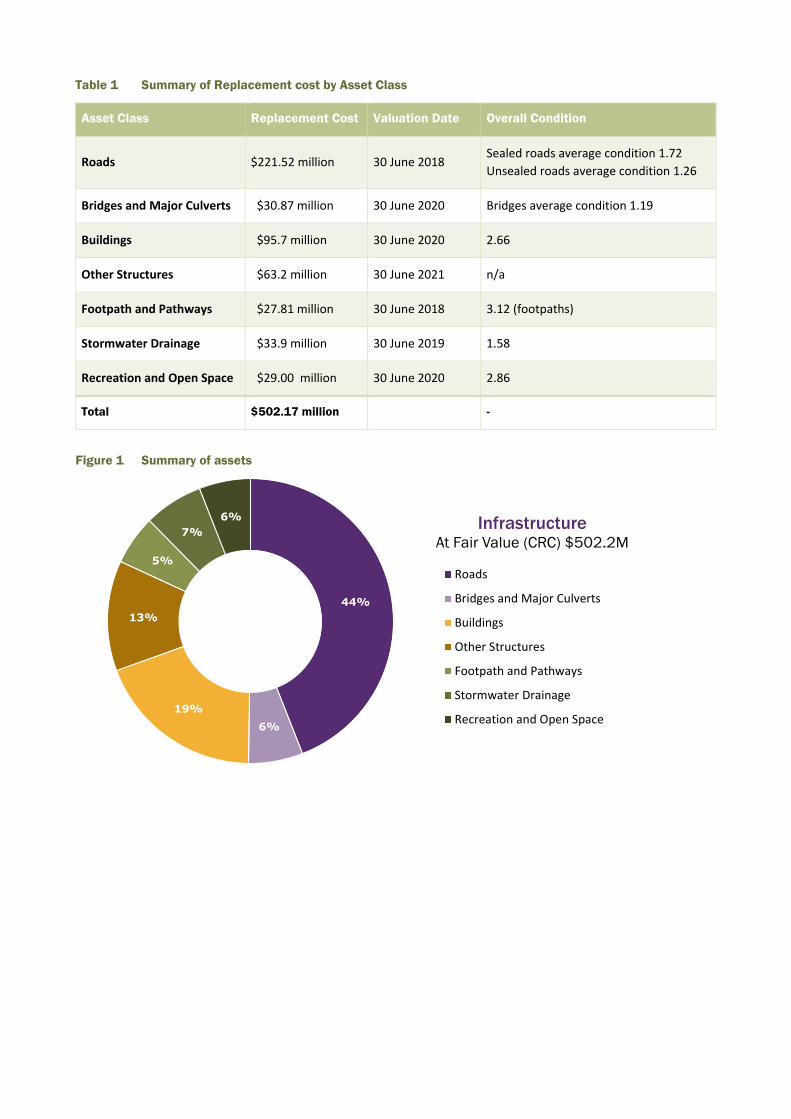
Table 1 Summary of Replacement cost by Asset Class
Asset Class Replacement Cost Valuation Date Overall Condition
Roads $221.52 million 30 June 2018 Sealed roads average condition 1.72 Unsealed roads average condition 1.26
Bridges and Major Culverts $30.87 million 30 June 2020 Bridges average condition 1.19
Buildings $95.7 million 30 June 2020 2.66
Other Structures $63.2 million 30 June 2021 n/a
Footpath and Pathways $27.81 million 30 June 2018 3.12 (footpaths)
Stormwater Drainage $33.9 million 30 June 2019 1.58
Recreation and Open Space $29.00 million 30 June 2020 2.86
Total $502.17 million -
Figure 1 Summary of assets
44%
6%19%
13%
5%
7%6% Infrastructure
At Fair Value (CRC) $502.2M
Roads
Bridges and Major Culverts
Buildings
Other Structures
Footpath and Pathways
Stormwater Drainage
Recreation and Open Space

Service Levels The fundamental purpose of Council’s assets is to provide services to the community. Council strives to provide infrastructure assets of a suitable standard that allows the community to function in its day-to-day activities and to meet community demands now and into the future.
From an asset management perspective, the principles used to achieve the desired service levels relate to setting the standards of construction and maintenance of the assets for their particular purpose. The sections below provide an overview of the service levels achieved from each asset class. A detailed description of service levels is included as Appendix A to this Plan.
There is a set of maintenance and construction standards established for each asset class which forms the basis of predicting the cost of providing services.
Fundamental to assigning a service level is a hierarchy classification, which has been established for each asset class. This hierarchy is used to setup the framework that drives decision making on the budget needed to ensure the asset provides the expected service level for the community. The asset hierarchy separates assets into groupings primarily based on importance and utilisation.
Assets with lower importance and utilisation will have a different service level expectation, which then relates to the funding allocated to the upkeep of that asset.
A visible example of this hierarchical approach is for roads, where there are clearly evident differences in the standards set for interstate highways compared to local access roads. The hierarchies for different asset classes is also discussed in this section of the Plan.
Roads Roads are constructed and maintained to be suited to the levels and types of traffic associated with their assigned hierarchy including consideration to travel width, vegetation clearance, ride comfort measured through roughness and the extent of street sweeping in urban areas. The principle service provided by roads is transport of goods and people.
Council conducts regular condition inspections to assess the need for maintenance or reconstruction of its roads. A significant proportion of Council’s asset management budget is committed to the ongoing renewal of roads to maintain them to their current construction standard. The Horsham Urban Transport Plan and the Rural Road Network Plan (currently under development) provide guidance to Council to consider upgrading sections of the network to meet the required standard. The ability to upgrade sections of roads is subject to available funding.
Bridges and Major Culverts Bridges and culverts are maintained to provide suitable access for vehicles using the road network. In some cases, bridges or culverts may not have the capacity to cater to larger, heavier trucks that are becoming more common in the municipality. This may lead to the need for some load limits on these structures, and for alternative routes to be used, until such time as the structures are able to be upgraded.
Buildings and Other Structures In contrast to roads, where the roads are effectively the service, buildings cater for a wide variety of Council’s services. Buildings are maintained to be fit for purpose for their allocated hierarchy, and having

regard for the specific needs of the services they host. This can mean that different buildings will have different maintenance needs and schedules.
As an example, a regional level facility, such as Horsham Town Hall, needs to be maintained to a higher standard than, say, a local community hall, as the expectations on the standard of presentation are higher.
Footpaths and Pathways Footpaths provide access primarily for pedestrians, but also increasing numbers of mobility assistance vehicles (gophers) and bicycles (for children). Shared pathways are also found in many open space areas.
Footpaths in residential areas are typically concrete, or pavers in some high pedestrian areas. Shared pathways have a range of surfaces.
The following principles have been adopted by Council for footpaths in Horsham:
• All streets should have a footpath on at least one side of the street.
• Some main routes should have a footpath on both sides of the street.
• In some places, there are footpaths that were constructed with a bitumen seal in about the 1950s thathave gradually disappeared. These will be replaced with concrete paths.
There is a backlog of streets that currently do not have footpaths that meet these principles. A program is in place to progressively install these missing sections of footpaths.
Footpath maintenance is also a key priority for Horsham, given the highly reactive (moving) soils that cause displacement in sections of footpaths. A major program to remedy these gaps has been in place over the past two years and will be continued to be rolled out.
Stormwater Drainage Drainage is necessary to remove excess rainfall from properties, roads and open spaces. The sub-surface drainage network starts with relatively small pipes (225 or 300 mm diameter) at the outer reaches of each local catchment. As the system progresses downslope, these pipes tend to increase in size, in Horsham reaching diameters of up to 1,200 mm before outfalling either to the Wimmera River or a series of basins. In several locations the water is reused to facilitate watering of open spaces, e.g. Wotonga Basin, Racecourse Reserve, Police Paddock basins. In other cases, the basins (wetlands) improve the quality of the drainage water to allow settling of solids and reduction of the nutrient load in the water before it reaches the Wimmera River. In Natimuk the drainage network outfalls to Natimuk Creek.
The target standard for the underground drainage systems is for them to be constructed to cope with a 1 in 5 year flood event and be maintained so drains are cleared annually or in response to blockages. Hydraulic modelling of the network is planned for the near future to review the capacity of the constructed system, and identify any gaps in the network (e.g. undersized pipes).
In rural areas, roads require a table drain to protect the road pavement from degradation due to waterlogging. The roadside drains are generally not intended to provide drainage of the adjoining paddocks. Maintenance of these roadside drains is required to ensure their continued effective performance.
Recreation and Open Space There are a myriad of assets that support Council’s recreation and open space services, ranging from sporting facilities to bench seats on walking paths.
Open space assets are inspected, cleaned and maintained to be fit for purpose for their allocated hierarchy.
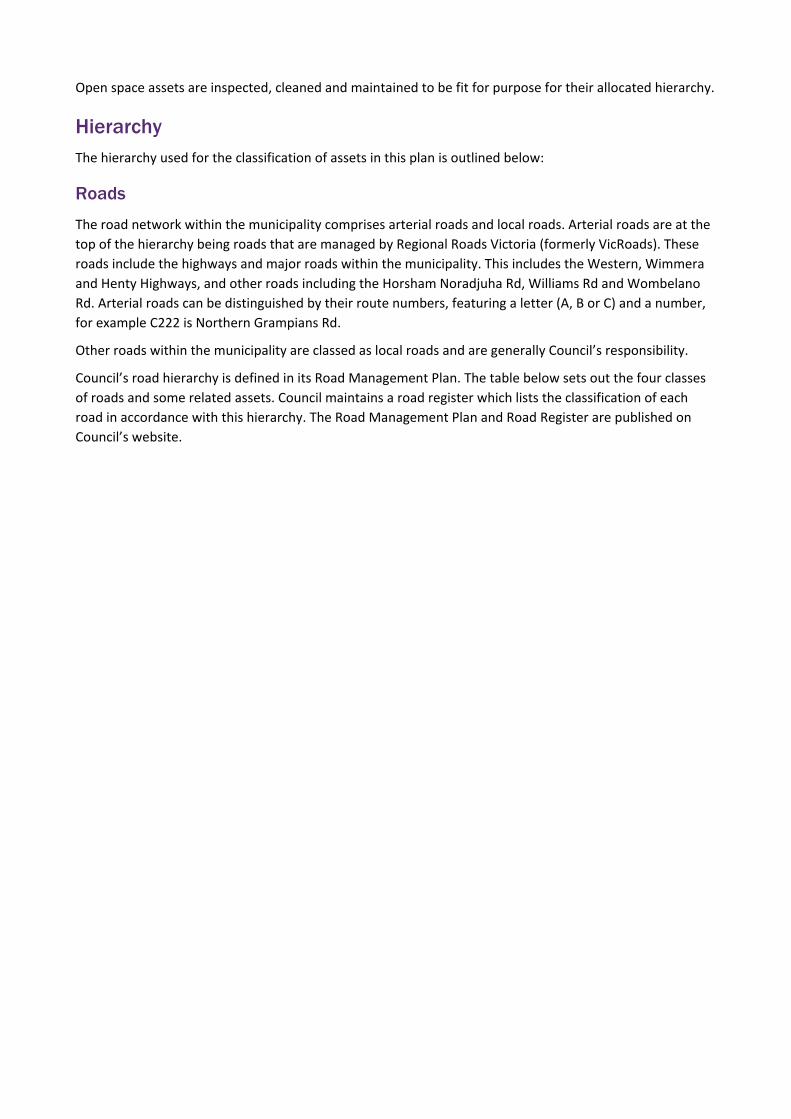
Hierarchy The hierarchy used for the classification of assets in this plan is outlined below:
Roads
The road network within the municipality comprises arterial roads and local roads. Arterial roads are at the top of the hierarchy being roads that are managed by Regional Roads Victoria (formerly VicRoads). These roads include the highways and major roads within the municipality. This includes the Western, Wimmera and Henty Highways, and other roads including the Horsham Noradjuha Rd, Williams Rd and Wombelano Rd. Arterial roads can be distinguished by their route numbers, featuring a letter (A, B or C) and a number, for example C222 is Northern Grampians Rd.
Other roads within the municipality are classed as local roads and are generally Council’s responsibility.
Council’s road hierarchy is defined in its Road Management Plan. The table below sets out the four classes of roads and some related assets. Council maintains a road register which lists the classification of each road in accordance with this hierarchy. The Road Management Plan and Road Register are published on Council’s website.

Table 2 Road and related assets hierarchy
Name Function Indicative Traffic Volume (VPD)
Link Roads other than arterial roads that link significant destinations and are designed for efficient movement of people and goods between and within regions. Also provide property access.
Rural > 100
Urban > 1000
Collector Roads other than arterial or link roads that provide movement of traffic within local areas and connect access roads to a substantial number of higher order roads. Also provide property access.
Rural 50 - 100
Urban 500 - 1000
Access Roads other than arterial, link or collector roads, that provide access to the street address of occupied properties.
Rural < 50
Urban < 500
Minor Roads other than arterial, link, collector or primary access roads that provide access to occupied property other than to the street address, or access to non-occupied abutting properties, and non-residential property.
Less than 50
Ancillary Area An area of land owned or managed by Council, maintained by a responsible road authority as ancillary to a public road.
Path A road reserve that contains a constructed pathway but does not contain a constructed or formed roadway.
Paper Road Road reserve not reasonably required for general public use
The Road Management Plan also provides details on the maintenance standards applicable to each level of road. Standard construction forms are described in the service levels appendix to this Plan (Appendix A).
Bridges and Major Culverts
The hierarchy level applicable for bridges and major culverts generally follows the standard of the road on which the structure is built. In addition, these structures need to have consideration for the (typically) waterway that they are built across, with larger bridges required on the major streams, and typically culverts on the smaller waterways.
Buildings, Recreation and Open Spaces
Buildings, recreation and open spaces share the same hierarchy which was developed in Council’s Social Infrastructure Framework, being classified into four groupings as follows in order of utilisation and importance to the community:
• Regional
• Municipal
• Neighbourhood
• Local.
This is explained in the following diagram.
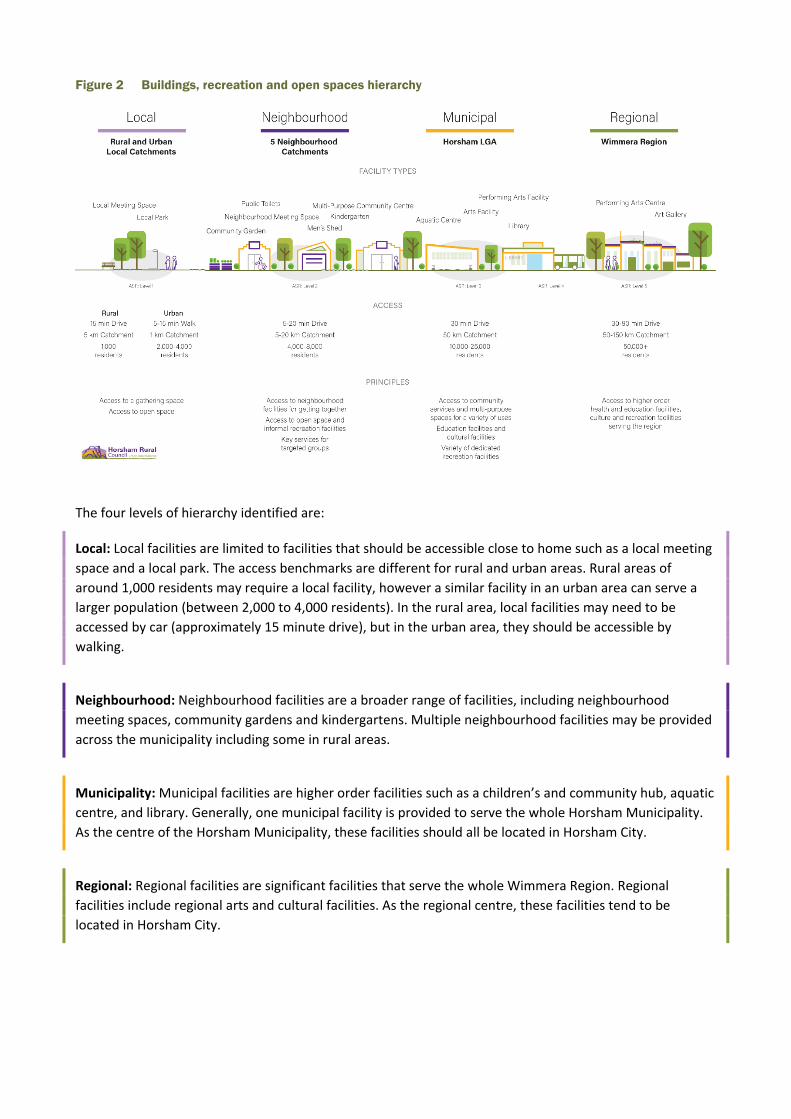
Figure 2 Buildings, recreation and open spaces hierarchy
The four levels of hierarchy identified are:
Local: Local facilities are limited to facilities that should be accessible close to home such as a local meeting space and a local park. The access benchmarks are different for rural and urban areas. Rural areas of around 1,000 residents may require a local facility, however a similar facility in an urban area can serve a larger population (between 2,000 to 4,000 residents). In the rural area, local facilities may need to be accessed by car (approximately 15 minute drive), but in the urban area, they should be accessible by walking.
Neighbourhood: Neighbourhood facilities are a broader range of facilities, including neighbourhood meeting spaces, community gardens and kindergartens. Multiple neighbourhood facilities may be provided across the municipality including some in rural areas.
Municipality: Municipal facilities are higher order facilities such as a children’s and community hub, aquatic centre, and library. Generally, one municipal facility is provided to serve the whole Horsham Municipality. As the centre of the Horsham Municipality, these facilities should all be located in Horsham City.
Regional: Regional facilities are significant facilities that serve the whole Wimmera Region. Regional facilities include regional arts and cultural facilities. As the regional centre, these facilities tend to be located in Horsham City.
Footpaths and Pathways
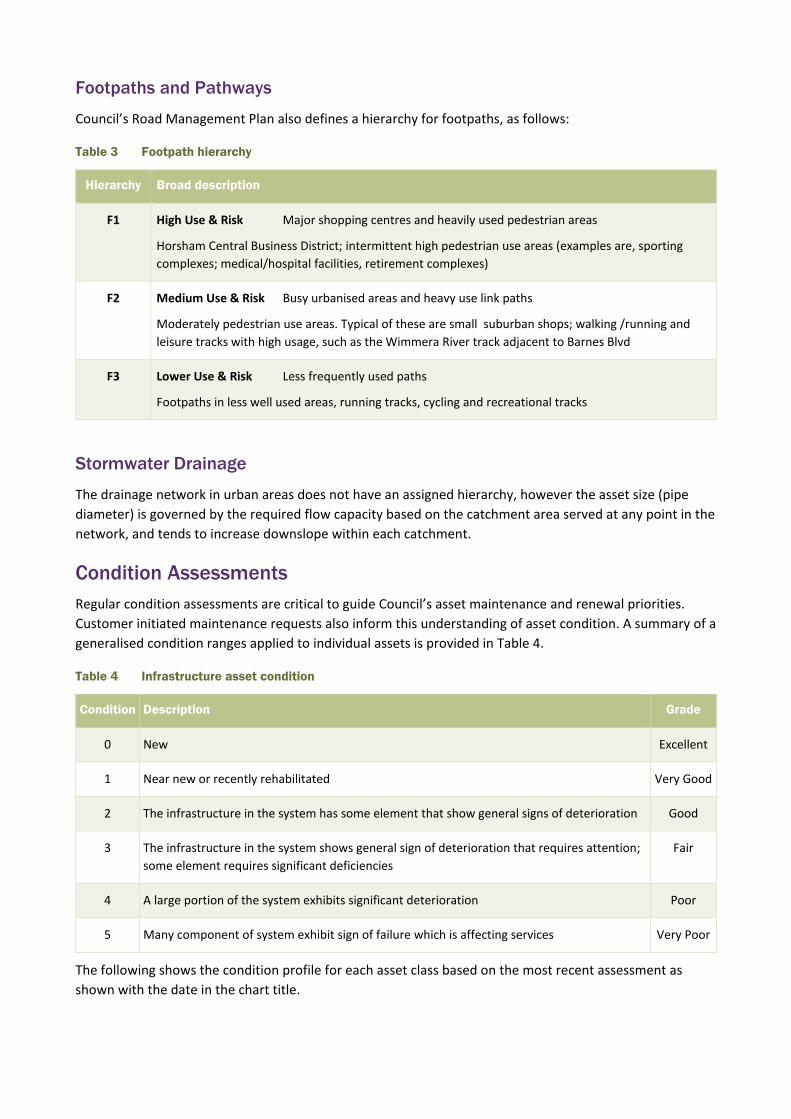
Council’s Road Management Plan also defines a hierarchy for footpaths, as follows:
Table 3 Footpath hierarchy
Hierarchy Broad description
F1 High Use & Risk Major shopping centres and heavily used pedestrian areas
Horsham Central Business District; intermittent high pedestrian use areas (examples are, sporting complexes; medical/hospital facilities, retirement complexes)
F2 Medium Use & Risk Busy urbanised areas and heavy use link paths
Moderately pedestrian use areas. Typical of these are small suburban shops; walking /running and leisure tracks with high usage, such as the Wimmera River track adjacent to Barnes Blvd
F3 Lower Use & Risk Less frequently used paths
Footpaths in less well used areas, running tracks, cycling and recreational tracks
Stormwater Drainage
The drainage network in urban areas does not have an assigned hierarchy, however the asset size (pipe diameter) is governed by the required flow capacity based on the catchment area served at any point in the network, and tends to increase downslope within each catchment.
Condition Assessments Regular condition assessments are critical to guide Council’s asset maintenance and renewal priorities. Customer initiated maintenance requests also inform this understanding of asset condition. A summary of a generalised condition ranges applied to individual assets is provided in Table 4.
Table 4 Infrastructure asset condition
Condition Description Grade
0 New Excellent
1 Near new or recently rehabilitated Very Good
2 The infrastructure in the system has some element that show general signs of deterioration Good
3 The infrastructure in the system shows general sign of deterioration that requires attention; some element requires significant deficiencies
Fair
4 A large portion of the system exhibits significant deterioration Poor
5 Many component of system exhibit sign of failure which is affecting services Very Poor
The following shows the condition profile for each asset class based on the most recent assessment as shown with the date in the chart title.
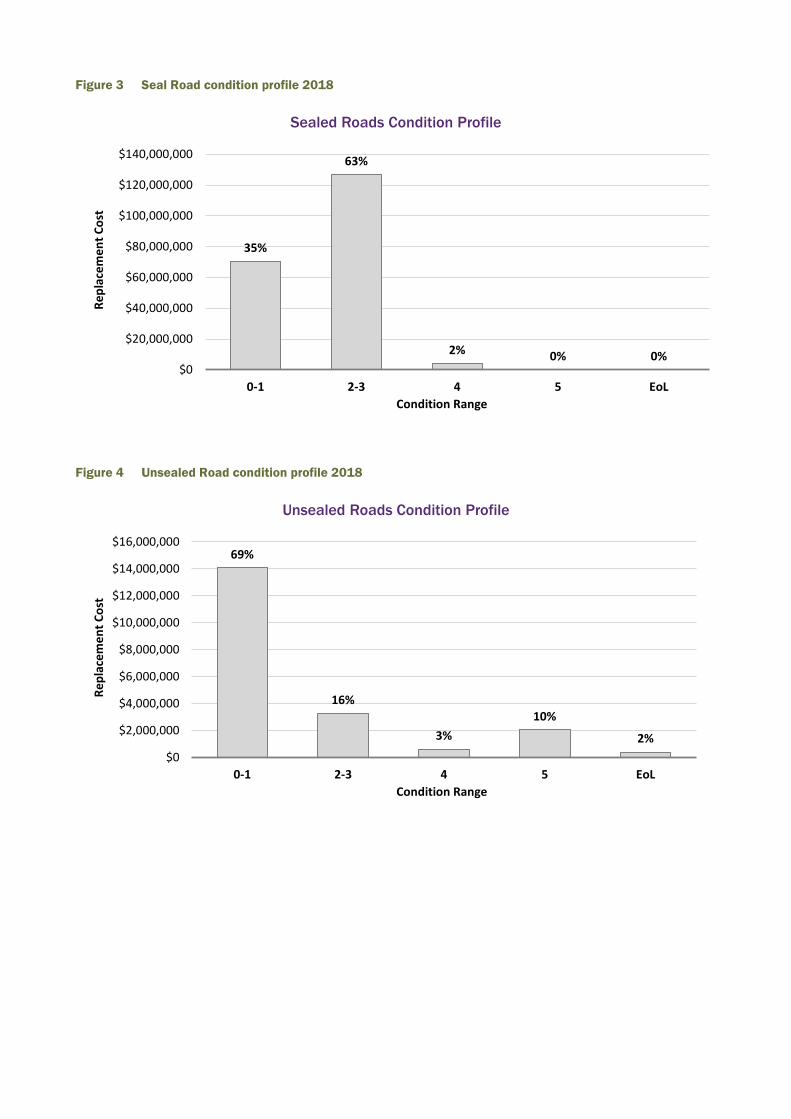
Figure 3 Seal Road condition profile 2018
Figure 4 Unsealed Road condition profile 2018
35%
63%
2% 0% 0%$0
$20,000,000
$40,000,000
$60,000,000
$80,000,000
$100,000,000
$120,000,000
$140,000,000
0-1 2-3 4 5 EoL
Repl
acem
ent C
ost
Condition Range
Sealed Roads Condition Profile
69%
16%
3%10%
2%$0
$2,000,000
$4,000,000
$6,000,000
$8,000,000
$10,000,000
$12,000,000
$14,000,000
$16,000,000
0-1 2-3 4 5 EoL
Repl
acem
ent C
ost
Condition Range
Unsealed Roads Condition Profile

Figure 5 Bridge and Major Culvert condition profile 2018
Figure 6 Buildings and Other Structure condition profile 2021
82%
18%
0% 0% 0%$0
$5,000,000
$10,000,000
$15,000,000
$20,000,000
$25,000,000
$30,000,000
0-1 2-3 4 5 EoL
Repl
acem
ent C
ost
Condition Range
Bridges and Major Culverts Condition Profile
7%
92%
1% 0% 0%$0
$10,000,000
$20,000,000
$30,000,000
$40,000,000
$50,000,000
$60,000,000
$70,000,000
$80,000,000
$90,000,000
0-1 2-3 4 5 EoL
Repl
acem
ent C
ost
Condition Range
Builidngs and Other Structures Condition Profile

Figure 7 Footpath and Pathways condition profile 2018
Stormwater Drainage
As the drainage network is buried it is not readily practicable to conduct regular inspections of the condition of drainage pipes. Council undertakes in-pipe CCTV inspections of some sections of the drainage network based on the identification of parts of the network that are performing poorly, and that are not responding to routine maintenance. The condition profile below is based on the percentage of actual age to predicted life converted to a consumption score.
Figure 8 Stormwater Drainage condition profile 2019
21%
35%
28%
14%
2%
$0
$2,000,000
$4,000,000
$6,000,000
$8,000,000
$10,000,000
$12,000,000
0-1 2-3 4 5 EoL
Repl
acem
ent C
ost
Condition Range
Footpath and Pathways Condition Profile
45%
51%
3% 1% 0%$0
$5,000,000
$10,000,000
$15,000,000
$20,000,000
$25,000,000
0-1 2-3 4 5 EoL
Repl
acem
ent C
ost
Condition Range
Stormwater Condition Profile

Recreation and Open Space
The condition of recreation and open space assets is primarily based on an extensive data collection exercise conducted in 2020. A detailed review is planned to ensure the integrity of this data. The graph below shows the condition profile based on the initial data collection.
Figure 9 Recreation and Open Space condition profile 2020
1%
93%
6%0% 0%
$0
$5,000,000
$10,000,000
$15,000,000
$20,000,000
$25,000,000
$30,000,000
0-1 2-3 4 5 EoL
Repl
acem
ent C
ost
Condition Range
Recreation and Open Space Condition Profile

Demand and Capacity The assets included in this plan are subject to a range of demand and capacity issues that will impact on the future funding necessary to maintain existing service levels or achieve desired service levels where they are not currently being met. The table below identifies some of the key issues being considered for inclusion in the upgrade plan.
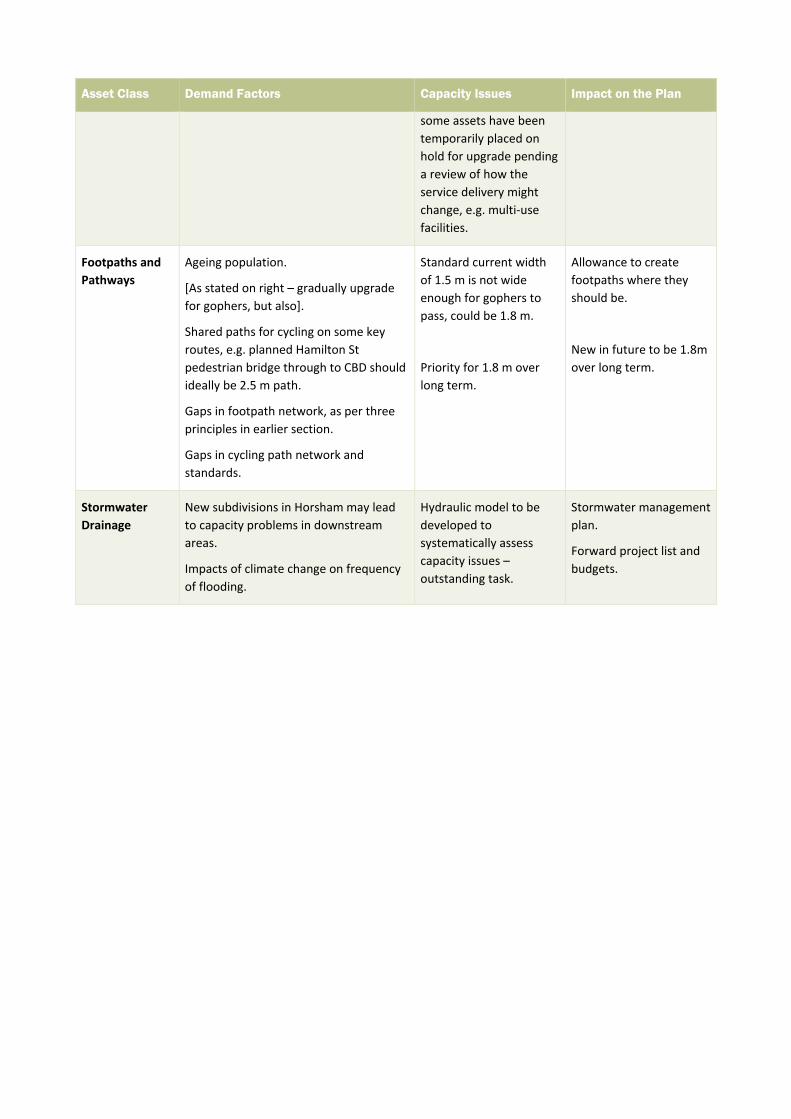
Table 5 Asset demand and capacity
Asset Class Demand Factors Capacity Issues Impact on the Plan
Roads Priority freight routes to be upgraded to 6.2 m seal.
Preferred routes for farm machinery being identified through the Rural Road Network Plan, to provide wider roads with a clear tree envelope, and avoid mixing slow moving farm machinery with other traffic.
Urban areas, improved safety for cyclists and pedestrians.
Alternative truck route to take trucks out of Horsham CBD, and link the three main highways that run through Horsham.
Other needs as identified in Horsham Urban Transport Plan (completed) and Rural Road Network Plan (in preparation).
Seal width less than 6.2m
99.5 km of roads need to be widened
• 51.5 km of link roadsfrom < 4 m to 6.2 m
• 48 km of collectorroads to be convertedto link roads
Achieve seal width of 6.2m and 1m gravel shoulder subject to business case.
Bridges and Major Culverts
Increase in use of heavy vehicles, requiring capacity upgrade.
Increased use of wide farm machinery.
Resilience to major events – increased capacity of culverts to avoid wash-outs during floods.
Wide farm machinery.
Three major crossings of Wimmera River on Council roads.
Allowance for retrofit to meet current standards.
Many bridges designed to old design standards.
Reduce bridges to single lanes.
Buildings and Other Structures
Single use, greater utilisation needed.
Intervene when in better condition and before they deteriorate too much.
Redundant buildings (what to do with them).
Equity of standards across municipality, through Social Infrastructure Framework. Gaps in service level to drive upgrade program.
For each hierarchy of building assets, Council has defined the minimum and desirable service level. For a subset of 50 high priority buildings, gaps against the service level have been identified which are scheduled to be upgraded over a 10 year period. Upgrades of
Social Infrastructure – 50 high priority and cost needed to develop service level gap to inform the upgrade plan
Asset Class Demand Factors Capacity Issues Impact on the Plan
some assets have been temporarily placed on hold for upgrade pending a review of how the service delivery might change, e.g. multi-use facilities.
Footpaths and Pathways
Ageing population.
[As stated on right – gradually upgrade for gophers, but also].
Shared paths for cycling on some key routes, e.g. planned Hamilton St pedestrian bridge through to CBD should ideally be 2.5 m path.
Gaps in footpath network, as per three principles in earlier section.
Gaps in cycling path network and standards.
Standard current width of 1.5 m is not wide enough for gophers to pass, could be 1.8 m.
Priority for 1.8 m over long term.
Allowance to create footpaths where they should be.
New in future to be 1.8m over long term.
Stormwater Drainage
New subdivisions in Horsham may lead to capacity problems in downstream areas.
Impacts of climate change on frequency of flooding.
Hydraulic model to be developed to systematically assess capacity issues – outstanding task.
Stormwater management plan.
Forward project list and budgets.
Asset Class Demand Factors Capacity Issues Impact on the Plan
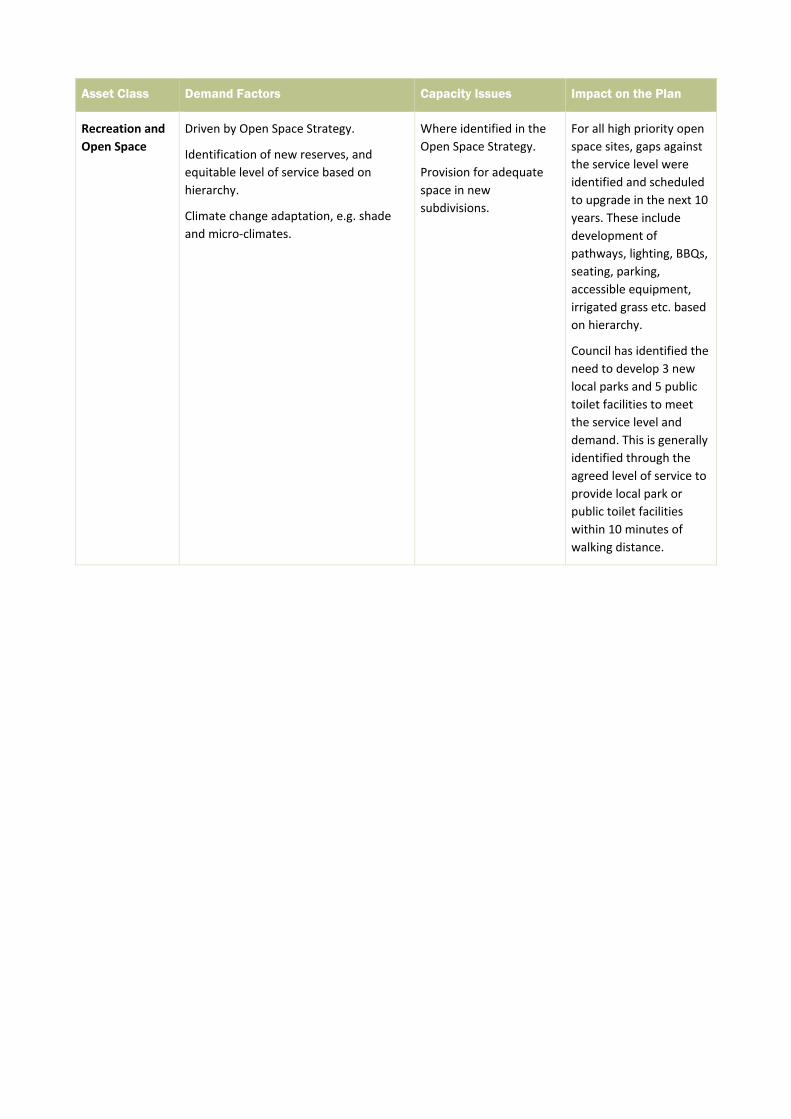
Recreation and Open Space
Driven by Open Space Strategy.
Identification of new reserves, and equitable level of service based on hierarchy.
Climate change adaptation, e.g. shade and micro-climates.
Where identified in the Open Space Strategy.
Provision for adequate space in new subdivisions.
For all high priority open space sites, gaps against the service level were identified and scheduled to upgrade in the next 10 years. These include development of pathways, lighting, BBQs, seating, parking, accessible equipment, irrigated grass etc. based on hierarchy.
Council has identified the need to develop 3 new local parks and 5 public toilet facilities to meet the service level and demand. This is generally identified through the agreed level of service to provide local park or public toilet facilities within 10 minutes of walking distance.

Financial Summary Current Costs Council’s current cost profile for managing all asset classes is presented separately as maintenance / operations and renewal.
The maintenance costs over the last three years are presented in the table below:
Table 6 Historic maintenance expenditure
2017/18 2018/19 2019/20
$6,161,009 $6,366,447 $6,117,862
The renewal costs reflect an average of the last three financial years.
Table 7 Average annual renewal expenditure 2017 to 2019
Renewal
Roads $3,950,000
Bridges and Major Culverts $100,000
Buildings $290,000
Footpaths and Pathways $150,000
Stormwater Drainage $135,000
Recreation and Open Space $100,000
Total $4,870,000
Future Costs Modelling has been undertaken for up to a 100-year period for each asset class to estimate the financial demands for renewal funding balancing short life and long life assets using the data that is available. The modelling also splits roads into several key elements / categories (including sealed and unsealed roads, and kerb and channel).
The modelling tool has been configured so that the standard life and condition at end of life can be varied so that assets can be renewed when they reach those intervention levels. The purpose of the modelling is to provide an estimate for each asset class on what the demand on funding is by applying unlimited funding. This is based on a set of assumptions and provides an indication both on how the funding demand varies with time and on how the certain asset classes may have spikes in funding demand.

For this Asset Plan the longer-term average funding requirement has been reported together with the time-based funding profile generated by the model. While both figures are based on the best available information there is ongoing work to refine assumptions and balance funding and service levels and affordability.
Roads Sealed Roads
The sealed road network has been modelled assuming resealing at $5.5/m2 and road reconstruction for rural roads of $30/m2 and $75/m2 for urban. The average annual budget required is $4.4M based on intervening when the condition reaches 5.
Figure 10 Unlimited budget scenario for Sealed Roads
Unsealed Roads
The unsealed road network has been modelled assuming gravel resheeting at $6/m2. The average annual budget required is $1.12M based on intervening when the condition reaches 5.
Figure 11 Unlimited budget scenario for Unselaed Roads
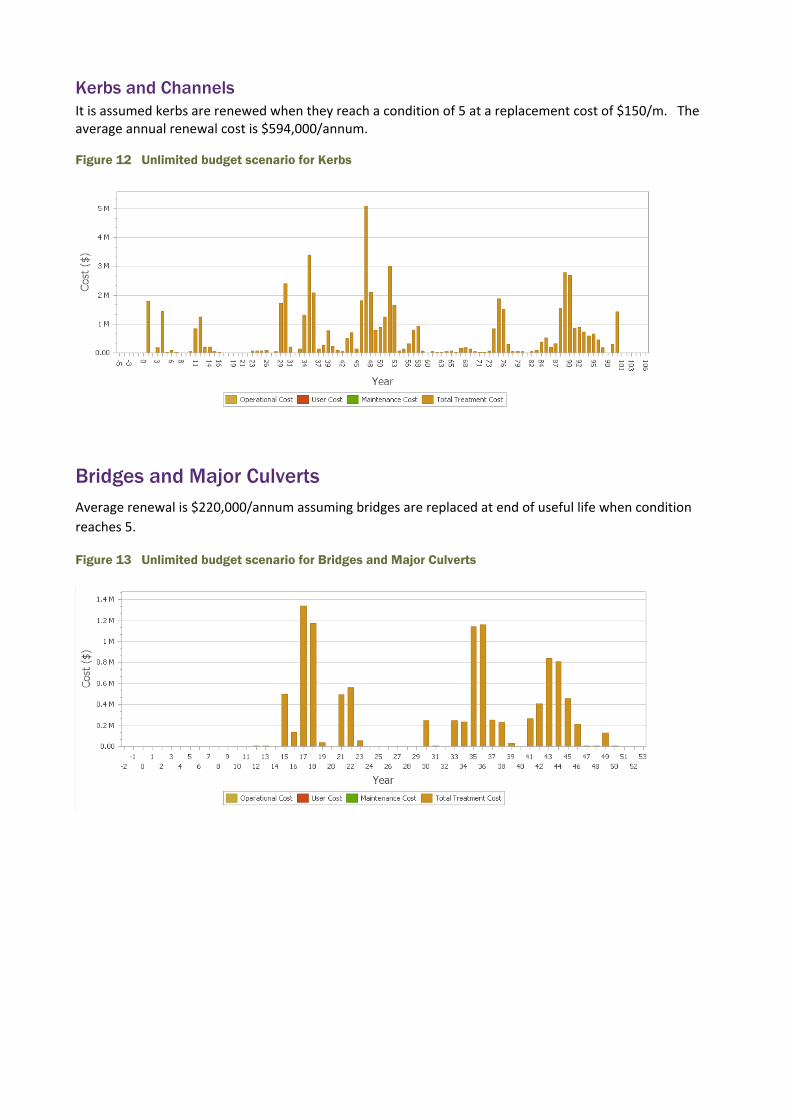
Kerbs and Channels It is assumed kerbs are renewed when they reach a condition of 5 at a replacement cost of $150/m. The average annual renewal cost is $594,000/annum.
Figure 12 Unlimited budget scenario for Kerbs
Bridges and Major Culverts Average renewal is $220,000/annum assuming bridges are replaced at end of useful life when condition reaches 5.
Figure 13 Unlimited budget scenario for Bridges and Major Culverts

Buildings The buildings have been modelled so they are renewed at different condition levels based on their hierarchy. The average annual renewal in $4.2 million/annum.
Figure 14 Unlimited budget scenario for Buildings
No modelling has been undertaken on other structures associated with Council land except for open space.
Footpaths and Pathways Assumption that assets reach a condition of 5 or end of life in 100 years. The average annual budget required is $329,000/annum.
Figure 15 Unlimited budget scenario for Footpaths and Pathways

Stormwater Drainage It is assumed pipes have an 80-year life and are renewal when they reach that age. The average annual renewal is $665,000/ annum.
Figure 16 Unlimited budget scenario for Stormwater
Recreation and Open Space Two alternative scenarios are presented which provide insight into the types of scenarios that can be adopted for managing these assets, the difference being the level at which the regional and municipal assets are renewed. This modelling helps inform the understanding of the levels of service that may be affordable.
Unlimited fund service criteria 1
Regional and municipal asset renew when reaches condition 3; Neighborhood asset renew when condition 4 and local asset renew when condition reaches to 5.
Figure 17 Unlimited budget scenario Service Criteria 1 Open Space condition profile
Average annual fund required is $2.42M.

Unlimited fund-service criteria 2
Regional and Municipal assets intervention at condition 4; and neighborhood and local assets- intervention at condition 5.
Figure 18 Unlimited budget scenario Service Criteria 2 Open Space condition profile
Average annual fund required is $1.92 M.
Modelling Scenarios The above charts are based on the current data sources which require improvement to better forecast renewal for specific years. These data sets will require review and refinement in methodologies to better predict end of useful life and will be part of regular review and updates and part on an improvement plan.
Accordingly for the purposes of this plan, in order to even out spending an overall average expenditure for renewal has been determined based on attempting to reduce the deterioration of the asset base, recognising the uneven nature of the unlimited budget scenarios presented above.
The table below shows the current theoretical funding gap between demand from the average unlimited funding model and current renewal spending.
Table 8 Actual annual renewal expenditure v average annual demand
Current Demand Theoretical Gap
Roads $4,095,000 $6,114,000 -$2,019,000
Bridges and Major Culverts $100,000 $220,000 -$120,000
Buildings $290,000 $4,200,000 -$3,910,000
Footpaths and Pathways $150,000 $329,000 -$179,000
Stormwater Drainage $135,000 $665,000 -$530,000
Recreation and Open Space $100,000 $1,920,000 -1,820,000
Total $4,870,000 $13,448,000 -$8,578,000
The table below shows the proposed increase in renewal funding to reduce the funding gap.

Table 9 Proposed annual renewal expenditure v average annual demand
Proposed Demand Theoretical Gap
Roads $4,645,000 $6,114,000 -$1,469,000
Bridges and Major Culverts $100,000 $220,000 -$120,000
Buildings $775,000 $4,200,000 -$3,425,000
Footpaths and Pathways $150,000 $329,000 -$179,000
Stormwater Drainage $135,000 $665,000 -$530,000
Recreation and Open Space $200,000 $1,920,000 -1,720,000
Total $6,005,000 $13,448,000 -$7,443,000
The modelling to project the condition of each asset under the funding scenarios to 2041 is shown below.
Figure 19 Proposed annual renewal expenditure v average annual demand and actual spend
$-
$500,000
$1,000,000
$1,500,000
$2,000,000
$2,500,000
$3,000,000
$3,500,000
$4,000,000
$4,500,000
$5,000,000
Footpath SealedRoads
UnsealedGravelled
Roads
Kerbs Drainage Buildings OpenSpaces
Bridges
Funding Profile
Spending theoretical demand Spending Current Spending Increase
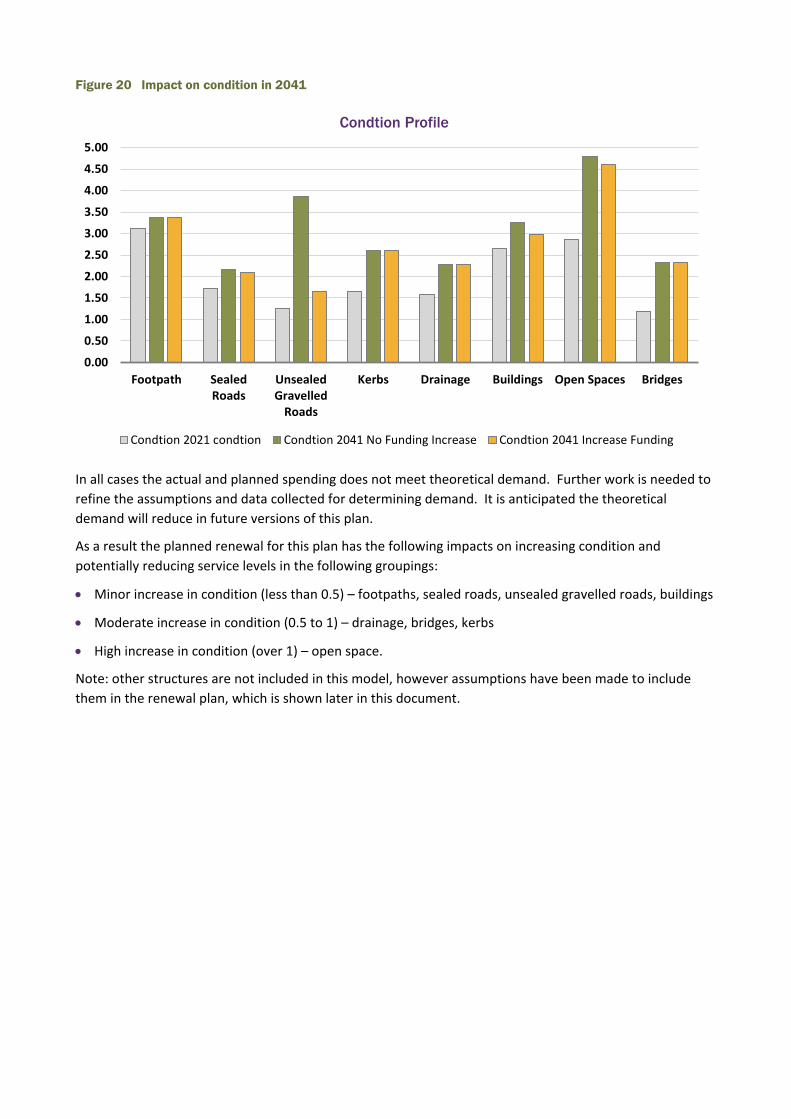
Figure 20 Impact on condition in 2041
In all cases the actual and planned spending does not meet theoretical demand. Further work is needed to refine the assumptions and data collected for determining demand. It is anticipated the theoretical demand will reduce in future versions of this plan.
As a result the planned renewal for this plan has the following impacts on increasing condition and potentially reducing service levels in the following groupings:
• Minor increase in condition (less than 0.5) – footpaths, sealed roads, unsealed gravelled roads, buildings
• Moderate increase in condition (0.5 to 1) – drainage, bridges, kerbs
• High increase in condition (over 1) – open space.
Note: other structures are not included in this model, however assumptions have been made to include them in the renewal plan, which is shown later in this document.
0.00
0.50
1.00
1.50
2.00
2.50
3.00
3.50
4.00
4.50
5.00
Footpath SealedRoads
UnsealedGravelled
Roads
Kerbs Drainage Buildings Open Spaces Bridges
Condtion Profile
Condtion 2021 condtion Condtion 2041 No Funding Increase Condtion 2041 Increase Funding
Life Cycle Costs The Asset Life Cycle Planning for the long-term management of assets requires consideration of the various phases of an asset’s life. An informed approach to the understanding of these phases helps in decision-making to optimise expenditure on assets. This section of the Asset Plan documents key information on the phases in the asset life cycle for each asset class where relevant.
Operations/Maintenance
Operations expenditure is incurred on assets that require regular and ongoing activities to service and clean assets so that they continue to deliver the services expected by the community. This includes the development of systems and processes needed the help manage assets in a systematic way.
Maintenance is driven by Council’s approach to inspecting assets and identifying defects and planning rectification works in line with set intervention and service levels. Council is also responsive to community requests. Council strives to be proactive in planning and delivering programmed maintenance works and is also responsive to issues identified in a more reactive manner.
Historic maintenance costs from 2017-18, to 2019-20 have averaged $6.22 million per year. For the purpose of this plan $6.638 million has been adopted for year 2021-22 and a 1.5% indexation has been allowed for each subsequent year.
Allowance has not been made for the increase in maintenance cost in time because of the introduction of new assets. Consideration in future versions of this plan will look at the impact on the increase in maintenance cost for new assets for growth or to meet demand.

Figure 21 Projected operations and maintenance expenditure
Renewal
Asset renewal is driven by a condition-based assessment process which considers the useful life of the assets with consideration to their utilisation and service level. The utilisation is represented in the asset hierarchy. Council has developed a rigorous approach to regularly inspecting assets and predicting their remaining life. When assets reach end of life they are programmed and budgeted for replacement with the most appropriate treatment (considering whole-of-life costs) to ensure the asset continues to provide the required services to the community.
This plan has been developed based on the assumptions included in the modelling with the inclusion of other structures and allowances for escalation. This funding level, which is an increase from historic levels, is considered appropriate recognising the overall condition in the future will be deteriorate further then today.
By doing this the majority of assets are maintained to be serviceable and are treated prior to them reaching an unserviceable condition.
The allocation of funding for renewal should be sustained to maintain service levels. An annual CPI index of 1.5% is included.
$0
$1,000,000
$2,000,000
$3,000,000
$4,000,000
$5,000,000
$6,000,000
$7,000,000
$8,000,000
2021-22 2022-23 2023-24 2024-25 2025-26 2026-27 2027-28 2028-29 2029-30 2030-31
Expe
nditu
re
Financial Year
Projected Operations and Maintenance Expenditure
Roads Bridges and Major Culverts Buildings and Other Structures
Footpath and Pathways Stormwater Drainage Recreation and Open Space

Figure 22 Projected capital renewal expenditure
Upgrades
Upgrades are driven by the need to increase the capacity of assets to cope with the current or emerging need or demand of the community.
Council has developed a systematic approach to these upgrades, based on definition of standard service levels to be provided from assets, and reflecting the hierarchy of assets in each asset class. The gaps between the current and desired service levels is a key driver of planned asset upgrades in the roads, bridges, buildings and open space asset classes.
A second driver for upgrades is the range of strategies developed by Council which identify changes to existing services or in some cases new services that Council aims to provide. These strategies may identify either upgrades or new asset requirements.
The proposed expenditure profile in response to the demand drivers can be summarised as follows:
• Roads – deficiencies in road width on freight corridors is driving the road upgrade plan.
• Bridge and Major Culverts – with increases in heavy vehicles, bridges need to be assessed againstcurrent bridge codes and upgraded for future demand. In the meantime, strategies to manage the riskto road users are being considered.
• Buildings and Other Structures – in response to driving economic development in the region considerinvestment is planned for the Wimmera Intermodal Freight Terminal, Horsham Regional LivestockExchange, Aerodrome and Aquatic Centre.
• Footpath and Pathways - in response to demand drivers for having footpaths on both sides of the streeton main routes, improving pedestrian access to key destinations, and increasing shared paths, allowanceis made for significant expansion of the footpath network.
$0
$2,000,000
$4,000,000
$6,000,000
$8,000,000
$10,000,000
$12,000,000
$14,000,000
2021-22(incl.
Backlog)
2022-23 2023-24 2024-25 2025-26 2026-27 2027-28 2028-29 2029-30 2030-31
Expe
nditu
re
Financial Year
Projected Capital Renewal Expenditure
Roads Bridges and Major Culverts Buildings and Other Structures
Footpath and Pathways Stormwater Drainage Recreation and Open Space

• Stormwater Drainage – the perceived demand for stormwater upgrade is low and limited funding isallocated to stormwater. New subdivisions will be required to incorporate detention systems that do notincrease the discharge from the historic land use into the drainage system.
• Recreation and Open Space – this upgrade plan is driven by the work undertaken in the City to RiverMaster Plan where a review of the facilities needed on each site has been undertaken to determinerequirements for upgrade existing access and or adding new assets.
The timing of works will be driven by availability of funding and projects will be prioritised in accordance with documented methodologies included in the Long Term Capex Plan, presented later in this document.
Upgrades will impact the future depreciation and sustainability of the Council as the more assets it has the more money is needed to manage them together with increases in depreciation. This is being factored into the development of the Long Term Financial Plan so that there is a balance between demand and financial sustainability.
Acquisition
Council has an established a policy principle to evaluate refurbishment of appropriate Council assets before construction of new facilities (refer 2020-24 Council Plan). The recommendations from the deliberative engagement by the Community Panel in 2021 are re-shaping that approach. This is discussed in the section in this document on the Long Term Capex Plan
In some cases, to deliver a new or upgraded service as identified in a strategy, Council may need to either acquire land or a developed property to achieve the planned outcome. Acquisition of these assets will be through normal commercial processes and based on a business case assessed by Council (subject to the level of expenditure / officer delegations).
Council owns an extensive collection of art. Art acquisitions are a distinct class of asset governed by a specific policy developed for this specialised area.
Expansion
Horsham is experiencing only limited growth with an annual population increase of around 0.2%. As a result, expansion of Horsham’s urban area is occurring at a slow-modest pace in the foreseeable future.
New urban areas are developed by private investors, who are responsible for the creation of new assets to service their developments, e.g. roads, footpaths, drains and drainage basins (wetlands), lighting, water supply, sewerage and more.
Council manages this expansion by requiring compliance with a set of infrastructure standards, known as the Infrastructure Design Manual (and the Sustainable Infrastructure Guidelines – which are under development), which has been adopted by many councils across rural Victoria. Council both reviews the submitted plans and oversees works to ensure the developments are constructed to these standards.
On completion of the works, many of these assets are then “gifted” to Council, which then takes on the ongoing maintenance and renewal responsibility. Assets typically gifted to Council include roads, kerb and channel, footpaths, drainage (including wetlands) and open space. Other assets may be gifted to various utilities, e.g. GWMWater.

Details of proposed expenditure to upgrade the asset base to meet the future demands is included in the section on the Long Term Capex Plan.
Disposal
Where assets are obsolete to current and future requirements, Council can plan to dispose of asset no longer meeting a community need, and by doing so ensure that Council only manages assets that are required by the community.
Council maintains an asset disposal policy to ensure that good value is obtained from any disposal of assets and that transparent processes are used in the disposal.
Decommission
Decommissioning is the final stage of the asset lifecycle.
Planning for decommissioning is often done as part of the initial planning of a new project, so that any asset that may no longer be required on completion of a new project or change to service can be identified and its future determined. Assets may also be decommissioned in other cases where there is no ongoing service need or where the delivery approach has altered, and an asset is no longer required to supply services to or for the community and is surplus to Council’s needs.
Decommissioning of an asset may involve a range of options, including:
• Demolition and returning to previous condition an asset.
• Disposal / sale of an asset, including potentially land on the open market.

Long Term Capex Plan Development of Long Term Capex Plan Council has established a systematic process for development of its 10-year, Long Term Capex (Capital Expenditure) Plan (LTCP). Two key elements contribute to the projects and costs of the Plan, these are:
• The costs of asset renewal, as identified in this Asset Plan.
• Upgrade and new projects identified in the Council Plan and a range of other strategies and plans.
The initial list of projects has been developed over the past 18 months, based on a review of some 55 Council plans and strategies, which had between them identified more than 1000 projects. This list of projects was reviewed to remove projects that had been completed or were otherwise assessed as no longer being required.
Project cost estimates were developed for all projects, as well as the identification of the potential source of funds for projects. A key to this funding is the reliance on grants.
There are many semi-regular grant funds available from the Australian and Victorian Governments which enable Council to match its own funds on a 1:1 basis for some projects. For some larger projects, a greater level of grant funding is required to enable these projects to proceed. Development of this LTCP enables Council to focus on the further development of business cases and advocacy efforts for these key projects.
Prioritisation A systematic approach to prioritisation of capex projects has been developed. This is based on the following key parameters:
• The service level standard for the hierarchy of that asset, compared to the current service level ofthe asset
• The level of use of the asset,
• Equitable service levels between areas, and
• The ability for assets to be multi-use (depending on the class of asset).
Different parameters are used for different asset classes, with the detailed scoring process outlined in Appendix B of this Plan.
The scoring developed through this process was used in the initial prioritisation of projects in the LTCP. Ultimately, some minor adjustments in priority are required to achieve a balanced and affordable program of works in each year’s budget taking into account factors such as the mix of available funds, including the potential availability of suitable grants.
Community Panel Recommendations To inform the Asset Plan and Long Term Financial Plan, the Community Panel was asked to deliberate on the following:
With limited resources it is getting more expensive to provide and maintain infrastructure. All Councils struggle with constantly having to balance the cost of renewing, upgrading and building

new infrastructure. What approach should Council use when making decisions around renewing, upgrading, and building new infrastructure?
The Community Panel’s response was as follows:
Recommendation: To achieve our Community Vision, in the next 10 years we would like Council to focus on building new infrastructure. The reasons for this recommendation are as follows:
• Building multipurpose facilities to meet the needs of the community, aligns with the communityvision, promotes economic growth and builds Horsham into a destination.
• Building new facilities has low impact on the use of current facilities (while the build isoccurring).
• Donating or selling current assets to community groups fosters a positive relationship betweenthem and the council.
• New buildings and infrastructure will be geared towards a digital future, with an ability tomanage our new COVID world.
While expressing this priority for new buildings, the Panel also recognised that there are some reasons to consider upgrades to existing buildings, as follows:
• Retention of historical significance, including retention of decentralised facilities (outlyingcommunity assets)
• Upgrading is generally cheaper than building new infrastructure (demolition costs, meeting ofall new standards)
• Increased utilisation of infrastructure can open new opportunities for funding e.g communitygroup funding solely available from state and federal grants.
• Better maintenance framework can reduce the need for renewal of some facilities, freeingfunding for upgrades or new opportunities.
• Economic - the funds used to build a single new facility can be used to upgrade multiple smallervenues. New assets have a greater depreciation and generally higher user group fees. Fundingfor certain parts of the building can be obtained in stages, rather than only getting funding fornew builds. Building new leaves an older run down venue that often sits unused leaving twofacilities to maintain instead of one.
• Current assets are located for a purpose, while new needs more space and would likely be indifferent locations. Heritage value is retained and often new buildings are harder to access formultiple user groups.
As a result of the Community Panel recommendations, Council will now work on revising its method for prioritisation of projects in the annual budget process for 2022-23 and the annual updates to the Long Term Capex Plan. The assessment of the preference for a “new” or “upgrade” approach to projects will be determined on a project-by-project basis.

Draft Long Term Capex Plan Expenditure Tables 10 and 11 below shows the LTCP expenditure program for the 10 year period 2021-22 to 2030-31, based first on asset class, and then based on whether they are renewal, upgrade or new projects.
Table 10 Long Term Capital Expenditure by Asset Class
Table 11 Long Term Capital Expenditure by Project Type

Long Term Financial Projection The financial projections are shown in Table 12 for the projected operations, maintenance, capital renewal and capital new/upgrade and estimate budget funding.
In this table, the “core” renewal demand is that established through modelling as outlined in this Plan. Some additional renewal expenditure results from various “upgrade” and “new” projects, which contain a component of the work scope which is classified as renewal works.
Table 12 Projected operations, maintenance, capital renewal and capital new/upgrade
Financial Year
Operations & Maintenance
Core Renewal Demand
Capital Renewal Budget
Capital New/Upgrade
Total Assets Budget
2021-22 $6,638,798 $7,453,278 $9,971,472 $10,389,444 $26,999,714
2022-23 $6,738,380 $8,746,382 $11,289,493 $9,333,406 $27,361,279
2023-24 $6,839,456 $7,884,805 $9,639,402 $11,888,868 $28,367,726
2024-25 $6,942,048 $10,738,276 $10,004,966 $19,045,276 $35,992,290
2025-26 $7,046,178 $6,221,315 $10,847,064 $23,212,332 $41,105,574
2026-27 $7,151,871 $6,544,258 $12,624,258 $7,887,902 $27,664,031
2027-28 $7,259,149 $9,423,515 $9,462,658 $15,930,290 $32,652,097
2028-29 $7,368,036 $6,775,853 $10,297,055 $21,123,977 $38,789,069
2029-30 $7,478,557 $7,107,404 $10,345,452 $19,906,309 $37,730,319
2030-31 $7,590,735 $11,808,500 $11,193,749 $7,974,433 $26,758,916
Total $71,053,207 $82,703,586 $105,675,569 $146,692,238 $323,421,015
Average $7,105,321 $8,270,359 $10,567,557 $14,669,224 $32,342,102
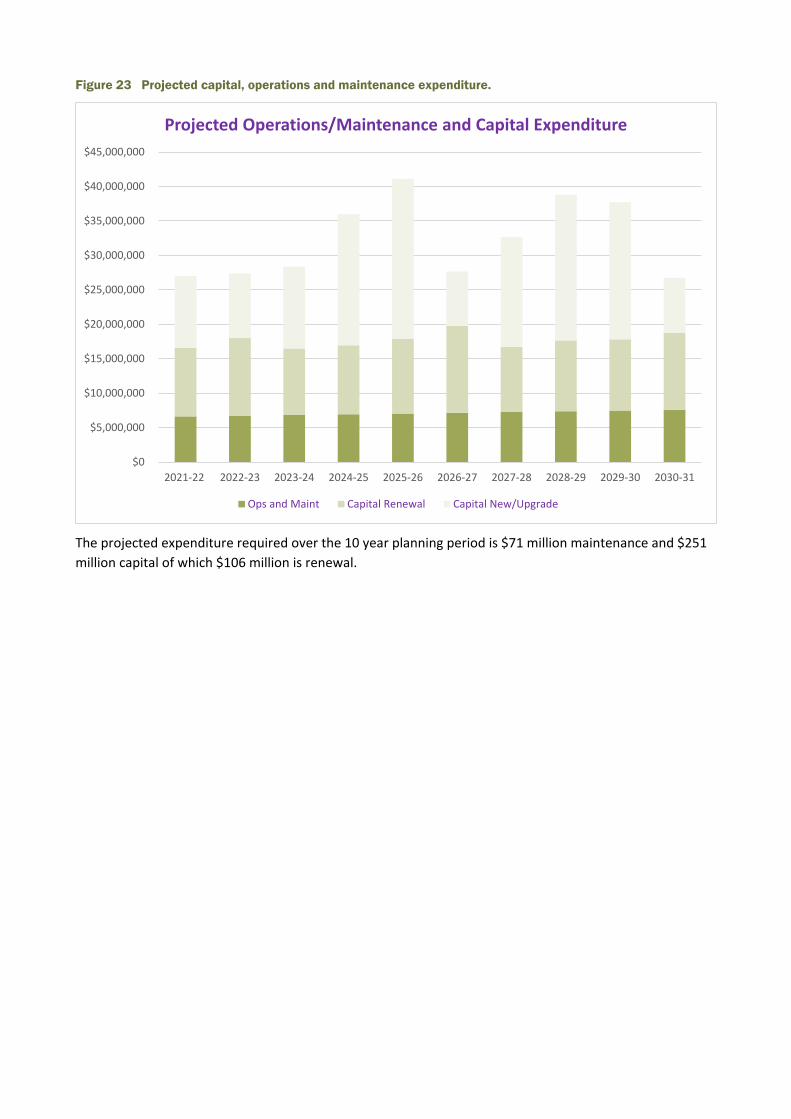
Figure 23 Projected capital, operations and maintenance expenditure.
The projected expenditure required over the 10 year planning period is $71 million maintenance and $251 million capital of which $106 million is renewal.
$0
$5,000,000
$10,000,000
$15,000,000
$20,000,000
$25,000,000
$30,000,000
$35,000,000
$40,000,000
$45,000,000
2021-22 2022-23 2023-24 2024-25 2025-26 2026-27 2027-28 2028-29 2029-30 2030-31
Projected Operations/Maintenance and Capital Expenditure
Ops and Maint Capital Renewal Capital New/Upgrade
Asset Hierarchy Maintenance service standard Construction service standard/renewal standard
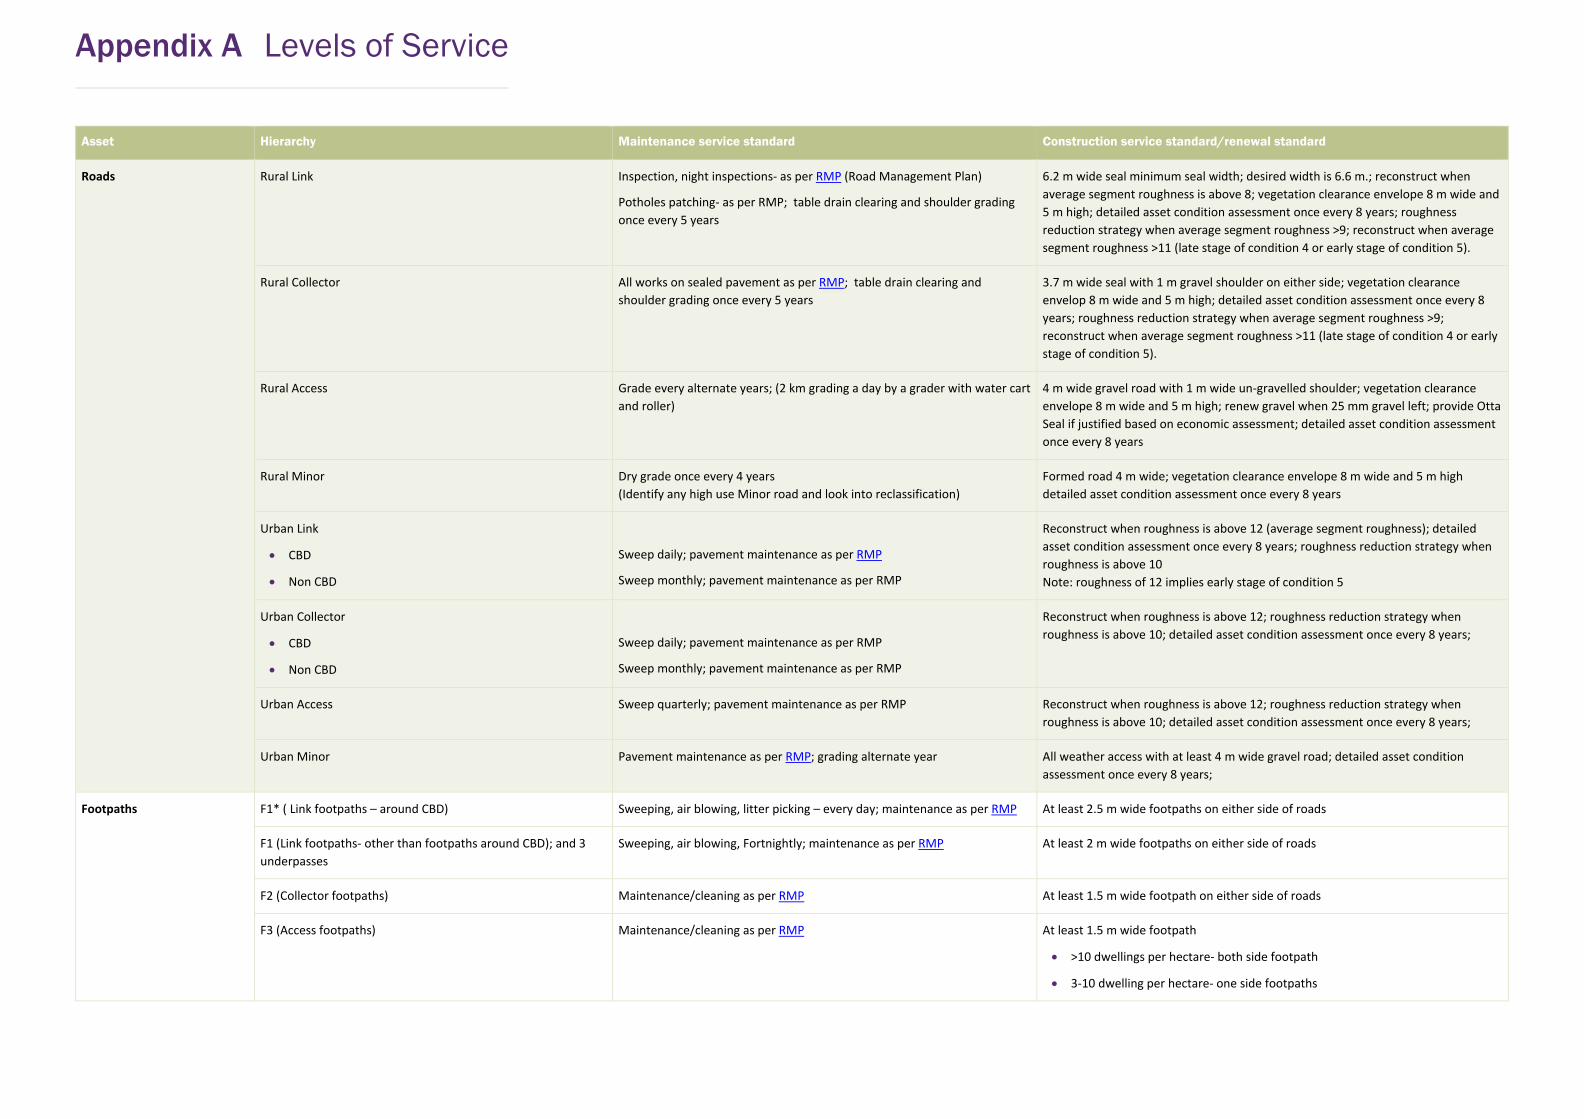
Roads Rural Link Inspection, night inspections- as per RMP (Road Management Plan)
Potholes patching- as per RMP; table drain clearing and shoulder grading once every 5 years
6.2 m wide seal minimum seal width; desired width is 6.6 m.; reconstruct when average segment roughness is above 8; vegetation clearance envelope 8 m wide and 5 m high; detailed asset condition assessment once every 8 years; roughness reduction strategy when average segment roughness >9; reconstruct when average segment roughness >11 (late stage of condition 4 or early stage of condition 5).
Rural Collector All works on sealed pavement as per RMP; table drain clearing and shoulder grading once every 5 years
3.7 m wide seal with 1 m gravel shoulder on either side; vegetation clearance envelop 8 m wide and 5 m high; detailed asset condition assessment once every 8 years; roughness reduction strategy when average segment roughness >9; reconstruct when average segment roughness >11 (late stage of condition 4 or early stage of condition 5).
Rural Access Grade every alternate years; (2 km grading a day by a grader with water cart and roller)
4 m wide gravel road with 1 m wide un-gravelled shoulder; vegetation clearance envelope 8 m wide and 5 m high; renew gravel when 25 mm gravel left; provide Otta Seal if justified based on economic assessment; detailed asset condition assessment once every 8 years
Rural Minor Dry grade once every 4 years (Identify any high use Minor road and look into reclassification)
Formed road 4 m wide; vegetation clearance envelope 8 m wide and 5 m high detailed asset condition assessment once every 8 years
Urban Link
• CBD
• Non CBD
Sweep daily; pavement maintenance as per RMP
Sweep monthly; pavement maintenance as per RMP
Reconstruct when roughness is above 12 (average segment roughness); detailed asset condition assessment once every 8 years; roughness reduction strategy when roughness is above 10 Note: roughness of 12 implies early stage of condition 5
Urban Collector
• CBD
• Non CBD
Sweep daily; pavement maintenance as per RMP
Sweep monthly; pavement maintenance as per RMP
Reconstruct when roughness is above 12; roughness reduction strategy when roughness is above 10; detailed asset condition assessment once every 8 years;
Urban Access Sweep quarterly; pavement maintenance as per RMP Reconstruct when roughness is above 12; roughness reduction strategy when roughness is above 10; detailed asset condition assessment once every 8 years;
Urban Minor Pavement maintenance as per RMP; grading alternate year All weather access with at least 4 m wide gravel road; detailed asset condition assessment once every 8 years;
Footpaths F1* ( Link footpaths – around CBD) Sweeping, air blowing, litter picking – every day; maintenance as per RMP At least 2.5 m wide footpaths on either side of roads
F1 (Link footpaths- other than footpaths around CBD); and 3 underpasses
Sweeping, air blowing, Fortnightly; maintenance as per RMP At least 2 m wide footpaths on either side of roads
F2 (Collector footpaths) Maintenance/cleaning as per RMP At least 1.5 m wide footpath on either side of roads
F3 (Access footpaths) Maintenance/cleaning as per RMP At least 1.5 m wide footpath
• >10 dwellings per hectare- both side footpath
• 3-10 dwelling per hectare- one side footpaths
Appendix A Levels of Service

Asset Hierarchy Maintenance service standard Construction service standard/renewal standard
• <3 dwelling per hectare- shoulder on both sides; no footpath
Bike Lanes N/A Sweep Quarterly Bike lanes on road, adequately marked/delineated; At least 1.8m wide lane marked; 2.4 m height clearance
Shared Path Sealed/concrete Shared path Sweeping/cleaning- Quarterly; maintenance as per RMP
(High use shared path along the river and also on the Racecourse). Other shared path sweep/clean as per RMP
At least 2.5 m wide
Gravelled Shared path Maintenance as per RMP Provide 50 mm gravel; resheet when gravel depth <20 mm; at least 2.5 m wide
Natural surface-formed shared path Maintenance as per RMP Formed natural surface at least 2.5 m wide
Drainage (detail more with extra categories for urban and rural drainage )
Link Maintenance/inspection as per RMP; pit inspection once every 4 years; clean grates yearly; annual dash cam image collection of kerbs 4 days after significant rain (>30 mm cumulative rain)
Design to cope with 1 in 5 years ARI
Collector Maintenance/inspection as per RMP; pit inspection once every 4 years; clean grates yearly; annual dash cam image collection of kerbs 3 days after significant rain (>30 mm cumulative rain)
Design to cope with 1 in 5 years ARI
Access Maintenance/inspection as per RMP; pit inspection once every 4 years; clean grates every 2 years; annual dash cam image collection of kerbs 4 days after significant rain (>30 mm cumulative rain)
Design to cope with 1 in 5 years ARI
Minor Maintenance/inspection as per RMP; pit inspection once every 4 years; clean grates yearly; annual dash cam image collection of kerbs 4 days after significant rain (>30 mm cumulative rain)
Design to cope with 1 in 5 years ARI
Cleaning works Public toilets, barbeque, sanitary napkin disposal, drinking fountain, picnic benches, air fresheners
Regional Cleaning/refill/disposal frequency as per the schedule
(Contract management/monitoring)
Spacing of facilities (public toilets, barbeque, drinking fountain, picnic benches) and design standard as prescribed in SIF (Social Infrastructure Framework); renewal of asset before reaching condition 3
Municipal Cleaning/refill/disposal frequency as per the schedule Spacing of facilities (public toilets, barbeque, drinking fountain, picnic benches) and design standard as prescribed in SIF (Social Infrastructure Framework); renewal of asset before reaching condition 3
Neighbourhood Cleaning/refill/disposal frequency as per the schedule Spacing of facilities (public toilets, barbeque, drinking fountain, picnic benches) and design standard as prescribed in SIF (Social Infrastructure Framework); renewal of asset before reaching condition 4
Local Cleaning/refill/disposal frequency as per the schedule Spacing of facilities (public toilets, barbeque, drinking fountain, picnic benches) and design standard as prescribed in SIF (Social Infrastructure Framework); renewal of asset before reaching condition 5

Asset Hierarchy Maintenance service standard Construction service standard/renewal standard
Open Space Assets (Park lawns, playground equipment, undersurface material around play equipment, pathways within park/gardens, furniture, toilets within parks/gardens, park signs, barbeque facilities/shelters,recreation reserve)
Regional
1. Park lawn mowing, Couch, Kikuyu and Rye
2. Edging and trimming of lawn edges and borders
3. Tree maintenance –including Pruning and Shaping fordesired growth and safety
4. Shrub/general plant maintenance including seasonalpruning
5. Playground equipment inspections and maintenance
6. Pathways (within parks and gardens) maintenance andinspections
7. Toilets
8. Furniture
9. Barbeque facilities and shelters
10. Rubbish bins and litter control
11. Litter pickup and tidiness of area
12. Under-surface material around play equipment
•
13. Park lighting
14. Park signage inspection
15. Wetlands water quality
16. Wetlands litter management
Playgrounds
1. Maintain Couch >20 mm, Kikuyu > 30 mm, Rye > 50mm < 75mm
2. Mechanically trimmed <20 mm
3. Regular pruning; meet electricity safety
4. Seasonal pruning practices to maintain safety and aestheticstandards
5. Weekly visual inspection/documented inspection monthly
6. Check weekly and maintain in a clean and safe condition; cleanweekly
7. Inspect weekly; report damage or repairs
8. Inspect and clean on a regular basis
9. Inspect and check operation [BBQ cleaning is on service contract]
10. Report bins that are not in a clean and useable condition
11. Check for litter daily
12. Inspect for hazardous materials and relevel and adjust materialweekly
13. Report damage to lights as required
14. Report damage to signs as required
15. Regular water testing; monitor algal blooms
16. Clean little traps regularly; pick up litter regularly
Note: From inspections when defects/issues found, make the system safe within 4 hours (signs bollards ribbon); and fix within 10 days
Inspect by qualified assessor for safety twice per year
Spacing of playgrounds and design standard as prescribed in SIF (Social Infrastructure Framework); asset renewal before asset reaches condition 3 ; detailed asset condition assessment once every 8 years;

Asset Hierarchy Maintenance service standard Construction service standard/renewal standard
Open Space Assets (Park lawns, playground equipment, undersurface material around play equipment, pathways within park/gardens, furniture, toilets within parks/gardens, park signs, barbeque facilities/shelters,recreation reserve)
Municipal
1. Park lawn mowing
2. Edging and trimming of lawn edges and borders
3. Tree maintenance –including Pruning and Shaping fordesired growth and safety
4. Shrub/general plant maintenance including seasonalpruning
5. Playground equipment inspections and maintenance
6. Pathway (within parks and gardens) maintenance andinspections
7. Toilets
8. Furniture
9. Barbeque facilities and shelters
10. Rubbish bins and litter control
11. Litter pickup and tidiness of area
12. Under-surface material around play equipment
13. Park lighting
14. Park signage inspection
15. Wetlands water quality
16. Wetlands litter management
Playgrounds
1. Maintain at <60 mm
2. Mechanically trimmed <30 mm
3. Regular pruning; meet electricity safety
4. Seasonal pruning practices to horticultural standards
5. Weekly visual inspection and documented inspection monthly
6. Check weekly and maintain in a clean and safe condition; cleanweekly
7. Inspect weekly; report damage or repairs
8. Inspect and clean on a regular basis
9. Inspect and check operation twice weekly
10. Report bins that are not in a clean and useable condition
11. Check for litter daily
12. Inspect weekly for hazardous materials; relevel and adjust materialweekly
13. Report damage to lights as required
14. Report damage to signs as required
15. Regular water testing; monitor algal blooms
16. Clean litter traps regularly; pick up litter regularly
Note: From inspections when defects/issues found, make the system safe within 4 hours(signs bollards ribbon); and fix within 10 days
Inspect by qualified assessor for safety twice per year
Spacing of playgrounds and design standard as prescribed in SIF (Social Infrastructure Framework); asset renewal before asset reaches condition 3; detailed asset condition assessment once every 8 years

Asset Hierarchy Maintenance service standard Construction service standard/renewal standard
Open Space Assets (Park lawns, playground equipment, undersurface material around play equipment, pathways within park/gardens, furniture, toilets within parks/gardens, park signs, barbeque facilities/shelters,recreation reserve)
Neighbourhood
1. Park grass mowing
2. Edging and trimming of lawn edges and borders
3. Tree maintenance –including Pruning and Shaping fordesired growth and safety
4. Shrub/general plant maintenance including seasonalpruning
5. Playground equipment inspections and maintenance
6. Pathway (within parks and gardens) maintenance andinspections
7. Toilets
8. Furniture
9. Barbeque facilities and shelters
10. Rubbish bins and litter control
11. Litter pickup and tidiness of area
12. Under-surface material around play equipment
13. Park lighting
14. Park signage inspection
15. Wetlands water quality
16. Wetlands litter management
Playgrounds
1. Maintain at <100 mm
2. Herbicide program to maintain turf border
3. Formative pruning of specimen
4. Reactive (generally no pruning)
5. Weekly visual inspection/documented inspection Monthly
6. Check monthly; herbicide control on pathways
7. Inspect weekly; report damage or repairs
8. Inspect as part of other routine inspections
9. Inspect and clean as required
10. Report bins that are not in a clean and useable condition
11. Fortnightly litter pickup
12. Inspect weekly for hazardous materials; relevel/adjust materialweekly or as required
13. Report damage to lights as required
14. Report damage to signs as required
15. In response to odours or other issues.
16. In response to Merits
Note: From inspections when defects/issues found, make the system safe within 4 hours (signs/bollards/safety ribbons); and fix the issue within 10 days
Inspect by qualified assessor for safety twice per year
Spacing of playgrounds and design standard as prescribed in SIF (Social Infrastructure Framework); renewal of asset before asset reaches condition 4; detailed asset condition assessment once every 8 years
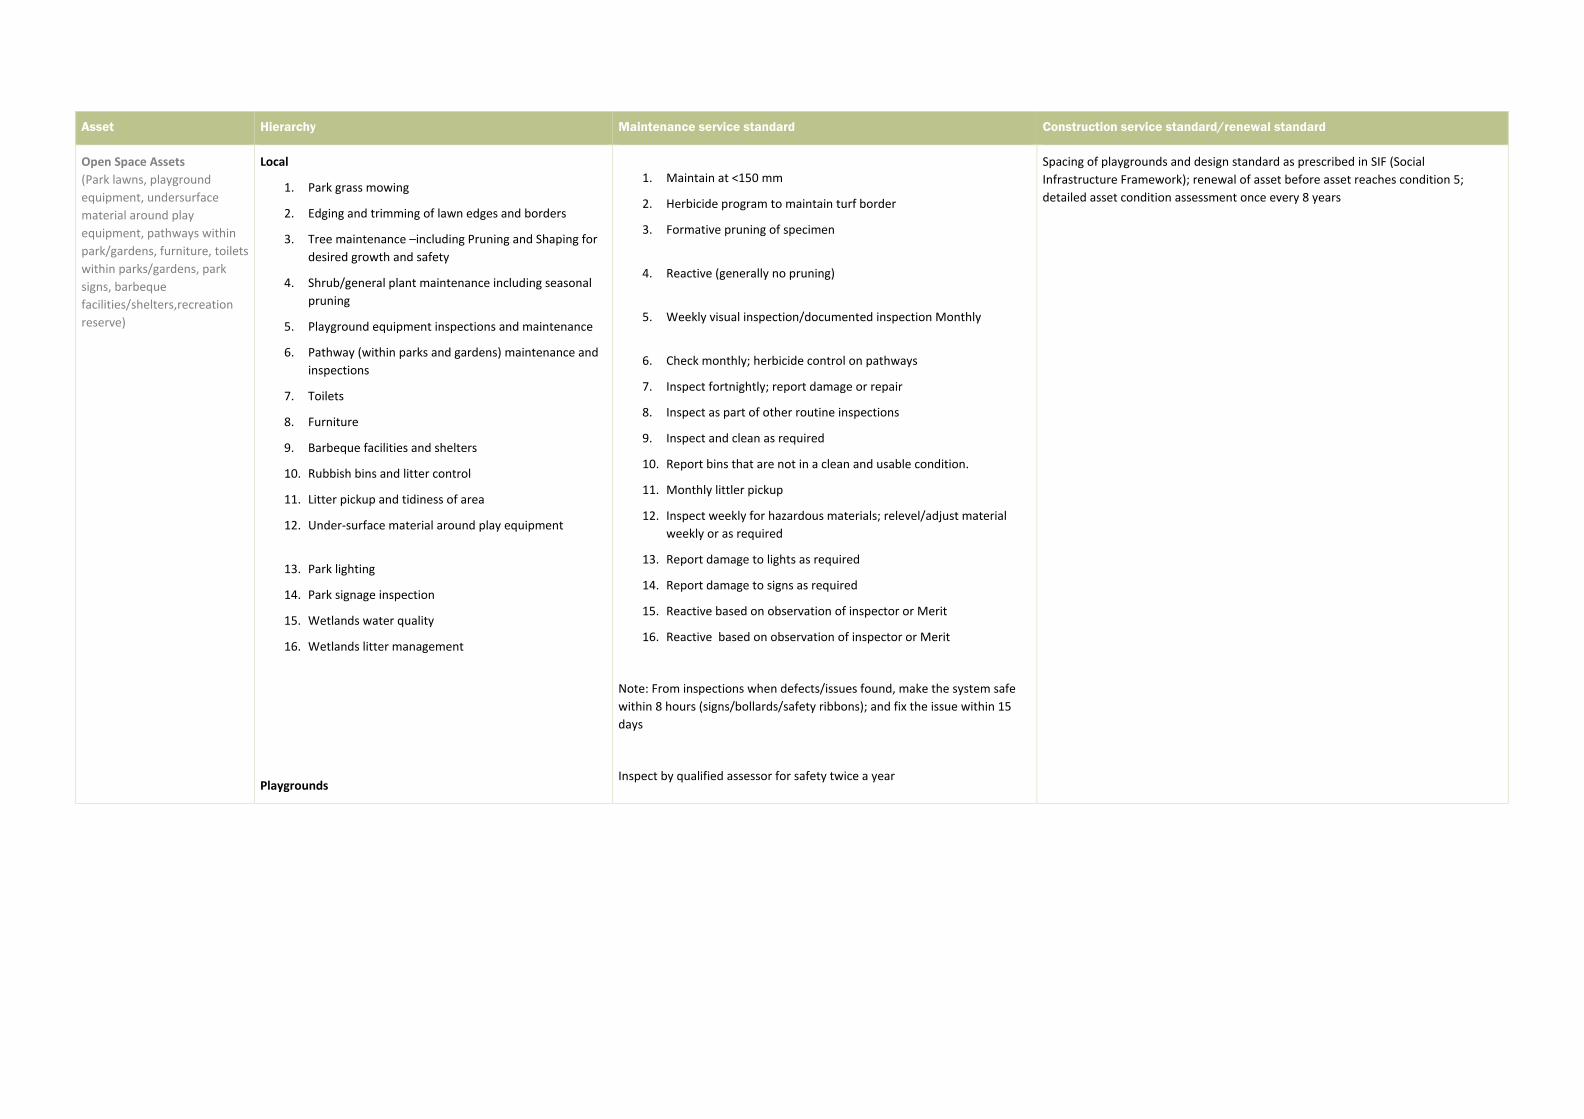
Asset Hierarchy Maintenance service standard Construction service standard/renewal standard
Open Space Assets (Park lawns, playground equipment, undersurface material around play equipment, pathways within park/gardens, furniture, toilets within parks/gardens, park signs, barbeque facilities/shelters,recreation reserve)
Local
1. Park grass mowing
2. Edging and trimming of lawn edges and borders
3. Tree maintenance –including Pruning and Shaping fordesired growth and safety
4. Shrub/general plant maintenance including seasonalpruning
5. Playground equipment inspections and maintenance
6. Pathway (within parks and gardens) maintenance andinspections
7. Toilets
8. Furniture
9. Barbeque facilities and shelters
10. Rubbish bins and litter control
11. Litter pickup and tidiness of area
12. Under-surface material around play equipment
13. Park lighting
14. Park signage inspection
15. Wetlands water quality
16. Wetlands litter management
Playgrounds
1. Maintain at <150 mm
2. Herbicide program to maintain turf border
3. Formative pruning of specimen
4. Reactive (generally no pruning)
5. Weekly visual inspection/documented inspection Monthly
6. Check monthly; herbicide control on pathways
7. Inspect fortnightly; report damage or repair
8. Inspect as part of other routine inspections
9. Inspect and clean as required
10. Report bins that are not in a clean and usable condition.
11. Monthly littler pickup
12. Inspect weekly for hazardous materials; relevel/adjust materialweekly or as required
13. Report damage to lights as required
14. Report damage to signs as required
15. Reactive based on observation of inspector or Merit
16. Reactive based on observation of inspector or Merit
Note: From inspections when defects/issues found, make the system safe within 8 hours (signs/bollards/safety ribbons); and fix the issue within 15 days
Inspect by qualified assessor for safety twice a year
Spacing of playgrounds and design standard as prescribed in SIF (Social Infrastructure Framework); renewal of asset before asset reaches condition 5; detailed asset condition assessment once every 8 years

Asset Hierarchy Maintenance service standard Construction service standard/renewal standard
Slashing/fire break works {Rural} Semi Rural
Tier 1 Maybe roads closer to higher density housing areas. Riverside , Drung, Haven, Natimuk , Jung, Dadswells Bridge, Pimpinio etc.
Maintain the height of grass below 300 mm
(Deliver this service in conjunction with fire management plan, risk and available fund)
Slashable shoulder, table drains and verges (small bushes/trees are cleared through routine table drain maintenance program);
Tier 2 Strategic fire break roads Mown Once or twice per year depending on growth
(Deliver this service in conjunction with fire management plan, risk and available fund)
Slashable shoulder, table drains and verges(small bushes/trees are cleared through routine table drain maintenance program)
Tier 3 Gravel roads Mown once per year
(Deliver this service in conjunction with fire management plan, risk and available fund)
Slashable shoulder, table drains and verges(small bushes/trees are cleared through routine table drain maintenance program with the clearance envelope)
Building Regional Inspection once every two years; rectify non urgent identified defects within 12 months (non-urgent defects includes gutter cleaning; painting; patch works on walls; non security door fixtures; site cleaning; non-standard electrical works; partially blocked drainage etc. Rectify urgent defects within 1 month (cracked window glass, air conditioner etc.)
Scheduled maintenance:
- Painting once every 7 years
- Essential safety measures e.g. Fire inspection twice every year
- Termite treatment once every 2 years
- Electrical safety/test and tag once every year
- Air-conditioning/heating scheduled inspection quarterly
- Floor covering renewal
- Cleaning- daily
- Security check- daily
- Gutter cleaning twice a year
- Lift inspection quarterly
- Fly line rigging once a year
- Thermostat checking for water heating system yearly
•
Asset creation or upgrade works as per SIF; renewal of asset before condition reaches to 4; detailed asset condition assessment once every 4 years.
Municipal Inspection once every two years; rectify non urgent identified defects within 12 months
Scheduled maintenance:
- Painting once every 10 years
- Essential safety measures e.g. Fire inspection once every year
- Pest control once every year
Asset creation or upgrade works as per SIF; renewal of asset before condition reaches to 4; detailed asset condition assessment once every 4 years.

Asset Hierarchy Maintenance service standard Construction service standard/renewal standard
- Electrical safety check once every year
- Air-conditioning/heating scheduled inspection twice a year
- Cleaning –weekly
- Gutter cleaning twice a year
- Security check-daily
- Lift inspection quarterly
- Thermostat checking for water heating system yearly
•
Neighbourhood Inspection once every 3 years; rectify non-urgent identified defects within 12 months
Scheduled maintenance:
- Painting once every 15 years
- Essential safety measures e.g. Fire inspection once every year
- Pest control once every year
- Electrical safety check once every year
- Air-conditioning/heating scheduled inspection once per year
- Cleaning fortnightly
- Gutter cleaning once a year
•
Asset creation or upgrade works as per SIF; renewal of asset before condition reaches to 5; detailed asset condition assessment once every 4 years.
Local Inspection once every 3 years; rectify non urgent identified defects within 2 years
Scheduled maintenance:
- Painting once every 15 years
- Essential safety measures e.g. Fire inspection once every year
- Pest control once every year
- Electrical safety check once every year
- Air-conditioning/heating scheduled inspection once per year
- Cleaning monthly
- Gutter cleaning once a year
Asset creation or upgrade works as per SIF; renewal of asset before condition reaches to 5; detailed asset condition assessment once every 4 years.

Asset Hierarchy Maintenance service standard Construction service standard/renewal standard
Other Open space areas (football oval, cricket pitch, tennis courts etc.)
Football Oval – Rural being done as request (paid job)
Football Oval in town
Regional City Oval, Coughlin Park TBA Asset creation, decommission, upgrades based on Social Infrastructure Framework and Long Term Financial Plan; detailed asset inspection once every 4 years
Municipal (Dudley Cornell Park #1, Sunnyside Park, Horsham College Oval,
TBA Asset creation, decommission, upgrades based on Social Infrastructure Framework and Long Term Financial Plan; detailed asset inspection once every 4 years
Neighbourhood Dudley Cornell #2, Haven, Racecourse Reserve TBA Asset creation, decommission, upgrades based on Social Infrastructure Framework and Long Term Financial Plan; detailed asset inspection once every 4 years
Draft Level of Service- Horsham Rural City Council –reviewed by internal stakeholders 21/06/2021

Generalised description of infrastructure asset condition Condition Description Grade
1 Typically new or recently rehabilitated Very Good
2 The infrastructure in the system has some element that show general signs of deterioration Good
3 The infrastructure in the system shows general sign of deterioration that requires attention; some element exhibits significant deficiencies Fair
4 A large portion of the system exhibits significant deterioration Poor
5 Many component of system exhibit sign of failure which is affecting services Very Poor
Road Roughness
If we measure the position of the load(object as shown in the diagram below) compare to its stationary position every meter along 1 km stretch of road, and add them; this gives roughness of that particular 1 km segment of road.

Road Hierarchy Road Type Category Description
Arterial State Highways 1 • Vic Roads responsibility
Arterial Main Roads 2 • Managed by Council
Rural Link Road 3 • Roads forming a significant link between townships and major rural communities, and the Atrterial Road Network. Roads may also form a significant link between roads
• Will generally carry all vehicle types
• Will generally have average traffic coutns greater than 100
• Will provide major access routes for heavy vehicle traffic
Rural Collector Roads 4 • Forms a route between local link roads and/or other major roads
• Collects and feeds traffic from local access roads onto local link roads and/or other major roads
• Will generally carry most vehicle types
• Will generally have average daily traffic greater than 80 vehicles per day
• Roads that may carry intermittent higher volumes of traffic, but would otherwise serve as general access roads; or
• Roads serving at least 10 dwellings
Rural General Access 5 • Servces at least 1 occupied residence
• Links individual houses to higher classification roadsDoes not carry regular heavy vehicles
• Generally will have average daily traffic counts less than 80 vehicles per day
Rural Minor Access Roads 6 • Predominantly serves as access to non-residential properties only
• Generally does not carry heavy vehicles
• Generally no through roads
• Generally have average daily traffic counts less than 20 vehicles per day
• May have infrequent use only
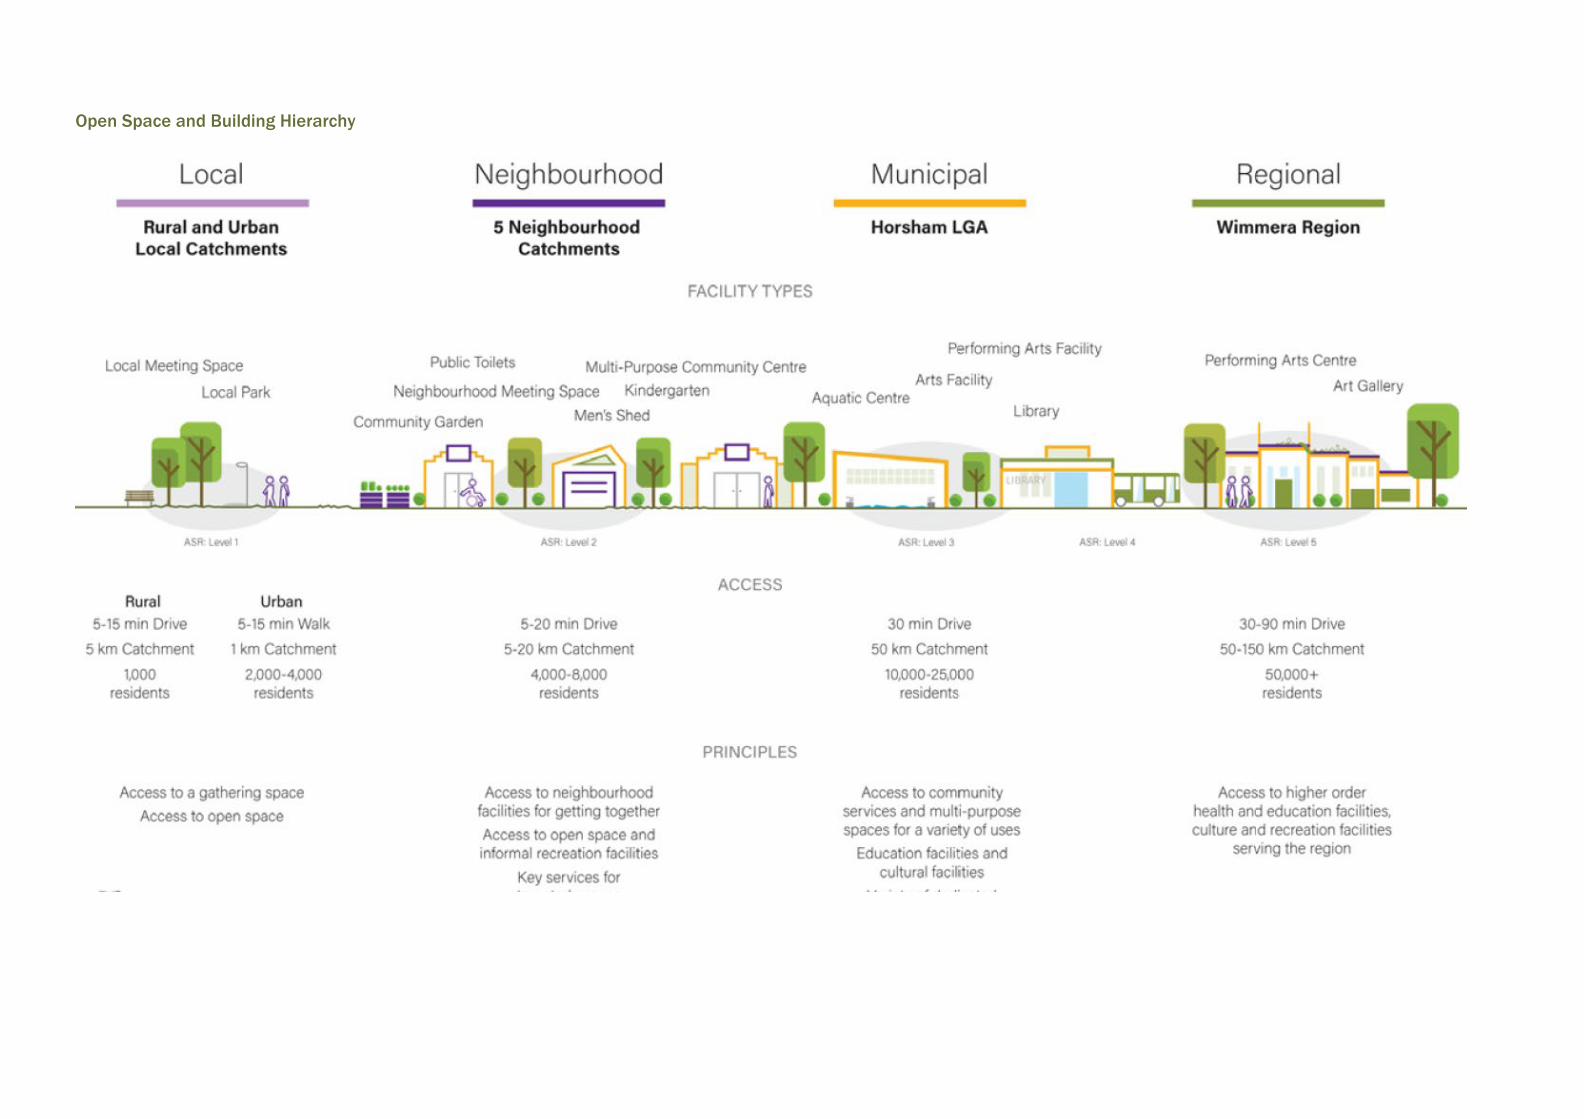
Open Space and Building Hierarchy
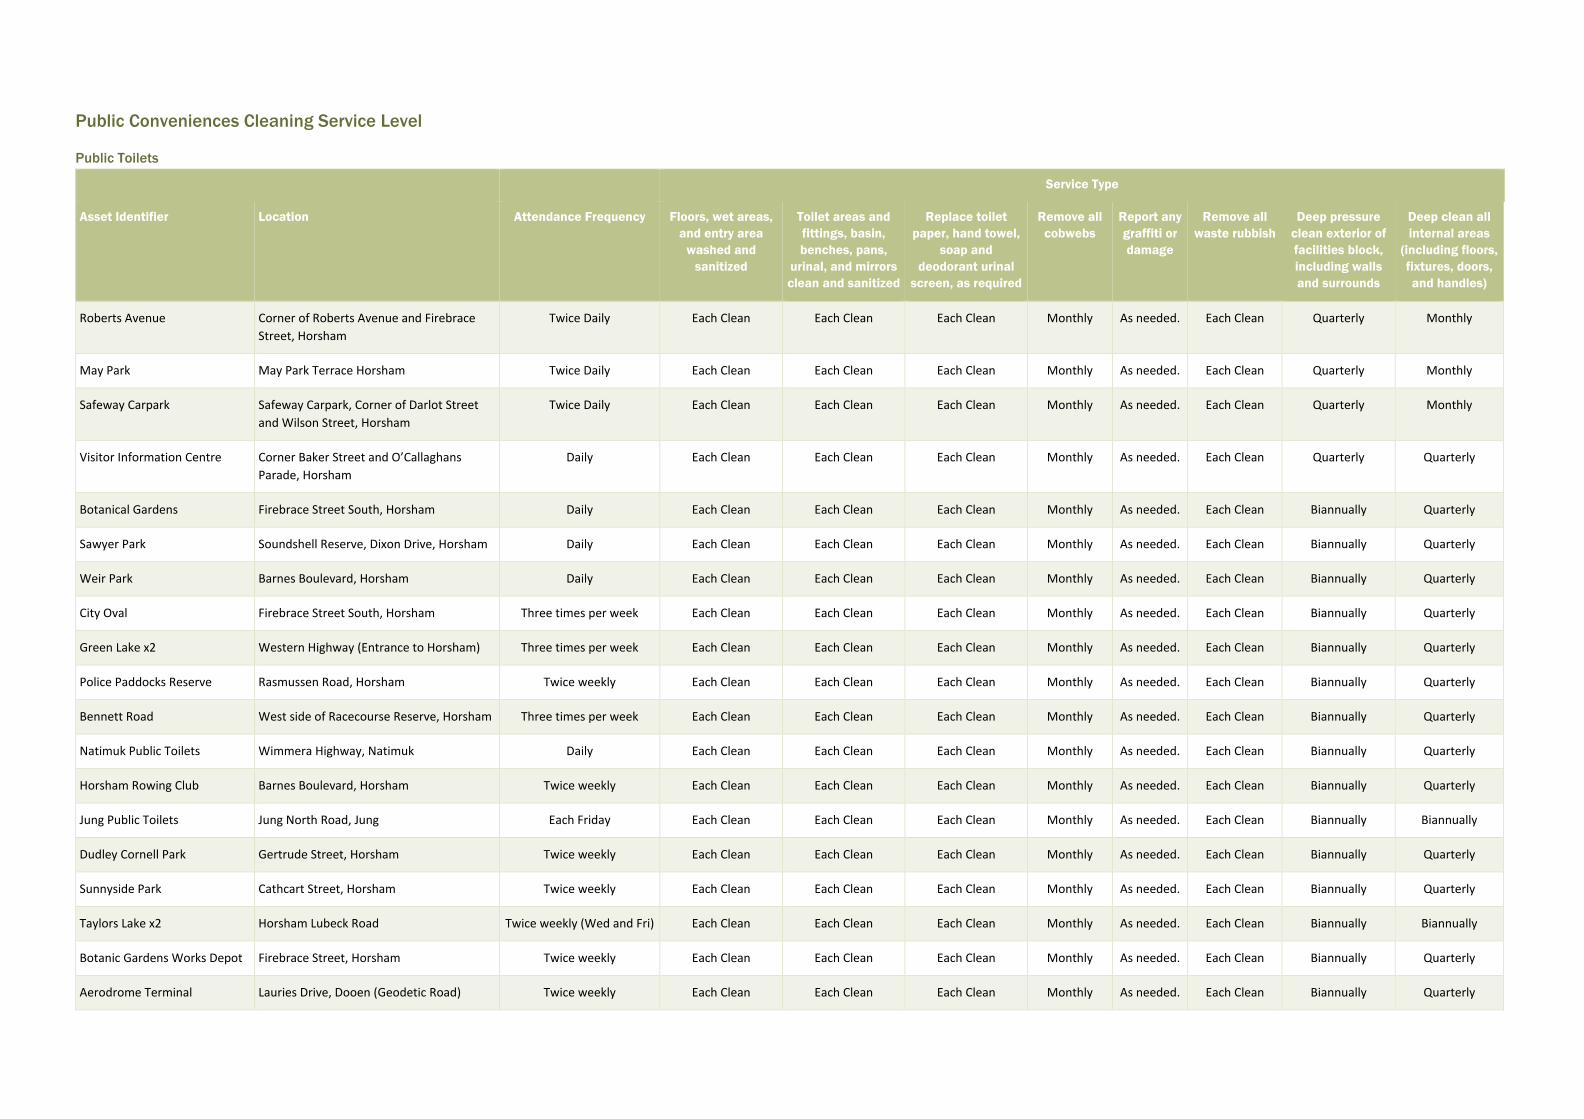
Public Conveniences Cleaning Service Level
Public Toilets
Service Type
Asset Identifier Location Attendance Frequency Floors, wet areas, and entry area
washed and sanitized
Toilet areas and fittings, basin, benches, pans,
urinal, and mirrors clean and sanitized
Replace toilet paper, hand towel,
soap and deodorant urinal
screen, as required
Remove all cobwebs
Report any graffiti or damage
Remove all waste rubbish
Deep pressure clean exterior of facilities block, including walls and surrounds
Deep clean all internal areas
(including floors, fixtures, doors, and handles)
Roberts Avenue Corner of Roberts Avenue and Firebrace Street, Horsham
Twice Daily Each Clean Each Clean Each Clean Monthly As needed. Each Clean Quarterly Monthly
May Park May Park Terrace Horsham Twice Daily Each Clean Each Clean Each Clean Monthly As needed. Each Clean Quarterly Monthly
Safeway Carpark Safeway Carpark, Corner of Darlot Street and Wilson Street, Horsham
Twice Daily Each Clean Each Clean Each Clean Monthly As needed. Each Clean Quarterly Monthly
Visitor Information Centre Corner Baker Street and O’Callaghans Parade, Horsham
Daily Each Clean Each Clean Each Clean Monthly As needed. Each Clean Quarterly Quarterly
Botanical Gardens Firebrace Street South, Horsham Daily Each Clean Each Clean Each Clean Monthly As needed. Each Clean Biannually Quarterly
Sawyer Park Soundshell Reserve, Dixon Drive, Horsham Daily Each Clean Each Clean Each Clean Monthly As needed. Each Clean Biannually Quarterly
Weir Park Barnes Boulevard, Horsham Daily Each Clean Each Clean Each Clean Monthly As needed. Each Clean Biannually Quarterly
City Oval Firebrace Street South, Horsham Three times per week Each Clean Each Clean Each Clean Monthly As needed. Each Clean Biannually Quarterly
Green Lake x2 Western Highway (Entrance to Horsham) Three times per week Each Clean Each Clean Each Clean Monthly As needed. Each Clean Biannually Quarterly
Police Paddocks Reserve Rasmussen Road, Horsham Twice weekly Each Clean Each Clean Each Clean Monthly As needed. Each Clean Biannually Quarterly
Bennett Road West side of Racecourse Reserve, Horsham Three times per week Each Clean Each Clean Each Clean Monthly As needed. Each Clean Biannually Quarterly
Natimuk Public Toilets Wimmera Highway, Natimuk Daily Each Clean Each Clean Each Clean Monthly As needed. Each Clean Biannually Quarterly
Horsham Rowing Club Barnes Boulevard, Horsham Twice weekly Each Clean Each Clean Each Clean Monthly As needed. Each Clean Biannually Quarterly
Jung Public Toilets Jung North Road, Jung Each Friday Each Clean Each Clean Each Clean Monthly As needed. Each Clean Biannually Biannually
Dudley Cornell Park Gertrude Street, Horsham Twice weekly Each Clean Each Clean Each Clean Monthly As needed. Each Clean Biannually Quarterly
Sunnyside Park Cathcart Street, Horsham Twice weekly Each Clean Each Clean Each Clean Monthly As needed. Each Clean Biannually Quarterly
Taylors Lake x2 Horsham Lubeck Road Twice weekly (Wed and Fri) Each Clean Each Clean Each Clean Monthly As needed. Each Clean Biannually Biannually
Botanic Gardens Works Depot Firebrace Street, Horsham Twice weekly Each Clean Each Clean Each Clean Monthly As needed. Each Clean Biannually Quarterly
Aerodrome Terminal Lauries Drive, Dooen (Geodetic Road) Twice weekly Each Clean Each Clean Each Clean Monthly As needed. Each Clean Biannually Quarterly

Service Type
Asset Identifier Location Attendance Frequency Floors, wet areas, and entry area
washed and sanitized
Toilet areas and fittings, basin, benches, pans,
urinal, and mirrors clean and sanitized
Replace toilet paper, hand towel,
soap and deodorant urinal
screen, as required
Remove all cobwebs
Report any graffiti or damage
Remove all waste rubbish
Deep pressure clean exterior of facilities block, including walls and surrounds
Deep clean all internal areas
(including floors, fixtures, doors, and handles)
Cemetery Davis Drive, Horsham Twice weekly Each Clean Each Clean Each Clean Monthly As needed. Each Clean Biannually Quarterly
Haven Rec Reserve Haven Recreation Reserve, 4378 Henty Highway , Haven
Twice weekly Each Clean Each Clean Each Clean Monthly As needed. Each Clean Biannually Quarterly
Cherrypool Public Toilets 8088 Henty Highway, Cherrypool Twice Weekly Each Clean Each Clean Each Clean Monthly As needed. Each Clean Biannually Biannually
Natimuk Lake Caravan Park Lake Road, Natimuk Twice Weekly Each Clean Each Clean Each Clean Monthly As needed. Each Clean Biannually Monthly
Skate Park Park Drive, Horsham Twice weekly Each Clean Each Clean Each Clean Monthly As needed. Each Clean Biannually Quarterly
Hocking Street At City Oval Twice weekly (Mon and Fri) Each Clean Each Clean Each Clean Monthly As needed. Each Clean Biannually Quarterly
Toolondo Reservoir Public Toilets
Wonwondah-Toolondo Road, Toolondo Twice weekly Each Clean Each Clean Each Clean Monthly As needed. Each Clean Biannually Quarterly
Firebrace St Shops Rear of Council Property Once weekly Each Clean Each Clean Each Clean Monthly As needed Each Clean Biannually Quarterly

Public Toilets Additional Facility Details
Asset Number Asset Identifier Location Toilets Basins Urinal Accessible/ Disabled Toilet
Sink / Trough Comments
3 Roberts Avenue Corner of Roberts Avenue and Firebrace Street, Horsham 6 4 1 1 - Medium urinal
8 May Park May Park Terrace Horsham 6 3 - 1 1
3 Safeway Carpark Safeway Carpark, Corner of Darlot Street and Wilson Street, Horsham 3 2 1 1 - Small urinal
3 Visitor Information Centre Corner Baker Street and O’Callaghans Parade, Horsham 6 5 1 1 - Large urinal
3 Botanical Gardens Firebrace Street South, Horsham 6 5 1 1 - Small urinal
3 Sawyer Park Soundshell Reserve, Dixon Drive, Horsham 6 3 1 1 - Large urinal
3 Weir Park Barnes Boulevard, Horsham 3 3 1 1 - Small urinal
1 City Oval Firebrace Street South, Horsham 6 3 1 - - Large urinal
2 Green Lake (Boat Ramp) Western Highway (Entrance to Horsham) 3 2 1 - - Small urinal
3 Green Lake (Closest to Kiosk) Western Highway (Entrance to Horsham) 3 4 1 1 1 Small urinal
1 Police Paddocks Reserve Rasmussen Road, Horsham - 1 - 1 -
2 Bennett Road West side of Racecourse Reserve, Horsham 5 2 1 - - Medium urinal
2 Natimuk Public Toilets Wimmera Highway, Natimuk 1 2 1 1 -
3 Horsham Rowing Club Barnes Boulevard, Horsham 5 4 1 1 - Medium urinal
3 Jung Public Toilets Jung North Road, Jung 1 1 - 1 - Unisex
2 Dudley Cornell Park Gertrude Street, Horsham 4 5 - 1 -
2 Sunnyside Park Cathcart Street, Horsham 3 2 1 - - Small urinal
1 Taylors Lake Horsham Lubeck Road - - - 1 -
1 Taylors Lake Fishers Road 2 1 - - -
- Botanic Gardens Works Depot Firebrace Street, Horsham 1 1 - - - Unisex toilet
2 Aerodrome Terminal Lauries Drive, Dooen (Geodetic Road) 1 2 - 1 - + Shower
2 Cemetery Davis Drive, Horsham 3 2 1 1 - Small urinal
4 Haven Rec Reserve Haven Recreation Reserve, 4378 Henty Highway , Haven 5 4 1 1 - Small urinal
Cherrypool Public Toilets 8088 Henty Highway, Cherrypool 1 2 1 - - Small Urinal

Asset Number Asset Identifier Location Toilets Basins Urinal Accessible/ Disabled Toilet
Sink / Trough Comments
2 Natimuk Lake Caravan Park Lake Road, Natimuk 3 2 1 2 - Small urinal
3 Skate Park Park Drive, Horsham 8 1 - 1 2 Long wall mounted trough
1 Hocking Street At City Oval 1 1 - 1 - Unisex
2 Toolondo Reservoir Public Toilets Wonwondah-Toolondo Road, Toolondo 3 2 1 - - Small urinal
Firebrace St Shops Rear of Council Property 3 2 1 - - Small urinal
Barbeques
Replace fat tray with disposal plastic bucket provided by HRCC (Selkirk Drive Depot)
Asset Identifier Location Number of Barbeques Attendance Frequency
Botanic Gardens Firebrace Street South, Horsham 2 No. twin plate (4 plates total) Monday to Friday: Once daily; Saturday and Sunday: Twice daily. (Total: Nine cleans per week)
May Park May Park Terrace, Horsham 2 No. twin plate (4 plates total) Monday to Friday: Once daily; Saturday and Sunday: Twice daily. (Total: Nine cleans per week)
Sawyer Park Dixon Drive, Horsham 1 No. twin plate (2 plates total) Monday to Friday: Once daily; Saturday and Sunday: Twice daily. (Total: Nine cleans per week)
Weir Park Barnes Boulevard, Horsham 2 No. twin plate (4 plates total) Monday to Friday: Once daily; Saturday and Sunday: Twice daily. (Total: Nine cleans per week)
Adventure Island Barnes Boulevard, Horsham 1 No. twin plate (2 plates total) Monday, Wednesday, Friday: Once daily; Saturday and Sunday: Twice daily. (Total: Five cleans per week)
Green Lake Western Highway 1 No. twin plate (2 plates total) Monday, Wednesday, Friday: Once daily.
Haven Hall Henty Highway, Haven 1 No. twin plate (2 plates total) Once per week between May and August; Twice per week between September and April
Charisma Park Watts Street, Horsham 1 plate Once per week between May and August; Twice per week between September and April
Jung Rec Reserve Main Street Jung 1 plate Once per week between May and August; Twice per week between September and April
Natimuk Caravan Park Natimuk Lake 1 No. twin plate (2 plates total) Once per week between May and August; Twice per week between September and April
Natimuk Lake Avenue 1 Plate Once per week between May and August; Twice per week between September and April
Dudley Cornell Park Gertrude Street, Horsham 1 plate Monday, Wednesday, Friday :Once daily
Toolondo Reservoir Wonwondah-Toolondo Road, Toolondo 1 Plate Once per week between May and August; Twice per week between September and April

Sanitary Napkin Disposal
Asset Identifier Location Number of Containers Attendance Frequency
Botanic Gardens Firebrace Street South, Horsham Six Every six weeks
Civic Centre Offices Roberts Avenue, Horsham Seven Every four weeks
Firebrace Street Shops Rear of Council Property Two Every six weeks
Visitor Information Centre (Inside) South-West corner of Baker Street and O’Callaghans Parade One Every six weeks
May Park May Park Terrace, Horsham Three Every three weeks
Mibus Memorial Cultural Centre, Wimmera Regional Library McLachlan Street, Horsham Four Every six weeks
Roberts Avenue North-East corner of Roberts Avenue and Firebrace Street Three Every three weeks
Jubilee Hall Roberts Avenue, Horsham Two Every six weeks
Safeway Carpark Darlot Street, Horsham One Every three weeks
Town Hall Pynsent Street, Horsham Twelve Every six weeks
Council Offices 43 Firebrace Street, Horsham One Every six weeks
Horsham Regional Livestock Exchange Industrial Estate, Horsham One Every six weeks
Horsham Aerodrome Geodetic Road, Dooen One Every six weeks
Council Depot Selkirk Drive, Horsham One Every six weeks
Green Lake Western Highway, Bungalally Two Every three weeks
Haven Recreation Reserve Henty Highway, Haven Four Every six weeks
Kalkee Road Children's and Community Hub Kalkee Road, Horsham Six Every six weeks
Information Centre Public Toilets O’Callaghans Parade, Horsham One Every six weeks
Natimuk Council Office Main Street, Natimuk Two Every six weeks
Jung Public Toilets Jung North Road, Jung Two Every six weeks
Natimuk Public Toilets Wimmera Highway, Natimuk Two Every six weeks
Cherrypool Public Toilets 8088 Henty Highway, Cherrypool Two Every six weeks
Toolondo Reservoir Public Toilets Wonwondah-Toolondo Road, Toolondo Two Every six weeks
Telangatuk East Hall Telangatuk East Rocklands Road, Telangatuk Two Every six weeks

Drinking Fountains
Asset Identifier Location Number of Fountains Attendance Frequency
Botanic Gardens Botanic Gardens Horsham One Twice Weekly
May Park May Park Terrace, Horsham Three Twice Weekly
Roberts Place Corner Roberts Place and Firebrace Street, Horsham Two Twice Weekly
Sawyer Park Sawyer Park, Dixon Drive, Horsham Two Twice Weekly
Skate Park Skate Park, Park Drive One Twice Weekly
Apex Park Apex Park, Bennett Road One Twice Weekly
Haven Recreation Reserve Henty Highway, Haven Two Twice Weekly
Tables and Chairs
Asset Identifier Location Number of Tables Attendance Frequency
Green Lake Western Highway, Green Lake Four Twice Weekly
Weir Park Barnes Boulevard, Horsham Five Twice Weekly
Air Fresheners
Asset Identifier Location Number of Air Fresheners Attendance Frequency
May Park May Park, Horsham Zero Monthly
Roberts Avenue Corner Roberts Avenue and Firebrace Street, Horsham Zero Monthly

Sharps Containers
Asset Identifier Location Number of containers Empty sharps containers
Roberts Avenue Corner of Roberts Avenue and Firebrace Street, Horsham 3 Monthly
May Park May Park Terrace Horsham 8 Monthly
Safeway Carpark Safeway Carpark, Corner of Darlot Street and Wilson Street, Horsham 3 Monthly
Visitor Information Centre Corner Baker Street and O’Callaghans Parade, Horsham 3 Monthly
Botanical Gardens Firebrace Street South, Horsham 3 Monthly
Sawyer Park Soundshell Reserve, Dixon Drive, Horsham 3 Monthly
Weir Park Barnes Boulevard, Horsham 3 Monthly
City Oval Firebrace Street South, Horsham 1 Monthly
Green Lake (Boat Ramp) Western Highway (Entrance to Horsham) 2 Monthly
Green Lake (Closest to Kiosk) Western Highway (Entrance to Horsham) 3 Monthly
Police Paddocks Reserve Rasmussen Road, Horsham 1 Quarterly
Bennett Road West side of Racecourse Reserve, Horsham 2 Monthly
Natimuk Public Toilets Wimmera Highway, Natimuk 2 Quarterly
Horsham Rowing Club Barnes Boulevard, Horsham 3 Monthly
Jung Public Toilets Jung North Road, Jung 3 Quarterly
Dudley Cornell Park Gertrude Street, Horsham 2 Monthly

Sunnyside Park Cathcart Street, Horsham 2 Monthly
Taylors Lake Horsham Lubeck Road 1 Quarterly
Taylors Lake Fishers Road 1 Quarterly
Botanic Gardens Works Depot Firebrace Street, Horsham -
Aerodrome Terminal Lauries Drive, Dooen (Geodetic Road) 2 Quarterly
Cemetery Davis Drive, Horsham 2 Quarterly
Haven Rec Reserve Haven Recreation Reserve, 4378 Henty Highway , Haven 4 Quarterly
Cherrypool Public Toilets 8088 Henty Highway, Cherrypool -
Natimuk Lake Caravan Park Lake Road, Natimuk 2 Quarterly
Skate Park Park Drive, Horsham 3 Monthly
Hocking Street At City Oval 1 Quarterly
Toolondo Reservoir Public Toilets Wonwondah-Toolondo Road, Toolondo 2 Quarterly

Introduction
This appendix describes Council’s historic approach to project prioritisation as utilised in preparation of the 2021 LTCP.
This process will be reviewed in the light of the outcomes from the Community Panel deliberative engagement on this Asset Plan. The description below has not yet taken into account these changes, which will be developed during preparation of the 2022-23 Council Budget.
Process Overview
Council’s approach to funding prioritisation involves decision trees that lead to the development of a comprehensive Long Term Capex Plan including project sorting, prioritisation, cost estimation and scheduling. A process is in place which uses key principles to guide priorities of the listed projects for the next ten years and to enable further development of the listed projects.
Various sections within the organisation work together to develop a framework of long term capital works plan which is equitable, fair, logical and affordable.
Prioritisation metrics have been developed to enable comparison of the relative merit of projects. Also, a cap on existing asset upgrades is developed based on the replacement value of asset portfolios. Utilising these, a 10-years draft Long Term Capex Plan has been developed.
Key references have been:
• Asset Management Plans for each asset category
• City to River Master Plan
• Urban Transport Plan
• Social Infrastructure Plan
• Aquatic Centre Master Plan
• Zero Carbon Plan
• Horsham Bicycle Strategy
• Future Freight Strategy
For each project identified, an initial cost estimate was developed. Those projects which were not synchronous with Council’s plan were given lower priority or delisted. This process led to listing of projects with relatively higher priority, and affordability over a period of ten years proposing a total capital spend for 10 years of $240 million of which $83 million is renewal and $154.3 million is new/upgrade.
Project Prioritisation Road asset upgrade
The prioritisation of road assets is based on their hierarchy, traffic volume, and percentage of heavy vehicles and whether they are part of a future freight route, scored using the framework shown in the table below.
Prioritisation framework for asset upgrade and creating a new asset
Appendix B Funding Prioritisation
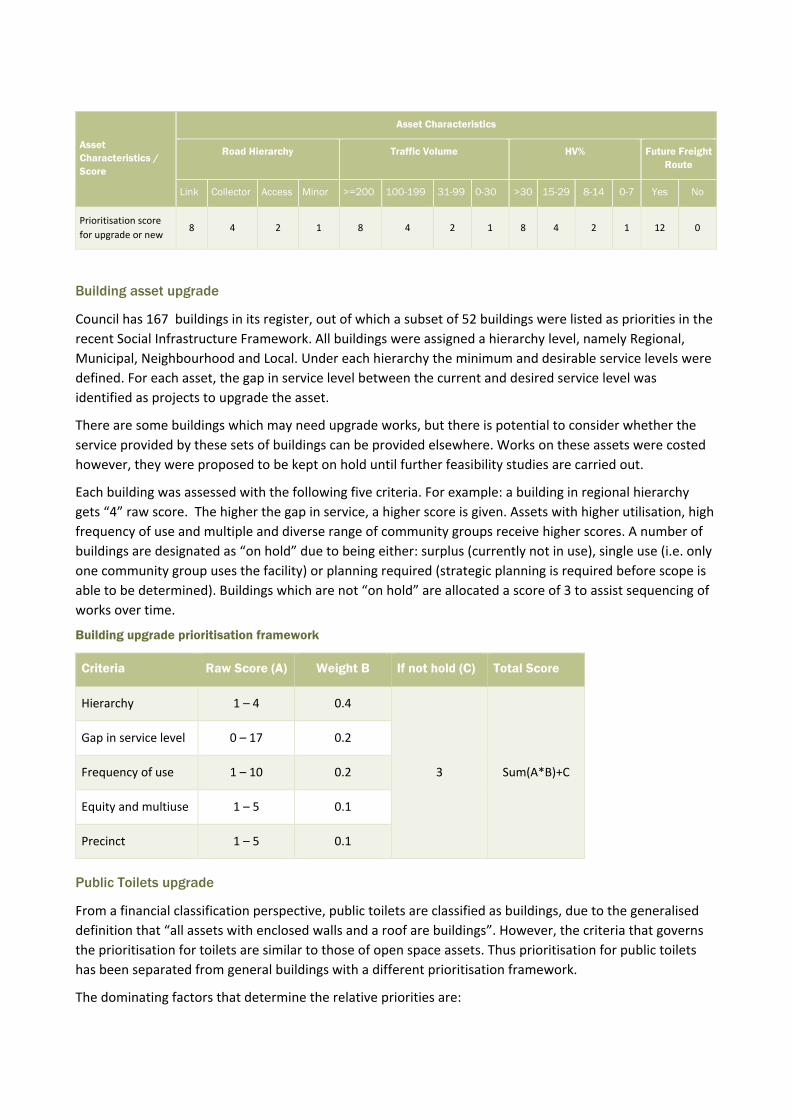
Asset Characteristics / Score
Asset Characteristics
Road Hierarchy Traffic Volume HV% Future Freight Route
Link Collector Access Minor >=200 100-199 31-99 0-30 >30 15-29 8-14 0-7 Yes No
Prioritisation score for upgrade or new
8 4 2 1 8 4 2 1 8 4 2 1 12 0
Building asset upgrade
Council has 167 buildings in its register, out of which a subset of 52 buildings were listed as priorities in the recent Social Infrastructure Framework. All buildings were assigned a hierarchy level, namely Regional, Municipal, Neighbourhood and Local. Under each hierarchy the minimum and desirable service levels were defined. For each asset, the gap in service level between the current and desired service level was identified as projects to upgrade the asset.
There are some buildings which may need upgrade works, but there is potential to consider whether the service provided by these sets of buildings can be provided elsewhere. Works on these assets were costed however, they were proposed to be kept on hold until further feasibility studies are carried out.
Each building was assessed with the following five criteria. For example: a building in regional hierarchy gets “4” raw score. The higher the gap in service, a higher score is given. Assets with higher utilisation, high frequency of use and multiple and diverse range of community groups receive higher scores. A number of buildings are designated as “on hold” due to being either: surplus (currently not in use), single use (i.e. only one community group uses the facility) or planning required (strategic planning is required before scope is able to be determined). Buildings which are not “on hold” are allocated a score of 3 to assist sequencing of works over time.
Building upgrade prioritisation framework
Criteria Raw Score (A) Weight B If not hold (C) Total Score
Hierarchy 1 – 4 0.4
3 Sum(A*B)+C
Gap in service level 0 – 17 0.2
Frequency of use 1 – 10 0.2
Equity and multiuse 1 – 5 0.1
Precinct 1 – 5 0.1
Public Toilets upgrade
From a financial classification perspective, public toilets are classified as buildings, due to the generalised definition that “all assets with enclosed walls and a roof are buildings”. However, the criteria that governs the prioritisation for toilets are similar to those of open space assets. Thus prioritisation for public toilets has been separated from general buildings with a different prioritisation framework.
The dominating factors that determine the relative priorities are:
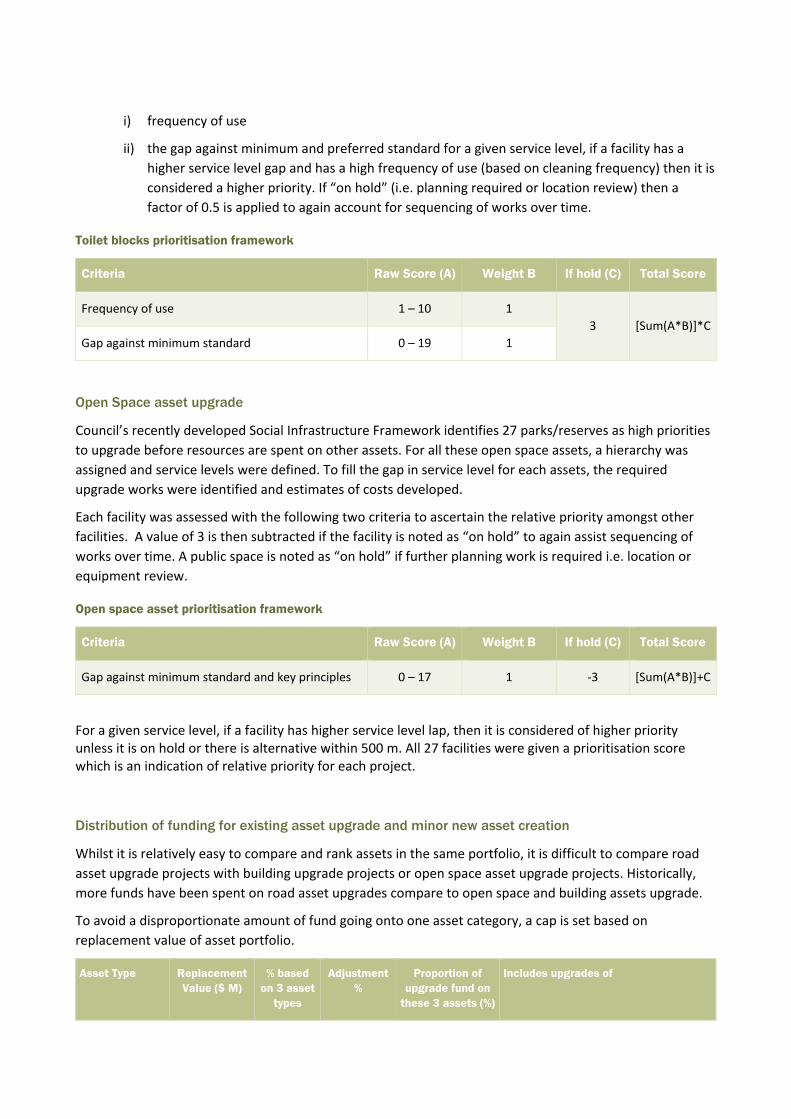
i) frequency of use
ii) the gap against minimum and preferred standard for a given service level, if a facility has ahigher service level gap and has a high frequency of use (based on cleaning frequency) then it isconsidered a higher priority. If “on hold” (i.e. planning required or location review) then afactor of 0.5 is applied to again account for sequencing of works over time.
Toilet blocks prioritisation framework
Criteria Raw Score (A) Weight B If hold (C) Total Score
Frequency of use 1 – 10 1 3 [Sum(A*B)]*C
Gap against minimum standard 0 – 19 1
Open Space asset upgrade
Council’s recently developed Social Infrastructure Framework identifies 27 parks/reserves as high priorities to upgrade before resources are spent on other assets. For all these open space assets, a hierarchy was assigned and service levels were defined. To fill the gap in service level for each assets, the required upgrade works were identified and estimates of costs developed.
Each facility was assessed with the following two criteria to ascertain the relative priority amongst other facilities. A value of 3 is then subtracted if the facility is noted as “on hold” to again assist sequencing of works over time. A public space is noted as “on hold” if further planning work is required i.e. location or equipment review.
Open space asset prioritisation framework
Criteria Raw Score (A) Weight B If hold (C) Total Score
Gap against minimum standard and key principles 0 – 17 1 -3 [Sum(A*B)]+C
For a given service level, if a facility has higher service level lap, then it is considered of higher priority unless it is on hold or there is alternative within 500 m. All 27 facilities were given a prioritisation score which is an indication of relative priority for each project.
Distribution of funding for existing asset upgrade and minor new asset creation
Whilst it is relatively easy to compare and rank assets in the same portfolio, it is difficult to compare road asset upgrade projects with building upgrade projects or open space asset upgrade projects. Historically, more funds have been spent on road asset upgrades compare to open space and building assets upgrade.
To avoid a disproportionate amount of fund going onto one asset category, a cap is set based on replacement value of asset portfolio.
Asset Type Replacement Value ($ M)
% based on 3 asset
types
Adjustment %
Proportion of upgrade fund on
these 3 assets (%)
Includes upgrades of
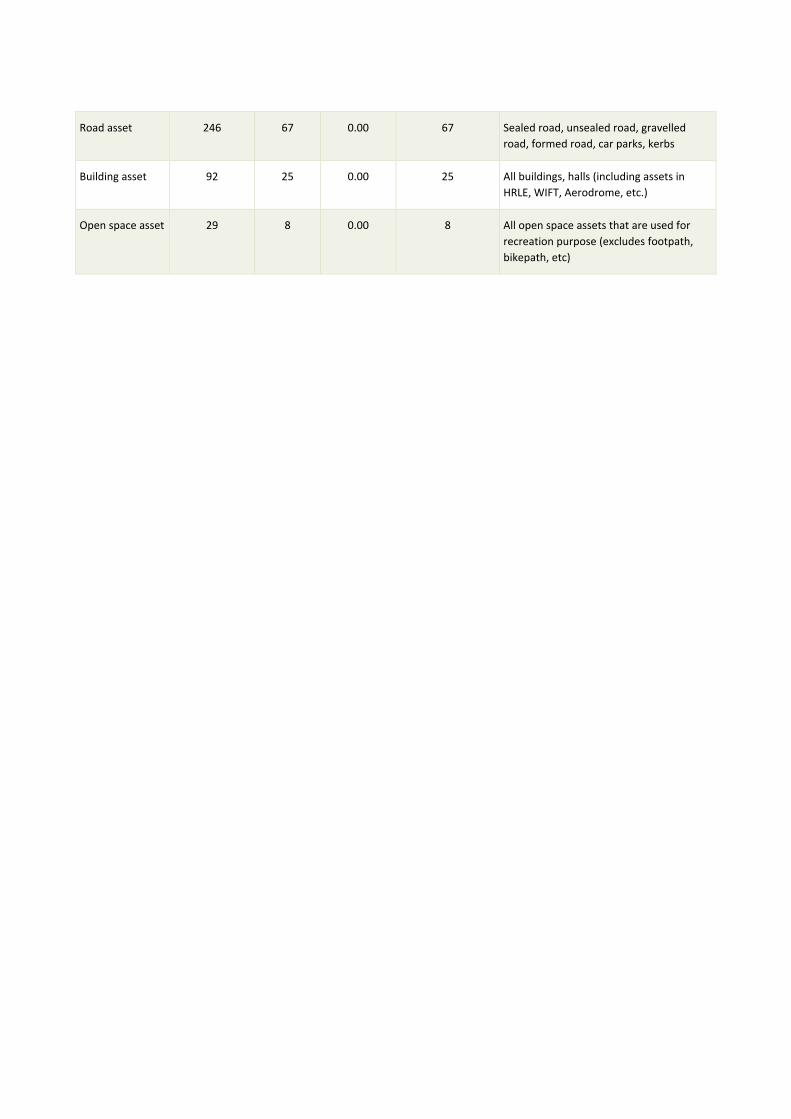
Road asset 246 67 0.00 67 Sealed road, unsealed road, gravelled road, formed road, car parks, kerbs
Building asset 92 25 0.00 25 All buildings, halls (including assets in HRLE, WIFT, Aerodrome, etc.)
Open space asset 29 8 0.00 8 All open space assets that are used for recreation purpose (excludes footpath, bikepath, etc)