Embed Size (px)
Citation preview

THIS COVER IN AUGUST The Review Body on
Doctors’ & Dentists’ Remuneration
Review for 2018
General Medical Practitioners and
General Dental Practitioners
December 2017
OFFICIAL
1
The Review Body on Doctors’ and Dentists’ Remuneration NHS England’s Evidence for the 2018 Review
Version number: 1.0.
First published on 29 December 2017.
Prepared by:
Mike Kemp, Senior Finance Lead and Joanne Lowther, Finance Manager National Primary Care Contracts (GP and Dental respectively) Strategic Finance NHS England Room 8E28 Quarry House Quarry Hill Leeds LS2 7UE Email: [email protected] or [email protected] Classification: Official
OFFICIAL
2
Contents
Introduction 4
Background 4
Contract for services 4
Affordability and funding constraints 4
Chapter 1: General Medical Practitioners (GMPs) 6
Introduction 6
Background 6
Current numbers of Full Time Equivalent (FTE) GMPs and contract types 6
Statistical publications and data comparisons 6
Current numbers of GMPs (headcount and FTE) by age and type 7
Numbers of GMP locums 9
Recruitment, retention and motivation of GMPs 9
Workload of GMPs 10
Policy and transformation updates 12
General Practice Forward View (GPFV) and progress to date 12
Five Year Forward View update 14
Sustainability and Transformation Partnerships (STPs) 15
Workforce planning issues 15
Trends in the earnings and expenses of GMPs 16
NHS pension scheme 21
Clinical Commissioning Groups (CCGs) 22
GMS contract changes in 2017/18 22
GMS contract changes in 2018/19 24
Conclusion 25
Chapter 2 – General Dental Practitioners (GDPs) 26
Introduction 26
Background 26
Smile4Life prevention initiatives 27
Access to NHS dental services 29
General Dental Practitioners: recruitment, retention and motivation 30
Future workforce supply 31
General Dental Practitioners: earnings and expenses 32
Net earnings 33
Expenses 35
NHS pension scheme 37

OFFICIAL
3
2017/18 settlement 38
Salaried dentists 38
Contract changes in 2018/19 39
General Dental Practitioners: conclusion 39
OFFICIAL
4
Introduction
Background
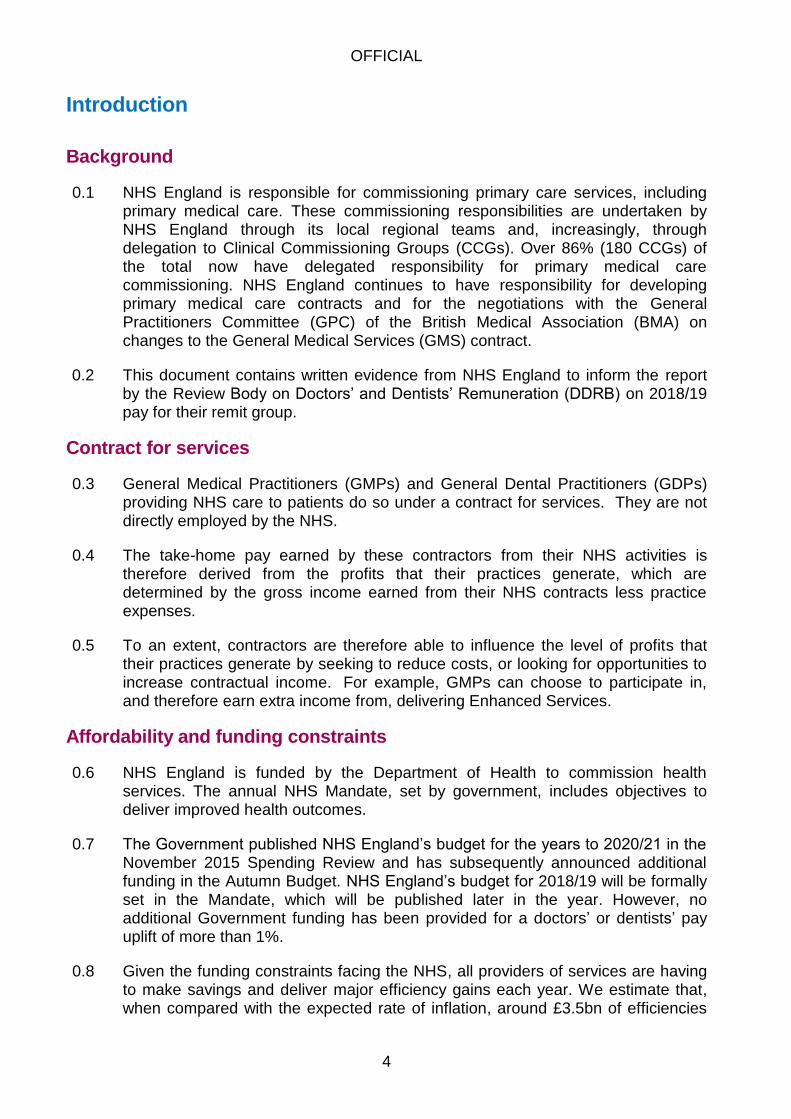
0.1 NHS England is responsible for commissioning primary care services, including primary medical care. These commissioning responsibilities are undertaken by NHS England through its local regional teams and, increasingly, through delegation to Clinical Commissioning Groups (CCGs). Over 86% (180 CCGs) of the total now have delegated responsibility for primary medical care commissioning. NHS England continues to have responsibility for developing primary medical care contracts and for the negotiations with the General Practitioners Committee (GPC) of the British Medical Association (BMA) on changes to the General Medical Services (GMS) contract.
0.2 This document contains written evidence from NHS England to inform the report by the Review Body on Doctors’ and Dentists’ Remuneration (DDRB) on 2018/19 pay for their remit group.
Contract for services
0.3 General Medical Practitioners (GMPs) and General Dental Practitioners (GDPs) providing NHS care to patients do so under a contract for services. They are not directly employed by the NHS.
0.4 The take-home pay earned by these contractors from their NHS activities is therefore derived from the profits that their practices generate, which are determined by the gross income earned from their NHS contracts less practice expenses.
0.5 To an extent, contractors are therefore able to influence the level of profits that their practices generate by seeking to reduce costs, or looking for opportunities to increase contractual income. For example, GMPs can choose to participate in, and therefore earn extra income from, delivering Enhanced Services.
Affordability and funding constraints
0.6 NHS England is funded by the Department of Health to commission health services. The annual NHS Mandate, set by government, includes objectives to deliver improved health outcomes.
0.7 The Government published NHS England’s budget for the years to 2020/21 in the November 2015 Spending Review and has subsequently announced additional funding in the Autumn Budget. NHS England’s budget for 2018/19 will be formally set in the Mandate, which will be published later in the year. However, no additional Government funding has been provided for a doctors’ or dentists’ pay uplift of more than 1%.
0.8 Given the funding constraints facing the NHS, all providers of services are having to make savings and deliver major efficiency gains each year. We estimate that, when compared with the expected rate of inflation, around £3.5bn of efficiencies

OFFICIAL
5
between 2015/16 and 2020/21 would be delivered by the application of the government’s previously announced 1% public sector pay cap to 2019/20.
OFFICIAL
6
Chapter 1: General Medical Practitioners (GMPs)
Introduction
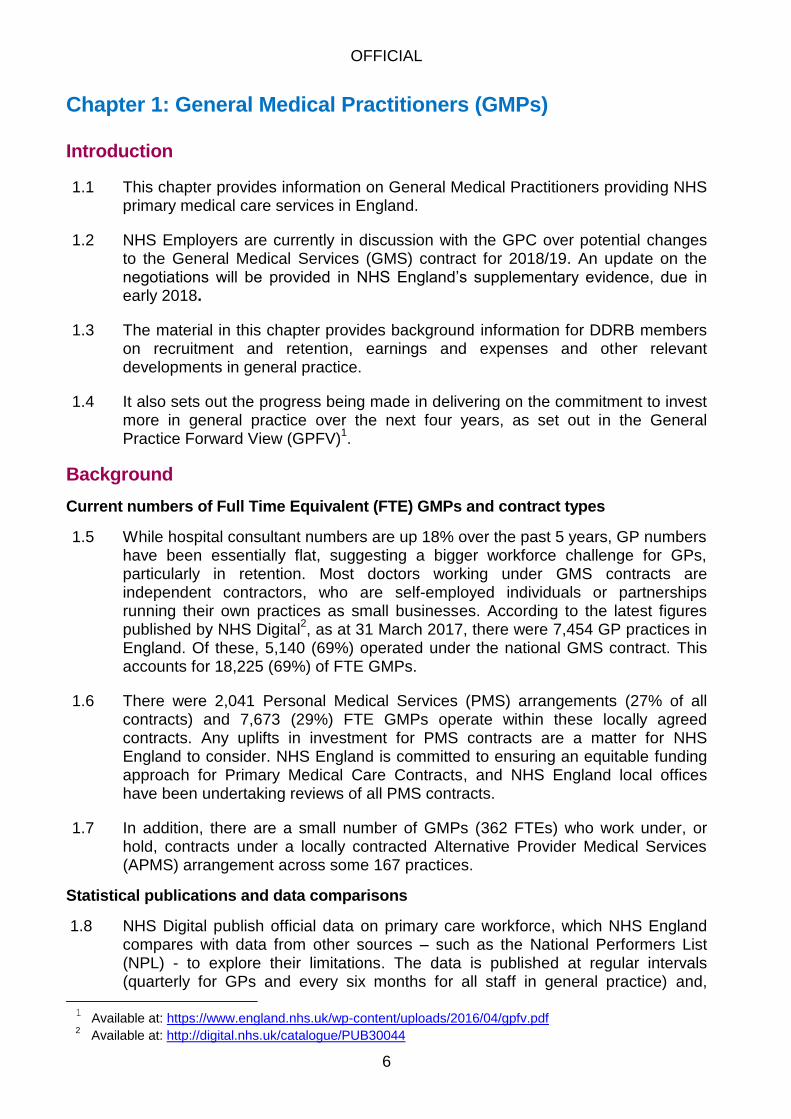
1.1 This chapter provides information on General Medical Practitioners providing NHS primary medical care services in England.
1.2 NHS Employers are currently in discussion with the GPC over potential changes to the General Medical Services (GMS) contract for 2018/19. An update on the negotiations will be provided in NHS England’s supplementary evidence, due in early 2018.
1.3 The material in this chapter provides background information for DDRB members on recruitment and retention, earnings and expenses and other relevant developments in general practice.
1.4 It also sets out the progress being made in delivering on the commitment to invest more in general practice over the next four years, as set out in the General Practice Forward View (GPFV)
1.
Background
Current numbers of Full Time Equivalent (FTE) GMPs and contract types
1.5 While hospital consultant numbers are up 18% over the past 5 years, GP numbers have been essentially flat, suggesting a bigger workforce challenge for GPs, particularly in retention. Most doctors working under GMS contracts are independent contractors, who are self-employed individuals or partnerships running their own practices as small businesses. According to the latest figures published by NHS Digital
2, as at 31 March 2017, there were 7,454 GP practices in
England. Of these, 5,140 (69%) operated under the national GMS contract. This accounts for 18,225 (69%) of FTE GMPs.
1.6 There were 2,041 Personal Medical Services (PMS) arrangements (27% of all contracts) and 7,673 (29%) FTE GMPs operate within these locally agreed contracts. Any uplifts in investment for PMS contracts are a matter for NHS England to consider. NHS England is committed to ensuring an equitable funding approach for Primary Medical Care Contracts, and NHS England local offices have been undertaking reviews of all PMS contracts.
1.7 In addition, there are a small number of GMPs (362 FTEs) who work under, or hold, contracts under a locally contracted Alternative Provider Medical Services (APMS) arrangement across some 167 practices.
Statistical publications and data comparisons
1.8 NHS Digital publish official data on primary care workforce, which NHS England compares with data from other sources – such as the National Performers List (NPL) - to explore their limitations. The data is published at regular intervals (quarterly for GPs and every six months for all staff in general practice) and,
1 Available at: https://www.england.nhs.uk/wp-content/uploads/2016/04/gpfv.pdf
2 Available at: http://digital.nhs.uk/catalogue/PUB30044
OFFICIAL
7
hitherto, with a time series showing the changes from September 2015. Due to the use of some provisional data, NHS Digital have caveated the latest (September 2017) GP statistics by classing them as ‘provisional experimental’ and care needs to be taken when interpreting these figures. In addition, NHS Digital has been working to improve the capture of GP locum data and the ‘all practitioners’ figures are therefore not directly comparable with previous information. Further detail is provided in the “Data Quality” section of the report.
1.9 NHS Digital also collects information on practice vacancies. Based on the 1,218 practices who submitted vacancy data, they reported that there were 277 FTE GP vacancies from October 2016 – March 2017. However, the BMA’s last Quarterly Survey (Q3 2017)
3 suggests that 50% (of the 39% of doctor respondents) reported
GP vacancies in the practices in which they work (up from the 48%, reported by the 42% of doctor respondents, in the Q2 2017 survey). We will therefore be working with BMA colleagues to support reporting improvements going forwards.
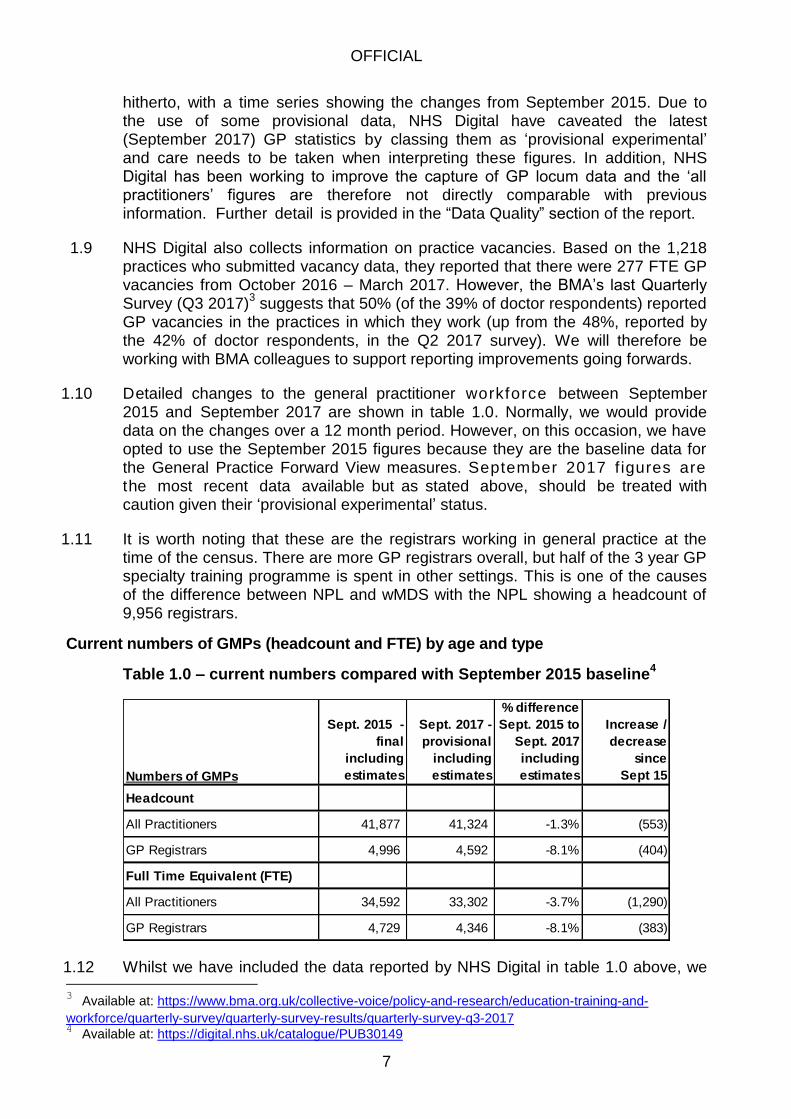
1.10 Detailed changes to the general practitioner workforce between September 2015 and September 2017 are shown in table 1.0. Normally, we would provide data on the changes over a 12 month period. However, on this occasion, we have opted to use the September 2015 figures because they are the baseline data for the General Practice Forward View measures. September 2017 f igures are the most recent data available but as stated above, should be treated with caution given their ‘provisional experimental’ status.
1.11 It is worth noting that these are the registrars working in general practice at the time of the census. There are more GP registrars overall, but half of the 3 year GP specialty training programme is spent in other settings. This is one of the causes of the difference between NPL and wMDS with the NPL showing a headcount of 9,956 registrars.
Current numbers of GMPs (headcount and FTE) by age and type
Table 1.0 – current numbers compared with September 2015 baseline4
Numbers of GMPs
Sept. 2015 -
final
including
estimates
Sept. 2017 -
provisional
including
estimates
% difference
Sept. 2015 to
Sept. 2017
including
estimates
Increase /
decrease
since
Sept 15
Headcount
All Practitioners 41,877 41,324 -1.3% (553)
GP Registrars 4,996 4,592 -8.1% (404)
Full Time Equivalent (FTE)
All Practitioners 34,592 33,302 -3.7% (1,290)
GP Registrars 4,729 4,346 -8.1% (383)
1.12 Whilst we have included the data reported by NHS Digital in table 1.0 above, we 3 Available at: https://www.bma.org.uk/collective-voice/policy-and-research/education-training-and-
workforce/quarterly-survey/quarterly-survey-results/quarterly-survey-q3-2017 4 Available at: https://digital.nhs.uk/catalogue/PUB30149
OFFICIAL
8
are aware of data quality issues that may be affecting the comparison. The issues have arisen due to the low levels of reporting and the fact that the GP Registrar data has been supplemented with an extract from the Electronic Staff Record (ESR) system. The table shows that, at September 2017, in headcount terms, there were 41,324 doctors working in general practice, taking GMPs, GP registrars and GP locums together – a reduction of 553 (1.3%) since September 2015. In Full Time Equivalent (FTE) terms, there were an estimated 33,302 GMPs - a reduction of 1,290 (3.7%) since September 2015.
1.13 There are now 4,592 GMP registrars, an estimated reduction of 404 (8.1%) since September 2015 and an estimated increase of 2,028 (79.1%), since 2005. In Full Time Equivalent (FTE) terms, there were an estimated 4,346 GMP registrars - an estimated reduction of 383 (8.1%) since September 2015.
1.14 Within the overall numbers, there were some GPs whose job role was ‘Not Stated’ in previous censuses, therefore preventing comparisons at job role level. NHS Digital has now retrospectively rectified the September 2015 and March 2016 data and job role level comparisons can now be made across that period.
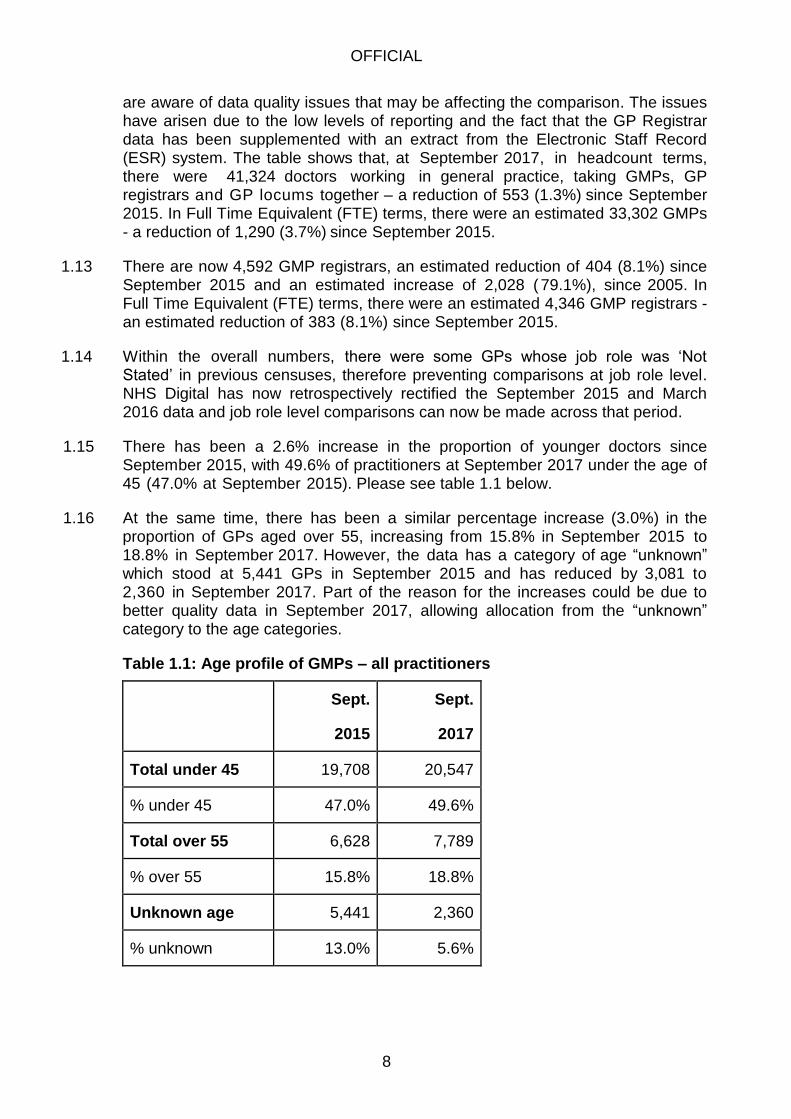
1.15 There has been a 2.6% increase in the proportion of younger doctors since September 2015, with 49.6% of practitioners at September 2017 under the age of 45 (47.0% at September 2015). Please see table 1.1 below.
1.16 At the same time, there has been a similar percentage increase (3.0%) in the proportion of GPs aged over 55, increasing from 15.8% in September 2015 to 18.8% in September 2017. However, the data has a category of age “unknown” which stood at 5,441 GPs in September 2015 and has reduced by 3,081 to 2,360 in September 2017. Part of the reason for the increases could be due to better quality data in September 2017, allowing allocation from the “unknown” category to the age categories.
Table 1.1: Age profile of GMPs – all practitioners
Sept.
2015
Sept.
2017
Total under 45 19,708 20,547
% under 45 47.0% 49.6%
Total over 55 6,628 7,789
% over 55 15.8% 18.8%
Unknown age 5,441 2,360
% unknown 13.0% 5.6%
OFFICIAL
9
Numbers of GMP locums
1.17 In previous reports, DDRB asked whether there was data on the use of GP locums:
The overall cost of locum allowances paid to practices rose by 3% from £31.8m in 2015/16 to £32.7m in 2016
5.
This does not reflect the full costs of locum cover to practices, as practices will also incur costs employing locums that are not covered by allowances, and data on the FTE numbers of locums used in each year isn’t published.
Overall numbers of G P s d e s c r i b i n g t h e m s e l ve s p r i n c i p a l l y a s locums o n t h e NP L increased by 801 (7%) to 12,203 in the period between 18
th January and 24
th August 2016. This suggests that the NHS
Digital numbers are not yet accurately capturing the number of locums working in general practice and we therefore supplement the NHS Digital data with data from the NPL.
The NPL shows that, during that period, there has been a decline in the proportion of all GPs as recorded on the NPL that are Partners, reducing from 45.5% to 41.1%. Conversely the proportion of all GPs on NPL that are recorded as locums has increased from 21.1% to 22.5%. However, some of the data associated with the NPL is affected by delays in amendments to a doctor’s registration on the NPL.
1.18 NHS Digital has been working with practices to improve the capture of GP locum data and there was a large increase in headcount and FTE between December 2016 and March 2017. The figures remained high in September 2017, with an increase of 1,261 headcount (92.0%) and 463 FTE (81.6%) when compared to September 2015. (Though still very significantly below those on the NPL).
1.19 As the NPL data (also supported by other evidence) suggest that number of locums is significantly higher than those currently published, system changes have recently been implemented by NHS Digital to further improve this position.
Recruitment, retention and motivation of GMPs
Improving recruitment and retention
1.20 NHS England acknowledged the workload, pressures and recruitment and retention challenges in the General Practice Forward View
6 and has, in
conjunction with the profession, been developing measures to help improve recruitment and retention. This includes both specific workforce schemes, such as changes to the induction and refresher scheme and the GP Career Plus pilot and also the wider package of support set out in the General Practice Forward View. This included the recently expanded international recruitment programme.
Salaried GPs
5 Available at Annex A2 – Supplementary Information at p17 here: http://digital.nhs.uk/catalogue/PUB30090
6 Available at: pp4-7 here: https://www.england.nhs.uk/ourwork/gpfv/
OFFICIAL
10
1.21 It should be noted that, although GP recruitment and retention is increasingly challenging in some areas of the country, as the DDRB recommendation only affects the contract price, salaried GP pay may not be automatically up-rated to reflect any uplift to the contract price that is provided as a result of a DDRB recommendation.
Work Life Surveys
1.22 The Eighth National GP Work Life Survey7 (published on 1 October 2015)
conducted by Manchester University in spring and summer 2015, on working conditions and job satisfaction of GMPs, is the most up to date, comparable evidence in measuring GMP satisfaction based on the 1,172 responses from 4,000 GMPs (in England). This showed that:
on a seven-point scale, overall average job satisfaction was 4.1 points in 2015;
average working hours had reduced slightly from 41.7 in 2012 to 41.4 hours per week in 2015, back to the same levels in the 2010 survey - which had remained unchanged since the 2008 survey; and
the proportion of GPs expecting to quit direct patient care in the next five years was 13.1% in 2015 amongst GPs under 50 years-old and 60.9% amongst GPs aged 50 years and over.
1.23 Manchester University have developed the Ninth National GP Work Life Survey, which was issued to the profession during October. It is expected that the survey’s results will be published during the first quarter of the New Year – i.e. in time for DDRB to review before finalising their report.
Workload of GMPs
Patients per practitioner and the changing skill mix in general practice
1.24 Whilst the number of patients per FTE GMP has risen, there has been a small reduction in the average hours reported as worked. This may be explained by the fact that the overall ratio of patients to total clinical practice staff, including GMPs has fallen by over 5% since 2005, meaning that more patients are now seen by other (i.e. non-GP) clinical staff.
1.25 The average number of patients per medical practitioner in England rose from 1,613 in 2005 to 1,693 (an increase of 5%) at March 2017, mainly because the skill mix in general practice changed significantly over that period – i.e. up to and beyond 2015. That has meant that, as practices have, on average, increased the proportion of other clinical practice staff compared with GMPs, such as practice nurses, the ratio of patients to GMPs has increased.
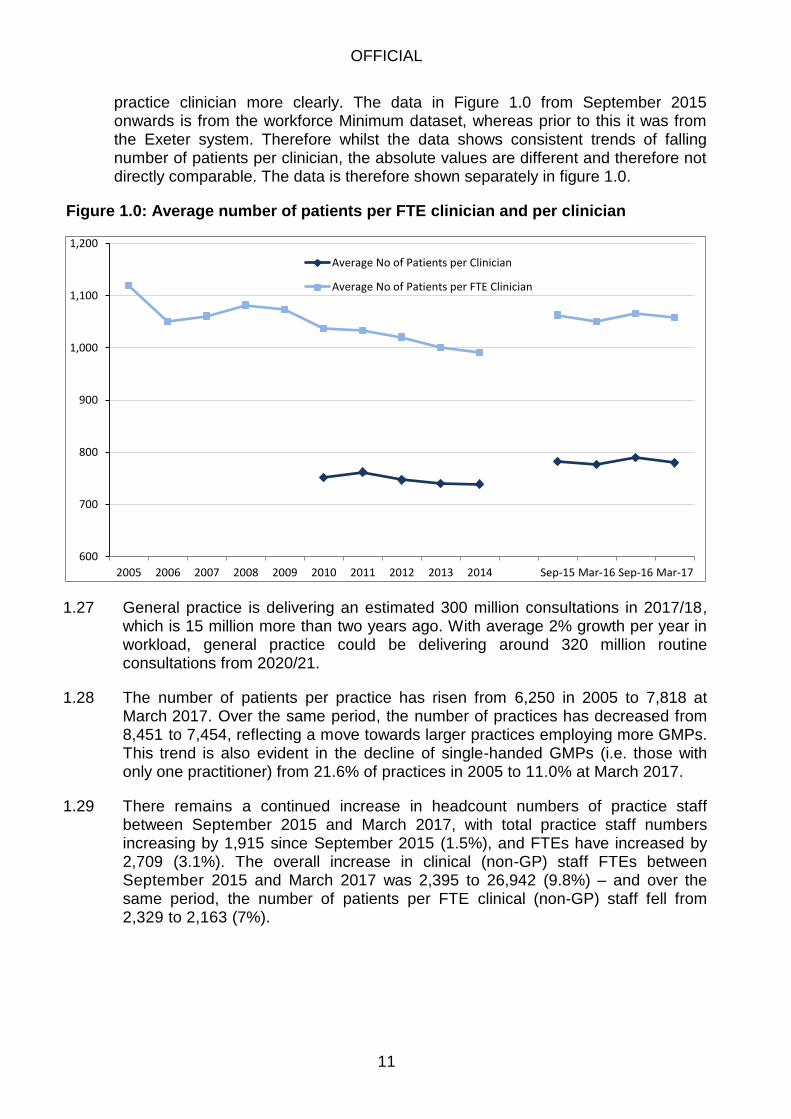
1.26 The graph in Figure 1.0 below shows the trend in the number of patients per
7 Available at: http://www.population-
health.manchester.ac.uk/healtheconomics/research/Reports/EighthNationalGPWorklife
Surveyreport/EighthNationalGPWorklifeSurveyreport.pdf
OFFICIAL
11
practice clinician more clearly. The data in Figure 1.0 from September 2015 onwards is from the workforce Minimum dataset, whereas prior to this it was from the Exeter system. Therefore whilst the data shows consistent trends of falling number of patients per clinician, the absolute values are different and therefore not directly comparable. The data is therefore shown separately in figure 1.0.
Figure 1.0: Average number of patients per FTE clinician and per clinician
600
700
800
900
1,000
1,100
1,200
2005 2006 2007 2008 2009 2010 2011 2012 2013 2014 Sep-15 Mar-16 Sep-16 Mar-17
Average No of Patients per Clinician
Average No of Patients per FTE Clinician
1.27 General practice is delivering an estimated 300 million consultations in 2017/18, which is 15 million more than two years ago. With average 2% growth per year in workload, general practice could be delivering around 320 million routine consultations from 2020/21.
1.28 The number of patients per practice has risen from 6,250 in 2005 to 7,818 at March 2017. Over the same period, the number of practices has decreased from 8,451 to 7,454, reflecting a move towards larger practices employing more GMPs. This trend is also evident in the decline of single-handed GMPs (i.e. those with only one practitioner) from 21.6% of practices in 2005 to 11.0% at March 2017.
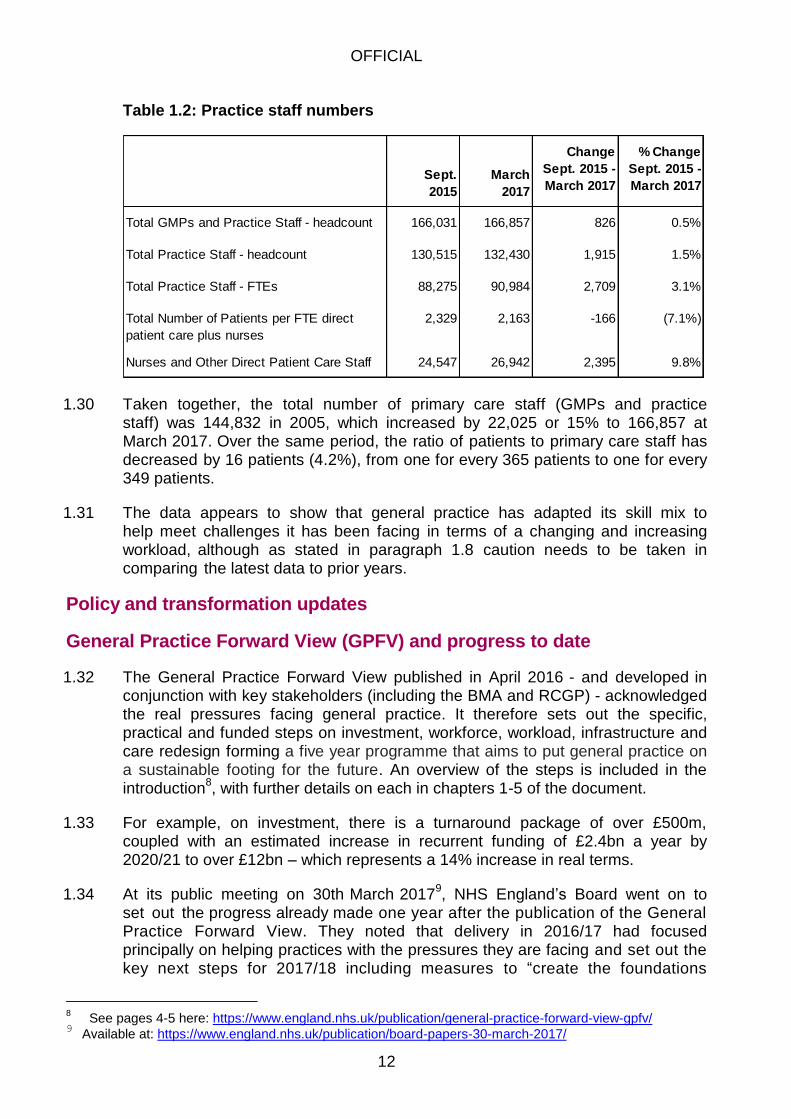
1.29 There remains a continued increase in headcount numbers of practice staff between September 2015 and March 2017, with total practice staff numbers increasing by 1,915 since September 2015 (1.5%), and FTEs have increased by 2,709 (3.1%). The overall increase in clinical (non-GP) staff FTEs between September 2015 and March 2017 was 2,395 to 26,942 (9.8%) – and over the same period, the number of patients per FTE clinical (non-GP) staff fell from 2,329 to 2,163 (7%).
OFFICIAL
12
Table 1.2: Practice staff numbers
Sept.
2015
March
2017
Change
Sept. 2015 -
March 2017
% Change
Sept. 2015 -
March 2017
Total GMPs and Practice Staff - headcount 166,031 166,857 826 0.5%
Total Practice Staff - headcount 130,515 132,430 1,915 1.5%
Total Practice Staff - FTEs 88,275 90,984 2,709 3.1%
Total Number of Patients per FTE direct
patient care plus nurses
2,329 2,163 -166 (7.1%)
Nurses and Other Direct Patient Care Staff 24,547 26,942 2,395 9.8%
1.30 Taken together, the total number of primary care staff (GMPs and practice staff) was 144,832 in 2005, which increased by 22,025 or 15% to 166,857 at March 2017. Over the same period, the ratio of patients to primary care staff has decreased by 16 patients (4.2%), from one for every 365 patients to one for every 349 patients.
1.31 The data appears to show that general practice has adapted its skill mix to help meet challenges it has been facing in terms of a changing and increasing workload, although as stated in paragraph 1.8 caution needs to be taken in comparing the latest data to prior years.
Policy and transformation updates
General Practice Forward View (GPFV) and progress to date
1.32 The General Practice Forward View published in April 2016 - and developed in
conjunction with key stakeholders (including the BMA and RCGP) - acknowledged the real pressures facing general practice. It therefore sets out the specific, practical and funded steps on investment, workforce, workload, infrastructure and care redesign forming a five year programme that aims to put general practice on a sustainable footing for the future. An overview of the steps is included in the introduction
8, with further details on each in chapters 1-5 of the document.
1.33 For example, on investment, there is a turnaround package of over £500m, coupled with an estimated increase in recurrent funding of £2.4bn a year by 2020/21 to over £12bn – which represents a 14% increase in real terms.
1.34 At its public meeting on 30th March 20179, NHS England’s Board went on to
set out the progress already made one year after the publication of the General Practice Forward View. They noted that delivery in 2016/17 had focused principally on helping practices with the pressures they are facing and set out the key next steps for 2017/18 including measures to “create the foundations
8 See pages 4-5 here: https://www.england.nhs.uk/publication/general-practice-forward-view-gpfv/ 9 Available at: https://www.england.nhs.uk/publication/board-papers-30-march-2017/
OFFICIAL
13
needed to enable general practice to take its place at the heart of population-based health care, whether in a primary care home or one of new models of care”.
1.35 The next steps included:
continuing to increase investment in general practice. This will include:
an extra £301 million into core primary medical care allocations in 2017/18;
CCG plans to invest £171 million over 2017/18 and 2018/19 for Practice Transformational Support; and
a range of other targeted investments to support improving access, infrastructure and building the workforce;
improving practice resilience – continuing to roll out the Practice Resilience Programme and the national GP Development Programme so that, over time, all practices can benefit from the latest thinking in ways to manage workload and improve patient experience; and
investment in infrastructure: this is a multi-year programme and, now that there is an established pipeline, this will begin to accelerate during 2017/18.
Access to GP Services: the Prime Minister’s Challenge Fund/GP Access Fund
1.36 The Government’s Mandate to NHS England10
set objectives to 2020, including:
“…to ensure everyone has easier and more convenient access to GP services, including appointments at evening and weekends where it is more convenient for them.”
1.37 NHS England has piloted new innovative approaches to extending and improving access through two waves of schemes in the Prime Minister’s Challenge Fund and then the GP Access Fund
11. These schemes have stimulated transformational
and sustainable change, with practices joining together to deliver a broader range of at scale services. This has been delivered through hub and spoke models and increased the choice and range of contact modes for patients through the use of broader, multi-disciplinary teams and increased use of digital technology.
1.38 Learning from these approaches, NHS England set out in the NHS Operational Planning and Contracting Guidance 2017-2019, seven national requirements that would need to be met for new national funding. It also set out the trajectory for national rollout that would deliver full England coverage by no later than March 2019.
10
https://www.england.nhs.uk/wp-content/uploads/2015/12/05.PB_.17.12.15-Annex-A-Mandate-to-NHS-England.pdf 11 https://www.england.nhs.uk/deliver-forward-view/
OFFICIAL
14
1.39 CCGs have submitted their delivery plans and NHS England has a process in place to track and ensure delivery.
1.40 NHS England is also working to share learning from the GP Access schemes to spread innovation across the NHS, through published guidance - including through an independent national evaluation, case studies and support products which include:
a communications guide and resource pack, designed to support commissioners and providers ensure services are advertised to patients, including featuring information on practice websites;
an inequalities resource, designed to support commissioners and providers address issues of inequalities in patients’ experience of accessing general practice and put in place actions to resolve issues;
top tips for general practice providers on key areas for establishing improved access to general practice services; and
a GP Workload Tool is being made available in 2017, which will provide each practice with a workload utilisation report using their own data. This can be used to better understand appointment activity and how it varies over time to better match supply of appointments more closely to demand.
1.41 The Improving Access to General Practice programme is a key part of helping to address workload issues in general practice, by investing in additional capacity that will divert some demand away from core general practice.
Five Year Forward View update
1.42 In 2015, 50 sites were selected as vanguards, following a process involving workshops and the engagement of key partners and patient representative groups. The vanguards are leading the development of new care models, including innovations in primary medical care, that are acting as the blueprints for the NHS moving forward and the inspiration to the rest of the health and care system
12.
1.43 During 2016/17, the vanguard programme focused on supporting sites to deliver their care models and sharing the learning of the programme through care model frameworks and other routes. From 2017/18, the programme will focus on supporting the vanguards to fully deliver their care models and increase the population coverage of new care models through working with the shadow ACSs.
1.44 The impact of the interventions, integrated workforce models and care model changes being implemented by the vanguards on:
health and wellbeing;
care and quality (including patient experience and staff engagement); and
efficiency
12
https://www.england.nhs.uk/ourwork/futurenhs/new-care-models/
OFFICIAL
15
is being evaluated nationally using a set of national metrics. These high level
outcome indicators for each care model type are reported quarterly and compared to the results for the rest of the country. Vanguards have set up local evaluations which look at the impact of their programmes on key local indicators, and the factors driving any changes.
Sustainability and Transformation Partnerships (STPs)
1.45 The NHS and local councils have formed partnerships in 44 areas covering all of England, to improve health and care. Each area has developed proposals built around the needs of the whole population in the area
13.
1.46 STPs will increasingly involve GPs working alongside other health professionals in hubs or networks, serving populations of 30,000-50,000 people, and providing tailored care to meet the needs of different groups of people. STPs are aiming to provide more care out of hospital, and GPs and other professionals working in primary care will be at the centre of providing this. NHS England is supporting the development of primary care networks in STPs and ACSs
14.
Workforce planning issues
1.47 The General Practice Forward View cannot be delivered without sufficient recruitment and workforce expansion. Therefore, NHS England and Health Education England (HEE) have set ambitious targets, supporting the government commitment to double the rate of growth of the medical workforce and create an extra 5,000 additional doctors working in general practice by 2020 and a further 5,000 other practice staff by 2020/21.
1.48 NHS England therefore worked closely with the Royal College of General Practitioners (RCGP), the British Medical Association (BMA) and Health Education England (HEE) to jointly develop and launch an initial 10 point action plan – “Building the Workforce - the new Deal for General Practice”
15 (published January
2015) “to ensure that we have a skilled, trained and motivated workforce in general practice”.
This work now continues through the delivery of the General Practice Forward View, with the aim being to “try to double the growth rate in GPs, through new incentives for training, recruitment, retention and return to practice” - and support initiatives to build capacity and capability in the wider non-medical workforce.
1.49 As part of this, a pilot to test the role of clinical pharmacists in general practice
was rolled out, leading to over 490 clinical pharmacists supporting approximately 650 practices across the country. The scheme is now being expanded to enable every practice to access a clinical pharmacist across a minimum population, on average, of 30,000 - which will lead to an extra 1,500 pharmacists in general practice. In addition to the pilots, applications have now been approved for more than 600 clinical pharmacists covering 2,372 GP sites
13
Further information is available at: https://www.england.nhs.uk/stps/ 14
Further information is available at: https://www.england.nhs.uk/five-year-forward-view/next-steps-on-the-
nhs-five-year-forward-view/primary-care/ and also Chapter 6 on integrating care locally here 15
http://www.england.nhs.uk/commissioning/primary-care-comm/gp-action-plan/
OFFICIAL
16
that will benefit an additional 23 million patients.
1.50 Whilst it is a little early to define the precise impact of these clinical pharmacists on GP retention and motivation, a full evaluation is already underway and early indications are positive. There are good examples of the difference they are already making. In Wallingbrook Health Group in Devon, for example, placing a clinical pharmacist in GP surgeries has reduced the need for patient GP appointments by 30%, making a significant impact on GP workloads and patient outcomes
16.
1.51 It is part of a wider programme to support practices with changing their skill mix where that can help with pressures in general practice and to deliver the patient care required in the most cost effective way.
1.52 To help deliver t h e g o v e r n m e n t ’ s commitment, Health Education England has increased the number of GP training places to 3,250 per year. In addition, NHS England has introduced some specific schemes to make extra funding available for GPs who choose to work in practices that have been identified as hard to recruit. Furthermore, the existing retained doctor scheme has been revised with increases in funding.
1.53 There have been a number of improvements to the induction and refresher scheme to help GPs return to English general practice, with further improvements planned in order to support the goal of attracting back an extra 500 doctors between 2016/17 and 2020/21. NHS England is working with the profession to consider what further targeted action is needed, including the GP Career Plus pilot - which will test a range of ways to offer greater flexibility and support to keep hold of the vital skills and experience of GPs on the verge of leaving general practice
17.
1.54 In addition, NHS England recently announced that we will begin rapidly expanding the current international recruitment programme of both European Economic Area (EEA) and non-EEA doctors. We published an advertisement in the Official Journal of the European Union (OJEU), inviting expressions of interest from companies who will support the recruitment and relocation of overseas doctors. Nine companies have been selected and we will soon have a Framework Agreement with International Recruitment providers in place to operate in EEA countries - and more widely. These companies will be tasked with identifying at least 2,000 doctors working abroad to come and work as a GP in England. This will include targeted marketing and relocation packages to attract doctors into England.
Trends in the earnings and expenses of GMPs
1.55 In 2016/17, the investment of the NHS in England in primary medical services increased to £10.2 billion
18 compared with £5.8 billion in 2003/04. This represents
an overall real-terms increase of 36%, and a 3.2% real terms increase compared
16
Available at: https://www.england.nhs.uk/gp/case-studies/wallingbrook-health-group/ 17
Available at: https://www.england.nhs.uk/gp/gpfv/workforce/retaining-the-current-medical-workforce/gp-
career-plus/ 18
http://www.digital.nhs.uk/catalogue/PUB21317
OFFICIAL
17
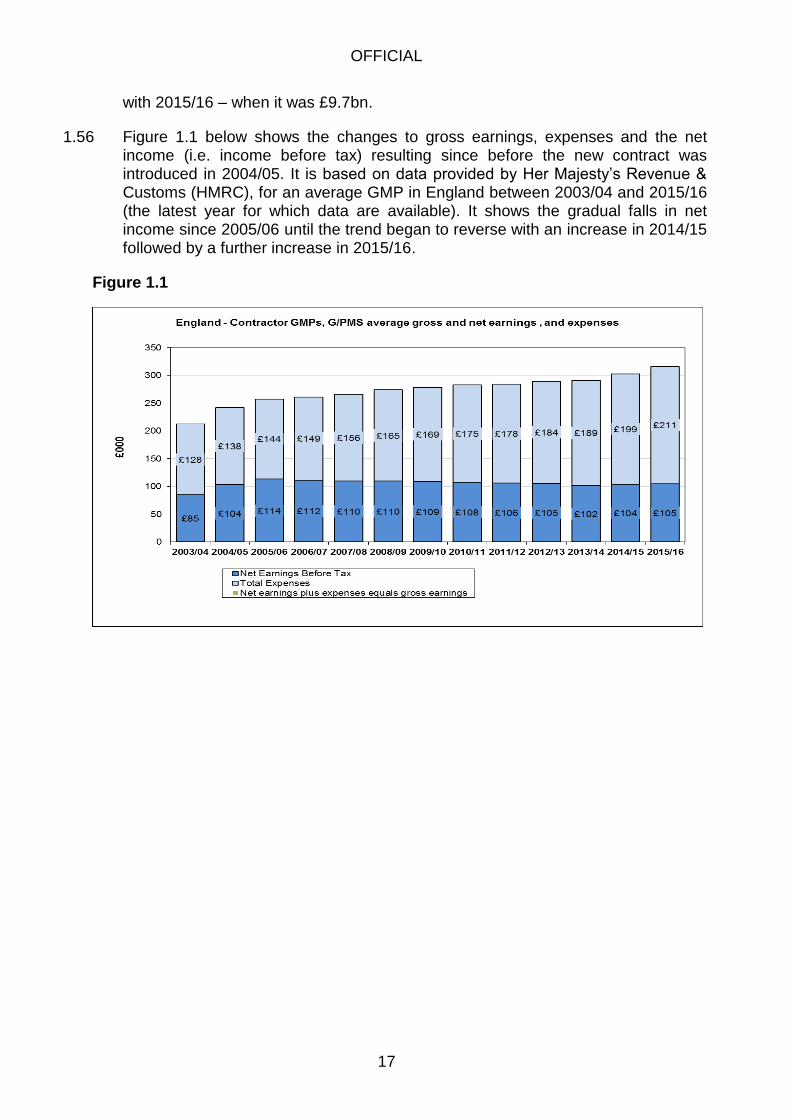
with 2015/16 – when it was £9.7bn.
1.56 Figure 1.1 below shows the changes to gross earnings, expenses and the net income (i.e. income before tax) resulting since before the new contract was introduced in 2004/05. It is based on data provided by Her Majesty’s Revenue & Customs (HMRC), for an average GMP in England between 2003/04 and 2015/16 (the latest year for which data are available). It shows the gradual falls in net income since 2005/06 until the trend began to reverse with an increase in 2014/15 followed by a further increase in 2015/16.
Figure 1.1

OFFICIAL
18
Table 1.3 below sets out actual GMP average net earnings for 2003/04 to 2015/16.
Table 1.3
England GPMS GMPs
Financial
Year
Average Net
Earnings
£
Year on Year
Percentage
Cash Change
Cumulative
Percentage
Cash Change
Cumulative
Real Terms
Percentage
Change
Since
2003/04
2003/04 84,795 - - -
2004/05 103,564 22.1% 22.1% 19.0%
2005/06 113,614 9.7% 34.0% 27.1%
2006/07 111,566 -1.8% 31.6% 21.2%
2007/08 110,139 -1.3% 29.9% 16.8%
2008/09 109,600 -0.5% 29.3% 13.1%
2009/10 109,400 -0.2% 29.0% 11.4%
2010/11 107,700 -1.6% 27.0% 7.7%
2011/12 106,100 -1.5% 25.1% 4.6%
2012/13 105,100 -0.9% 23.9% 1.5%
2013/14 101,900 -3.0% 20.2% -3.2%
2014/15 103,800 1.9% 22.4% -2.9%
2015/16 104,900 1.1% 23.7% -2.4%
OFFICIAL
19
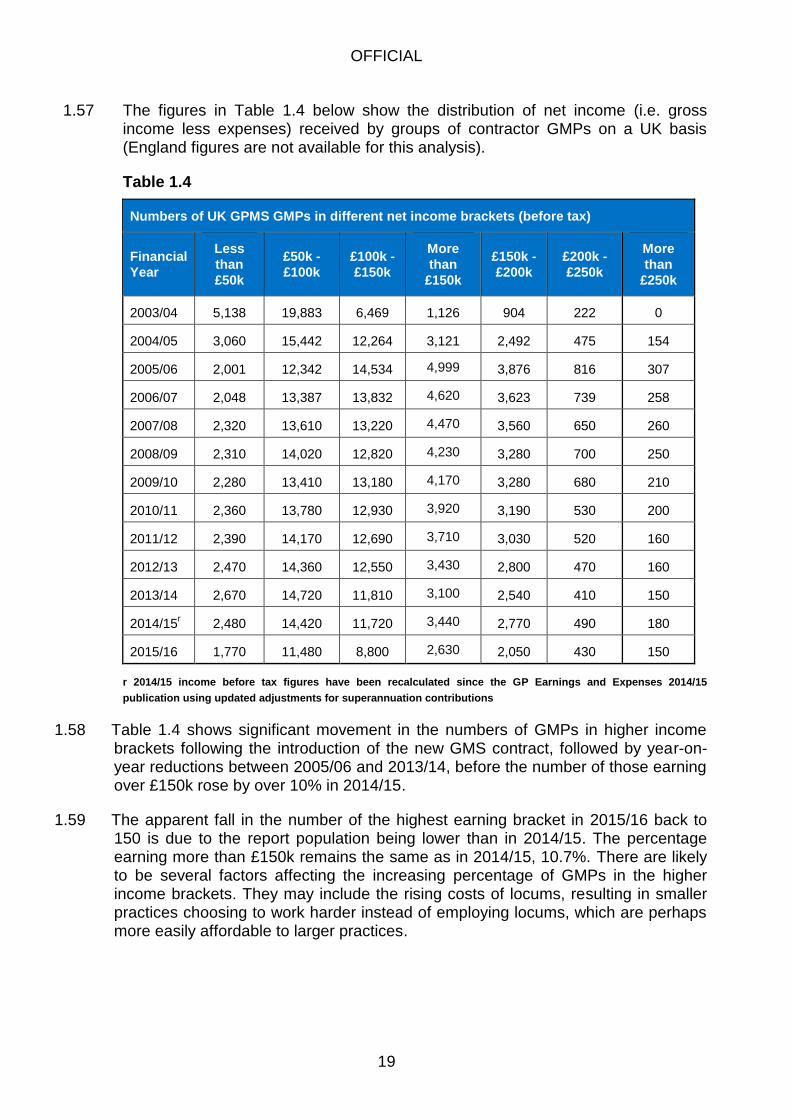
1.57 The figures in Table 1.4 below show the distribution of net income (i.e. gross income less expenses) received by groups of contractor GMPs on a UK basis (England figures are not available for this analysis).
Table 1.4
Numbers of UK GPMS GMPs in different net income brackets (before tax)
Financial
Year
Less
than
£50k
£50k -
£100k
£100k -
£150k
More
than
£150k
£150k -
£200k
£200k -
£250k
More
than
£250k
2003/04 5,138 19,883 6,469 1,126 904 222 0
2004/05 3,060 15,442 12,264 3,121 2,492 475 154
2005/06 2,001 12,342 14,534 4,999 3,876 816 307
2006/07 2,048 13,387 13,832 4,620 3,623 739 258
2007/08 2,320 13,610 13,220 4,470 3,560 650 260
2008/09 2,310 14,020 12,820 4,230 3,280 700 250
2009/10 2,280 13,410 13,180 4,170 3,280 680 210
2010/11 2,360 13,780 12,930 3,920 3,190 530 200
2011/12 2,390 14,170 12,690 3,710 3,030 520 160
2012/13 2,470 14,360 12,550 3,430 2,800 470 160
2013/14 2,670 14,720 11,810 3,100 2,540 410 150
2014/15r 2,480 14,420 11,720 3,440 2,770 490 180
2015/16 1,770 11,480 8,800 2,630 2,050 430 150
r 2014/15 income before tax figures have been recalculated since the GP Earnings and Expenses 2014/15
publication using updated adjustments for superannuation contributions
1.58 Table 1.4 shows significant movement in the numbers of GMPs in higher income brackets following the introduction of the new GMS contract, followed by year-on-year reductions between 2005/06 and 2013/14, before the number of those earning over £150k rose by over 10% in 2014/15.
1.59 The apparent fall in the number of the highest earning bracket in 2015/16 back to 150 is due to the report population being lower than in 2014/15. The percentage earning more than £150k remains the same as in 2014/15, 10.7%. There are likely to be several factors affecting the increasing percentage of GMPs in the higher income brackets. They may include the rising costs of locums, resulting in smaller practices choosing to work harder instead of employing locums, which are perhaps more easily affordable to larger practices.
OFFICIAL
20
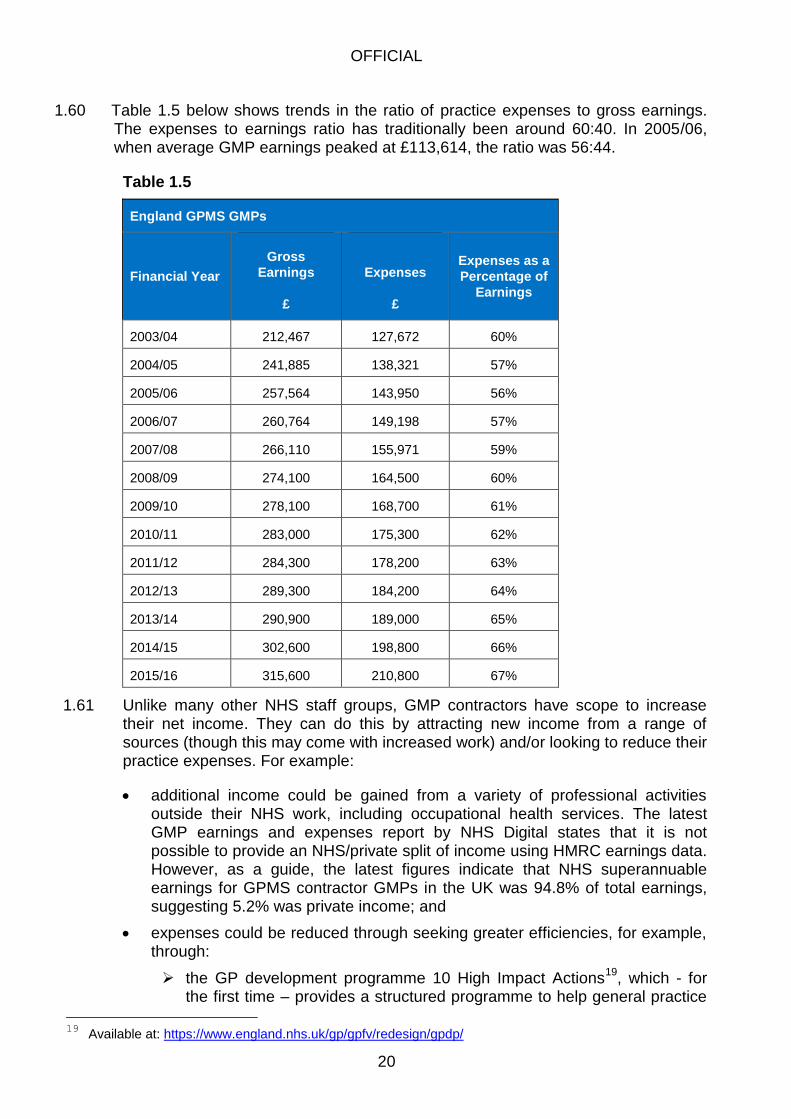
1.60 Table 1.5 below shows trends in the ratio of practice expenses to gross earnings. The expenses to earnings ratio has traditionally been around 60:40. In 2005/06, when average GMP earnings peaked at £113,614, the ratio was 56:44.
Table 1.5
England GPMS GMPs
Financial Year
Gross
Earnings
£
Expenses
£
Expenses as a
Percentage of
Earnings
2003/04 212,467 127,672 60%
2004/05 241,885 138,321 57%
2005/06 257,564 143,950 56%
2006/07 260,764 149,198 57%
2007/08 266,110 155,971 59%
2008/09 274,100 164,500 60%
2009/10 278,100 168,700 61%
2010/11 283,000 175,300 62%
2011/12 284,300 178,200 63%
2012/13 289,300 184,200 64%
2013/14 290,900 189,000 65%
2014/15 302,600 198,800 66%
2015/16 315,600 210,800 67%
1.61 Unlike many other NHS staff groups, GMP contractors have scope to increase their net income. They can do this by attracting new income from a range of sources (though this may come with increased work) and/or looking to reduce their practice expenses. For example:
additional income could be gained from a variety of professional activities outside their NHS work, including occupational health services. The latest GMP earnings and expenses report by NHS Digital states that it is not possible to provide an NHS/private split of income using HMRC earnings data. However, as a guide, the latest figures indicate that NHS superannuable earnings for GPMS contractor GMPs in the UK was 94.8% of total earnings, suggesting 5.2% was private income; and
expenses could be reduced through seeking greater efficiencies, for example, through:
the GP development programme 10 High Impact Actions19
, which - for the first time – provides a structured programme to help general practice
19 Available at: https://www.england.nhs.uk/gp/gpfv/redesign/gpdp/
OFFICIAL
21
providers implement more efficient working practices, thereby supporting practice workload reductions;
the introduction of federated approaches and sharing of back office functions and staff with other practices; and
a greater use of technology.
1.62 There are, however, other areas of cost growth which also need to be considered. In particular, professional indemnity insurance cost increases are affecting practice expenses nationally. For 2016/17, these cost increases were addressed directly through the contract uplift. In May 2016, NHS England and the Department of Health established a GP Indemnity Review group to consider proposals to address the rising costs of indemnity in general practice, working with the profession and medical defence organisations.
1.63 The review concluded that the best way to relieve the immediate pressure was through a new and tailored scheme to provide direct financial support to general practice, whilst developing actions to resolve the long-term drivers of increased costs
20. For 2017/18, addressing the cost increases will be in line with the
statements set out in the GP Indemnity Review.
1.64 In October 2017, the Secretary of State for Health announced that the government is planning to develop a state-backed indemnity scheme for GPs, aiming to deliver a more stable and more affordable system for GPs. We recognise that significant work will now need to be undertaken to develop the details of the scheme, following appropriate engagement with a wide range of stakeholders.
1.65 The assumption is that any new scheme should:
meet the needs of current and future GPs;
be in the interest of patients; and
represent value for money for taxpayers.
1.66 The scheme will therefore need careful design, negotiation and will take at least 12 to 18 months to establish. In the meantime, we will continue to work closely with our partners within the profession, current indemnity insurance providers and other key stakeholders.
NHS pension scheme
1.67 The NHS pension scheme forms a significant part of the overall GMP and GDP reward package. Uniquely amongst self-employed people, GMPs and GDPs have access to a defined benefit public sector pension scheme, effectively guaranteed by the Exchequer.
1.68 GMP and GDP earnings can fluctuate widely from year to year according to the work that they carry out and how much is taken as net NHS income. To take account of these fluctuations in earnings, GMPs and GDPs who are members of the 1995 or 2008 NHS Pension Scheme have a Career Average Revalued Earnings (CARE) NHS pension arrangement in which their pensionable earnings
20
https://www.england.nhs.uk/ourwork/gpfv/gp-indemnity/
OFFICIAL
22
are revalued by an annual uprating (or dynamising) factor. The factor is based on the Consumer Prices Index (CPI) plus 1.5%. GMPs and GDPs who are members of the 2015 NHS Pension Scheme accrue a pension amount every year (based on 1/54
th of their pensionable pay) - which is revalued according to Treasury Orders
plus 1.5%.
Clinical Commissioning Groups (CCGs)
1.69 On 1 May 2014, NHS England announced proposals for local CCGs to co-commission primary medical care in partnership with NHS England
21. There are
three co-commissioning models that CCGs can take forward:
Full delegated responsibility for commissioning the majority of GP services;
Joint commissioning responsibility with NHS England; and
Greater involvement in GP commissioning decisions.
1.70 From 1 April, 2017 the overall total number of CCGs with full delegated responsibilities rose to 174 – i.e. over 84%.
GMS contract changes in 2017/18
1.71 The 2017/18 contract changes – which were all agreed and fully funded - included an overall increase to global sum of 5.9% for all GP providers, which incorporated the 1% increase in net income recommended by DDRB. No changes were made to the Carr-Hill formula or to the Quality and Outcomes Framework. The changes to the contract were:
Directed Enhanced services (DESs):
the payment for the Learning Disabilities Health Check Scheme increased from £116 to £140 per health check. A new learning disabilities health check template was introduced. All other requirements of the enhanced service remain unchanged; and
the Avoiding Unplanned Admissions DES ceased at 31 March 2017. Funding of £157 million was transferred into global sum and used to support the new contractual requirement of Identification and Management of Patients with Frailty.
Other changes to the contract
Identification and management of patients with frailty:
We agreed a new contractual requirement to support the identification and management of patients with frailty.
National Diabetes Audit (NDA)
A new contractual requirement to support the extraction of data relating to the NDA was agreed.
NHS Digital Workforce Census
21
https://www.england.nhs.uk/commissioning/pc-co-comms/
OFFICIAL
23
We agreed a new contractual requirement to support the collection of data relating to the NHS Digital Workforce Census. Recurrent funding of £1.5 million has been provided to support this requirement.
Data Collection
We agreed a new contractual requirement to support the extraction of data on a selection of retired QOF indicators (INLIQ) and retired DESs.
Registration of Prisoners
We introduced a contractual change to allow prisoners to register with a practice before they leave prison.
Access to Healthcare
We agreed a new contractual requirement to support the provision of a revised GMS1 form for all new patients, which includes supplementary questions to determine a patient’s eligibility to healthcare.
We agreed that practices would be required to manually record if the patient holds either a non-UK issued EHIC or a S1 form in the patient’s medical record and then send the form and supplementary questions to NHS Digital or the Overseas Healthcare Team.
We provided new investment of £5m, which was added to global sum for this. We also agreed that NHS England and GPC would work with NHS Digital and GP system suppliers to put in place an automated process, as soon as possible, to replace the manual process.
GP Retention Scheme
We agreed and funded a new scheme with the key changes being as follows:
o tighter criteria for those who are joining the new scheme;
o a professional expenses salary supplement will be payable to the GP via the practice;
o the retained GP will be entitled to the pro rata full time equivalent of CPD as set out within the salaried model contract; and
o GPs can be on the scheme for a period of up to five years. In exceptional circumstances an extension can be made for up to a further 24 months.
Payments for Sickness Leave Cover
We agreed changes to the arrangements for making sickness leave payments:
o to allow for cover to be provided by external locums or existing GPs already working in the practice but who do not work full time;
o reimbursement to begin when the absence is two or more weeks;
o an increase in the maximum amount payable to £1,734.18 per week. Payments will no longer be discretionary and will be payable where the absence is two or more weeks; and
o sickness leave payments will not be made on a pro-rata basis and will be the lower of actual or invoiced costs up to the maximum amounts as set out in the Statement of Financial Entitlements.
Parental leave payments
OFFICIAL
24
We have agreed that parental leave payments will not be made on a pro-rata basis and will be the lower of actual or invoiced costs up to the maximum amounts as set out in the Statement of Financial Entitlements.
Business Improvement District (BID) levies: eligible practices to be reimbursed for costs relating to BID levies.
Care Quality Commission (CQC) Fees will be reimbursed directly
Core opening hours and extended hours access DES
New conditions have been introduced from October 2017 which will mean that practices who regularly close for a half day, on a weekly basis, will not ordinarily qualify for the DES. GPC agreed that Local Medical Committees should be integral partners in working with local commissioners in ensuring practices are fulfilling their contractual requirements.
GMS digital
The changes that we agreed for 2017/18 are as follows:
o practice compliance with the ten new data security standards in the National Data Guardian Security Review;
o practice completion of the NHS Digital Information Governance toolkit - including attainment of level 2 accreditation, and familiarisation with the July 2016 Information Governance Alliance guidance;
o an increased uptake of electronic repeat prescriptions with reference to co-ordination with community pharmacy;
o an increased uptake of electronic referrals to 90 per cent where this is enabled by secondary care;
o continued uptake of electronic repeat dispensing to a target of 25 per cent with reference to CCG use of medicines management and co-ordination with community pharmacy;
o uptake of patient use of one or more online services to 20 per cent including, where possible, apps to access those services and increased access to clinical correspondence online; and
o better sharing of data and patient records at local level, between practices and between primary and secondary care.
Indemnity Inflation
When the GP Indemnity Review was published,22
NHS England agreed to make payments to practices to cover indemnity inflation experienced in 2016/17 and 2017/18.
GMS contract changes in 2018/19
1.72 We will provide an update on the negotiations in NHS England’s supplementary evidence, due to be provided to DDRB in the coming weeks.
22
Available at: https://www.england.nhs.uk/wp-content/uploads/2016/07/gp-indemnity-rev- summary.pdf

OFFICIAL
25
Conclusion
1.73 This chapter provides information on the latest position on recruitment and retention, earnings and expenses, and other relevant developments in general practice. It shows that, whilst general practice is under pressure – as we acknowledged in the General Practice Forward View and since - NHS England is investing heavily in a wide range of innovative and transformational programmes to support general practice, which are being successfully delivered in conjunction with key stakeholder organisations in the profession.
OFFICIAL
26
Chapter 2 – General Dental Practitioners (GDPs)
Introduction
2.1 This chapter provides an update on general dental practitioners (GDPs) providing NHS primary care services and those salaried GDPs on terms and conditions set by NHS organisations in England.
2.2 NHS England has already met the General Dental Practice Committee of the British Dental Association (BDA) to discuss possible quality and efficiency improvements for 2018/19, and has also discussed practice expenses. We plan to meet again on several occasions in the near future. We believe that overall levels of uplift for independent contractors are best considered as part of such discussions with the profession’s representatives about on-going improvements in contractual arrangements, provided that it is possible to secure appropriate improvements in the quality and efficiency of services.
Background
2.3 In April 2013, NHS England became responsible for commissioning all NHS dental services, including primary, community and hospital dental services. NHS England is working towards a single operating model, which provides an opportunity for consistency and efficiency where it is required, and enables flexibility where necessary. Proposals for dental commissioning will build on the single operating model for primary care commissioning described in “Securing excellence in commissioning primary care”
23.
2.4 NHS England has now been commissioning dental services for four years and is committed to improving them to the benefit of patients and providers, in particular by:
improving health outcomes and making best use of NHS resources;
reducing inequalities;
promoting greater patient and public involvement; and
promoting and swiftly adopting innovation that delivers excellence.
2.5 We are doing this through the development of, and move towards, a single system with a consistent operating model across the country. NHS England is working to ensure there are clear and consistent outcome measures, indicators and a single accountability framework for NHS primary care dentistry in England, set out in our single operating model for dental commissioning. This is not intended to be at the expense of stifling local innovation in service and quality improvement.
2.6 In 2011, in response to dentists continuing to feedback that the current contract leaves them on an “activity treadmill” with no specific rewards for delivering high quality care or for delivering prevention, the Department of Health set up new pilot schemes. The pilots looked at elements of a new contract based on capitation and
23
Available at: https://www.england.nhs.uk/wp-content/uploads/2013/02/commissioning-dental.pdf
OFFICIAL
27
quality, intended to focus on better rewarding oral health promotion, and better targeting patients with dental needs avoiding unnecessary treatments.
2.7 Following learning from the pilots a prototype scheme was launched early in 2016. Some 78 prototypes are now live, incorporating learning from the pilot scheme and testing a blended capitation/activity-based remuneration mechanism. Characteristics of the prototypes are 75 high street practices; 20 new sites (known as UDA practices) and 55 former pilots; and three community dental services.
2.8 Of the 75 high street practices, 37 are blend A and 38 blend B. The two blends are a combination of payment systems based on capitation and activity. Blend A’s capitation covers check-ups and preventative care. Blend B’s capitation covers check-ups, preventative care, and routine treatment. All prototypes will follow the preventative clinical pathway designed to support dentists in delivering the best care for patients.
2.9 The focus on quality is intended to support dentists in improving the oral health of their patients, while the capitation system and the focus on long-term care will give patients the security of continuing care. We expect the proposed new contract will address many of the concerns of the profession, drive further improvements in dental health in England, and maintain current access as a minimum. The programme has conducted a formal evaluation of the prototypes, capturing three high level measures of success:
appropriate high quality care;
access; and
value for money.
Subject to the final evaluation of year 1 prototyping, further consideration will be given to increasing the number of practices for year 2 evaluation purposes. No firm decision on roll-out has been made, but it is expected there will be a phased approach over a period of years.
2.10 Although it is clear that changes to the current system may be desirable to fit in with our long term aim, as expressed in the Five Year Forward View, of moving towards prevention rather than intervention - and encouraging patients to take greater control of their own oral health care. We are pleased to note that the current position on NHS dentistry continues to improve and there has been an increase in the number of both adults and children accessing NHS dental services.
Smile4Life prevention initiatives
2.11 In addition to the development of a new contract, NHS England is developing two new prevention schemes:
Smile4life is aimed at improving the oral health of young children; and
the NHS England Starting Well programme aims to support the reduction of oral health inequalities and improve oral health in children under the age of 5
OFFICIAL
28
in 13 high priority areas, through a more creative use of commissioning expenditure.
2.12 The objectives of the programme are to:
offer evidence-based and innovative interventions at individual patient level, practice level and community level to children under the age of 5, with a focus on high-risk groups;
increase the provision of preventive advice and interventions by the dental team, as per the evidence-base presented in Delivering Better Oral Health;
increase the proportion of children under the age of 5 accessing dental care, with a focus on high-risk groups and under 2’s;
increase the integration of the dental team within the community;
develop and deliver the programme in partnership working with:
Public Health England;
Health Education England;
the dental profession through the BDA;
Local Dental Networks and Local Dental Committees; and
Local Authorities – for increased effectiveness of the programme and to complement existing local initiatives;
and
provide NHS England dental commissioners with a method of commissioning the programme within the existing dental contract.
2.13 The NHS England Step Change initiative is designed to improve access and address oral health inequalities in children under the age of 2 on a national basis. This will support early prevention and will be a key element in reducing the number of young children requiring a general anaesthetic for the removal of decayed teeth.
2.14 The objectives of the programme are to:
increase access to dental care and attendance for children under two years of age on a national level, so increasing the proportion of under 2s visiting the dentist;
implement a national high profile public awareness programme to ensure the timely attendance of children (two years and under), followed by the provision of cost effective evidence-based prevention - such as fluoride varnish, weaning and dietary advice; and
provide NHS England dental commissioners with a method of commissioning the initiative within the existing dental contract.
OFFICIAL
29
Access to NHS dental services
2.15 The March 2017 GP Patient Survey24
covered access to NHS dental services, which showed that 95% of people who tried to get an appointment with an NHS dentist in the past two years were successful. For those seeking an appointment in the last six months, the success rate is higher still at 96%.
2.16 In the last year:
the method of reporting the number of children seen by an NHS dentist changed in 2015/16 from a 24 month period to a 12 month period to reflect NICE recommendations. The data on total access to NHS dental services cannot therefore be compared to years prior to 2015/16. We are still able to compare access to NHS dental services by adult patients, as reported in NHS Dental Statistics
25 - and this has risen: 22.2 million adult patients (51.4% of
the population) were seen by an NHS dentist in the 24-month period ending June 2017. This is an increase of 18,774 compared with the previous twelve months, and 2.7 million higher than the low point reached in June 2008.
in the 12 month period ending June 2017, 6.8 million children (58.2% of the childhood population) accessed NHS dental services, an increase in both actual and percentage access compared to previous 12 months when the figures were 6.7 million and 57.6%.
there has been a slight fall in units of dental activity (UDA): by 0.6 million (0.7%) from 2015/16 to 85.7 million UDAs in 2016/17. However, band 1 activity continues to increase - up 502,000 UDAs when compared with 2015/16, suggesting that the mix of treatment provided is changing rather than provision falling. NHS England regional team commissioning plans at June 2017 for the following twelve months show 478,000 UDAs (0.5%) lower than the previous twelve months. This can reflect a number of factors, including a continued removal of undelivered UDAs and a cleaning up of the dataset. This, and a reduction in delivered UDAs, does not mean that we are commissioning services for fewer patients. The ‘patient seen’ data continues to show an increase in the number of patients seen and an additional 242,000 Courses of Treatment were provided in 2016/17, which might indicate a decrease in treatment intensity based on improving oral health across the population. This could also reflect our commitment to improve the efficiency of NHS dental services, including ensuring that claims for activity correctly reflect the treatment required and delivered.
the number of dentists providing NHS services was broadly unchanged, being down by 0.3% to 24,007 dentists in 2016/17; and
the majority of dentists’ time remains committed to NHS work: the proportion of dentists’ time spent on NHS work fell slightly from 71.4% in 2013/14 to 70.7% in 2015/16.
24 Available at:https://www.england.nhs.uk/statistics/2017/07/06/gpps_dent_y111864861/
25 Available at http://digital.nhs.uk/catalogue/PUB30069
OFFICIAL
30
General Dental Practitioners: recruitment, retention and motivation
2.17 The number of NHS patients seen and the NHS service they receive is the most important measure of delivery - and the numbers of dentists providing NHS services is relatively less important. 2016/17 saw the number of Performer Only dentists continues to rise. This may be a factor in the overall NHS remuneration per dentist as activity is spread across more dental performers.
2.18 Dentists are still generally ready, and indeed enthusiastic, to bid for and undertake NHS contracts - including in areas where dentists had previously chosen not to set up or provide NHS services - and NHS access continues to rise.
2.19 Dentists have seen a reduction in average working hours, with evidence from NHS Digital’s dental working hours’ survey published in September 2016 showing that dentists are working an average of 36.9 hours per week in 2015/16 compared to 39.4 hours in 2000, a reduction of over 6% across that period.
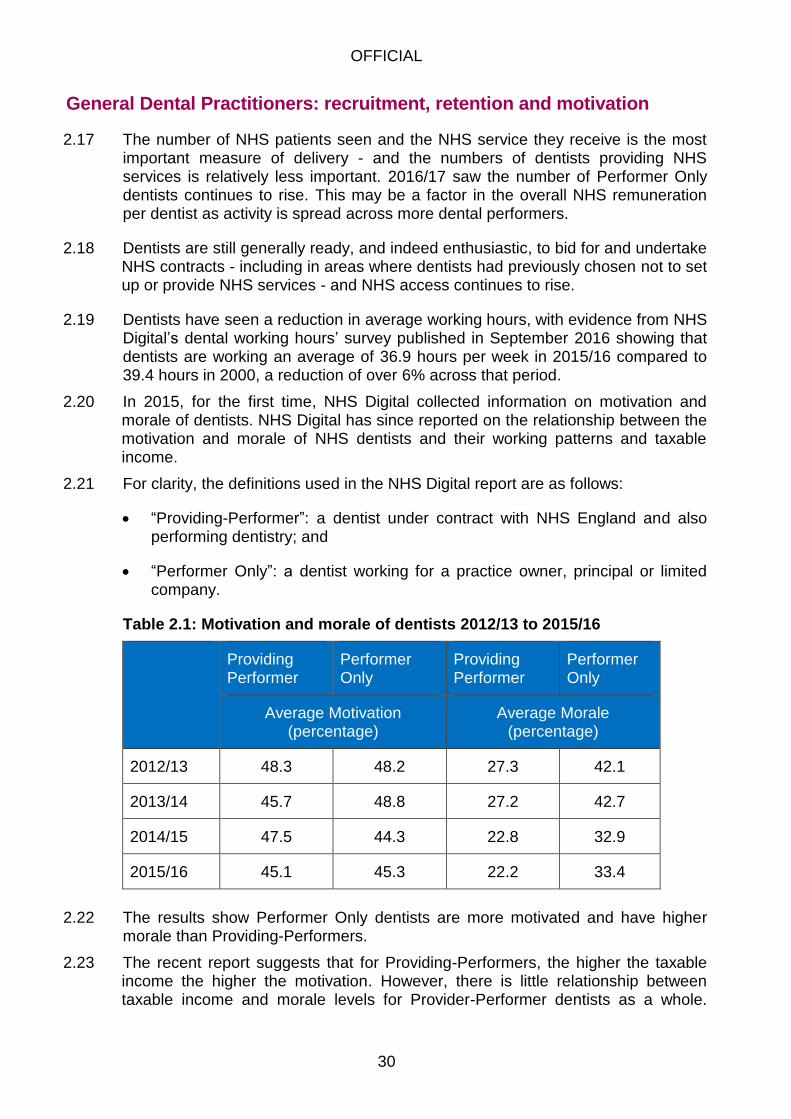
2.20 In 2015, for the first time, NHS Digital collected information on motivation and morale of dentists. NHS Digital has since reported on the relationship between the motivation and morale of NHS dentists and their working patterns and taxable income.
2.21 For clarity, the definitions used in the NHS Digital report are as follows:
“Providing-Performer”: a dentist under contract with NHS England and also performing dentistry; and
“Performer Only”: a dentist working for a practice owner, principal or limited company.
Table 2.1: Motivation and morale of dentists 2012/13 to 2015/16
Providing Performer
Performer Only
Providing Performer
Performer Only
Average Motivation (percentage)
Average Morale (percentage)
2012/13 48.3 48.2 27.3 42.1
2013/14 45.7 48.8 27.2 42.7
2014/15 47.5 44.3 22.8 32.9
2015/16 45.1 45.3 22.2 33.4
2.22 The results show Performer Only dentists are more motivated and have higher
morale than Providing-Performers.
2.23 The recent report suggests that for Providing-Performers, the higher the taxable income the higher the motivation. However, there is little relationship between taxable income and morale levels for Provider-Performer dentists as a whole.
OFFICIAL
31
When considered alone, female Provider-Performers have a statistically significantly positive relationship between pay and morale.
2.24 There does not appear to be a relationship between taxable income and motivation for Performer Only dentists. However, Performer Only dentists who report higher morale levels have a lower taxable income, suggesting a negative relationship between taxable income and levels of morale.
2.25 In answer to the question ‘I feel good about my job as a dentist,’ 56.8% of Performers and 51.4% of Providing-Performers ‘agreed’ or ‘strongly agreed’. This was the highest positive response for Performers. The question ‘I have all the equipment and resources I need to do my job properly’ provided the highest positive response for Providing-Performers with 60.1% answering ‘agree’ or ‘strongly agree’ (48.4% of Performers).
2.26 There are still a number of key issues with the way dentistry is delivered and managed, which we intend to work with the profession to address. As noted earlier, we are piloting new dental remuneration systems with prototype practices, based more on prevention and quality - and focusing more closely on patient outcomes rather than simply the number of interventions.
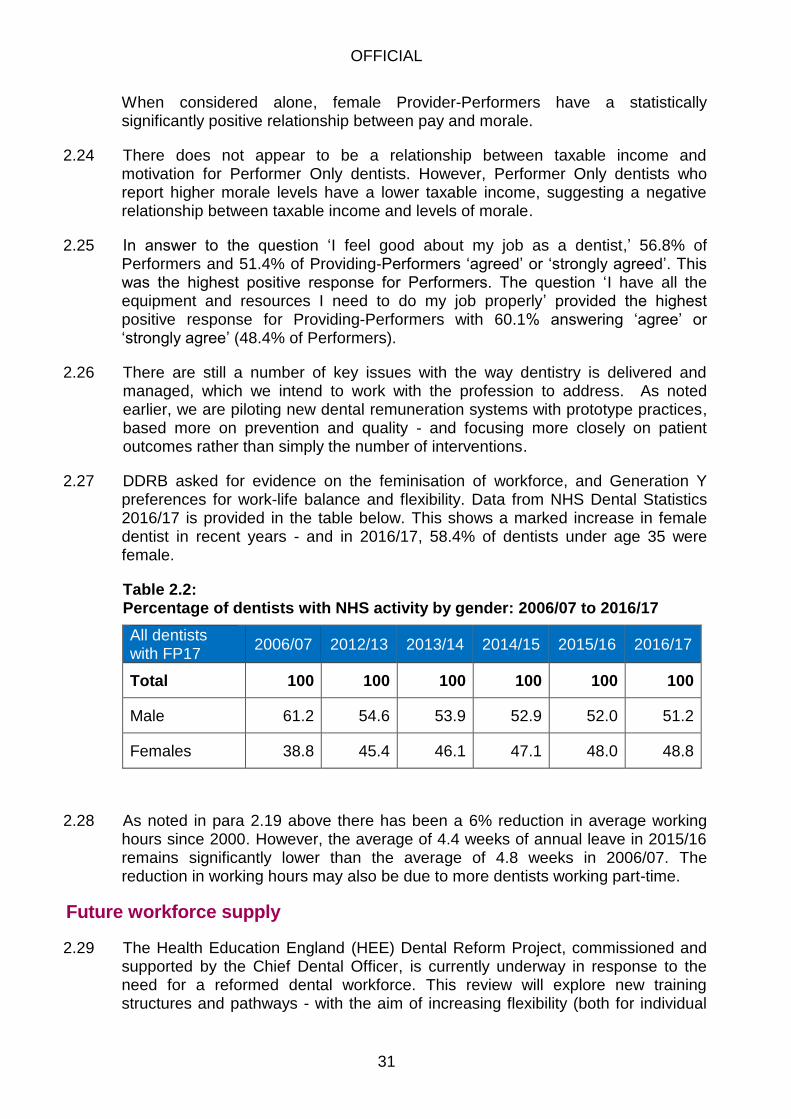
2.27 DDRB asked for evidence on the feminisation of workforce, and Generation Y preferences for work-life balance and flexibility. Data from NHS Dental Statistics 2016/17 is provided in the table below. This shows a marked increase in female dentist in recent years - and in 2016/17, 58.4% of dentists under age 35 were female.
Table 2.2: Percentage of dentists with NHS activity by gender: 2006/07 to 2016/17
All dentists with FP17
2006/07 2012/13 2013/14 2014/15 2015/16 2016/17
Total 100 100 100 100 100 100
Male 61.2 54.6 53.9 52.9 52.0 51.2
Females 38.8 45.4 46.1 47.1 48.0 48.8
2.28 As noted in para 2.19 above there has been a 6% reduction in average working hours since 2000. However, the average of 4.4 weeks of annual leave in 2015/16 remains significantly lower than the average of 4.8 weeks in 2006/07. The reduction in working hours may also be due to more dentists working part-time.
Future workforce supply
2.29 The Health Education England (HEE) Dental Reform Project, commissioned and supported by the Chief Dental Officer, is currently underway in response to the need for a reformed dental workforce. This review will explore new training structures and pathways - with the aim of increasing flexibility (both for individual
OFFICIAL
32
trainees and the service) and efficiency. It will also seek to maximise the value for money for taxpayers.
2.30 For post-foundation dental training there are currently opportunities to undertake a programme, comprising core training and then 13 different specialties. This review will consider how these are structured. For example, whilst there is a sophisticated process to quality assure and approve the 13 specialty curricula, there is no mechanism to consider more fundamental questions, such as whether these 13 specialty divisions are indeed the most appropriate means of structuring specialist dental training to meet future patient and service needs (and universities’ teaching requirements).
2.31 Health Education England confirms that there continues to be a very healthy supply of foundation dentists. The current situation with dental foundation trainees is currently being considered as part of the Dental Investment Planning, 2017.
General Dental Practitioners: earnings and expenses
2.32 Each year, we see a smaller number of Providing-Performers. In 2016/17 there was a fall of 524 (15.2%) to 2,925. We also saw a rise of 442 (2.1%) in the number of Performers to 21,082. Overall, 87.8% of dentists are now Performers, compared with 62.4% in 2006/07.
2.33 The earnings of Providing-Performers dentists have seen a slight reduction, following two years of increases - and the earnings of performer dentist increased slightly in 2015/16, the first time since 2009.
2.34 The average figures published by NHS Dental Statistics cover dentists doing any NHS work in the year. A significant number of dentists come and go within a year: in 2015/16 there were 1,629 leavers and 1,646 joiners in-year, or 3,275 (13.6%) working for only part of the year for the NHS.
2.35 The numbers of dentists for the years 2006/07 to 2016/17 are set out on table 2.3 below (table 8e from 'NHS Dental Statistics for England 2016/17').
OFFICIAL
33
Table 2.3: Number and percentage of dentists with NHS activity by dentist type, 2006/07 to 2016/17
Number Per cent
Providing performer
Performer only Total
Providing performer
Performer only Total
2006/07 7,585 12,575 20,160 37.6 62.4 100
2007/08 7,286 13,529 20,815 35.0 65.0 100
2008/09 6,778 14,565 21,343 31.8 68.2 100
2009/10 6,279 15,724 22,003 28.5 71.5 100
2010/11 5,858 16,941 22,799 25.7 74.3 100
2011/12 5,099 17,821 22,920 22.2 77.8 100
2012/13 4,649 18,552 23,201 20.0 80.0 100
2013/14 4,413 19,310 23,723 18.6 81.4 100
2014/15 4,038 19,909 23,947 16.9 83.1 100
2015/16 3,449 20,640 24,089 14.3 85.7 100
2016/17 2,925 21,082 24,007 12.2 87.8 100
Notes
1) Dentists are defined as Performers with NHS activity recorded by FP17 forms.
2) Data consists of Performers in General Dental Services (GDS), Personal Dental Services (PDS) and Trust–led
Dental Services (TDS).
Net earnings
2.36 The data from NHS Digital, Dental Earning and Expenses Estimates 2015/1626
continues to be difficult to compare with previous years because of changes in the way dentists pay themselves. The main change has been the move towards personal and practice incorporation, which takes profits out of the self-employed tax system for the individual dentist and moves them into company accounts.
2.37 We do not have precise figures on how many dentists changed their business arrangements in this way, although we do know the changes in the number of self-employed dentists overall in 2016/17. Compared to 2015/16, there are 15% fewer dental contract holders and 21% more “dentists who work for others”.
2.38 This is a significant issue, which has a serious impact on the ability to access data on key areas - including the relative level of expenses and earnings. However, it is clear that dentists continue to earn good income levels. Although the average identifiable net income after expenses for dentists in 2015/16 fell to £69,200 compared with £70,500 in the previous year, the NHS Digital report notes that this is not statistically significant. These income levels appear to be sufficient to recruit and retain the dental workforce.
2.39 For dentists holding a contract, earnings were considerably higher at an average of £115,700 a decrease of 1.4% from the previous year’s £117,400. The data also show some dentists earning considerably more - with 1% earning over £300,000. Dentists working for providers still had an average net profit of £60,200, up 0.4% from the £59,900 of the previous year.
26 Available at https://digital.nhs.uk/catalogue/PUB30077
OFFICIAL
34
2.40 On expenses, the data showed that just over half (53.3%) of gross payments to dentists was to meet their expenses. There has been little movement in this ratio since 2006 - as shown in the table below.
Table 2.4: Gross income and net profit of primary care dentists 2004/05 to 2015/15
Population Average gross income
Expenses Net profit Expenses ratio
2004/05 GDS only 13,309 £193,215 £113,187 £80,032 58.6
2005/06 18,796 £205,368 £115,450 £89,919 56.2
2006/07 19,547 £206,255 £110,120 £96,135 53.4
2007/08 19,598 £193,436 £104,373 £89,062 54.0
2008/09 19,636 £194,700 £105,100 £89,600 54.0
2009/10 20,300 £184,900 £100,000 £84,900 54.1
2010/11 20,800 £172,000 £94,100 £77,900 54.7
2011/12 21,300 £161,000 £86,600 £74,400 53.8
2012/13 21,500 £156,100 £83,500 £72,600 53.5
2013/14 21,500 £155,100 £83,400 £71,700 53.8
2014/15 21,350 £152,500 £82,000 £70,500 53.8
2015/16 21,200 £148,000 £78,900 £69,200 53.3
Note: some double counting of expenses inflates both gross income and expenses but does not affect reported net profit.
2.41 Another source of information on dentists’ income, compiled by the National Association of Specialist Dental Accountants and Lawyers (NASDAL), reported that average net profits for NHS practices have been increasing since 2012/13 - with NHS practices having an average profit of £134,102 in 2015/16, an increase of £4,837 from 2014/15. Net profits for private practices fell in 2015/16, showing a return to the pre-2012/13 position, where NHS practices generate higher profits than private practices. The NASDAL goodwill survey published in July 2017 noted a levelling out of prices being paid for practices. However, NHS practices continue to attract significant premiums, with goodwill on average 165% of fee income compared to the overall average of 137%.
Table 2.5: Net profit per principle for the practice
Type of
practice
2006/07
£
2007/08
£
2008/09
£
2009/10
£
2010/11
£
2011/12
£
2012/13
£
2013/14
£
2014/15
£
2015/16
£
NHS 149,500 148,000 161,300 147,800 133,020 130,000 125,958 129,000 129,265 134,102
Mixed 147,100 140,700 138,600 143,800 127,045 - - - -
Private 130,900 136,500 130,600 126,400 117,552 117,000 124,086 131,000 140,129 133,743
Source: NASDAL. NHS practices are those where NHS earnings are 80% or more. Private practices are those where private earnings
are 80% or more. Data for mixed practices has not been provided since 2010/11
2.42 NASDAL report that average net profits for associate dentists (those dentists with no share of ownership) have been stable for over a decade. Although, average profits decreased slightly again in 2015/16 by 0.9% from £68,024 in 2014/15 to £67,389 in 2015/16.
OFFICIAL
35
Expenses
2.43 The NHS Digital earnings report continues to note the increasing difficulty in separating out expenses between performers and providers - and the possible double counting of expenses. They state:
Introduction to the NHS Digital Report on dental earnings and expenses estimates 2015/16initial analysis
Multiple counting
The results presented in this report reflect earnings and expenses as recorded by dentists on their Self-Assessment tax returns. The majority of payments for NHS dentistry are made to Provider-Performer/Principal dentists. In some cases, dentistry is actually performed by a Performer Only/Associate dentist working in the Provider-Performer/Principal’s practice and some of that payment will be passed on to the Performer Only/Associate. This means that the same sum of money may be declared as gross earnings by both the Provider-Performer/Principal and Performer Only/Associate and as an expense by the Provider-Performer/Principal. This is known as ‘multiple counting’. Its extent is difficult to quantify but, where it does occur, multiple counting will inflate only gross earnings and total expenses values. The resulting taxable income values are not affected. Where a dentist is single-handed (i.e. is the only dentist working in a practice), no multiple counting will occur.
Incorporation
This report only considers those primary care dentists who have earnings from self-employment. Traditionally, the employment status of a vast majority of primary care dentists (both Providing-Performer/Principal and Performer Only/Associate) has been self-employment. As such, these dentists complete Self-Assessment tax returns which, subject to certain exclusion criteria, have been used to inform the analyses presented in the dental earnings reports. Since the introduction of the Dentists Act 1984 (Amendment) Order 2005, it has been possible for dentists to incorporate their business(es) and become a director and/or an employee of a limited company (Dental Body Corporate), with the potential to operate in a highly tax-efficient manner. Both Providing-Performer/Principal and Performer Only/Associate dentists are able to incorporate their businesses. For Providing-Performer/Principal dentists, the business tends to be a dental practice. For Performer Only/Associate dentists, the business is the service they provide as a sub-contractor. It is currently not known how many dentists have incorporated their business(es) and what the precise consequences of incorporation may be for the results presented in this report.
2.44 In looking at expenses we need to continue to take account of the fact that average earnings and expenses figures are affected by the composition of the population covered. There are significant on-going changes in the composition of the dentists in the earnings and expenses figures: mainly a large shift from Providing-Performer dentists to Performer Only dentists.
2.45 Dentists can also choose to alter the balance between gross and net pay without a major effect on earnings. Changes in earnings and expenses reflect more than
OFFICIAL
36
just changes in pay rates and price changes. For example, if dentists work longer hours they have higher gross income - but may also have higher expenses (and higher net income). The figures may also reflect changes in the type of work undertaken (e.g. complex treatment with higher expenses vs. time-consuming with lower expenses).
2.46 The changes from year to year are affected by contract holder dentists changing their business arrangements into companies. Some profit is retained in the company, which in turn makes a self-employment payment to the dentist. The profits retained in the company are no longer covered in these self-employed earnings figures. There is also evidence that many individual Performer dentists continue to operate under limited company status - further confusing the self-employed earnings report.
2.47 The issue of multiple-counted expenses is also important as noted by NHS Digital. For example, a dental Performer pays the laboratory bills associated with treatment out of their gross income. The Performer pays the contract holder who, in turn, pays the laboratory. Both the contract holder and the dental Performer show the cost as an expense, with the contract holder showing the payment from the performer as an income. The NHS Digital paper (above) indicates that the extent of double-counting may have increased since 2006. This is because gross payments are no longer paid directly to individual dentists.
2.48 Extracts from the NASDAL results are in the table below. They show that there have been only slight variations in expenses as a percentage of gross income in 2015/16. Other non-staffing costs (Morris & Co) increased to similar levels seen in 2013/14 following a fall in 2014/15.
Table 2.6: Categories of expenses as a percentage of gross income
2006/
07
2007/
08
2008/
09
2009/
10
2010/
11
2011/
12
2012/
13
2013/
14
2014/
15
2015/1
6
Non-clinical staff wages (NASDAL)
NHS
practices
17.3% 17.9% 17.7% 18.8% 19.8% 19.9% 21.0% 20.3% 20.1% 20.6%
Private
Practices
17.4% 17.8% 17.6% 18.1% 19.4% 19.5% 19.5% 18.9% 18.2% 17.6%
Laboratory costs (NASDAL)
NHS
practices
5.6% 6.1% 6.0% 6.5% 6.3% 6.1% 6.4% 6.6% 6.3% 6.1%
Private
Practices
7.8% 7.6% 7.1% 7.9% 7.6% 7.2% 7.3% 7.4% 6.8% 7.5%
Materials costs (NASDAL)
NHS practices
5.0%
5.6% 5.4% 5.6% 6.3% 6.6% 6.3% 6.8% 6.0% 6.1%
Private
Practices
7.0% 7.5% 7.1% 7.5% 7.9% 7.4% 7.2% 7.1% 7.8% 7.4%
Premises Costs ( NASDAL)
NHS
practices
3.4% 3.7% 3.2% 3.8%
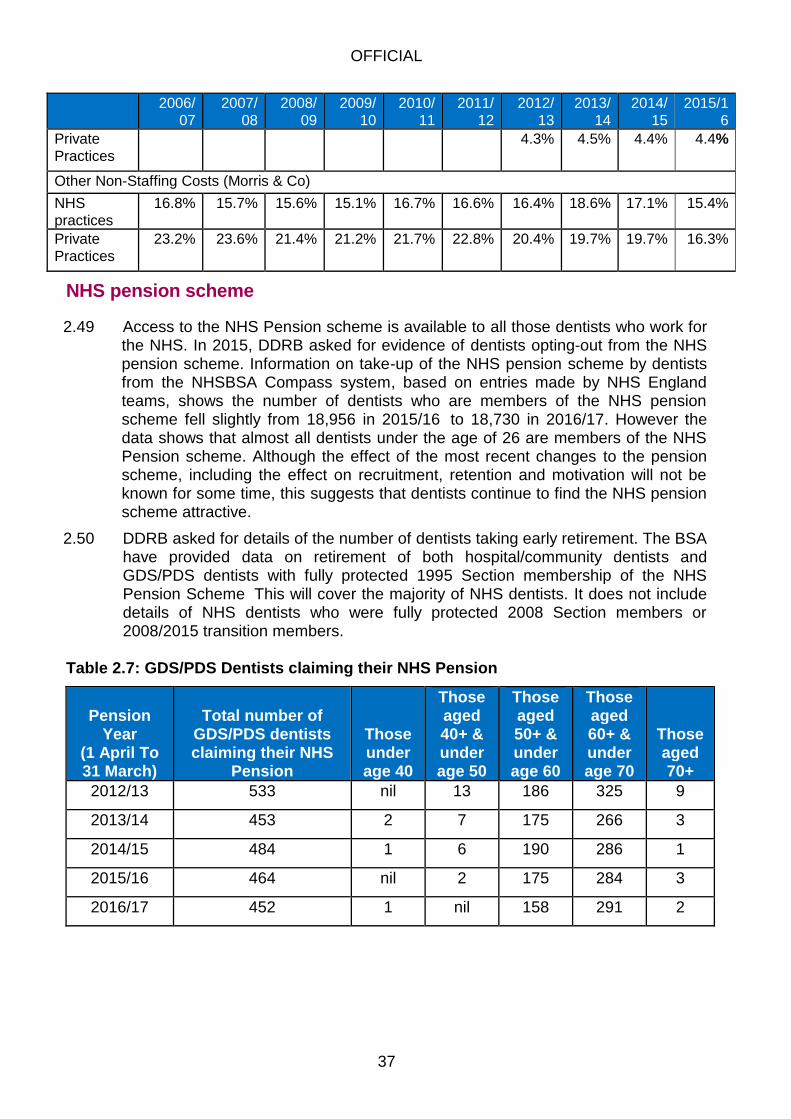
OFFICIAL
37
2006/
07
2007/
08
2008/
09
2009/
10
2010/
11
2011/
12
2012/
13
2013/
14
2014/
15
2015/1
6
Private
Practices
4.3% 4.5% 4.4% 4.4%
Other Non-Staffing Costs (Morris & Co)
NHS
practices
16.8% 15.7% 15.6% 15.1% 16.7% 16.6% 16.4% 18.6% 17.1% 15.4%
Private
Practices
23.2% 23.6% 21.4% 21.2% 21.7% 22.8% 20.4% 19.7% 19.7% 16.3%
NHS pension scheme
2.49 Access to the NHS Pension scheme is available to all those dentists who work for the NHS. In 2015, DDRB asked for evidence of dentists opting-out from the NHS pension scheme. Information on take-up of the NHS pension scheme by dentists from the NHSBSA Compass system, based on entries made by NHS England teams, shows the number of dentists who are members of the NHS pension scheme fell slightly from 18,956 in 2015/16 to 18,730 in 2016/17. However the data shows that almost all dentists under the age of 26 are members of the NHS Pension scheme. Although the effect of the most recent changes to the pension scheme, including the effect on recruitment, retention and motivation will not be known for some time, this suggests that dentists continue to find the NHS pension scheme attractive.
2.50 DDRB asked for details of the number of dentists taking early retirement. The BSA have provided data on retirement of both hospital/community dentists and GDS/PDS dentists with fully protected 1995 Section membership of the NHS Pension Scheme This will cover the majority of NHS dentists. It does not include details of NHS dentists who were fully protected 2008 Section members or 2008/2015 transition members.
Table 2.7: GDS/PDS Dentists claiming their NHS Pension
Pension Year
(1 April To 31 March)
Total number of GDS/PDS dentists claiming their NHS
Pension
Those under age 40
Those aged 40+ & under age 50
Those aged 50+ & under age 60
Those aged 60+ & under age 70
Those aged 70+
2012/13 533 nil 13 186 325 9
2013/14 453 2 7 175 266 3
2014/15 484 1 6 190 286 1
2015/16 464 nil 2 175 284 3
2016/17 452 1 nil 158 291 2
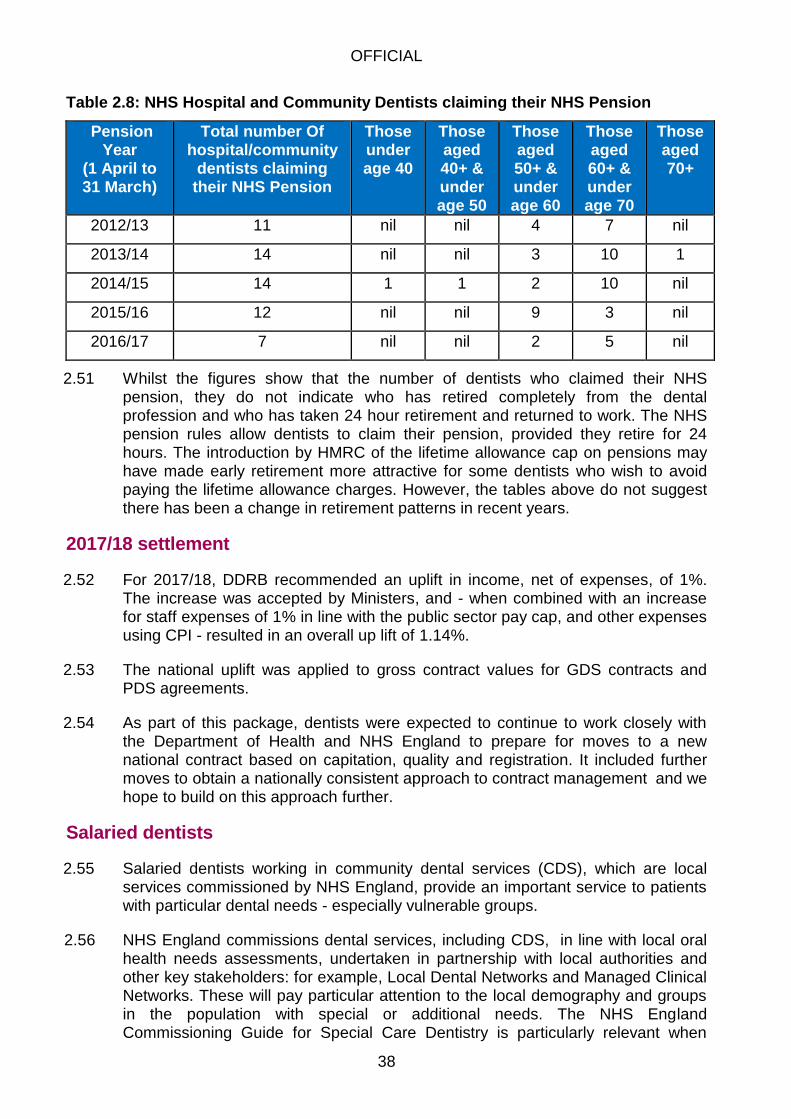
OFFICIAL
38
Table 2.8: NHS Hospital and Community Dentists claiming their NHS Pension
Pension Year
(1 April to 31 March)
Total number Of hospital/community
dentists claiming their NHS Pension
Those under age 40
Those aged 40+ & under age 50
Those aged 50+ & under age 60
Those aged 60+ & under age 70
Those aged 70+
2012/13 11 nil nil 4 7 nil
2013/14 14 nil nil 3 10 1
2014/15 14 1 1 2 10 nil
2015/16 12 nil nil 9 3 nil
2016/17 7 nil nil 2 5 nil
2.51 Whilst the figures show that the number of dentists who claimed their NHS pension, they do not indicate who has retired completely from the dental profession and who has taken 24 hour retirement and returned to work. The NHS pension rules allow dentists to claim their pension, provided they retire for 24 hours. The introduction by HMRC of the lifetime allowance cap on pensions may have made early retirement more attractive for some dentists who wish to avoid paying the lifetime allowance charges. However, the tables above do not suggest there has been a change in retirement patterns in recent years.
2017/18 settlement
2.52 For 2017/18, DDRB recommended an uplift in income, net of expenses, of 1%. The increase was accepted by Ministers, and - when combined with an increase for staff expenses of 1% in line with the public sector pay cap, and other expenses using CPI - resulted in an overall up lift of 1.14%.
2.53 The national uplift was applied to gross contract values for GDS contracts and PDS agreements.
2.54 As part of this package, dentists were expected to continue to work closely with the Department of Health and NHS England to prepare for moves to a new national contract based on capitation, quality and registration. It included further moves to obtain a nationally consistent approach to contract management and we hope to build on this approach further.
Salaried dentists
2.55 Salaried dentists working in community dental services (CDS), which are local services commissioned by NHS England, provide an important service to patients with particular dental needs - especially vulnerable groups.
2.56 NHS England commissions dental services, including CDS, in line with local oral health needs assessments, undertaken in partnership with local authorities and other key stakeholders: for example, Local Dental Networks and Managed Clinical Networks. These will pay particular attention to the local demography and groups in the population with special or additional needs. The NHS England Commissioning Guide for Special Care Dentistry is particularly relevant when
OFFICIAL
39
commissioning CDS as it will often be a key provider of more advanced special care services.
2.57 NHS England believes that CDS play an important role in dental health service provision and are not aware of any specific difficulties in filling vacancies faced by providers.
Contract changes in 2018/19
2.58 We are taking forward discussions with the BDA with a view to setting a direction of travel that aligns key contract changes to the Five Year Forward View.
General Dental Practitioners: conclusion
2.59 This chapter provides information on the latest position on recruitment and retention, earnings and expenses, and other relevant developments for general dental practitioners.


![Back To Basics GMPs[1]](https://img.pdfslide.net/doc/110x75/5874977b1a28abfc5f8b4b05/back-to-basics-gmps1.jpg)