Embed Size (px)
Citation preview
ArkPSA Arkansas Political Science Association
───────────────────────────────────────────────
Offensive Realism, Defensive Realism, and the Role of Constraints Author(s): Peter Rudloff Source: The Midsouth Political Science Review, Volume 14 (December 2013), pp. 45-77 ISSN: 2330-6882 [print]; 2330-6890 [online] Published by: Arkansas Political Science Association Website: http://uca.edu/politicalscience/midsouth-political-science-review-mpsr/ ───────────────────────────────────────────────

Offensive Realism, Defensive Realism, and the Role of Constraints1
Peter Rudloff
Oklahoma State University
Despite the prominence of realist theory in international relations, there is much disagreement among realists as to how states make decisions, and few studies attempt to compare different realist theories with formal models and large-N empirical analysis. This article applies optimization models from the economic literature to two variants of realist theory: offensive and defensive realism. The key constraints in these economic models are shown to be one way to develop clear alternative hypotheses that distinguish between these two realist theories. These two hypotheses are tested with data on major powers from 1820 to 2000. The results of this analysis indicate that while there is little support for either offensive or defensive realist theory across the entire period of study, there is more support for defensive realism when examining the pre-World War I and post-World War II time periods separately.
Introduction Do major powers aggressively seek power over other states, or do states only seek enough power in order to achieve an acceptable level of security? This is an ongoing question in international relations research (Labs 1997), and the answer to such a question has profound implications for the international system. In the case of aggressive states, the international system is a never-ending competition for power, and the losers of this competition face insecurity and possible extinction (see, for example, Mearsheimer 2001). On the other hand, major powers may fear what other states may do, but this fear does not drive states to necessarily aggressively dominate other states, but only to protect themselves (see, for example, Waltz 1979). Whether one model of major power behavior is more appropriate than the other is an ongoing debate in the academic literature, and leads to vastly different arguments for how major powers should approach foreign policy. One strand of realism, known as “offensive realism” (Mearsheimer 2001, 5), argues “that the international system forces great power states to
1 I thank Paul Diehl, Michael Findley, Robert Pahre, James Scott, Tze Kwang Teo, Brandon Valeriano, and Mark Wolfgram for helpful comments and suggestions, and Lynsey Parsons for research assistance. I also wish to thank the Program in Arms Control, Disarmament, and International Security at the University of Illinois at Urbana-Champaign (http://www.acdis.uiuc.edu) for fellowship support during this project. An earlier version of this paper was presented at the 2005 International Studies Association-Midwest meeting in St. Louis, MO.
46 | Rudloff
maximize their relative power because that is the optimal way to maximize their security” (Mearsheimer 2001, 21).2 The alternative theory, known as “defensive realism” (Lynn-Jones 1998, 157) derives primarily from Waltz (1979), and is a theoretical perspective proposing “that the international system does not necessarily generate intense conflict and war, and that defensive strategies are often the best route to security” (Lynn-Jones 1998, 157–158).3 Note that while there are similarities between these two realist theories, Snyder (2002) points out that “Where Mearsheimer departs from Waltz is in his assertion that the search for power and security is insatiable” (151). The problem with distinguishing between these two theories (as well as between realist and non-realist theory) is that both realist theories assume that states seek some amount of power, and both theories assume that states seek power through similar means (Snyder 2002, 151–152). In other words, both theories assume that states engage in similar foreign policy behaviors, but the key difference is in the degree to which states engage in these foreign policy strategies. Ultimately, whether a strategy should be considered offensive or defensive in character is difficult to ascertain, particularly given that both theories argue the underlying motivation is “security” (Mearsheimer 2001, 31; Waltz 1979, 126). For example, the United States invasion of Iraq in 2003 can certainly be interpreted as an aggressive act, but at the time of the invasion, the arguments of United States leaders had partly to do with defense against weapons of mass destruction, implying at least the possibility that decision makers were motivated partly by defensive purposes. Recently, Russia initiated conflict against Georgia (Chivers 2008), but does this hostility amount to aggressive, offensively oriented behavior, or is Russia attempting to defend itself from what Russia perceives as the potential aggression of major powers such as the United States (Finn 2008)? Not only do these cases illustrate the difficulty of empirically distinguishing between offensive and defensive motivations, but assuming one type of motivation over the other may lead to vastly different policy recommendations for the states involved.4
2The terminology “offensive realism” (Mearsheimer 2001, 5) and “maximize” (Mearsheimer 2001, 21) as well as variations of these terms are used throughout to reference this theory. 3The term “defensive realism” (Lynn-Jones 1998, 157) is adopted throughout the rest of the paper. 4See, for example, Mearsheimer’s (2001) analysis and predictions concerning future international relations (384–400).
Offensive Realism, Defensive Realism, and the Role of Constraints | 47
This paper proceeds by further exploring offensive and defensive realism, as well as debates between these two perspectives. Two formal models are formulated, one for offensive realism and another for defensive realism. These models are then used to derive theoretical implications that focus on the constraints facing these states (see McGinnins 1994, 71–72 for the importance of constraints). By focusing on the fundamental constraints that drive realist foreign policy, separate hypotheses can be derived for each realist theory. These hypotheses allow for the testing of both whether either realist theory provides an adequate explanation of major power foreign policy, and which of the two realist theories provides a better explanation. The paper concludes with an analysis of major power foreign policy behavior between 1820 and 2000 in an attempt to use these differing theoretical implications to empirically compare offensive and defensive realism and determine whether one or either of the theories provides a better explanation of major power foreign policy behavior. Distinguishing Between Realist Theories Realism remains an important theoretical perspective in international relations, but over time realist theory has fragmented into a variety of theories united under the title of realism (Lynn-Jones 1998, 157). For example, one division is between traditional realist theories (Carr 1964; Morgenthau 1978) and “neorealist” theory (Mearsheimer 2001; Waltz 1979). Another division is between systemic forms of realist theory (Mearsheimer 2001; Waltz 1979) and realist theories that acknowledge the potential impact of domestic factors and institutions (Lobell 2002/2003; Rose 1998; Snyder 1991). Yet another division is among systemic-focused realist theorists, who disagree over whether major powers seek to maximize power (Elman 2004; Labs 1997; Mearsheimer 1994; 2001) or whether a particular amount of power is sufficient to ensure security (Waltz 1979). Lynn-Jones (1998) summarizes this division concisely:
One of the most significant divides within realism is between offensive realism and defensive realism. Offensive realists generally argue that the international system fosters conflict and aggression. Security is scarce, making international competition and war likely…Defensive realists, on the other hand, argue that the international system does not necessarily generate conflict and war, and defensive strategies are often the best route to security (157–158; footnotes from original omitted)
48 | Rudloff
This ongoing debate among realists over the virtues of offensive and defensive realism is the topic of this paper, which attempts to model and empirically compare these two forms of realist theory. Many of the studies in the offensive-defensive realist debate, and the challenge of offensive realism in particular, focus on the theoretical aspects of the two theories (Elman 2004; Labs 1997; Lee 2002/2003; Lobell 2002/2003; Lynn-Jones 1998; Montgomery 2006; Snyder 2002; Tang and Montgomery 2007). On the other hand, attempts to empirically distinguish between offensive and defensive realism, or to test the implications of offensive realism, tend to focus on small sets of case studies (Elman 2004; Feng 2005; Labs 1997; Lobell 2002/2003; Mearsheimer 2001; Montgomery 2006). Mearsheimer (2001) focuses on a number of major powers and whether “the history of great-power politics involves primarily the clashing of revisionist states” (168). A potential pitfall of such analysis is that many actions states take can be seen as either “revisionist” or “status quo” oriented (Mearsheimer 2001, 168–169) depending on one’s perspective. Snyder (2002), for example, points out that
Although it is coherent and without obvious inconsistency, it is sometimes pushed to extremes. Exhibit A in this respect is the claim that all great powers all the time are primarily concerned with maximizing power so as to maximize their security. Can it really be true that the world is condemned to a future of constant conflict and power struggles (171).
The debates surrounding particular cases, and the motivations of states are not easily resolved. For example, World War I remains one of the most important wars in recent history, and yet disagreement still exists over whether the war was ultimately caused by an overly-aggressive Germany (Tuchman 1962), or by a breakdown in the “balance of power” (Kagan 1995, 81–231).5 Given the disagreement over such an important case, is the generation of general empirical findings regarding the underlying motivations by examining major power foreign policies possible? This may explain the relative lack of large-N empirical studies attempting to distinguish between offensive and defensive realism. Although a number of empirical tests of realism have been conducted (see Palmer and Morgan 2007 for such a test, as well as 335-336 for a concise
5Kagan (1995) uses the term “balance of power” periodically throughout this section (that is, pages 81–231), for example on page 93.
Offensive Realism, Defensive Realism, and the Role of Constraints | 49
review of other tests), few focus on the distinctions between offensive and defensive realism, or the implications of offensive realism specifically (Lemke 2004). One possible exception is Valeriano (2009), which attempts to test offensive realism by examining the militarized conflict behavior of states, although this study does not directly compare offensive and defensive variations of realism. There is a lack of large-N empirical analysis that directly compares the empirical effectiveness of offensive and defensive realism. This may be due to the underlying problem of motivations, and the difficulty of discerning these motivations from actions. Without testable implications, such a large-N comparison of offensive and defensive realism is impossible. One method for generating testable implications is to adopt a formal modeling approach, which has been shown to be successful in generating implications from realist theory (Powell 1999). Powell (1999), formalizes realist theory although he notes that “a natural next step in the modeling would be to allow the states to respond to a threat in more than one way” (213). Incorporating multiple realist foreign policies addresses concerns related to “substitutability” (Most and Starr 1989, 102–110). Some models incorporate these concerns by adopting a modeling framework that incorporates a number of foreign policy strategies (Morgan and Palmer 2000; Palmer and Morgan 2006). Such studies offer a method for distinguishing between offensive and defensive realism through the role of constraints, and this general approach is adopted in the following pages. McGinnis (1994) notes that:
Since preferences are not directly measurable, it is impossible to test any assertion that an actor’s behavior has changed because its preferences have changed... Economists typically relate behavioral changes to observable changes in constraints (71).
By examining the role of constraints in realist foreign policy, this study hopes to theoretically distinguish between offensive and defensive realism in a manner that can be empirically tested. By focusing on foreign policy, this study may be criticized by realists as “reductionist” (Waltz 1979, 18–37). Offensive and defensive realists both argue that aspects of the international system are key factors in international relations (Mearsheimer 2001, 19–22; Waltz 1979, 73–78). However, realists themselves tend to focus on foreign policy, such that even though “structure” (Waltz 1979, 73) may be an important causal factor, state behavior is often the focus of theoretical and empirical analysis
50 | Rudloff
(Mearsheimer 2001, 334–359). Even so, aspects of the international system are not abandoned in the following pages. Two Models of Realist Foreign Policy Decision Making
The formal models in this paper must accomplish two goals. First, the models must allow for theoretical implications that are both testable, and distinguishable between different models of realist foreign policy. Second, the models must easily incorporate a number of foreign policy strategies within a single framework, such that the implications of the formal models will not be confounded by the possibility of substitutability (Most and Starr 1989). To fulfill both of these goals, models commonly used in the field of economics known as “constrained optimization” models (Kreps 1990, 775–789; Simon and Blume 1994, 411–482) are used. A number of other studies of foreign policy decision making use these types of models in their analysis (Morgan and Palmer 2000; Palmer and Morgan 2006). Variations in these models match up well with realist theories, and the theoretical implications of these models, via the role of constraints on decision making (McGinnis 1994), allow us to more readily empirically distinguish between offensive and defensive realism. One common factor uniting the following models is the importance of “relative power” (Mearsheimer 2001, 34).6 According to realists, acquiring relative power is the first priority of states, and the difference between offensive and defensive realism has to do with “amount” (Snyder 2002, 152). How do states acquire power? Following realist theory, there are three primary ways that states may achieve relative power over other states. Waltz (1979) identifies “internal balancing” (168) and “external balancing” (168) as two foreign policy strategies of states. These two strategies roughly correspond to military spending and alliances (respectively), two means through which states may increase their power according to both defensive (see Waltz 1979 above) and offensive realists (Mearsheimer 2001, 156–157). A third strategy available to states is military conflict, which allows states to strengthen themselves or weaken potential major power opponents (Mearsheimer 2001, 147-152). These three strategies form the basis of relative power acquisition in the following two sections outlining formal models of offensive and defensive realism. By including each of these three strategies, the models reflect how realist theorists view foreign policy. The models, however, also provide the ability to test whether the realist formulation of
6The term “relative power” (Mearsheimer 2001, 34) is used throughout the rest of the paper.
Offensive Realism, Defensive Realism, and the Role of Constraints | 51
foreign policy is effective, by allowing for the empirical examination of each of the three strategies separately. Offensive Realism
As noted earlier, the offensive realism view of major power foreign policy is that states attempt to maximize relative power (Labs 1997; Mearsheimer 1994; 2001). States, however, are not able to simply acquire an infinite amount of power due to limited resources (Mearsheimer 2001, 60–75). These resources serve as a significant constraint, in that states must deal with these limitations when attempting to maximize their relative power.
In the offensive realism model, relative power is represented by , and
relative power is assumed to be a function of each of the three realist foreign
policies outlined above: military spending ( ), alliances ( ), and conflict ( ).
Each variable represents the investment in a particular foreign policy strategy, and are the key variables in the model that can be manipulated by states. That is to say, states do not produce relative power directly, but instead invest in foreign policy strategies, which in turn lead to relative power. The relative power equation takes the form of a Cobb-Douglas function (Cobb and Douglas 1928), such that:
(1)
where , , and represent parameters that translate investment in each of
the realist foreign policies into power (each of these three parameters are assumed to be greater than 0 and less than 1 (Sydsaeter, Strom, and Berck
2000, 156)). This equation, , represents the key function in the
production of power for major powers. Note that an increase in investment in each of these strategies leads to an increase in power, so higher levels of a
strategy such as military spending (i.e. ) leads to higher levels of power
( ). The Cobb-Douglas function (Cobb and Douglas 1928) is useful because
of its mathematical clarity, and is used in many formal models of foreign policy (Morgan and Palmer 2000; Palmer and Morgan 2006). One of the further assumptions of the model is that states invest in a positive and non-
zero amount of each foreign policy strategy (i.e. , , ). In other words,
states invest in a mix of strategies (this will be further explored in terms of the equilibria below). Equation 1 is only part of the story. If this were the only consideration of states seeking to maximize their power, then states would simply produce infinite amounts of power by investing in infinite amounts of each of the
52 | Rudloff
realist foreign policies. Of course, states cannot invest in infinite amounts of any foreign policy because states are limited in their capabilities of investment (see Mearsheimer 2001, 60–75). Due to this limitation, states take
into consideration their level of capabilities ( ). A state cannot invest more
in foreign policy strategies than their capabilities allow, but a state that wishes to maximize relative power will spend all of their capabilities on producing relative power. Therefore, a state maximizes equation 1 subject to the following capability constraint:
(2)
where , , and are parameters that translate investment in each of the
strategies into capabilities, . The capabilities function is represented as an
equality, because states will not spend less than their capabilities. By
investing less than , a state would produce less than the maximum amount
of power, which would not occur with states attempting to maximize relative power. These two equations may be a simplification, however, this formalization attempts to capture only the essential aspects of major power decision making as described by offensive realist theory. For example, one might argue that states do not spend all of their capabilities seeking relative power. Mearsheimer (2001), after all, argues that “States care about relative wealth, because economic might is the foundation of military might” (143), and as some have pointed out, investing in strategies such as military spending may ultimately decrease a state’s economic capability (Heo and
Eger 2005). Even if this is the case, does not necessarily represent the
entirety of a state’s economic resources. For example, may represent the
amount of resources available to be spent on realist foreign policies that will not compromise the state’s future economic ability to invest in realist foreign policy strategies. How much do states invest in each of the foreign policies? This depends
on a variety of factors, namely the level of a state’s capabilities ( ), and the
translation parameters described above ( , , , , , and ). The optimal
investment in each of the foreign policies is determined by a process described in Simon and Blume (1994, 411–482).7 The optimal levels of each
strategy are represented by the following three equations (the “ ” represents
7Given space limitations, a full step-by-step derivation of equilibria is not provided, but instead the reader can refer to Simon and Blume (1994, 411-482).
Offensive Realism, Defensive Realism, and the Role of Constraints | 53
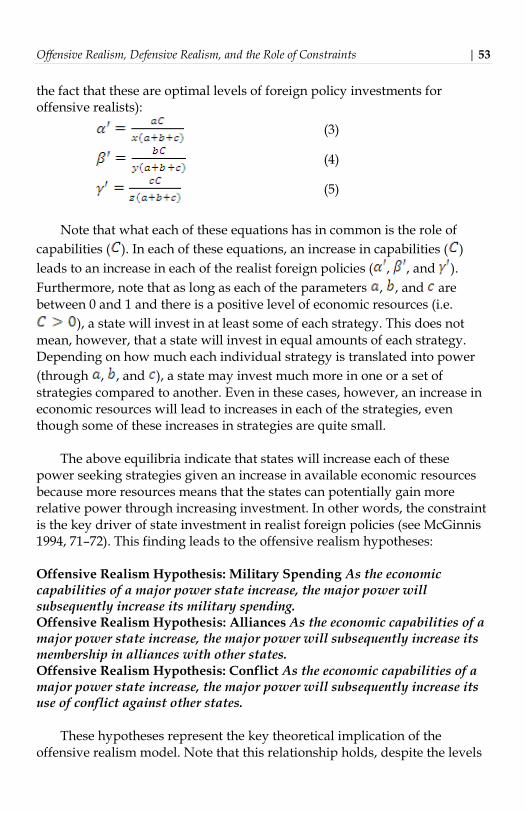
the fact that these are optimal levels of foreign policy investments for offensive realists):
(3)
(4)
(5)
Note that what each of these equations has in common is the role of
capabilities ( ). In each of these equations, an increase in capabilities ( )
leads to an increase in each of the realist foreign policies ( , , and ).
Furthermore, note that as long as each of the parameters , , and are
between 0 and 1 and there is a positive level of economic resources (i.e.
), a state will invest in at least some of each strategy. This does not
mean, however, that a state will invest in equal amounts of each strategy. Depending on how much each individual strategy is translated into power
(through , , and ), a state may invest much more in one or a set of
strategies compared to another. Even in these cases, however, an increase in economic resources will lead to increases in each of the strategies, even though some of these increases in strategies are quite small. The above equilibria indicate that states will increase each of these power seeking strategies given an increase in available economic resources because more resources means that the states can potentially gain more relative power through increasing investment. In other words, the constraint is the key driver of state investment in realist foreign policies (see McGinnis 1994, 71–72). This finding leads to the offensive realism hypotheses: Offensive Realism Hypothesis: Military Spending As the economic capabilities of a major power state increase, the major power will subsequently increase its military spending. Offensive Realism Hypothesis: Alliances As the economic capabilities of a major power state increase, the major power will subsequently increase its membership in alliances with other states. Offensive Realism Hypothesis: Conflict As the economic capabilities of a major power state increase, the major power will subsequently increase its use of conflict against other states. These hypotheses represent the key theoretical implication of the offensive realism model. Note that this relationship holds, despite the levels
54 | Rudloff
of the parameters , , and , which alter the attractiveness of an individual
strategy relative to the others. For example, assume that a major power is
maximizing a version of equation 1, where is much greater than either or
, thus meaning that investments in conflict ( ) result in larger contributions
to power than investments in other power strategies (see Mearsheimer 2001, 344 for such an argument). Even in this case, the expectation is that increases
in capabilities ( ) lead to an increase in each strategy rather than an increase
in only conflict. A further benefit of this approach is the testing of each individual foreign policy strategy, as well as offensive realism as a whole. Analysis may indicate that realist theory provides an explanation of only certain strategies. As detailed in the next section, the relationship between capabilities and each power strategy provides a method for distinguishing between offensive and defensive realism forms of foreign policy. Defensive Realism Under the defensive realism decision making framework, relative power is important, but “the first concern of states is not to maximize power but to maintain their position in the system” (Waltz 1979, 126). Furthermore, assuming that states rely on capabilities for a variety of ends, including power (Waltz 1979, 126), then capabilities can no longer be seen as the primary constraint on power seeking behavior. An alternative approach to
this problem assumes that states seek both power ( ) and “other goals”
(Waltz 1979, 126)8 (these non-power goals are referred to as ), but that
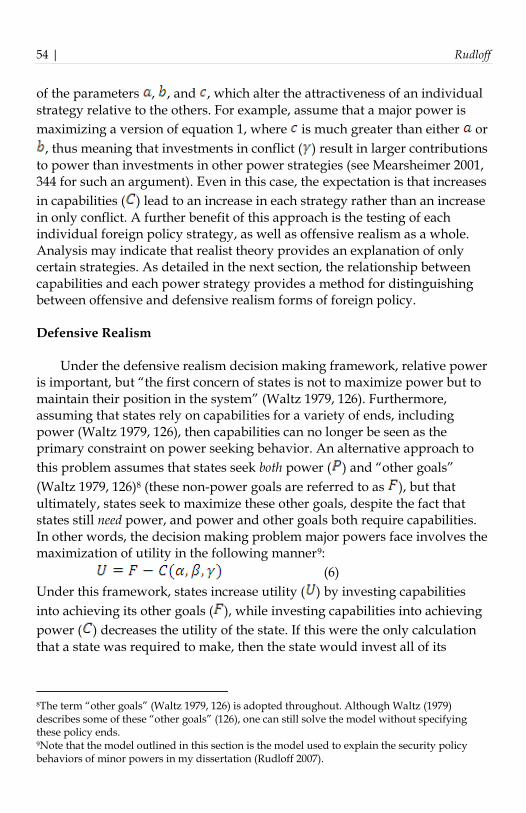
ultimately, states seek to maximize these other goals, despite the fact that states still need power, and power and other goals both require capabilities. In other words, the decision making problem major powers face involves the maximization of utility in the following manner9:
(6)
Under this framework, states increase utility ( ) by investing capabilities
into achieving its other goals ( ), while investing capabilities into achieving
power ( ) decreases the utility of the state. If this were the only calculation
that a state was required to make, then the state would invest all of its
8The term “other goals” (Waltz 1979, 126) is adopted throughout. Although Waltz (1979) describes some of these “other goals” (126), one can still solve the model without specifying these policy ends. 9Note that the model outlined in this section is the model used to explain the security policy behaviors of minor powers in my dissertation (Rudloff 2007).
Offensive Realism, Defensive Realism, and the Role of Constraints | 55
capabilities into achieving its other goals ( ), and would not invest any
capabilities in power seeking foreign policies (such as , , and ).
Unfortunately for major powers, they must invest some amount of capabilities into power, in order to achieve security (Waltz 1979, 126). As suggested by some realists, however, states do not need to maximize power, but rather invest in enough power to achieve security (Snyder 2002, 151–155). Waltz (1979) argues that “Only if survival is assured can states safely seek such other goals as tranquility, profits, and power” (126). In other words, defensive realists seek enough relative power to achieve security, but do not necessarily seek more power, because seeking additional power
would require the state to compromise other goals ( ) that represent the true
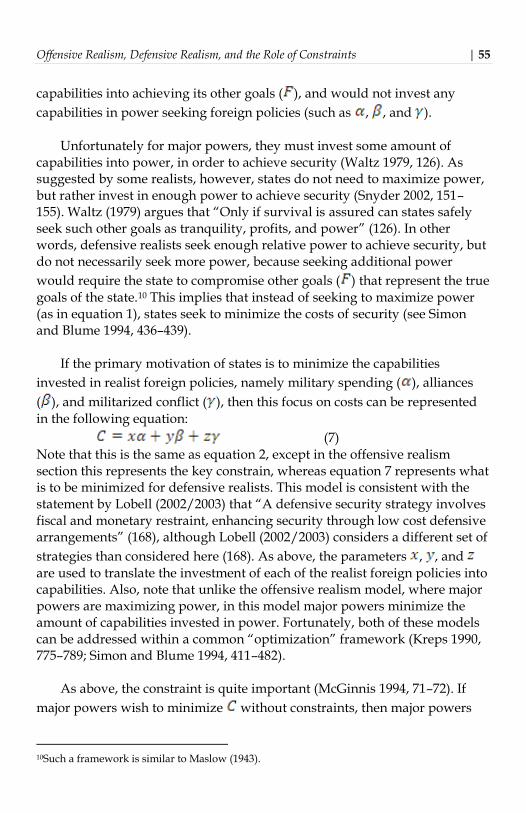
goals of the state.10 This implies that instead of seeking to maximize power (as in equation 1), states seek to minimize the costs of security (see Simon and Blume 1994, 436–439). If the primary motivation of states is to minimize the capabilities
invested in realist foreign policies, namely military spending ( ), alliances
( ), and militarized conflict ( ), then this focus on costs can be represented
in the following equation:
(7)
Note that this is the same as equation 2, except in the offensive realism section this represents the key constrain, whereas equation 7 represents what is to be minimized for defensive realists. This model is consistent with the statement by Lobell (2002/2003) that “A defensive security strategy involves fiscal and monetary restraint, enhancing security through low cost defensive arrangements” (168), although Lobell (2002/2003) considers a different set of
strategies than considered here (168). As above, the parameters , , and
are used to translate the investment of each of the realist foreign policies into capabilities. Also, note that unlike the offensive realism model, where major powers are maximizing power, in this model major powers minimize the amount of capabilities invested in power. Fortunately, both of these models can be addressed within a common “optimization” framework (Kreps 1990, 775–789; Simon and Blume 1994, 411–482). As above, the constraint is quite important (McGinnis 1994, 71–72). If
major powers wish to minimize without constraints, then major powers
10Such a framework is similar to Maslow (1943).
56 | Rudloff
simply invest no capabilities in realist foreign policies, would equal zero,
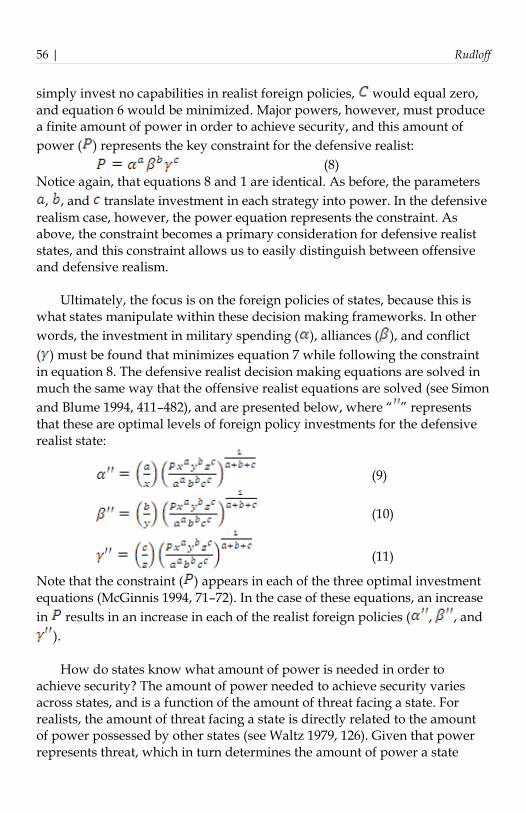
and equation 6 would be minimized. Major powers, however, must produce a finite amount of power in order to achieve security, and this amount of
power ( ) represents the key constraint for the defensive realist:
(8)
Notice again, that equations 8 and 1 are identical. As before, the parameters
, , and translate investment in each strategy into power. In the defensive
realism case, however, the power equation represents the constraint. As above, the constraint becomes a primary consideration for defensive realist states, and this constraint allows us to easily distinguish between offensive and defensive realism. Ultimately, the focus is on the foreign policies of states, because this is what states manipulate within these decision making frameworks. In other
words, the investment in military spending ( ), alliances ( ), and conflict
( ) must be found that minimizes equation 7 while following the constraint
in equation 8. The defensive realist decision making equations are solved in much the same way that the offensive realist equations are solved (see Simon
and Blume 1994, 411–482), and are presented below, where “ ” represents
that these are optimal levels of foreign policy investments for the defensive realist state:
(9)
(10)
(11)
Note that the constraint ( ) appears in each of the three optimal investment
equations (McGinnis 1994, 71–72). In the case of these equations, an increase
in results in an increase in each of the realist foreign policies ( , , and
).
How do states know what amount of power is needed in order to achieve security? The amount of power needed to achieve security varies across states, and is a function of the amount of threat facing a state. For realists, the amount of threat facing a state is directly related to the amount of power possessed by other states (see Waltz 1979, 126). Given that power represents threat, which in turn determines the amount of power a state
Offensive Realism, Defensive Realism, and the Role of Constraints | 57
needs to achieve security, the following hypotheses summarize the theoretical implications of the defensive realist model: Defensive Realism Hypothesis: Military Spending As the threat facing a major power state increases, the major power will subsequently increase its military spending. Defensive Realism Hypothesis: Alliances As the threat facing a major power state increases, the major power will subsequently increase its membership in alliances with other states. Defensive Realism Hypothesis: Conflict As the threat facing a major power state increases, the major power will subsequently increase its use of conflict against other states. Note that the constraint drives the defensive realism hypothesis as the constraint drives the offensive realism hypothesis (see McGinnis 1994, 71–72), but that the constraint is different in each model. Furthermore, the relationship between threat and each strategy is expected despite variation
in those factors (represented by , , and ) that make particular strategies
more effective. The difference in constraints distinguishes between the two realist models, and serves as the basis of the empirical comparison between offensive and defensive realist theories in the following sections. Testing Realist Foreign Policy Behavior
The focus of the analysis is on the periods between 1816-1916 and 1946-2000, because a variety of different potential major powers exist during these periods, and the period spans a variety of different phases in international relations, including the Cold War. This means that the hypotheses can be tested in a variety of international contexts, and more importantly for realist theory, in a variety of “polarity” (James 1995, 183) contexts. Realists argue that the concentration and “distribution of power” (Mearsheimer 2001, 348) in the international system represent important determinants of how states behave (Mearsheimer 2001, 334–359). This argument can be examined in the following analysis by examining the effects of defensive and offensive realist variables in different time periods. Realists typically argue that the only important states in the international system are major powers (Mearsheimer 2001, 17), so in order to test realist theories on their own terms, the focus here is also on major powers. The operationalization of “major power” is potentially controversial, because power (a continuous characteristic) must be used to create a dichotomous
58 | Rudloff
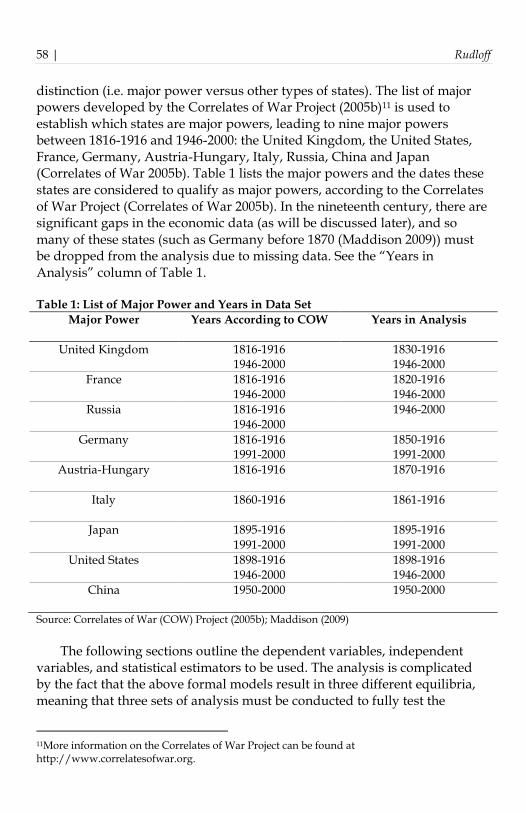
distinction (i.e. major power versus other types of states). The list of major powers developed by the Correlates of War Project (2005b)11 is used to establish which states are major powers, leading to nine major powers between 1816-1916 and 1946-2000: the United Kingdom, the United States, France, Germany, Austria-Hungary, Italy, Russia, China and Japan (Correlates of War 2005b). Table 1 lists the major powers and the dates these states are considered to qualify as major powers, according to the Correlates of War Project (Correlates of War 2005b). In the nineteenth century, there are significant gaps in the economic data (as will be discussed later), and so many of these states (such as Germany before 1870 (Maddison 2009)) must be dropped from the analysis due to missing data. See the “Years in Analysis” column of Table 1. Table 1: List of Major Power and Years in Data Set
Major Power Years According to COW Years in Analysis
United Kingdom 1816-1916 1946-2000
1830-1916 1946-2000
France 1816-1916 1946-2000
1820-1916 1946-2000
Russia 1816-1916 1946-2000
1946-2000
Germany 1816-1916 1991-2000
1850-1916 1991-2000
Austria-Hungary 1816-1916
1870-1916
Italy 1860-1916
1861-1916
Japan 1895-1916 1991-2000
1895-1916 1991-2000
United States 1898-1916 1946-2000
1898-1916 1946-2000
China 1950-2000
1950-2000
Source: Correlates of War (COW) Project (2005b); Maddison (2009)
The following sections outline the dependent variables, independent variables, and statistical estimators to be used. The analysis is complicated by the fact that the above formal models result in three different equilibria, meaning that three sets of analysis must be conducted to fully test the
11More information on the Correlates of War Project can be found at http://www.correlatesofwar.org.
Offensive Realism, Defensive Realism, and the Role of Constraints | 59
theoretical implications of offensive and defensive realism. This requires different statistical methods to accommodate the different types of dependent variables. Dependent Variables According to the above analysis, each realist foreign policy is a potential dependent variable. Given the theoretical implications of the model, separate dependent variables for each strategy are constructed: military spending, alliances, and conflict. Military Spending. The military spending variable is constructed from the Correlates of War Project’s National Military Capabilities data set, version 3.02 (Singer, Bremer and Stuckey 1972).12 Several complications with this data must be addressed before analysis can be completed. First, the data are presented in two different currencies. Before 1914, the data is in British pounds, while after 1913 the data is United States dollars (Correlates of War 2005a, 17). In order to transform the data into a single currency, the currency figures prior to 1914 are converted from British pounds to United States dollars using Officer’s (2008) currency conversion data.13 As a result, all of the data are in a single currency, United States dollars. The second issue is that the data is in “current” values for each year (Correlates of War 2005a, 20), meaning that the data is not controlled for inflation. Comparing currency values at different times is problematic because a United States dollar in 1856 is not the same as a United States dollar in 1956. Sahr’s (2009) data on inflation is used to convert the military spending data, such that the data is in year 2000 United States dollars,14 making the comparison of data possible between the nineteenth and twentieth century. The military spending variable measures the year to year change in the military spending of a state by subtracting the previous year’s military
12The Correlates of War Project’s National Military Capabilities data set can be downloaded from http://www.correlatesofwar.org. 13Officer’s (2008) currency conversion data was downloaded from http://www.measuringworth.com on March 8, 2008. This website contains a variety of economic data in addition to currency conversion data. 14Sahr’s (2009) data was downloaded on October 25, 2009 from http://oregonstate.edu/cla/polisci/faculty-research/sahr/sahr.htm. This website contains a variety of data on inflation.
60 | Rudloff
spending from the current year. This results in a continuous variable that varies from negative values (indicating a decrease in military spending) to positive values (indicating an increase in military spending). Alliances. The alliance data is constructed from the Correlates of War Project’s Formal Alliance data set, version 3.03 (Gibler and Sarkees 2004). For the purposes of constructing the alliance data, all alliances in the Correlates of War data set are included: “defense pacts”, “neutrality or non-aggression pact”, and “entente” (Gibler and Sarkees 2004, 212). Two variables were constructed from this data to measure the change in alliance strategies. The first is a variable indicating whether a state entered into an alliance in a given year, and the second is a variable indicating whether a state exited an alliance in a given year. In this way, the analysis can measure both increases and decreases in alliance behavior over time. Conflict. The conflict variable is constructed using the Correlates of War Project’s Militarized Interstate Dispute data, version 3.10 (Ghosn, Palmer and Bremer 2004).15 As with the alliance data, the conflict data is an indicator variable, which measures whether an event (i.e. “militarized interstate disputes” (Ghosn, Palmer and Bremer 2004)) occurs in a given year. Conflicts only in the year in which the dispute begins or the “start year of participation in dispute” (Ghosn and Palmer 2003, 4) are included. Conflict initiation is a rare event. Furthermore, many MIDs last for only short periods of time, and are thus contained within the same year. Both these facts make measuring change over time difficult, which is why the analysis relies on the indicator of conflict initiation. Alternative measures of the conflict variable are a count of the number of conflict initiations, and the year to year difference in the number of disputes initiated. Results for these alternative variables are noted later in the paper. Independent Variables
The statistical analysis centers on two key independent variables, economic resources and threat, corresponding to the two realist hypotheses (offensive realism and defensive realism, respectively). The economic
resources variable corresponds to in the above formal model of offensive
realism, or the general capabilities of a state as indicated in equations 3, 4,
and 5. The threat variable corresponds to in the above defensive realism
15The Correlates of War Project’s Militarized Interstate Dispute data set (Ghosn, Palmer and Bremer 2004) can be downloaded from http://www.correlatesofwar.org.
Offensive Realism, Defensive Realism, and the Role of Constraints | 61
formal model, or the relative power needed to ensure security in equations 9, 10, and 11. Several other variables are included as controls. Where appropriate, the year-to-year change in these variables are measured to analyze whether changes in the independent variables lead to appropriate changes in the dependent variables. All of the independent variables are lagged a year. Economic Resources. The economic constraint variable developed in the
above formal models ( ) are measured with the economic capability of each
major power in a given year. As noted above, realists acknowledge (Mearsheimer 2001, 143), and other theorists argue (Heo and Eger 2005) that one cannot simply ignore economic capability considerations. Instead, the constraint represents some portion of a state’s economic capability that will be used to invest in each power strategy. Realists such as Mearsheimer (2001), however, do not provide clear empirical guidance as to what portion of economic capability will be used. Assuming that overall economic capability is a proxy for the overall amount that will be used to invest in the strategies is, however, reasonable. As the overall economic capabilities of a state increase, so too will the amount of resources that can be used without compromising the future ability of the state to invest in power strategies. The economic resources variable is constructed from Maddison’s (2009) “Statistics on World Population, GDP, and Per Capita GDP, 1 - 2006 AD”, which was downloaded on October 25, 2009.16 Maddison’s (2009) data includes a variety of states from 1820 onward, although some data is missing for various states.17 Due to missing data, the number of state-years included in the final analysis is smaller than the Correlates of War Project’s (2005b) list of major powers suggests. Table 1 contains a column entitled “Years in Analysis” which lists the years each state is included in the analysis as a result of the Maddison (2009) data. Although this limits the number of cases,
16Maddison’s (2009) gross domestic product data was downloaded from http://www.ggdc.net/maddison/, and the website contains a variety of information on economic data collected for various states. Although “Maddison (2009)” is cited throughout in reference to the data, note that this data is associated with a variety of written works (Maddison 1995; 2001; 2003). Throughout the rest of the paper, however, references to “Maddison (2009)” as the source of the data are made. 17A variety of states do not have economic data for a variety of years in Maddison’s (2009) data set. In addition to these missing values, several changes to the data are made, because there are a number of states in the nineteenth century that have a observation for a given year, but not proceeding and subsequent years (Maddison 2009). First, the Austria-Hungary observations begin in 1861. Second, the Germany observations begin in 1850. Third, the Russia observations begin in 1946. Fourth, the Italy observations begin in 1861.
62 | Rudloff
the list can be viewed as a more conservative estimation of which states are major powers in a particular year.18 In order to measure change, the economic resources variable measures year-to-year changes in gross domestic product (GDP). The variable is constructed by subtracting the previous year’s GDP from a given year’s GDP. Threat. The threat variable is constructed from the Correlates of War Project’s National Military Capabilities data set, version 3.02 (Singer, Bremer and Stuckey 1972).19 This is the same data used above to estimate a state’s military spending. In order to estimate the threat facing a state, the sum is taken of military spending for every other major power (Correlates of War 2005b). The military spending data is converted into United States dollars for the years before 1914 by using Officer’s (2008) data on currency conversion.20 Second, the data is controlled for inflation using Sahr’s (2009) data for 2000 United States dollars.21 Finally, the data was transformed into a change variable by subtracting the previous year’s threat from a given year’s threat. Control Variables. Two variables are constructed to measure the systemic power distribution. First, a polarity variable is intended to measure the manner in which power is distributed in the international system for a given year (see James 1995). As described above, realists argue that polarity is an important causal factor in explaining state behavior (for example, Mearsheimer 2001, 334–359), and including a variable for polarity will help to control for power characteristics at the system level that may potentially affect the foreign policies of major powers (see Valeriano 2009). The polarity distinction of “bipolarity” and “multipolarity” from Mearsheimer (2001, 348) is adopted, dividing the time period into three categories: “multipolarity” from 1816–1916, “bipolarity” from 1946–1990, and “multipolarity” from 1991–2000 (see Mearsheimer 2001, 348 for the original measure on which this
18The Maddison (2009) data already appear to be controlled for inflation. To help ascertain the validity of Maddison’s (2009) data, a correlation of Maddison’s (2009) data with Gleditsch’s (2002) Expanded Trade and GDP Data, version 4.1, which contains gross domestic product data (this data is also controlled for inflation) was created. Although the Gleditsch (2002) data only begins in 1950, the correlation between the Maddison (2009) and Gleditsch (2002) data for the
1950–2000 period is quite high (i.e. 0.9). The Maddison (2009) data is therefore consistent with another gross domestic product data set. 19The Correlates of War Project’s National Military Capabilities data set can be downloaded from http://www.correlatesofwar.org. 20Officer’s (2008) currency conversion data was downloaded from http://www.measuringworth.com on March 8, 2008. 21Sahr’s (2009) inflation data was downloaded from http://oregonstate.edu/cla/polisci/faculty-research/sahr/sahr.htm on October 25, 2009.
Offensive Realism, Defensive Realism, and the Role of Constraints | 63
is adapted). Second, a variable providing a continuous measure of the concentration of power in the international system is created by summing the power of all the major powers. This is done by adding together the major powers’ Correlates of War “Composite Index of National Capability” (Correlates of War 2010, 1) in each year. This provides a rough measure of how much power the major powers possess in the international system. An additional indicator variable is added to measure whether or not a state is involved in an ongoing war according to the Correlates of War Inter-state War data (Sarkees and Wayman 2010).22 States involved in a war may be more likely to increase strategies such as military spending, regardless of the threat from other major powers. Finally, two non-realist variables are also included to provide additional controls. The first is a variable measuring the year-to-year change in the total imports and exports of a major power (Barbieri, Keshk, and Pollins 2009; Barbieri and Keshk 2012).23 The second is the change in the PolityIV (Marshall, Jaggers, and Gurr 2011) regime type measurement.24 These latter two variables are included in a separate analysis as each is not a realist variable, and the trade data is limited to the time period after 1870 (Barbieri, Keshk, and Pollins 2009; Barbieri and Keshk 2012). Statistical Estimation
Given the variety of dependent variables, utilizing a single statistical estimator in subsequent analysis is impossible. Therefore, an appropriate estimator for the distribution of each of the dependent variables must be used. To analyze the military spending of major powers, a feasible generalized least squares model is presented, which is appropriate given the continuous distribution of the military spending variable (Greene 2003, 322). The alliance and conflict variables are analyzed with a logit model, because each of these variables represents whether a particular event takes place (Long and Freese 2006, 129-140). Random effects are included to account for the time series cross-sectional data, helping to control for unit-level effects (Greene 2003, 293-295). Finally, for each of these random effects models, the year is included as an independent variable. Given that some variables are generally increasing over time (particularly military spending), inclusion of
22The Correlates of War Inter-State data, version 4.0 can be downloaded from http://www.correlatesofwar.org. 23The Correlates of War Bilateral Trade data can be downloaded at http://www.correlatesofwar.org. 24The Polity IV dataset can be downloaded from http://www.systemicpeace.org.
64 | Rudloff
year will help control for this year-to-year dependence in the data (see Drury and Li 2006, 319 for a similar use of a temporal variable). There are significant changes across the time period of study, including significant changes in the states that are considered major powers. Due to this, not only is the overall model included for all of the years in the data, but also a separate analysis for the time period before World War I and after World War II. Such a division in the data is justified for both theoretical and empirical reasons. First, both offensive and defensive realists believe that the structure of the international system is important (Mearsheimer 2001; Waltz 1979), and there are important changes in this structure that occur before and after the World Wars (see Mearsheimer 2001, 348). Second, other empirical studies demonstrate that important changes may occur between different time periods (Senese and Vasquez 2005).25 This division allows for the examination of this possibility. Empirical Analysis of Offensive and Defensive Realism Table 2 summarizes the results of the military spending analysis. There is little evidence indicating that either of the realist models provide an adequate explanation for the year-to-year change in military spending when examining the entire time period. Models 1 and 2 illustrate that both key realist variables, while positive as one would expect, are not statistically significant. A further check was conducted that split each of the two key variables (economic resources and threat) into two separate models with the same controls as in Model 1, as suggested by Clarke (2001). In both models, each of these variables remained statistically insignificant. A more interesting story emerges with a breakdown of the years in the analysis into those prior to World War I and those after World War II. While offensive realism receives no support in either case, there is some evidence to suggest that defensive realist considerations may be operating prior to World War I. In Model 3, the change in threat variable is positive and statistically significant, indicating that as the total military spending of other major powers increase year-to-year, a major power is likely to increase its own military expenditures. The effect of this relationship is also sizable, with an increase of one billion United States dollars in the change of military
25The two time periods adopted for this paper (1820–1917 and 1946–2000) are similar to those found in Senese and Vasquez (2005).
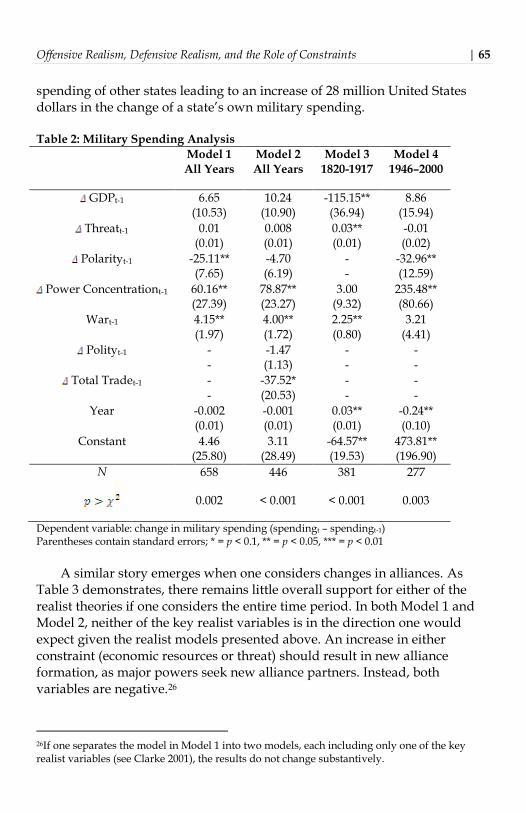
Offensive Realism, Defensive Realism, and the Role of Constraints | 65
spending of other states leading to an increase of 28 million United States dollars in the change of a state’s own military spending. Table 2: Military Spending Analysis
Model 1 Model 2 Model 3 Model 4
All Years All Years 1820-1917 1946–2000
GDPt-1 6.65 (10.53)
10.24 (10.90)
-115.15** (36.94)
8.86 (15.94)
Threatt-1 0.01 (0.01)
0.008 (0.01)
0.03** (0.01)
-0.01 (0.02)
Polarityt-1 -25.11** (7.65)
-4.70 (6.19)
- -
-32.96** (12.59)
Power Concentrationt-1 60.16** (27.39)
78.87** (23.27)
3.00 (9.32)
235.48** (80.66)
Wart-1 4.15** (1.97)
4.00** (1.72)
2.25** (0.80)
3.21 (4.41)
Polityt-1 - -
-1.47 (1.13)
- -
- -
Total Tradet-1 - -
-37.52* (20.53)
- -
- -
Year -0.002 (0.01)
-0.001 (0.01)
0.03** (0.01)
-0.24** (0.10)
Constant 4.46 (25.80)
3.11 (28.49)
-64.57** (19.53)
473.81** (196.90)
N 658 446 381 277
0.002 < 0.001 < 0.001 0.003
Dependent variable: change in military spending (spendingt – spendingt-1) Parentheses contain standard errors; * = p < 0.1, ** = p < 0.05, *** = p < 0.01
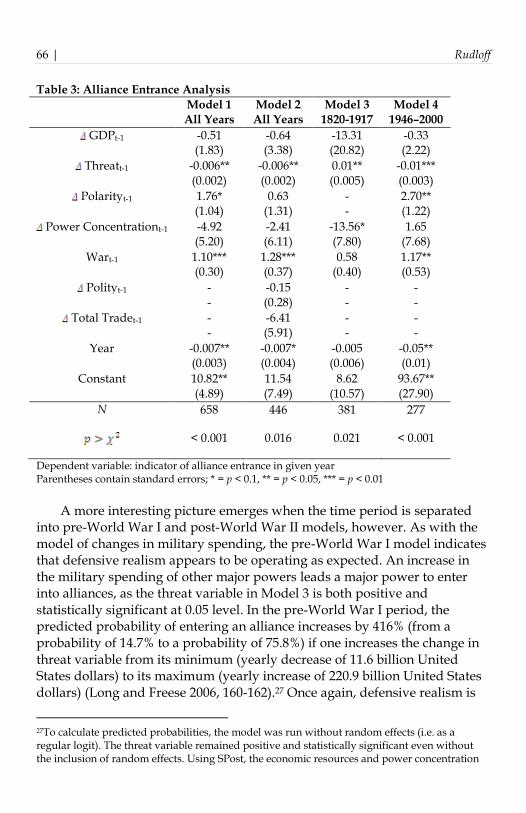
A similar story emerges when one considers changes in alliances. As Table 3 demonstrates, there remains little overall support for either of the realist theories if one considers the entire time period. In both Model 1 and Model 2, neither of the key realist variables is in the direction one would expect given the realist models presented above. An increase in either constraint (economic resources or threat) should result in new alliance formation, as major powers seek new alliance partners. Instead, both variables are negative.26
26If one separates the model in Model 1 into two models, each including only one of the key realist variables (see Clarke 2001), the results do not change substantively.
66 | Rudloff
Table 3: Alliance Entrance Analysis
Model 1 Model 2 Model 3 Model 4
All Years All Years 1820-1917 1946–2000
GDPt-1 -0.51 (1.83)
-0.64 (3.38)
-13.31 (20.82)
-0.33 (2.22)
Threatt-1 -0.006** (0.002)
-0.006** (0.002)
0.01** (0.005)
-0.01*** (0.003)
Polarityt-1 1.76* (1.04)
0.63 (1.31)
- -
2.70** (1.22)
Power Concentrationt-1 -4.92 (5.20)
-2.41 (6.11)
-13.56* (7.80)
1.65 (7.68)
Wart-1 1.10*** (0.30)
1.28*** (0.37)
0.58 (0.40)
1.17** (0.53)
Polityt-1 - -
-0.15 (0.28)
- -
- -
Total Tradet-1 - -
-6.41 (5.91)
- -
- -
Year -0.007** (0.003)
-0.007* (0.004)
-0.005 (0.006)
-0.05** (0.01)
Constant 10.82** (4.89)
11.54 (7.49)
8.62 (10.57)
93.67** (27.90)
N 658 446 381 277
< 0.001 0.016 0.021 < 0.001
Dependent variable: indicator of alliance entrance in given year Parentheses contain standard errors; * = p < 0.1, ** = p < 0.05, *** = p < 0.01
A more interesting picture emerges when the time period is separated into pre-World War I and post-World War II models, however. As with the model of changes in military spending, the pre-World War I model indicates that defensive realism appears to be operating as expected. An increase in the military spending of other major powers leads a major power to enter into alliances, as the threat variable in Model 3 is both positive and statistically significant at 0.05 level. In the pre-World War I period, the predicted probability of entering an alliance increases by 416% (from a probability of 14.7% to a probability of 75.8%) if one increases the change in threat variable from its minimum (yearly decrease of 11.6 billion United States dollars) to its maximum (yearly increase of 220.9 billion United States dollars) (Long and Freese 2006, 160-162).27 Once again, defensive realism is
27To calculate predicted probabilities, the model was run without random effects (i.e. as a regular logit). The threat variable remained positive and statistically significant even without the inclusion of random effects. Using SPost, the economic resources and power concentration
Offensive Realism, Defensive Realism, and the Role of Constraints | 67
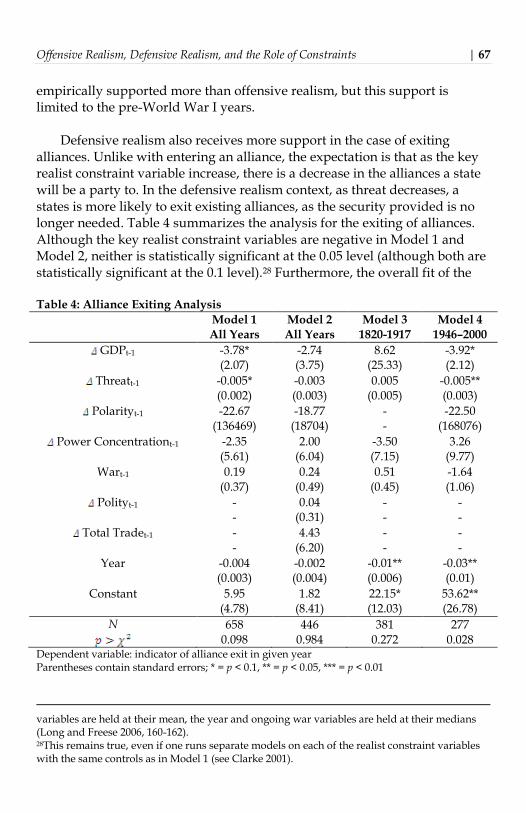
empirically supported more than offensive realism, but this support is limited to the pre-World War I years. Defensive realism also receives more support in the case of exiting alliances. Unlike with entering an alliance, the expectation is that as the key realist constraint variable increase, there is a decrease in the alliances a state will be a party to. In the defensive realism context, as threat decreases, a states is more likely to exit existing alliances, as the security provided is no longer needed. Table 4 summarizes the analysis for the exiting of alliances. Although the key realist constraint variables are negative in Model 1 and Model 2, neither is statistically significant at the 0.05 level (although both are statistically significant at the 0.1 level).28 Furthermore, the overall fit of the Table 4: Alliance Exiting Analysis
Model 1 Model 2 Model 3 Model 4
All Years All Years 1820-1917 1946–2000
GDPt-1 -3.78* (2.07)
-2.74 (3.75)
8.62 (25.33)
-3.92* (2.12)
Threatt-1 -0.005* (0.002)
-0.003 (0.003)
0.005 (0.005)
-0.005** (0.003)
Polarityt-1 -22.67 (136469)
-18.77 (18704)
- -
-22.50 (168076)
Power Concentrationt-1 -2.35 (5.61)
2.00 (6.04)
-3.50 (7.15)
3.26 (9.77)
Wart-1 0.19 (0.37)
0.24 (0.49)
0.51 (0.45)
-1.64 (1.06)
Polityt-1 - -
0.04 (0.31)
- -
- -
Total Tradet-1 - -
4.43 (6.20)
- -
- -
Year -0.004 (0.003)
-0.002 (0.004)
-0.01** (0.006)
-0.03** (0.01)
Constant 5.95 (4.78)
1.82 (8.41)
22.15* (12.03)
53.62** (26.78)
N 658 446 381 277
0.098 0.984 0.272 0.028 Dependent variable: indicator of alliance exit in given year Parentheses contain standard errors; * = p < 0.1, ** = p < 0.05, *** = p < 0.01
variables are held at their mean, the year and ongoing war variables are held at their medians (Long and Freese 2006, 160-162). 28This remains true, even if one runs separate models on each of the realist constraint variables with the same controls as in Model 1 (see Clarke 2001).
68 | Rudloff
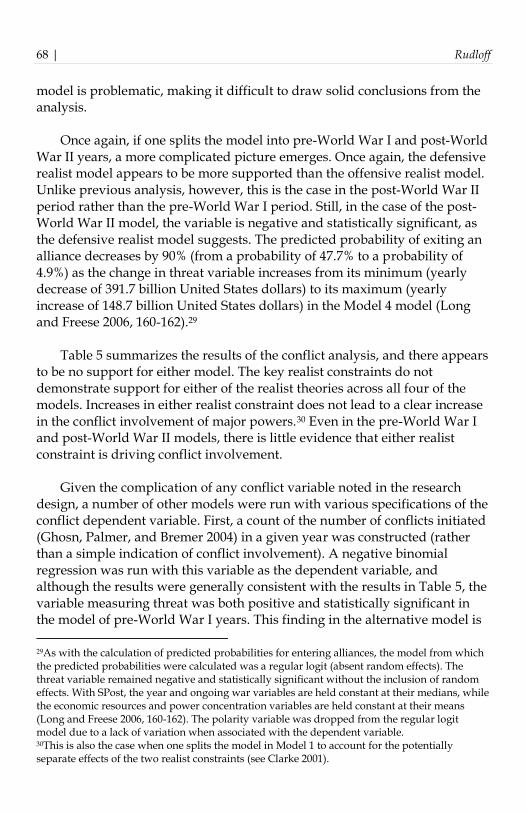
model is problematic, making it difficult to draw solid conclusions from the analysis. Once again, if one splits the model into pre-World War I and post-World War II years, a more complicated picture emerges. Once again, the defensive realist model appears to be more supported than the offensive realist model. Unlike previous analysis, however, this is the case in the post-World War II period rather than the pre-World War I period. Still, in the case of the post-World War II model, the variable is negative and statistically significant, as the defensive realist model suggests. The predicted probability of exiting an alliance decreases by 90% (from a probability of 47.7% to a probability of 4.9%) as the change in threat variable increases from its minimum (yearly decrease of 391.7 billion United States dollars) to its maximum (yearly increase of 148.7 billion United States dollars) in the Model 4 model (Long and Freese 2006, 160-162).29 Table 5 summarizes the results of the conflict analysis, and there appears to be no support for either model. The key realist constraints do not demonstrate support for either of the realist theories across all four of the models. Increases in either realist constraint does not lead to a clear increase in the conflict involvement of major powers.30 Even in the pre-World War I and post-World War II models, there is little evidence that either realist constraint is driving conflict involvement. Given the complication of any conflict variable noted in the research design, a number of other models were run with various specifications of the conflict dependent variable. First, a count of the number of conflicts initiated (Ghosn, Palmer, and Bremer 2004) in a given year was constructed (rather than a simple indication of conflict involvement). A negative binomial regression was run with this variable as the dependent variable, and although the results were generally consistent with the results in Table 5, the variable measuring threat was both positive and statistically significant in the model of pre-World War I years. This finding in the alternative model is
29As with the calculation of predicted probabilities for entering alliances, the model from which the predicted probabilities were calculated was a regular logit (absent random effects). The threat variable remained negative and statistically significant without the inclusion of random effects. With SPost, the year and ongoing war variables are held constant at their medians, while the economic resources and power concentration variables are held constant at their means (Long and Freese 2006, 160-162). The polarity variable was dropped from the regular logit model due to a lack of variation when associated with the dependent variable. 30This is also the case when one splits the model in Model 1 to account for the potentially separate effects of the two realist constraints (see Clarke 2001).
Offensive Realism, Defensive Realism, and the Role of Constraints | 69
consistent with previous models that indicate that defensive realism receives more support when one breaks down the years by time period, and similar to the alliance entrance and military spending model in its indication that defensive realism operates in pre-World War I years. Table 5: Conflict Analysis
Model 1 Model 2 Model 3 Model 4 All Years All Years 1820-1917 1946–2000
GDPt-1 2.17 1.11 -5.51 3.01* (1.62) (2.48) (18.88) (1.81)
Threatt-1 -0.00007 -0.001 0.006 -0.002 (0.002) (0.002) (0.005) (0.002)
Polarityt-1 1.29 1.02 - 2.19 (1.21) (1.27) - (1.34)
Power Concentrationt-1 -2.82 -0.31 -1.64 -12.91 (3.82) (4.37) (4.31) (8.03)
Wart-1 0.22 0.28 -0.29 0.62 (0.26) (0.33) (0.38) (0.44)
Polityt-1 - -0.51 - - - (0.31) - -
Total Tradet-1 - -0.38 - - - (4.03) - -
Year -0.001 -0.004 0.01* -0.01 (0.002) (0.003) (0.01) (0.01)
Constant 2.52 6.81 -17.21* 20.57 (3.96) (6.12) (9.74) (19.86)
N 658 446 381 277
0.685 0.744 0.322 0.132 Dependent variable: indicator of conflict involvement in given year Parentheses contain standard errors; * = p < 0.1, ** = p < 0.05, *** = p < 0.01
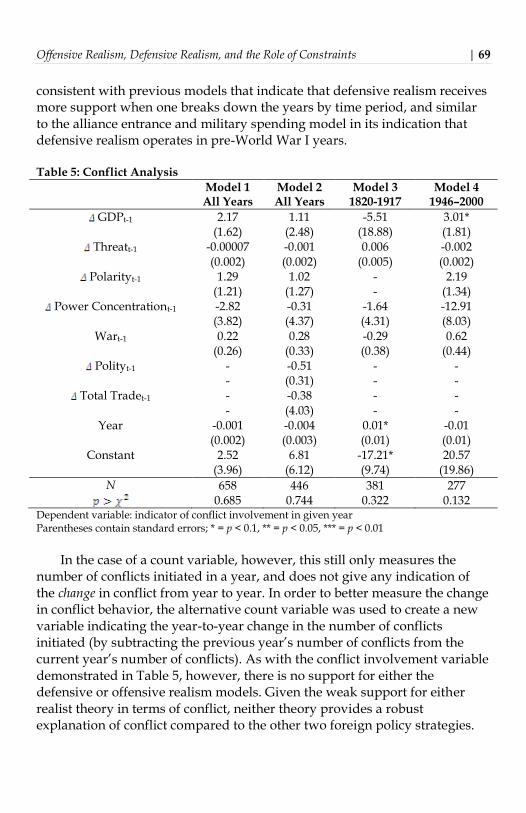
In the case of a count variable, however, this still only measures the number of conflicts initiated in a year, and does not give any indication of the change in conflict from year to year. In order to better measure the change in conflict behavior, the alternative count variable was used to create a new variable indicating the year-to-year change in the number of conflicts initiated (by subtracting the previous year’s number of conflicts from the current year’s number of conflicts). As with the conflict involvement variable demonstrated in Table 5, however, there is no support for either the defensive or offensive realism models. Given the weak support for either realist theory in terms of conflict, neither theory provides a robust explanation of conflict compared to the other two foreign policy strategies.
70 | Rudloff
This may suggest a general weakness in realist theory for explaining conflict strategies (see Mearsheimer 2001, 147-152). What conclusions can be drawn from the analysis? First, there is no evidence that either offensive realism or defensive realism is at work across the entire time period and across all states. The analysis here does not allow us to distinguish between the two realist models. That is, there is no evidence to suggest whether offensive realism or defensive realism is more appropriate than the other across the previous two centuries. Indeed, the analysis indicates that the key constraints that theoretically drive both realist models are ineffective as a general explanation of the foreign policy behavior of major powers. Second, the division of the sample into pre-World War I and post-World War II observations leads to the clear finding that defensive realism operates more consistently within different time periods. The threat variable is associated with military spending and entering into alliances in the way defensive realists would expect, prior to World War I. There is also some limited evidence in terms of the number of conflicts per year, that defensive realism is at work in the pre-World War I period. In the post-World War II period, defensive realism also appears to be a better explanation for the exiting of alliances by major powers. Although these cases of defensive realism’s support are limited to specific time periods, there is far more support in these cases for defensive realism than offensive realism. This demonstrates the utility of utilizing constraints to distinguish between the two realist theories. Third, the inconsistent results between the pre-World War and the post-World War time periods point to an important shift in the decision making of major powers. Specifically, defensive realist considerations seem to be less important in the post-World War II time period. Only in the case of alliance exits is there evidence to suggest that defensive realism is a better explanation after World War II. There is similarity between this finding and that of Senese and Vasquez (2005) regarding conflict, further supporting the assertion of Senese and Vasquez (2005) that one should decompose long time series data sets into different periods of time. The analysis presented here suggests that in the post-World War II period, major powers often behave in the opposite manner than both defensive and offensive realists expect. There are several possible explanations for the decreasing importance of defensive realist decision making in the later time period. The inconsistency
Offensive Realism, Defensive Realism, and the Role of Constraints | 71
in the conflict results across the two time periods may be particularly important (see Senese and Vasquez 2005). There are important economic changes taking place in the international system across both periods, suggesting that major powers may be more likely to behave in ways suggested by liberal theories of decision making (e.g. Gartzke 2007; Oneal and Russett 1997). Likewise, major powers are becoming increasingly (and predominantly) democratic in the nearly two centuries after the Napoleonic Wars, suggesting once again that liberal considerations may be at work (e.g. Oneal and Russett 1997; Russett 1993). Of course, these are merely suggestions at this stage, and without further theoretical and empirical comparisons between these two realist models and liberal alternatives, determining with certainty that liberal theories explain the inconsistencies between realist expectations and the empirical findings across time is impossible. Conclusion This paper attempts to contribute to the ongoing debate between offensive and defensive realists (and other theoretical perspectives) by applying both formal modeling and statistical methods. Through the use of formal models, simple expectations regarding defensive and offensive realist theory are derived, while still incorporating a number of realist strategies within the same theoretical framework (Powell 1999, 213). Empirical tests of these expectations reveal that although both theories receive empirical support, only defensive realism receives some support across all three realist strategies (military spending, alliances, and conflict), and only when specific time periods (i.e. pre-World War I and post-World War II) are considered. Although the period between the Napoleonic Wars and the World Wars demonstrates that defensive realist motivations are at work in major power decision making (although this finding is weakest in terms of conflict), after World War II there is little evidence that either defensive or offensive realism explain these major power strategies (except in the case of defensive realism and the exiting of alliances). This article demonstrate a weakening of realist explanations over time, as well as the utility of applying such formal methods to realist debates. Of course, there are a number of important questions left to be answered, both because of the limited scope, and the results of this study. First, the empirical tests address a major debate in realism, but do not attempt to find empirical evidence comparing either of these realist theories to possible alternative non-realist explanations (e.g. Gartzke 2007; Oneal and
72 | Rudloff
Russett 1997; Russett 1993). Second, the finding that the defensive realist logic offers possible explanations for major power alliance entrance and military spending decisions in the pre-World War I period, but less for the post-World War II period, introduces a number of questions as to why this change occurs. Although answering such a question is outside the goals of this study, such findings indicate not only the importance of comparing empirical results across time periods (Senese and Vasquez 2005), but the further need for theoretical efforts to better explain such changes.
Offensive Realism, Defensive Realism, and the Role of Constraints | 73
References Barbieri, Katherine, Omar M.G. Keshk, and Brian Pollins. 2009. “Trading Data:
Evaluating our Assumptions and Coding Rules,” Conflict Management and Peace Science 26 (5): 471-491.
Barbieri, Katherine and Omar Keshk. 2012. “Correlates of War Project Trade Data Set
Codebook, Version 3.0.” Available at: http://www.correlatesofwar.org. Accessed on: April 15, 2013.
Carr, Edward Hallett. 1964. The Twenty Years’ Crisis: 1919 - 1939. New York: Harper
and Row. Chivers, C. J. 2008. “Russia Warns It May Back Breakaway Republics in Georgia,” The
New York Times, February 16, 2008, section A, page 3. Available through LexisNexis Academic. Accessed on March 10, 2008.
Clarke, Kevin A. 2001. “Testing Nonnested Models of International Relations:
Reevaluating Realism,” American Journal of Political Science 45 (3): 724–744. Cobb, Charles W. and Paul H. Douglas. 1928. “A Theory of Production,” The
American Economic Review 38 (Supplement): 139–165. Correlates of War Project. 2005a. “National Military Capabilities Data
Documentation, Version 3.0.” Available at http://www.correlatesofwar.org. Accessed on March 10, 2008. Accessed on: April 15, 2013.
Correlates of War Project. 2005b. “State System Membership List, v2004.1." Online,
http://correlatesofwar.org. Correlates of War Project. 2010. “National Material Capability Data Documentation,
Version 4.0.” Available at: http://www.correlatesofwar.org. Drury, A. Cooper and Yitan Li. 2006. “U.S. Economic Sanctions Threats Against
China: Failing to Leverage Better Human Rights,” Foreign Policy Analysis 2 (4): 307-324.
Elman, Colin. 2004. “Extending Offensive Realism: The Louisiana Purchase and
America’s Rise to Regional Hegemony,” American Political Science Review 98 (4): 563- 576.
Feng, Huiyun. 2005. “The Operational Code of Mao Zedong: Defensive or Offensive
Realist?” Security Studies 14 (4): 637–662.
74 | Rudloff
Finn, Peter. 2008. “Putin Threatens Ukraine on NATO; Russian Raises Issue of U.S.
Missile Shield,” The Washington Post, February 13, 2008, page A08. Available through LexisNexis Academic. Accessed on March 10, 2008.
Gartzke, Erik. 2007. “The Capitalist Peace,” American Journal of Political Science 51 (1):
166–191. Ghosn, Faten and Glenn Palmer. 2003. “Codebook for the Militarized Interstate
Dispute Data, Version 3.0.” Available at http://cow2.la.psu.edu. Accessed on March 10, 2008.
Ghosn, Faten, Glenn Palmer, and Stuart Bremer. 2004. “The MID3 Data Set, 1993 -
2001: Procedures, Coding Rules, and Description,” Conflict Management and Peace Science 21 (2): 133–154.
Gibler, Douglas M. and Meredith Reid Sarkees. 2004. “Measuring Alliances: The
Correlates of War Formal Interstate Alliance Dataset, 1816–2000,” Journal of Peace Research 41 (2): 211–222.
Gleditsch, Kristian D. 2002. “Expanded Trade and GDP Data,” Journal of Conflict
Resolution 46 (5): 712–724. Greene, William H. 2004. Econometric Analysis. Fifth edition. Upper Saddle River, NJ:
Prentice Hall. Heo, Uk and Robert J. Eger. 2005. “Paying for Security: The Security-Prosperity
Dilemma in the United States,” Journal of Conflict Resolution 49 (5): 792–817. Kagan, Donald. 1995. On the Origins of War and the Preservation of Peace. New York:
Anchor Books. James, Patrick. 1995. “Structural Realism and the Causes of War,” Mershon
International Studies Review 39 (2): 181–208. Kreps, David M. 1990. A Course in Microeconomic Theory. Princeton, NJ: Princeton
University Press. Labs, Eric J. 1997. “Beyond Victory: Offensive Realism and The Expansion of War
Aims,” Security Studies 6 (4): 1–49. Lee, Gerald Geunwook. 2002/2003. “To Be Long or Not To Be Long - That is the
Question: The Contradiction of Time-Horizon in Offensive Realism,” Security Studies 12 (2): 196–217.
Offensive Realism, Defensive Realism, and the Role of Constraints | 75
Lemke, Douglas. 2004. “Great Powers in the Post-Cold War World: A Power
Transition Perspective,” in Balance of Power: Theory and Practice in the 21st Century, edited by T. V. Paul, James J. Wirtz, and Michel Fortmann. Stanford, CA: Stanford University Press, 52–75.
Lobell, Steven E. 2002/2003. “War is Politics: Offensive Realism, Domestic Politics,
and Security Strategies,” Security Studies 12 (2): 165–195. Long, J. Scott and Jeremy Freese. 2006. Regression Models for Categorical Dependent
Variables Using Stata. Second edition. College Station, TX: Stata Press. Lynn-Jones, Sean M. 1998. “Realism and America’s Rise: A Review Essay,”
International Security 23 (2): 157–182. Maddison, Angus. 1995. Monitoring the World Economy 1820–1992. Paris: OECD. Maddison, Angus. 2001. The World Economy: A Millennial Perspective. Paris: OECD
Development Center. Maddison, Angus. 2003. The World Economy: Historical Statistics. Paris: OECD
Development Center. Maddison, Angus. 2009. “Statistics on World Population, GDP and Per Capita GDP,
1–2006 AD.” Available at: http://www.ggdc.net/maddison/. Accessed on: October 25, 2009.
Marshall, Monty G., Keith Jaggers, and Ted Robert Gurr. 2011. “Polity IV Project:
Political Regime Characteristics and Transitions, 1800-2010, Data Users Manual.” Available at: http://www.systemicpeace.org/inscr/p4manualv2010.pdf. Accessed on: April 15, 2013.
Maslow, A. H. 1943. “A Theory of Human Motivation,” Psychological Review 50 (4):
370–396. McGinnis, Michael D. 1994. “Rational Choice and Foreign Policy Change: The Arms
and Alignments or Regional Powers,” in Foreign Policy Restructuring: How Governments Respond to Global Change, edited by Jerel A. Rosati, Joe D. Hagan, and Martin W. Sampson III. Columbia, SC: University of South Carolina Press, 65- 87.
Mearsheimer, John J. 1994. “The False Promise of International Institutions,”
International Security 19 (3): 5–49. Mearsheimer, John J. 2001. The Tragedy of Great Power Politics. New York: W. W.
Norton.
76 | Rudloff
Morgan, T. Clifton and Glenn Palmer. 2000. “A Model of Foreign Policy
Substitutability: Selecting the Right Tools for the Job(s),” Journal of Conflict Resolution 44 (1): 11–32.
Montgomery, Evan Braden. 2006. “Breaking Out of the Security Dilemma: Realism,
Reassurance, and the Problems of Uncertainty,” International Security 31 (2): 151-185.
Morgenthau, Hans J. 1978. Politics Among Nations: The Struggle for Power and Peace.
Fifth edition. New York: Knopf. Most, Benjamin A. and Harvey Starr. 1989. Inquiry, Logic and International Politics.
Columbia, SC: University of South Carolina. Officer, Lawrence H. “Dollar-Pound Exchange Rate From 1791.”
MeasuringWorth.com, 2008. Data accessed on March 8, 2008. Oneal, John R. and Bruce M. Russett. 1997. “The Classical Liberals Were Right:
Democracy, Interdependence, and Conflict, 1950–1985,” International Studies Quarterly 41 (2): 267–293.
Palmer, Glenn and T. Clifton Morgan. 2006. A Theory of Foreign Policy. Princeton, NJ:
Princeton University Press. Palmer, Glenn and T. Clifton Morgan. 2007. “Power Transition, the Two-Good
Theory, and Neorealism: A Comparison with Comments on Recent U.S. Foreign Policy,” International Interactions 33 (3): 329–346.
Powell, Robert. 1999. In the Shadow of Power: States and Strategies in International
Politics. Princeton, NJ: Princeton University Press. Rose, Gideon. 1998. “Neoclassical Realism and Theories of Foreign Policy,” World
Politics 51 (1): 144–172. Rudloff, Peter. 2007. Substituting Security: Economic Resources, Strategies Resources, and
the Security Policy Choices of Minor Powers. Dissertation, University of Illinois at Urbana-Champaign.
Russett, Bruce. 1993. Grasping the Democratic Peace: Principles for a Post-Cold War World.
Princeton, NJ: Princeton University Press. Sahr, Robert. 2009. “Conversion Factors in 2000 Dollars for 1800 to estimated 2016.”
Available at http://oregonstate.edu/cla/polisci/faculty-research/sahr/sahr.htm. Accessed on October 25, 2009.
Offensive Realism, Defensive Realism, and the Role of Constraints | 77
Sarkees, Meredith Reid and Frank Whelon Wayman. 2010. Resort to War: A Data Guide
to Inter-state, Extra-state, Intra-state, and Non-state Wars, 1816-2006. Washington, DC: CQ Press.
Senese, Paul D. and John A. Vasquez. 2005. “Assessing the Steps to War,” British
Journal of Political Science 35 (4): 607–633. Simon, Carl P. and Lawrence Blume. 1994. Mathematics for Economists. New York: W.
W. Norton. Singer, J. David, Stuart Bremer, and John Stuckey. 1972. “Capability Distribution,
Uncertainty, and Major Power War, 1820-1965,” in Peace, War, and Numbers. Edited by Bruce Russett. Beverly Hills: Sage, 19–48.
Snyder, Glenn H. 2002. “Mearsheimer’s World - Offensive Realism and the Struggle
for Security: A Review Essay,” International Security 27 (1): 149–173. Snyder, Jack. 1991. Myths of Empire: Domestic Politics and International Ambition. Ithaca,
NY: Cornell University Press. Sydsaeter, Knut, Arne Strom, and Peter Berck. 2000. Economist’s Mathematical Manual.
Third edition. Berlin: Springer. Tang, Shiping and Evan Braden Montgomery. 2007. “Uncertainty and Reassurance in
International Politics,” International Security 32 (1): 193-200. Tuchman, Barbara W. 1962. The Guns of August. New York: Macmillan. Valeriano, Brandon. 2009. “The Tragedy of Offensive Realism: Testing Aggressive
Power Politics Models,” International Interactions 35 (2): 179–206. Waltz, Kenneth N. 1979. Theory of International Politics. New York: McGraw Hill.