Embed Size (px)
Citation preview

N O T I C E
THIS DOCUMENT HAS BEEN REPRODUCED FROM MICROFICHE. ALTHOUGH IT IS RECOGNIZED THAT
CERTAIN PORTIONS ARE ILLEGIBLE, IT IS BEING RELEASED IN THE INTEREST OF MAKING AVAILABLE AS MUCH
INFORMATION AS POSSIBLE
https://ntrs.nasa.gov/search.jsp?R=19820006434 2018-06-19T21:56:37+00:00Z

tfi
NATIONAL AERONAUTICS AND SPACE ADMINISTRATIO.WASHINGTON. DC 20546 JULY 198
l X 411
NASA TECHNICAL 14EMORANDUM NASA TM-70607
DEPOSITION OF THIN INSULATION LAYERSFROM THE GAS PHASE
Reinhard Bet:n, Horst Hagedorn, Johann Kammermaier ,Manfred Kobale,Horst Packonik, Dietrich Ristow, uerhard Seebacher
(NASA-TH-76607) DEPOSITION Of THIN N82-14307INSULATION LAYERS FROM THE GAS PHASE(National Aeronautics and SpaceAdaiaiztrat on) 86 p HC A05/M,F A01 C;SCL 07D unclas
G3/25 06249
Translation of "Absheidung dunner Isolationsschichten aus derGasphase", Siemens AG, l,' 'ch, Unternehmensbereich Bauel.ementeHauptbereich Grundlagenentwickl.ung, and Aandeaministerium fuerForschjung and Techno;ogie, Munich, West Gert ►; mny, Report BMFT-FB-T-76,-66,May 1976, pp 1-88
yEG
4 .
s
to Rs>M1 Nw i ONeonnew ANesNM IIw A loovie s cluk 01w...NASA TM-76607
4. T111 lrAMNr . I DEPOSITION OF. THIN t. flow# 000 JULY 1981INSULATION LAYERS VROM THE GAS PHASE ^, r«1r^ a,.M..N« c./r '
ra', r^+«Id Reinhard Behn,k Horst ttagedorn, L p«h"W"s00"W..M,. Room ft.
Jchann Kammermaier, Manfred Kobale,1t. Y*ALWOMs.Borst packonik, Dietrich Ristow, Gerhard
SeebacherI I. C«1"NI « QIMI N&
9. Po4otmoee OtsonloNim Have Md Ad*@@* NASw 4199SCITMNBox 5436
A 1W *1 Ran aW ►«I+►d Co.«ed
4110a Tranalatlos
i?. f ► so.in^ Al!earf Memo wed ANre$•wAtion& Aatoneutice and Space AdulpSOtratlonWaanington. D.C. 90546 14. /MM«1s@ Amp Coh
If. 5vM'M40H«rM.N9 Translation of "Abshe dung dunner Isolation_sschlchten a:us der Gasphase", Siemens AG, Munich, Unterneh-mensboreich Bauelemente Hauptbere:ich Grundlagenentwicklung,and Aundesministerium flier Forschung and Technologie, Munich,West; Germany, Repopt BMFT-FB-T-76-66, May 1976, pp 1-88
(original German: N77-29418)
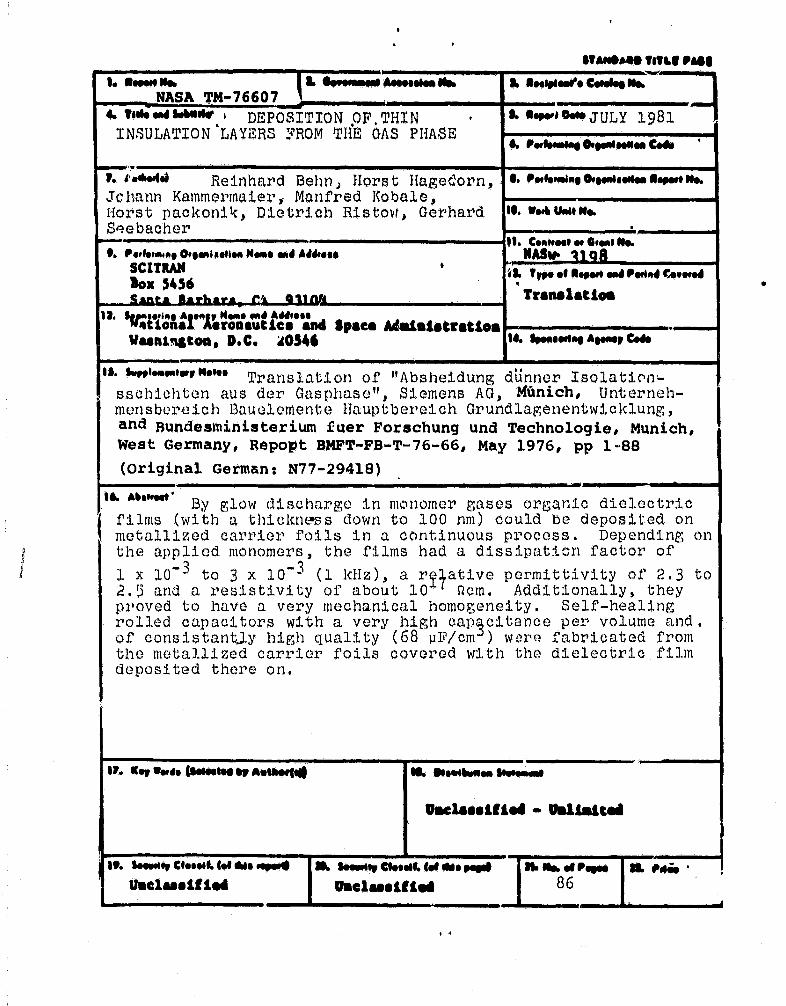
18. Abo"od. By glow di5chargo in monomer gases organic dielectricfilms (with a thickness down to 100 nm) could be deposited onmetallized carrier foils in a continuous process. Depending onthe applied monomers, the Films had a dissipation factor of
1 x 10⁻³ to 3 x 10_3 (1 kHz), a rTlative permittivity of 2.3 to
2.5 and a resistivity of about 10 Rom. Additionally, theyproved to have a very mechanical homogeneity. Self-healingrolled capacitors with a very high capacitance per volume and.of cunsistant-ly high quality (68 uF/cm ) ware .fabricated fromthe metallized carrier foils covered with the dielectric filmdeposited there on.
17. KM a«b (ftWftd by AN M f o$ M. Poself a s $ostmo N
OmeLasi[i^ - fi^ll^itari
19. 1»sodti Cless4 L ls1 *As wMrd 3L iAwMti CNoMf. /s• Mb peed s1. ob. of peon a 0,$4 .Uaslaseltied Unclassified 86
.

Federal iv inistry for Research and Technology
Research Report T 76-66Technological Research and Development
- Alec troni,c s
Deposition of Thin Insulation Layers
from the Gas Phase
Siemens AG, Munich
Unternehmungsbere ch Bauelemente
Hauptbereich Grundlagenentwcklung
Munich, May 1976
Preparerst
Reinhard Behn
Horst Hagedorn
Dr. Johann Kammermaier
Dr. Manfred Kobale
Horst Packonik
Dr. Dietrich Ristow
Dr. Gerhard Seebacher
et al.
Department leader:
Dr. Hermann Heywang
Project directions
Reinhard Behn

RTable of Contents English Z*
German page
1 Introduction 8 3
2 Construction of the deposition avvaratus 11 6
2.1 Introduction 11 6
2.2 Results of the preliminary tests 12 7
2.3 Co struction of the new apparatus 13
2.3.1 Roller-guidance system and electrode 13 8
arrangement
2.3.2 Measures for stabilizing the glow discharge 15 92.3.3 Drive system 16 11
2.3.4 Direct gas supply 17 12
30 Investigations of the dielectric resistance, 18 13
the dielectric properties, and the self-
healing
3.1 Introduction 18 13
3.2 Investigation of the dielectric resistance 19 14
3.2.1 Conduct of the experiment 19 14
3.2.2 Measurement of current density, results, and 21 16
their discussion
3.3 Dielectric properties 24 19
3.3.1 Dielectric coefficient and losses 24 193.3.2 Dielectric strength 26 21
3.4 Investigation of self-healing 28 23
3.4.1 Test set-up 28 233.4.2 Test results 29 25
4. Tests for increasing the deposition speed 32 27and improvement of the coat properties_
4.1 Introduction 32 274.2 Selection of the monomer gases 33 28
* Numbers in margin indicate pagination of original foreign text
1

4.3 Monomer mixtures 38 334.4 Kinet,i.c processes during glow discharge 4o 35
5 Infrared-spectroscopic and mass spectrometric 45 40investigations
,5•1.y,
Introduction 45 405.2 Experimental with respect to the IR- 46 ul
investigations5.3 Results of the IR-investigations 46 425.4 Mass-spectrometric investigations 49 X4
6. Adhesive strength investigations 50 456.1 Introduction 50 456.2 Adhesion problems between carrier foil and 51 46
metal coating6.2.1 Relation between surface tension and adhesion 51 466.2.2 Methods for improving the adhesion properties 52 48
of thin metal layers on plastic foils 526.3 Adhesion problems of the polymer layer 54 50
on the metal-like carrier6.3.1 Increasing the adhesive power by means of 54 50
dipole structures in the monomer gas6.3.2 Generation and prevention of separating layers 55 51
between metal coating and glow polymeride
70 Production of capacitor Prototypes 57 52 L27.1 Introduction 57 527.2 Production of wound capacitors 57 537 . 3 Capacitor properties 59 557.4 Endurance tests with capacitors 62 58
References s appendix 1 66 61
Publicati.onss Appendix 1 67 62
Figuress Appendix 2 68 63
2

1 INTRODUCTION
The "Deposition of thin insulation layers from the gas-
phase" is the promoted part of a larger endeavor which has as its
goal the development of capacitors with plastic dielectric for
high energy density. Capacitors with plastic foils such as
polystyrole, polyethyleneterephthalate, tradename "Hostaphan"
(Hoechst) or "Mylar" (Du Pont) and polyearbonate, tradename
"Makrofol" (Bayer) receive a great technological and economic
significance because of their high dielectric str ,.^ngth, their low
water take-up and the potential to produce thin foil thicknesses.
Because of these properties the dimensions of plastic capacitors
could constantly be reduced and the energy densities could be
increased considerably. However, limitations, till now insurmountable,
were set for the possibilities for applying ever thinner foils by
the increasing difficulties during the processing, e.g., during
winding and metallizing. Thus the producers of foil, after initialrapid progress, which led to a thickness of 2 µm, were unable in
the last few years to achieve additional success with respect tothinner foils.
Even before 1960 Siemens developed a method by which the
dielectric layers could oe produced from a fabrication-technological
standpoint 4!,)wn to 1.2 4m and which led to the well-known MKL
capacitor. Here the dielectric medium is applied to the carrier
foil in the form of a lacquer, is metallized, and subsequently again
removed from the capacitor from the carrier foil during the winding
of the capacitor.
With the goal to find newer ways for producing even thinner
dielectric layers with high dielectric strength for capacitors with
high energy densities, we first investigated various methods from an
orientation standpoints the production of thinner layers by glow Poly-
merization from the gas phase, the deposition of pyrolytically
produced gases and finally layers from radiation polymerized material.
3 1
x

From this initial work it became apparent that the glow polymeriza-
tion method from the gas phase for production of very thin dielectric
layers showed the greatest promise for success. These developmentswere then continued forcibly with the support of the BMFT. With
this method it now became possible to produce thicknesses down to
0.1 µm in large surfaces and to produce, despite the low thicknesses,
very uniform, high-performance layers from an electric standpoint.
It was possible to base the development on extensive pre-
liminary investigations which the receiver of the grant had already
done as a preliminary performance. The starting point of this work
was the status as of that time of the technologye basic investiga-tions concerning the polymerizing capabilities of organic substancesby means of glow discharges had already been made in 1931 by
Linder and Davis /l/. Haefer and Mohamed /2/ and Carchano 131determined in detail the characteristics of the glow discharges
and the behavior of ion and electrons in a'D.C, field. According
to them the affected cross-section of the cations for polymerization
processes is greater than that of the electrons by an order of
magnitude. Bradley and Hammes /4/ investigated the temperature
dependence resistance of the layers produced by means of glow
discharges in an HF-alternating field and determined the yield
(g/kWh). Stuart 151 presented a simple apparatus for flow-throughcoating of aluminum foil. Connell and Gregor 161 utilized alongitudinal magnetic field for generating an electrode-freeglow discharge in order to obtain layers as pure as possible
without imbrittlement, arch as can happen during direct ?on
bombardment. A great number of investigations were concerned with
the property of certain polymerides /7-11/. Mostly two plate-
shaped elen erodes were used which are contained in an evacuated
receiver, which is being flooded through with the gas to be
polymerized up to a definite pressure. Here the plates serve also
as carriers for the polymer layer. At times the work done in the
references cited was performed in a stationary system, i.e.,
after filling the receiver with the appropriate starting monomers
4

to a working pressure without additional gas supply and withoutpumping, partly with a dynamic equilibrium where fresh gas wasconstantly supplied and where gas enriched with products ofcracking was pumped away,
r
In view of the state of the technology it was necessary todevelop an apparatus which allows a very uniform and very thindeposition of a metal-like carrier foil in a flowing system. ,Ametallized carrier foil became necessary, because the prerequisite
for applying these thin glow po.:wmer layers as dieleatrIcs in
capacitors are a self-healing capacitor construction. In additionit was necessary to develop new dielectric materials with improved
properties whose chemical composition also satisfies the require-
ments for self healing in capacitors.
The following sequence was provided for planning the work
first it was intended , building on the experiences with a simple
already available apparatus , to build a new installation in order
to assure a disturbance-free coating process in order to improve the
quality of the coating. Simultaneously it was needed to conduct an
investigation of the layers produced wit). respect to insulation
behavior and further dielectric properties. With a view to a later
economic application of this process we aimed at an increase in the
deposition speed of the layer. The chemical structure of the layers
obtained had to be determined whereby infrared spectroscopic
investigations had to be conducted. The investigation of theadhesive property of the layers on one another (carrier foil,
metal vapor depositc:°+ and glow polymerization deposition) was
a:Lso an important work item. Finally it was intended to producecapacitors from the thin dielectric layers and to investigate
their properties in snort- and long time tests.
z I

It was possible to conduct the work cequence in accordancewith a plan stipulated in the contract with one small authorizedchange which also included the investigation of the self-healing
properties of these thin layers.
During the conduct of the FE-project the receiver of the
grant was not aware of any additional progress made in this area
and other places.
2, Construction of the coating apparatus
2.1 Litroduction
With the help of a glow discharge it was possible to
polymerize organic gases and vapors /12/. Here the molecules in
the discharge path were broken up into radicals and ionized by thebreakup of covalence bonds and/or by separation of gaseous components
(H-atom, methyl groups and similar). In the boundary regions of
the discharge region the radicals recombined to larger complexes
by mutual saturation of their valences. This process proceeds
preferably at the electrodes of the discharge path, the precipitated
particles combine to macromolecules and form adhesive layers. By
means of glow discharge it is also possible to excite, for the
formation of macromolecules, materials which cannot be polymerized
by conventional chemical methods. Not only is it possible to
separate active groups, such as substitutable H-Atoms,methyl groups and multiple bondings, but also more stable bondings
such as H-atoms from benzene rings. The elementary processes in
the glow discharge and during polymerization are not yet known.
Only a certain pressure range of glow discharge is saitable
for polymerization. The arc discharges occurring at atmosphericpressure cannot be used for coat formation because of the exra
ordinarily high current densities. Only for pressures in the range
wk

of about 1 mbar does the current density become so small than' itdoes not affect electrodes- and carrier material and the properties
of the coating. Investigations with a simple test apparatustsuch as is being used in the work referred to at the beginning,
now demonstrated the exact conditions under which the formation
of tho coating is possible. The results will be described in thofollowing.
2.2 Results of the oroliminary tests
The partial pressure p of the reaction gases must be in the
range of 1...6 mbar. For higher pressure the discharge became
non.-uniforr4 the resulting polymerization layer exhibited variationsin thickness and murky appearance and its dielectric losses
increased. For pressures that were too low the dielectric losses
also increased since a certain partial pressure of impurities -
especial.ly oxygen which as a reactive element takes part in the
polymerization process - could not be avoided in the reacting
chamber so that, as the partial pressure of the monomers was
reduced, the relative portion of the impurities increased.
This led to an increased introduction of impurities into the
polymer layer. With a knowledge of the optimal pressure we obtained,
according to Paschen's Law for the arc voltage U = f (p o d) alsothe optimal electrode distance of d a 12 mn. The optimum currentdensity was found to be 0.2... 5 mA per cm" electrode surface.
For a current density that was too low the discharge burned non-
uniformly, i.e., it extended only to a part of the electrode surface.
For too great a current density the temperature gradient between
layer surface and electrode became too great so that, because
of stresses, the layer exhibited cracks and/or lifted from the
substrate. Therefore, the temperature measured at the electrode
back side must not exceed 1500C.
Z11 l
nf
^Li-

2. 3 Oonstructor: of the new appar"
2.3.1 R21ler-g_uidance s_3gUm and a1 W p„ ,arWXemeneat
In accordance with the knowledge gained a new apparatus
was constructed which permits coating in a flowing system. It
is described in the following.
The new apparatus is placed in a 50 liter vacuum chamber
(figure 1)l, It consists of a moving roller system and three
Electrode pairs in parallel facing each other. A carrier foil
(carrier for the polymerization layer) coming from a supply roll is
pulled across the two-dimensional surface in such a way that it
just touches it. Subsequently, it is again wound onto another roll.
The excitation frequency of the glow discharge was increased by means
of a power sender (min. m m power 200 W) to 100 kHz...l MHz so thatthe displacement current through the carrier foil is sufficient
to maintain the ,glow discharge. Since for one electrode pair on
each of the surfaces facing each other polymerization layers are
deposited, one carrier foil is simultaneously pulled through for
each surface so that two supply rollers and two takeup rollers are
installed. The width of the carrier foil is the same as the width
of the electrode surface so that the electrodes are protected from
the discharge zone. In this way the electrodes remain clean
and even longer test foils can be coded in one run. Since the
dimensions of a flat electrode pair are limited by the danger of
wrinkle formations in the carrier foil, we resorted to several
parallel,.-connected electrode pairs whereby a foil between the
electrode pairs was smoothened by means of reverse direction rollers.
This also has 'the advantage that the carrier foil, during the coating
process, can cool off on the reverse direction rollers outside of the
.glow discharge volume. The area of the electrodes is .50 x 100 mm
each. So that no electrical discharges can occur at the electrode
edges which could damage the carrier foil, the edges are coated with
8

i
! an insulating strip made of teflon. To reduce the thermal loadingof the carder foil the electrodes are water cooked. We were able
to dispense with the originally used oil cooling with heat exchanger
because water, at the prQsently used high excitation frequencies,
has a sufficient insulation resistance with respect to the electrodes.
The installation is layed out for foil width up to 150 mni
and should wind carrier foil thicknesses down to 2 ..3 gm w,. w.:. utany problems. It turned out that disturbing electrical iieldeffects arose at the mounting place for the roller system and thateven discharges originated from the electrodes which forced us tomake the carrier plates out of plastic. For reasons of mechanicalstability and accuracy.bo ¢rings had to be installed on both sidesof the rollers when using the plastic structure. After testing of
several plastics epoxy resin p.,,oved to be the best. The electrodepairs are also mounted on these plastic plates. The distancebetween the electrode pairs between which the glow discharge takesplace can be changed rather simply. The electrode supports are
constructed in such a way that, by means of ad-listing screws,
the position and tilt of the electrodes can be adjusted exactlyparallel to the path of the foil. Thus it is possible t despite therelatively large electrode surfaces, to move the carrier foil
without displacement and without the formation of wrinkles.
2.3.2 Measures for stabilizing the glow, discharge
Tests showed that i,ow and then discharges occurred through the
foil exposed to the glow up to the electrode. Therefore, the discharge
surfaces of the electrodes facing each other are covered with an
insulation layer of several micron thickness, which serves for
stabilizing the discharge. This insulation layer prevents curentconcentration resulting from discharge. The electrical substitute
circuit diagram, shown in figure 2 ,/13/, corresponds to the given
buildup between the electrodes.
9

We have i W » Rs and Ra >> I ( w . Angul er requenoy
Cg = capacitance of glow volume, R x resistance of glow volume
C s a capacitance of insulating layer, R s w resistance of insulating
layer)
To a good approximation the resistance of the entire arrangement
thus is
CRg
For the glow discharge a voltage Ueff between 200 to 400 Y
was required if the gases described below were used and if an
experimentally determined current density flowed which was optimal
with respect U polymerization speed and thermal stresses of the
carrier material. From this we obtained, according to the schematic
arrangement in figure 2, a resistance in the glow discharge volume of
100,000 to 200p000 ohms, referenced to an electrode area of l cm2.
Then in the insulating layer on the electrodes the voltage decreased
y d 'z 00b Us. if
^ W a C•L 0
(d = thickness of the insulation layer, I = current density,
c = dielectric constant of the insulating material)
For sufficiently high frequency of the discharge currentthe voltage drop Us was less than 1 V
The formula (1b) also applies for the voltage drop at the
cartAer foils located in the glow region.
In addition to 'these measures the metal coat of the Alas-
tic:foile to be coated was set via an electrically cronducting
reversing roller at the potential of'.the associated electrodes
10

For disturbance-free glow the required energy is transported toan overwhelming degree by the displacement current through theinsulation layers into the glow zone.
2.3.3 Drive system
A 400 W D.C. motor, located outside of the reaction chamber
and controlled by a thyristor switch, provided the drive of which
high requirements were made with respect to oynchroniam. The torque
is transmitted to the wind-up rollers via a chain drive, a rotaryfeed-through for the vacuum system, and a system of gears.
For thermally sensitive carrier foils it was not possible to
apply arbitrarily -thick glow polymerization layers in one work step
since the heat loads resulting from the heat of reaction and from
the current flow would have led to partial destruction of the carrier
foil. Therefore, thick layers were produced in several work runs.
Tests were also conducted to coat various dielectrics at very small
thicknesses (10 ... 100 nm) directly on top of one another in order
to achieve certain defined properties of the dielectric layers which
cannot be achieved with a one-material system.
To avoid intermediate aeration with corresponding adsorption
of air and water, it was necessary to find a way by which the c arTier
foils could be rewound in the reaction vessel. Because of the
changes in diameter between the supply- and wind-up rollers no
common rigid drive could be used for both rollers. It had to bepossible to decouple the roller to be unwound. A solution for the
drive principle was found through magnetic couplings so that it
was now possible to wind and unwind the carrier foils at random
without opening the reaction vessel.
For coating thicknesses of 50 to 150 nm running speeds of
the order of 1 m/Min are required. With this apparatus running
speeds of 0.1 m/min to 10 m/min are possible.
11

2.3.4 Direct, „Rae supjLJZ
For electrode surfaces of dimensions 150 mm x 100 mm in-homogeneities arose in the glow discharge volume, recognizable bynon-uniform ;glows of the discharge, which became noticeable byuneven thicknesses and by an insufficient quality of the polymer
layer. As tests showed, this phenomenon can be attributed to alack of fresh-gas supply and too high a concentration of cracked
products in the likterior region of the discharge volume.
For that reason an attempt was made to pass the fresh gas
directly into the discharge volume. Ae a first step we used a
carrier foil which we led over the associated electrode plate.
The opposite electrode consisted, at the side facing the discharge
region, of porous sintered bronze with pores of 100 µm diameterthrough which the fresh gas flowed into the discharge volume.The pores could not be closed by polymer deposits resulting fromthe flowing gas (figure 3).
In a subsequent step it became possible to i?tiize bothelectrode pairs, i.e., to coat 2 foils at the tame time. Here
insulating cover strips were used for gas supply which limit thedischarge volume during entry resp. leaving of the foil from the
glow zone and which cover the reversing roller system. The stripswere hollow and were provided with a row of holes (1 mm diameter)
18
leading to the discharge volume. In this way the fresh gas could
be passed directly into the discharge volume. The coatings produced
with this gas supply* system are unobjectionable under full utili-zation of the capacity of the installation.
For the continuous supply of the installation with monomer
gas, a flow-control valve was installed betweer;the supply container
and the reaction vessel. Simultaneously with gas admission of gas
the vessel was pumped down to a limited extent since, during the
12

glow process, cracked products (hydrogen, methyl groups, and
simiaar) were produced which could have a damaging effect on thequality of the layer if present in boo high a concentration:
With the aid of the flow-control valve the partial pressure of the
monomer had to be kept constant to ± 10% of the monomer-dependent
rated va^,ue (between 100 and 700 M/m2 ) in order to achieve auniform polymerization, speed.
With all these measures it became possible to produce coat
thicknesses down to 0.1 µm with great uniformity of thickness
(± 2.5%) and with homogeneous quality.
3. The investigation of the insulation resistance, the dielectric
proyeerties . and of self-healing
3.1 Introduction
For application as capacitor dielectrics the insulating
action, the dielectric properties, and the self-healing of these
thin layers is of decisive significance. For coat thicknesses of
about 0.1 µm very high field strengths are obtained in the diel-
ectric (200 Vbm) even for low capacitor voltages (e.g., 20 V).
The investigation of the layers thus not only penetrates new areas
from the standpoint of new materials, but also the operating field
strengths attain valuas which are not yet being used in general
in dielectrics known today.
As is known from investigations with plastic foils /14/,the insulation current increases, in the region of higher field
strengths, to an increasing degree with increases in voltage. The
magnitude of the insulation currents and its dependence on tempera-
ture, time, and field strength therefore affects the type andthickness of the dielectric for a given applied voltage.
13

r
Even a knowledge of the dielectric properties of the ;layers,such as dielectric constant and loss factor, is very important Inits application in capacitors.
Self-healing has not yet boon investigated for layers ofthis thickness. Since these low laver thicknesses cannot beproduced without voids (e.g., pores), we must assume that self-
healing takes place so that the capacitors attain high dielectric
strength and high insulation. For self-healing a certain energyis required for vaporizing the electrode metal at the arcing
location. In general only the energy stored in the capacitor isavailable for that. For the presently used thin layers with them:relatively low are voltages, this questioli is worthy of furtherinvestigation.
3.2 Investigation of the insulation resistance
3.2.1 Experimental conduct
In figure 4 the principal construction is shown for thosecapacitor models with which the investigation of the dielectric
properties of the glow polymer layers was conducted. A metal
coating - primarily aluminum - was applied to relatively thick
plastic foils, especially polyethylene terephthalate, by a vapor
deposition process ir, high vacuum. Upon this metallized carrier
foil we Find the glow polymei layer and upon it the vapor-deposited
counter-electrode. It proved to be advantageous for most of the
investigations to use small-area model capacitors with capacitance-
effective areas in the range 0.5 cm2 to 1 cm 2 . For higher capacitycondensers longer strips of the above.-mentioned construction with
capacitance-active areas bemeen 100 and 1000 cm were wound and
contacted. In addition to aluminum, other metals were occasionally
used, such as copper, zinc, or mercury, as electrode metals for at 20least one of the two electrodes.
14

During the :measurement the samples were placed in a vacuum
oven which, at the same time, produced shielding and in which the
samples were tested with the assurance of good drying at a pressure
of 2 mbar and at temperatures in the rango of 20 0 C ... 1200 C.
For comparison measurements were also made with undried samples.
To determine the at times rather- small currents, an oscillating
condenser electrometer ma4e by the Kethley Instruments Co. of type
640 A proved to be especially suitable. The instrument makes
possible current measurements down to 10p•17 A for practically nozero drift (input resistance optional to above 1016 ohms. inputcapacitance < 2pF).
For measurement of the current-voltage characteristic linesof the insulation layers high demands are made of the D.C. supply.
For the measurements an instrument # stabilized electronically to10-4 for ± 10% network voltage fluctuationso was employed.
For application of polymerized coatings in high-performancedielectric capacitor;^. starting monomers with the gross formula(CH2 ) n and (CF2 ) n produced at a minimum vapor pressure of 3 , 103 N/m2
turned out to be particularly suitable.
For investigating the -.insulation properties we selected fromthe two groups of materials, cyclohexane with the gross formula
CON and perfluorocyclobutane (gross formula CV8 ) as characteristicmaterials.
Most of the samples produced first were subject to short-circuits which, howevero could be eliminated by directed voltage
loads (called unlocking).
i 15

3.2.2 Measurement current density, results, and their discussion
The current density was determined with capacitor models'eith a glow polymer dielectric made of cyclohexane (figure 5)respectively perfluorocyclobutane(figure 6) and layer . thicknesses
of 100 nm. In order to eliminate post-charge events during theInsulation measurement, the ourrent density values were not readoff until 60 minutes after the measurement voltage had been appliedto the model capacitor.
Now and then self-healing took place because of the long
duration of the measurement and the relatively high field strength.
Measurements for which a self-healing process was observed,
recognizable by a short current jump could not be evaluitted for
determining the insulation_ resistance.
Whon the 60-minute values of the insulation currents areplotted, one obtains as a good approximation straight lines if
VU' (U = measurement voltage for the materials tested) is chosen
as the abscissa (figures 5 and 6). Evert or the well-known plastic
foils for capar4itors, such as polyethylene terephthalate, analogous
insulaton measurements lead to straight liners according to
figures 5 and 6. In figure 7 the current density values are plotted
as a function of field strength for 6 4m thick polyethylene
terphthalate foils and for 100 nin thick glow polymer coatings made
of hydrocarbons resp. of perfluorinated monomers as starting
materials. In the following several values will be presented for
the specific resistances: layers of cyclohexane for a field strengthof 10 Vfµm 5-1018 Com (2500) or 2•1016,QCM (10000), for layers of
hexafluoropropylene 1.6,1017jr:
(2500) or i.6 . 1015 Clam (1000C).
The comparison values for a 6 µm thick foil of polyethylene
terephthalate are & 2.5 » 1018 Com (250C) or 1.6 • 1015 them(1000C) .
16

The conduction processes 'In these thin layers, which agreewith the results from well.-known plastic foilep are largely unknown.The evaluation of the test results showed that the relation between
current density 3, field strength F, and temperature T can be
explained neither by the well-known Schottky equation 1151
IPs . 1/2AT2 exp (- 'T - " ----- )
with A a 4 n e m k2/h3 1/2
D . 0 3/2 /lc (4 ced
'O S = work functione = elementary charge, mass of electrons
h = action quantum
nor by the Poole-Frenkel equation /16/
j=ebnEexp( -9^PF -F^F1/2)KV ;lr--
b movability of the charge carriers
n = charge carrier densityPPF = excitation potential from disturbance location_ in the
conductive band
B r - 2 e 3/2/k (4 n cto) 112
The following was found for the relation between current density,
temperature, and field strength for the glow polymerization layers
in agreement with results obtained with plastic foils
(^n
1/2
For glow polymer layers from cyclohexane the constant C has the
value 8-10-4 A/cm2 and for perfluorinated glow polymer layers
1.8.10-3.A/cm2.
The term D. in contrast to the corresponding term in equations (1)
according to Schotky and (2) according to Poole-Frenkel is
temperature-dependent (see table 2).
17^h
p
I

103 denotes in (1) the work function for electrons exitingfrom electrode metals into vacuum (e.g., 2.8 eV for aluminum).
From figures 5 and 6, for the corresponding term 4 in (3), values
UIbetween 0.6 and 0 . 7 can be calculated. For plastic foile such
as polyethylene terephthalate values between O - E and 1.2 eV arelisted /171.
The just described deviations of the experimental results
from the laws demanded by Schottky, especially the value of
j 0.6 to 0.7 as determined by us compared to the much highervalues 14^ for the work function of metals, suggest that the
conducting electrons reach the conducting band not from the
electrodes, but from disturbance places in the insulating layer.
This is also in agreement with the fact established by us that the
current density is independent not only of the electrode material,
but also of the polarity of the voltage.
The constant B in formula (2) corresponds to that from (1)
except for the factor 2. Tn table 1 the values for B, calculatedaccording to Schottky with t: = 2.5 and according to Poole-Frenkel
also with c = 2.5 9 are compared with the quantity D from equation
(3). One can clearly recognize the temperature dependency of D:
furthermore it can be seen that the value D agrees with the value B
calculated according to Schottky only at 2,5 0 C.
Table 1 Listing of the quantity B or D (V - 'cm'K)
from the formulas (1), ^2), and (3)
D for layers made of cyclohexane (d=100 nm)
D for fluorinated layers 0=100 nm)
D for polyethylene terephthalate (d=6 µm)
B calculated according to Schottky (with c =2.5)
B calculated according to Poole-Frenkel
(with c = 2.5)
25 o
1000C
1. 54
1.83
2.53
3.00
2.45
4.o4
2.73
2.73
5.,46
5.46
18

The comparison of formula (3) with that of (1) and (2) alsoshows that the conducting mechanism in thin layers deviates from
M
that calculated according to Schottky as well as that according toPoole-Frenkel.
3.3 Diy,electric Properties
24
3.3.1 Dielectric constant and losses
The investigation of the current denelty was complementedby additional measurements of capacitance and of losses. VW was
also conducted with capacitor models according to figure fir.
To achieve dielectric properties as good al3 possible we firstselected materials which, in chemical polymerization, produced
non-polar materials such as polyethylene or tetrafluoroethylene.
As the following dielectric investigations show only amorphous
layers with more or less built-in dipoles can be produced by the
creation of side chains and networks by means of glow polymerizationnot only for hydrocarbons but also for perfluorinated starting
monomers. As a further step we then chose cyclic starting monomerswith outside chains which break up on their end in the dischargezone of the glow polymerization apparatus to linear molecules with
one free valence each and which then assemble "to long chains
with few side chains. As shown in table 2 even these layers were
not free from dipoles, and an increase of the dielectric constant
and the losses compared to chemically polymerized comparison
materials was found.
The DZ-Nalues listed in table 2 for glow polymer layers
are obtained from capacitance measurements with capacitor models.
The determination of the dielectric constant,,accurate for the
first time, was made by means of two methods: in one very plain
silvar mirrors were coated partially. With the interference
microscope one was then able to determine the thickness of the
b
19

applied layer at the boundary between coated and uncoated carrier
parts. By vapor deposition of a surface (F s 2 cm2 ) defined ao
counter electrode the capacitance was measured and from that
DZ was calculated. In the second method the coating thickness
on plastic carrier foils was determined by weighing and by
capacitance measurement. In order to obtain a,weight ratio of the
carrier to the coating as favorable as possible we selected 3µm
thick carrier foils. Metalized foil pieces of defined sire(dimensions of the electrodes) were weighed. Subsequently they were
coated and weig."ied again. After vapor deposition of counter
electrodes of surface 2 cm and capacitance measurements it was
possible to calculatev in conjunction with th e first method, layer
thickness, specific weightsp and DZ. By frequent repetition of
these processes we obtained statistically assured results accurate
to about + 51. Now it was possible to determines in reverse
direction, the thickness of glow polymer layers by capacitance
measurements.
Table 2 DZ and tan'b of polyethylene and polytetraflurorethylene
and the corresponding glow polymerides
Poly- glow poly- polytetra glow polymerideethylene meride from fluoro- from perfluor-
cyclohexane ethylene cyclobutane
DZ (250 C) 2.3 2.5 2.1 2.3
DZ (100OCI+) ) 2.25 2.55 2.a4 2 .26
fond • 1, 3 ^ 25oC ; 0.2 4 0.2 1.5tanb • 14 3(1AoC ) 0.2 5 0.2 1.5
+) The numbers were calculated from capacitance changes compared
to the value at 250 C.
f
20

As a result of the insertion of dipoles we obtained change
in the temperature dependency of the capacitance as compared to
chemically polymerized plastic. While for nonpolar materials,
such as polyethylene rasp. polytetrafluoroethylene, with pure
displacement polarization (because of the change in density with
temperature) the DZ decreases with increasing temperature and
a value for TKc of about -210 • 10 `6 6 o0 is found, glow polymerized
layers with cyclohexane as starting monomer exhibit a positive
temperature value of capacitance with a value TK c of about
+300 • 10-6/°C (figure 8). An increase of DZ results from the fact 2E
that the built-in dipoles become mobile at higher temperatures
Ferfluorinated glow polymer layers with fewer numbers of built-in
dipoles as compared to polyolefins exhibit at temperatures above
250 C a negative, but at lower temperatures a positive TK c (figures 9) .
The capacitance- and loss factor curves of the glow polymer
layers are as can be recognized particularly for those with cyclo-hexane as a starting monomer - relatively uniform without sharpextremes over the entire frequency - as well as temperature rangethat was measured. Accordingly there seems to be a smear or a
wide interval of the thermal activation energies for excitationof dipole movement of the glow polymeride, which suggests a large
number of polar structures.
3.3.2 Electrical arcing resistance
While for capacitors with metal foils the first arcing
leads to short-circuits, arcing is basically allowed for self-
healing capacitors. However, even here the number of arcingsmust be kept as low as possible Auring operation. Thus thequestiti arises how the frequency of arcing depends on the varioustest parameters, such as voltage and temperature. A comparable measurefor the a;^cing behavior of self-healing capacitors is obtained bya test, in which, for step-wise voltage increases of capacitors,the number of self--healing arcings is measured per voltage atep.
21.

In this wayone obtains an idea of the number of arcings withreference to a given voltage and temperature. Since the number ofarcings is approximately proportional to the decrease in capacitance,one can.also choose in these tests the decrease its capacitanceas a measure of the arcing resistance. Such tests are describedin the followings They were conducted with capacitance effectivesurfaces of 1 to 100 em2 and with dielectric thicknesses of 75 rim,100 nm, and 150 nm. The results are shown in figure 10 where therest capacity of the capacitors investigated is given as a functionof the applied field strength. Up to a field strength of about
300 V/µm no arcing was determined. For higher loads the capacitanceof the model capacitors decreased because of self-healing arcings.It was shown that the important capacitance decrease occurred ina relatively narrow range of field strength (A E = 100 to 150 V/µm)
1.q figure 10 it can be recognized clearly that the arcing field
strength increases with decreasing coal; thickness. Such a behaviorwas described theoretically by Frohlich /18/ and was confirmed by
measurements of, however, very small area single crystals. Toexplain the thickness dependencies of the arcing resistanceone can use the concept that the formation of electron avalanchesnecessary for generating aroings is made increasingly more difficult
with decreasing coat thicknesses.
For industrial foils, such as polycarbonate or polyethylene
terephthal to the number of arcings per unit area, referenced to
equal field strength, increases in the direction of thin foils /19/.The reason can be found in technically caused voids.which ,in
thinner foils, are always more closely Spaced. The tests with
glow polymerides now show, in contrast thereto, an increase in
arcing resistance as the layer thicknesses become thinner. In
addition the arcings are all found in a relatively narrow field
strength interval ( at 150 nm s 450... 550 V/µm, at 100 r),mi 600... 700 V/µm,
at 75 rant ?50...890 V/µm). This behavior suggests an extraordinarilygreat homogeneity of the layers generated by glow polymerization.
22
k
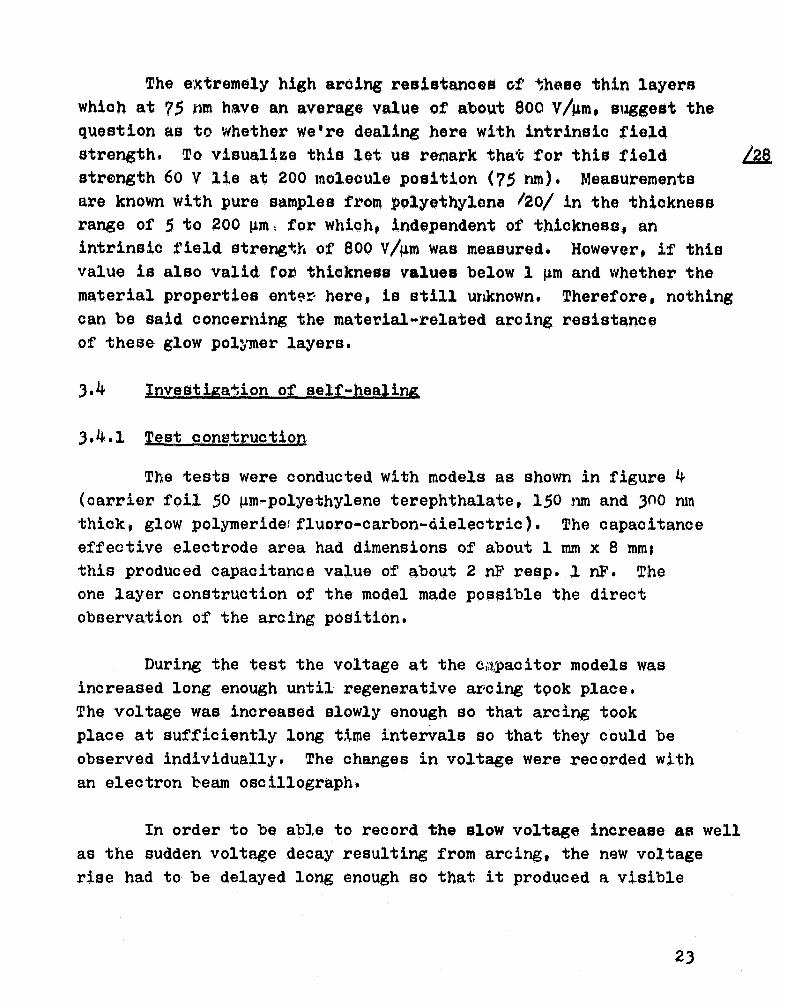
The extremely high arcing resistances of these thin layers
y which at 75 nm have an average value of about 800 V/4m, suggest the }
question as to whether we're dealing here with intrinsic field
strength, To visualize this let us renark that for this field
i strength 60 V lie at 200 molecule position (75 run). Measurementsare known with pure samples from ,polyethylena 120/ in the thicknessrange of 5 to 200 gm, for which, independent of thickness, an
intrinsic field strength of 800 V/µm was measured. However, if thisvalue is also valid for thickness values below l 4m and whether the
material properties ente here, is still unknown. Therefore, nothingcan be said concer ►iing the material-related arcing resistanceof these glow polymer layers.
3.4 Investigation of self-healing
3.4.1 est c^onetruction
The tests were conducted with models as shown in figure 4(carrier foil 50 µm-polyethylene terephthalate, 150 i m and 300 run
thick, glow polymeridefluoro-carbon-dielectric). The capacitance
effective electrode area had dimensions of about 1 mm x 8 mmi
this produced capacitance value of about 2 nF resp. l nF. The
one layer construction of the model made possible the direct
observation of the arcing position.
During the test the voltage at the capacitor models wasincreased long enough until regenerative arcing tpok place.
The voltage was increased slowly enough so that arcing took
place at sufficiently long tame intervals so that they could be
observed individually. The changes in voltage were recorded with
an electron beam oscllograph.
In order to be able to record the slow voltage increase as well
as the sudden voltage decay resulting from arcing, the new voltage
rise had to be delayed long enough so that it produced a visible
23

T,
trace in the oscillogram. This was accomplished by the construction
consisting of three RC-members shown in figure 11. A simple
serious resistance at the test unit would have to boo because of
it small capacitance, larger than 1 G A 0 which is difficult to
achieve and which, because of the voltage division resulting from
the internal resistance of the measuring instrumen rtso produces
problems in the voltage supply (compare also figure 14 ar;ti the
associated text). The first RC-member (R1CZ ) had a timo i.,nstant
of about 10 s and served for the slow charging of the test
unit Cpr . Because of the substant3.ally smaller 1tiime constant,.P. the two RC-members connected downstream the voltage at the
capacitors C2 and Cpr is equal during the charging phase. During
arcing the voltage at the test unit decreases'by p U (figure 12)
Arcing is completed within one microsecond. During this time no
significant amount of charge flows to the test unit through the
resistor R 3 . After that, however, the test unit is charged again
within a few milliseconds from the capaoitant C 2 until 02 and Cpr,
have the same voltage. This produces a voltage decreaseA U'
(figure 12) at 0 2 which is recorded by the measuring instruments.
Then follows the slower recharging of C 2 and Cpr to the arcing
voltage.
For the charging of C pr from C 2 we have
0 2 A U' = Cps, (Au - A u').
Therefore AU can be calculated simply from the measured. AU'.
(2) A U = (l + C2 ) A ugpr
This means that the scale factor of the oscillograph must
be multiplied by the value in the parentheses in order to be able
to read off A U directly. (The measuring errors during the
determination of C 2 and Cpr can be neglected compared to the
accuracy of reading the oscillograph).
^T
24
(l)

Lj
3.4.2 Test results
By means of the described construction the arcing voltage U
and voltage decrease b U = UO was measured and from that the energy
converted during arcing was calculated
2 0 /3a
The capacitance C of the test unit was varied by parallel connectionsof additional capacitances between 1 and 10 nF. The areas of
several burned out sections were determined under the microscope.
Figure 17 shows such a burn-out section with arcing channel.
The size of the burned-out section depends only on the
magnitude of the energy conversion. All other parameters such
as layer thickness, arcing voltage, capacitance, etc. affect only
the energy conversion and, in this way, affect the size of theburned-out section /21/. Figure 13 shows the relation letween
burned-out section area and energy conversion (solid line).
Thic was first found with thicker dielectrics for higher voltages
and correspondingly higher energy conversions (crosses in figure 13).
These measurements mere made with different dielectrics, dielectric
thicknesses, and capacitance values. The test described here with
the thinnest dielectric layers (circles in figure 13) have now
shown that the mathematical relations remain valid down to the
smallest discharge energy. The dashed straight line in figure 13
represents the vaporization energy for an average aluminum coating.
One can recognize that of this converted energy a large part,
for small energy conversions the overwhelming part, is used for
vaporization of the metal. The remaining energy destroys the
dielectric in the arcing channel and at the surfaces of the burn-out
area /22/• For arcing at the smallest measured energy conversions
no more burn-out sections were observed; here only the metal above
the arcing channel was removed. Even these locations still had
25

satisfactory insulaton.
The measurements showed further that during arcing the voltagedoes not drop to below about 17 V but that this 'lower limit isattained frequently. Figure 14 should make this clear. To produce thisa test was conducted with a construction different from the onedeocribed. A voltage was applied to a model capacitor via a
series resistance of only 1 NIA . Because of the small timeconstant the voltage at the capacitor rose, at the connection,very rapidly to the prescribed value which, after every arcing,
was again attained just as quickly so that the arcing occurred
in close sequence. The lower limit of the voltage decay whichwas almost obtained in most arcing events can be clearly recognized.
For voltages below the given limit of about 17 V no
arcing was observed.
In figure 15 the energy conversions E referenced to thecapacity C
(4) E2 2
_ U _ VoC - 2
are plotted again„st the arcing voltage U for the individually
observed arcings. The plotted curve corresponds to the case
where the final voltage U 0 after arcing is equal to 17 V.
Points which lie below the curve correspond to a U 0 > 17V.
The frequency of the points decreases rapidly with increasing
distance. Higher capacitances with correspondingly higher energy
content show a tendency to somewhat higher final voltage U04
fn figure 16 the curve of figure 15 is plotted on a two-cycle logarithmic scale as compared to measurements with capacitors
having 6 µm thick polyethylene terephthalate as dielectric. For U >> U0
we obtain according to equation (4).
26

(5)
E/C fts U2 .
In the range U a UO the curve is curved according to equation (4)•
For the measurement with polyethylene terephthalate we obtained, a
similar curve, to a large extent independent of the capacitance,
which, however aims at a higher limiting voltage for U 0 . /32
For the linear relation between burn-out area and energyconversion shown in figure 13 for two-cycle logarithmic plotting
one can recognize that, with decreasing energy conversion, anincreasing share of the energy is utilized for metal vaporization:
the load on the dielectric becomes increasingly lower. Similarly
the voltage available for ionization becomes increasingly smaller
until, below the critical limit of about 17 V (for the glowpolymerized layer investigated) it is obviously no longer sufficient
to support an arcing current. Thus for this voltage the self- healingprocess is terminated. Below it no arcing can occur. This criticallimit depends, as can be seen in figure 16, on the thickness of
the dielectric and perhaps also on the chemical composition of the
dielectric. Below this voltage limit where no self-healing arcing
can occur a slow self-healing process becomes effective /23/ which
is based on electro-chemical processes.
Tests for increasing the deposition speed and improvementof the coating properties
4.1 Introduction
With a view toward economic production of thin layers by means
of glow polymerization an effort is made to attain transport speedsas high as possible of the foils through the coating apparatus.
This transport speed depends on the one hanl on the geometry andthe size of the electrodes in the apparatus, and on the other hand,on the deposition speed of the thin layers from the carrier foil.
27

The geometry of the electrodes was described under 2.1. Theconnecting in series of several electrode pairs demonstrates thebasic possibility to increase the transport speed ii, this mannerand at the same time keeping the thickness of the coating conOtant.
In preliminary tests (see 2.2) it was already possible tofind an optimum with respect to deposition speed and coatingproperties during the production of polymer layers made of hydro-carbons of the formula (CH 2 )n by varying the various test parameters,such as gas pressure and current density'. It occurs at a workingpressure of about 300 N /m2 and at a currant density of about2 mA/cm2 . The optimum is established with respect to gas pressureby the negative influence, of foreign atoms+ which make theirpresence known, with increasing working pressure, by increasingembrittlement of the layers resulting from increased: c;,ross-linkingand shortening of the chain links.
In the following we shall now investigate the effect of themonomer Vases on the deposition speed. In these considerationsone must take into -account that the layers generated are very thinand. that the surface capacitances are very great. Thus forproducing a certain capacitance from conventional dielectric
thicknesses, such as 3 4m, we must produce dielectric surfaceswhich are 20 times greater than those of a capacitor of equal capa-
citance with a glow polymerization layer 150 nm thick.
4.2 Choice of the monomer gases
The energy available in glow discharge is sufficient tocrack all bondings found in organic substances. It is possible,therefore, to produce layers with given properties by the suitablechoice of the monomers and the test conditions. For dielectric
applications the i'ollowing criteria are controllingi good electrical
behavior, such as low dielectric losses over a wide frequency range,
high temperature constancies of the capacitance, high dielectric
28

constant, and the ability to employ high field strengths in addition
resistance to oxidation, sufficient elasticity, ,ind high temperature
constancy.
From these considerations one obtains the requirement Z1
for a build-up of the layers as free as possible of dipoles,
such as one can find in polyolefins, such as polyethylene and
polypropylene, and for perfluorinated polyolefins, such as
polytetra fluoroethylene, an4 polystyrole. These substances
are made up of benzene-substituted vinyl groups (styrole, d--
vinylbenzene ) resp. from (-CH 2 -)- or (-CF2 )- units. It is
necessary, therefore, that the starting monomers are made up of
such basic units.
The necessity for regeneration capability poses additional
demands on the dielectric. In the capacitor construction (figure 4)
very thin metal layers are necessary, for one, and for another,
certain prerequisites concerning the chemical construction of thedielectric must be satisfied /22/. Thus, in particular, a certain
ratio of carbon to hydrogen- or halogen portions must be satisfied.
Figure 17 shows a self-healing arcing in such a regenerating
dielectric, for which a highly insulating area is formed around
the arcing channel. For the case where the chemical composition
of the dielectric contains a greater carbon content, conducting
carbon bridges are formed during arcing between the two metallic
coatings. According to accurate investigations /22f benzene
, erivatives, in particular, are not suited as regenerating dielectrics.
This, thus, sets additional limits for the possible substances
to be used as starting monomers which during glow discharges form
layers with a bask structure made up of (-CH 2-)- or (-CF2-)
units.
Thus, for the material groups of the pure hydrocarbons
only monomers of composition CnH2n+2 and CnH2n may be used where
the first contained exclusively single bonds in their construction
29
all,

relative boiling vapormass of point pressuremolecules o0 at room
2temp. N/m
ethene 28 -102.4 gaseous
propene 42 - 47.7 to
butene 56 - 6.6
pentene 70 38.4 4 loo
hexene -1 84 63. 5 2 . 14
cycl.ohexane 84 80.8 1.2 0 104heptene -1 98 93.1 8 . 103
oct ene 112 rV 101 5 . 103
depositionspeed(nm/s)
3.5578.5
10
10
11.0
12.5
30
4;
and thus produced considerably lower polymerization speed than
molecules of the composition C nH2n . Those have either double bonds
in the molecule or are made up of a cyclic structure. By means of
a single excitation process in glow discharge two free valences
are produced by cracking of a double bond or by the split-up of
a ring molecule so that in this way excited molecules can be
assembled to polymer chains. Molecules without double bondsp
on the other hand, must be activated in two places (by cracking
or by splitting-off of an H-atom) in order to be able to polymerize.
Such a simultaneous double excitation is relatively improbable.
i^-
Therefore, the additional investigations concentrated on
the series of al,kene and cycloalkene • Table 3 lists the most
important hydrocarbons with their vapor pressure and their
deposition speed for a current density j of 2 mA/cm 2 . The depositionspeed refers to tho static case (carrier belt at rest).
Table 3 Starting monomers for glow polymerization (hydrocarbons)

Glow polymerized layers could be produced with allthese substances.
The polymerization speed of monomers of similar structure
depends almost linearly on their relative mass of the molecule
(table 1). From that one can conclude that the number of the
excitation processes for equal molecule density is almost
independent of molecule size. For this reason the investigations
were concentrated on monomers of high relative molecular mass.
Howeverr one has to take into account that monomer flooding had to
be employed, To obtain a sufficient fresh gas supply the monomer
pressure had to be about 10 times the working pressure. To obtain a
working pressure of several 100 N/m2 no monomers with molecular
mass greater than that of octene could be employed. For heptene^,
and octene polymerides Jhe chain links are already so large
that steric hindrances set in during layer formationsq which
imparted a certain degree of stickiness to the polymer film
because of lacking cross-linking.
The most favorable coating properties were obtained with
monomers having 5-6 carbon atoms, whereby cyclohexane had theadditional advantage, that it can form layers with primarily
linear chain structure and relatively few side chains similar to
cross-linked polyethylene.
Analogously to the test with hydrocarbons experiments were
also conducted with corresponding perfluorinated compounds. 'table 4
lists several important data for the polymerization of perfluoro-
carbons, also referenced to a current density of 2 mA/cm2.
R4
31

Table 4 Starting monomers for glow polymerization(perfluorocarbons)
relative boiling vapor depositionmass ofmolecules
pointoC
pressure 2at RT N/mspeed6M/sec)
tetrafluoroethylene 100 -78.4 gaseous -
hexrtfluoropropyl-ane 150 -29.4 of
perfluorobutylene 200 - 8.0 to 5perfluorocyclobutane 200 - 6.4 00
perfluorocyclobexane 300 57 5 • 103 7.5
,Even for perfluorinated compounds the law of increasng
deposition speed with increasing relative mass of the molecule
applies. Ht;wever, the deposition speed is only about half as
greet as that for the corresponding hydrocarbons. Except fortetrafluoroethylene coatings were produced from all the above-
named substances. Tetrafluoroethylene 16 difficult to process
(danger of explosion) and exhibits the lowest deposition rate.
Furthermore, investigations with this substance had already
been conducted by others /24,25/.
The deposition rate of perfluorinated substances is only
about 50% of that of the corresponding hydrocarbons. This results
from the lower possible working pressure and from the missing
cross-linking reaction. Practically only C-C bonds are broken up.
Fluorine atoms are split off only rarely (energy of the C-F bonds
5.4 eV). For that reason the number of the dipoles resulting is
also very low. It is the lowest because of the lack of longer
side chains for the materials perfluorocyclobutane and perfluoro-
dimethylcyclohexane. The electrical properties of these coatings
are described in gr,-ater detail in section 3. They closely approachthe industrial perfluorinated plastics and show that, during glow
polymerization of fluorocarbons, very few reactive molecules
32

(e.g. C = 0'-groups) are built in. Even the low water take-up('" 39£o) leads to that conclusion.
In order to obtain the electrical properties described under
3, it is necessary to de-gas the reaction set-up completely, toclean the reaction vessel by glow discharges with an inert gas,and to dry the carrier foil thoroughly. In addition the monomergases must be dried before admittance into the reaction vessel
and must be freed of oxygen by suitable reduction agents.
4.3 Monomer mixtures
Polymer coatings made up of hydrocarbons of the formula
(OF 2 )n exhibit high moisture resistance and low loss factors, those ofthe formula (CH2 )n exhibit excellent self-healing properties. In
order to combine the advantages of both polymers in one coating
tests were conducted with mixtures made up of both materials.
For this both material groups were alternately deposited,
one above the other, up to 5 polymer layers. The thicknesses ofthe individual layers could be estimated to be between 5 and 20 nmbased on extrapolation of the transportation speed from known
thicknesses. The electrical properties of this buildap corresponded,
to the ratio of the participating individual substances. In
contrast to pure perfluorinated layers the regeneration capability
is also completely sufficient during inclusion of very thin cyclo-
hexane coatings. In addition, it furnishes the possibility to
adjust accurately the temperature coefficient of the capacitance
within certain limits by the appropriate selection of layer
thickness.
In order to avoid the multiple coating process and to
obtain new dielectric layers, the two gas components were mixed
by means of mixing devices in the supply tubes and were passed
33

directly into the discharge none. The characteristics.of the glowdischarge changed because of the different polymerization mechaniF.Asof the two gases with the combined compositions.
The many combination possibilities with respect to materialselection as well as with respect to mass ratio required extensivetesting. It was possible to obtain an optimum of results withrespect to production requirements and coating properties. Animportant result was an increase in the polymerization speed.The most favorable material combination was cyclohexaneperfluorodimethylcyclohexane. For thew combinations the partialpressures of the two gases were varied in a test series for a totalpressure of 300 N/m2 each, so that, starting with 3.00% cyclohexaneup to 100% perfluoromethylcyclohexane mixture ratios were obtained
in lo% steps. Table 5 shows the deposition speed in nm/s as a
function of the gas composition for a current density of 2 mA/cm2e
Table 5 Deposition .peed of gas mixtures
gas composition (j)
cyclohexane
100 90 80 7o 6o 50 40 30 20 10 0
perfluoromethyl- 0 10 20 30 40 50 60 70 80 90 100
cyclohexane
deposition speed (nm/s)
mi;cture
10 11 13 14 17 19 18 15 13 10 8
For a corresponding mixture composition the deposition
speed increased to about double the value. Similar results, but
not so favorable, were also obtained with mixtures from pure hydro-carbons and corresponding fluorinated materials. Here the chemicalstructure of the two reaction partners need not be necessarilyanalogous. Thus, for instance, the system propylene-perFluoro-
cyclobutane also has a significantly greater polymerization speed
than the individual components. No unequivocal explanation has as

yet been found for the mechanism which brings about the increasein deposition speed. It is possible that a inutual sensitizingand exciting of the mcleoules takes place since during glow
polymerization light of different wave lengths, primarily in the
UV range, arises and since the pure and perfluorinated hydro-
carbons have different absorption bands.
In addition to the attainment of increased depositionvelocity it was possible to vary the electrical and mechanical
properties of these films within certain limits. Thus filmwith 30% perfluorinated gars and 70% cyclohexane have already been 40
found to be elastic up to a thickness of several µm, while ;layers
of such thicknesses made up of cyclohexane alone are very brittle.
In addition the moisture sensitivity as compared to ,pure hydrocarbonhas been decreased sigrifica:ntlyl on the other hand, the regeneration
capability of such layers mad e up of mixed polymerides is still.excellent and the TKC of such a layer is close to zero.
By the use of such gas mixtures whose composition can be
adapted to any particular requirement, the possibilities for the
application of glow polymerization layers can be expanded considerably.
4.4 Kinetic Process es glow discharge
The effective cross-section of the positive monomer ion
with reference to the coatj:t^g formation process on the electrodesis about 10 times that of the electrons /2, 26/. This can be shown
with glow discharge investigations using D.C. where the material
polymerized on the cathode is several times that polymerized on
the anode. At the ssipe timo it is found from these tests that
the polymerization to macromolecules for a given pressure and
suitable current densities takes place overwhelmingly directly
on the surfaces of the electrodes. Since the molecule density
in the gas volume is low, the probability of stacking together
a series of molecules to a polymer chain is not realistic.
35

The short chains that are produc
stream and sucked off.
In the following we shall
processes in the plasma with the
For the average square of
the reaction chamber we obtain
ad are carried off by the gas
describe in greater detail the
aid of kinetic ,gas theory.
the velocity of the molecules in
u2 r y^T
(k Boltzmann's constant, T temperature in K, m mass of the molecule)
The average velocity u iss
2 (2)u - 0,921 • Y11* .
Th i average free path lengths of the molecule am between two
collisions is
A m = .^r1
^^'•' (}c)
(rm radius of molecule, N number of particles/volume)
Compared to the radius of the molecule of several 10-10m
the radius
of the electron of 2.8 • 10-i5m can be neglected. For the freepath length Ael of the electrons (3a) simplified according to the
kinetic gas theory to
e 1 ,,,..^ (3b)n tJi•m
The temperature T in the reactor can be assured to be about 300 K.
From the above relations, the monomer-specific working
pressure and the density of the liquid monomers, we obtained
important data (table 6) for the reactions oc ..:urring in the plasma.
These data were calculated for the hydrocarbon evclohexane and for the
t perfluor.inated cyclobutane for whose coating a large number of testsA
36
M 11

is available
ab e_6 Gas kinetic data of cyclohexane and perfluorocyclobutane
Cyclohexano, Perfluoro-cycl,obutane
Radius of molecule r ran 0.35 0.37
Average velocity u m/s 274 178
Average free path lengths Am µm 5.3 707
Free path lengths of µm 30 44
the electron Act
Since the electrons, based on their low mass, lose practically
no energy in Elastic collisions with gas molecules, they take on a
quasi-thermal velocity corresponding to several eV. Starting with
this velocity level they are accelerated by an applied electric
field E. They obtain the maximum possible energy addition
from two collisions, if the original flight path and direction
of the electrical field coincides
AC . eg g. (e elementary charge,
E electrical field strength) (4)
For a maximum field strength of about 3 ' 10 4 V/m this means an
energy increase of about 1 eV between two collisions. Thus, the
energy of the electron increases with each individual elasticcollision: until it can be transferred to a molecule by aninelastic collision, e.g., for the excitation or dissociation of
a light electron or for cracking of a molecule bond. As can be
seen from section 5.4 an energy of about 3.7 eV is required for
breaking up a C-C single bonds for splitting off the H-atoms
4.3 eV are required. During splitting off of two bonds of a cyclic
molecule low molecular cracking products are produced. By the
42
37

R
dissociation of H-ions branching to larger molecules takes place.
For perfluorinated substances 5,4 eV are necessary for
splitting off a fluorine atoms iseep the colliding electron,
in the absence of inelast*,c collision, must be accel4rated more
often in order to attain this energy. The probability for this
is considerably lowers in addition free fluorine atoms are very
reactive and attached to other molecules. These different
bonding energies explain not only the results of the mass spectro-
metric investigation in section 5.4, but also the varying coating
properties of the resulting polymers as will be discussed in a
different place.
The excitation processes by ionized molecules, principally
/43cations, play a relatively small role in the discharge volume,
since t based on their shorten free path lengths according to (4),
they would have to pass through a greater number of excitation
steps without neutralization by electrons in order to be able totransfer sufficient activation energies. However t according to the
experimental results, they are responsible for the major portion
of the polymerization processes on the electrodes.
Apparently the main polymerization process first starts on
the electrode surface. The molecules colliding with the electrodes
are adsorbed in part. For hydrocarbons the heat of adsorption
is greater than the heat of condensation /25/. In addition the
vapor pressure of the monomers used is greater than the working
pressure prevailing in the reactor by a factor of 10. Therefore,
at equilibrium a monomolecular layer of the surfaces to be coated
will take place. In glow discharge monomer cations impact on the
electrodes and initiate a polymerization process. By this process
the surfaces are changed # the diffusion equilibrium is disturbed,and a new molecular layer can be deposited.
The time- and area-dependent number z of the colliding
38

molecules is given by the pressure p. We have
P •: z'r
2 m r u2 ^ and
P 3Nm u2
from this it follows:
x a ^ N 4-U2 (5^
For oyclohexane we obtain z = 4.35 • 1020 molecules/cm 2• s, for
perfluorocyclobutane we obtain correspondingly z = 1.7 • 1020
molecules/cm2. S.
A current density of 2,
speed listed in the table , is
elementary charges per cm and
half of which again collide on
two surfaces face each other).
nA/cm2 , corresponding to the deposition 44
identical with a flux of 12.4' 1015seconds. Half of them are cations,
1 cm electrode surface ( since the
Thus, the cation flux is
T+ 3.1 ' 1015 K+/cm2 . s
Of about 10 5 molecules which impact on the electrodes, only one is
thus a cation so that the thermal diffusion process at the electrode
can proceed practically without disturbance.
For cyclohexane, with the assumption of an adsorbed mono-
molecular layer on the electrode in equilibrium, we obtain a
coverage density of 2.3 • 1014 molecules/cm2 (the diameter of a
cyclohexane molecule is about 7 • 10-10m /27/). The average dwell
time T of an adsorbed molecule on the electrode then becomest
T = adsorbed molecule per cm2/colliding molecules per cm 2 and
seconds; i.e.T 5,4 . 10"7 g ft 5 . 10-7 a
From the density of about 1 g/cm 2 of the deposited materials and
a measured growth velocity proportional to the current strength2
of 5 mA sm we obtain for cyclohexane for the above current strength
39

i ,—,m._^. A^.e!!!r^u +sw^.w..^..... ^ ,-,41MMAA ,. ^lAN.9B.dlIl9AMlAYASw^^w--`.+a. m,...we.e...
T
1
k
a deposition rate M of 7 . 1015 molecules cm S. This means about
30 molecule layers with a thickness of 3.2 • 10`10m per molecule.
The specific polymerization rate, referenced to the number of
the polymerized molecules pe- colliding positive monomer ions is
M+ = 7 • 101513.1 • 1015 = 2.25 molecules/cation.I
During the estimated dwell time of 5 e 10-7 s of the adsorbed
molecules they can react with one another on the surface, and in
such a way that they can collide directly with an ion since the
factor M/I+ > 1.
The polymerization speed of perfluorocarbons is, under the
same conditions (pressure, current strength), only about half as
great as that for the equally great hydrocarbons buildup in the
corresponding mass. The splitting-off of fluorines is ^rery low,
and based on the high reactivity of fluorines the recombination
rate of fluorines is very high so that no additional polymerization
possibilities arise to reactions with side chains.
5. IR spectroscopic and mass spectrometric investigations
5.1 Introduction
In glow polymerization processes primarily ions and different
i radicals with free valences are produced in a gas discharge volume.
The relative frequency of these radicals in a gas phase control
decisively the chemical structure and the physical properties
of the thin polymer layer since free valences in the chain mo ocules
can cause the formation of branch points or an inclusion of polar
t atom groups by conversion with 02 or H2O. Since the prevailing
h sical polymerization differs here basically^ P Y P Y Y from the known
chemical polymerization processes, one can predict which type of
materials are produced not only with respect to chemical composition
40

but also with respect to structure. Therefore, an investigat',on
of these new materials was necessary. As methods of analysis the
IR absorption spectroscopy suggests itself with which molecular
structures in organic compounds can be proven specifically with
the aid of characteristic absorption and in this way, for new
synthetic polymer compounds, detailed information concerning thechemical composition can be obtained.
In addition to the glow polymerization layers the gases
pumped from the gas reaction volume are also analyzed in order
to obtain information concerning the composition of the plasma.
5.2 Experimental with respect to the IR investigations
As substrate for the thin dielectric layers we utilized each
time metallized plastic foils (Hostaphan 50 µm). For the analysesan IR absorption spectrophotometer model 2.1 of Perkin-Elmer was
available with which IR spectra in the wave length range 2 -15 µmcould be obtained. In most cases an analysis of the layers by
the conventional penetration radiation method was impossible because,
based on the very low thicknesses of the samples, no actively
measurable absorption signals were possible on the one hand, and,on the other rand, the layers could riot be separated as a rule from
their metallized substrate. Thus an important aid to these
investigations turned out to be the method of the attenuated
multiple IR spectroscopic total reflection (FMIR-Technology)
in which on both sides the multiple total reflection occurring in
the boundary surface between a planar parallel crystal made of
thallium iodine with high index of refraction and the thin sample
layer was utilized. The method depends on the fact that the
radiation, for each total reflection, penetrates the optically
thinner medium of the probe layer at a lower depth ( ti 0.1 µm) andthat it is attenuated here by absorption as well as by penetrating
radiation of a corresponding layer before it returns into the
optically thicker medium of the crystal ./28,/. The absorption effect
46
- - A't_
41

in the sample layer is amplified with each additional total reflectionso that the light portions emitted at the end of the FMIR unitrepresent, as a function of wave length, the exact image of
absorption spectrum of the sample layer obtained with greater
coating thickness.
5.3 Results of the IR investigations
The investigations extended to dielectric layers for whose
production various linear as well as cyclically constructed
hydrocarbons- and fluorocarbon monomers were used (see tables 3and 4).
The IR spectra of the dielectric layers produced from
C 3H6 and C6H12 exhibited the same main absorption bands whose
characteristics are listed in table 7.
Table Main absorption bands of the IR spectra of glow polymerides
from hydrocarbons
Bands wave length rel. absorptionranges (µ.m) intensity
(rough markings)
1 3.35 - 3.50 strong
2 5.8 - 5.9 average
3 6.85 - 6.9 average
4 7.25 average
associated oscillationsaccording to /30/
CH 3-1
CH2-. CH-valence
C = 0-valence
CH-deformation in -CH2 -
and asym. C-CH3
CH-deformation in
sym. C-CH 3
Except for band 2, both spectra correspond to the spectrum
of a long chain aliphatic hydrocarbon polymer without crystalline
contributions /29/. Thus from C 3H6 and C6 H12 dielectric layers
42

are produced by glow polymerization with extensively equal chemicalstructure. From the intensity of band 4 one can conclude that inboth cases rH2-chain contained a considerable number of branchpoints with CH - groups 1301. Peak 2 proves the existence ofC=0-groups which are apparently produced during the glow dischargeby a conversion of the gas phase with H 2O molecules adsorbed on thesubstrate and which, because of their polarity, produce an increaseof the dielectric losses and the water take-up of the layers.A quantitative comparison of the two spectra showed that these
oxidated portions were present in smaller amounts in the coating
produced from the cyclic monomer C6H12.
The IR spectra of the polymer layers formed from 0 3F60 C4F8,and C8F16 also agreed completely with one another= the data are
listed in table 8.
Table 8 Absorption bands of the IR spectrum of glow polymerides
from fluorocarbons
/48'
Bands range of rel. absorptionwave length intensity
(pm) (rough markings)
1 5.7 - 5.9 weak
2 8.1 - $.6 strong
3 10.2 weak
4 13.4 13.8 average
associated oscillationsaccording to /30/
C=0-valence
CF2 -' valence
CH-wagging in vinyl groupsCF-CF
3-valence
Just as the spectrum of polytetrafluoroethylene /29/ the spectra
of these thin layers exhibit a main absorption band at 8.1 -
8.6 µm (Peak 2). This clearly points to the fact that during the
glow polymerization of the named fluorocarbons we obtain over-
whelmingly CF2-chains. A, difference compared to polytetrafluoro-
ethylene lies in the fact that the g.:,ow polymeride = as can be seen
43
from the magnitude of peak '* - contain more CF-CF3 members. As in thepolymerization of hydrocarbons,C=O-groups are also built in duringthe polymerization of fluorocarbons= this can be seen from theappearance of peak 1 (table 8). The controlling conversion ofadsorbed H2O molecule p produces as an intermediate product hydrogen
which as shown by peak 3 is bound chemically in the polymer layer.
The IR spectroscopic investigations showed that neither for
hydrocarbons - nor for fluorocarbon polymerization the replacement
of linearly built-up starting materials by monomers with cyclic
structure produced a change of the chemical composition of thethin layers.
To increase the deposition speed as well as to obtain layers
with selected dielectric properties it is of advantage, (see also 4.4),
to generate in the glow discharge process co-polymerides through
the use of mixtures from hydrocarbon- and fluorocarbon monomers. /49
In the IR spectroscopic investigations of such a co-polymeridemade up of 06H12 and C 8F16 it was found that both monomers were
connected to each other in an essentially homogeneous distributionto form chains.
5.4 Mass spectrometric investigations
During the polymer layer formation on the electrode there
arise in the gas discharge volume a series of cracked products
whose mass is lower to a large extent than that of the starting
substance. Since they supply important information with respect
to the composition of the plasma, they were analyzed mass spectro-
metrically. As an example let us use propene (figure 18). In
addition to a strong hydrogen band one can also find all possible
radical combinations up to 6 carbon atoms. The other radicalsC 2H2 , C 2H,,, C 2H4 and the propane radical C
3 H 3 were especially
abundant,,. The remaining radicals cannot be identified individually
44

because of the decreasing resolution power of the spectrometer
with increasing mass. The H2O band showed that, even for caredrying of the built-in parts and of the carrier foil, residua]
water molecules cannot be excluded.
In mass spectrometric analyses of the other hydrocarbons
it was found that the spectra can be differentiated only quanti-
tatively, but not qualitatively. However, the mass spectrograms
of the perfluorinated combinations used hardly show any evidenceof crack products. For perfluorocyclobutane (C 4F8), only a veryweak peak for F 2 and the radical CF2 and C2F3 can be identified.
The difference in compositiono of the plasmas of the two
material groups (pure hydrocarbons as opposed to perfluorocarbons)
can be explained by the different bonding energy in the molecular
structure. Thus one needs for
opening of a C=C-bond
break-up of a C-C-bond(aliphatic)
break -up of a C-H-bondbreak-up of a C-F -bond
about 2.6 eV
about 3.7 eV
about 4-3 eV
about 5.4 eV
6. Adhesive strength investigations
6.1 Introduction
The thin glow polymerization layers which are produced on a
carrier band can only be process-I further to capacitors on this
carrier. This results in capacitor construction ar; shown in
figure 19 and 21.
The capacitor thus consists of a carrier foil and 2 or 3
layers applied in succession (metallizing, glow polymerization layer,
and possibly also a second metallizing). This type of constructionposes high demands on the adhesion of the individual layer.
45

Thus the metal layer vaporized on the carrier foil experiences
a high temperature and mechanical stress during the application
of the glow polymerization layer which must not produce a separation
or change of the metal cover on the carrier. Even during the
second metallizing process the layers lying below it are
s^ressed highly. Carrier foilep glow polymerization and metal
layers have greatly different expansion coefficients which,
during temperature changes, lead to mechanical stresses. As is
well known, the foils from carbohydrates and fluorocarbons,
related to the glow polymerization layers, have very poor adhesive
properties. However, since between metal cover and carrier foil
as well as between metal cover and glow polymerization layer a
very good adhesion must be guaranteed during the production and
in continued use, corresponding investigations were conducted.
6.2 Adhesion problems between carrier foil and metal cover 151
6.2.1 Ralation between surface tension and adhesion
To gain an idea as to which plastic foil, based on their
properties (temperature resistance, water take- up, surface tension,)
are suitable as carriers for the glow polymerization layers,
systematic investigations were conducted with the foils
(polyethyleneterephthalate-, polycarbonate-, polypropylene-,
fluoroethylenepropylene-, polyimidefo il) in question.
With respect to adhesion of the metallized layer on the carrier
foil its surface tension is controlling. We therefore searched fora method with which this could be determined quickly and with
sufficient accuracy. The choice was a so-called Union-Carbide-Test.
For this,mixtures were prepared from formamide and ethyleneglycol-
monoethylether, each w t,h widely varying mixture ratios, but
definite surface tension. This test liquid is brushed onto the
surface of the test unit . The test unit then possesses thesurface tension of that test fluid which remains on the surface
46

ifor 2 seconds with sharply defined edges, without contracting or
without spreading.
According to this measuring method, of the listed dielectric,
FEP (fluoroethylenepropylene) has the lowest surface tension of
about 20 mN/m. Then follows polypropylene with a surface tensionof 30...31 mN/m. Polyethylene terephthalatej polycarbonate and
polyimide belong to those materials which, already without any
pretreatment of the surface, have a surface tension of 42...
45 mN/m .
Investigation of the metallizing capability of the foils
showed that the adhesive strength of the metal on the surt'ace as
well as its condensation rate depend on the surface tension of the
foil. Thus, for identical vaporization parameters less than half
of the metal condenses per unit time on FEP then on polyethyleneterephthalate. More accurate conductivity measurements of the
vaporized metals showed that, for good condensation requirements
the surface tension must be at least 35 mN/m. For the adhesive
strength of the Al-coat we obtain a steep increase between 35
and 40 mN/m.
The adhesive strength was measured by first pouring epoxy
resin blocks onto the foil and subsequently peeling off the foil
from the blocks with measurement of the required force. For this
foil strips of about 1 cm width were cemented on the metallized
side (e.g. aluminum) with epoxy resin blocks. The adhesion between
epoxy resin block and metal was always greater than the adhesion
of the metal on the foil surfaces. It was determined empirically
that for the production of capacitors an adhesive strength of the metal
layers on the plastic foil with a tear-off force of 2 N/cm
is sufficient. As described in the following, this tear-off forcecan be achieved for polar foils without pretreatment, for unpolar
foils by glowing or by sputtering.
4,7
6.2.2 Methods for improving the adhesive strength ofthin metal
lavers on plastic foils
Polar carrier foils possess a sufficient surface tensionso that metal vapor deposition is possible without special surfacetreatment. However, they are often prone to greater moisture
pickup which can affect the adhesive strength of the metal layer.
Thus, for instance, polyimide, has a high surface tension and anexcellent temperature constancy, so that during the vaporization
process no thermal decomposition products are produced. Its
moisture pickup, however, is considerable (about 3%). Thus, beforemetallization polyimide must be dried for about 3. week at 1000
under vacuum. If one omits this step then, during vaporization
with metal under high temperature stresses,the water vapor present
in the foil evaporates and forms an intermediate layer of metal
hydroxide between foil and .metal. This intermediate layer prevents
a satisfactory adhesion of the metal. In addition a glowing
bluish discoloration of the metal coat becomes visible which can
be attributed to partial oxidation. Are improvement of adhesion
of metal layers on unpolaced foils could be achieved by measures
in which polar groups or condensation nuclei were generated on
the foil surface to which the metal atoms could adhere. This can
be done, e.g., by exposure to glowing in an oxygen-containing
atmosphere, in the same apparatus in which the just describedpolymerization processes take place= or one can expose the carrier
foil to a so-called "silent discharge" at atmospheric pressure.
The best results were achieved when the foil was previously
subjected to a sputtering process. For a sputtering material
we used either the same metal as was used for vapor deposition
(primarily aluminum) or a metal with higher atomic weight, such
as nickel. The metal atom penetrates during sputtering into the
soft plastic surface; the penetration increases with increasing
atomic weight. The sputtered metal quantity can be extremely
small (no cohesive, conductive layer need be formed). During
the subsequent metallizing the sputtered atoms act as condensation
48

R
nuclei and effect a firm clamping of the metal coat with the carrier
foil. In general, surfaces which can be easily metallized have
good adhesion, such as epoxy resin. Non-pretrbited polyp-ro^-
pylene surfaces do not, for instance, adhere to epcxy resin.
However, if one pours onto the sputtered polypropylene epoxy
resin, hardens it and attempts subsequently to pull the foil off
the epoxy resin, the foil tears and the polypropylene layer
remains on the epoxy resin block.
The most detailed irfvestigations for improving adhesive
capability by means of sputtering were conducted' with fluoro-
ethylenepropylene (FEP). Nickel was used as the sputtering material.
The following correlations between sputtered nickel layer and the /a,4
forced pull-out of the aluminum layer was found.
Table 9 Adhesien of Al-vapor deposited layer on FEP as a function
of a sputtered intern,,:diate layer
Thickness of the nickel Layer
0.13 nm
0.25 nm
0.5 nm0 . 75 nm3 nip►
30 nm
Force required to pulloff the Al-layer(vapor deposited)
1.8 N/cm
2 N/cm
3 N/cm
3.1 N/cm
4 :N/cm
4 N/cm
It was sufficient to sputter on a few atomic layers of a metal.
This did not measurably increase the surface conductivity of the
plastic foilt however, the adhesive strength of the metal electrode
vaporized onto it was sufficient.
49

6.3 Adhesion problems of the polymer layer on the meta
carrier
6.3.1 Increase of the adhesion strength of layers by means of
dipole containing structures in the monomer gas
For dielectric layers with a thickness below 0.3 µm adhesion
on the metallized carrier by means of the measures described in
the fourth section, suoh as de-gasing of the reaction vessel,
drying of the carrier foil, and the removal. of water and oxygen
from the monomer, was already sufficient to be able to employ
them as capacitor dielectrics.
To improve the adhesion strength of thick layers adhesion
promoters had to be used. Silanes are an example of promoters
between organic and inorganic layers. A direct application of
such compounds onto the Metal surface, however-, brought no
improvement of adhesion. Therefore, an attempt was made to
start directly from the glow discharge and to achieve the desired Zeffect by the addition of monomer gas. These additives must
possess a high dipole moment in order to bond with the substrate
and, by themselves, make worse the electrical. properties of the
glow polymeride. Therefore, only extremely thin boundary layers
(^5 nm) were provided with dielectrically unfavorable additives.
The procedure was such that in a supply container material, such
as silane, organic substances (e.g. aldehyde, alcohol) or mixtures
thereof were mixed in a ratio of 1 1 103 with the monomers for
the glow discharge. This mixture was then added to the main ?as
stream which led into the discharge apparatus. For a working
pressure of about 1 mbar the partial pressure of the additives
could be controlled down to 10-5 mbar.
The improvement in adhesion that was achieved by the
formation of such a mixture in the boundary surfaces, was
sufficient in conjunction with the cited measure for improving
50

the layer quality for dielectric thicknesses 30.5 gm. At thepresent state of development thicker layers are of no greatimportance.
6.3.2 Occurance and prevention of separating layers betweenMetal coa tipgs and glow poly„me_ides
Thicker carrier foils with sufficient temperature resistance
(> 1500C), such as polyethylene terePhthalate, could be vapor
deposited with aluminum to form adhesive coatings with any required
conductivity, for capacitors, up to 20 S/13(0.7 µm). Thermally
sensitive foils, such as polypropylene of 6 µm thickness or even
thinner carrier foils (0-3 µm) from polyethylene terephthalate,which were to be used in capacitors for reason of high energy
density, could not be wound as problem-free during the metallizationprocess as thick roils. Thus, for inBtgnee, wrinkles developed
which did not have a heat conducting contact with the cooling
roller during the metallization process. In these places over-
heat damages can arise during the production of thicker vapor
deposit layers. These can not be seen directly. They lead to a
poor adhesion of the glow polymer layer on the metal coating.
As shown by investigations the poor adhesions can be attributedto intermediate layers which form from the decomposition productfrom the carrier fail during the m4btallization process.
By means of tests the limits of the coating thicknesses
were established below which the thermal stresses were so low
that no decomposition productproduct from the carrier foil developed
and that, thus, no separating layer arose. For the most often usedvaporizing metal alimnum the limit for thin polyethylene
terephthalate was 1.5 S/O , for polypropylene 1 S/p .
As shown by infrared spectroscopic analyses the polymerization-
deposited layers differed from each other as a function of the
metallizing thicknesses lying below. As an example let us compare
51

M<
the hexafluoropropylene layers which were deposited on 2 different
polyethylene terephthalate carriers. One carrier was metallized
with 1 S/p , a second one with 10 S/O . The extinction curves
of the two samples were considerably different.
Practically only the bands of the C F-oscillation at a
wave length of 8.2 µm and the CF-CF 3 oscillation at 13.8 µm were
identical. In all cases a band appeared at 5.8 µm for the
0x0-valence oscillation which, however, was considerably weaker for
the first sample (thin metallizing) than for the second one
The C=O bands could be attributed, in part, surely to oxygen
containing impurities in the starting monomers and to the 02
partial pressure in the glow discharge. For the second sample,
however, the predominating part came from the carrier foil.
Furthermore we found in this sample bands at 9.1 µm, 10.3 µm,
11.5 4m, 11.8 µm, which are typical for the decomposition product
of polyethylene torephthalate.
7. Production of capacitor prototypes
7.1 Introdution
In parallel with the development of the technology of their
production the thin glow polymerization layers were also tested
for their application potential as capacitor dielectrics. In
order to keep the expenditures for coating development as low as
possible, many important tests, as described before, were made
with model capacitors Ord section). However, in order to be able
to test the behavior of industrial capacitors, the production of
such capacitors and their testing was necessary. Thus, for
instance, the problem of contacting of the thin metal layers as
well as the endurance behavior had to be tested with industrial
capacitors. For that purpose 2 types of wound capacitors were
produced which are described in the following.
52

7.2 Production of wound capacitors
The steps for achieving such wound capacitors were as follows:
First plastic carrier foils were vapor treated in several capacitor
pathwidth with aluminum in the form of strips. The conductanceof the metal layer on the active capacitor surface was between
0.2 and 0.5 S/p . The ed6e of the metal layer to be contactedal`o,ays had a conductivity > 0.5 S/p . This was ;Followed by theapplication of a glow polymerization layer acroos the entire width
of the foil. Subsequently, the wide foils were cut into small
strips and wound together as shown in figure 19. The front faces
of these windings were contacted with conventional Schoop methodsl
one connecting wire each was then soldered to these front-side
metal spray layers. Subsequently, the capacitors were dried and
built into aluminum tubes with epoxy resin seals at the front side.
As dielectric layer we used predominantly glow polymeride made from
cyclohexane because of its high deposition speed, as described in
section 4, and its good regeneration capabilities. Its dielectric
constant was about 2.5. As carrier foil we used 6 µm polypropylene
in the first test. For a dielectric layer thickness of 50 nm
on each carrier we obtained a physical volume capacitance
(capacitance per effective volume range) of 17 4F/cm3 . In this
construction the capacitance of the carrier foil is parallel to
the capacitance of the thin layer and contributes about 2°I to
the total value.
By switching to the mechanically and thermally more stable
polyethylene terephthalate it became possible to coat even 3 µm thick
carrier foils without problems. For equal dielectric thickness
(2 x 50 µm) physical volume capacitance could be increased to
34 µF/cm3.
An additional increase of the volume capacitance was
obtained when^the construction of the capacitor was changed in
accordance with figure 21. For this the entire capacitor system,
53

consisting of 2 metal coatings with an intermediate polymer layer,
was applied in a multiple path width onto a single carrier foil
(figure 20) and subsequently separated into individual paths.
In this way, the air space # which in a construction as shown infigure 19 reduces the capacitance for extremely thin dielectric
layers appreciably, was eliminated by a metallizing process onto
the dielectric. The use of only a single foil produced technical
advantages during the winding process.
The capacitors of this construction had, for instance,
with a carrier foil thickness of 3 µm and a dielectric thickness
of 110 nm a physical volume capacitance of 68 4F/em 3 . This volume
capacitance is greater than those obtained in capacitor technology
with organic dielectrics by a factor of about 3.
Because of their favorable volume capacitance and the
technical advantages during winding the subsequent investigations
were conducted only with capacitors which were produced from a
single carrier foil. Here the technical construction of the
capacitors was as follows:
From the foiled path Pas shown in figure 20 ,,10 mm wide stripswere cut and were processed iW^^o round coils. For insulation- and
contact protection several empty starting and end reel sections
made of insulation foil were wound on. By spraying on of an
aluminum layer onto the front faces of the coils (methods according
to Schoop) the thin vapor deposited electrodes were contacted.
A white metal layer was sprayed onto this aluminum ] s ayer in orderto produce a layer nor the connecting wires which could be
soldered or welded. After the wires had been soldered to the
sprayed-on metal layer the coils, as described, were installed
into aluminum tubes with epoxy resin seals on the front side.
For the tests conducted a magnitude of the capacitance
was 5 to 10 µF. As dielectric we used exclusively polymerized
cyclohexane with a thickness of 110 nm. Typical exterior dimensions
54i
r.
M
of a capacitor built into aluminum tubes with a capacity of 8 µF
were diameter of 7 mm and length of 20 mm.
7.3 Capacitor properties
The properties of the capacitors are determined not only
by the thin polymer dielectric but they are also affected
considerably by the relatively thick carrier foil. Lo gs factor,
behavior during over-voltage, and dielectric constants are
predominantly properties of the glow ,polymerides. The temperature
coefficient of the capacitance, the behavior during temperature
shocks and during constant exposure to increased temperatures
are primarily determined by the carrier material.
The expansion coefficient of the carrier foil (+140 • 10- 61 )is larger than that of the doss-linked glow polymeride. One can
recognize the lower coefficient of expansion of the glow polymeride
by the behavior of the coated carrier foil during temperature
changes. During cooling the carrier foil contracts more than the 60
dielectric layer and shows a tendency to roll up in such a way
that the polymera,zation-deposited layer is found on the outside.
As a mark of quality one can consider the behavior during temperature.
shock. The capacitors were exposed in temperature change tuts
each time 30 minutes to a 1000 C environment and 30 minutes to a
-400 C environment without intermediate storage at room temperature.
Here, after only a few changes, about 20% of the construction
elements exhibited inst,ration decreases to below 10 Mid , which
can be attributed to the mechanical deformation of the coils
by the effect of temperature.
These insuration drops, however, can be avoided if the
capacitors are subjected to a tempering process at 130 0 C to 1400C
for one hour with a simultaneous application of 20 Veff alternating
voltage. PresuAably, weak places in the dielectric become evident
here and are healed by the applied voltage. After this treatment
the insulation values were, even after 50 shock-like temperature
55

r^ lk
changes between -4000 and +1000 C, above 10 000 MO x g.
The temperature coefficient of the capacitance (TX,) ofcapacitors with a glow polymeride made of pure hydrocarbon is
positive (figure 22) and lies in the temperature range-200 C... +250C between +500 and +boo • 10-6/K (1 kHz). Thepositive TKc results frrm dipoles in the dielectric; it is stillincreased because of the higher coefficient of expansion of thelayer carrier as compared to the cross-linked glow polymeride
(see ,above).
The frequency dependence of the capacitance is the highest
at low temperatures and decreases uniformly to higher temperatures.At -400 C the decrease in capacitance for an increase of frequency
by a factor of 10 is about 1% 9 at +1000 C it is only 0.3 to 0.4%
Loss factor measurements with capacitors of such great
/61
capacitance could be conducted up to 10 kHz. The inner resistances
of the measuring instruments are too high for investigations with
higher frequencies. However, already at 10 kHz the loss factor
is increased because of the resistance of the coatings and the
connecting lines. Figure 23 presents the loss factor curve for
the temperature range from -400 C...+0000.
It can be seen that the tan6 in the temperature range
investigated shows no sharp maxima. Even measurements up to
1500 exhibit similar loss factor values. This behavior can be
attributed to the amorphous structure of the layers and the irregular
length of the side chains which thus become mobile at different
temperatures.
The dielectric loss factor is a sensitive proof for the
degree of purity of the glow polymeride. If during the coating
process the supply of fresh gas is too low, which can not necessarily
be determined by the growth rate and the thickness uniformity,
56

then the loss factor increases over the entire range investigated.
Basically various properties; such as moisture behavior and
capacitance changes during storage at elevated temperature,
can be improved by vacuum tempering at 150 0C (l to 2 hours)directly after the production. This improvement is probably
based on the fact that, at first, there are present in the layer
radicals with unsaturated val=es, which become saturated during
tempering and which stabilize the layer.
All Vhe results described here were obtained with layers
from hydrocarbons of the formula (CH 2 ) n. The dielectric propertiescan be improved considerably if one resorts to perftuorinated
monomers during the production of the coating (section 3).
Regeneration difficulties developed, however, which prevented
a sufficiently high insulation in a compactly wound -capacitor of
large capacitance (in contrast to the model capacitors described
in section 3). The cause for these difficulties is presumed to be
the high temperature stability of the dielectric coating which is
considerably greater than that of the carrier foil. It seems
that, if a weak place with poor insulation and high current glow
forms,the carrier foil will heat up to such an extent, before the
self-heating process with vaporization of the dielectric and the
electrode sets is, that local melting zones are formed which
release irreversible short circuits even in the thin dielectric
layer lying above it. In order to avoid these difficulties
capacitors with layers made of monomer mixtures (pure hydrocarbons
and perfluorocarbono) were produced as described in section 4.
By means of these layers coils of great carlaQitance
with satisfactory insulation ( > 4000 MQx pF ) and low loss factors( tan6,^^)I•r = 2.10`3 ) were achieved. In addition a TKc of closeto 0 could be established.
57{
62
"T4
7.4 Duration tests with capacitors
To investigate the capacitor properties it is also necessary
to conduct endurance tests. The difficulty in the case of the
present development lies in the multiplicity of the possibleParameters and the frequent changes which had to be made not only
in the production of the dielectric layers but a.'L, ao for Chat of
the capacitors. The effect of each one of these changes can onlybe evaluated after endurance testing, regardless of potentially
excellent final values.
In order to reduce the large number of possibilities to an
economically and technically justifiable measurep the endurancetests were limited, based on preliminary tests, to capacitor
construction with a single foil and with a dielectric made of
polymerized cyclohexane. In all cases the thickness of the
dielectric was 110 nm. As protection against coating corrosionthe test coils were installed into aluminum tubes with front -sideopoxy resin seals and then, as described, were tempered undervoltage.
The following tests were conducted with capacitance valuesbetween 5 µF and 10 µF:
Room temperature 12 V= and 10 V,.700C 12 'V= and 0 V
85°C 121 V= and 0 V1000C 12 V= and 0 V
A stress loading with 12 V signifies for these thin coatings
of only 110 nm thickness a field strength of 110 V/µm. For continued
operation such field strengths were only obtained in a few cases
with capacitors with thicker dielectric.
The voltage-free storage at elevated temperatures should
show whether, for instance, fault locations are formed by changes
58

in the dielectric or by mechanical stresses. Such fault locations
can lead to lower insulation if a subsequent voltage stress isso low that it does not lead to self-healing arcing. For low
endurance voltage stresses for which no self-healing arcing takesplace, a sufficient insulation is assured by means of the electro-
chemical self-healing /23/.
Tests at room temperature showed, ,for voltage free storage,
capacitance decreases of several % in 5000 hours where the
reduction pros-ss is essentially completed after 1000 hours. <,4
Changes in insulation- and loss factor were not observed here.
Stresses at 10 V ti(50 Hz) and 12 V= produced the same capacitance
curve; the time constant of the insulation had values above 10 0 000 s.
Endurance tests at elevated temperatures also produced no
appreciable changes. Table 10 shows the insulation value and the
changes in capacitance after 5000 hours under the stated condit4.ons.
Table 10 Change in capacitance and insulation resistance
I[ t
after 5000 hours
700
85 o
100°0
OV 12 V 0 V 12 V OV 12 V
Change incapacitance M
Time constantof the insulationresistance (s)
-o.8 -o.8 -1.3 -1.4 -2.4 -2.5
25 9 000 25,000 18 9 000 20 0 000 16 9 000 20,000
For insulation we are dealing with average values measured
at room temperature and for a field strength of 100 V/µm. The
insulation values decreased slightly with increasing endurance
test temperature and are somewhat lower in voltage free storage
than during operation under voltage. These differences are already
59

pronounced after several 100 hours. Beyond that no important changes
can be observed and the insulation remains at a high value.
Similarly, the changes in capacitance have ended to a large
extent after 1000 hours. They result from two effects. First,
the shrinking of the carrier foil contributes to the decrease in
capacitance. This it evidenced by the fact that more tightlywound capacitors also exhibit lower decreases in capacitance.
In the second place the DZ of the polymerized dielectrics seem
to decrease somewhat. Presumably chemical groups present in the
polymerde with higher dipole moment (e.g. double bond) still
decrease their dipole moments afterwards by saturation processes.
The chemical conversion processes, however, are not
sufficiently significant that they result in a lowering of the
dielectric loss factor. This remains constant during the test
duration named within the framework of measuring accuracy.
The further continuation of these endurance tests produced
after till now :10,000 hours ,,no more essential changes with
respect to the above named tabulated values for capacitance
and insulation= and also no worsening of the loss factor.
60

Appendix 1
66
Referencest
/1/ E.G. Linder, A.D. Davis, J Phys. Chem. 35(1931) 3649./2/ R. Haefer, A.A. Mohamed, Acta Phys. Austr., 11(1957) 193./3,/ H. Carchano, Journ. of Chemical Physics, 61 (1974) 3634•/4/ A. Bradley, J.P. Hammes, J. Electrochem. Sac., 110 (1963) 1$.151 M. Stuart, Proc. IEE, 112 (1965) 1614./6/ R.A. Connell, L.V. Gregor, J. Electrochem. Soc., 112
(196$) 1198./7/ P.B. Weisz, J. Phys. Chem., 59 (1955) 464/8/ G.L. Gallet, R. Nannoni, P. de Valance, L'Onde Electrique,
50 (1970) 113/9/ T. Hirai, 0. Nakada, Japanese Journal of Applied Physics,
7, 2 (1968) 112/10/ S. Nahyama, T. Shiba, V. Mizoguchi, Nec Res. and Dev.,
21 (1971) 24.
/11/ H. Kobayashi, A.T. Bell, M. Shea, J. Appl. Polym. Sci.,
17 (1973) $85./12/ P. White, Proc. Chem. Soc., (1961) 337./13/ T. Williams, M.W. Hayes, Nature, 209 (1966) 769./14/ Stetter, G.i Dissertation TU Munchen 1964./15/ F. Seitz, The Modern Theory of Solids, McGraw Hill,
New York (1940)./16/ 1. Frenkel, Phys. Rev., 54 (1938) 647./17/ G. Lengyel, J. Appl. Phys., 37, 2 (1966) 807./18/ H. Frohlich, Proc. R.oy. Soc. A, 178 (1941) 493•/19/ G. Hoyler, Siemens Forsch. and Entwickl.-Ber. 3 (1974) 110./20/ H. Luy, F. Oswalk, ETZ-A, 92 (1971), 358•/21/ H. Heywang, Colloid and Polymer sci 254 (1976) 139./22/ J. Kammermaier, H. Hagedorn, Siemens Forsch. and Entwickl.-
Ber., 2 (1973) 26.
61

Referenceso
/23/ R. Behn, H. Heywant, J. Kammermaier, H. PreseingerSiemens Z., 36 (1962) 808
/24/ W. Vollmann, H.U. Poll, Thin Solid Films, 26 (1975) 201./25/ H.U. Poll, Z.angew. Physik, 29 (1970) 260./26/ W. Vollmann, Phys. Status Solidi (a), 22 (1974) 195-/27/ D'Ans Lax, Tasahenbuch f. Chemiker and Physiker, Vol_. 1,
Berlin-Heidelberg-New York, (1967)-
/28/ W. Bru"gel, Einfuhrung in die Ultrarotspektroskopie,
Darmstadt, (1969).
/29/ D. Hummel, F. Scholl, Atlas der Kunststoffanalys6,Ma'nchen, (1969) .
1301 L.J. Bellamy, Ultrarot-Spektrum and chemische Konstitution,Darmstadt, (1966).
Publicationst
/l/ H. Packonik
Production of thin glow-polymerized layers.
Thin Solid Filme , 38,2 (1976) 171.
/2/ H. Packonik, G. Seebacher
Properties of thin glow-polymerized 'layers
Thin Solid Films, 38,3 (1976) 343.
62

OF. ANAL PAW 13ON POOR QUAD Y
r wr
6 "A
T --
1 - supply rollers.- - for carrier foil
2 - windup rollers
-• 4 ~^ for carrier foil
3 - hollow electrodes
t\
5,11 0
54 - plastic electrode
0 covers with drilled
a holes for supply
`' 0 1 1 0 of reaction gas
^ 3G 't10
5 - turn-around rollers.p _^ I -
_ 36 - current supply
for electrodes_.4 7 - water connections
for electrode 000ing5` o - feedthroughs in
k 0 0r 5 reactor bottom for
0 connections and^^',^..^ pumpsGO)". 9 - glow discharge
M
F' is Buildup cf the glow polymerisation installation

c co CS
Rs Ro R5
figure 2: Substitute switch diagram of the glow disoharge path
Ca capaoitance of the insulation layer
Cg oapaoitance of the glow volume
R resistanoe of the insulation layer
R resistance of the glow volume
64

turn-around roller,e rf
^,. sectionieleotr. supply ileotr. suflnlY
electrode I
turn—around roller
./I--`Icarrier foil electrode
gas supply
1
t
porous layer --`[ -- gas supply
Figure Buildup of the electrodes and gas supply.
65
f

-to
electrodes
T+ice re, t Buildup of the capacitor models (schematic)
w
F
66

10'1
A
cm^
10 `^
ILI - 10
A
x
Z,7°
xo
/n^ivo lc
x
x
Figure 5_
x.0
Current density-voltage
diagram of cyclohexaneo polymeride at various
temperatures(thiokness = 100 nm)
0
0
2 5'C
10-11
10'1=
0'11
0 2• 67

I
•
•
•
•
x
/x
130'C •
x
10 0'Cx o
/x70'C F, re ,6s
c Current density-voltagediagram for perfluoro-oyolobutane polymerideat various temperatures'
,^... (thiokness s 100 nm)
0
25%
10'A
C m'
10'
10.E
10.10
10.11
10'11
10 *11
68
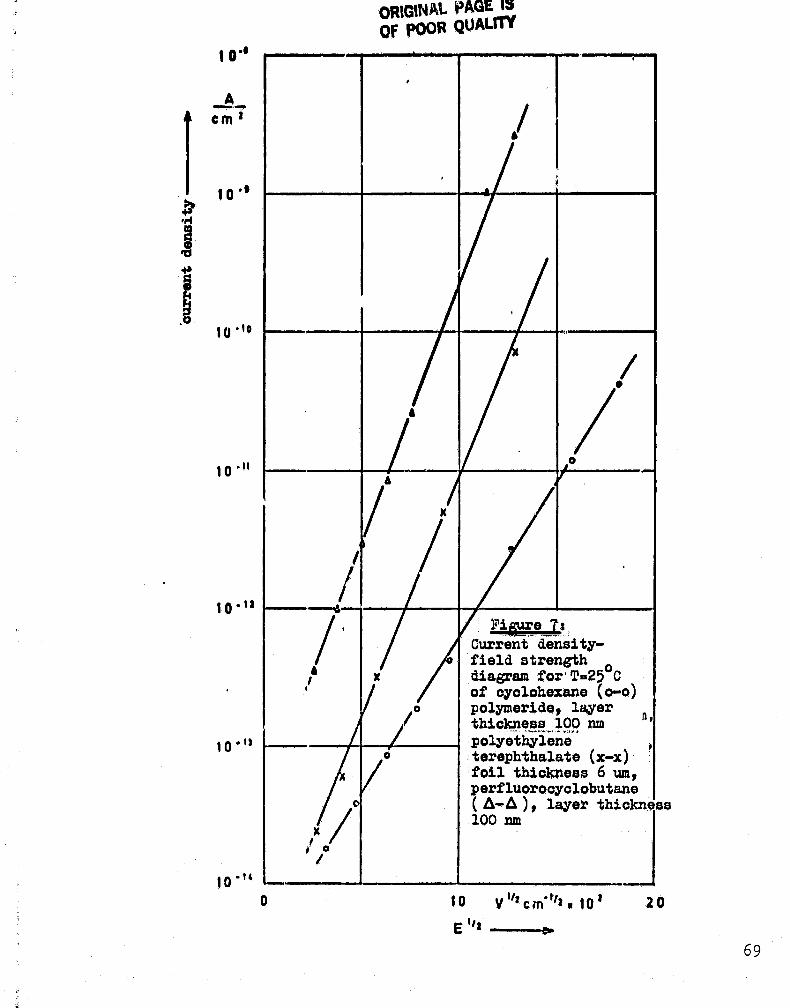
OROGINA^ QUALITYOF
10'9
A
em'
10"
♦T10'10
10.11
10.11
10 •13
,
1 h
•
•
O
s
x
Fi ^e_wCurrent density-field strength•
x °Cdiagram for , T-25of oyclohexane (o-o)
/o polymeridep layerthickness 100 nmpolyethyleneterephthalate (xx)foil thickness 6 um,perfluorooyclobutane
o
/( A-0 ) p layer thioknei
100 nm
i o
Is
10 Y it?
c?n*"I
- 10^ 20
EII= ----e•
10.14
0
69

♦2
0
-2
0
-20 0 • 20 40 60 00 9 C 100P , temperature to
aa
Fimre 8: Capaottance curves of densely packed glow polymer capaottorswith hydrooarbon dielectric as a :Function o+ temperature
6
TA C 6/6
C
6
I I II tKC1MHtr$ItC.to's /11C I IKCIkHt'*300.10'0/9C '

Figure
IkCapaoitance curves of densely packed glow polymer capacitors
Ywith perfluorinated dielectric as a function of temperature
2
t
I ^ k C IYHI I 1 , ?NO th"I • • 110.10'0!'C
•. OOH 1611dI^^ ^^^^.I►1
I I I
I l
II
I
I
.2 q-40 - 20 0 .20 40 so 00 •C 100
temperature ._.._..l,.
71

100
so
60
40
20
00 200 600 600 000 1000 --1—
fie''-1 strength —r N m
Figure 10: Capao tanoe deorease of oondenser models with perfluorinated
glow polymeride layers under voltage stresses for various
dieleotrio thioknesses at room temperature
72
r^

Cpr
time ---^'^--
ri0u.
IJ0
R^ C^ =10sRz
`R ' C 2 = 2 s R3 CP r 2ms
Fig re 11: Measurement circuitry
. 100 M IJInternal resistance ofCpr test unit aapacitanoop Rj
the osoillographp R,. 1 N il r R2 = 100 K A 9 R3 . 2 Id n^
Cl : lC u FP C2 - 10 nF
Fib: Voltage curve at test unit for one arcing.
Heavy solid lines represent voltage curve at C2
recorded on the osoillogram
73

V O m p 0 O
i
N
3
a
v '^s
in1Q
IFQ
h12
EE — spode I no=nq To 84,xe
IM4s
%
W
i P,
'^4 1 O N O
>e
x
w
sx
r
i^4
I
i
74

60 —
V40
20 --
0
time ----^.....
Fibre 11A Aroing sequence for a series resistance of laM
Lower voltage level about equal for all aroingsp
upper voltage level strongly radiated because of lower
radiation velocity
75

E
Figge 1 1 Baergr usagesp referencedto unit capaoitance t ofglow-polAerieed capavi Torsas a function of arcingvoltage ,^xsolid line corresponds to •
2
E/a tJ` 1 Yk x x
V ^^ xe x
2
u ^.go xW ^^ k K
x103
B
^^ x x
M6
m 8eeA o
^, x 08 00 9 hg
00-A^.
o
o °o e
00 00 A
z e e
A
0
oe
x 1 ne / 0, stir
102 2 nF / 0, dam
8
e nH' / ^^, Vin,;o 0
o
6 0
a
A
F
2e
y °oV
1010 20 30 40 50 60 _ 70 eo 90 v 100 110
^.76
4

105
s ^e
EA
e
2 -
V 2
10^'e
i8 '
6
polyethylene tsrephthalatecapacitors (6 ja dielectric)
4 0, 2t nF
2 u 11p6 n F:
63 nF;
w103 -
►. 8
6
r
2
I'ignre 16: Comparison of the energy usagesp referenced to unit10 2 ^-^^ oapacitancev of single-layer capacitors with glow-
9 polymerized dielectrics of 0.15 and 0.3 11 m thicknesswith capacitors, also single layers having 6µ 1m thick
6 metallized polyethylene terephthalate dielectrics
4
x
2
JO IL-L I I-LIA., I I --I-- I-A-A-1 I
10 12 4 6 0 10 2 V 2 4 6 8 103
I arcing voltage +►
77

ORIGINAL PAGE t3OF POOR QUALJ?Y,
. yr
r_ro 17: Self-healing arcing in a glow-polymerization layer(raster-elsotron microscopic piotureq 1000 s 1enlargement)
78

It 3
0
20 40 60 s0 a
relative molecular mass ---♦'aI
ii20 13 CIS, 14 " 121 15 i C"J , 17 OH, 18' = H2Ot
='S " Cc2.!!, .?fi ^` C2 ! i2 ► 27 = C2H 3r 2e C 2 Ii40 32 02 ►39 ^ C3 113 , 42 = C3 116 , '56 = C411bo 70 t C5 VI IO► 64 !2 12
Figure 18: Mass spectrogram of cracked products of a hydrocarbon.
(assigrv,gnt of the radicals to recorded relativemolecular mass)
79

oarrior foL
metal layer
Fib 19i Buildup of a wound aapaoitor from two oarrier foils,eaoh having one glow polymerization layer
80

Gaeta coati
dielectri c layer'
I I I 1 0 1 ,
Lzrier foil
toAting
+i^e_20_: Sketch of a carrier foil with dielectric and metal coatings
metal coating
glow polymeride
metal coating _--- carrier foil}
Figu^ re 1: Buildup of a wound, capacitor from a carrier foil withglow -polymerization. dielectric
ii
i is
^1

5QCC
& 1 1 1
6--tots IbI41 •S00010 .0 1 6C --+ --- TKCIYNt "500.10*/'C. /0
2 ( rrI50Nt1 ,^. ^'^ .i 1 ► Nt( ^,^r• ^,i • ^101Rit
1 ^ • I"1r'^I •^•^ ^^r
0 0 0' .'•
/ 00 00*•
l/ / /
-2 040
V.
40 -20 20 40 G0 60 .0 100
temperature ,
Figure s Capacitance curves of capaoitors with a dielectric from glow-polymeride
(cyclohezane 100 nm) as a function of temperature and frequency
82
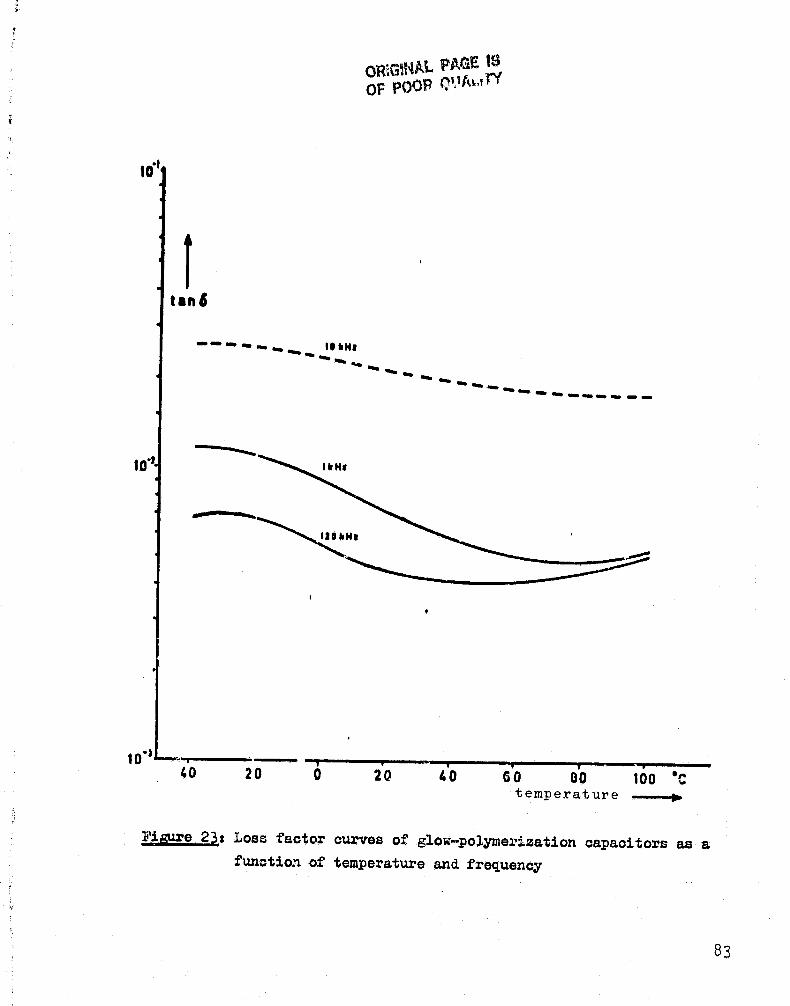
^a.
../Kitasma
20 0 20 LO 6000 100 '.temperature ^.._._.^.
Figure 23t Loss factor curves Of glow polymerization capacitors as afunction of temperature and frequency
83
iQ