Embed Size (px)
Citation preview
EN EN
EUROPEAN COMMISSION
Brussels, 7.4.2016
SWD(2016) 120 final
COMMISSION STAFF WORKING DOCUMENT
Country Report Cyprus 2016
Including an In-Depth review on the prevention
and correction of macroeconomic imbalances
This document is a European Commission staff working document. It does not
constitute the official position of the Commission, nor does it prejudge any such position.
Executive summary 1
1. Scene setter: economic situation and outlook 4
2. Imbalances, risks and adjustment issues 14
2.1. Financial sector 14
2.2. Private indebtedness 23
2.3. External sustainability 36
2.4. Sustainability of public finances 41
2.5. MIP assessment matrix 46
3. Additional structural issues 49
3.1 Obstacles to growth 49
3.2. Labour market, education and social challenges 55
3.3. Public sector 65
3.4. Energy, environment and climate 73
3.5. Health care sector 76
A. Overview table 78
B. MIP Scoreboard 80
C. Standard tables 81
LIST OF TABLES
1.1. Key economic, financial and social indicators - Cyprus 13
2.1.1. Financial robustness indicators 17
2.1.2. Debt restructuring targets 18
2.1.3. Quantitative assessment of Cypriot banks' restructuring process 19
2.5.1. Macro imbalances procedure: assessment matrix 46
3.1.1. Research and development indicators for Cyprus 54
B.1. MIP Scoreboard 80
C.1. Financial market indicators 81
C.2. Labour market and social indicators 82
C.3. Expenditure on social protection benefits (% of GDP) 83
C.4. Structural policy and business environment indicators 84
C.5. Green growth performance 85
CONTENTS
LIST OF GRAPHS
1.1. Growth of GDP and components 4
1.2. GVA and contributions by sectors 4
1.3. Employment, Unit Labour Costs and unemployment 5
1.4. Current account balance and components 6
1.5. Credit growth and interest rate on outstanding loans by sector 6
1.6. Potential growth and contributions 7
2.1.1. Evolution of banking sector assets in Cyprus 15
2.1.2. Liquidity support to banks in Cyprus 15
2.1.3. Deposits and non-performing loans 18
2.1.4. Non-performing loans, provisions and profitability (June 2015) 19
2.2.1. Evolution of private sector indebtedness 23
2.2.2. Growth in the private sector debt-to-GDP ratio (excluding SPEs), and contributions 23
2.2.3. Assets and income of indebted households 24
2.2.4. Household non-performing loans ratio1 24
2.2.5. House prices, cross country comparison with peaks aligned 25
2.2.6. House prices and disposable income 26
2.2.7. Household debt servicing ratio 26
2.2.8. Non-financial corporations non-performing loans ratio 27
2.2.9. Non-financial corporations ratio of debt (excluding SPEs) to liquid assets 27
2.2.10. Distribution of domestic loan stocks, September 2015 28
2.2.11. Growth in debt-to-gross operating surplus and non-performing loans by sector 28
2.2.12. Growth in profit mark-ups by sector 29
2.2.13. Investment and debt 30
2.2.14. Interest burden - Cyprus versus the euro area 30
2.2.15. Non-financial corporations surplus allocation 31
2.3.1. International investment position, gross 36
2.3.2. Net international investment position 36
2.3.3. Savings by institutional sector 37
2.3.4. Total investment 37
2.3.5. Current account balance 38
2.3.6. Net international investment position 38
2.3.7. Gross external debt 39
2.3.8. Cumulative trade balance adjustment 39
2.3.9. Cyclically-adjusted current account balance 40
2.3.10. Net lending 40
2.4.1. Primary balance (general government) 41
3.1.1. Real gross value added and contribution to growth by sector 49
3.1.2. Contribution to growth from labour utilisation 50
3.1.3. Contribution to growth from hourly labour productivity 50
3.1.4. Shift-share breakdown of productivity growth 50

3.1.5. Greenfield foreign direct investment 51
3.1.6. Investment 52
3.1.7. Ease of Doing Business world ranking, 2016 53
3.2.1. Employment and GDP growth 55
3.2.2. Breakdown of rate of change of unit labour cost 55
3.2.3. Labour costs and productivity developments compared 56
3.2.4. Skill-adjusted public sector wage premium 56
3.2.5. Labour force participation by nationality and sex 57
3.2.6. Unemployment by duration 57
3.2.7. Unemployment rate by skill level, age 15-64 (per cent) 58
3.2.8. Beveridge Curve 58
3.2.9. Unemployment rate by age groups (percent) 58
3.2.10. Overall performance of the education and training sector vs. EU average and targets 60
3.2.11. Percentage of low-achievers in basic skills (PISA 2012) 60
3.2.12. Percentage of vocational education and training students at ISCED 3 level 61
3.2.13. At-risk-of-poverty rate and its components 61
3.3.1. Government Effectiveness Index 65
3.3.2. Expenditure and revenue ratio (general government) 67
3.3.3. Total expenditure (general government) Difference Cyprus - Euro area 67
3.3.4. Compensation of general government employees 68
3.3.5. Gross fixed capital formation (general government) 69
3.3.6. Main mobile operator market share (%) 71
3.3.7. % of individuals using Internet at least once a week (2015) 71
3.4.1. Energy trade balances as a share of GDP 73
3.4.2. Industrial consumer energy prices 74
3.5.1. Private health expenditure (% of total health expenditure) 76
LIST OF BOXES
1.1. Inward spillovers to Cyprus 8
1.2. Investment challenges 10
1.3. Contribution of the EU Budget to structural change 12
2.1.1. Reform of the legal framework for private debt restructuring 21
2.1.2. The efficiency of the justice system in Cyprus 22
2.2.1. The Cypriot housing market 32
2.2.2. Title deeds issuance and transfer 34
2.4.1. Debt sustainability assessment 44
3.2.1. The Cypriot welfare reform 63

1
Following the end of the economic adjustment
programme for Cyprus on 31 March 2016, this
country report assesses Cyprus's economy in light
of the Commission's Annual Growth Survey
published on 26 November 2015. The survey
recommends three priorities for EU economic and
social policy in 2016: re-launching investment;
pursuing structural reforms to modernise Member
States' economies; and responsible fiscal policies.
At the same time, the Commission published the
Alert Mechanism Report that initiated the fifth
annual round of the macroeconomic imbalance
procedure, in which a number of indicators suggest
the possible presence of imbalances in Cyprus. The
Alert Mechanism Report identified issues relating
to the current account deficit, net international
investment position (NIIP), losses in export market
shares, private sector debt, and government debt,
which warrant further in-depth review. In the
present analysis, the Cypriot economy is
considered as it stands today, without taking into
account the economic effects of a possible future
reunification.
Cyprus benefited from an economic adjustment
programme, during which it emerged from
recession, stabilised its financial sector, and
consolidated its public finances; yet many
challenges remain. Considerable economic
imbalances, including an unstable and oversized
financial sector and fiscal imbalances, led Cyprus
to require financial assistance in June 2012.
During the programme, the European Commission
monitored the correction of imbalances in liaison
with the European Central Bank (ECB), and,
where relevant, with the International Monetary
Fund (IMF). Credit tightening and the need for
corporate balance-sheet restructuring led to a
contraction of the economy and, consequently, to a
surge in unemployment. Despite the many good
achievements during the programme, the crisis has
left legacy issues.
Reforms have started to bear fruit. The
economy reached a turning point in 2015, with
growth having resumed and unemployment
starting to decline. However, potential growth has
suffered from the recession and vulnerabilities
remain in several areas, particularly as regards
private and public indebtedness.
The recovery has been moderate and mainly
driven by internal demand, while inflation has
remained negative. Real GDP grew by 1.6% in
2015. However, in nominal terms, economic
growth was flat due to subdued price
developments, which are reflected in a negative
consumer price inflation rate (-1.6%). Private
consumption has been one of the main driving
forces of growth, with investment growth
(excluding ship registrations) remaining low,
government consumption contained, and net
exports still subdued.
Although the labour market has started
recovering, youth and long-term unemployment
remain high, in a context of slowly rising job
creation. The unemployment rate started to
decline slowly in 2015, while employment grew by
around 0.9%. However, youth and long-term
unemployment remain high, at 33% of the young
labour force and 7% of the total labour force,
respectively.
Investment is still dampened by high corporate
debt, and the housing market remains
depressed. Credit to the economy continues to be
subdued and banks struggle with a very high ratio
of non-performing loans (around 55% on loans to
households and non-financial corporations). This
high level of non-performing loans weighs on
banks' profitability and on their capacity to build
up capital buffers. New lending is constrained by
lack of viable projects in which to invest due to
high private indebtedness and non-compliance
with financial contracts. SMEs are overly
dependent on bank lending, while alternative
financing remains limited, which significantly
hampers their ability to invest and grow.
Regarding the progress in reaching the national
targets under the Europe 2020 Strategy, Cyprus
has either reached or is making progress towards
its targets on reducing greenhouse gas emissions,
increasing the share of renewable energy,
improving energy efficiency, reducing early school
leaving and increasing the tertiary education
attainment. On the other hand, progress towards
Europe 2020 targets on the employment rate,
investment in research and development and the
reduction of poverty and social exclusion appears
limited.
The main findings of the in-depth review
contained in this country report, and the related
policy challenges, are as follows:
EXECUTIVE SUMMARY

Executive summary
2
There have been major reforms in the
financial sector; notwithstanding, the ratio
of non-performing loans in the banking
sector remains high and constrains new
credit. Banks have drastically downsized their
balance sheets and thoroughly restructured
their operations. At the same time, bank
supervision was redesigned and strengthened.
However, the banking model remains based on
a strong exposure to foreign deposits, while
lending practices have not fully shifted away
from an overreliance on collateral towards a
more systematic use of risk-assessment tools.
Rising provisions weigh on bank profits and
capital base, while good investment
opportunities are hard to find, given high
private sector indebtedness and low payment
discipline. New legislation on sales of loans
and securitisation is set to allow a clean-up of
banks' balance sheets.
Private sector indebtedness is high and debt
reduction is proving very slow. The debt of
non-financial corporations and households, as a
share of Cypriot output, is among the highest in
the EU. This debt-overhang stifles investment
in the non-financial corporate sector, and
depresses property markets. Declining incomes
during the crisis have contributed to
widespread non-compliance with debt contracts
but cannot fully explain this phenomenon.
Reforms have been introduced, notably in the
areas of foreclosure and insolvency legislation
to help unwinding unviable debts and support
sustainable restructuring. However, the impact
of the new legislative framework in reducing
debt stocks has so far been limited. In
particular, existing inefficiencies of the court
system are among the factors that constrain the
efficiency of the new framework. The sharp
decline in house prices has depressed collateral
values significantly, limiting the scope for
borrowers to restructure debt through asset
disposal, and creating incentives for strategic
defaults. Further reforms to the still inefficient
- despite some measures taken - system of
issuance and transfer of title deeds are under
discussion among the authorities and relevant
stake holders, but an agreement had not been
reached by the time of this publication.
The net international investment position is
among the most negative in the EU, but risks
are significantly reduced. Foreign holding
companies and public debt account for a large
share of the negative international investment
position. Since these foreign companies
interact relatively little with the Cypriot
economy, they pose limited risks. Public debt
largely represents official lending by the IMF
and the European Stability Mechanism, the
financial support mechanism of the euro area
members, and is closely monitored in the
context of post-programme surveillance.
Nevertheless, without further export growth, a
return to the current account deficits of the past
could set the net international investment
position on an unsustainable trajectory.
While the fiscal outcomes under the
programme have consistently outperformed
the agreed targets, debt sustainability
remains subject to sizeable risks. Risks relate
in particular to a possible reversal of the fiscal
adjustment achieved under the program, to
adverse macroeconomic shocks, and to
insufficient implementation of fiscal-structural
reforms set out during the programme,
including the public administration reform.
Other key economic issues analysed in this report
which point to particular challenges for Cyprus are
as follows:
Productivity-enhancing investment has
persistently been weaker than the EU
average and is holding back growth. The
recession and still fragile banking sector have
further depressed investment, bringing it to one
of the lowest levels in the EU (as a share of
GDP). The lack of growth-enhancing
investment is also attributable to shortcomings
in the business environment, especially to poor
contract enforcement, long court proceedings,
administrative and regulatory burden, low
incentives for innovation, and limited access to
finance, in particular for SMEs. EU funds and
financial instruments have been available to
SMEs in Cyprus but the take up has so far been
limited, partly owing to inefficient local
coordination. Growth-enhancing strategies,
including also a privatisation plan for public
Executive summary
3
utilities, are in place but have not yet been
implemented.
Unemployment remains high, especially
youth and long-term unemployment. The
reduction of this high unemployment will take
time, also due to the limited capacity of the
public employment services, and limited
outreach of active labour market policies. The
Cypriot labour market and wage setting system
is relatively flexible, a feature that helped
rebalancing in response to the crisis. Wage
adjustment during the downturn has prevented
higher unemployment and safeguarded external
competitiveness. Discussions have recently
started about extending by law collective
agreements in some sectors (i.e. construction).
While such a change aims at setting minimum
standards in those sectors, in the absence of
valid representativeness criteria, it might make
the wage setting system less flexible and
prevent effective adjustment. The wage
indexation reform has not yet been fully
adopted by the private sector. Labour
productivity growth is subdued and skills
development is inefficient: spending on
education is above the EU average but
outcomes are relatively poor. Moreover,
participation in vocational education and
training is low and the system lacks employers'
engagement in the education of students.
The social situation has worsened during the
crisis, although given the size of the shock
that affected the economy, social indicators
have withstood relatively well. The share of
people at risk of poverty or social exclusion
peaked in 2013, but improved slightly in 2014.
However, income inequality and the share of
people living in low work intensity households
continued to increase. The successful
introduction of a guaranteed minimum income
in 2014 is an important step towards a better
targeted and more coherent welfare system in
Cyprus, but it is still early to quantify its effects
on social well-being.
The public sector is not fully efficient. The
public administration is marked by one of the
highest wage bills (as percentage of GDP) in
the euro area, but its efficiency (as measured by
efficiency indicators) remains average. In
particular, performance could be enhanced by
increased mobility, the introduction of
performance incentives, and increased
availability of e-government services. While
Cyprus' fiscal balances are back on track, there
are still inefficiencies in allocating spending
and collecting revenue. State-provided utilities
(the Cyprus Telecommunications Authority
and the Electricity Authority of Cyprus, in
particular) are marked by high prices and are
still relatively shielded from competition.
Cyprus's energy mix is heavily dependent on
imported oil, and resource efficiency is lower
than the EU average. Reforms in the energy
sector are set to increase energy efficiency by
diversifying the energy mix, opening up the
market and improving regulation, but
implementation has been slow. Although
climate policies are in place, respect for
environmental regulations is weak and Cyprus
lacks policies to improve its currently low
resource efficiency.
The Cypriot health care sector is
characterised by inefficiencies, which
constrain access to adequate and effective
care. The economic crisis led to an increase in
demand for public health care services,
exacerbating the problems of inadequate access
to care and ineffective care delivery in the
public health care sector, due to both low
funding and inefficient use of resources. At the
same time there is over-capacity on the side of
private health care providers. Such outcomes
contribute to allocative inefficiencies and have
led to a relatively high share of private
expenditures in total health expenditures,
mostly directed towards largely unregulated
private health care providers. More autonomy
for public hospitals and the creation of a
National Health System are among the
measures that have been discussed by the
authorities and stakeholders to improve the
adequacy and cost-effectiveness of the Cypriot
health sector, but which have not yet been
adopted.

4
Economic growth
Growth resumed in Cyprus in 2015, following
three consecutive years of contraction in real
GDP, but is still far from buoyant. Real GDP
was significantly hit by the crisis, declining by
2.4%, 5.9% and 2.5% in 2012, 2013 and 2014,
respectively. Yet several consecutive quarters of
expansion in 2015 confirmed that the deepest point
of the recession was past, with real GDP growth
for the year reaching 1.6%. Nominal GDP,
however, remained flat, having fallen by about
7.2% in 2013 and a further 3.7% in 2014,
following downward price adjustment. This low
inflation trend, accentuated in 2014 and 2015 by
lower energy prices, supported real private
consumption. The latter recovered relatively faster
than output, growing by 0.6% in 2014 and rising
further in 2015. The other factor contributing to
the resilience of private consumption was a lower
debt-servicing ratio, explained by a decline in
lending rates and an increase in the incidence of
non-performing loans. Low inflation also
supported tourism exports, but despite this, the
contribution of net foreign trade to growth has
remained subdued. In the course of
macroeconomic adjustment public consumption
was scaled down, while total investment fell
significantly in both 2013 and 2014. Only in 2015
did investment begin a very mild recovery (Graph
1.1).
Growth is expected to be stronger in 2016 and
2017, driven by both domestic and external
sources. It is forecast to gain momentum gradually
and reach 2.0 % in 2017(1). The support afforded
by low energy prices is expected to begin to fade
gradually in 2016, limiting the scope for
acceleration in the growth of private consumption.
At the same time, balance-sheet adjustments and
increasing investment are expected to assist a
return to more balanced growth. A shift towards
external demand as a source of growth relative to
domestic demand is also expected to facilitate a
reversal of the economy’s savings-investment
position and help unwind current imbalances.
(1) This value is taken from the European Commission's
winter forecast, which does not take account of 2015Q4
developments or of revisions of developments recorded in the first three quarters of 2015 that were published after the
forecast's cut-off date.
Graph 1.1: Growth of GDP and components
Source: Commission services
Graph 1.2: GVA and contributions by sectors
Source: Eurostat
Tradable services sectors, which rely
significantly on external demand, are leading
the recovery, while activity in the construction
and real estate sectors remains subdued. In the
wake of the housing market bust, declining output
in the financial, construction and real estate sectors
contributed significantly to the contraction of GDP
during the crisis. The recovery in 2015 was led
mostly by tradable services sectors (2), including
(2) In this analysis, tradable services sectors exclude
construction, real estate, financial services, public
-12
-8
-4
0
4
8
12
05 06 07 08 09 10 11 12 13 14 15 16 17
Net exports Investment
Priv. consumption Gov. consumption
Inventories Real GDP (y-o-y%)
forecast
pps.
-8
-6
-4
-2
0
2
4
6
8
1996
1997
1998
1999
2000
2001
2002
2003
2004
2005
2006
2007
2008
2009
2010
2011
2012
2013
2014
15Q
3
pps
Construction and real estate FinancialTradable services OtherTotal
1. SCENE SETTER: ECONOMIC SITUATION AND OUTLOOK
1. Scene setter: economic situation and outlook
5
tourism and professional services, which rely
significantly on foreign demand (Graph 1.2). In
these sectors, cost-competitiveness was supported
by low prices and the depreciation of the euro.
Activity in the financial, construction and real
estate sectors remained subdued well into 2015.
Price developments
HICP inflation has remained negative, owing
largely to falling energy prices, though also in
some measure to subdued core inflation,
reflecting the ongoing adjustment. Declining
wages and lower demand kept inflation low in
2013, and these effects were reinforced in 2014 by
lower energy prices which drove the HICP
inflation rate into negative territory. In 2015,
inflation fell further to around -1.6% as a result of
a further decline in energy prices and subdued non-
energy inflation. Despite low prices, profit margins
were supported by low wage inflation, which may
have helped firms in some sectors rebalance their
highly leveraged balance sheets and finance their
investment needs under tight credit conditions. In
2016 and 2017, consumer price inflation is
expected to rise slowly, as domestic price
pressures increase and the lower energy price
effect starts to fade away.
House prices are stabilising, but demand and
supply conditions indicate that the house
market recovery will be slow. The decline in
house prices, observed since 2008, eased
significantly in 2015. However, the market
dynamics are still weak on both the demand and
the supply side. On the domestic demand side,
credit conditions remain relatively tight,
unemployment is high, and households are over-
indebted. On the supply side, the stock of unsold
properties, which remains considerable, indicates
that pressure for prices to increase will remain low
for some time.
Employment and social inclusion
The labour market is recovering, but
unemployment is still high, with youth and
long-term unemployment a cause for concern.
Labour market conditions deteriorated
administration, health, and education, even though some of
these sectors attract foreign demand in Cyprus.
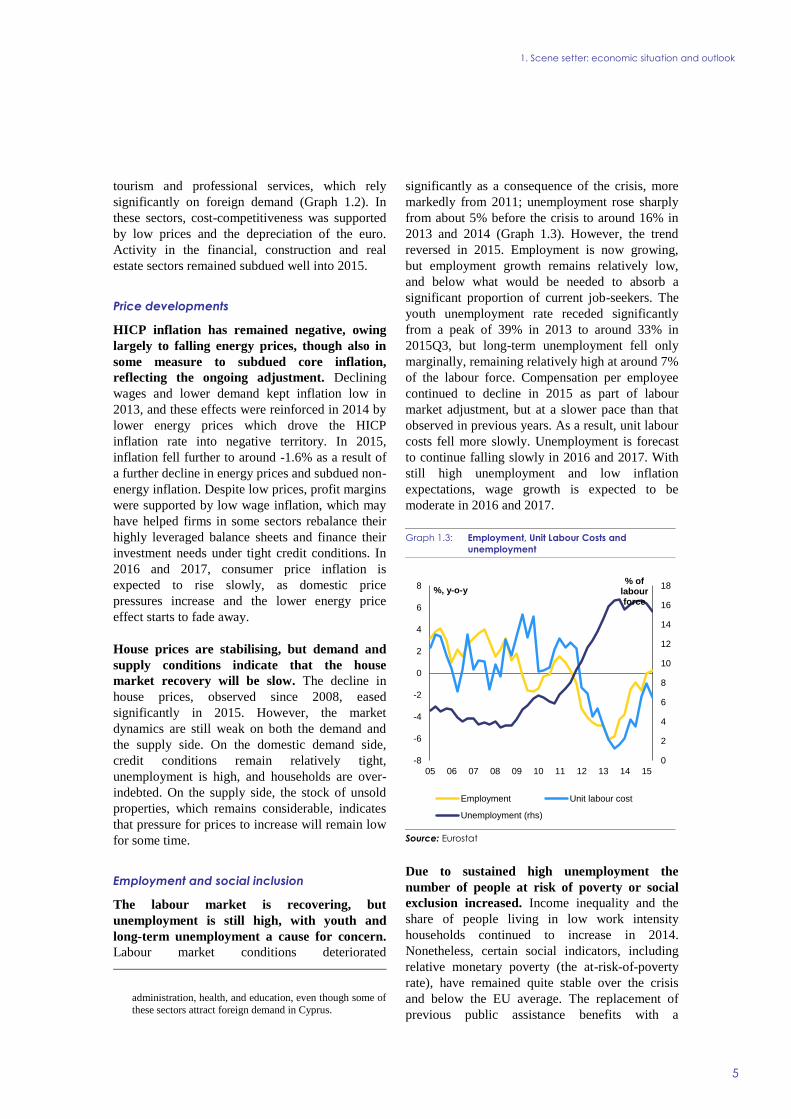
significantly as a consequence of the crisis, more
markedly from 2011; unemployment rose sharply
from about 5% before the crisis to around 16% in
2013 and 2014 (Graph 1.3). However, the trend
reversed in 2015. Employment is now growing,
but employment growth remains relatively low,
and below what would be needed to absorb a
significant proportion of current job-seekers. The
youth unemployment rate receded significantly
from a peak of 39% in 2013 to around 33% in
2015Q3, but long-term unemployment fell only
marginally, remaining relatively high at around 7%
of the labour force. Compensation per employee
continued to decline in 2015 as part of labour
market adjustment, but at a slower pace than that
observed in previous years. As a result, unit labour
costs fell more slowly. Unemployment is forecast
to continue falling slowly in 2016 and 2017. With
still high unemployment and low inflation
expectations, wage growth is expected to be
moderate in 2016 and 2017.
Graph 1.3: Employment, Unit Labour Costs and
unemployment
Source: Eurostat
Due to sustained high unemployment the
number of people at risk of poverty or social
exclusion increased. Income inequality and the
share of people living in low work intensity
households continued to increase in 2014.
Nonetheless, certain social indicators, including
relative monetary poverty (the at-risk-of-poverty
rate), have remained quite stable over the crisis
and below the EU average. The replacement of
previous public assistance benefits with a
0
2
4
6
8
10
12
14
16
18
-8
-6
-4
-2
0
2
4
6
8
05 06 07 08 09 10 11 12 13 14 15
% of labour force
%, y-o-y
Employment Unit labour cost
Unemployment (rhs)

1. Scene setter: economic situation and outlook
6
guaranteed minimum income is set to improve
social conditions, while reducing incentives for
welfare dependence.
External balance
The current account balance remains negative.
It deteriorated in 2015 as a result of weakening
demand from the country's main trading
partners and the recovery of import demand.
The Cypriot current account has improved
significantly in recent years, from about -15.6% in
2008 to around -4.6% in 2014 (Graph 1.4). This
improvement, however, is fragile as it relied
significantly on import contraction. Data for the
first three quarters of 2015 shows already some
deterioration, due mostly to a worsening balance of
goods. The balance of services also worsened
somewhat, reflecting the negative impact on
tourism receipts of lower Russian tourist arrivals,
and of weakening world trade. At the same time,
trade balances also reflect a recovery in import
demand.
Graph 1.4: Current account balance and components
Source: Eurostat
Rebalancing Cyprus's very negative net
international investment position remains a
challenge. Cyprus's NIIP remains among the most
negative in the EU, at around -140% of GDP.
Despite the significant improvement in the current
account, deficits around 5% of GDP can only
stabilise Cyprus's net international investment
position at its current very negative level.
Private and public debt
Private debt-to-GDP ratios are among the
highest in the euro area. Private debt in Cyprus
has been steadily growing as a share of GDP since
2004, reaching over 340% of GDP. Some of this
debt (about 75% of GDP) corresponds to the
liabilities of special purpose entities (companies
registered in Cyprus but with most of their
operations abroad), which are counted as residents
according to ESA 2010, but whose links with the
domestic economy are limited. Still, the remaining
debt is also high, both for households (130%) and
for non-financial corporations other than special
purpose entities (140%). Notwithstanding the
deleveraging pressures of existing firms, credit
availability is still important, however, to promote
new viable businesses, increase business
dynamics, and foster the R&D and innovation.
Graph 1.5: Credit growth and interest rate on
outstanding loans by sector
Source: European Central Bank
Credit growth is constrained by the private
sector debt overhang and a very high level of
non-performing loans. Declining incomes, in
conjunction with excessive borrowing of the past
and poor contract enforcement, exacerbated the
problem of non-performing loans in the banking
sector, which now affects about 55 % of the
portfolio of loans to households and non-financial
corporations. Even as credit stalls, the stock of
non-performing loans keeps rising, largely owing
to the capitalisation of interest accrued on unpaid
debts. Enhanced restructuring efforts in 2015,
-40
-30
-20
-10
0
10
20
30 % of GDP, 4-quarters
sum
Secondary income GoodsPrimary income ServicesCurrent account (BPM6)
0
1
2
3
4
5
6
7
8
-10
0
10
20
30
40
50
08 09 10 11 12 13 14 15
%, interest rate
%, y-o-y
Loans to householdsLoans to non-financial corporationsInterest rate for non-financial corporations (rhs)Mortage rate (rhs)
1. Scene setter: economic situation and outlook
7
together with the enforcement of the reformed
foreclosure and insolvency frameworks and the
implementation of the recently adopted legislation
enabling the sale of loans by banks, are expected to
bring a new dynamics to the rebalancing of
financial balance sheets. A rebalancing towards
better asset quality is set to enable banks to fulfil
their role in financing productive investments in
the future. To date, credit growth remains subdued
for both households and corporations, despite a
significant reduction in lending rates (Graph 1.5).
Public finances have been consolidated to a
large extent to secure the sustainability of
public debt. Net of one-offs related to banking
sector recapitalisation, the headline deficit is
expected to have been reduced by about 5 ¼pps of
GDP over 2012-2015, while from 2016, the
headline balance is projected to remain in positive
territory. This reflects the consolidation related to
the economic adjustment programme, which
required significant fiscal effort, covering all main
categories on the expenditure and revenue sides. In
addition, structural reforms, some of them in the
fiscal area, are set to contribute to ensuring strong
fiscal governance in the post-programme period.
The debt-to-GDP ratio peaked at 109% of GDP in
2015. It is expected to decline gradually after that,
supported by the economic recovery and primary
surpluses. This downward trajectory is, however,
subject to risks, stemming in particular from delays
in implementing the privatisation and the public
administration reform agenda.
Potential growth
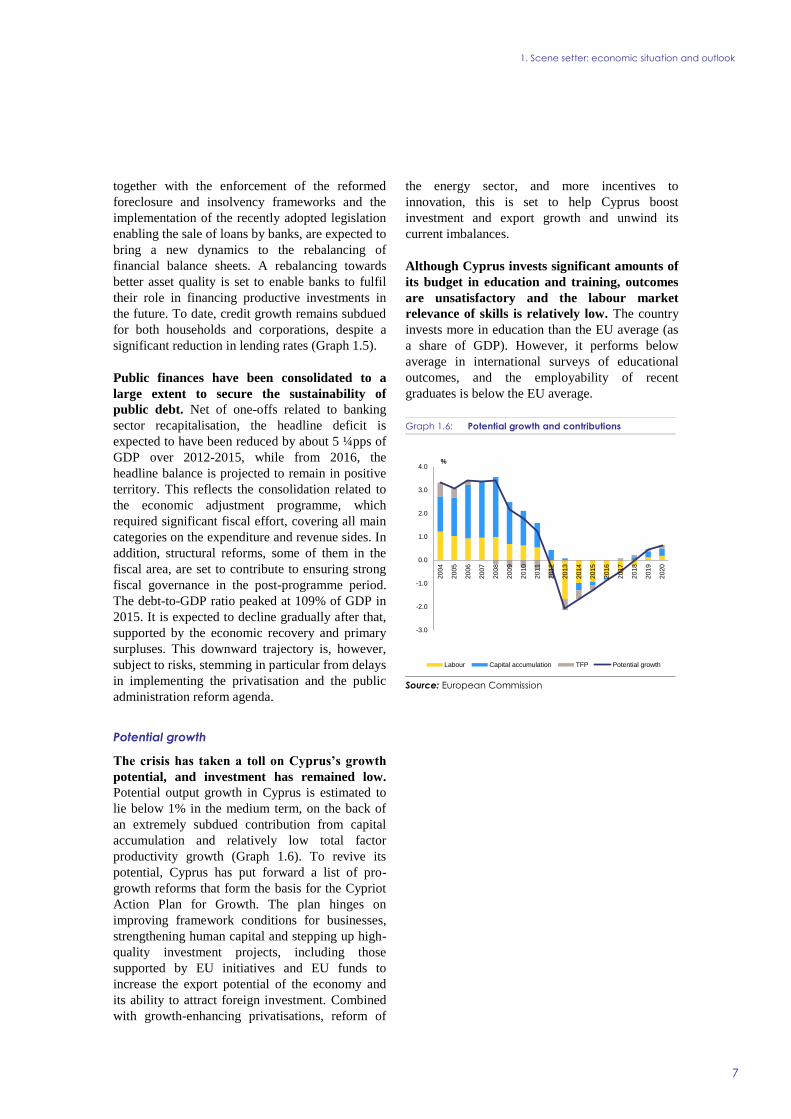
The crisis has taken a toll on Cyprus’s growth
potential, and investment has remained low.
Potential output growth in Cyprus is estimated to
lie below 1% in the medium term, on the back of
an extremely subdued contribution from capital
accumulation and relatively low total factor
productivity growth (Graph 1.6). To revive its
potential, Cyprus has put forward a list of pro-
growth reforms that form the basis for the Cypriot
Action Plan for Growth. The plan hinges on
improving framework conditions for businesses,
strengthening human capital and stepping up high-
quality investment projects, including those
supported by EU initiatives and EU funds to
increase the export potential of the economy and
its ability to attract foreign investment. Combined
with growth-enhancing privatisations, reform of
the energy sector, and more incentives to
innovation, this is set to help Cyprus boost
investment and export growth and unwind its
current imbalances.
Although Cyprus invests significant amounts of
its budget in education and training, outcomes
are unsatisfactory and the labour market
relevance of skills is relatively low. The country
invests more in education than the EU average (as
a share of GDP). However, it performs below
average in international surveys of educational
outcomes, and the employability of recent
graduates is below the EU average.
Graph 1.6: Potential growth and contributions
Source: European Commission
-3.0
-2.0
-1.0
0.0
1.0
2.0
3.0
4.0
2004
2005
2006
2007
2008
2009
2010
2011
2012
2013
2014
2015
2016
2017
2018
2019
2020
%
Labour Capital accumulation TFP Potential growth
1. Scene setter: economic situation and outlook
8
(Continued on the next page)
Box 1.1: Inward spillovers to Cyprus
As a very small open economy, Cyprus is affected by developments in the EU and the rest of the world
through its trade in goods and services, FDI flows and other financial flows. Cyprus's GDP is about
0.1% of total EU GDP. The economy is very open, with trade (the average of imports and exports)
representing about 60% of output, compared with an EU average of about 40%. Alongside trade, financial
links – with both EU and non-EU countries - are important channels of contagion.
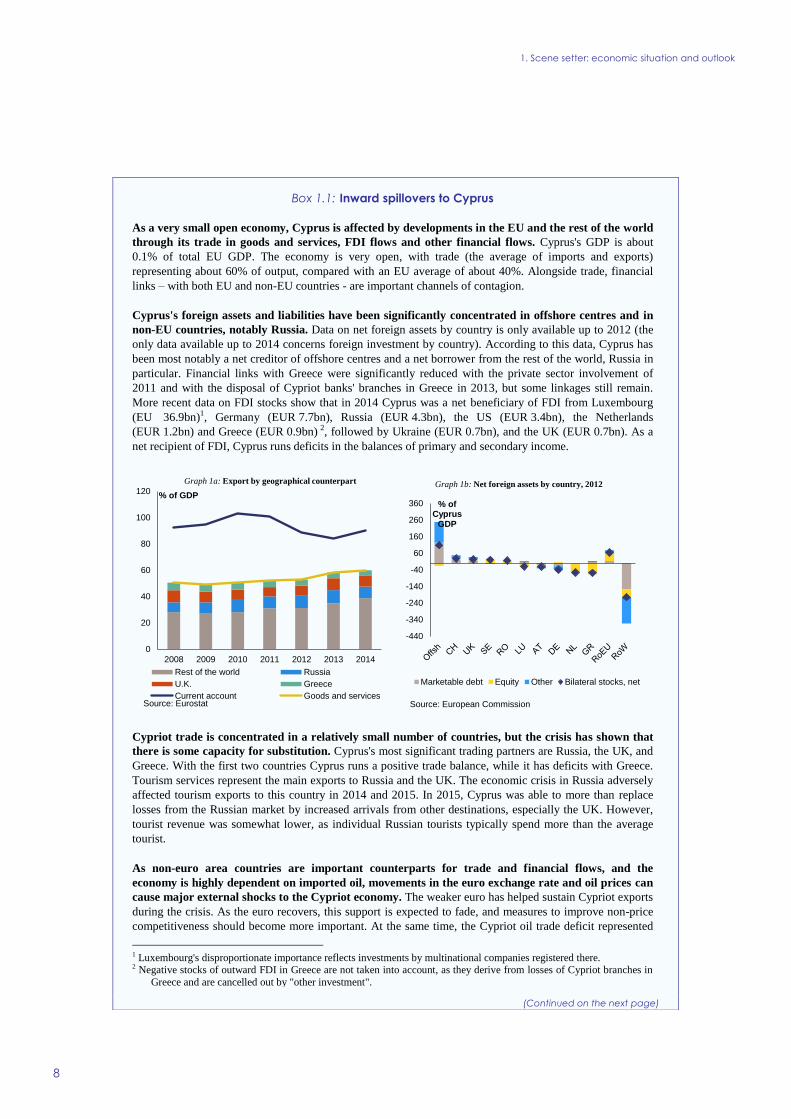
Cyprus's foreign assets and liabilities have been significantly concentrated in offshore centres and in
non-EU countries, notably Russia. Data on net foreign assets by country is only available up to 2012 (the
only data available up to 2014 concerns foreign investment by country). According to this data, Cyprus has
been most notably a net creditor of offshore centres and a net borrower from the rest of the world, Russia in
particular. Financial links with Greece were significantly reduced with the private sector involvement of
2011 and with the disposal of Cypriot banks' branches in Greece in 2013, but some linkages still remain.
More recent data on FDI stocks show that in 2014 Cyprus was a net beneficiary of FDI from Luxembourg
(EU 36.9bn)1, Germany (EUR 7.7bn), Russia (EUR 4.3bn), the US (EUR 3.4bn), the Netherlands
(EUR 1.2bn) and Greece (EUR 0.9bn) 2, followed by Ukraine (EUR 0.7bn), and the UK (EUR 0.7bn). As a
net recipient of FDI, Cyprus runs deficits in the balances of primary and secondary income.
Cypriot trade is concentrated in a relatively small number of countries, but the crisis has shown that
there is some capacity for substitution. Cyprus's most significant trading partners are Russia, the UK, and
Greece. With the first two countries Cyprus runs a positive trade balance, while it has deficits with Greece.
Tourism services represent the main exports to Russia and the UK. The economic crisis in Russia adversely
affected tourism exports to this country in 2014 and 2015. In 2015, Cyprus was able to more than replace
losses from the Russian market by increased arrivals from other destinations, especially the UK. However,
tourist revenue was somewhat lower, as individual Russian tourists typically spend more than the average
tourist.
As non-euro area countries are important counterparts for trade and financial flows, and the
economy is highly dependent on imported oil, movements in the euro exchange rate and oil prices can
cause major external shocks to the Cypriot economy. The weaker euro has helped sustain Cypriot exports
during the crisis. As the euro recovers, this support is expected to fade, and measures to improve non-price
competitiveness should become more important. At the same time, the Cypriot oil trade deficit represented
1 Luxembourg's disproportionate importance reflects investments by multinational companies registered there. 2 Negative stocks of outward FDI in Greece are not taken into account, as they derive from losses of Cypriot branches in
Greece and are cancelled out by "other investment".
0
20
40
60
80
100
120
2008 2009 2010 2011 2012 2013 2014
% of GDP
Graph 1a: Export by geographical counterpart
Rest of the world Russia
U.K. Greece
Current account Goods and servicesSource: Eurostat
-440
-340
-240
-140
-40
60
160
260
360 % of Cyprus
GDP
Graph 1b: Net foreign assets by country, 2012
Marketable debt Equity Other Bilateral stocks, net
Source: European Commission

1. Scene setter: economic situation and outlook
9
Box (continued)
about 6% of GDP in 2014 (see Section 3.4), and, setting aside a small share of renewable energy, energy
production and transport are heavily dependent on imported oil. For this reason, low oil prices since 2014
have significantly reduced the price of energy in Cyprus and pushed HICP inflation below zero. Savings on
the energy bill supported private consumption in 2014 and 2015. As indigenous gas develops and
renewables penetrate further into the market, the economy's response to changes in oil prices is set to
weaken.
High debt makes also Cyprus particularly vulnerable to changes in government bond yields that may
be triggered by changes in reference interest rates. As yields increase in the future, Cyprus will find it
more costly to finance itself on the market and meet its debt payment obligations. At the same time, Cypriot
bond spreads could be influenced by developments in other economies.
1. Scene setter: economic situation and outlook
10
(Continued on the next page)
Box 1.2: Investment challenges
Macroeconomic perspective
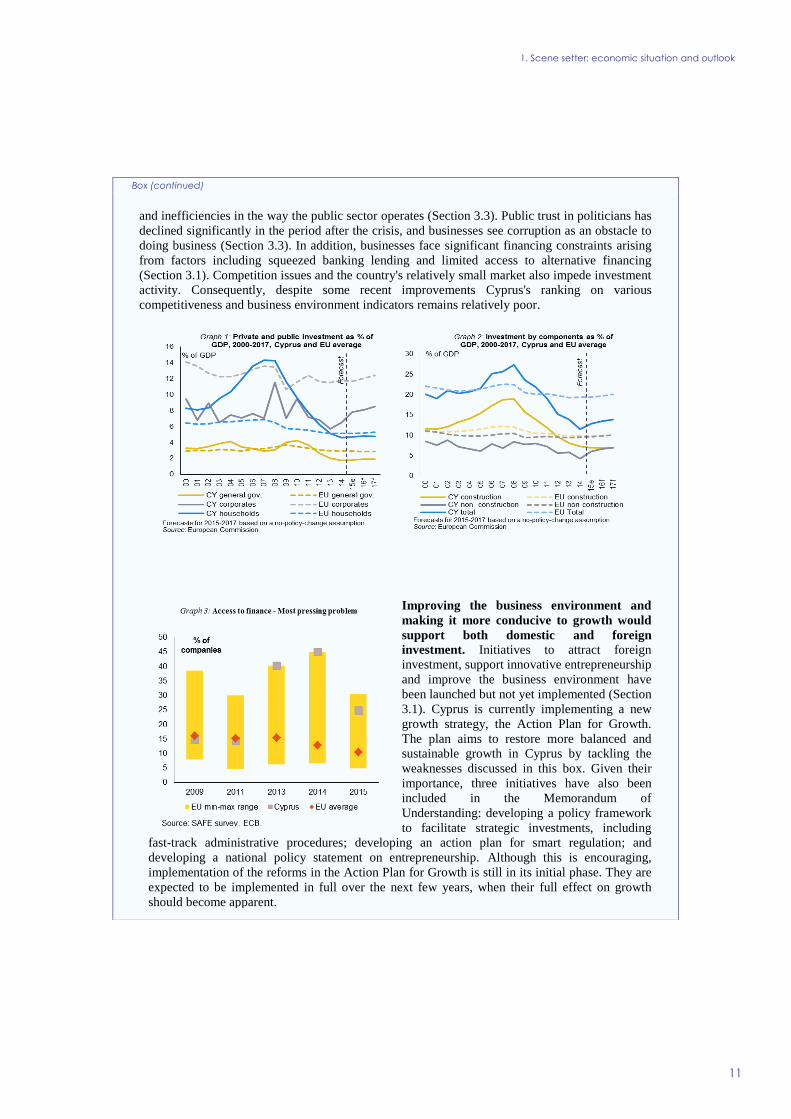
Investment contraction is gradually bottoming out, following a significant drop in
construction investment on the back of the housing market collapse. A surge in private
investment (Graph 1), driven by households' investment in dwellings (Graph 2), pushed total
investment (as a share of GDP) to above the EU average in the years preceding 2008. In particular,
asset re-pricing (i.e. land), coupled with the positive confidence effect of EU accession and
subsequent euro adoption as well as easy financing conditions driven by excess liquidity in the
banking sector have led to a formation of a housing bubble. Since the burst of the bubble, total
investment, both public and private, has shown a steep decline and reached one of the lowest
levels in the EU. Although investment is expected to have grown in 2015, the pick-up is due
mainly to the larger number of ship registrations in Cyprus, while underlying investment growth
still appears weak. (1) In the medium term, private investment should pick up again as uncertainty
in global markets and deleveraging needs diminish. Nevertheless, the overall investment gap with
respect to the EU average will remain significant for some years to come.
Structural problems in the banking sector and the highest ratio of bad assets among banks
supervised by the Single Supervisory Mechanism (SSM) resulted in very tight credit
conditions that constrain investment. This is also reflected in the very high share of firms
reporting that the most pressing problem for them is access to finance (Graph 3). The ratio of non-
performing exposures (NPEs) is expected to have peaked. Nevertheless, around half of banks’
exposures are non-performing (Section 2.1). A gradual reduction in bad assets, combined with
increasing and more sustainable restructurings of non-performing loans, is expected to ease credit
conditions in the future and support investment growth. Nevertheless, the high level of corporate
debt is a major impediment to investment and potential output growth. Cypriot companies are
among the most indebted in the EU, and their debt servicing costs remains among the highest in
EU (Section 2.2). Investment remains subdued, even in sectors that fared relatively well during the
crisis and that have been more successful in reducing their debt (e.g. the tradable sector).
Assessment of barriers to investment and ongoing reforms
Despite some progress with implementing structural reforms, productivity-enhancing
investment appears to be low and held back by several structural shortcomings. Key issues
are identified in the business and institutional environment in areas such as dealing with
construction permits, contract enforcement and judicial procedures. Cyprus is experiencing
subdued market dynamics and low competition in business services (Section 3.1 and Box 2.1.2).
Low competition is reflected in high costs, e.g. Cypriot companies face electricity prices that are
among the highest in the EU (Section 3.4) and mark-ups in the service sector are also estimated to
be among the highest (2). There is a significant amount of red tape, the shortcomings of the justice
system make contract enforcement relatively difficult, and the regulatory framework could be
further improved. Numerous shortcomings exist in the research and innovation system which are
reflected by the country's ranking in the 2015 Innovation Union Scoreboard (Section 3.1). Key
issues relate to the limited business R&D, which is one of the lowest in the EU, and a policy
tradition which favours academia over business competitiveness. The perception of the
government's effectiveness is barely above the EU average, as there are a number of shortcomings
(1) New registrations of ships in Cyprus have a positive impact on investment. Since this is matched by their equally
positive effect on imports, they have no net impact on GDP growth. Abstracting from ship registrations suggests that investment is slowly regaining momentum, and it should gather further strength through easing credit conditions.
(2) Thym-Thysen and Canton (2015)
1. Scene setter: economic situation and outlook
11
Box (continued)
and inefficiencies in the way the public sector operates (Section 3.3). Public trust in politicians has
declined significantly in the period after the crisis, and businesses see corruption as an obstacle to
doing business (Section 3.3). In addition, businesses face significant financing constraints arising
from factors including squeezed banking lending and limited access to alternative financing
(Section 3.1). Competition issues and the country's relatively small market also impede investment
activity. Consequently, despite some recent improvements Cyprus's ranking on various
competitiveness and business environment indicators remains relatively poor.
Improving the business environment and
making it more conducive to growth would
support both domestic and foreign
investment. Initiatives to attract foreign
investment, support innovative entrepreneurship
and improve the business environment have
been launched but not yet implemented (Section
3.1). Cyprus is currently implementing a new
growth strategy, the Action Plan for Growth.
The plan aims to restore more balanced and
sustainable growth in Cyprus by tackling the
weaknesses discussed in this box. Given their
importance, three initiatives have also been
included in the Memorandum of
Understanding: developing a policy framework
to facilitate strategic investments, including
fast-track administrative procedures; developing an action plan for smart regulation; and
developing a national policy statement on entrepreneurship. Although this is encouraging,
implementation of the reforms in the Action Plan for Growth is still in its initial phase. They are
expected to be implemented in full over the next few years, when their full effect on growth
should become apparent.
1. Scene setter: economic situation and outlook
12
Box 1.3: Contribution of the EU Budget to structural change
Cyprus is one of the main beneficiaries of the European Structural and Investment Funds (ESIF) and
is eligible to receive some EUR 908 million from the Funds between 2014 and 2020. This is equivalent
to 0.9% of GDP (on an annual basis) and 37.6% of the expected national public investment in areas
supported by the ESIF.
A number of reforms were implemented to satisfy preconditions and ensure successful investments
and effective delivery of the Europe 2020 objectives and targets (e.g. to strengthen competitiveness and
innovation and support the shift towards the low-carbon economy). Reforms in areas such as next generation
network infrastructure, risk prevention and management, water pricing policy and river basin management
plan, waste management and legislation relating to environmental impact assessments and strategic
environmental assessment are pending. If preconditions are not met by the end of 2016, the Commission
may suspend interim payment to the priority areas of the programme concerned.
The programming of the Funds was based on priorities and challenges identified in recent years,
partly in the context of the economic adjustment programme. It focuses on boosting competitiveness
and economic growth by supporting entrepreneurship and innovation and helping develop an
environmentally friendly, resource-efficient economy. Other priority areas are making public administration
more efficient, helping reduce and prevent poverty, supporting vocational education and training, and
supporting public employment services and employment, with a particular emphasis on youth employment
through the specific Youth Employment Initiative allocation. Regular monitoring of implementation
includes reporting in mid-2017 on how the funds have contributed to meeting Europe 2020 objectives and
on progress on structural reforms designed to maximise the use of EU financing.
Financing under the new European Fund for Strategic Investments (EFSI), Horizon 2020, COSME,
the Connecting Europe Facility and other directly managed EU funds would be additional to the
ESIF. Following the first rounds of calls for projects under the Connecting Europe Facility, Cyprus has
signed agreements for EUR 1 million in the energy field, EUR 272 thousand for telecoms projects, and
EUR 4 million for transport projects. For more information on the use of ESIF in Cyprus, see:
https://cohesiondata.ec.europa.eu/countries/CY.
1. Scene setter: economic situation and outlook
13
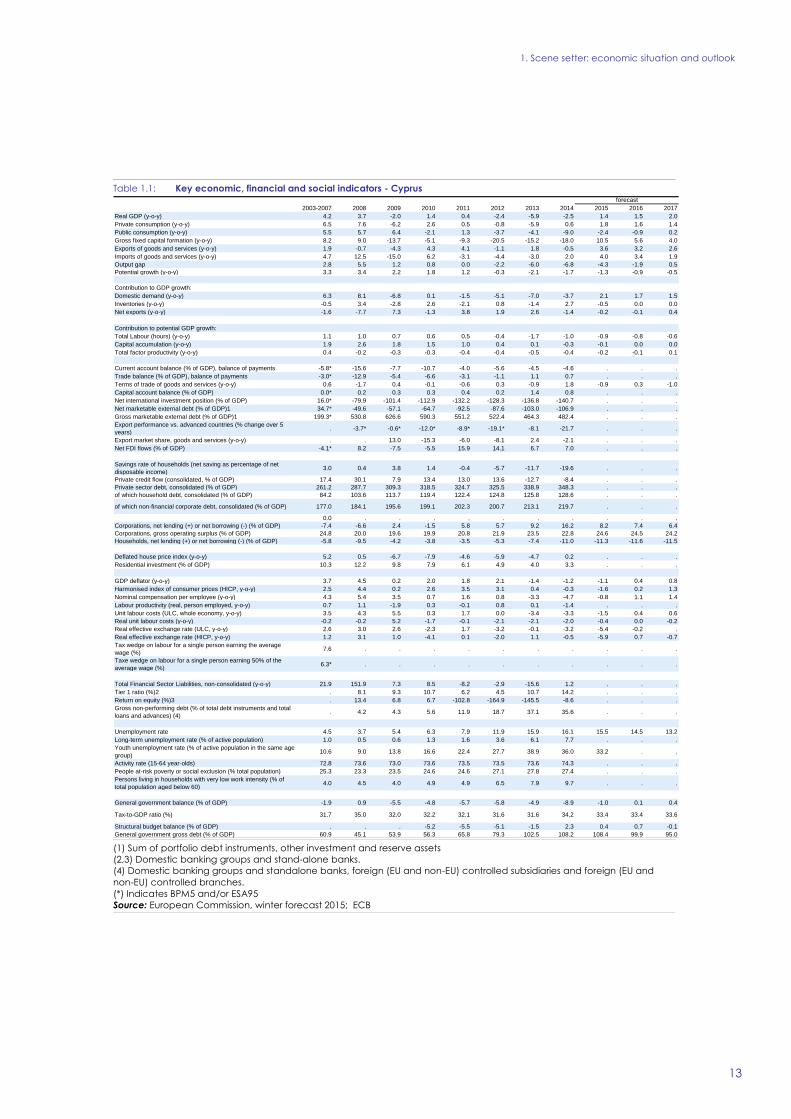
Table 1.1: Key economic, financial and social indicators - Cyprus
(1) Sum of portfolio debt instruments, other investment and reserve assets
(2,3) Domestic banking groups and stand-alone banks.
(4) Domestic banking groups and standalone banks, foreign (EU and non-EU) controlled subsidiaries and foreign (EU and
non-EU) controlled branches.
(*) Indicates BPM5 and/or ESA95
Source: European Commission, winter forecast 2015; ECB
2003-2007 2008 2009 2010 2011 2012 2013 2014 2015 2016 2017
Real GDP (y-o-y) 4.2 3.7 -2.0 1.4 0.4 -2.4 -5.9 -2.5 1.4 1.5 2.0
Private consumption (y-o-y) 6.5 7.6 -6.2 2.6 0.5 -0.8 -5.9 0.6 1.8 1.6 1.4
Public consumption (y-o-y) 5.5 5.7 6.4 -2.1 1.3 -3.7 -4.1 -9.0 -2.4 -0.9 0.2
Gross fixed capital formation (y-o-y) 8.2 9.0 -13.7 -5.1 -9.3 -20.5 -15.2 -18.0 10.5 5.6 4.0
Exports of goods and services (y-o-y) 1.9 -0.7 -4.3 4.3 4.1 -1.1 1.8 -0.5 3.6 3.2 2.6
Imports of goods and services (y-o-y) 4.7 12.5 -15.0 6.2 -3.1 -4.4 -3.0 2.0 4.0 3.4 1.9
Output gap 2.8 5.5 1.2 0.8 0.0 -2.2 -6.0 -6.8 -4.3 -1.9 0.5
Potential growth (y-o-y) 3.3 3.4 2.2 1.8 1.2 -0.3 -2.1 -1.7 -1.3 -0.9 -0.5
Contribution to GDP growth:
Domestic demand (y-o-y) 6.3 8.1 -6.8 0.1 -1.5 -5.1 -7.0 -3.7 2.1 1.7 1.5
Inventories (y-o-y) -0.5 3.4 -2.8 2.6 -2.1 0.8 -1.4 2.7 -0.5 0.0 0.0
Net exports (y-o-y) -1.6 -7.7 7.3 -1.3 3.8 1.9 2.6 -1.4 -0.2 -0.1 0.4
Contribution to potential GDP growth:
Total Labour (hours) (y-o-y) 1.1 1.0 0.7 0.6 0.5 -0.4 -1.7 -1.0 -0.9 -0.8 -0.6
Capital accumulation (y-o-y) 1.9 2.6 1.8 1.5 1.0 0.4 0.1 -0.3 -0.1 0.0 0.0
Total factor productivity (y-o-y) 0.4 -0.2 -0.3 -0.3 -0.4 -0.4 -0.5 -0.4 -0.2 -0.1 0.1
Current account balance (% of GDP), balance of payments -5.8* -15.6 -7.7 -10.7 -4.0 -5.6 -4.5 -4.6 . . .
Trade balance (% of GDP), balance of payments -3.0* -12.9 -5.4 -6.6 -3.1 -1.1 1.1 0.7 . . .
Terms of trade of goods and services (y-o-y) 0.6 -1.7 0.4 -0.1 -0.6 0.3 -0.9 1.8 -0.9 0.3 -1.0
Capital account balance (% of GDP) 0.0* 0.2 0.3 0.3 0.4 0.2 1.4 0.8 . . .
Net international investment position (% of GDP) 16.0* -79.9 -101.4 -112.9 -132.2 -128.3 -136.8 -140.7 . . .
Net marketable external debt (% of GDP)1 34.7* -49.6 -57.1 -64.7 -92.5 -87.6 -103.0 -106.9 . . .
Gross marketable external debt (% of GDP)1 199.3* 530.8 626.6 590.3 551.2 522.4 464.3 482.4 . . .
Export performance vs. advanced countries (% change over 5
years). -3.7* -0.6* -12.0* -8.9* -19.1* -8.1 -21.7 . . .
Export market share, goods and services (y-o-y) . . 13.0 -15.3 -6.0 -8.1 2.4 -2.1 . . .
Net FDI flows (% of GDP) -4.1* 8.2 -7.5 -5.5 15.9 14.1 6.7 7.0 . . .
Savings rate of households (net saving as percentage of net
disposable income)3.0 0.4 3.8 1.4 -0.4 -5.7 -11.7 -19.6 . . .
Private credit flow (consolidated, % of GDP) 17.4 30.1 7.9 13.4 13.0 13.6 -12.7 -8.4 . . .
Private sector debt, consolidated (% of GDP) 261.2 287.7 309.3 318.5 324.7 325.5 338.9 348.3 . . .
of which household debt, consolidated (% of GDP) 84.2 103.6 113.7 119.4 122.4 124.8 125.8 128.6 . . .
of which non-financial corporate debt, consolidated (% of GDP) 177.0 184.1 195.6 199.1 202.3 200.7 213.1 219.7 . . .
0.0 . . . . . . . . . .
Corporations, net lending (+) or net borrowing (-) (% of GDP) -7.4 -6.6 2.4 -1.5 5.8 5.7 9.2 16.2 8.2 7.4 6.4
Corporations, gross operating surplus (% of GDP) 24.8 20.0 19.6 19.9 20.8 21.9 23.5 22.8 24.6 24.5 24.2
Households, net lending (+) or net borrowing (-) (% of GDP) -5.8 -9.5 -4.2 -3.8 -3.5 -5.3 -7.4 -11.0 -11.3 -11.6 -11.5
Deflated house price index (y-o-y) 5.2 0.5 -6.7 -7.9 -4.6 -5.9 -4.7 0.2 . . .
Residential investment (% of GDP) 10.3 12.2 9.8 7.9 6.1 4.9 4.0 3.3 . . .
GDP deflator (y-o-y) 3.7 4.5 0.2 2.0 1.8 2.1 -1.4 -1.2 -1.1 0.4 0.8
Harmonised index of consumer prices (HICP, y-o-y) 2.5 4.4 0.2 2.6 3.5 3.1 0.4 -0.3 -1.6 0.2 1.3
Nominal compensation per employee (y-o-y) 4.3 5.4 3.5 0.7 1.6 0.8 -3.3 -4.7 -0.8 1.1 1.4
Labour productivity (real, person employed, y-o-y) 0.7 1.1 -1.9 0.3 -0.1 0.8 0.1 -1.4 . . .
Unit labour costs (ULC, whole economy, y-o-y) 3.5 4.3 5.5 0.3 1.7 0.0 -3.4 -3.3 -1.5 0.4 0.6
Real unit labour costs (y-o-y) -0.2 -0.2 5.2 -1.7 -0.1 -2.1 -2.1 -2.0 -0.4 0.0 -0.2
Real effective exchange rate (ULC, y-o-y) 2.6 3.0 2.6 -2.3 1.7 -3.2 -0.1 -3.2 -5.4 -0.2 .
Real effective exchange rate (HICP, y-o-y) 1.2 3.1 1.0 -4.1 0.1 -2.0 1.1 -0.5 -5.9 0.7 -0.7
Tax wedge on labour for a single person earning the average
wage (%)7.6 . . . . . . . . . .
Taxe wedge on labour for a single person earning 50% of the
average wage (%)6.3* . . . . . . . . . .
Total Financial Sector Liabilities, non-consolidated (y-o-y) 21.9 151.9 7.3 8.5 -8.2 -2.9 -15.6 1.2 . . .
Tier 1 ratio (%)2 . 8.1 9.3 10.7 6.2 4.5 10.7 14.2 . . .
Return on equity (%)3 . 13.4 6.8 6.7 -102.8 -164.9 -145.5 -8.6 . . .
Gross non-performing debt (% of total debt instruments and total
loans and advances) (4). 4.2 4.3 5.6 11.9 18.7 37.1 35.6 . . .
Unemployment rate 4.5 3.7 5.4 6.3 7.9 11.9 15.9 16.1 15.5 14.5 13.2
Long-term unemployment rate (% of active population) 1.0 0.5 0.6 1.3 1.6 3.6 6.1 7.7 . . .
Youth unemployment rate (% of active population in the same age
group)10.6 9.0 13.8 16.6 22.4 27.7 38.9 36.0 33.2 . .
Activity rate (15-64 year-olds) 72.8 73.6 73.0 73.6 73.5 73.5 73.6 74.3 . . .
People at-risk poverty or social exclusion (% total population) 25.3 23.3 23.5 24.6 24.6 27.1 27.8 27.4 . . .
Persons living in households with very low work intensity (% of
total population aged below 60)4.0 4.5 4.0 4.9 4.9 6.5 7.9 9.7 . . .
General government balance (% of GDP) -1.9 0.9 -5.5 -4.8 -5.7 -5.8 -4.9 -8.9 -1.0 0.1 0.4
Tax-to-GDP ratio (%) 31.7 35.0 32.0 32.2 32.1 31.6 31.6 34.2 33.4 33.4 33.6
Structural budget balance (% of GDP) . . . -5.2 -5.5 -5.1 -1.5 2.3 0.4 0.7 -0.1
General government gross debt (% of GDP) 60.9 45.1 53.9 56.3 65.8 79.3 102.5 108.2 108.4 99.9 95.0
forecast

14
The Cypriot banking system
The banking sector remains structured in four
different segments, with large market
concentration in a few banks. The four segments
are: i) the cooperative credit sector, ii) three
domestic banks, iii) subsidiaries of Greek banks,
and iv) other foreign banks. Prior to the crisis, 75%
of the deposits market share was held by the
cooperative credit sector and three domestic banks,
namely Bank of Cyprus, Cyprus Popular Bank,
and Hellenic Bank (4). Subsidiaries of Greek banks
and other foreign banks accounted for the
remaining 25%. With the resolution of the Cyprus
Popular Bank, the market share of Bank of Cyprus
increased significantly.
The current banking sector is two-thirds of its
pre-crisis size. Lax credit conditions and ample
liquidity supported a domestic bank credit
expansion before the crisis. This fuelled a real
estate boom and brought the indebtedness of
Cypriot households and companies to among the
highest in the European Union (see Section 2.2).
Cyprus' position as an offshore, low cost financial
centre attracted substantial amounts of non-
resident funding in search of both monetary yield
and diversified financial services (Section 2.3).
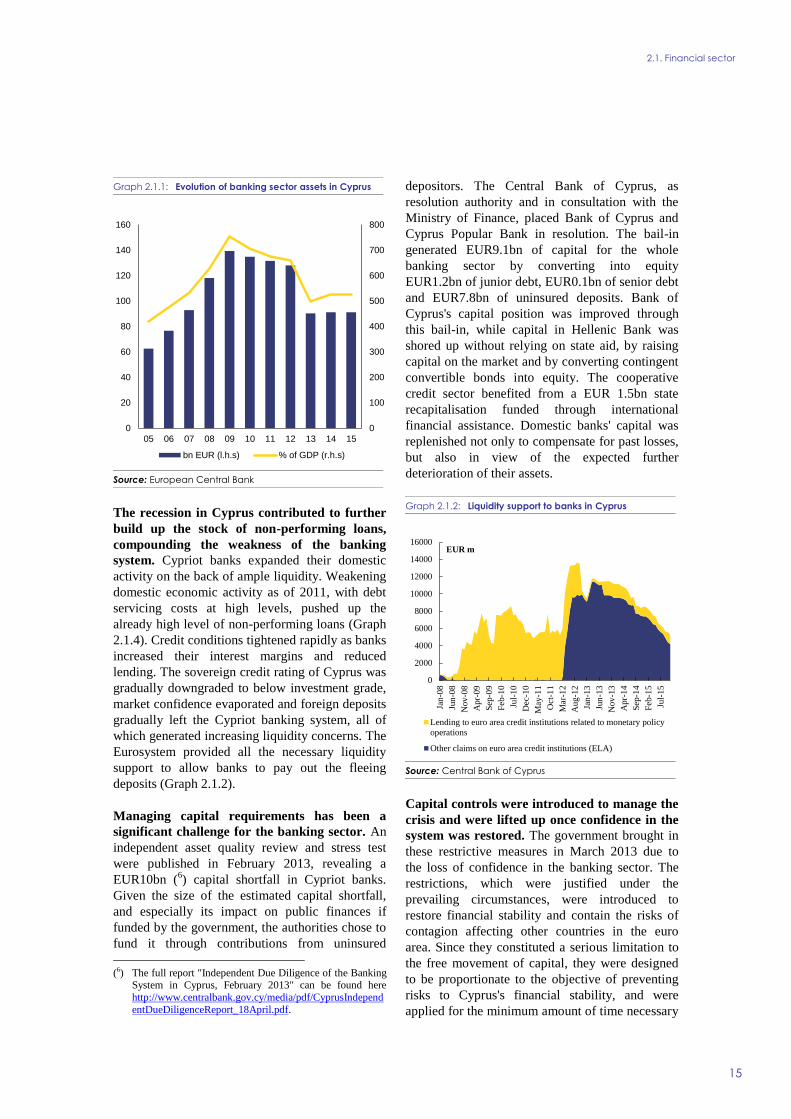
Consolidated assets held by the banking sector
peaked at about 750% of GDP in 2009 (Graph
2.1.1), much above the EU average. In response to
the crisis, Cypriot financial institutions
significantly downsized their balance sheets and
focused on the domestic market. Aggregate
financial sector assets fell by a further 80% of
GDP (Graph 2.1.1) when Cyprus Popular Bank
was put under resolution (5). Insured deposits were
(3) According to Article 5 of Regulation (EU) No. 1176/2011. (4) Commission (2013) The economic adjustment programme
for Cyprus, May 2013, pp 15-16 (5) Details of the downsizing of Cyprus's banking sector can
be found in European Commission, 2015, The Economic
acquired by Bank of Cyprus, but uninsured
deposits and other liabilities were converted into
equity through a bail-in (see below) and merged
into Bank of Cyprus.
Exposure to foreign economies has been
significantly curtailed. Domestic banks, notably
Cyprus Popular Bank and Bank of Cyprus, had
increased their exposure to foreign economies in
the run up to the crisis. Direct loans in Greece, for
example, reached EUR20bn in 2012, i.e. about
110% of Cyprus's GDP. Developments in Greece
at the time adversely affected the performance of
Cypriot banks, which notably suffered a EUR4bn
loss when the Greek private sector involvement cut
the value of their Greek sovereign bonds holdings
from about EUR5bn in March 2011, to EUR1bn in
September 2012. In March 2013, the domestic
banks sold their Greek operations, worth about
120% of GDP. This has further limited the
exposure of the Cypriot banking system to any
possible unfavourable developments in Greece.
The high level of collateralised lending posed
challenges regarding the perception of credit
risk. Lending practices used to rely on the
availability of collateral and personal guarantees,
only recently focussing on borrowers' debt service
capacity. This has resulted in a large stock of
collateralised loans in banks' balance sheets.
Relatively low estimates of expected losses on
collateralised loans have kept provisions at levels
below the EU average, implying that Cypriot
commercial banks' overall capitalisation compared
more unfavourably to euro area banks than a direct
comparison of capital adequacy ratios would
suggest.
Adjustment Programme, Cyprus's 6th Review – Spring
2015, pp. 24-25.
2. IMBALANCES, RISKS AND ADJUSTMENT ISSUES
This section provides the in-depth review required under the macroeconomic imbalance procedure
(MIP) (3). It focuses on the potential risks and vulnerabilities flagged in the Alert Mechanism Report
2016. The reasons for the high level of non-performing loans and other challenges faced by the financial
sector are discussed, as are the developments in the debt of households and the corporate sector and the
related deleveraging process. This section also discusses the sustainability of Cyprus's external debt
position, and the still high public-debt-to-GDP ratio. It concludes with the MIP assessment matrix which
summarises the main findings.
2.1. FINANCIAL SECTOR
2.1. Financial sector
15
Graph 2.1.1: Evolution of banking sector assets in Cyprus
Source: European Central Bank
The recession in Cyprus contributed to further
build up the stock of non-performing loans,
compounding the weakness of the banking
system. Cypriot banks expanded their domestic
activity on the back of ample liquidity. Weakening
domestic economic activity as of 2011, with debt
servicing costs at high levels, pushed up the
already high level of non-performing loans (Graph
2.1.4). Credit conditions tightened rapidly as banks
increased their interest margins and reduced
lending. The sovereign credit rating of Cyprus was
gradually downgraded to below investment grade,
market confidence evaporated and foreign deposits
gradually left the Cypriot banking system, all of
which generated increasing liquidity concerns. The
Eurosystem provided all the necessary liquidity
support to allow banks to pay out the fleeing
deposits (Graph 2.1.2).
Managing capital requirements has been a
significant challenge for the banking sector. An
independent asset quality review and stress test
were published in February 2013, revealing a
EUR10bn (6) capital shortfall in Cypriot banks.
Given the size of the estimated capital shortfall,
and especially its impact on public finances if
funded by the government, the authorities chose to
fund it through contributions from uninsured
(6) The full report "Independent Due Diligence of the Banking
System in Cyprus, February 2013" can be found here
http://www.centralbank.gov.cy/media/pdf/CyprusIndepend
entDueDiligenceReport_18April.pdf.
depositors. The Central Bank of Cyprus, as
resolution authority and in consultation with the
Ministry of Finance, placed Bank of Cyprus and
Cyprus Popular Bank in resolution. The bail-in
generated EUR9.1bn of capital for the whole
banking sector by converting into equity
EUR1.2bn of junior debt, EUR0.1bn of senior debt
and EUR7.8bn of uninsured deposits. Bank of
Cyprus's capital position was improved through
this bail-in, while capital in Hellenic Bank was
shored up without relying on state aid, by raising
capital on the market and by converting contingent
convertible bonds into equity. The cooperative
credit sector benefited from a EUR 1.5bn state
recapitalisation funded through international
financial assistance. Domestic banks' capital was
replenished not only to compensate for past losses,
but also in view of the expected further
deterioration of their assets.
Graph 2.1.2: Liquidity support to banks in Cyprus
Source: Central Bank of Cyprus
Capital controls were introduced to manage the
crisis and were lifted up once confidence in the
system was restored. The government brought in
these restrictive measures in March 2013 due to
the loss of confidence in the banking sector. The
restrictions, which were justified under the
prevailing circumstances, were introduced to
restore financial stability and contain the risks of
contagion affecting other countries in the euro
area. Since they constituted a serious limitation to
the free movement of capital, they were designed
to be proportionate to the objective of preventing
risks to Cyprus's financial stability, and were
applied for the minimum amount of time necessary
0
100
200
300
400
500
600
700
800
0
20
40
60
80
100
120
140
160
05 06 07 08 09 10 11 12 13 14 15
bn EUR (l.h.s) % of GDP (r.h.s)
0
2000
4000
6000
8000
10000
12000
14000
16000
Jan-0
8
Jun
-08
Nov
-08
Apr-
09
Sep
-09
Feb
-10
Jul-
10
Dec
-10
May
-11
Oct
-11
Mar
-12
Aug
-12
Jan-1
3
Jun
-13
Nov
-13
Apr-
14
Sep
-14
Feb
-15
Jul-
15
EUR m
Lending to euro area credit institutions related to monetary policy
operations
Other claims on euro area credit institutions (ELA)
2.1. Financial sector
16
for that purpose. The authorities' prudent approach
to administrative measures consisted of linking the
relaxation steps to complying with specific
milestones. These indicators were mostly related to
the restructuring and resolution of financial
institutions and to the tangible and sustainable
return of depositors' confidence. About one year
after the measures were brought in, considerable
progress had been made towards eliminating them
since the necessary milestones had been reached.
All limitations were lifted in April 2015 (7).
The shortcomings of the prudential and
regulatory framework played a role in the
build-up of imbalances prior to the financial
crisis. Regulatory requirements for investing
excess liquidity in government debt resulted in a
high exposure to the Greek sovereign and
subsequent losses. There were also significant
weaknesses in the regulation of cooperative credit
institutions, which had systemic importance.
Overall, poor risk management practices,
insufficient capacity to exercise prudential
oversight compared to the size of the financial
sector, and excessive concentration of investments
led to the unprecedented challenges for the system.
Structural reforms
The Cypriot authorities have taken important
steps to improve the resilience of the banking
system. These reforms were aimed at cleaning up
banks’ balance sheets and supporting the recovery
of credit to the economy. The reforms have been
based on three main objectives: i) strengthening
the regulation and supervision of non-performing
loans; ii) addressing the economy’s indebtedness;
and iii) making the financial system more
transparent.
The Central Bank of Cyprus has improved its
capacity to monitor and regulate banks'
activities. One objective was to improve
prudential oversight, notably by increasing the
capacity and resources of the Central Bank of
Cyprus and aligning the regulation and supervision
of the cooperative banking sector to that of
commercial banks. To improve the perception of
(7) Details of the restrictive measures applied in Cyprus can be
found in European Commission, 2014, The Economic Adjustment Programme, Cyprus's 4th Review – Spring
2014, pp. 18-19.
credit risk, a broader definition and classification
of non-performing loans was introduced in July
2013, now also including fully collateralised loans.
In addition, banks were recommended to base their
lending decisions on the borrower's repayment
capacity, rather than on personal guarantees and
collateral value, and to promote a more active
management of existing loans(8). The Central
Bank of Cyprus also stepped up its monitoring of
banks' non-performing loans and early arrears
management, notably by setting up and publishing
loan restructuring targets for each bank. Finally, a
single credit register was set up to improve
information on borrowers.
The legal framework for private debt
restructuring has been overhauled in order to
accelerate the resolution of non-performing
loans. The authorities took measures to facilitate
the reduction of the large pool of non-performing
loans. The Cypriot parliament adopted new legal
frameworks for foreclosure and insolvency (see
Box 2.1.1) to reduce the time and cost of enforcing
loan collateral, while also incentivising repayment
discipline. A troubled borrowers' framework was
set up, including a Code of Conduct for banks and
the mediation process between lenders and
borrowers, headed by a Financial Ombudsman (9).
Legislation on disentangling legal claims by
transferring titles deeds (see Box 2.2.2) was also
adopted in order to restore confidence in the
housing market. Finally, the parliament adopted
new legislation enabling the sale of loans to third
parties. This should facilitate the cleaning up of
banks' balance sheets by allowing banks to sell
part of their distressed assets portfolio to investors
and specialised companies, without having to
obtain the consent of the borrower.
The law transposing the bank recovery and
resolution directive was adopted in early 2016.
Cyprus, contrary to many other Member States,
already had a functioning national resolution
framework before transposing the directive. In its
very spirit, this framework was the precursor of the
directive and has been applied already. For
example, a dedicated Recapitalisation Fund was
(8) make reference to the directive
(9) Details about the policy initiatives addressing private sector debt restructuring and their monitoring framework can be
found in European Commission, 2014, The Economic
Adjustment Programme, Cyprus 3rd Review – Winter 2014, pp. 24-25 and pp. 26-27.

2.1. Financial sector
17
created to make sure that state aid measures
granted by Cyprus were in line with the directive.
This fund is funded from a special levy imposed
on all banks and credit institutions in Cyprus in a
way that complies with ex-post contribution of the
banking sector to support resolution financing.
Cypriot authorities have considerably
strengthened their anti-money-laundering
framework, although implementation
challenges remain. The reform was designed to
strengthen the preventive measures regarding due
diligence, the use of introduced business (10
) and
the reporting of suspicious transactions, while also
improving transparency as regards the ultimate
beneficiaries of accounts and trusts. Supervisory
authorities implemented new risk-based inspection
tools and increased the resources dedicated to
combating money laundering. The exchange of
information with foreign supervisors has also been
improved. Moneyval gave a positive review of the
effectiveness of customer due diligence in the
Cypriot banking sector in a report published on
15 September 2014(11
). However, the effectiveness
of the action plan for combating money laundering
still depends on the authorities’ ability to enforce
their prudential framework. So far, sanctions
remain rare and appear untimely. For example,
while the Central Bank of Cyprus carried out
inspections in 2014, the first penalty arising from
these inspections was imposed only in November
(10) ‘introduced business’ refers to the practice of relying on
intermediaries to introduce new clients to banks and perform part of the bank’s customer due diligence.
(11) The Moneyval report can be found here
http://www.coe.int/t/dghl/monitoring/moneyval/countries/cyprus_EN.asp. .
2015. One of the main reasons for this delay is
staff shortages on the authorities' side.
Remaining challenges
Following three years of reform efforts, the high
level of non-performing loans remains a key
challenge for Cyprus. With around half of gross
loans non-performing (12
), this is a key challenge,
also recognised as a key issue in the 2016 Council
recommendations for the euro area (Graph 2.1.3).
The environment is now conducive to reducing
non-performing loans, following the
implementation of a wide range of reforms and
given stronger economic growth, an improved
liquidity situation and the lifting of the restrictive
measures. Other remaining challenges include
further improving of the banks' lending practices
and profitability. The latter still relies to a large
extent on the interest income accrued on bad loans.
(12) Non-performing loans in the banking sector stood at
slightly below 50% of gross loans at the end of 2015. Looking at households and companies only, non-
compliance amounts to close to 60% of gross loans
Table 2.1.1: Financial robustness indicators
Source: Central Bank of Cyprus
in % Mar Jun Sep Dec Mar Jun Sep Dec Mar June Sep Dec Mar June Sep
NPLs, loans to legal entities (% of total) 18.0 18.9 20.3 22.6 24.7 30.2 39.7 44.4 45.6 49.1 50.4
NPLs, loans to NFCs (% of total) 58.0 55.8 55.7 57.0
Restructured non-performing (% of total) 8.4 10.9 12.5 14.2 14.6 14.1 23.3 22.4 24.0 24.6
Restructured performing (% of total) 15.1 13.7 12.2 11.2 10.2 10.0 5.3 5.4 7.9 6.8
NPLs, loans to private individuals 18.0 18.9 20.3 22.6 24.7 35.1 39.4 43.3 47.6 49.4 50.8 52.7 53.9 54.9 56.1
Restructured non-performing (% of total) 2.7 4.6 6.7 8.8 8.5 8.4 13.9 15.0 16.5 17.5
Restructured performing (% of total) 11.9 12.0 10.4 11.0 10.3 9.1 8.9 8.3 8.6 7.7
Coverage rate 29.7 32.4 32.7 37.5 27.1 23.8 22.9 30.1 30.6 35.8 36.3 32.9 32.6 33.1 34.0
Cost-to-income ratio 41.0 49.7 51.6 55.6 49.9 52.4 53.4 53.4 37.9 37.0 39.3 40.4 41.2 35.3 43.4
Net interest margin 2.8 2.4 2.3 2.3 1.7 2.0 2.3 2.4 3.1 3.2 3.1 2.9 3.0 2.8 2.8
Core Tier 1 ratio 6.1 7.3 6.9 4.5 12.1 11.9 11.6 12.1 12.5 12.9 14.8 14.2 14.3 15.1 15.3
Return on assets 1.6 -1.9 -1.7 -3.4 -5.4 -3.4 -2.5 -4.3 0.1 0.3 0.1 -0.6 0.6 0.6 0.0
2012 2013 2014 2015
2.1. Financial sector
18
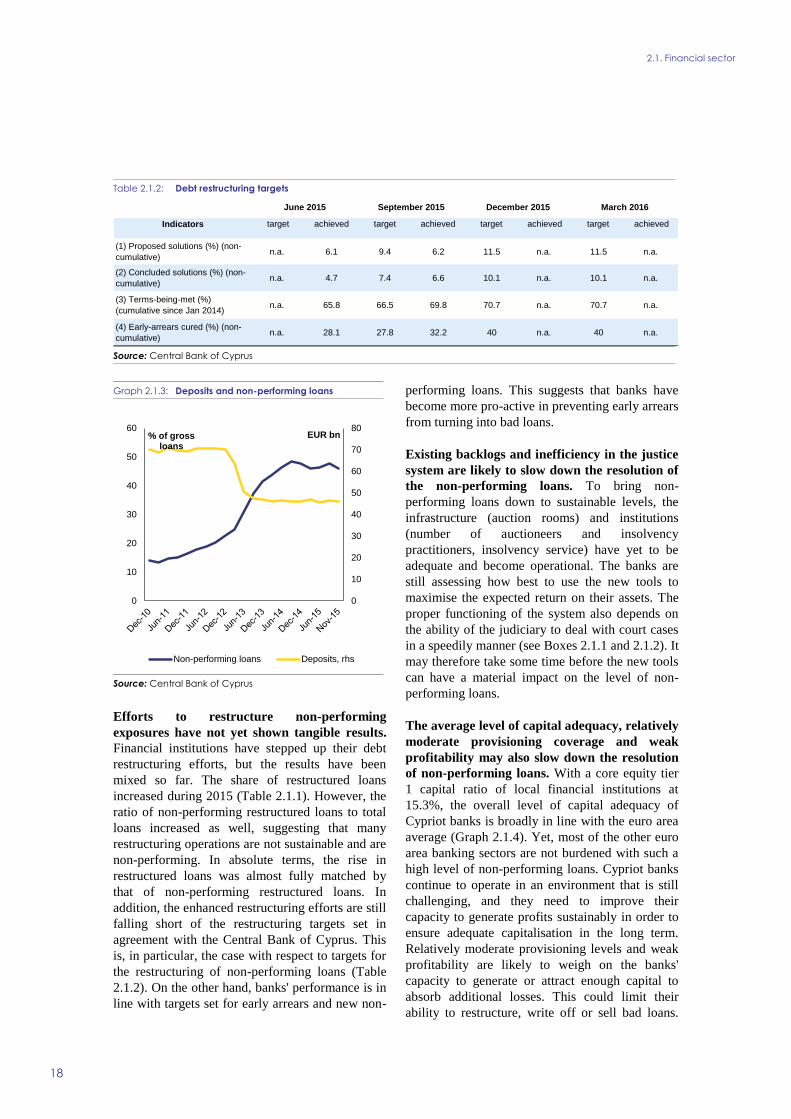
Graph 2.1.3: Deposits and non-performing loans
Source: Central Bank of Cyprus
Efforts to restructure non-performing
exposures have not yet shown tangible results.
Financial institutions have stepped up their debt
restructuring efforts, but the results have been
mixed so far. The share of restructured loans
increased during 2015 (Table 2.1.1). However, the
ratio of non-performing restructured loans to total
loans increased as well, suggesting that many
restructuring operations are not sustainable and are
non-performing. In absolute terms, the rise in
restructured loans was almost fully matched by
that of non-performing restructured loans. In
addition, the enhanced restructuring efforts are still
falling short of the restructuring targets set in
agreement with the Central Bank of Cyprus. This
is, in particular, the case with respect to targets for
the restructuring of non-performing loans (Table
2.1.2). On the other hand, banks' performance is in
line with targets set for early arrears and new non-
performing loans. This suggests that banks have
become more pro-active in preventing early arrears
from turning into bad loans.
Existing backlogs and inefficiency in the justice
system are likely to slow down the resolution of
the non-performing loans. To bring non-
performing loans down to sustainable levels, the
infrastructure (auction rooms) and institutions
(number of auctioneers and insolvency
practitioners, insolvency service) have yet to be
adequate and become operational. The banks are
still assessing how best to use the new tools to
maximise the expected return on their assets. The
proper functioning of the system also depends on
the ability of the judiciary to deal with court cases
in a speedily manner (see Boxes 2.1.1 and 2.1.2). It
may therefore take some time before the new tools
can have a material impact on the level of non-
performing loans.
The average level of capital adequacy, relatively
moderate provisioning coverage and weak
profitability may also slow down the resolution
of non-performing loans. With a core equity tier
1 capital ratio of local financial institutions at
15.3%, the overall level of capital adequacy of
Cypriot banks is broadly in line with the euro area
average (Graph 2.1.4). Yet, most of the other euro
area banking sectors are not burdened with such a
high level of non-performing loans. Cypriot banks
continue to operate in an environment that is still
challenging, and they need to improve their
capacity to generate profits sustainably in order to
ensure adequate capitalisation in the long term.
Relatively moderate provisioning levels and weak
profitability are likely to weigh on the banks'
capacity to generate or attract enough capital to
absorb additional losses. This could limit their
ability to restructure, write off or sell bad loans.
0
10
20
30
40
50
60
70
80
0
10
20
30
40
50
60EUR bn% of gross
loans
Non-performing loans Deposits, rhs
Table 2.1.2: Debt restructuring targets
Source: Central Bank of Cyprus
Indicators target achieved target achieved target achieved target achieved
(1) Proposed solutions (%) (non-
cumulative)n.a. 6.1 9.4 6.2 11.5 n.a. 11.5 n.a.
(2) Concluded solutions (%) (non-
cumulative)n.a. 4.7 7.4 6.6 10.1 n.a. 10.1 n.a.
(3) Terms-being-met (%)
(cumulative since Jan 2014)n.a. 65.8 66.5 69.8 70.7 n.a. 70.7 n.a.
(4) Early-arrears cured (%) (non-
cumulative)n.a. 28.1 27.8 32.2 40 n.a. 40 n.a.
March 2016December 2015September 2015June 2015
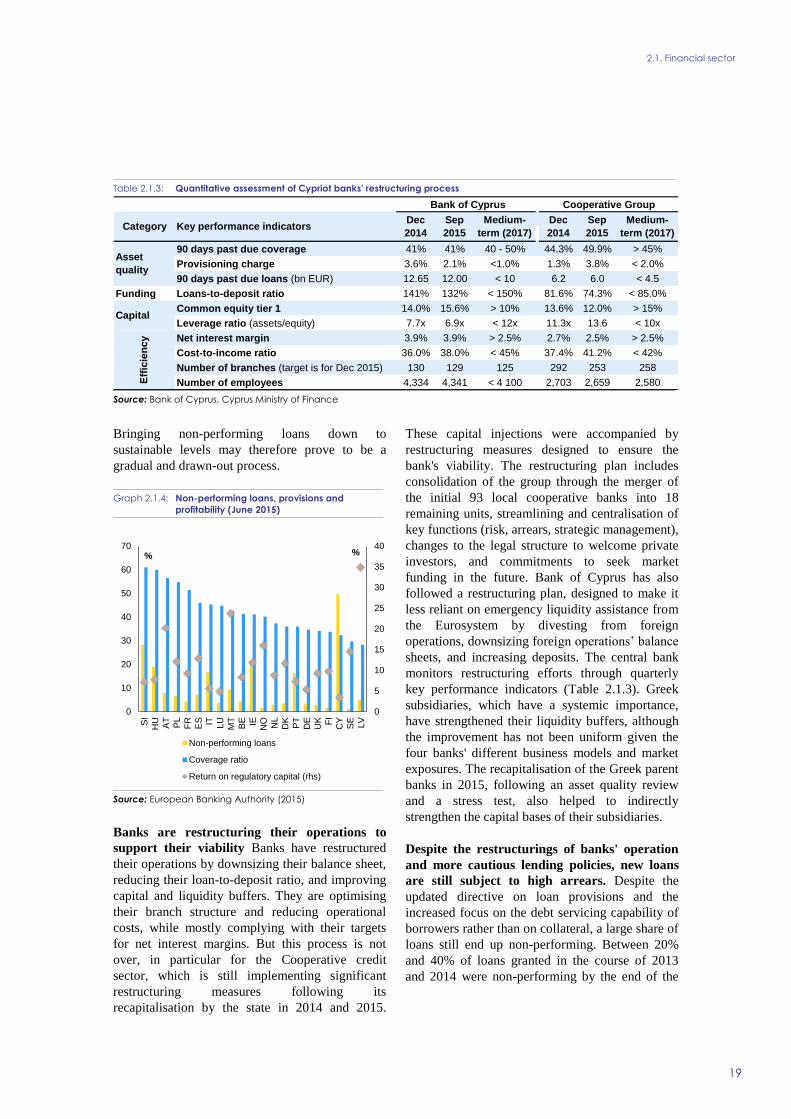
2.1. Financial sector
19
Bringing non-performing loans down to
sustainable levels may therefore prove to be a
gradual and drawn-out process.
Graph 2.1.4: Non-performing loans, provisions and
profitability (June 2015)
Source: European Banking Authority (2015)
Banks are restructuring their operations to
support their viability Banks have restructured
their operations by downsizing their balance sheet,
reducing their loan-to-deposit ratio, and improving
capital and liquidity buffers. They are optimising
their branch structure and reducing operational
costs, while mostly complying with their targets
for net interest margins. But this process is not
over, in particular for the Cooperative credit
sector, which is still implementing significant
restructuring measures following its
recapitalisation by the state in 2014 and 2015.
These capital injections were accompanied by
restructuring measures designed to ensure the
bank's viability. The restructuring plan includes
consolidation of the group through the merger of
the initial 93 local cooperative banks into 18
remaining units, streamlining and centralisation of
key functions (risk, arrears, strategic management),
changes to the legal structure to welcome private
investors, and commitments to seek market
funding in the future. Bank of Cyprus has also
followed a restructuring plan, designed to make it
less reliant on emergency liquidity assistance from
the Eurosystem by divesting from foreign
operations, downsizing foreign operations’ balance
sheets, and increasing deposits. The central bank
monitors restructuring efforts through quarterly
key performance indicators (Table 2.1.3). Greek
subsidiaries, which have a systemic importance,
have strengthened their liquidity buffers, although
the improvement has not been uniform given the
four banks' different business models and market
exposures. The recapitalisation of the Greek parent
banks in 2015, following an asset quality review
and a stress test, also helped to indirectly
strengthen the capital bases of their subsidiaries.
Despite the restructurings of banks' operation
and more cautious lending policies, new loans
are still subject to high arrears. Despite the
updated directive on loan provisions and the
increased focus on the debt servicing capability of
borrowers rather than on collateral, a large share of
loans still end up non-performing. Between 20%
and 40% of loans granted in the course of 2013
and 2014 were non-performing by the end of the
0
5
10
15
20
25
30
35
40
0
10
20
30
40
50
60
70
SI
HU
AT
PL
FR
ES IT LU
MT
BE IE
NO
NL
DK
PT
DE
UK FI
CY
SE
LV
%%
Non-performing loans
Coverage ratio
Return on regulatory capital (rhs)
Table 2.1.3: Quantitative assessment of Cypriot banks' restructuring process
Source: Bank of Cyprus, Cyprus Ministry of Finance
Bank of Cyprus Cooperative Group
90 days past due coverage 41% 41% 40 - 50% 44.3% 49.9% > 45%
Provisioning charge 3.6% 2.1% <1.0% 1.3% 3.8% < 2.0%
90 days past due loans (bn EUR) 12.65 12.00 < 10 6.2 6.0 < 4.5
Funding Loans-to-deposit ratio 141% 132% < 150% 81.6% 74.3% < 85.0%
Common equity tier 1 14.0% 15.6% > 10% 13.6% 12.0% > 15%
Leverage ratio (assets/equity) 7.7x 6.9x < 12x 11.3x 13.6 < 10x
Net interest margin 3.9% 3.9% > 2.5% 2.7% 2.5% > 2.5%
Cost-to-income ratio 36.0% 38.0% < 45% 37.4% 41.2% < 42%
Number of branches (target is for Dec 2015) 130 129 125 292 253 258
Number of employees 4,334 4,341 < 4 100 2,703 2,659 2,580
Dec
2014
Sep
2015
Capital
Eff
icie
nc
y
Medium-
term (2017)Key performance indicatorsCategory
Asset
quality
Dec
2014
Sep
2015
Medium-
term (2017)
2.1. Financial sector
20
year in which they were granted. (13
) This
highlights the challenges that exist in identifying
viable borrowers and investment projects in the
context of excessive private sector indebtedness
(see Section 2.2). The creation of a credit register
in 2015 might help banks avoid lending to already
troubled borrowers, although it would not help
assess their repayment capacity, as it only collects
data on liabilities. Moreover, there are now
increasing pressures for banks to increase lending,
potentially under-pricing risk, as ample and still
rising liquidity is penalised by the negative rates
on the ECB deposit facility.
The funding structure of the banks has
improved but remains dependent on foreign
deposits. The banks' deposit base stabilised since
the last quarter of 2014 and remained stable at
about EUR 46bn in 2015 (apart from a temporary
decline in June 2015 ). The aggregate
improvement in funding contributed to increasing
banks' liquidity buffers and decreasing their
reliance on emergency liquidity assistance from
the Eurosystem. However, the inflow of deposits
from non-residents outside the euro area remains
subdued. A
(13) Hellenic Bank (2015), the Cooperative Central Bank
(2015) and Bank of Cyprus (2015)
diversification of bank funding sources from retail
to hybrid and wholesale instruments would
increase banks' loss absorption capacity, provide
them with longer maturity funding and reduce their
exposure to swings in depositors' confidence. In
this respect, legislation allowing for loan
securitisation, which is currently under
preparation, aims to facilitate banks' long term
funding.
The quality, independence, governance and
administrative capacity of the non-banking
supervisory authorities are relatively weak and
associated with risks. The European Insurance
and Occupational Pension Authority identified
risks related to maintaining the current supervisory
framework of the non-banking financial
intermediaries, i.e. insurance companies and
pension funds, which held assets amounting to
about 30% of GDP in 2014. It highlighted that the
current supervisory framework does not have the
critical size or sufficient capacity to identify
weaknesses and ensure the stability of this
significant sector. It recommended consolidating
the supervisory landscape by creating a new single
authority supervising both the insurance and
pension industries. So far, progress with the
integration of the supervisory authorities has been
limited.
2.1. Financial sector
21
Box 2.1.1: Reform of the legal framework for private debt restructuring
The Cypriot legal framework for private debt restructuring has undergone a broad reform. This
reform introduces (i) for companies, a new debt restructuring (examinership) procedure and modernised law
on the liquidation of companies, and (ii) for natural persons, new arrangements for restructuring debt and
reforming the bankruptcy law. The reform also modernises the foreclosure law, streamlining procedures.
As regards the corporate insolvency regime, the existing law on the winding-up of companies has been
updated, and a new corporate restructuring/rescue law has been established. The existing law now
provides for a swift liquidation procedure for insolvent companies which cannot be rescued. A new
corporate restructuring/rescue law (based closely on the Irish Examinership law) has been introduced to
enable viable companies to be restructured with the help of an examiner (insolvency practitioner). The
directors of the company would normally remain in control of the business.
The reform of the framework for personal insolvency has modernised the bankruptcy law and
established new tools for restructuring household debt. The bankruptcy law was amended to permit
automatic discharge of bankrupt individuals after 3 years, in line with EU best practice. It gives over-
indebted individuals a better chance of a fresh start, on the basis of full cooperation, disclosure and surrender
of assets. This discharge covers, for the first time, secured debt in order to permit a mortgage debtor to be
released from a deficiency claim after loss or disposal of the property. The possibility of a debt discharge is
an important development with regard to rehabilitation of entrepreneurs liable for the debt of a company,
particularly in Cyprus, where the finances of SMEs are often intertwined with household finances, and
personal property and guarantees are used to secure business loans, as mentioned in Section 2.2.
Two new insolvency tools were developed to help reduce the high levels of private debt. The Debt
Relief Order (based on UK and Irish models) allows debt relief of up to EUR 25,000 for debtors who have
virtually no assets, no income and who are at risk of social exclusion. The Personal Repayment Plan (mostly
replicating the Irish Personal Insolvency Arrangement) establishes a procedure that enables an insolvent
debtor, with the mandatory help of an insolvency practitioner, to develop a restructuring plan which, where
possible, should avoid the sale of the primary residence. The plan, which could last up to 5-6 years, must be
approved by the creditors (35% veto right, of all creditors). The Personal Repayment Plan contains a
compulsory element which – in the event of failure to agree a restructuring – allows the debtor to apply to
the court for its imposition on the creditors, with the objective of avoiding bankruptcy and foreclosure,
subject to certain criteria (value of primary residence up to EUR 300,000 and total amount of debt up to
EUR 350,000). Creditors must at least receive the bankruptcy liquidation value in a compulsory plan. The
law establishing the Insolvency Service also regulates insolvency practitioners' eligibility criteria, training
and licensing.
The new foreclosure legislation strikes a better balance between the rights of debtors and creditors. It
allows mortgage creditors to conduct auctions/sales of collateral property without involving government
agencies if a debtor defaults on payment for more than 120 days. There are clear timelines for all procedural
steps, including appeals. This should significantly reduce the time required to foreclose a property in
mortgage default, which could previously have taken about 20 years. This law applies to all types of
property, including primary residences, and is expected to encourage more realistic engagement by debtors.
Implementation of the new foreclosure and insolvency framework has been slow. Full implementation
of the foreclosure legislation has been delayed by slow progress in selecting locations for auctions, but the
first auctions are expected to be held from the second quarter of 2016. As regards personal insolvency, by
end-February 2016 490 Debt Relief Order applications had been made, and there were only 8 requests for
Personal Insolvency Arrangements. There has been a commitment by the Cypriot authorities, in the context
of the economic adjustment programme, to conduct an assessment of the functioning and of the first
experiences of the private sector debt restructuring and foreclosure frameworks, with the aim of defining an
action plan of modifications to those frameworks to correct any deficiencies, but as of mid-March 2016 such
an assessment had not been initiated.
2.1. Financial sector
22
Box 2.1.2: The efficiency of the justice system in Cyprus
The efficiency indicators of Cyprus's justice system lag significantly behind the EU average. According
to the forthcoming 2016 EU Justice Scoreboard, proceedings in the area of civil and commercial law are
among the lengthiest in the EU and the backlog of pending cases is among the highest in the EU. The
reasons are manifold: relatively low access costs, inefficient procedures, insufficient use of information and
communication technologies in courts, underuse of Alternative Dispute Resolution methods, and the
relatively modest budgetary resources allocated to the courts system.
No qualitative assessment of the justice system is published. Cyprus is among those Member States that
do not conduct surveys among court users or legal professionals on the quality of the justice system.
Moreover, the career of Cypriot judges does not include any compulsory training.
The Cypriot authorities plan to modernise the justice system. The main concern will be improving
efficiency as regards general operations, management systems and the use of ICT in court. Various reforms
have been adopted in civil, administrative and commercial justice to cut backlogs in court cases, which are
often considerable. Amendments to civil law have been proposed to expedite enforcement of court
judgments and make it more effective. There are also proposals to restrict the right to file appeals against
interlocutory decisions during proceedings. A new administrative court started work at the beginning of
2016, the aim being to speed up administrative justice proceedings. The authorities also envisage setting up
a Commercial Court, which may also operate in English with streamlined procedures, to reduce the length of
time take to settle commercial disputes. In addition to the above, the Cypriot authorities envisage
rationalising court fees and promoting the use of mediation.
To implement the new insolvency and foreclosure frameworks in full, and thus to reduce non-
performing loans, an efficient justice system is a sine qua non. Implementing the modernised framework
for personal and corporate insolvency and the new foreclosure legislation (see Box 2.1.1) depends largely on
courts' ability to deal efficiently with the flow of applications by both borrowers and creditors, which is
expected to be substantial. The efficiency of the court system should therefore have a bearing on the
resolution of legal disputes to do with restructuring bad loans, as well as on litigation over the transfer of
title deeds for mortgages properties (see Box 2.2.2). The swift resolution of such disputes could help clean
up banks' balance sheet and have a positive effect on the investment environment in the housing sector.
The efficiency of the justice system affects commercial and investment decisions. It is a key parameter
in businesses' ability to enforce contracts and ensure that investment decisions are taken with sufficient legal
certainty, as reflected in indicators of the ease of doing business and of global competitiveness (1).
Modernising the Cypriot justice system would, therefore, be conducive to growth.
(1) World Bank (2016) and World Economic Forum (2015)

23
In Cyprus, the ratio of debt to GDP is very high
for both households and non-financial
corporations (NFCs). The private debt-to-GDP
ratio in Cyprus is now over 340%, which is among
the highest in the euro area. One of the reasons for
the high level of debt is that the debt of ship-
owning special purpose entities (SPEs) registered
in Cyprus is incorporated in the Cypriot national
accounts (following the adoption of ESA2010)
(14
). This effect on Cypriot corporate debt
amounted to roughly 75% of GDP in 2014 (Graph
2.2.1). It corresponds broadly to loans contracted
abroad by companies which are virtually
disconnected from the domestic economy. Setting
this effect aside, debt related to other types of non-
financial corporations rose steadily from about
45% of GDP in 1995 to 140% in 2014. Similarly,
household debt rose from just over 60% of GDP to
about 130%, in the same period.
Graph 2.2.1: Evolution of private sector indebtedness
Source: Eurostat and Central Bank of Cyprus
The private debt-to-GDP ratio, excluding
special purpose entities (SPEs), is the by-
product of excessive credit growth before the
crisis and significant decline in nominal GDP as
the crisis unfolded. Between 2004 and 2008,
following EU accession, private debt stocks
increased significantly by and annual average of
16% a year, while nominal GDP growth averaged
8% a year. This led to a significant accumulation
of debt relative to GDP, which, setting aside SPEs,
(14) The role of these types of companies in the economy is
discussed in more detail in section 2.3.
reached 200% already in 2008. Although the
increase in private debt stocks slowed down
subsequently, even declining in 2013 and 2014, the
significant contraction in nominal GDP growth,
due to both real GDP contraction and negative
inflation, continued to feed into the non-SPE
private debt-to-GDP ratio (Graph 2.2.2).
Graph 2.2.2: Growth in the private sector debt-to-GDP
ratio (excluding SPEs), and contributions
Source: Eurostat and Central Bank of Cyprus
There are important adverse feedback loops
between low nominal growth and failure to
reduce debt, which have been aggravated in
Cyprus by the presence of high non-performing
loans (NPLs). Lower nominal income growth not
only increases the debt-to-GDP ratio directly by
reducing the denominator, but also implies that
households and corporations have less disposable
income to make payments on their existing debt. It
may drive some into default, increasing the stock
of non-performing loans, which in Cyprus has
reached around 55% of total loans to households
and non-financial corporations. In the presence of
non-performing loans total debt stocks continue to
increase even if no new credit is provided, due to
the capitalisation of interest accrued on delayed
payments. Increasing non-compliance forces banks
to increase provisions and exacerbates problems of
asymmetric information, constraining the flow of
credit to the economy that could be used to finance
productive investment. Although most existing
firms face important deleveraging pressures, new
credit is crucial to promote viable projects,
increase business dynamics, and foster the R&D
0
50
100
150
200
250
300
350
400
1995
1996
1997
1998
1999
2000
2001
2002
2003
2004
2005
2006
2007
2008
2009
2010
2011
2012
2013
2014
%
Debt-to-GDP ratio of non-financial special purpose entities
Non-financial corporations Debt-to-GDP ratio excluding debt ofnon-financial special purpose entitiesHousehold debt-GDP ratio
-40
-20
0
20
40
1995
1996
1997
1998
1999
2000
2001
2002
2003
2004
2005
2006
2007
2008
2009
2010
2011
2012
2013
2014
%
Valuation changesInflation (negative)Real GDP growth (negative)Household debt transactionsNFCs excluding special purpose entities debt transactionsPrivate debt to GDP ratio, % change
2.2. PRIVATE INDEBTEDNESS
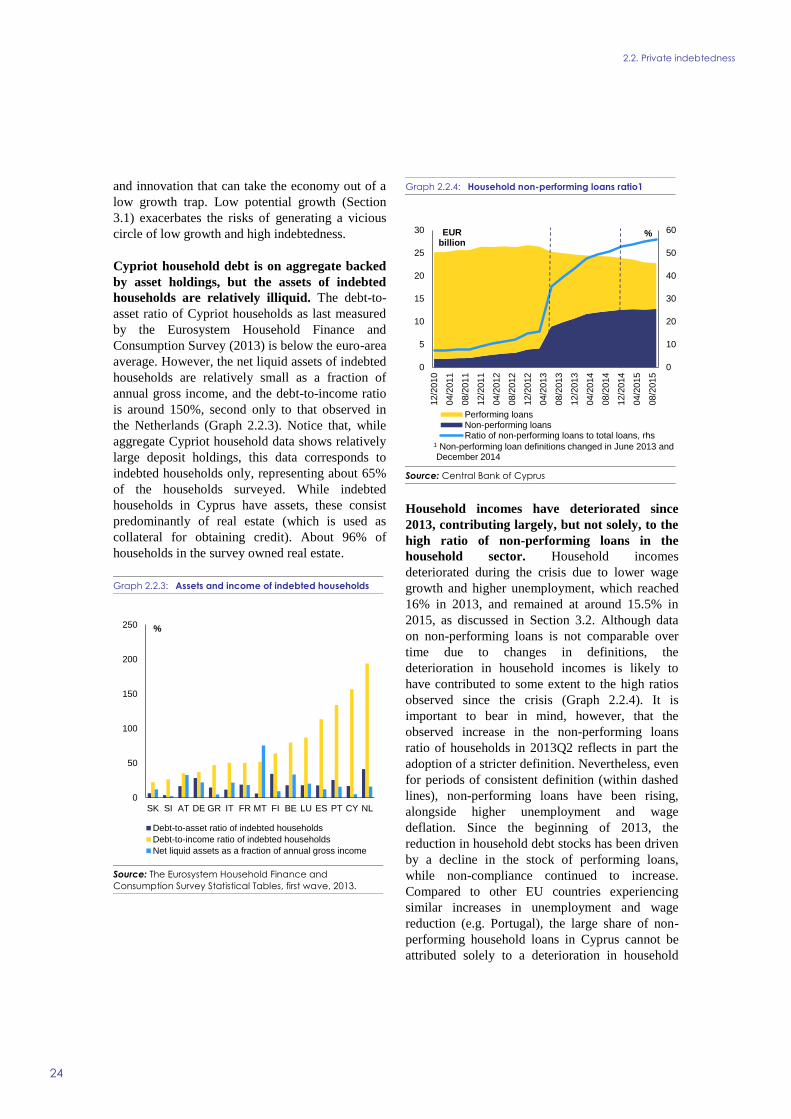
2.2. Private indebtedness
24
and innovation that can take the economy out of a
low growth trap. Low potential growth (Section
3.1) exacerbates the risks of generating a vicious
circle of low growth and high indebtedness.
Cypriot household debt is on aggregate backed
by asset holdings, but the assets of indebted
households are relatively illiquid. The debt-to-
asset ratio of Cypriot households as last measured
by the Eurosystem Household Finance and
Consumption Survey (2013) is below the euro-area
average. However, the net liquid assets of indebted
households are relatively small as a fraction of
annual gross income, and the debt-to-income ratio
is around 150%, second only to that observed in
the Netherlands (Graph 2.2.3). Notice that, while
aggregate Cypriot household data shows relatively
large deposit holdings, this data corresponds to
indebted households only, representing about 65%
of the households surveyed. While indebted
households in Cyprus have assets, these consist
predominantly of real estate (which is used as
collateral for obtaining credit). About 96% of
households in the survey owned real estate.
Graph 2.2.3: Assets and income of indebted households
Source: The Eurosystem Household Finance and
Consumption Survey Statistical Tables, first wave, 2013.
Graph 2.2.4: Household non-performing loans ratio1
Source: Central Bank of Cyprus
Household incomes have deteriorated since
2013, contributing largely, but not solely, to the
high ratio of non-performing loans in the
household sector. Household incomes
deteriorated during the crisis due to lower wage
growth and higher unemployment, which reached
16% in 2013, and remained at around 15.5% in
2015, as discussed in Section 3.2. Although data
on non-performing loans is not comparable over
time due to changes in definitions, the
deterioration in household incomes is likely to
have contributed to some extent to the high ratios
observed since the crisis (Graph 2.2.4). It is
important to bear in mind, however, that the
observed increase in the non-performing loans
ratio of households in 2013Q2 reflects in part the
adoption of a stricter definition. Nevertheless, even
for periods of consistent definition (within dashed
lines), non-performing loans have been rising,
alongside higher unemployment and wage
deflation. Since the beginning of 2013, the
reduction in household debt stocks has been driven
by a decline in the stock of performing loans,
while non-compliance continued to increase.
Compared to other EU countries experiencing
similar increases in unemployment and wage
reduction (e.g. Portugal), the large share of non-
performing household loans in Cyprus cannot be
attributed solely to a deterioration in household
0
50
100
150
200
250
SK SI AT DE GR IT FR MT FI BE LU ES PT CY NL
%
Debt-to-asset ratio of indebted households
Debt-to-income ratio of indebted households
Net liquid assets as a fraction of annual gross income
0
10
20
30
40
50
60
0
5
10
15
20
25
30
12/2
010
04/2
011
08/2
011
12/2
011
04/2
012
08/2
012
12/2
012
04/2
013
08/2
013
12/2
013
04/2
014
08/2
014
12/2
014
04/2
015
08/2
015
%EUR billion
Performing loansNon-performing loansRatio of non-performing loans to total loans, rhs
1 Non-performing loan definitions changed in June 2013 andDecember 2014
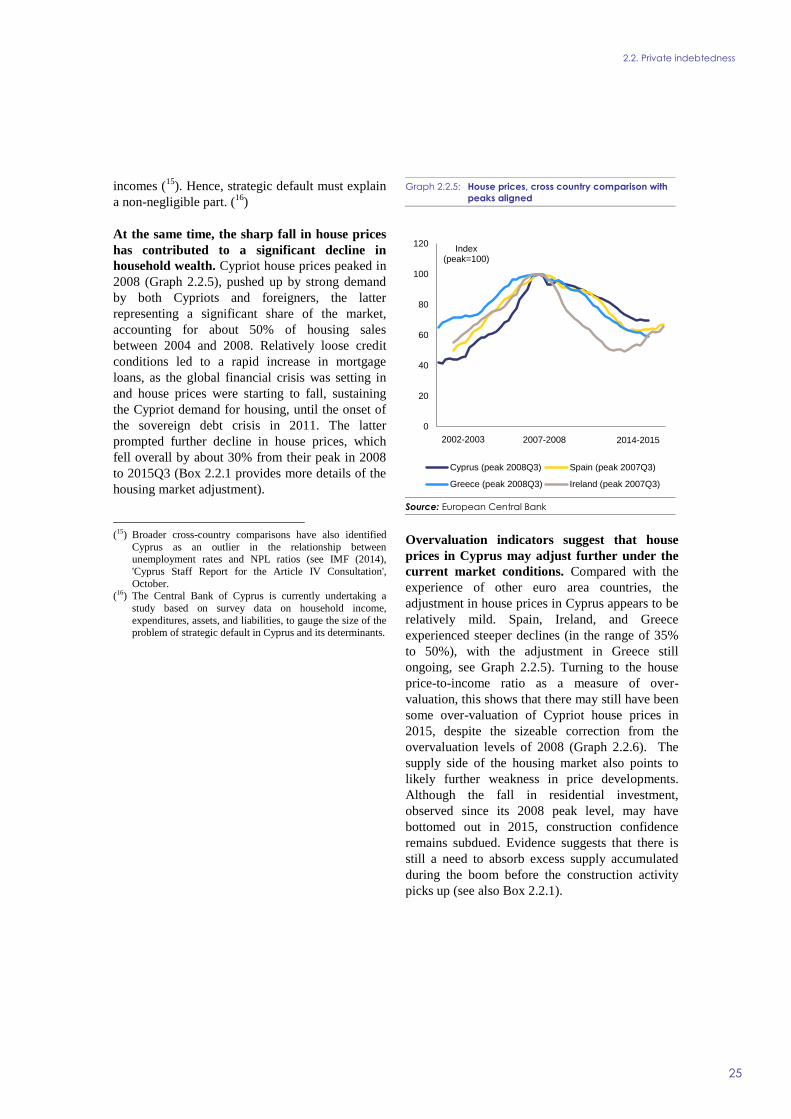
2.2. Private indebtedness
25
incomes (15
). Hence, strategic default must explain
a non-negligible part. (16
)
At the same time, the sharp fall in house prices
has contributed to a significant decline in
household wealth. Cypriot house prices peaked in
2008 (Graph 2.2.5), pushed up by strong demand
by both Cypriots and foreigners, the latter
representing a significant share of the market,
accounting for about 50% of housing sales
between 2004 and 2008. Relatively loose credit
conditions led to a rapid increase in mortgage
loans, as the global financial crisis was setting in
and house prices were starting to fall, sustaining
the Cypriot demand for housing, until the onset of
the sovereign debt crisis in 2011. The latter
prompted further decline in house prices, which
fell overall by about 30% from their peak in 2008
to 2015Q3 (Box 2.2.1 provides more details of the
housing market adjustment).
(15) Broader cross-country comparisons have also identified
Cyprus as an outlier in the relationship between unemployment rates and NPL ratios (see IMF (2014),
'Cyprus Staff Report for the Article IV Consultation',
October. (16) The Central Bank of Cyprus is currently undertaking a
study based on survey data on household income,
expenditures, assets, and liabilities, to gauge the size of the
problem of strategic default in Cyprus and its determinants.
Graph 2.2.5: House prices, cross country comparison with
peaks aligned
Source: European Central Bank
Overvaluation indicators suggest that house
prices in Cyprus may adjust further under the
current market conditions. Compared with the
experience of other euro area countries, the
adjustment in house prices in Cyprus appears to be
relatively mild. Spain, Ireland, and Greece
experienced steeper declines (in the range of 35%
to 50%), with the adjustment in Greece still
ongoing, see Graph 2.2.5). Turning to the house
price-to-income ratio as a measure of over-
valuation, this shows that there may still have been
some over-valuation of Cypriot house prices in
2015, despite the sizeable correction from the
overvaluation levels of 2008 (Graph 2.2.6). The
supply side of the housing market also points to
likely further weakness in price developments.
Although the fall in residential investment,
observed since its 2008 peak level, may have
bottomed out in 2015, construction confidence
remains subdued. Evidence suggests that there is
still a need to absorb excess supply accumulated
during the boom before the construction activity
picks up (see also Box 2.2.1).
0
20
40
60
80
100
120
2002Q
1
2002Q
4
2003Q
3
2004Q
2
2005Q
1
2005Q
4
2006Q
3
2007Q
2
2008Q
1
2008Q
4
2009Q
3
2010Q
2
2011Q
1
2011Q
4
2012Q
3
2013Q
2
2014Q
1
2014Q
4
2015Q
3
Index (peak=100)
Cyprus (peak 2008Q3) Spain (peak 2007Q3)
Greece (peak 2008Q3) Ireland (peak 2007Q3)
2007-2008 2014-20152002-2003
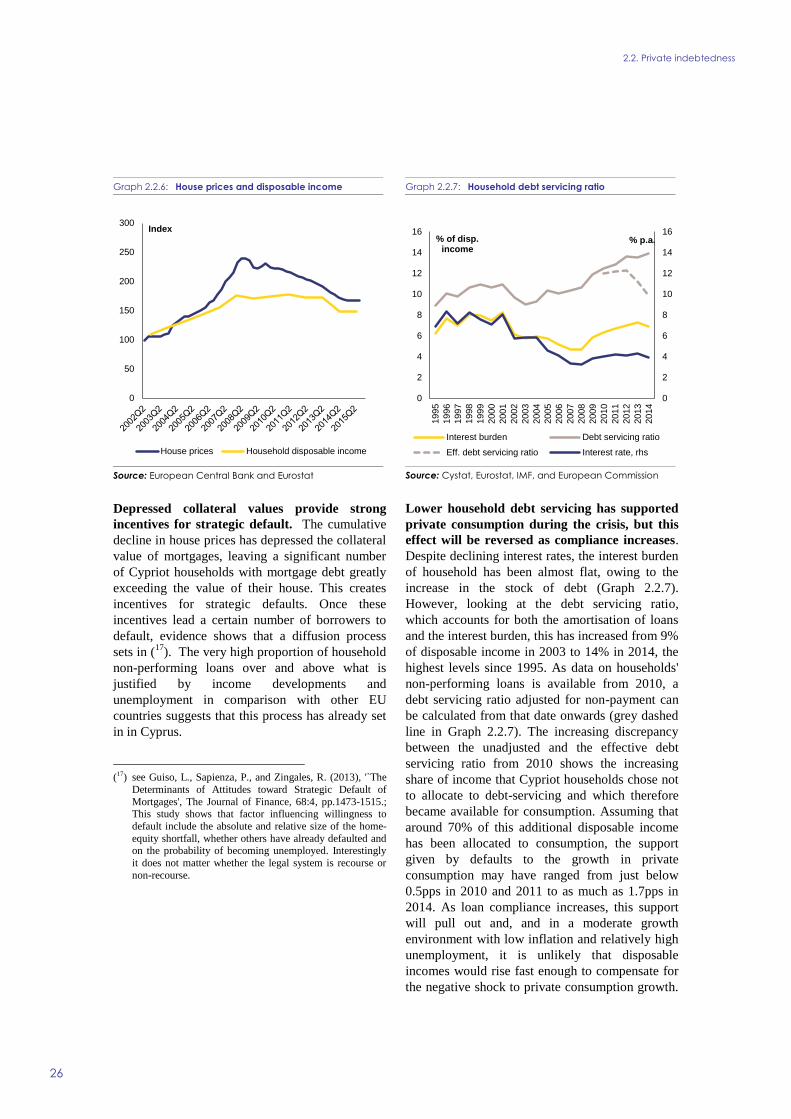
2.2. Private indebtedness
26
Graph 2.2.6: House prices and disposable income
Source: European Central Bank and Eurostat
Depressed collateral values provide strong
incentives for strategic default. The cumulative
decline in house prices has depressed the collateral
value of mortgages, leaving a significant number
of Cypriot households with mortgage debt greatly
exceeding the value of their house. This creates
incentives for strategic defaults. Once these
incentives lead a certain number of borrowers to
default, evidence shows that a diffusion process
sets in (17
). The very high proportion of household
non-performing loans over and above what is
justified by income developments and
unemployment in comparison with other EU
countries suggests that this process has already set
in in Cyprus.
(17) see Guiso, L., Sapienza, P., and Zingales, R. (2013), '`The
Determinants of Attitudes toward Strategic Default of
Mortgages', The Journal of Finance, 68:4, pp.1473-1515.; This study shows that factor influencing willingness to
default include the absolute and relative size of the home-
equity shortfall, whether others have already defaulted and on the probability of becoming unemployed. Interestingly
it does not matter whether the legal system is recourse or
non-recourse.
Graph 2.2.7: Household debt servicing ratio
Source: Cystat, Eurostat, IMF, and European Commission
Lower household debt servicing has supported
private consumption during the crisis, but this
effect will be reversed as compliance increases.
Despite declining interest rates, the interest burden
of household has been almost flat, owing to the
increase in the stock of debt (Graph 2.2.7).
However, looking at the debt servicing ratio,
which accounts for both the amortisation of loans
and the interest burden, this has increased from 9%
of disposable income in 2003 to 14% in 2014, the
highest levels since 1995. As data on households'
non-performing loans is available from 2010, a
debt servicing ratio adjusted for non-payment can
be calculated from that date onwards (grey dashed
line in Graph 2.2.7). The increasing discrepancy
between the unadjusted and the effective debt
servicing ratio from 2010 shows the increasing
share of income that Cypriot households chose not
to allocate to debt-servicing and which therefore
became available for consumption. Assuming that
around 70% of this additional disposable income
has been allocated to consumption, the support
given by defaults to the growth in private
consumption may have ranged from just below
0.5pps in 2010 and 2011 to as much as 1.7pps in
2014. As loan compliance increases, this support
will pull out and, and in a moderate growth
environment with low inflation and relatively high
unemployment, it is unlikely that disposable
incomes would rise fast enough to compensate for
the negative shock to private consumption growth.
0
50
100
150
200
250
300Index
House prices Household disposable income
0
2
4
6
8
10
12
14
16
0
2
4
6
8
10
12
14
16
1995
1996
1997
1998
1999
2000
2001
2002
2003
2004
2005
2006
2007
2008
2009
2010
2011
2012
2013
2014
% p.a.% of disp. income
Interest burden Debt servicing ratio
Eff. debt servicing ratio Interest rate, rhs
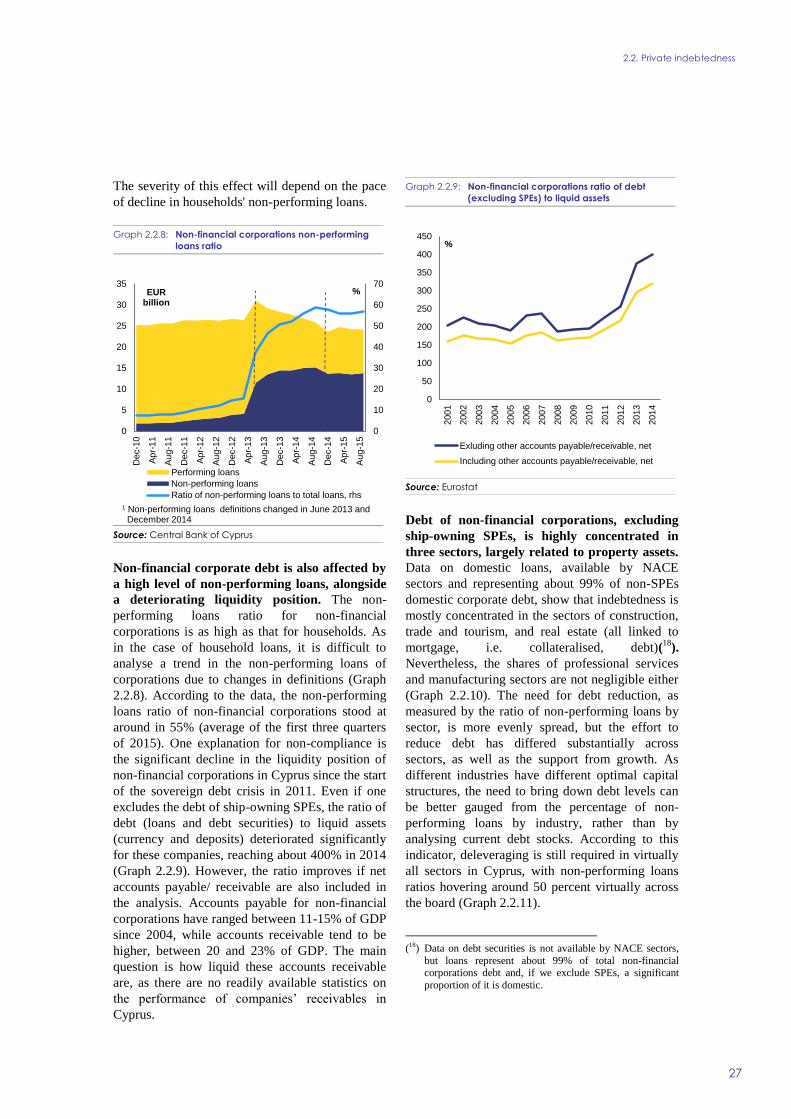
2.2. Private indebtedness
27
The severity of this effect will depend on the pace
of decline in households' non-performing loans.
Graph 2.2.8: Non-financial corporations non-performing
loans ratio
Source: Central Bank of Cyprus
Non-financial corporate debt is also affected by
a high level of non-performing loans, alongside
a deteriorating liquidity position. The non-
performing loans ratio for non-financial
corporations is as high as that for households. As
in the case of household loans, it is difficult to
analyse a trend in the non-performing loans of
corporations due to changes in definitions (Graph
2.2.8). According to the data, the non-performing
loans ratio of non-financial corporations stood at
around in 55% (average of the first three quarters
of 2015). One explanation for non-compliance is
the significant decline in the liquidity position of
non-financial corporations in Cyprus since the start
of the sovereign debt crisis in 2011. Even if one
excludes the debt of ship-owning SPEs, the ratio of
debt (loans and debt securities) to liquid assets
(currency and deposits) deteriorated significantly
for these companies, reaching about 400% in 2014
(Graph 2.2.9). However, the ratio improves if net
accounts payable/ receivable are also included in
the analysis. Accounts payable for non-financial
corporations have ranged between 11-15% of GDP
since 2004, while accounts receivable tend to be
higher, between 20 and 23% of GDP. The main
question is how liquid these accounts receivable
are, as there are no readily available statistics on
the performance of companies’ receivables in
Cyprus.
Graph 2.2.9: Non-financial corporations ratio of debt
(excluding SPEs) to liquid assets
Source: Eurostat
Debt of non-financial corporations, excluding
ship-owning SPEs, is highly concentrated in
three sectors, largely related to property assets.
Data on domestic loans, available by NACE
sectors and representing about 99% of non-SPEs
domestic corporate debt, show that indebtedness is
mostly concentrated in the sectors of construction,
trade and tourism, and real estate (all linked to
mortgage, i.e. collateralised, debt)(18
).
Nevertheless, the shares of professional services
and manufacturing sectors are not negligible either
(Graph 2.2.10). The need for debt reduction, as
measured by the ratio of non-performing loans by
sector, is more evenly spread, but the effort to
reduce debt has differed substantially across
sectors, as well as the support from growth. As
different industries have different optimal capital
structures, the need to bring down debt levels can
be better gauged from the percentage of non-
performing loans by industry, rather than by
analysing current debt stocks. According to this
indicator, deleveraging is still required in virtually
all sectors in Cyprus, with non-performing loans
ratios hovering around 50 percent virtually across
the board (Graph 2.2.11).
(18) Data on debt securities is not available by NACE sectors,
but loans represent about 99% of total non-financial corporations debt and, if we exclude SPEs, a significant
proportion of it is domestic.
0
10
20
30
40
50
60
70
0
5
10
15
20
25
30
35
Dec-1
0
Ap
r-11
Au
g-1
1
Dec-1
1
Ap
r-12
Au
g-1
2
Dec-1
2
Ap
r-13
Au
g-1
3
Dec-1
3
Ap
r-14
Au
g-1
4
Dec-1
4
Ap
r-15
Au
g-1
5
%EUR billion
Performing loans
Non-performing loans
Ratio of non-performing loans to total loans, rhs
1 Non-performing loans definitions changed in June 2013 and December 2014
0
50
100
150
200
250
300
350
400
450
2001
2002
2003
2004
2005
2006
2007
2008
2009
2010
2011
2012
2013
2014
%
Exluding other accounts payable/receivable, net
Including other accounts payable/receivable, net
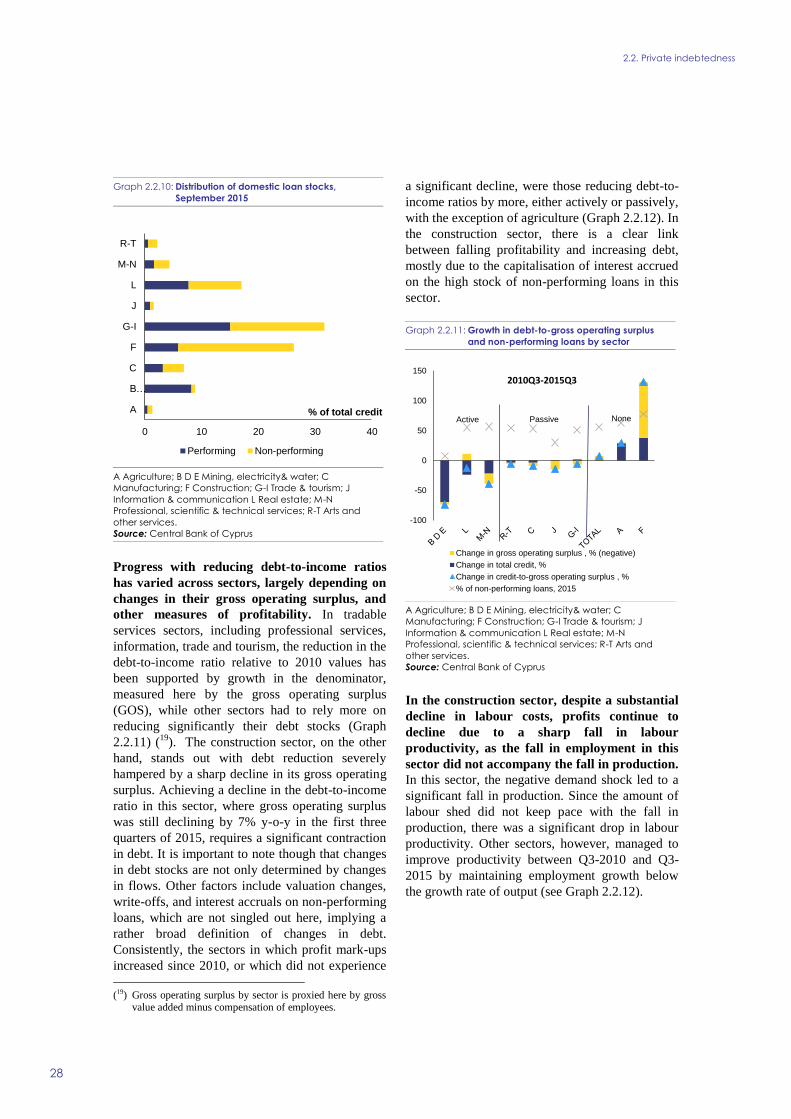
2.2. Private indebtedness
28
Graph 2.2.10: Distribution of domestic loan stocks,
September 2015
A Agriculture; B D E Mining, electricity& water; C
Manufacturing; F Construction; G-I Trade & tourism; J
Information & communication L Real estate; M-N
Professional, scientific & technical services; R-T Arts and
other services.
Source: Central Bank of Cyprus
Progress with reducing debt-to-income ratios
has varied across sectors, largely depending on
changes in their gross operating surplus, and
other measures of profitability. In tradable
services sectors, including professional services,
information, trade and tourism, the reduction in the
debt-to-income ratio relative to 2010 values has
been supported by growth in the denominator,
measured here by the gross operating surplus
(GOS), while other sectors had to rely more on
reducing significantly their debt stocks (Graph
2.2.11) (19
). The construction sector, on the other
hand, stands out with debt reduction severely
hampered by a sharp decline in its gross operating
surplus. Achieving a decline in the debt-to-income
ratio in this sector, where gross operating surplus
was still declining by 7% y-o-y in the first three
quarters of 2015, requires a significant contraction
in debt. It is important to note though that changes
in debt stocks are not only determined by changes
in flows. Other factors include valuation changes,
write-offs, and interest accruals on non-performing
loans, which are not singled out here, implying a
rather broad definition of changes in debt.
Consistently, the sectors in which profit mark-ups
increased since 2010, or which did not experience
(19) Gross operating surplus by sector is proxied here by gross
value added minus compensation of employees.
a significant decline, were those reducing debt-to-
income ratios by more, either actively or passively,
with the exception of agriculture (Graph 2.2.12). In
the construction sector, there is a clear link
between falling profitability and increasing debt,
mostly due to the capitalisation of interest accrued
on the high stock of non-performing loans in this
sector.
Graph 2.2.11: Growth in debt-to-gross operating surplus
and non-performing loans by sector
A Agriculture; B D E Mining, electricity& water; C
Manufacturing; F Construction; G-I Trade & tourism; J
Information & communication L Real estate; M-N
Professional, scientific & technical services; R-T Arts and
other services.
Source: Central Bank of Cyprus
In the construction sector, despite a substantial
decline in labour costs, profits continue to
decline due to a sharp fall in labour
productivity, as the fall in employment in this
sector did not accompany the fall in production.
In this sector, the negative demand shock led to a
significant fall in production. Since the amount of
labour shed did not keep pace with the fall in
production, there was a significant drop in labour
productivity. Other sectors, however, managed to
improve productivity between Q3-2010 and Q3-
2015 by maintaining employment growth below
the growth rate of output (see Graph 2.2.12).
0 10 20 30 40
A
B…
C
F
G-I
J
L
M-N
R-T
% of total credit
Performing Non-performing
-100
-50
0
50
100
150
2010Q3-2015Q3
Change in gross operating surplus , % (negative)
Change in total credit, %
Change in credit-to-gross operating surplus , %
% of non-performing loans, 2015
Passive NoneActive
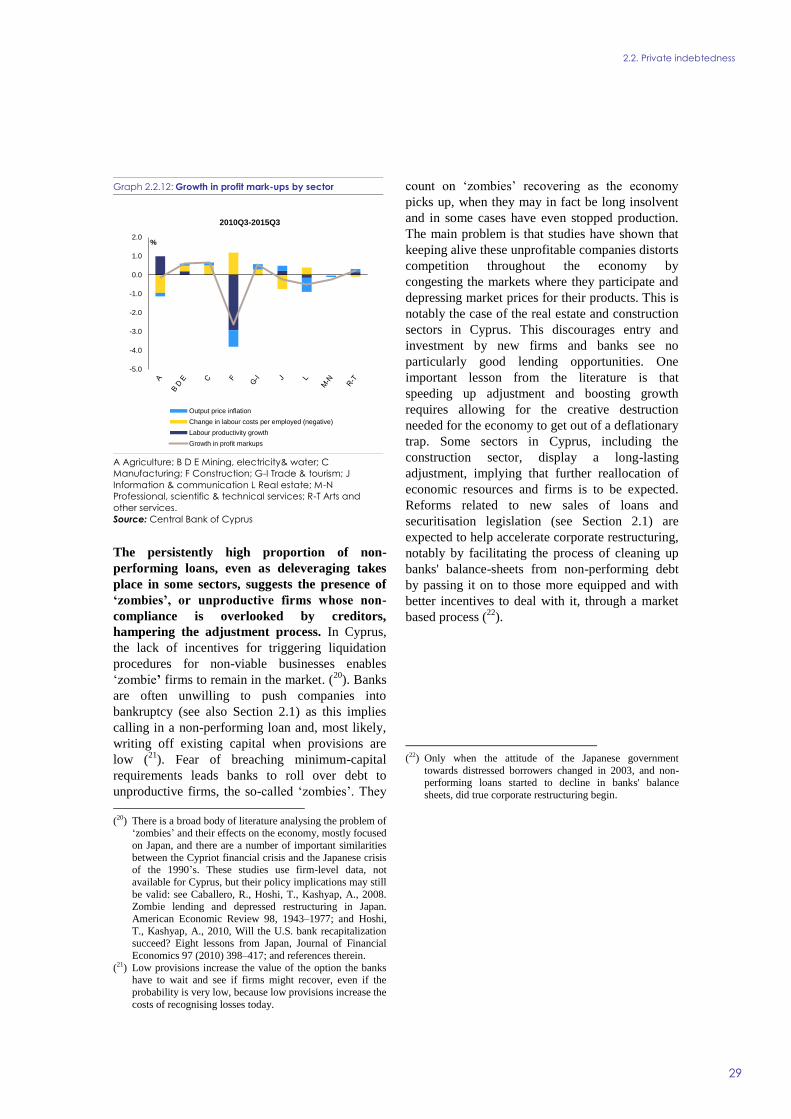
2.2. Private indebtedness
29
Graph 2.2.12: Growth in profit mark-ups by sector
A Agriculture; B D E Mining, electricity& water; C
Manufacturing; F Construction; G-I Trade & tourism; J
Information & communication L Real estate; M-N
Professional, scientific & technical services; R-T Arts and
other services.
Source: Central Bank of Cyprus
The persistently high proportion of non-
performing loans, even as deleveraging takes
place in some sectors, suggests the presence of
‘zombies’, or unproductive firms whose non-
compliance is overlooked by creditors,
hampering the adjustment process. In Cyprus,
the lack of incentives for triggering liquidation
procedures for non-viable businesses enables
‘zombie’ firms to remain in the market. (20
). Banks
are often unwilling to push companies into
bankruptcy (see also Section 2.1) as this implies
calling in a non-performing loan and, most likely,
writing off existing capital when provisions are
low (21
). Fear of breaching minimum-capital
requirements leads banks to roll over debt to
unproductive firms, the so-called ‘zombies’. They
(20) There is a broad body of literature analysing the problem of
‘zombies’ and their effects on the economy, mostly focused
on Japan, and there are a number of important similarities
between the Cypriot financial crisis and the Japanese crisis of the 1990’s. These studies use firm-level data, not
available for Cyprus, but their policy implications may still
be valid: see Caballero, R., Hoshi, T., Kashyap, A., 2008. Zombie lending and depressed restructuring in Japan.
American Economic Review 98, 1943–1977; and Hoshi,
T., Kashyap, A., 2010, Will the U.S. bank recapitalization succeed? Eight lessons from Japan, Journal of Financial
Economics 97 (2010) 398–417; and references therein.
(21) Low provisions increase the value of the option the banks have to wait and see if firms might recover, even if the
probability is very low, because low provisions increase the
costs of recognising losses today.
count on ‘zombies’ recovering as the economy
picks up, when they may in fact be long insolvent
and in some cases have even stopped production.
The main problem is that studies have shown that
keeping alive these unprofitable companies distorts
competition throughout the economy by
congesting the markets where they participate and
depressing market prices for their products. This is
notably the case of the real estate and construction
sectors in Cyprus. This discourages entry and
investment by new firms and banks see no
particularly good lending opportunities. One
important lesson from the literature is that
speeding up adjustment and boosting growth
requires allowing for the creative destruction
needed for the economy to get out of a deflationary
trap. Some sectors in Cyprus, including the
construction sector, display a long-lasting
adjustment, implying that further reallocation of
economic resources and firms is to be expected.
Reforms related to new sales of loans and
securitisation legislation (see Section 2.1) are
expected to help accelerate corporate restructuring,
notably by facilitating the process of cleaning up
banks' balance-sheets from non-performing debt
by passing it on to those more equipped and with
better incentives to deal with it, through a market
based process (22
).
(22) Only when the attitude of the Japanese government
towards distressed borrowers changed in 2003, and non-performing loans started to decline in banks' balance
sheets, did true corporate restructuring begin.
-5.0
-4.0
-3.0
-2.0
-1.0
0.0
1.0
2.0%
2010Q3-2015Q3
Output price inflation
Change in labour costs per employed (negative)
Labour productivity growth
Growth in profit markups
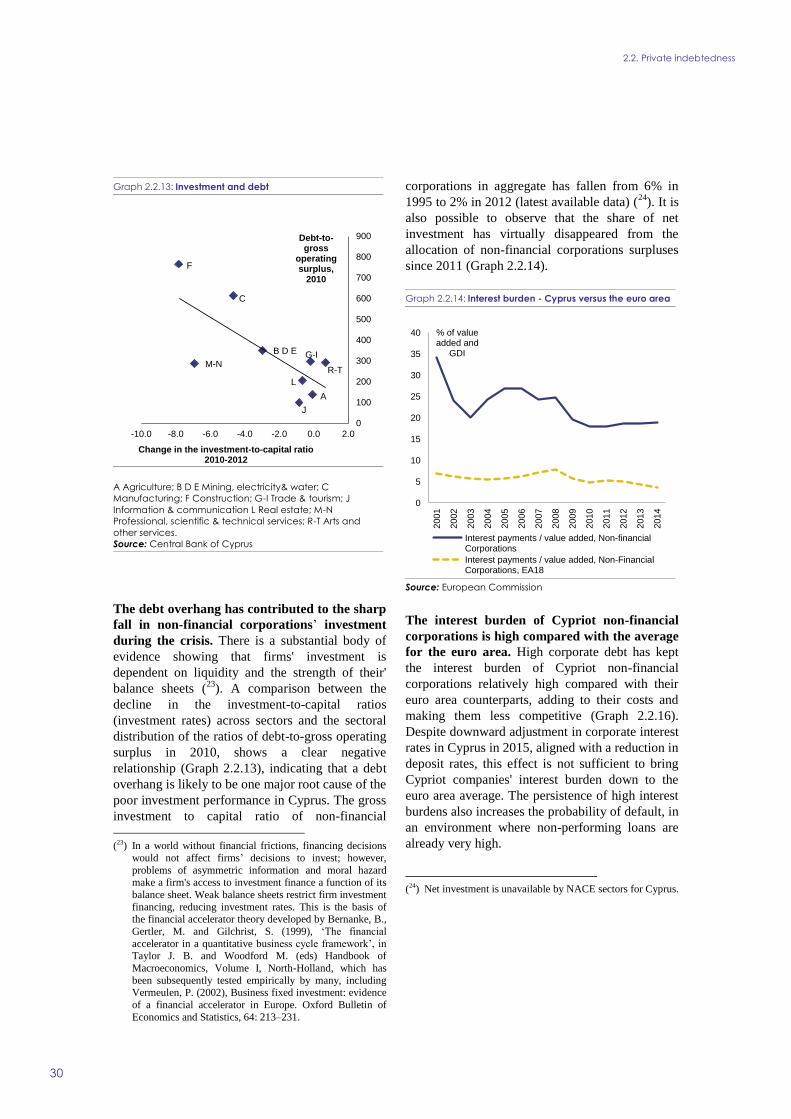
2.2. Private indebtedness
30
Graph 2.2.13: Investment and debt
A Agriculture; B D E Mining, electricity& water; C
Manufacturing; F Construction; G-I Trade & tourism; J
Information & communication L Real estate; M-N
Professional, scientific & technical services; R-T Arts and
other services.
Source: Central Bank of Cyprus
The debt overhang has contributed to the sharp
fall in non-financial corporations’ investment
during the crisis. There is a substantial body of
evidence showing that firms' investment is
dependent on liquidity and the strength of their'
balance sheets (23
). A comparison between the
decline in the investment-to-capital ratios
(investment rates) across sectors and the sectoral
distribution of the ratios of debt-to-gross operating
surplus in 2010, shows a clear negative
relationship (Graph 2.2.13), indicating that a debt
overhang is likely to be one major root cause of the
poor investment performance in Cyprus. The gross
investment to capital ratio of non-financial
(23) In a world without financial frictions, financing decisions
would not affect firms’ decisions to invest; however,
problems of asymmetric information and moral hazard
make a firm's access to investment finance a function of its
balance sheet. Weak balance sheets restrict firm investment
financing, reducing investment rates. This is the basis of the financial accelerator theory developed by Bernanke, B.,
Gertler, M. and Gilchrist, S. (1999), ‘The financial
accelerator in a quantitative business cycle framework’, in Taylor J. B. and Woodford M. (eds) Handbook of
Macroeconomics, Volume I, North-Holland, which has
been subsequently tested empirically by many, including Vermeulen, P. (2002), Business fixed investment: evidence
of a financial accelerator in Europe. Oxford Bulletin of
Economics and Statistics, 64: 213–231.
corporations in aggregate has fallen from 6% in
1995 to 2% in 2012 (latest available data) (24
). It is
also possible to observe that the share of net
investment has virtually disappeared from the
allocation of non-financial corporations surpluses
since 2011 (Graph 2.2.14).
Graph 2.2.14: Interest burden - Cyprus versus the euro area
Source: European Commission
The interest burden of Cypriot non-financial
corporations is high compared with the average
for the euro area. High corporate debt has kept
the interest burden of Cypriot non-financial
corporations relatively high compared with their
euro area counterparts, adding to their costs and
making them less competitive (Graph 2.2.16).
Despite downward adjustment in corporate interest
rates in Cyprus in 2015, aligned with a reduction in
deposit rates, this effect is not sufficient to bring
Cypriot companies' interest burden down to the
euro area average. The persistence of high interest
burdens also increases the probability of default, in
an environment where non-performing loans are
already very high.
(24) Net investment is unavailable by NACE sectors for Cyprus.
A
R-T
F
B D E
J
C
M-N
L
G-I
0
100
200
300
400
500
600
700
800
900
-10.0 -8.0 -6.0 -4.0 -2.0 0.0 2.0
Debt-to-gross
operating surplus,
2010
Change in the investment-to-capital ratio 2010-2012
0
5
10
15
20
25
30
35
40
2001
2002
2003
2004
2005
2006
2007
2008
2009
2010
2011
2012
2013
2014
% of value added and
GDI
Interest payments / value added, Non-financialCorporations
Interest payments / value added, Non-FinancialCorporations, EA18

2.2. Private indebtedness
31
Graph 2.2.15: Non-financial corporations surplus allocation
Source: European Commission
While the newly reformed foreclosure and
insolvency frameworks in Cyprus provide
better incentives for the rebalancing of private
sector balance sheets, but their role in the
deleveraging process has been so far limited.
The purpose of these frameworks is to create better
incentives for households and non-financial
corporations to actively seek to restructure their
debts in a sustainably (25
). The new legislation
strikes a better balance between debtors' and
creditors' rights and is expected to help bring
viable debtors to the negotiating table, while
facilitating the resolution of unviable debts, in line
with the 2016 Council recommendations for the
euro area. However, the laws adopted by
parliament following prolonged discussions are
cumbersome and make provision for the possible
involvement of the courts at several stages in the
process, in an already overburdened judicial
system (see Box 2.1.2). Up to early 2016, the use
of the new foreclosure law and insolvency tools
(25) It would seem that institutions negatively affected the
paying culture of Cypriot households in the past.
According to Le Blanc et al. (2015), in the first wave of the Eurosystem Household Finance and Consumption Network
(HFCN) survey, held in 2010-2011, a relatively high
percentage of Cypriot households (about 20%) reported having left bills unpaid to finance expenditure in excess of
income, and a relatively low percentage reported selling
assets (less than 1%) or running down accumulated savings (less than 30%), in comparison with other countries (Le
Blanc J., Porpiglia, A., Teppa, F., Zhu, J., and Ziegelmeyer,
M. (2015), 'Household saving behaviour and credit constraints in the Euro area`, ECB working paper 1790.
was still very limited, showing that their efficiency
and implementation is not ensured in all respects
(Box 2.1.1).
In parallel, reforms of the housing market and
immovable property regulations are set to
support the functioning of the foreclosure and
insolvency frameworks, and rebuild the trust of
property investors. These reforms are being
discussed among the authorities and stakeholders,
but no agreement on adoption had been reached as
of early 2016 (see Box 2.2.2). Their purpose is to
ensure that titles are promptly issued, that all sales
contracts are properly registered, and that titles are
speedily transferred to the final buyer of the
property, all pre-requisites for a clear definition of
property rights, and for contract enforcement. All
of these conditions must be met if property rights
are to be clearly defined and contracts enforced,
creating better conditions for foreclosures and
liquidations to start taking place in the case of
unviable debts. This is a prerequisite for the
process of creative destruction, a better allocation
of resources, and the elimination of distortions,
thus paving the way for higher long-term growth
(see Section 3.1). Above all, these measures will
help restore the trust of foreign investors, shattered
during the crisis, and attract them back into the
Cypriot market.
-15
-10
-5
0
5
10
15
20
25
30
35
99 00 01 02 03 04 05 06 07 08 09 10 11 12 13 14 15
% of GDP
net equity payments other current transactions
direct taxes & contrib net other income
net interest payments capital transfers
net lending/borrowing net investment
net operating surplus retained profits (=NLB + inv)
2.2. Private indebtedness
32
(Continued on the next page)
Box 2.2.1: The Cypriot housing market
From 2004 to 2008 there was a surge in housing investment on the back of high sales to both residents
and foreigners, with non-residents representing about half the market. Between 2004 and 2008, sales
were high, above the average change in the adult Cypriot population (Graph 1). Cypriot house prices peaked
in 2008, pushed up by strong demand from both Cypriot residents and foreign buyers (predominantly from
the UK and Russia) for holiday and retirement homes. As the European financial crisis set in and foreigners
withdrew from the market, relatively loose credit conditions led to a rapid increase in mortgage loans,
sustaining the domestic demand for housing to some extent until the onset of the sovereign debt crisis in
2011 (Graph 2). Together with the rapid increase in sales, credit-financed residential investment by
developers surged until 2007 and faded only slowly afterwards. By 2010, this had resulted in a 35% increase
in the housing stock compared with 2003, which proved difficult for the market to absorb, given the sharp
decline in sales to non-residents (see also chapter 3.1 for an analysis of trends in construction investment).
The unanticipated fall in demand in 2008 set house prices on a steep downward trend. Between 2008
and 2009, non- residents' house purchases fell by about 84%, while demand from Cypriots fell significantly
less, by about 37%. In 2011, the sovereign debt crisis prompted a further fall in sales, by an average of about
15% in both 2011 and 2012. Finally, in 2013, sales dropped by a further 28%, led by a significant reduction
in sales to Cypriots. As a result, house prices fell overall as of 2015Q3 by about 30% in nominal terms and
about 31% in real terms. However, the housing busts in other EU countries resulted in even steeper declines
(35% in Spain and 50% in Ireland, in nominal terms), as illustrated in chapter 2.2.
The supply side has adjusted significantly, with investment and building permits falling sharply.
Residential investment has fallen to a fifth of its 2008 peak level, with this downward drift extending into
2015. Construction confidence remains subdued, mainly due to an extremely negative assessment of order
books, consistent with the small number of building permits granted. Data on the stock of unsold dwellings
varies according to different sources and state of completion, but could range from 5 to 10% of total housing
stock (or about 460% the average change in the Cypriot adult population). Muted supply side activity
suggests that the existing supply of properties may not have yet been absorbed.1
Demand remains subdued, as foreign buyers have not returned to the market, while residents' demand
is still constrained by several factors. Sales data show that foreigners are not returning to the Cypriot
market; sales to foreigners in 2015 were only about 12% of the 2007 peak. At the same time, residents'
demand remains constrained by tight credit conditions amid excessive private indebtedness, and by high
unemployment and depressed wages. Short-term house price dynamics are largely determined by households'
ability and willingness to finance housing assets through credit, irrespective of the housing market's valuation
level. Cyprus is the EU country facing most pressure to reduce debt, on both the supply and the demand side
(see section 2.2).
House prices appear to be still above equilibrium level and house price inflation in likely to remain
subdued. The Commission's winter forecasts for house prices in Cyprus suggest that prices could rise in
nominal terms in 2016 (2). However, this prediction should be approached with caution, as it is very sensitive
to changes in model parameters and to the data source used (Eurostat versus the European Central Bank).
Many other indicators suggest that houses are still overvalued and that further downward adjustment,
particularly in real terms, may still be needed under current market conditions. Firstly, the difference
between the actual inflation-adjusted house price and its filtered trend (Graph 4), which characterises the
'severity' of the upward and downward cyclical phases, combining the magnitude and duration of the peak-to-
trough and trough-to-peak phases, reveals that by 2015Q1 the bear phase had only attained about 78% of the
boom's 'severity'. Secondly, price-to-rental and price-to-income ratios, despite significant correction between
1 Estimates of the stock of unsold housing units based on land registry data vary according to the methodology used. If
estimated on the basis of the land registry value of sales contracts of titles remaining to be issued, the stock is at least 18,000; if estimated on the basis of the difference between building permits and sales contract registrations, it could
be around 50,000 at most. Back-of-envelope calculations using sales data also yield estimates within this range.
Assuming that investment in houses each year is determined by the number of units sold in that year and that new houses take two years to go on the market for sale, over-investment can be estimated as sales minus sales two years
previously. Adding this gap, between 2018 and 2015, gives about 28,000 unsold properties. However, this calculation
underestimates the stock of unsold houses if there were also houses left unsold before 2018. 2 European Economic Forecast: Winter 2016, Institutional paper 020, February, Box 1.4.
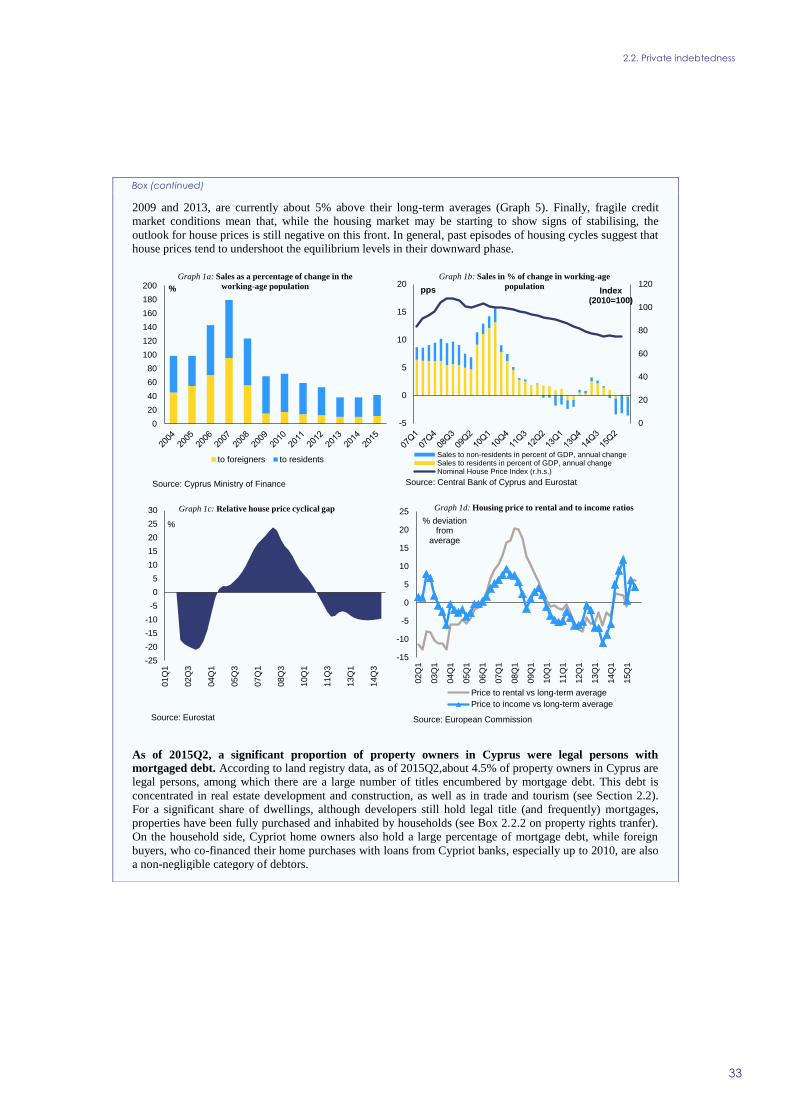
2.2. Private indebtedness
33
Box (continued)
2009 and 2013, are currently about 5% above their long-term averages (Graph 5). Finally, fragile credit
market conditions mean that, while the housing market may be starting to show signs of stabilising, the
outlook for house prices is still negative on this front. In general, past episodes of housing cycles suggest that
house prices tend to undershoot the equilibrium levels in their downward phase.
As of 2015Q2, a significant proportion of property owners in Cyprus were legal persons with
mortgaged debt. According to land registry data, as of 2015Q2,about 4.5% of property owners in Cyprus are
legal persons, among which there are a large number of titles encumbered by mortgage debt. This debt is
concentrated in real estate development and construction, as well as in trade and tourism (see Section 2.2).
For a significant share of dwellings, although developers still hold legal title (and frequently) mortgages,
properties have been fully purchased and inhabited by households (see Box 2.2.2 on property rights tranfer).
On the household side, Cypriot home owners also hold a large percentage of mortgage debt, while foreign
buyers, who co-financed their home purchases with loans from Cypriot banks, especially up to 2010, are also
a non-negligible category of debtors.
0
20
40
60
80
100
120
140
160
180
200 %
Graph 1a: Sales as a percentage of change in the
working-age population
to foreigners to residents
Source: Cyprus Ministry of Finance
0
20
40
60
80
100
120
-5
0
5
10
15
20Index
(2010=100)
pps
Graph 1b: Sales in % of change in working-age
population
Sales to non-residents in percent of GDP, annual changeSales to residents in percent of GDP, annual changeNominal House Price Index (r.h.s.)
Source: Central Bank of Cyprus and Eurostat
-15
-10
-5
0
5
10
15
20
25
02Q
1
03Q
1
04Q
1
05Q
1
06Q
1
07Q
1
08Q
1
09Q
1
10Q
1
11Q
1
12Q
1
13Q
1
14Q
1
15Q
1
% deviation from
average
Graph 1d: Housing price to rental and to income ratios
Price to rental vs long-term average
Price to income vs long-term average
Source: European Commission
-25
-20
-15
-10
-5
0
5
10
15
20
25
30
01Q
1
02Q
3
04Q
1
05Q
3
07Q
1
08Q
3
10Q
1
11Q
3
13Q
1
14Q
3
%
Graph 1c: Relative house price cyclical gap
Source: Eurostat
2.2. Private indebtedness
34
(Continued on the next page)
Box 2.2.2: Title deeds issuance and transfer
About a third of the housing stock built and sold since 2000 is still legally owned by the sellers. With
over 40 000 such cases, this is a major problem. Typically, the home buyer has paid the developer most of
the sales price, or even its entirety, and has become a de facto owner. However, legally, the seller - usually a
developer - still owns the property, as the transfer of the title deed has not taken place.
Unpaid developer mortgages prevent the transfer of ownership of the properties to home buyers. In
most cases, the developer has failed to repay the mortgage loan for building the property, despite having
received the proceeds of the sale. In such cases, banks are typically reluctant to release the mortgage, a
necessary step before the property can be transferred of to the final buyer. Outstanding loans to developers
and home buyers entangled in the title deed problem are estimated to form a considerable share of non-
performing loans (NPLs).
The difficulty in transferring title deeds complicates the enforcement of loan payments and the
restructuring of non-performing loans. Home buyers who have not received their title deeds may have an
incentive to default on their home loans, since the bank that granted the mortgage (or other creditors) cannot
foreclose on their property. Instead, it is the bank of a non-performing developer who has the right to seek
foreclosure on the property. However, that would lead to evicting the home buyer, who would be left with
only a junior claim to the foreclosure proceeds. Foreclosing on such de facto sold, but not transferred,
property, though legal, would seriously undermine the attractiveness of Cyprus property market to foreign
investors and would be politically and socially unacceptable. This is why banks have not sought to foreclose
developers' projects, and the Cypriot House of Representatives barred them from doing so until September
2015. In essence, this problem limits the tools available to banks to enforce loan repayment and to
incentivise debtors in difficulties to resolve their loans arrears.
In 2015, legislation was adopted to establish legal certainty, by protecting the buyers that have
fulfilled their contract requirements, for sales contracts registered by end-2014, the so-called "legacy
cases". This legislative framework addresses the existing cases of title deeds issued but not transferred.
While a small proportion of title deeds transfers have already been achieved under this legislation, others are
blocked in court procedures and the remaining are waiting to be processed. Thus, automaticity has not been
ensured.
Legislative proposals are under discussion to create legal certainty and disentangle the convoluted
claims on title deeds by swiftly transferring property rights to home buyers. They would ensure that
home buyers who have paid the purchase price in full will have their titles deeds transferred, allowing
unsecured construction loans to be converted into a mortgage, which will allow banks to release provisions
and strengthen their equity1. At the same time, unpaid developer mortgages on sold property will be shifted,
whenever possible, to unsold assets of the developer. A system of dedicated bank accounts will ensure that
any remaining payment on property sales will be used to repay the developers' creditors.
There are also significant problems with the issuance of title deeds, stemming from slow administrative
processes. The authorities have a substantial backlog in issuing title deeds, i.e. the land registry has not
completed the cadastral division of development projects into apartments or homes. A new property within a
larger development (a new flat for example) for which the title has not yet been issued does not exist legally,
so it cannot be transferred to its buyer. This administrative backlog mostly stems from the pre-2011 legal
situation that made issuing title deeds conditional on full compliance with building and planning permits
(themselves subject to long delays). The large number of uncertified and inhabited buildings may also pose
significant hazards to citizens and needs to be addressed.
1 According to the Central Bank of Cyprus, bank provisioning practice classifies purchasers' loans that relate to a property
on which there is also a developer's loan as unsecured. Shifting the developer's mortgage will change the purchaser's loans
into collateralised mortgages, increasing incentives for servicing the loans and thus removing the loss provisioning.

2.2. Private indebtedness
35
Box (continued)
Progress has been made on speeding up title deed issuance, but procedures are still lengthy and
uncertain. Since 2013, roughly half of the backlog in title deed issuance has been cleared. However, the still
complex title deeds issuance procedures are not supporting a swift cleaning of the backlog, which still
remains substantial, despite significant administrative efforts undertaken. There is still no centralised
enforcement of local certification and penalties are limited. A building can be inhabited for several years
without steps being taken to remedy the non-existence of a title deed. So far, legislations have been amended
for allowing self-certification of completion for small buildings and introduce penalties for the major
stakeholders involved (owner, designer, supervisor engineer and building contractor) responsible for
impediments. However, still pending are the legislative frameworks for the implementation of the reform of
local authorities, for the enforcement and remedy periods regarding the certification of non-certified
completed buildings and unauthorized works, and for the enforcement of timely issuance of building
compliance certificates by the relevant authorities.
The difficulties in issuing and transferring title deeds hamper competitiveness and deter international
investors. The Cypriot property market has been very dependent on foreign investors, particularly as regards
the most distressed assets (middle-class coastal holiday homes). Foreign investment in the property market
has dwindled with the crisis, and given the title deeds situation, has not returned to Cyprus. A return of
foreign investment would support the recovery of the housing market, and thus would help improve banks'
balance sheets.
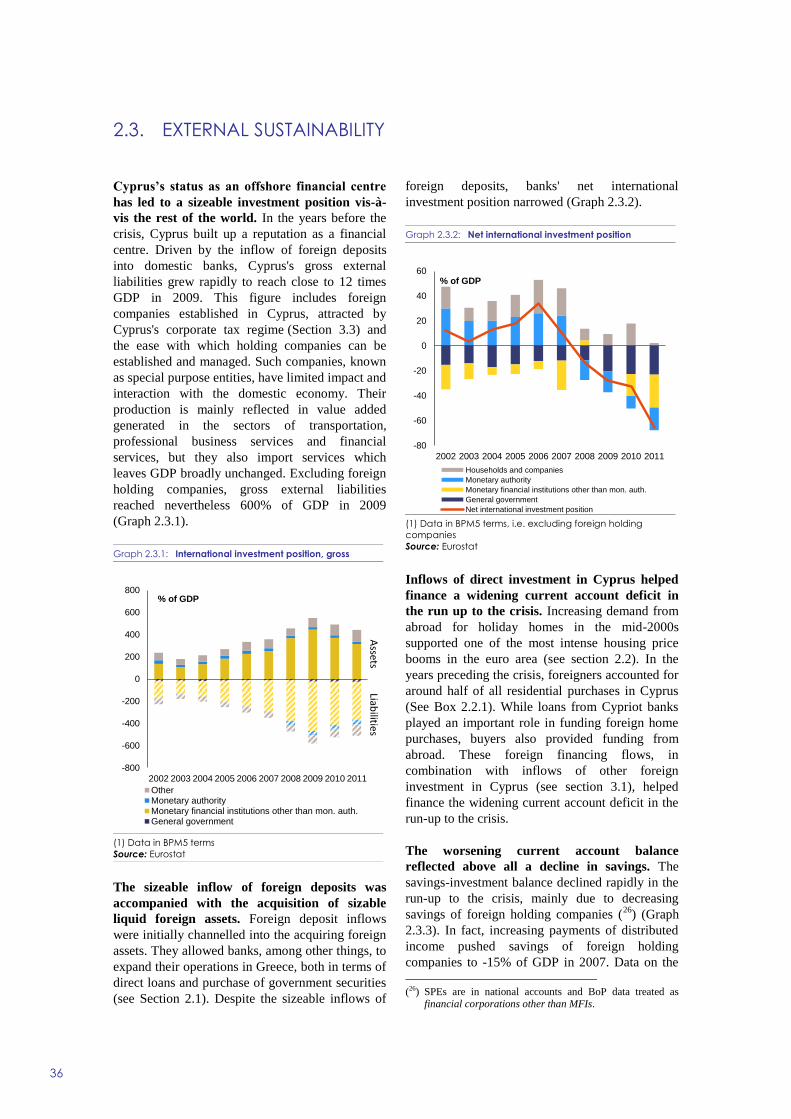
36
Cyprus’s status as an offshore financial centre
has led to a sizeable investment position vis-à-
vis the rest of the world. In the years before the
crisis, Cyprus built up a reputation as a financial
centre. Driven by the inflow of foreign deposits
into domestic banks, Cyprus's gross external
liabilities grew rapidly to reach close to 12 times
GDP in 2009. This figure includes foreign
companies established in Cyprus, attracted by
Cyprus's corporate tax regime (Section 3.3) and
the ease with which holding companies can be
established and managed. Such companies, known
as special purpose entities, have limited impact and
interaction with the domestic economy. Their
production is mainly reflected in value added
generated in the sectors of transportation,
professional business services and financial
services, but they also import services which
leaves GDP broadly unchanged. Excluding foreign
holding companies, gross external liabilities
reached nevertheless 600% of GDP in 2009
(Graph 2.3.1).
Graph 2.3.1: International investment position, gross
(1) Data in BPM5 terms
Source: Eurostat
The sizeable inflow of foreign deposits was
accompanied with the acquisition of sizable
liquid foreign assets. Foreign deposit inflows
were initially channelled into the acquiring foreign
assets. They allowed banks, among other things, to
expand their operations in Greece, both in terms of
direct loans and purchase of government securities
(see Section 2.1). Despite the sizeable inflows of
foreign deposits, banks' net international
investment position narrowed (Graph 2.3.2).
Graph 2.3.2: Net international investment position
(1) Data in BPM5 terms, i.e. excluding foreign holding
companies
Source: Eurostat
Inflows of direct investment in Cyprus helped
finance a widening current account deficit in
the run up to the crisis. Increasing demand from
abroad for holiday homes in the mid-2000s
supported one of the most intense housing price
booms in the euro area (see section 2.2). In the
years preceding the crisis, foreigners accounted for
around half of all residential purchases in Cyprus
(See Box 2.2.1). While loans from Cypriot banks
played an important role in funding foreign home
purchases, buyers also provided funding from
abroad. These foreign financing flows, in
combination with inflows of other foreign
investment in Cyprus (see section 3.1), helped
finance the widening current account deficit in the
run-up to the crisis.
The worsening current account balance
reflected above all a decline in savings. The
savings-investment balance declined rapidly in the
run-up to the crisis, mainly due to decreasing
savings of foreign holding companies (26
) (Graph
2.3.3). In fact, increasing payments of distributed
income pushed savings of foreign holding
companies to -15% of GDP in 2007. Data on the
(26) SPEs are in national accounts and BoP data treated as
financial corporations other than MFIs.
-800
-600
-400
-200
0
200
400
600
800
2002 2003 2004 2005 2006 2007 2008 2009 2010 2011
% of GDP
OtherMonetary authorityMonetary financial institutions other than mon. auth.General government
Assets
Liabilities
-80
-60
-40
-20
0
20
40
60
2002 2003 2004 2005 2006 2007 2008 2009 2010 2011
% of GDP
Households and companies
Monetary authority
Monetary financial institutions other than mon. auth.
General government
Net international investment position
2.3. EXTERNAL SUSTAINABILITY
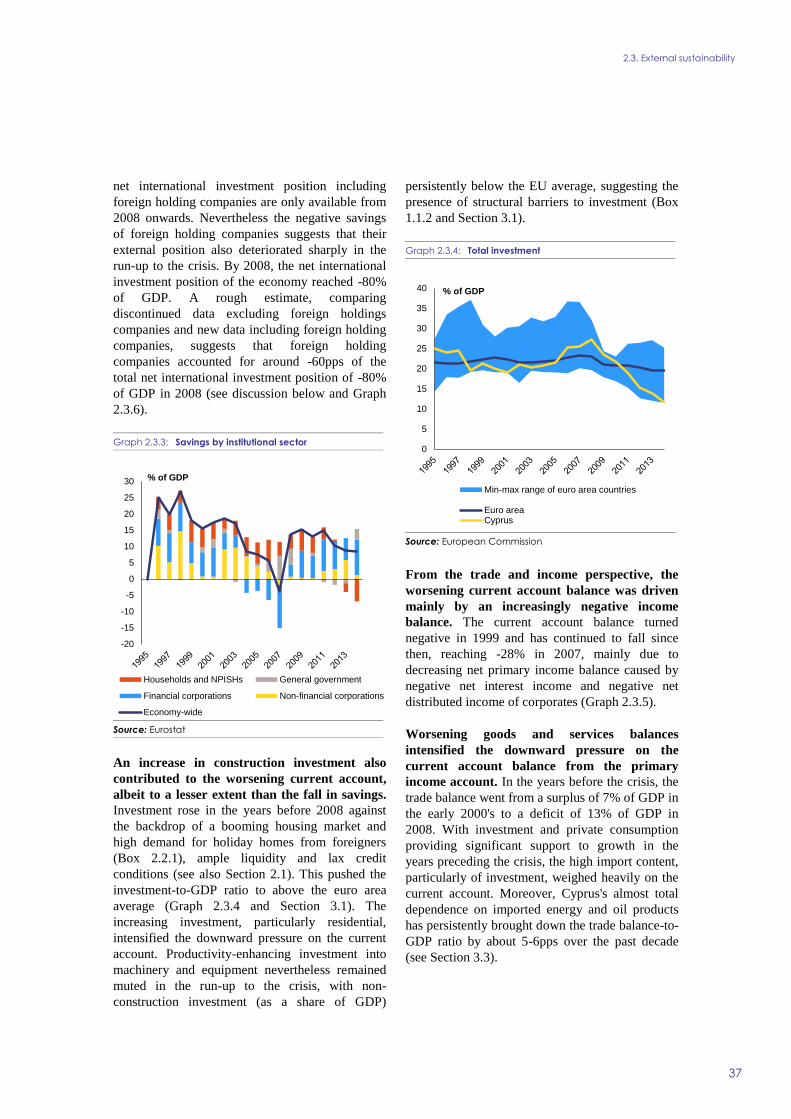
2.3. External sustainability
37
net international investment position including
foreign holding companies are only available from
2008 onwards. Nevertheless the negative savings
of foreign holding companies suggests that their
external position also deteriorated sharply in the
run-up to the crisis. By 2008, the net international
investment position of the economy reached -80%
of GDP. A rough estimate, comparing
discontinued data excluding foreign holdings
companies and new data including foreign holding
companies, suggests that foreign holding
companies accounted for around -60pps of the
total net international investment position of -80%
of GDP in 2008 (see discussion below and Graph
2.3.6).
Graph 2.3.3: Savings by institutional sector
Source: Eurostat
An increase in construction investment also
contributed to the worsening current account,
albeit to a lesser extent than the fall in savings.
Investment rose in the years before 2008 against
the backdrop of a booming housing market and
high demand for holiday homes from foreigners
(Box 2.2.1), ample liquidity and lax credit
conditions (see also Section 2.1). This pushed the
investment-to-GDP ratio to above the euro area
average (Graph 2.3.4 and Section 3.1). The
increasing investment, particularly residential,
intensified the downward pressure on the current
account. Productivity-enhancing investment into
machinery and equipment nevertheless remained
muted in the run-up to the crisis, with non-
construction investment (as a share of GDP)
persistently below the EU average, suggesting the
presence of structural barriers to investment (Box
1.1.2 and Section 3.1).
Graph 2.3.4: Total investment
Source: European Commission
From the trade and income perspective, the
worsening current account balance was driven
mainly by an increasingly negative income
balance. The current account balance turned
negative in 1999 and has continued to fall since
then, reaching -28% in 2007, mainly due to
decreasing net primary income balance caused by
negative net interest income and negative net
distributed income of corporates (Graph 2.3.5).
Worsening goods and services balances
intensified the downward pressure on the
current account balance from the primary
income account. In the years before the crisis, the
trade balance went from a surplus of 7% of GDP in
the early 2000's to a deficit of 13% of GDP in
2008. With investment and private consumption
providing significant support to growth in the
years preceding the crisis, the high import content,
particularly of investment, weighed heavily on the
current account. Moreover, Cyprus's almost total
dependence on imported energy and oil products
has persistently brought down the trade balance-to-
GDP ratio by about 5-6pps over the past decade
(see Section 3.3).
-20
-15
-10
-5
0
5
10
15
20
25
30 % of GDP
Households and NPISHs General government
Financial corporations Non-financial corporations
Economy-wide
0
5
10
15
20
25
30
35
40 % of GDP
Min-max range of euro area countries
Euro areaCyprus

2.3. External sustainability
38
Graph 2.3.5: Current account balance
Source: Eurostat
Cyprus lost significant export market shares in
goods markets in the years preceding the crisis.
Despite having moved up on the technological
ladder and specialising geographically in countries
with higher growth, Cyprus lost significant export
market shares in the years preceding EU
accession. A constant market share analysis
suggests that the loss in export market shares is
mainly a consequence of deteriorating price
competitiveness (27
).
Declining tourism receipts explain most of the
falling share of service exports in GDP.
Although tourism is one of the main economic
sectors, tourism receipts as a ratio to value added
have declined. While exports of travel services
accounted for nearly 20% of GDP in 2001, their
share fell to around 10% in 2008. Over that period,
Cyprus managed to attract tourists with a higher
average spending per day; however, weak
developments in the number of tourist arrivals
weighed on the overall income generated in the
tourism sector. Professional business services, also
a major sector of the economy, maintained a
relatively stable share of 8% of GDP during the
same period.
(27) See the Box entitled "Cyprus export performance in goods
markets" in European Commission (2015), 'The Economic Adjustment Programme: Cyprus 6th Review', Spring.
Recent developments and outlook for the
external position
In recent years, the net international investment
position has stabilised at levels that are far
more negative than in other EU Member States.
The net international investment position has
gradually worsened, reaching around -140% of
GDP in 2011, and has since stabilised at this level.
The stabilisation was associated with a
stabilisation of the current account balance at
around -5% of GDP (see discussion below). It is
estimated that foreign holding companies accounts
for around 60pps of the negative net international
investment position (Graph 2.3.6). Since foreign
holding companies interact to a limited extent only
with the domestic economy, the spillover risks
associated with them are relatively well contained.
The negative net external position of the general
government has gained more importance,
particularly following the emergence of the
sovereign debt crisis, reaching around -75% of
GDP. Most of this is accounted for by programme
financing and a loan from the Russian government
in 2011 (Section 2.4). The increasing reliance of
the financial sector on central bank funding in
2011-13 is reflected in the net investment position
of the Central Bank of Cyprus and movements in
Target2 balances. Households and non-financial
corporations have a small but positive financial
position vis-à-vis the rest of the world.
Graph 2.3.6: Net international investment position
(1) Net international investment data in accordance with
BPM5 exclude foreign holding companies
Source: Central Bank of Cyprus and Eurostat
-30
-25
-20
-15
-10
-5
0
5
10
1995
1996
1997
1998
1999
2000
2001
2002
2003
2004
2005
2006
2007
2008
2009
2010
2011
2012
2013
2014
2015Q
3
% of GDP
Secondary incomePrimary incomeTrade balanceCurrent account balance
-160
-140
-120
-100
-80
-60
-40
-20
0
% of GDP
Monetary financial institutions
Households, non-financial corporations and SPEs
General government
Net International Investment Position
Net International Investment Position (BPM5)

2.3. External sustainability
39
Graph 2.3.7: Gross external debt
Source: Eurostat
Although more than half of the financial
liabilities are non-debt creating liabilities, gross
external debt stood at more than five times
GDP in 2015. Cyprus' sizeable gross external debt
in Cyprus has fallen since 2009, hovering at
around 550% of GDP since 2013, on the back of a
significant downsizing of the banking system
(Graph 2.3.7), and in particular the sale of banking
subsidiaries in Greece (Section 2.1) (28
). It is
estimated that around 220pps of GDP is related to
the debts of foreign holding companies (29
) which
leaves external debt proper at 330% of GDP. The
gross external debt of households and non-
financial corporations has been broadly stable
since 2008. With few foreign assets, the general
government's external debt mirrors developments
in the net external position to a large extent.
Sizeable external debt leaves Cyprus exposed to
external shocks and changes in market
sentiment. Although external debt has been
reduced since 2008, its high level leaves Cyprus
vulnerable to external shocks and changes in
sentiment surrounding the Cypriot economy. This
in particular relates to the sizeable foreign deposits
in the Cypriot banking system, which are
considered as a less stable funding source than
(28) The increasing external debt in 2014 reflected an expansion
of companies with foreign holdings, rather than an increase
in the debt of existing companies residing in Cyprus.
(29) Publicly available data on foreign liabilities of financial corporates other than MFIs provides a rough estimate of
the external debt of foreign holding companies.
domestic deposits. With the financial sector
stabilising, tapping interbank markets may help
mitigate some of the risks arising from the
persistent reliance on foreign deposits.
The current account balance has stabilised
since 2011 at around -5%. Improvements in the
primary income account and an import contraction
explain the bulk of the improvement in the current
account balance since 2007. While the correction
of the income balance mainly reflects the
transactions of foreign holding companies, the
adjustment of the trade balance relates to domestic
activities. The contraction in imports of goods
since 2008 amounts to 12pps of GDP (Graph
2.3.8) and explains most of the improvement in the
trade balance. More recently, a revival in exports
of tourism and telecom services, coupled with
falling oil prices have supported the rebalancing
and helped push the trade balance into surplus.
However, export growth has been insufficient to
offset the negative impact from increasing imports.
The stabilisation of the current account balance
observed since 2011 also reflects a drop in deposit
rates and the outflow of foreign deposits from the
banking system. A return to previous high deposit
rates and an increasing inflow of foreign deposits
are likely to put downward pressure on both the
current account and the net international
investment position.
Graph 2.3.8: Cumulative trade balance adjustment
Source: Eurostat
0
100
200
300
400
500
600
700
800
2008 2009 2010 2011 2012 2013 2014 15Q3
% of GDP
Special purpose entitiesHouseholds and non-financial corporationsMonetary financial institutionsGeneral governmentTotalDomestic economy
-10
-5
0
5
10
15
20
25 pps of GDP
Export of goods Export of services
Import of goods Import of services
Trade balance Net export of goods
Net exports of services
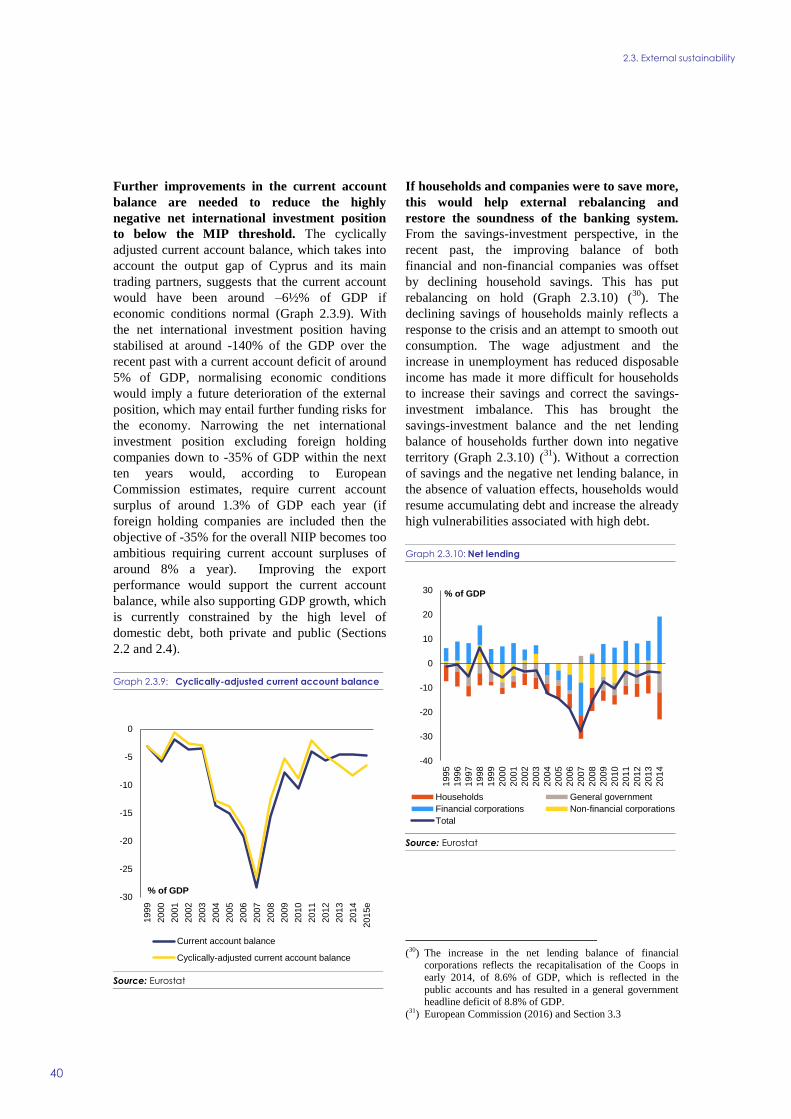
2.3. External sustainability
40
Further improvements in the current account
balance are needed to reduce the highly
negative net international investment position
to below the MIP threshold. The cyclically
adjusted current account balance, which takes into
account the output gap of Cyprus and its main
trading partners, suggests that the current account
would have been around –6½% of GDP if
economic conditions normal (Graph 2.3.9). With
the net international investment position having
stabilised at around -140% of the GDP over the
recent past with a current account deficit of around
5% of GDP, normalising economic conditions
would imply a future deterioration of the external
position, which may entail further funding risks for
the economy. Narrowing the net international
investment position excluding foreign holding
companies down to -35% of GDP within the next
ten years would, according to European
Commission estimates, require current account
surplus of around 1.3% of GDP each year (if
foreign holding companies are included then the
objective of -35% for the overall NIIP becomes too
ambitious requiring current account surpluses of
around 8% a year). Improving the export
performance would support the current account
balance, while also supporting GDP growth, which
is currently constrained by the high level of
domestic debt, both private and public (Sections
2.2 and 2.4).
Graph 2.3.9: Cyclically-adjusted current account balance
Source: Eurostat
If households and companies were to save more,
this would help external rebalancing and
restore the soundness of the banking system.
From the savings-investment perspective, in the
recent past, the improving balance of both
financial and non-financial companies was offset
by declining household savings. This has put
rebalancing on hold (Graph 2.3.10) (30
). The
declining savings of households mainly reflects a
response to the crisis and an attempt to smooth out
consumption. The wage adjustment and the
increase in unemployment has reduced disposable
income has made it more difficult for households
to increase their savings and correct the savings-
investment imbalance. This has brought the
savings-investment balance and the net lending
balance of households further down into negative
territory (Graph 2.3.10) (31
). Without a correction
of savings and the negative net lending balance, in
the absence of valuation effects, households would
resume accumulating debt and increase the already
high vulnerabilities associated with high debt.
Graph 2.3.10: Net lending
Source: Eurostat
(30) The increase in the net lending balance of financial
corporations reflects the recapitalisation of the Coops in
early 2014, of 8.6% of GDP, which is reflected in the
public accounts and has resulted in a general government headline deficit of 8.8% of GDP.
(31) European Commission (2016) and Section 3.3
-30
-25
-20
-15
-10
-5
0
1999
2000
2001
2002
2003
2004
2005
2006
2007
2008
2009
2010
2011
2012
2013
2014
2015e
% of GDP
Current account balance
Cyclically-adjusted current account balance
-40
-30
-20
-10
0
10
20
30
1995
1996
1997
1998
1999
2000
2001
2002
2003
2004
2005
2006
2007
2008
2009
2010
2011
2012
2013
2014
% of GDP
Households General government
Financial corporations Non-financial corporations
Total
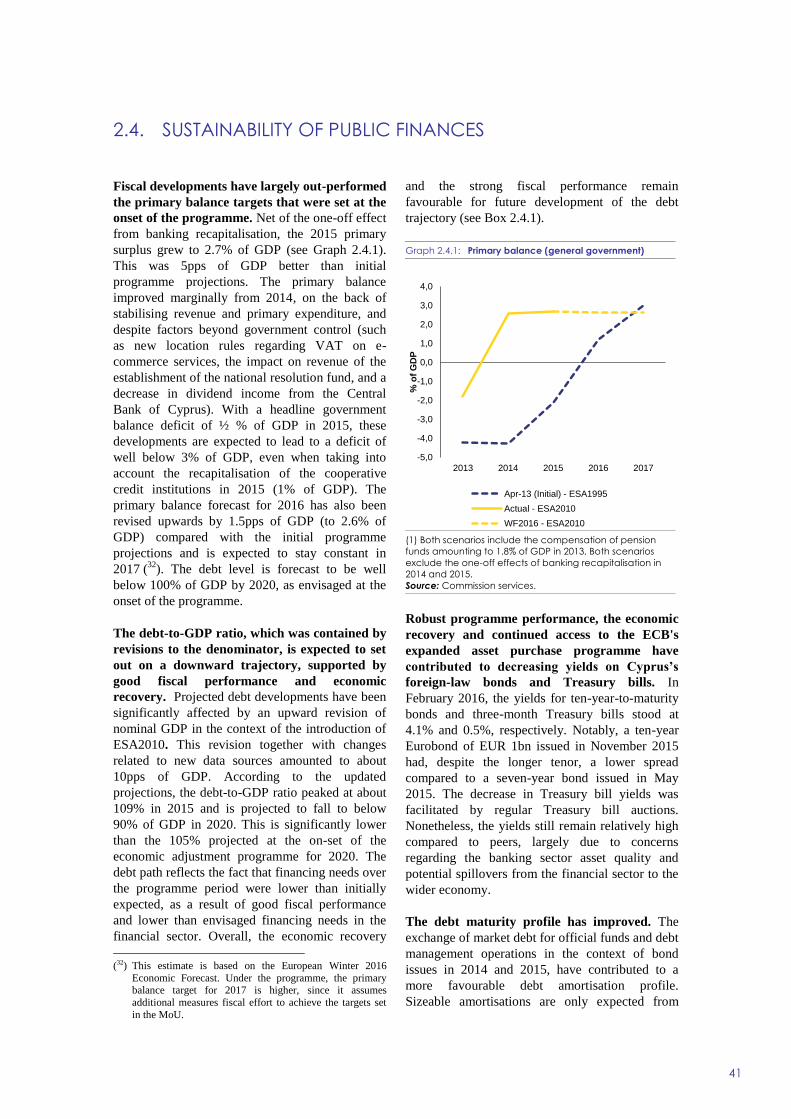
41
Fiscal developments have largely out-performed
the primary balance targets that were set at the
onset of the programme. Net of the one-off effect
from banking recapitalisation, the 2015 primary
surplus grew to 2.7% of GDP (see Graph 2.4.1).
This was 5pps of GDP better than initial
programme projections. The primary balance
improved marginally from 2014, on the back of
stabilising revenue and primary expenditure, and
despite factors beyond government control (such
as new location rules regarding VAT on e-
commerce services, the impact on revenue of the
establishment of the national resolution fund, and a
decrease in dividend income from the Central
Bank of Cyprus). With a headline government
balance deficit of ½ % of GDP in 2015, these
developments are expected to lead to a deficit of
well below 3% of GDP, even when taking into
account the recapitalisation of the cooperative
credit institutions in 2015 (1% of GDP). The
primary balance forecast for 2016 has also been
revised upwards by 1.5pps of GDP (to 2.6% of
GDP) compared with the initial programme
projections and is expected to stay constant in
2017 (32
). The debt level is forecast to be well
below 100% of GDP by 2020, as envisaged at the
onset of the programme.
The debt-to-GDP ratio, which was contained by
revisions to the denominator, is expected to set
out on a downward trajectory, supported by
good fiscal performance and economic
recovery. Projected debt developments have been
significantly affected by an upward revision of
nominal GDP in the context of the introduction of
ESA2010. This revision together with changes
related to new data sources amounted to about
10pps of GDP. According to the updated
projections, the debt-to-GDP ratio peaked at about
109% in 2015 and is projected to fall to below
90% of GDP in 2020. This is significantly lower
than the 105% projected at the on-set of the
economic adjustment programme for 2020. The
debt path reflects the fact that financing needs over
the programme period were lower than initially
expected, as a result of good fiscal performance
and lower than envisaged financing needs in the
financial sector. Overall, the economic recovery
(32) This estimate is based on the European Winter 2016
Economic Forecast. Under the programme, the primary balance target for 2017 is higher, since it assumes
additional measures fiscal effort to achieve the targets set
in the MoU.
and the strong fiscal performance remain
favourable for future development of the debt
trajectory (see Box 2.4.1).
Graph 2.4.1: Primary balance (general government)
(1) Both scenarios include the compensation of pension
funds amounting to 1.8% of GDP in 2013. Both scenarios
exclude the one-off effects of banking recapitalisation in
2014 and 2015.
Source: Commission services.
Robust programme performance, the economic
recovery and continued access to the ECB's
expanded asset purchase programme have
contributed to decreasing yields on Cyprus’s
foreign-law bonds and Treasury bills. In
February 2016, the yields for ten-year-to-maturity
bonds and three-month Treasury bills stood at
4.1% and 0.5%, respectively. Notably, a ten-year
Eurobond of EUR 1bn issued in November 2015
had, despite the longer tenor, a lower spread
compared to a seven-year bond issued in May
2015. The decrease in Treasury bill yields was
facilitated by regular Treasury bill auctions.
Nonetheless, the yields still remain relatively high
compared to peers, largely due to concerns
regarding the banking sector asset quality and
potential spillovers from the financial sector to the
wider economy.
The debt maturity profile has improved. The
exchange of market debt for official funds and debt
management operations in the context of bond
issues in 2014 and 2015, have contributed to a
more favourable debt amortisation profile.
Sizeable amortisations are only expected from
-5,0
-4,0
-3,0
-2,0
-1,0
0,0
1,0
2,0
3,0
4,0
2013 2014 2015 2016 2017
% o
f G
DP
Apr-13 (Initial) - ESA1995
Actual - ESA2010
WF2016 - ESA2010
2.4. SUSTAINABILITY OF PUBLIC FINANCES

2.4. Sustainability of public finances
42
2019 onwards, taking thus pressure off the
immediate post-programme period. The weighted
average debt maturity has been improved by
around 3 years throughout the programme period
and is now about 9 years, while debt that falls due
within one year has been reduced by around 7% to
6% of total debt. Loans account for about 70% of
Cyprus’ debt, most of them from official sources.
Cyprus’ government bond credit rating has
been increasing since mid-2013, but remains
below investment grade (33
). The main reasons
for the rating upgrades are that macroeconomic
and fiscal developments have been better than
expected at the start of the economic adjustment
programme, and that capital controls have been
removed. However, the remaining vulnerabilities
in the financial sector, public debt, which remains
high, and weaknesses in domestic demand and
investment are likely to continue weighing on
Cyprus’ credit ratings.
At the onset of the programme, the Cypriot
authorities set up a monthly fiscal reporting
scheme, which has significantly improved fiscal
surveillance. Since the programme began,
CYSTAT, in cooperation with the Ministry of
Finance, has been preparing a monthly fiscal
reporting scheme (including data on the general
government's budget execution and debt
developments), using an integrated Financial
Information Management System (FIMAS). This
comes in addition to the quarterly General
Government budget execution data, which is
officially submitted to EUROSTAT and published
around 27 days after the end of the quarter. The
overall reporting scheme has been continuously
improved during the programme period and has
contributed significantly to analysing and
monitoring fiscal developments. Better use of
FIMAS has also helped improve public
expenditure control.
The Cypriot authorities have made significant
progress with regard to fiscal-structural
(33) In October and November 2015, Fitch and Moody’s credit
agencies upgraded Cyprus’ credit rating by two notches. Despite an earlier upgrade of Cyprus’ credit rating by
Standard and Poor's Rating Services (S&P), it is still kept
at least three notches below the investment grade. In December 2015, DBRS also upgraded Cyprus by one
notch.
reforms, which will help ensure public finances
sustainable. These include reforms in three key
areas: 1) public financial management, 2) the
pension system, and 3) revenue administration (see
section 3.3).
As regards public financial management, the
House of Representatives adopted the Fiscal
Responsibility and Budget System Law in 2014,
providing a comprehensive and transparent
legal framework for sound practices. It applies
to the entire general government and ensures
compliance with EU requirements. The Fiscal
Responsibility and Budget System Law ensures a
strategic approach at budget preparation stage,
including multi-annual fiscal targets and
expenditure ceilings, and a medium-term
budgetary framework laying down a medium-term
strategy for meeting targets and complying with
ceilings. Secondary legislation attached to the
Fiscal Responsibility and Budget System Law is
expected to be adopted. It should lay down, inter-
alia, procedures for budget preparation,
requirements for within-year budgetary
adjustments, and the responsibilities of
commitment control officers.
Further, to limit the fiscal risk from the large
exposure to contingent liabilities, the Cypriot
authorities have established a guarantee office
under the Treasury, which has taken over
responsibility for managing existing and future
government guarantees, and for assessing the fiscal
risk stemming from them. The authorities have
also prepared a policy for issuing government
guarantees and a manual on procedures for their
management. Both were adopted by the Council of
Ministers in August 2015. All of these steps will
contribute significantly to limiting the risk from
contingent liabilities in the future.
The Council of Ministers also adopted a
medium-term debt management strategy in
December 2014, which was updated in December
2015. This strategy and the corresponding annual
financing plan are important milestones on the way
to preparing for debt management after the
programme. The Public Debt Management Office
is continuing to build the strategies and skills
needed to gain stable market access after the
programme. The basis for this is an action plan set
up with the help of the ESM which sets out
specific steps and timelines for improving investor
2.4. Sustainability of public finances
43
relations and the organisational capacity of the
Public Debt Management Office.
A major reform of the whole public pension
system (the government employees’ pension
scheme and the general social insurance
scheme) was undertaken by the Cypriot
authorities in late 2012. The reform aimed at
reducing projected spending and ensuring adequate
financing through contributions. Among the
measures taken were an increase in the minimum
age for retirement with full pension entitlements,
including provisions for its automatic adjustment
every five years in line with changes in life
expectancy; the introduction of a penalty to
provide disincentives to and lower expenditure for
early retirement; gradual increases in contributions
and minimum contributory period; a temporary
freeze of pensions; and the treatment of pensions
as personal and therefore taxable income. It has
significantly improved the system's long-term
viability by stabilising the public pension spending
as a share of GDP until 2060 (estimated at 10.2%
of GDP in 2060, 0.2pps lower than in 2013 and
6.2pps lower than the estimation prior to the 2012
reform) and increasing its financing through
increase in contributions by employees, employers
and the State (estimated at 9.8% of GDP in 2060,
2.8pps higher than in 2013). (34
) A recent actuarial
study shows that the reform has reduced the
projected increase in pension expenditure for the
whole public spending system over 5% of GDP in
the long run, making it one of the lowest in the EU
(whereas it was one of the highest, after
Luxembourg, before the reform). Furthermore, the
Budget Law stipulates reduced indexation of
government employees' sector top-up pensions (35
).
By mainly targeting the increase in average
effective working career against life spent in
retirement and by the closure of the top-up
Government Employees Pension Scheme to new
members, the reform did not significantly affect
the adequacy of pension payments under the
(34) For the estimations and detailed analysis, see '2015 Ageing
Report: Economic and budgetary projections for the 28 EU Member States (2013-2060)' and Cyprus country fiche:
http://europa.eu/epc/working_groups/ageing_en.htm.
(35) The Government Employees Pension Scheme provides supplementary pensionable benefits to its members in
addition to the benefits of the General Social Insurance
Scheme, covering every person gainfully employed in Cyprus, both in public and private sector.
pension scheme (36
). Moreover, low income
pensioners can apply to the new guaranteed
minimum income scheme (see Box 3.2.1).
Social transfer schemes have been rationalised
through improved targeting, which has helped
put this expenditure category on a stable path,
despite the worsening labour market. The
consolidation of benefits and the use of
information technology for the Guaranteed
Minimum Income scheme have helped make
expenditure control more efficient and mitigated
the associated risks, while allowing for better
targeting to those mostly in need (see also Section
3.2 and Box 3.2.1).
Significant reforms of tax administration are in
progress. They are designed to make revenue
collection more effective and efficient, to improve
taxpayer compliance, and to limit tax fraud and
evasion. The aim is to achieve a lasting increase in
tax revenue. (See details of implementation in
Section 3.3).
Significant risks remain, even if fiscal
developments have out-performed expectations
during the programme. The remaining fiscal
risks notably stem from: a) reversal of fiscal
adjustment achieved under the programme or an
adverse macroeconomic and financial environment
(e.g. low growth and subdued credit supply — see
Section 3.1); b) insufficient implementation of
structural reforms, including in particular the
implementation of the privatisation and public
administration reform agenda (see Section 3.2);
and c) difficulties in maintaining market access at
reasonable borrowing costs. Positively, fiscal risk
stemming from banking sector spillover is reduced
through the implementation of EU Bank Recovery
and Resolution Directive, which limits the
financial sector exposure of the Cyprus sovereign
and reduces the importance of what had been a
major hindrance to its credibility.
(36) According to Cyprus country fiche for the Aging Working
Group of the EPC, average new pension over economy wide average wage is expected to increase from 44% in
2014 to 49% in 2060.

2.4. Sustainability of public finances
44
(Continued on the next page)
Box 2.4.1: Debt sustainability assessment
The public debt-to-GDP ratio rose sharply after 2008, but after peaking in 2015 is expected to decline
owing to the significant efforts made under the economic adjustment programme. In line with the
overall pro-cyclical expenditure stance, the debt-to-GDP ratio rose by about 7% of GDP to about 64% of
GDP during 2000-2003, after which it fell to about 45% of GDP in the run-up to the euro area accession in
2008. The years following accession and prior to the crisis were marked by a loose fiscal stance and a
slowdown in growth as a result of the global financial crisis and the bursting of the Cypriot housing market
bubble (see Box 2.1.1), later compounded by the Vasilikos power plant incident in 2011. All this combined
pushed the debt-to-GDP ratio up significantly. During the crisis, the public debt further increased, notably
due to the public support granted to the financial sector. All in all, the debt-to-GDP ratio is expected to have
peaked at 109% of GDP in 2015, and to decline steadily in the medium term. The main supporting factors in
that regard are the projected continuation of primary fiscal surpluses in 2017 and beyond, the projected
positive growth, and large stock-flow adjustment items, including privatisation proceeds (see Graph 1a).
The significant reduction in the interest bill during the programme period was driven largely by the
replacement of market financing by official financing. Liability management exercises and declining
yields on the newly issued bonds have also helped reduce the projected interest bill in the first years
after the programme as compared to initial expectations. The interest bill increased markedly during the
economic crisis, by around 1% of GDP over 2010-2013. Since then, has been brought down by about 0.3%
of GDP, mainly by replacing market financing by official financing. While incurring an upfront cost when
buying back debt at a market premium, this type of liability management exercises has allowed Cyprus to
reduce the interest burden in future years. In addition, the yields achieved in the latest bond issues have also
helped lower the projected interest bill. It is expected to fall by another 0.5% of GDP by 2017 and to
increase after that as a result of higher market interest compared with that charged on ESM and IMF
funding.
Stock-flow adjustments have contributed significantly to debt developments in recent years. They had
a significant impact on the debt ratio in 2013 owing to the recapitalisation of the banking sector amounting
to about 7% of GDP. In 2016, these adjustments are expected to lead to a steep decline of the debt-to-GDP
ratio, largely driven by privatisation proceeds, a large proportion of which are expected to be used for debt
buybacks, and the finalisation of the loan-asset swap(1).
Changes in the debt trajectory continue to be sensitive to the macroeconomic and fiscal performance.
Reducing (Increasing) real GDP growth permanently by 0.5pps would trigger upward (downward) revision
of the debt trajectory by about 5pps of GDP by 2026 (see Graph 1b). The effect of a permanent inflation
increase (decrease) by 0.5pps would be similar. An enhanced negative (positive) macro shock would
exacerbate the increasing (decreasing) effect on the debt-to-GDP ratio (see Graph 1c). Higher (lower) short-
and long-term market interest rates by 1 pps would have only a limited effect on the debt trajectory (see
Graph 1d). If privatisation proceeds were lower than current estimates, the debt trajectory would be revised
upward.
All in all, looking at the various scenarios projected and the main results, Cyprus still faces risks of
fiscal stress in the short-term and moderate sustainability risks in the medium term, while long-run
risks are low (2). Moderate risks in the medium run emerge from the analysis of the sustainability gap
indicator S1. According to this analysis, reaching a structural primary balance of 2.4% of GDP by 2022 from
the currently forecast structural primary balance of 2.1% of GDP in 2017 would be required to reach the
reference value of 60% debt-to-GDP ratio by 2030. The S2 indicator suggests low risks to public finances in
the long run, showing that only a very small structural primary surplus of 0.1% of GDP would be required to
ensure sustainability of public finance in the long run. However, in the short run (i.e. within one year),
(1) The CBC debt swap is subject to a decision by the CBC board. The independence of the CBC, and compliance with
the Treaty and the rules and procedures underpinning the euro system, are paramount. (2) The debt sustainability assessment and risk classification rely on the methodology used in the Fiscal Sustainability
Report for 2015 (Institutional Paper 018, January 2016). See also footnote (3).
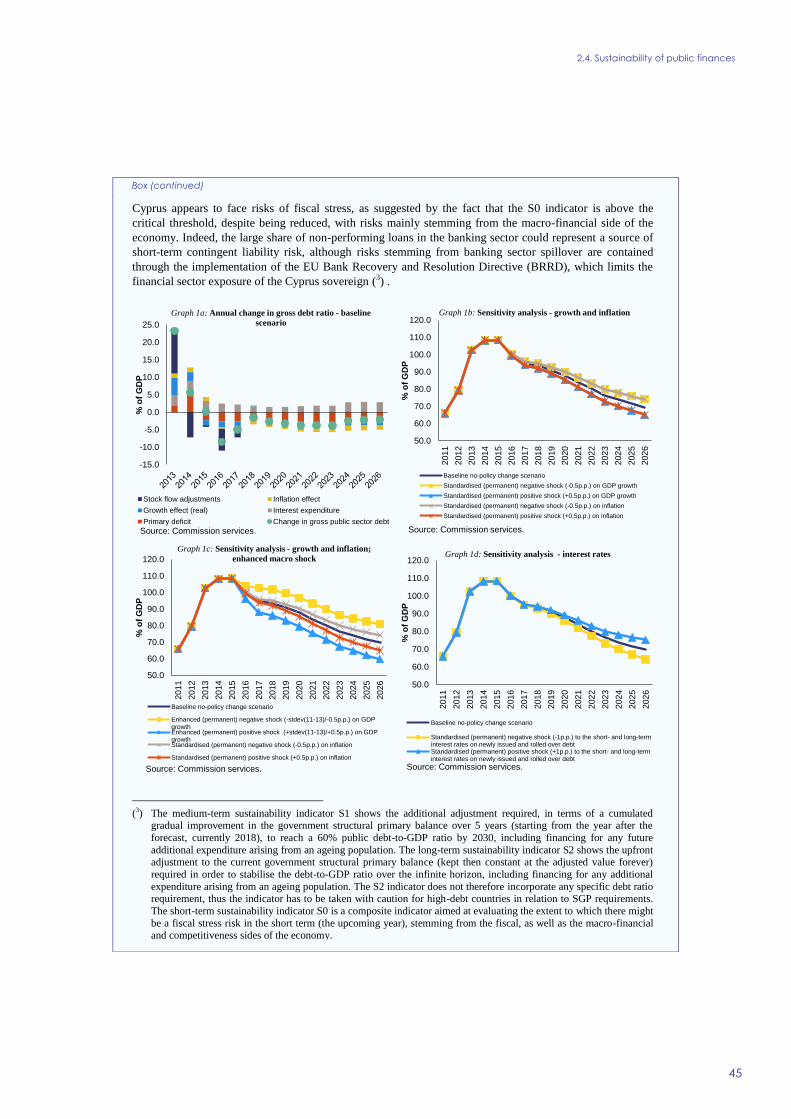
2.4. Sustainability of public finances
45
Box (continued)
Cyprus appears to face risks of fiscal stress, as suggested by the fact that the S0 indicator is above the
critical threshold, despite being reduced, with risks mainly stemming from the macro-financial side of the
economy. Indeed, the large share of non-performing loans in the banking sector could represent a source of
short-term contingent liability risk, although risks stemming from banking sector spillover are contained
through the implementation of the EU Bank Recovery and Resolution Directive (BRRD), which limits the
financial sector exposure of the Cyprus sovereign (3) .
-15.0
-10.0
-5.0
0.0
5.0
10.0
15.0
20.0
25.0
% o
f G
DP
Graph 1a: Annual change in gross debt ratio - baseline
scenario
Stock flow adjustments Inflation effect
Growth effect (real) Interest expenditure
Primary deficit Change in gross public sector debt
Source: Commission services.
50.0
60.0
70.0
80.0
90.0
100.0
110.0
120.0
2011
2012
2013
2014
2015
2016
2017
2018
2019
2020
2021
2022
2023
2024
2025
2026
% o
f G
DP
Graph 1b: Sensitivity analysis - growth and inflation
Baseline no-policy change scenario
Standardised (permanent) negative shock (-0.5p.p.) on GDP growth
Standardised (permanent) positive shock (+0.5p.p.) on GDP growth
Standardised (permanent) negative shock (-0.5p.p.) on inflation
Standardised (permanent) positive shock (+0.5p.p.) on inflation
Source: Commission services.
50.0
60.0
70.0
80.0
90.0
100.0
110.0
120.0
2011
2012
2013
2014
2015
2016
2017
2018
2019
2020
2021
2022
2023
2024
2025
2026
% o
f G
DP
Graph 1d: Sensitivity analysis - interest rates
Baseline no-policy change scenario
Standardised (permanent) negative shock (-1p.p.) to the short- and long-terminterest rates on newly issued and rolled over debtStandardised (permanent) positive shock (+1p.p.) to the short- and long-terminterest rates on newly issued and rolled over debt
Source: Commission services.
50.0
60.0
70.0
80.0
90.0
100.0
110.0
120.0
2011
2012
2013
2014
2015
2016
2017
2018
2019
2020
2021
2022
2023
2024
2025
2026
% o
f G
DP
Graph 1c: Sensitivity analysis - growth and inflation;
enhanced macro shock
Baseline no-policy change scenario
Enhanced (permanent) negative shock (-stdev(11-13)/-0.5p.p.) on GDPgrowthEnhanced (permanent) positive shock (+stdev(11-13)/+0.5p.p.) on GDPgrowthStandardised (permanent) negative shock (-0.5p.p.) on inflation
Standardised (permanent) positive shock (+0.5p.p.) on inflation
Source: Commission services.
(3) The medium-term sustainability indicator S1 shows the additional adjustment required, in terms of a cumulated
gradual improvement in the government structural primary balance over 5 years (starting from the year after the
forecast, currently 2018), to reach a 60% public debt-to-GDP ratio by 2030, including financing for any future
additional expenditure arising from an ageing population. The long-term sustainability indicator S2 shows the upfront adjustment to the current government structural primary balance (kept then constant at the adjusted value forever)
required in order to stabilise the debt-to-GDP ratio over the infinite horizon, including financing for any additional
expenditure arising from an ageing population. The S2 indicator does not therefore incorporate any specific debt ratio requirement, thus the indicator has to be taken with caution for high-debt countries in relation to SGP requirements.
The short-term sustainability indicator S0 is a composite indicator aimed at evaluating the extent to which there might
be a fiscal stress risk in the short term (the upcoming year), stemming from the fiscal, as well as the macro-financial and competitiveness sides of the economy.

46
2.5. MIP ASSESSMENT MATRIX
Table 2.5.1: Macro imbalances procedure: assessment matrix
(Continued on the next page)
Gravity of the challenge Evolution and prospects Policy response
Imbalances (unsustainable trends, vulnerabilities and associated risks)
Financial
sector
imbalances
At around 55% in September
2015, the non-performing loans
(NPLs) ratio for households
and corporate loans remains
among the highest in the euro
area and has not yet been put
on a sustainable declining
trend.
Provisions are low in view of
downside risks to housing
collateral value, as well as risks
of changes in valuation
policies.
Banks are not yet able to
generate profits in a sustainable
manner to ensure adequate
capitalisation.
The increase in restructured loans was
almost fully off-set by the increase of
non-performing restructured loans (…).
In addition, the enhanced restructuring
efforts are still falling short of the
restructuring targets set in agreement
with the Central Bank of Cyprus
(p.17).
The high level of collateralised lending
poses challenges regarding the
perception of credit risk (…).
Relatively low estimates of expected
losses on collateralised loans have kept
provisions at levels below the EU
average (p.14).
The capital adequacy of Cypriot banks
has increased closer to the euro area
average, but capacity to build up
further capital buffers is hampered by
low profitability and high NPL risks
(p.18).
Banks have strengthened
arrears management
processes, targets for
restructurings have been
introduced, but current
provisioning level may not
incentivise banks to seek the
liquidation of unviable
debtors (p.18).
Reforms of the foreclosure,
insolvency and land registry
frameworks were carried out
but banks and debtors have
been reluctant to make use
of them (p. 18).
Private debt Private debt in Cyprus is above
340% of GDP, among the
highest level in the EU. Debt of
non-financial corporations
(other than ship-owning special
purpose entities) has trebled
since 1995 to reach 140% of
GDP in 2014, while household
debt has doubled to about
130%.
Low nominal growth and a
depressed property market
aggravate the problems of
excessive debt.
Private debt has not been declining in
% of GDP. Deleveraging pressures
remain strong with high
unemployment, tight credit conditions,
and high rates of default, but low
nominal growth is making debt
reduction challenging (p.23).
Declining property prices have created
incentives for strategic defaults in
mortgage debt. Indicators suggest that
property prices will adjust further
down under current market conditions
(p.25)
Corporate debt is concentrated in the
sectors of construction, real estate and
trade and tourism. The adjustment of
these sectors may require further
reallocation of domestic resources, to
avoid prolonging market distortions
(p.27)
Foreclosure and insolvency
legislation have been
reformed in order to allow
for swifter contract
enforcement, as well as the
restructuring of viable debts,
but efficiency is not yet
ensured (p.30).
Further delaying the
liquidation of unviable
borrowers and the
restructuring of viable debts
can prolong market
distortions (p.28).
Reforms of land registry
regulations are being
discussed to enable
insolvency proceedings and
help Cyprus regain the trust
of investors, particularly
foreign investors, but have
not yet been adopted (p.30).
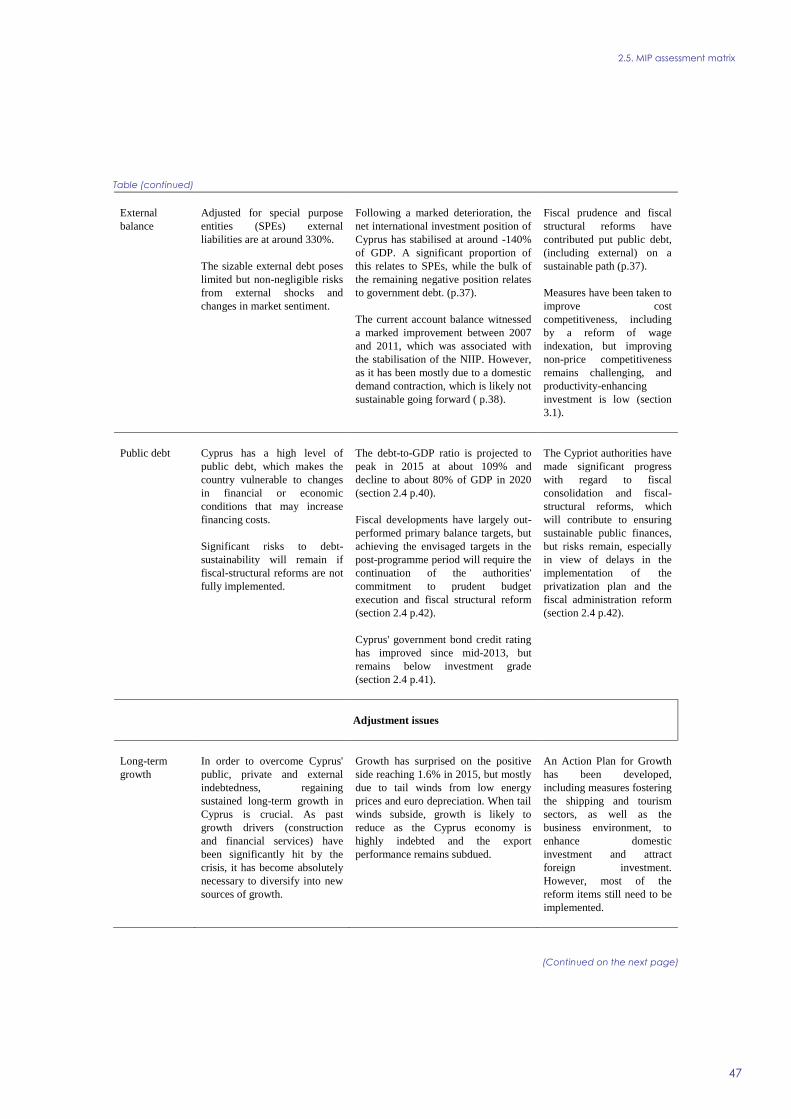
2.5. MIP assessment matrix
47
Table (continued)
(Continued on the next page)
External
balance
Adjusted for special purpose
entities (SPEs) external
liabilities are at around 330%.
The sizable external debt poses
limited but non-negligible risks
from external shocks and
changes in market sentiment.
Following a marked deterioration, the
net international investment position of
Cyprus has stabilised at around -140%
of GDP. A significant proportion of
this relates to SPEs, while the bulk of
the remaining negative position relates
to government debt. (p.37).
The current account balance witnessed
a marked improvement between 2007
and 2011, which was associated with
the stabilisation of the NIIP. However,
as it has been mostly due to a domestic
demand contraction, which is likely not
sustainable going forward ( p.38).
Fiscal prudence and fiscal
structural reforms have
contributed put public debt,
(including external) on a
sustainable path (p.37).
Measures have been taken to
improve cost
competitiveness, including
by a reform of wage
indexation, but improving
non-price competitiveness
remains challenging, and
productivity-enhancing
investment is low (section
3.1).
Public debt Cyprus has a high level of
public debt, which makes the
country vulnerable to changes
in financial or economic
conditions that may increase
financing costs.
Significant risks to debt-
sustainability will remain if
fiscal-structural reforms are not
fully implemented.
The debt-to-GDP ratio is projected to
peak in 2015 at about 109% and
decline to about 80% of GDP in 2020
(section 2.4 p.40).
Fiscal developments have largely out-
performed primary balance targets, but
achieving the envisaged targets in the
post-programme period will require the
continuation of the authorities'
commitment to prudent budget
execution and fiscal structural reform
(section 2.4 p.42).
Cyprus' government bond credit rating
has improved since mid-2013, but
remains below investment grade
(section 2.4 p.41).
The Cypriot authorities have
made significant progress
with regard to fiscal
consolidation and fiscal-
structural reforms, which
will contribute to ensuring
sustainable public finances,
but risks remain, especially
in view of delays in the
implementation of the
privatization plan and the
fiscal administration reform
(section 2.4 p.42).
Adjustment issues
Long-term
growth
In order to overcome Cyprus'
public, private and external
indebtedness, regaining
sustained long-term growth in
Cyprus is crucial. As past
growth drivers (construction
and financial services) have
been significantly hit by the
crisis, it has become absolutely
necessary to diversify into new
sources of growth.
Growth has surprised on the positive
side reaching 1.6% in 2015, but mostly
due to tail winds from low energy
prices and euro depreciation. When tail
winds subside, growth is likely to
reduce as the Cyprus economy is
highly indebted and the export
performance remains subdued.
An Action Plan for Growth
has been developed,
including measures fostering
the shipping and tourism
sectors, as well as the
business environment, to
enhance domestic
investment and attract
foreign investment.
However, most of the
reform items still need to be
implemented.

2.5. MIP assessment matrix
48
Table (continued)
Source: Commission services
Unemployment Unemployment remains high
and is only slowly declining.
Labour market adjustment is
key to prevent hysteresis,
improve long-term growth, and
mitigate social distress.
In 2015, labour market conditions
improved, with employment slightly
increasing and unemployment receding
somewhat to around 15%. However,
youth unemployment and long-term
unemployment remain high at 33% and
7% respectively.
Labour market policies have
been implemented, targeting
the youth, and more recently
also the long-term
unemployed. However
deficiencies remain in the
provision of public
employment services, and in
the monitoring and
evaluation of labour market
policies.
Conclusions from IDR analysis
Cyprus is characterised by large stock imbalances in the form of a private, public, and external debt overhang.
Adjustment of private sector bank debt is impaired by a non-performing loans ratio exceeding 50%. This level of non-
compliance hinders the normal functioning of the banking sector, depressing credit to investment and slowing down
growth, further undermining the reduction of debt-to-GDP ratios.
Significant current account adjustment has been driven by import contraction, but is characterized by cyclical elements
and falls short of putting external debt on a sustainable path. Despite slowly receding, unemployment remains at high
levels, and the rate of investment as well as the growth potential of the economy are subdued.
Important reforms have been initiated in the context of the Macroeconomic Adjustment Programme, notably regarding
the foreclosure and insolvency frameworks, arrears management, public finances, and competitiveness. However,
several reforms initiated under the programme remain to be adopted, in particular regarding the courts system, public
administration and state owned enterprises, including public utilities, regulatory authorities, property market regulations,
and the health sector. Likewise, further measures necessary to foster the sustainable workout of bad debts have been
identified.
(*) The first column summarises 'gravity' issues which aim at providing an order of magnitude of the level of imbalances.
The second column reports findings concerning the 'evolution and prospects' of imbalances. The third column reports
recent and planned relevant measures. Findings are reported for each source of imbalance and adjustment issue. The
final three paragraphs of the matrix summarise the overall challenges, in terms of their gravity, developments and
prospects, and policy response.
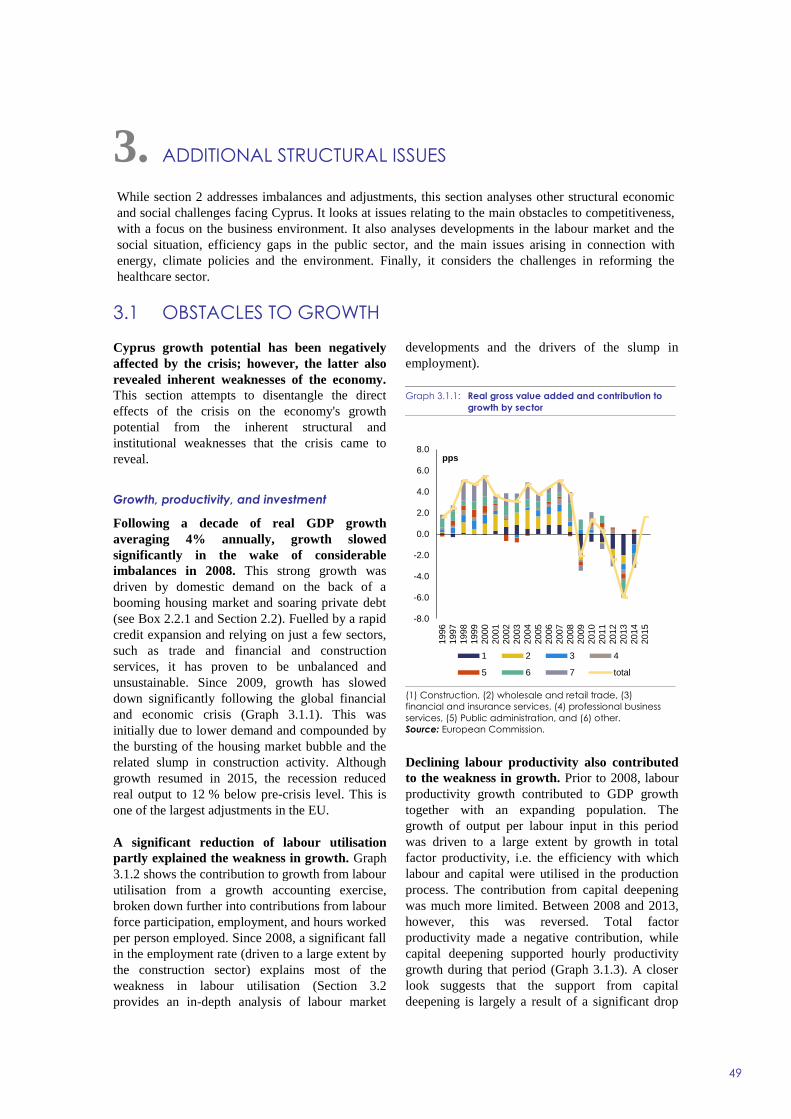
49
Cyprus growth potential has been negatively
affected by the crisis; however, the latter also
revealed inherent weaknesses of the economy.
This section attempts to disentangle the direct
effects of the crisis on the economy's growth
potential from the inherent structural and
institutional weaknesses that the crisis came to
reveal.
Growth, productivity, and investment
Following a decade of real GDP growth
averaging 4% annually, growth slowed
significantly in the wake of considerable
imbalances in 2008. This strong growth was
driven by domestic demand on the back of a
booming housing market and soaring private debt
(see Box 2.2.1 and Section 2.2). Fuelled by a rapid
credit expansion and relying on just a few sectors,
such as trade and financial and construction
services, it has proven to be unbalanced and
unsustainable. Since 2009, growth has slowed
down significantly following the global financial
and economic crisis (Graph 3.1.1). This was
initially due to lower demand and compounded by
the bursting of the housing market bubble and the
related slump in construction activity. Although
growth resumed in 2015, the recession reduced
real output to 12 % below pre-crisis level. This is
one of the largest adjustments in the EU.
A significant reduction of labour utilisation
partly explained the weakness in growth. Graph
3.1.2 shows the contribution to growth from labour
utilisation from a growth accounting exercise,
broken down further into contributions from labour
force participation, employment, and hours worked
per person employed. Since 2008, a significant fall
in the employment rate (driven to a large extent by
the construction sector) explains most of the
weakness in labour utilisation (Section 3.2
provides an in-depth analysis of labour market
developments and the drivers of the slump in
employment).
Graph 3.1.1: Real gross value added and contribution to
growth by sector
(1) Construction, (2) wholesale and retail trade, (3)
financial and insurance services, (4) professional business
services, (5) Public administration, and (6) other.
Source: European Commission.
Declining labour productivity also contributed
to the weakness in growth. Prior to 2008, labour
productivity growth contributed to GDP growth
together with an expanding population. The
growth of output per labour input in this period
was driven to a large extent by growth in total
factor productivity, i.e. the efficiency with which
labour and capital were utilised in the production
process. The contribution from capital deepening
was much more limited. Between 2008 and 2013,
however, this was reversed. Total factor
productivity made a negative contribution, while
capital deepening supported hourly productivity
growth during that period (Graph 3.1.3). A closer
look suggests that the support from capital
deepening is largely a result of a significant drop
-8.0
-6.0
-4.0
-2.0
0.0
2.0
4.0
6.0
8.01996
1997
1998
1999
2000
2001
2002
2003
2004
2005
2006
2007
2008
2009
2010
2011
2012
2013
2014
2015
pps
1 2 3 4
5 6 7 total
3. ADDITIONAL STRUCTURAL ISSUES
While section 2 addresses imbalances and adjustments, this section analyses other structural economic
and social challenges facing Cyprus. It looks at issues relating to the main obstacles to competitiveness,
with a focus on the business environment. It also analyses developments in the labour market and the
social situation, efficiency gaps in the public sector, and the main issues arising in connection with
energy, climate policies and the environment. Finally, it considers the challenges in reforming the
healthcare sector.
3.1 OBSTACLES TO GROWTH
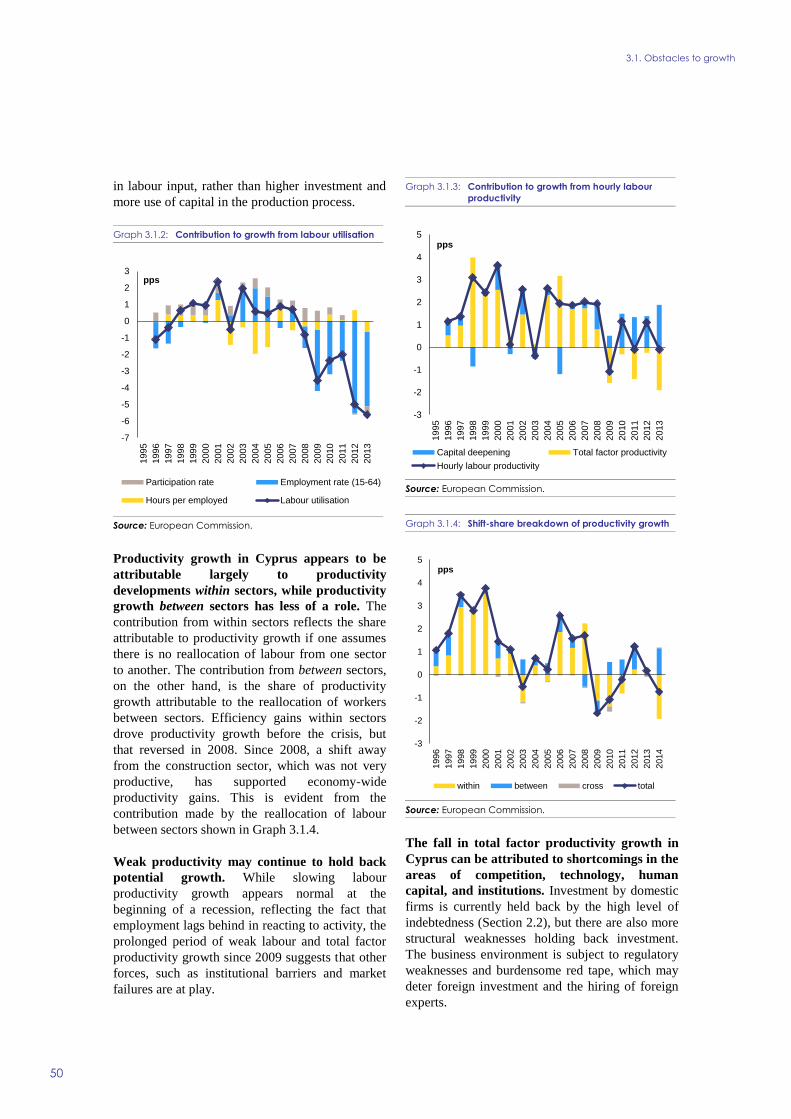
3.1. Obstacles to growth
50
in labour input, rather than higher investment and
more use of capital in the production process.
Graph 3.1.2: Contribution to growth from labour utilisation
Source: European Commission.
Productivity growth in Cyprus appears to be
attributable largely to productivity
developments within sectors, while productivity
growth between sectors has less of a role. The
contribution from within sectors reflects the share
attributable to productivity growth if one assumes
there is no reallocation of labour from one sector
to another. The contribution from between sectors,
on the other hand, is the share of productivity
growth attributable to the reallocation of workers
between sectors. Efficiency gains within sectors
drove productivity growth before the crisis, but
that reversed in 2008. Since 2008, a shift away
from the construction sector, which was not very
productive, has supported economy-wide
productivity gains. This is evident from the
contribution made by the reallocation of labour
between sectors shown in Graph 3.1.4.
Weak productivity may continue to hold back
potential growth. While slowing labour
productivity growth appears normal at the
beginning of a recession, reflecting the fact that
employment lags behind in reacting to activity, the
prolonged period of weak labour and total factor
productivity growth since 2009 suggests that other
forces, such as institutional barriers and market
failures are at play.
Graph 3.1.3: Contribution to growth from hourly labour
productivity
Source: European Commission.
Graph 3.1.4: Shift-share breakdown of productivity growth
Source: European Commission.
The fall in total factor productivity growth in
Cyprus can be attributed to shortcomings in the
areas of competition, technology, human
capital, and institutions. Investment by domestic
firms is currently held back by the high level of
indebtedness (Section 2.2), but there are also more
structural weaknesses holding back investment.
The business environment is subject to regulatory
weaknesses and burdensome red tape, which may
deter foreign investment and the hiring of foreign
experts.
-7
-6
-5
-4
-3
-2
-1
0
1
2
3
1995
1996
1997
1998
1999
2000
2001
2002
2003
2004
2005
2006
2007
2008
2009
2010
2011
2012
2013
pps
Participation rate Employment rate (15-64)
Hours per employed Labour utilisation
-3
-2
-1
0
1
2
3
4
5
1995
1996
1997
1998
1999
2000
2001
2002
2003
2004
2005
2006
2007
2008
2009
2010
2011
2012
2013
pps
Capital deepening Total factor productivity
Hourly labour productivity
-3
-2
-1
0
1
2
3
4
5
1996
1997
1998
1999
2000
2001
2002
2003
2004
2005
2006
2007
2008
2009
2010
2011
2012
2013
2014
pps
within between cross total
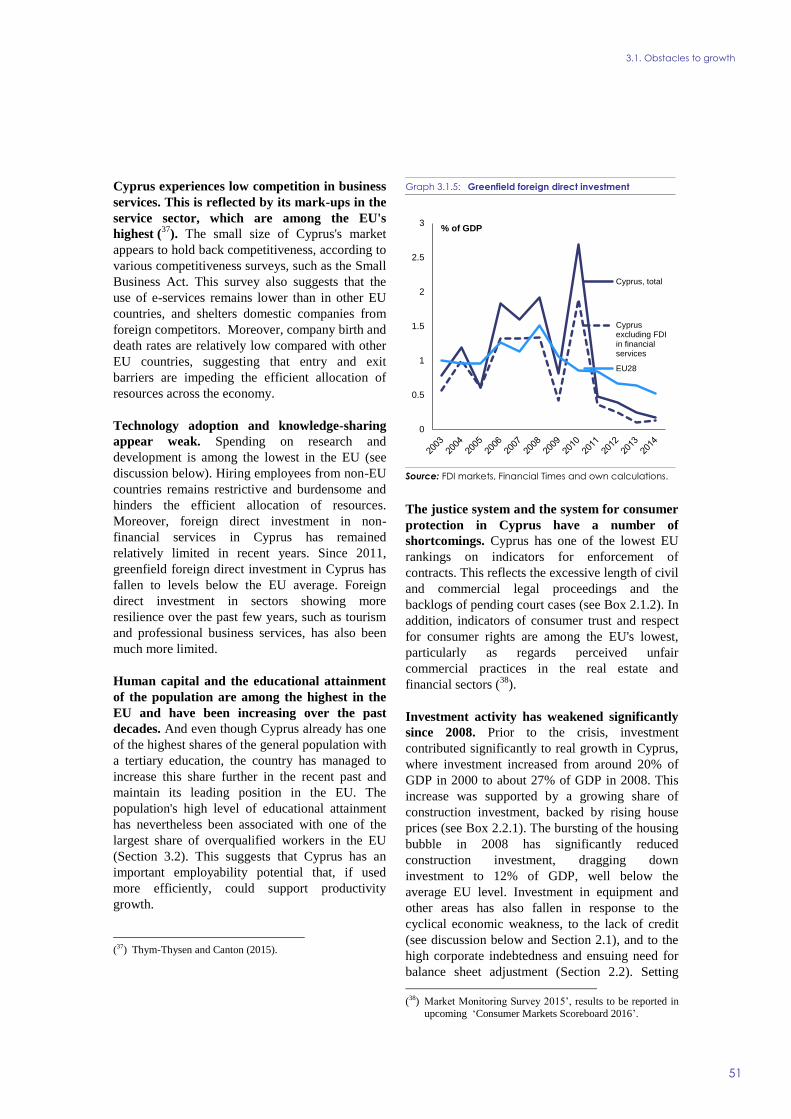
3.1. Obstacles to growth
51
Cyprus experiences low competition in business
services. This is reflected by its mark-ups in the
service sector, which are among the EU's
highest (37
). The small size of Cyprus's market
appears to hold back competitiveness, according to
various competitiveness surveys, such as the Small
Business Act. This survey also suggests that the
use of e-services remains lower than in other EU
countries, and shelters domestic companies from
foreign competitors. Moreover, company birth and
death rates are relatively low compared with other
EU countries, suggesting that entry and exit
barriers are impeding the efficient allocation of
resources across the economy.
Technology adoption and knowledge-sharing
appear weak. Spending on research and
development is among the lowest in the EU (see
discussion below). Hiring employees from non-EU
countries remains restrictive and burdensome and
hinders the efficient allocation of resources.
Moreover, foreign direct investment in non-
financial services in Cyprus has remained
relatively limited in recent years. Since 2011,
greenfield foreign direct investment in Cyprus has
fallen to levels below the EU average. Foreign
direct investment in sectors showing more
resilience over the past few years, such as tourism
and professional business services, has also been
much more limited.
Human capital and the educational attainment
of the population are among the highest in the
EU and have been increasing over the past
decades. And even though Cyprus already has one
of the highest shares of the general population with
a tertiary education, the country has managed to
increase this share further in the recent past and
maintain its leading position in the EU. The
population's high level of educational attainment
has nevertheless been associated with one of the
largest share of overqualified workers in the EU
(Section 3.2). This suggests that Cyprus has an
important employability potential that, if used
more efficiently, could support productivity
growth.
(37) Thym-Thysen and Canton (2015).
Graph 3.1.5: Greenfield foreign direct investment
Source: FDI markets, Financial Times and own calculations.
The justice system and the system for consumer
protection in Cyprus have a number of
shortcomings. Cyprus has one of the lowest EU
rankings on indicators for enforcement of
contracts. This reflects the excessive length of civil
and commercial legal proceedings and the
backlogs of pending court cases (see Box 2.1.2). In
addition, indicators of consumer trust and respect
for consumer rights are among the EU's lowest,
particularly as regards perceived unfair
commercial practices in the real estate and
financial sectors (38
).
Investment activity has weakened significantly
since 2008. Prior to the crisis, investment
contributed significantly to real growth in Cyprus,
where investment increased from around 20% of
GDP in 2000 to about 27% of GDP in 2008. This
increase was supported by a growing share of
construction investment, backed by rising house
prices (see Box 2.2.1). The bursting of the housing
bubble in 2008 has significantly reduced
construction investment, dragging down
investment to 12% of GDP, well below the
average EU level. Investment in equipment and
other areas has also fallen in response to the
cyclical economic weakness, to the lack of credit
(see discussion below and Section 2.1), and to the
high corporate indebtedness and ensuing need for
balance sheet adjustment (Section 2.2). Setting
(38) Market Monitoring Survey 2015’, results to be reported in
upcoming ‘Consumer Markets Scoreboard 2016’.
0
0.5
1
1.5
2
2.5
3% of GDP
Cyprus, total
Cyprusexcluding FDIin financialservices
EU28
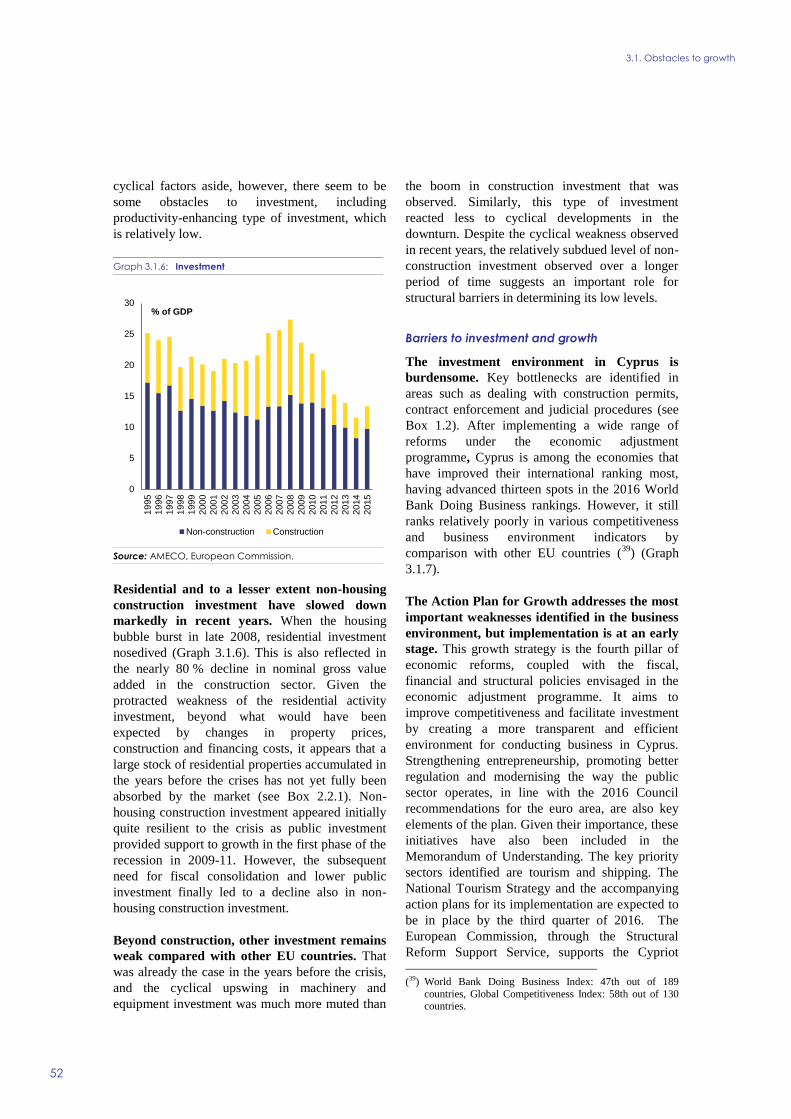
3.1. Obstacles to growth
52
cyclical factors aside, however, there seem to be
some obstacles to investment, including
productivity-enhancing type of investment, which
is relatively low.
Graph 3.1.6: Investment
Source: AMECO, European Commission.
Residential and to a lesser extent non-housing
construction investment have slowed down
markedly in recent years. When the housing
bubble burst in late 2008, residential investment
nosedived (Graph 3.1.6). This is also reflected in
the nearly 80 % decline in nominal gross value
added in the construction sector. Given the
protracted weakness of the residential activity
investment, beyond what would have been
expected by changes in property prices,
construction and financing costs, it appears that a
large stock of residential properties accumulated in
the years before the crises has not yet fully been
absorbed by the market (see Box 2.2.1). Non-
housing construction investment appeared initially
quite resilient to the crisis as public investment
provided support to growth in the first phase of the
recession in 2009-11. However, the subsequent
need for fiscal consolidation and lower public
investment finally led to a decline also in non-
housing construction investment.
Beyond construction, other investment remains
weak compared with other EU countries. That
was already the case in the years before the crisis,
and the cyclical upswing in machinery and
equipment investment was much more muted than
the boom in construction investment that was
observed. Similarly, this type of investment
reacted less to cyclical developments in the
downturn. Despite the cyclical weakness observed
in recent years, the relatively subdued level of non-
construction investment observed over a longer
period of time suggests an important role for
structural barriers in determining its low levels.
Barriers to investment and growth
The investment environment in Cyprus is
burdensome. Key bottlenecks are identified in
areas such as dealing with construction permits,
contract enforcement and judicial procedures (see
Box 1.2). After implementing a wide range of
reforms under the economic adjustment
programme, Cyprus is among the economies that
have improved their international ranking most,
having advanced thirteen spots in the 2016 World
Bank Doing Business rankings. However, it still
ranks relatively poorly in various competitiveness
and business environment indicators by
comparison with other EU countries (39
) (Graph
3.1.7).
The Action Plan for Growth addresses the most
important weaknesses identified in the business
environment, but implementation is at an early
stage. This growth strategy is the fourth pillar of
economic reforms, coupled with the fiscal,
financial and structural policies envisaged in the
economic adjustment programme. It aims to
improve competitiveness and facilitate investment
by creating a more transparent and efficient
environment for conducting business in Cyprus.
Strengthening entrepreneurship, promoting better
regulation and modernising the way the public
sector operates, in line with the 2016 Council
recommendations for the euro area, are also key
elements of the plan. Given their importance, these
initiatives have also been included in the
Memorandum of Understanding. The key priority
sectors identified are tourism and shipping. The
National Tourism Strategy and the accompanying
action plans for its implementation are expected to
be in place by the third quarter of 2016. The
European Commission, through the Structural
Reform Support Service, supports the Cypriot
(39) World Bank Doing Business Index: 47th out of 189
countries, Global Competitiveness Index: 58th out of 130 countries.
0
5
10
15
20
25
30
1995
1996
1997
1998
1999
2000
2001
2002
2003
2004
2005
2006
2007
2008
2009
2010
2011
2012
2013
2014
2015
% of GDP
Non-construction Construction
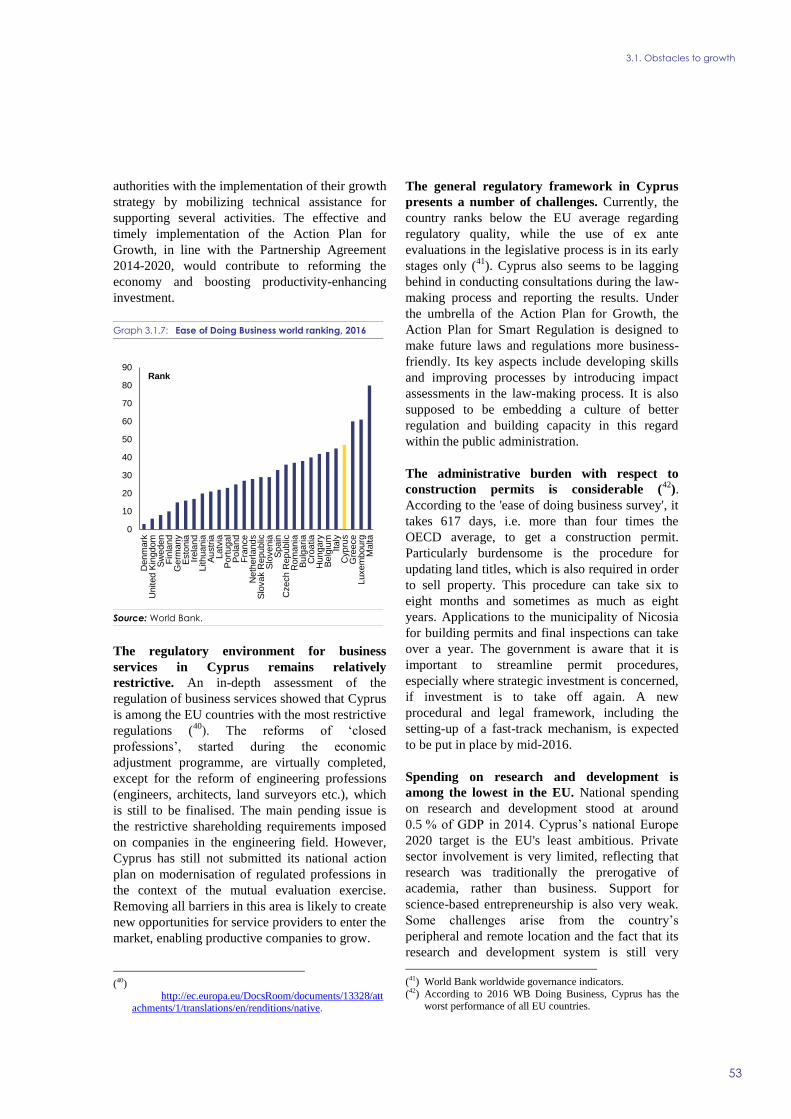
3.1. Obstacles to growth
53
authorities with the implementation of their growth
strategy by mobilizing technical assistance for
supporting several activities. The effective and
timely implementation of the Action Plan for
Growth, in line with the Partnership Agreement
2014-2020, would contribute to reforming the
economy and boosting productivity-enhancing
investment.
Graph 3.1.7: Ease of Doing Business world ranking, 2016
Source: World Bank.
The regulatory environment for business
services in Cyprus remains relatively
restrictive. An in-depth assessment of the
regulation of business services showed that Cyprus
is among the EU countries with the most restrictive
regulations (40
). The reforms of ‘closed
professions’, started during the economic
adjustment programme, are virtually completed,
except for the reform of engineering professions
(engineers, architects, land surveyors etc.), which
is still to be finalised. The main pending issue is
the restrictive shareholding requirements imposed
on companies in the engineering field. However,
Cyprus has still not submitted its national action
plan on modernisation of regulated professions in
the context of the mutual evaluation exercise.
Removing all barriers in this area is likely to create
new opportunities for service providers to enter the
market, enabling productive companies to grow.
(40)
http://ec.europa.eu/DocsRoom/documents/13328/attachments/1/translations/en/renditions/native.
The general regulatory framework in Cyprus
presents a number of challenges. Currently, the
country ranks below the EU average regarding
regulatory quality, while the use of ex ante
evaluations in the legislative process is in its early
stages only (41
). Cyprus also seems to be lagging
behind in conducting consultations during the law-
making process and reporting the results. Under
the umbrella of the Action Plan for Growth, the
Action Plan for Smart Regulation is designed to
make future laws and regulations more business-
friendly. Its key aspects include developing skills
and improving processes by introducing impact
assessments in the law-making process. It is also
supposed to be embedding a culture of better
regulation and building capacity in this regard
within the public administration.
The administrative burden with respect to
construction permits is considerable (42
).
According to the 'ease of doing business survey', it
takes 617 days, i.e. more than four times the
OECD average, to get a construction permit.
Particularly burdensome is the procedure for
updating land titles, which is also required in order
to sell property. This procedure can take six to
eight months and sometimes as much as eight
years. Applications to the municipality of Nicosia
for building permits and final inspections can take
over a year. The government is aware that it is
important to streamline permit procedures,
especially where strategic investment is concerned,
if investment is to take off again. A new
procedural and legal framework, including the
setting-up of a fast-track mechanism, is expected
to be put in place by mid-2016.
Spending on research and development is
among the lowest in the EU. National spending
on research and development stood at around
0.5 % of GDP in 2014. Cyprus’s national Europe
2020 target is the EU's least ambitious. Private
sector involvement is very limited, reflecting that
research was traditionally the prerogative of
academia, rather than business. Support for
science-based entrepreneurship is also very weak.
Some challenges arise from the country’s
peripheral and remote location and the fact that its
research and development system is still very
(41) World Bank worldwide governance indicators.
(42) According to 2016 WB Doing Business, Cyprus has the worst performance of all EU countries.
0
10
20
30
40
50
60
70
80
90
Denm
ark
United K
ingdom
Sw
eden
Fin
lan
dG
erm
any
Esto
nia
Irela
nd
Lith
uania
Au
str
iaLatv
iaP
ort
uga
lP
ola
nd
Fra
nce
Neth
erla
nds
Slo
va
k R
ep
ub
licS
lovenia
Sp
ain
Cze
ch R
epublic
Rom
ania
Bu
lga
ria
Cro
atia
Hungary
Be
lgiu
mItaly
Cyp
rus
Gre
ece
Luxem
bourg
Ma
lta
Rank

3.1. Obstacles to growth
54
young. Still, research and development governance
lacks guidance, vision and a consistent strategy.
No systematic evaluations of programmes are
being carried out, and funding is still spread over
many research areas. On the positive side, Cyprus
has approved its smart specialisation strategy for
building the competitive advantages of the
economy by matching research and innovation to
business needs. Moreover, Cyprus exhibits a stable
and crisis-resistant growth over time in the area of
entrepreneurial activity (43
).The national policy
statement on entrepreneurship adopted in 2015 has
five priority strands that set quantitative targets
where possible: developing an entrepreneurial
culture, improving the business environment,
business innovation, enhancing access to financing
and facilitating access to markets.
Table 3.1.1: Research and development indicators for
Cyprus
(1) EU average for the latest available year (2) Values in
italics are estimated or provisional.
Source: Commission services
Access to finance is a pressing issue for
businesses (44
). Bank lending has been reduced
and poses a significant constraint for small and
medium-sized businesses trying to access finance
(Section 2.1). In addition, access to alternative
financing sources such as venture capital is
limited, not least because entrepreneurs are not
aware of alternative investment funds. Small and
medium-sized businesses have less financial
literacy, so their skills and opportunities for
participating in and benefit from available funding
programmes are limited (45
). The banking sector in
Cyprus is able to implement basic financial
instruments only, and is not equipped to assess
early stage business risks. Scarce funding, coupled
with high rates of non-performing loans, weigh on
small businesses' capacity to invest, especially in
(43) Cologne Institute for Economic Research, IW policy paper,
2/2016
(44) According to the 2015 access to finance of enterprises from ECB, 25% of entrepreneurs consider access to finance to
be the most pressing issue, compared with 10% in the EU
as a whole. (45) National Policy Statement on Entrepreneurship, Nov. 2015
.
innovative and more risky projects. Exploring
alternative financing instruments while also
improving businesses' ‘investment readiness’
would increase opportunities for innovative
companies to grow.
Reliable access to finance is a key driver of
sustainable and balanced growth. Several
financial instruments were put in place in recent
years, but results are somewhat mixed. The
government managed to put in place three
financial instruments with the European
Investment Bank to support entrepreneurship and
improve access to finance for small and medium-
sized businesses. The Cyprus Entrepreneurship
Fund (CYPEF) supports both working capital and
investment loans for SMEs. This risk-sharing
facility has been less successful so far, partly
because Cypriot banks have tightened credit
conditions. A Trade Finance Facility offers
guarantees for foreign banks to provide trade
finance to Cypriot small and medium-sized
companies and Mid-Caps. The European
Investment Bank's Multi-Beneficiary
Intermediated Lending provides additional funding
at advantageous interest rates and longer maturities
(up to twelve years). This programme has helped
cut the cost of funding for businesses.
There are also opportunities to stimulate
financing from the European Fund for Strategic
Investments (EFSI), in combination with ESIF
support and through EU competitive
programmes. The take-up of financial instruments
under the programming period 2014-2020 has been
so far limited. In addition, the proposed
organisational structure in the government for
dealing with the management of EU-instruments
such as ESIF, EFSI is pending confirmation. In
general, the access to finance issue falls under the
responsibilities of various ministries, which may
limit the opportunities for using the resources
available to the full extent and makes it more
difficult for businesses to be aware of the funds
that exist. EU competitive programs such as
COSME and H2020 are accessible to local
financial intermediaries who could apply directly.
However, the take-up of similar programs in the
previous programming period was very limited.
2014 EU average (1) EU Rank
R&D Intensity (as % of GDP) 0.5 2.0 27
Public expenditure on R&D as % of
GDP0.3 0.7 26
Business enterprise expenditure on
R&D as % of GDP0.1 1.3 28
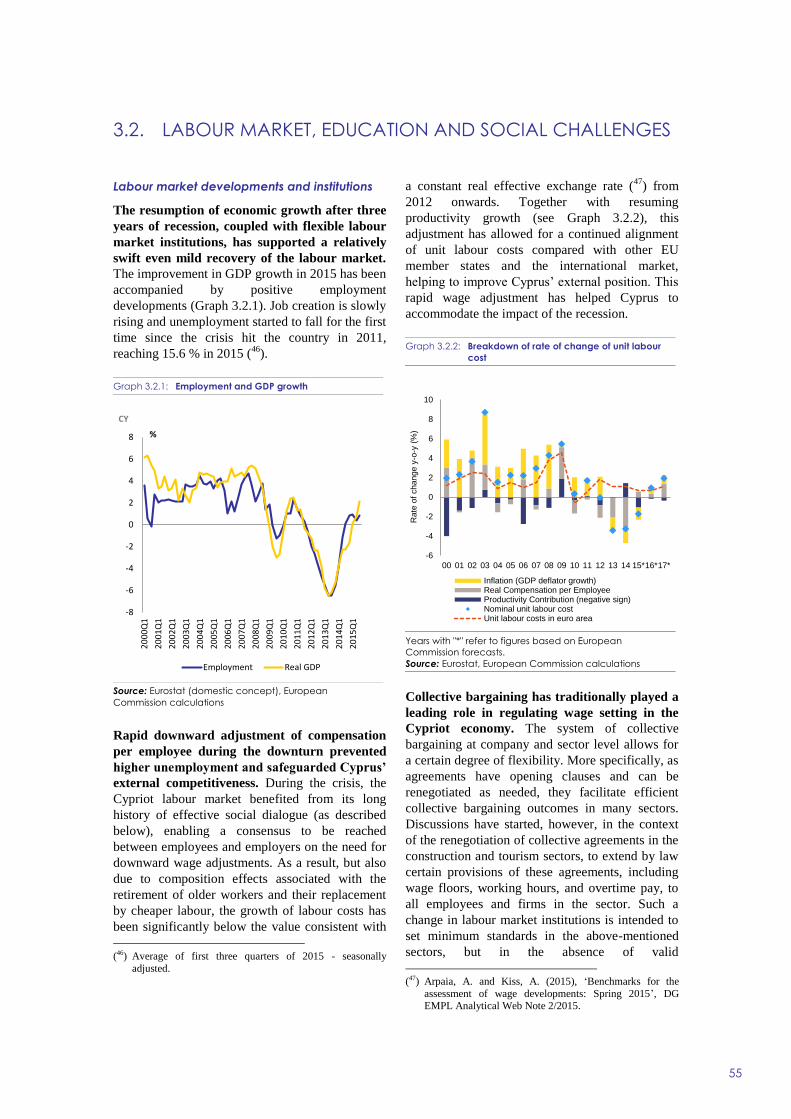
55
Labour market developments and institutions
The resumption of economic growth after three
years of recession, coupled with flexible labour
market institutions, has supported a relatively
swift even mild recovery of the labour market.
The improvement in GDP growth in 2015 has been
accompanied by positive employment
developments (Graph 3.2.1). Job creation is slowly
rising and unemployment started to fall for the first
time since the crisis hit the country in 2011,
reaching 15.6 % in 2015 (46
).
Graph 3.2.1: Employment and GDP growth
Source: Eurostat (domestic concept), European
Commission calculations
Rapid downward adjustment of compensation
per employee during the downturn prevented
higher unemployment and safeguarded Cyprus’
external competitiveness. During the crisis, the
Cypriot labour market benefited from its long
history of effective social dialogue (as described
below), enabling a consensus to be reached
between employees and employers on the need for
downward wage adjustments. As a result, but also
due to composition effects associated with the
retirement of older workers and their replacement
by cheaper labour, the growth of labour costs has
been significantly below the value consistent with
(46) Average of first three quarters of 2015 - seasonally
adjusted.
a constant real effective exchange rate (47
) from
2012 onwards. Together with resuming
productivity growth (see Graph 3.2.2), this
adjustment has allowed for a continued alignment
of unit labour costs compared with other EU
member states and the international market,
helping to improve Cyprus’ external position. This
rapid wage adjustment has helped Cyprus to
accommodate the impact of the recession.
Graph 3.2.2: Breakdown of rate of change of unit labour
cost
Years with "*" refer to figures based on European
Commission forecasts.
Source: Eurostat, European Commission calculations
Collective bargaining has traditionally played a
leading role in regulating wage setting in the
Cypriot economy. The system of collective
bargaining at company and sector level allows for
a certain degree of flexibility. More specifically, as
agreements have opening clauses and can be
renegotiated as needed, they facilitate efficient
collective bargaining outcomes in many sectors.
Discussions have started, however, in the context
of the renegotiation of collective agreements in the
construction and tourism sectors, to extend by law
certain provisions of these agreements, including
wage floors, working hours, and overtime pay, to
all employees and firms in the sector. Such a
change in labour market institutions is intended to
set minimum standards in the above-mentioned
sectors, but in the absence of valid
(47) Arpaia, A. and Kiss, A. (2015), ‘Benchmarks for the
assessment of wage developments: Spring 2015’, DG EMPL Analytical Web Note 2/2015.
-8
-6
-4
-2
0
2
4
6
8
20
00
Q1
20
01
Q1
20
02
Q1
20
03
Q1
20
04
Q1
20
05
Q1
20
06
Q1
20
07
Q1
20
08
Q1
20
09
Q1
20
10
Q1
20
11
Q1
20
12
Q1
20
13
Q1
20
14
Q1
20
15
Q1
%
CY
Employment Real GDP
-6
-4
-2
0
2
4
6
8
10
00 01 02 03 04 05 06 07 08 09 10 11 12 13 14 15*16*17*
Rate
of
change y
-o-y
(%
)
Inflation (GDP deflator growth)Real Compensation per EmployeeProductivity Contribution (negative sign)Nominal unit labour costUnit labour costs in euro area
3.2. LABOUR MARKET, EDUCATION AND SOCIAL CHALLENGES
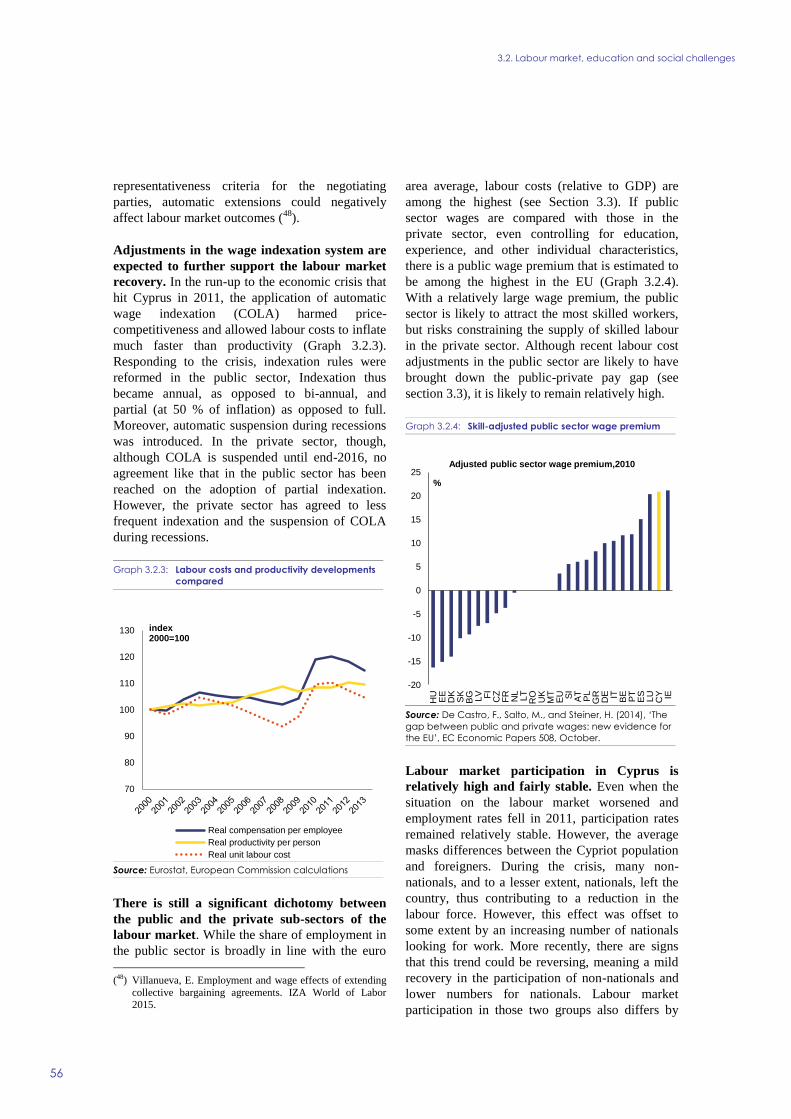
3.2. Labour market, education and social challenges
56
representativeness criteria for the negotiating
parties, automatic extensions could negatively
affect labour market outcomes (48
).
Adjustments in the wage indexation system are
expected to further support the labour market
recovery. In the run-up to the economic crisis that
hit Cyprus in 2011, the application of automatic
wage indexation (COLA) harmed price-
competitiveness and allowed labour costs to inflate
much faster than productivity (Graph 3.2.3).
Responding to the crisis, indexation rules were
reformed in the public sector, Indexation thus
became annual, as opposed to bi-annual, and
partial (at 50 % of inflation) as opposed to full.
Moreover, automatic suspension during recessions
was introduced. In the private sector, though,
although COLA is suspended until end-2016, no
agreement like that in the public sector has been
reached on the adoption of partial indexation.
However, the private sector has agreed to less
frequent indexation and the suspension of COLA
during recessions.
Graph 3.2.3: Labour costs and productivity developments
compared
Source: Eurostat, European Commission calculations
There is still a significant dichotomy between
the public and the private sub-sectors of the
labour market. While the share of employment in
the public sector is broadly in line with the euro
(48) Villanueva, E. Employment and wage effects of extending
collective bargaining agreements. IZA World of Labor 2015.
area average, labour costs (relative to GDP) are
among the highest (see Section 3.3). If public
sector wages are compared with those in the
private sector, even controlling for education,
experience, and other individual characteristics,
there is a public wage premium that is estimated to
be among the highest in the EU (Graph 3.2.4).
With a relatively large wage premium, the public
sector is likely to attract the most skilled workers,
but risks constraining the supply of skilled labour
in the private sector. Although recent labour cost
adjustments in the public sector are likely to have
brought down the public-private pay gap (see
section 3.3), it is likely to remain relatively high.
Graph 3.2.4: Skill-adjusted public sector wage premium
Source: De Castro, F., Salto, M., and Steiner, H. (2014), ‘The
gap between public and private wages: new evidence for
the EU’, EC Economic Papers 508, October.
Labour market participation in Cyprus is
relatively high and fairly stable. Even when the
situation on the labour market worsened and
employment rates fell in 2011, participation rates
remained relatively stable. However, the average
masks differences between the Cypriot population
and foreigners. During the crisis, many non-
nationals, and to a lesser extent, nationals, left the
country, thus contributing to a reduction in the
labour force. However, this effect was offset to
some extent by an increasing number of nationals
looking for work. More recently, there are signs
that this trend could be reversing, meaning a mild
recovery in the participation of non-nationals and
lower numbers for nationals. Labour market
participation in those two groups also differs by
70
80
90
100
110
120
130 index 2000=100
Real compensation per employee
Real productivity per person
Real unit labour cost
-20
-15
-10
-5
0
5
10
15
20
25
HU
EE
DK
SK
BG LV FI
CZ
FR
NL
LT
RO
UK
MT
EU SI
AT
PL
GR
DE IT BE
PT
ES
LU
CY IE
%
Adjusted public sector wage premium,2010
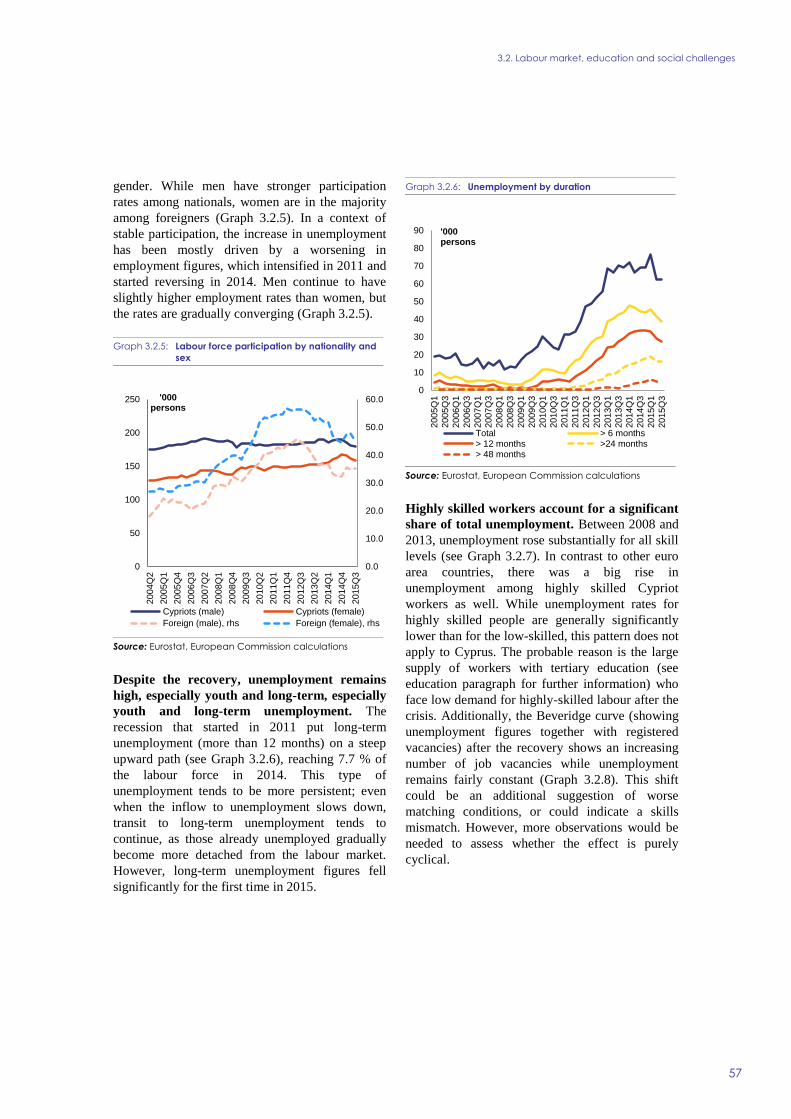
3.2. Labour market, education and social challenges
57
gender. While men have stronger participation
rates among nationals, women are in the majority
among foreigners (Graph 3.2.5). In a context of
stable participation, the increase in unemployment
has been mostly driven by a worsening in
employment figures, which intensified in 2011 and
started reversing in 2014. Men continue to have
slightly higher employment rates than women, but
the rates are gradually converging (Graph 3.2.5).
Graph 3.2.5: Labour force participation by nationality and
sex
Source: Eurostat, European Commission calculations
Despite the recovery, unemployment remains
high, especially youth and long-term, especially
youth and long-term unemployment. The
recession that started in 2011 put long-term
unemployment (more than 12 months) on a steep
upward path (see Graph 3.2.6), reaching 7.7 % of
the labour force in 2014. This type of
unemployment tends to be more persistent; even
when the inflow to unemployment slows down,
transit to long-term unemployment tends to
continue, as those already unemployed gradually
become more detached from the labour market.
However, long-term unemployment figures fell
significantly for the first time in 2015.
Graph 3.2.6: Unemployment by duration
Source: Eurostat, European Commission calculations
Highly skilled workers account for a significant
share of total unemployment. Between 2008 and
2013, unemployment rose substantially for all skill
levels (see Graph 3.2.7). In contrast to other euro
area countries, there was a big rise in
unemployment among highly skilled Cypriot
workers as well. While unemployment rates for
highly skilled people are generally significantly
lower than for the low-skilled, this pattern does not
apply to Cyprus. The probable reason is the large
supply of workers with tertiary education (see
education paragraph for further information) who
face low demand for highly-skilled labour after the
crisis. Additionally, the Beveridge curve (showing
unemployment figures together with registered
vacancies) after the recovery shows an increasing
number of job vacancies while unemployment
remains fairly constant (Graph 3.2.8). This shift
could be an additional suggestion of worse
matching conditions, or could indicate a skills
mismatch. However, more observations would be
needed to assess whether the effect is purely
cyclical.
0.0
10.0
20.0
30.0
40.0
50.0
60.0
0
50
100
150
200
250
2004Q
2
2005Q
1
2005Q
4
2006Q
3
2007Q
2
2008Q
1
2008Q
4
2009Q
3
2010Q
2
2011Q
1
2011Q
4
2012Q
3
2013Q
2
2014Q
1
2014Q
4
2015Q
3
'000 persons
Cypriots (male) Cypriots (female)
Foreign (male), rhs Foreign (female), rhs
0
10
20
30
40
50
60
70
80
90
2005Q
1
2005Q
3
2006Q
1
2006Q
3
2007Q
1
2007Q
3
2008Q
1
2008Q
3
2009Q
1
2009Q
3
2010Q
1
2010Q
3
2011Q
1
2011Q
3
2012Q
1
2012Q
3
2013Q
1
2013Q
3
2014Q
1
2014Q
3
2015Q
1
2015Q
3
'000 persons
Total > 6 months> 12 months >24 months> 48 months

3.2. Labour market, education and social challenges
58
Graph 3.2.7: Unemployment rate by skill level, age 15-64
(per cent)
Source: Eurostat, European Commission calculations: Skill
levels are defined in terms of ISCED11 classification of
qualifications (cat. 0-2 for low-skilled; cat. 3-4 for medium-
skilled; and cat. 5-8 for high-skilled)
Graph 3.2.8: Beveridge Curve
Source: Eurostat and Cystat, European Commission
calculations
Youth unemployment is falling, but remains
well above pre-crisis levels. At 32.6 % in
September 2015(49
), it is significantly above the
EU average (20.1 %). The youth unemployment
rate (15-24) is more than double the overall
(49) Eurostat, Unemployment rate by sex and age groups -
monthly average,% (une_rt_m)
unemployment rate (50
). Young people are also in a
precarious situation in the labour market, as
reflected by the very high share of involuntary
temporary contracts among young people (51
).
Graph 3.2.9: Unemployment rate by age groups (percent)
Source: Eurostat, European Commission calculations
The rate of young people not in education,
employment or training (NEET) is historically
high and above the EU average. It reached
17.1% in 2014 in the 15-24 age group. Unlike
most EU countries, the NEET rate in Cyprus is
positively correlated with educational attainment,
as measured by the International Standard
Classification of Education (ISCED) level (52
). In
other words, the higher the educational level, the
higher the incidence of NEETs. For example,
25.1% of 15-29-year olds with ISCED level 5-6
are NEETs, whereas the share is 19.9 % for those
with ISCED 3-4 and 11.8 % for those with ISCED
level 0-2 (2013 figures). This should be seen in a
context where the employment rate of people who
have completed upper secondary education (20-34
years) is among the lowest in the EU, and is still
30 pp below its 2008 level(53
). The high and
(50) 32.6% compared to 15.1% in Q3 2015; Eurostat,
Unemployment rate by sex and age groups - quarterly average,% (une_rt_q).
(51) 78.7% in 2014; Eurostat, Main reasons for temporary
employment (15- 24) lfsa_etgar (reason ‘could not find permanent job’).
(52) Incidence of NEETs rate by educational level and Member
States (15-29 only) in 2013, Eurofound, ‘The diversity of NEETs’ – forthcoming.
(53) 47.6% in 2014; Eurostat, Employment rates of upper
secondary graduates (20-34 years), edat_lfse_24.
0
5
10
15
20
25% labour
force
High skilled Medium skilled
Low skilled High skilled (EA)
Medium skilled (EA) Euro area
2010 Q3
2011 Q3
2012 Q3
2013 Q3
2015 Q3
2014 Q3
0
2000
4000
6000
0 5 10 15 20
Vacancies
4-quarter
averages
Unemployment rate, % LF, 4-quarter averages
Beveridge Curve
0
5
10
15
20
25
30
35
40
45
2005Q
2
2006Q
2
2007Q
2
2008Q
2
2009Q
2
2010Q
2
2011Q
2
2012Q
2
2013Q
2
2014Q
2
2015Q
2
%
From 15 to 24 years From 25 to 54 years
From 55 to 64 years
3.2. Labour market, education and social challenges
59
persistent youth unemployment and NEET rates
increase the risk of young people becoming
disengaged from the labour market.
The reform of the system of active labour
market policies is mostly progressing through
the implementation of the Youth Guarantee
(YG), as part of the national action plan for
youth employment. The youth employment
initiative in Cyprus covers about a third of young
people. Additionally, a number of schemes
financed by the European Social Fund and/or
national funds have been launched to support
employment among other social groups, including
women, the long-term unemployed, the self-
employed, social enterprises and other
disadvantaged groups such as people with
disabilities. The number of people expected to take
part in employment programmes was 3 400 in
2015 (about 4.8 % of those unemployed and 0.8 %
of the labour force in the first half of 2015). The
projected figures for 2016 and 2017 are 15 500 and
8 000 respectively, the big increase in 2016 being
due partly to the frontloading of actions in the
context of the youth employment initiative, but
also to delays in launching the schemes planned
for 2015. The attractiveness of ALMP schemes
being implemented varies considerably. Schemes
placing young unemployed (people who have
completed tertiary, secondary, and post-secondary
education) in business and other organisations to
give them work experience have had higher
participation than others, such as subsidised
employment in the retail sector. The preliminary
assessment is that policy responses are not yet
comprehensive enough. So far, there is no fully-
fledged outreach strategy for non-registered
NEETs. A comprehensive tool is gradually being
used to monitor and evaluate the programmes, and
the results from this assessment will be crucial in
identifying further weaknesses.
Public Employment Services (PES) still lack the
capacity to respond to carry out their extended
tasks and meet higher demand for their
services. While registrations in the public
employment service rose by 55% from 2009 to
March 2015, staff numbers expanded by less than
15 % during the same period, with the proportion
of staff dealing directly with the unemployed
having fallen from about 73 % to 66 %. The
measures set out in the Memorandum of
Understanding (section 4.4.ii) to improve the
administrative capacity of the public employment
service continue to be delayed. This affects service
provision to all jobseekers, and especially the
implementation of the Youth Guarantee and the
recent long-term unemployment initiative. Public
employment services' capacity for activation is
further hampered by year-to-year fluctuations in
active labour market policy budgets, which
accounted for almost two thirds of spending by
public employment service in 2015.
Delays in the strengthening public employment
services (including structural changes) are
holding back the reduction of the high youth
and long-term unemployment rates. The
package of measures planned to strengthen the
public employment services is not yet in place.
Even if staff is increased by 35 counsellors in
2016, as is planned, the public employment
services’ projected capacity will still be inadequate
for coping with the entire pool of unemployed
people. However, a budget of EUR 5.7 million has
been allocated and is available to improve the
administrative capacity of labour market
institutions through the European Social Fund
Operational Programme for 2014-20. The Cypriot
Authorities have already committed EUR 2 million
of this to public employment services.
Education and training
There is a fairly mixed picture as regards the
performance of Cyprus’ education and training
system. Early school leaving has declined steadily
in recent years and the tertiary attainment rate is
one of the highest in the EU (Graph 3.2.10).
However, while public expenditure on education
as a share of GDP is amongst the highest in the
EU, the quality of educational outcomes is
insufficient, with an unsatisfactory performance in
basic skills by students (Graph 3.2.11) and young
adults alike. Moreover, recent graduates have the
lowest employability rates in the EU. Finally, the
higher education system is responding sluggishly
to the changing economic structure and adapting
only slowly to future skills needs. This remains a
major cause for concern.
The level of public spending on education is
high, but there are efficiency problems. While
spending levels were reduced considerably in
response to the crisis, only three other EU
countries invested more public funds in education
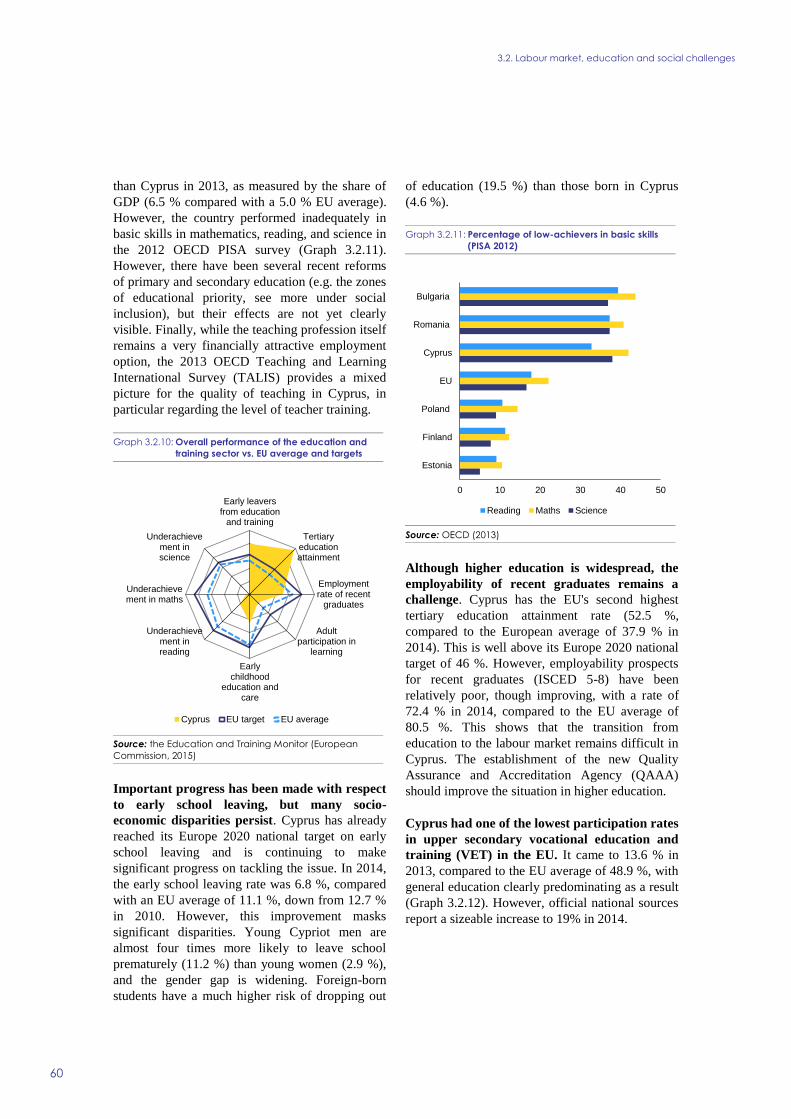
3.2. Labour market, education and social challenges
60
than Cyprus in 2013, as measured by the share of
GDP (6.5 % compared with a 5.0 % EU average).
However, the country performed inadequately in
basic skills in mathematics, reading, and science in
the 2012 OECD PISA survey (Graph 3.2.11).
However, there have been several recent reforms
of primary and secondary education (e.g. the zones
of educational priority, see more under social
inclusion), but their effects are not yet clearly
visible. Finally, while the teaching profession itself
remains a very financially attractive employment
option, the 2013 OECD Teaching and Learning
International Survey (TALIS) provides a mixed
picture for the quality of teaching in Cyprus, in
particular regarding the level of teacher training.
Graph 3.2.10: Overall performance of the education and
training sector vs. EU average and targets
Source: the Education and Training Monitor (European
Commission, 2015)
Important progress has been made with respect
to early school leaving, but many socio-
economic disparities persist. Cyprus has already
reached its Europe 2020 national target on early
school leaving and is continuing to make
significant progress on tackling the issue. In 2014,
the early school leaving rate was 6.8 %, compared
with an EU average of 11.1 %, down from 12.7 %
in 2010. However, this improvement masks
significant disparities. Young Cypriot men are
almost four times more likely to leave school
prematurely (11.2 %) than young women (2.9 %),
and the gender gap is widening. Foreign-born
students have a much higher risk of dropping out
of education (19.5 %) than those born in Cyprus
(4.6 %).
Graph 3.2.11: Percentage of low-achievers in basic skills
(PISA 2012)
Source: OECD (2013)
Although higher education is widespread, the
employability of recent graduates remains a
challenge. Cyprus has the EU's second highest
tertiary education attainment rate (52.5 %,
compared to the European average of 37.9 % in
2014). This is well above its Europe 2020 national
target of 46 %. However, employability prospects
for recent graduates (ISCED 5-8) have been
relatively poor, though improving, with a rate of
72.4 % in 2014, compared to the EU average of
80.5 %. This shows that the transition from
education to the labour market remains difficult in
Cyprus. The establishment of the new Quality
Assurance and Accreditation Agency (QAAA)
should improve the situation in higher education.
Cyprus had one of the lowest participation rates
in upper secondary vocational education and
training (VET) in the EU. It came to 13.6 % in
2013, compared to the EU average of 48.9 %, with
general education clearly predominating as a result
(Graph 3.2.12). However, official national sources
report a sizeable increase to 19% in 2014.
Early leaversfrom education
and training
Tertiaryeducationattainment
Employmentrate of recent
graduates
Adultparticipation in
learning
Earlychildhood
education andcare
Underachievement inreading
Underachievement in maths
Underachievement inscience
Cyprus EU target EU average
0 10 20 30 40 50
Estonia
Finland
Poland
EU
Cyprus
Romania
Bulgaria
Reading Maths Science
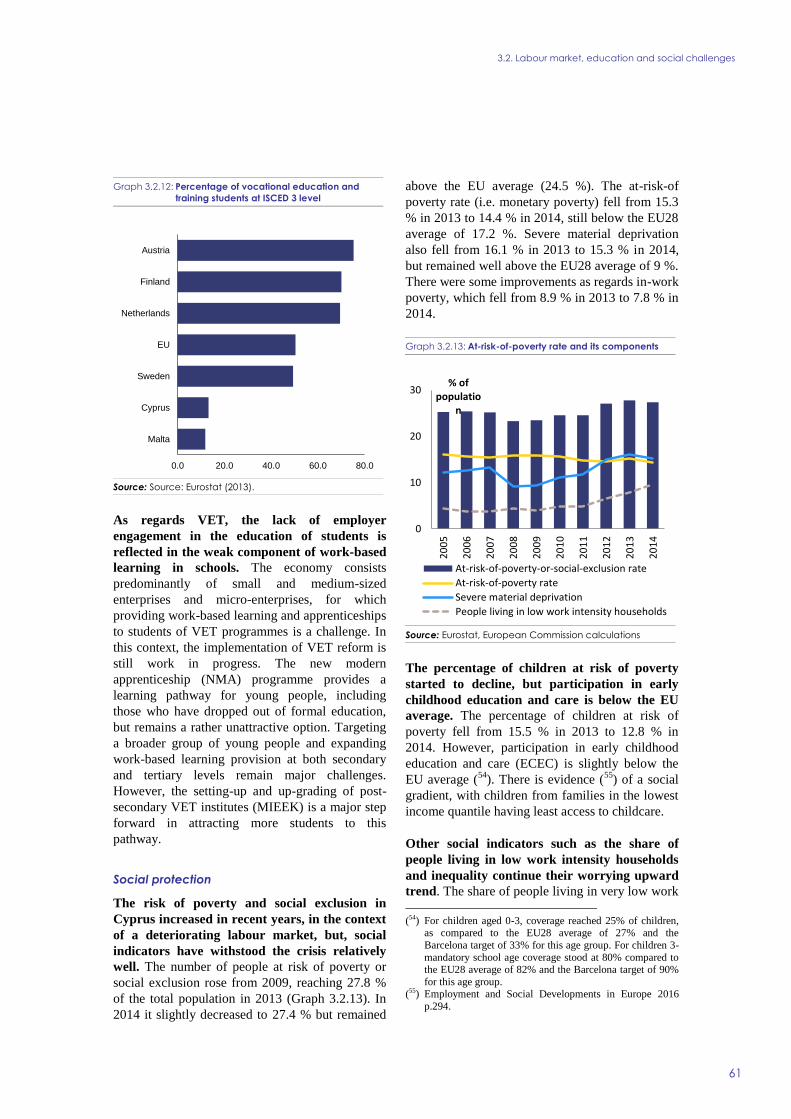
3.2. Labour market, education and social challenges
61
Graph 3.2.12: Percentage of vocational education and
training students at ISCED 3 level
Source: Source: Eurostat (2013).
As regards VET, the lack of employer
engagement in the education of students is
reflected in the weak component of work-based
learning in schools. The economy consists
predominantly of small and medium-sized
enterprises and micro-enterprises, for which
providing work-based learning and apprenticeships
to students of VET programmes is a challenge. In
this context, the implementation of VET reform is
still work in progress. The new modern
apprenticeship (NMA) programme provides a
learning pathway for young people, including
those who have dropped out of formal education,
but remains a rather unattractive option. Targeting
a broader group of young people and expanding
work-based learning provision at both secondary
and tertiary levels remain major challenges.
However, the setting-up and up-grading of post-
secondary VET institutes (MIEEK) is a major step
forward in attracting more students to this
pathway.
Social protection
The risk of poverty and social exclusion in
Cyprus increased in recent years, in the context
of a deteriorating labour market, but, social
indicators have withstood the crisis relatively
well. The number of people at risk of poverty or
social exclusion rose from 2009, reaching 27.8 %
of the total population in 2013 (Graph 3.2.13). In
2014 it slightly decreased to 27.4 % but remained
above the EU average (24.5 %). The at-risk-of
poverty rate (i.e. monetary poverty) fell from 15.3
% in 2013 to 14.4 % in 2014, still below the EU28
average of 17.2 %. Severe material deprivation
also fell from 16.1 % in 2013 to 15.3 % in 2014,
but remained well above the EU28 average of 9 %.
There were some improvements as regards in-work
poverty, which fell from 8.9 % in 2013 to 7.8 % in
2014.
Graph 3.2.13: At-risk-of-poverty rate and its components
Source: Eurostat, European Commission calculations
The percentage of children at risk of poverty
started to decline, but participation in early
childhood education and care is below the EU
average. The percentage of children at risk of
poverty fell from 15.5 % in 2013 to 12.8 % in
2014. However, participation in early childhood
education and care (ECEC) is slightly below the
EU average (54
). There is evidence (55
) of a social
gradient, with children from families in the lowest
income quantile having least access to childcare.
Other social indicators such as the share of
people living in low work intensity households
and inequality continue their worrying upward
trend. The share of people living in very low work
(54) For children aged 0-3, coverage reached 25% of children,
as compared to the EU28 average of 27% and the
Barcelona target of 33% for this age group. For children 3-
mandatory school age coverage stood at 80% compared to the EU28 average of 82% and the Barcelona target of 90%
for this age group. (55) Employment and Social Developments in Europe 2016
p.294.
0.0 20.0 40.0 60.0 80.0
Malta
Cyprus
Sweden
EU
Netherlands
Finland
Austria
0
10
20
30
20
05
20
06
20
07
20
08
20
09
20
10
20
11
20
12
20
13
20
14
% of populatio
n
At-risk-of-poverty-or-social-exclusion rate
At-risk-of-poverty rate
Severe material deprivation
People living in low work intensity households

3.2. Labour market, education and social challenges
62
intensity households (‘quasi-jobless households’)
continued to rise against the backdrop of still weak
labour market conditions, reaching 9.7 % in 2014
(a 1.8 pp increase compared to 2013). Inequality
(as measured by the S80/S20 i.e. the ratio of the
income of the richest 20 % to that of the poorest 20
% of the population) increased considerably
between 2009 and 2013 and continued to rise in
2014, reaching 5.4 and passing the EU average for
the first time in recent years.
Unemployment benefit coverage of those
unemployed for less than 12 months remains
relatively low. At 20% in 2014, it was 17 pps
lower than the EU average. This reflects a
maximum duration of benefits for 26 weeks in
2015, while eligibility conditions do not appear
particularly strict (56
). Replacement rates after 6
months of unemployment seem to be in line with
the EU average, but fall afterwards.
Cyprus’ social welfare system has undergone a
major reform in recent years. In 2014,
parliament adopted the ‘Guaranteed Minimum
Income and Social Benefits Act’, which replaced
the previous Public Assistance legislation. This
reform is expected to improve the targeting and
(56) The beneficiary needs to have been insured for at least 26
weeks up to the date of unemployment and paid and assimilated insurance in the contribution year preceding
unemployment should be at least 39% of the yearly Basic
Insurable Earnings ceiling or EUR 3,537.
coherence of the system, while also alleviating
poverty and reducing social exclusion (see Box
3.2). The streamlining and administrative
consolidation of benefits outside the GMI
(disability benefits, student benefits) is also
proceeding, although at a slower pace.
Through the ESF Operational Programme for
2014-20, the Cypriot Authorities have
committed themselves to taking complementary
actions against social exclusion, especially for
children. The ‘Actions for social and school
inclusion’ project is an example of complementary
measures aimed at reducing the risk of low-
achievement, poverty and social exclusion. It
builds on the ‘zones of educational priority’ (ZEP)
project, financed by the 2007-13 ESF Operational
Programme. The project will expand the scope of
the ‘zones of educational priority’ by providing
more flexible networks of schools with educational
priority, including individual schools wishing to
participate in the programme. The impact of such
measures is however uncertain as regards both
early school leaving and low achievement in basic
skills, the latter being still a cause for concern.
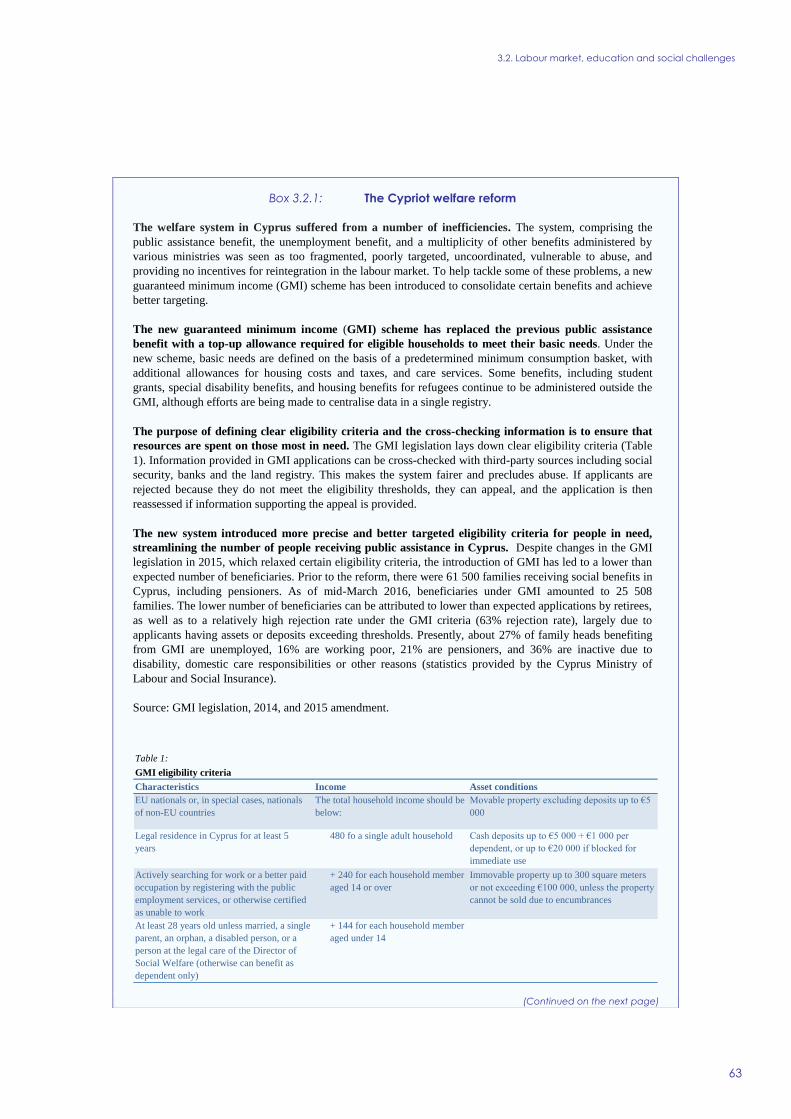
3.2. Labour market, education and social challenges
63
(Continued on the next page)
Box 3.2.1: The Cypriot welfare reform
The welfare system in Cyprus suffered from a number of inefficiencies. The system, comprising the
public assistance benefit, the unemployment benefit, and a multiplicity of other benefits administered by
various ministries was seen as too fragmented, poorly targeted, uncoordinated, vulnerable to abuse, and
providing no incentives for reintegration in the labour market. To help tackle some of these problems, a new
guaranteed minimum income (GMI) scheme has been introduced to consolidate certain benefits and achieve
better targeting.
The new guaranteed minimum income (GMI) scheme has replaced the previous public assistance
benefit with a top-up allowance required for eligible households to meet their basic needs. Under the
new scheme, basic needs are defined on the basis of a predetermined minimum consumption basket, with
additional allowances for housing costs and taxes, and care services. Some benefits, including student
grants, special disability benefits, and housing benefits for refugees continue to be administered outside the
GMI, although efforts are being made to centralise data in a single registry.
The purpose of defining clear eligibility criteria and the cross-checking information is to ensure that
resources are spent on those most in need. The GMI legislation lays down clear eligibility criteria (Table
1). Information provided in GMI applications can be cross-checked with third-party sources including social
security, banks and the land registry. This makes the system fairer and precludes abuse. If applicants are
rejected because they do not meet the eligibility thresholds, they can appeal, and the application is then
reassessed if information supporting the appeal is provided.
The new system introduced more precise and better targeted eligibility criteria for people in need,
streamlining the number of people receiving public assistance in Cyprus. Despite changes in the GMI
legislation in 2015, which relaxed certain eligibility criteria, the introduction of GMI has led to a lower than
expected number of beneficiaries. Prior to the reform, there were 61 500 families receiving social benefits in
Cyprus, including pensioners. As of mid-March 2016, beneficiaries under GMI amounted to 25 508
families. The lower number of beneficiaries can be attributed to lower than expected applications by retirees,
as well as to a relatively high rejection rate under the GMI criteria (63% rejection rate), largely due to
applicants having assets or deposits exceeding thresholds. Presently, about 27% of family heads benefiting
from GMI are unemployed, 16% are working poor, 21% are pensioners, and 36% are inactive due to
disability, domestic care responsibilities or other reasons (statistics provided by the Cyprus Ministry of
Labour and Social Insurance).
Source: GMI legislation, 2014, and 2015 amendment.
Table 1:
GMI eligibility criteria
Characteristics Income Asset conditions
EU nationals or, in special cases, nationals
of non-EU countries
The total household income should be
below:
Movable property excluding deposits up to €5
000
Legal residence in Cyprus for at least 5
years
480 fo a single adult household Cash deposits up to €5 000 + €1 000 per
dependent, or up to €20 000 if blocked for
immediate use
Actively searching for work or a better paid
occupation by registering with the public
employment services, or otherwise certified
as unable to work
+ 240 for each household member
aged 14 or over
Immovable property up to 300 square meters
or not exceeding €100 000, unless the property
cannot be sold due to encumbrances
At least 28 years old unless married, a single
parent, an orphan, a disabled person, or a
person at the legal care of the Director of
Social Welfare (otherwise can benefit as
dependent only)
+ 144 for each household member
aged under 14

3.2. Labour market, education and social challenges
64
Box (continued)
The new system contains much stronger activation mechanisms. To be eligible for GMI, beneficiaries
must be registered with the public employment services and be willing to participate in active labour market
programmes, looking for a job if they are unemployed, or better paid work, if they belong to the working
poor. Once registered, GMI recipients cannot turn down a job offer, without acceptable justification. Failure
to register or to accept a job offer without justification triggers an investigation by the public employment
services, which can lead to a recommendation either to withdraw GMI, or to refer the person concerned to
social intervention services. However, the public employment service faces serious capacity constraints. No
data is yet available on the participation of GMI recipients in active labour market programmes and on their
activation.
The Guaranteed Minimum Income is expected to reduce the intensity of poverty in Cyprus.
Preliminary simulations during its design phase concluded that the new system would have a small impact
on the incidence of relative poverty (at-risk-of-poverty rate), a considerable positive impact on the intensity
of relative poverty, and would significantly reduce absolute poverty. However, a full assessment of the new
system based on actual data has yet to take place.
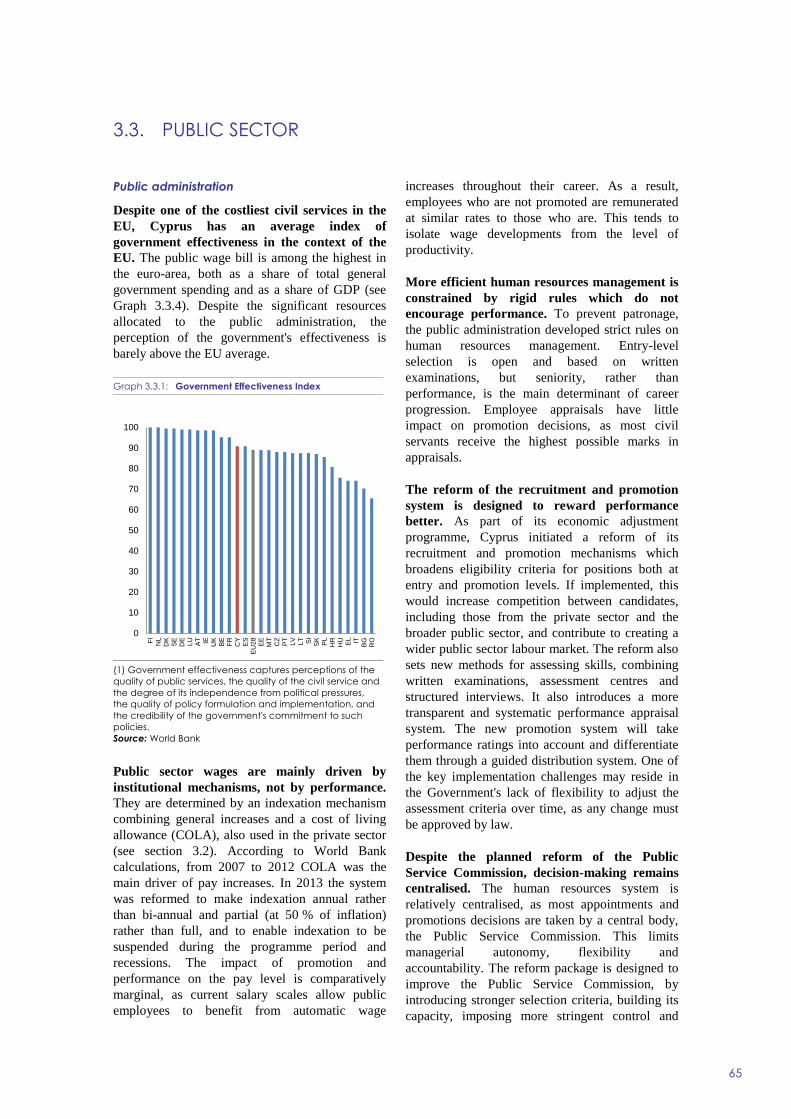
65
Public administration
Despite one of the costliest civil services in the
EU, Cyprus has an average index of
government effectiveness in the context of the
EU. The public wage bill is among the highest in
the euro-area, both as a share of total general
government spending and as a share of GDP (see
Graph 3.3.4). Despite the significant resources
allocated to the public administration, the
perception of the government's effectiveness is
barely above the EU average.
Graph 3.3.1: Government Effectiveness Index
(1) Government effectiveness captures perceptions of the
quality of public services, the quality of the civil service and
the degree of its independence from political pressures,
the quality of policy formulation and implementation, and
the credibility of the government's commitment to such
policies.
Source: World Bank
Public sector wages are mainly driven by
institutional mechanisms, not by performance.
They are determined by an indexation mechanism
combining general increases and a cost of living
allowance (COLA), also used in the private sector
(see section 3.2). According to World Bank
calculations, from 2007 to 2012 COLA was the
main driver of pay increases. In 2013 the system
was reformed to make indexation annual rather
than bi-annual and partial (at 50 % of inflation)
rather than full, and to enable indexation to be
suspended during the programme period and
recessions. The impact of promotion and
performance on the pay level is comparatively
marginal, as current salary scales allow public
employees to benefit from automatic wage
increases throughout their career. As a result,
employees who are not promoted are remunerated
at similar rates to those who are. This tends to
isolate wage developments from the level of
productivity.
More efficient human resources management is
constrained by rigid rules which do not
encourage performance. To prevent patronage,
the public administration developed strict rules on
human resources management. Entry-level
selection is open and based on written
examinations, but seniority, rather than
performance, is the main determinant of career
progression. Employee appraisals have little
impact on promotion decisions, as most civil
servants receive the highest possible marks in
appraisals.
The reform of the recruitment and promotion
system is designed to reward performance
better. As part of its economic adjustment
programme, Cyprus initiated a reform of its
recruitment and promotion mechanisms which
broadens eligibility criteria for positions both at
entry and promotion levels. If implemented, this
would increase competition between candidates,
including those from the private sector and the
broader public sector, and contribute to creating a
wider public sector labour market. The reform also
sets new methods for assessing skills, combining
written examinations, assessment centres and
structured interviews. It also introduces a more
transparent and systematic performance appraisal
system. The new promotion system will take
performance ratings into account and differentiate
them through a guided distribution system. One of
the key implementation challenges may reside in
the Government's lack of flexibility to adjust the
assessment criteria over time, as any change must
be approved by law.
Despite the planned reform of the Public
Service Commission, decision-making remains
centralised. The human resources system is
relatively centralised, as most appointments and
promotions decisions are taken by a central body,
the Public Service Commission. This limits
managerial autonomy, flexibility and
accountability. The reform package is designed to
improve the Public Service Commission, by
introducing stronger selection criteria, building its
capacity, imposing more stringent control and
0
10
20
30
40
50
60
70
80
90
100
FI
NL
DK
SE
DE
LU
AT IE UK
BE
FR
CY
ES
EU
28
EE
MT
CZ
PT
LV
LT SI
SK
PL
HR
HU
EL IT
BG
RO
3.3. PUBLIC SECTOR
3.3. Public sector
66
supervision mechanisms, and restricting members'
length of service. However, this does not address
the issue of excessive centralisation of human
resources decisions, despite managers’ opinion
being given more weight. This limits the flexibility
of human resources management, and prevents
managers from being held accountable for their
units' results.
Low employee mobility weighs on the
administration’s ability to adapt to the
changing needs of the population and of the
economy. There are strong legal and cultural
barriers to mobility within the administration,
which impedes the reallocation of resources
according to priorities. Due to legal constraints on
mobility across government entities, only technical
and clerical employees are considered
interchangeable. The use of secondments as an
alternative tool for mobility has been developed,
but presents a series of disincentives for employees
as regards career progression. The hurdles to
mobility undermine the government’s ability to
establish an internal labour market and adapt
public service activities to the country’s needs.
This is proving particularly critical in the current
context of recruitment freeze and overall staff
reduction.
The reform of mobility rules is designed to
create a more flexible public service. The
proposed reform would increase the incentives for
mobility by broadening schemes of service,
creating a cross-cutting public sector labour
market, simplifying secondment procedures and
introducing mandatory redeployments. This could
enable the administration to redeploy resources
more flexibly according to the needs of the service.
Effective implementation of this reform will
notably depend on the provision of appropriate
training opportunities to allow staff to adapt to new
tasks, and on mobility being perceived as an
advantage in terms of career progression. It will
have to overcome a mobility-averse work culture
by providing an adequate set of incentives.
The authorities also plan to tackle sector-
specific deficiencies. A series of sectoral reviews
allowed the government to identify challenges
regarding key ministries and to formulate relevant
action plans. The action plans range from
reorganising ministries along policy lines
(agriculture) to the complete overhaul of
government entities (companies' registrar). This
effort will continue in 2016, but may be hampered
by the uncertainty generated by the cross-cutting
reform of the public administration. The review of
local government highlighted the strong potential
for efficiency gains in managing local public
services. The reform plan adopted by the
authorities to address these concerns aims to
achieve economies of scale by clustering public
services; however, no fiscal impact study has been
conducted to assess potential efficiency gains.
Perceived corruption in the public
administration is a challenge (57
). A recent
survey highlights the perception among businesses
that patronage, bribery or abuses of power are
significant problems in the public administration.
87 % of companies agree that corruption hampers
business competition in Cyprus. According to the
World Economic Forum, corruption is seen as the
third most problematic factor for doing business in
Cyprus. In 2014, there was only one bidder in 31%
of public procurement procedures and no call for
tender in 22% (58
). Promising developments
include ongoing reforms to professionalise public
procurement at local level and a political party
funding law enacted in December 2015. The
Action Plan for Growth promotes measures
minimising the potential for corruption in the
public administration and improving corporate
governance. These include: assessing the current
anti-corruption institutional set-up, prioritising
policy areas in terms of incidence of corruption,
and developing an anti-corruption plan. The
reform and simplification of the public sector is
designed to reduce opportunities for and incentives
to engage in corruption. However, a constitutional
amendment necessary for asset disclosure has not
yet been adopted, and the Coordinating Body
against Corruption remains without full-time staff.
The supply of digital public services in Cyprus
ranks below the EU average. The percentage of
e-Government users (i.e. the percentage of Internet
users who have sent completed forms to public
(57) Cyprus is one of those countries where the perception of
corruption has increased most over the last two years. Source: Flash Eurobarometer 428. Businesses' attitude
toward corruption in the EU.
(58) http://ec.europa.eu/internal_market/scoreboard/perfo
rmance
_per_policy_area/public_procurement/index_en.htm

3.3. Public sector
67
authorities online) is below the EU average (28 %
vs an EU average of 33 %). The adoption of
medical data exchange is also below average and
weighs on the efficiency and diversity of services
offered by health systems. Digital public services
produce efficiency gains for businesses, the public,
and the public administration itself. Cyprus plans
to upgrade e-government services by introducing
electronic signatures, creating a single point of
contact for tele-services and developing a web
portal for small businesses.
Public expenditure
Graph 3.3.2: Expenditure and revenue ratio (general
government)
Source: Eurostat and Commission Services
The Cypriot authorities have made significant
progress under the economic adjustment
programme towards putting public expenditure
on a sustainable path. Expenditure policy took a
largely pro-cyclical stance during 2000-2003,
followed by stronger control policies in the pre-
euro area accession phase (2004-2007). The years
following the adoption of the euro, in 2008-2010,
were marked by a loose stance, showing an
increase in the expenditure ratio by about 4pps of
GDP against broadly constant nominal GDP. All in
all, the expenditure ratio increased by about 8pps
of GDP during 2000-2010. This trend was reversed
in 2010 and the expenditure ratio has been on a
declining path, despite broadly constant nominal
GDP in 2011 and declining nominal GDP during
2012-2014. This highlights the significant efforts
made under the economic adjustment programme
to bring expenditure back onto a sustainable path.
The structure of public expenditure shows
convergence towards the euro area average,
although significant differences remain with
respect to certain items. During 2000-2014, most
expenditure categories as a share of total
expenditure were in line with the euro area
average. Other categories where the differences
were more pronounced have since broadly
converged on the euro area average. Notably,
compensation of employees was significantly
higher than the euro area between 2000 and 2012,
but this difference was reduced by almost 10pps of
total expenditure during the programme. Social
transfers were lower than for the euro area in
2000-2014, but converged by 2012. The gap
widened again in 2013-2014, suggesting the
impact of streamlining social transfers during the
programme. Public investment was volatile and (at
times significantly) higher than in the euro area
over 2000-2012. However, the gap narrowed by
about 4pps of total expenditure over 2010-2014,
and spending on this category is now below that in
the euro area.
Graph 3.3.3: Total expenditure (general government)
Difference Cyprus - Euro area
Source: Eurostat
The compensation of employees in the public
sector has been a key explanatory factor behind
expenditure developments. The compensation of
employees, one of the biggest items in the public
expenditure bill, rose on average by 4% per year
over 2001-2014, significantly above the annual
EU27 growth rate (of 2.7%). Developments were
largely driven by the rise in public employment,
combined with public sector wage developments.
100
110
120
130
140
150
160
170
180
190
200
30
32
34
36
38
40
42
44
200
0
200
1
200
2
200
3
200
4
200
5
200
6
200
7
200
8
200
9
201
0
201
1
201
2
201
3
201
4
201
5
201
6
201
7
Total expenditure (net of financial sector recap)Total revenue ratio (net of extraordinary CBC dividends)Nominal GDP (2000 = 100)
No
min
al
GD
P (2
00
0 =
10
0)
% o
f G
DP
-10
-5
0
5
10
15
pp
s o
f to
tal
exp
end
itu
re
Social benefits other than social transfers in kind
Compensation of employees
Intermediate consumption
Gross fixed capital formation
Other current transfers
Subsidies
Capital transfers (net of financial sector recap)
Interest
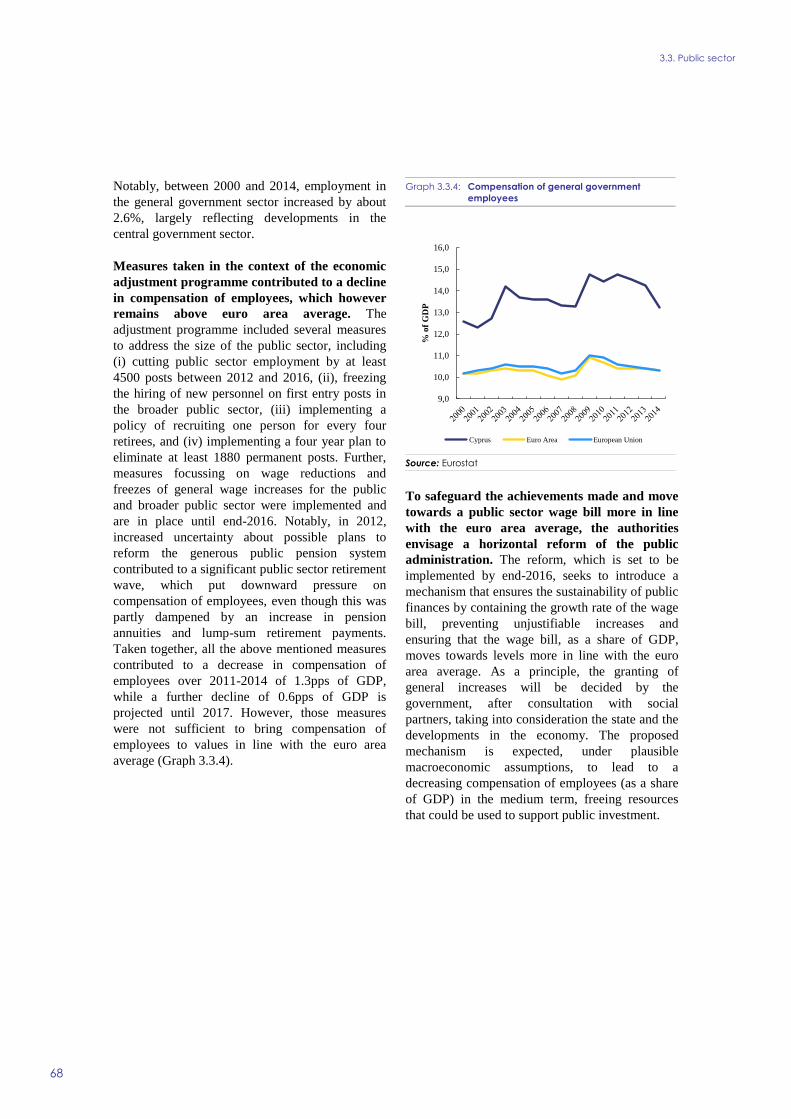
3.3. Public sector
68
Notably, between 2000 and 2014, employment in
the general government sector increased by about
2.6%, largely reflecting developments in the
central government sector.
Measures taken in the context of the economic
adjustment programme contributed to a decline
in compensation of employees, which however
remains above euro area average. The
adjustment programme included several measures
to address the size of the public sector, including
(i) cutting public sector employment by at least
4500 posts between 2012 and 2016, (ii), freezing
the hiring of new personnel on first entry posts in
the broader public sector, (iii) implementing a
policy of recruiting one person for every four
retirees, and (iv) implementing a four year plan to
eliminate at least 1880 permanent posts. Further,
measures focussing on wage reductions and
freezes of general wage increases for the public
and broader public sector were implemented and
are in place until end-2016. Notably, in 2012,
increased uncertainty about possible plans to
reform the generous public pension system
contributed to a significant public sector retirement
wave, which put downward pressure on
compensation of employees, even though this was
partly dampened by an increase in pension
annuities and lump-sum retirement payments.
Taken together, all the above mentioned measures
contributed to a decrease in compensation of
employees over 2011-2014 of 1.3pps of GDP,
while a further decline of 0.6pps of GDP is
projected until 2017. However, those measures
were not sufficient to bring compensation of
employees to values in line with the euro area
average (Graph 3.3.4).
Graph 3.3.4: Compensation of general government
employees
Source: Eurostat
To safeguard the achievements made and move
towards a public sector wage bill more in line
with the euro area average, the authorities
envisage a horizontal reform of the public
administration. The reform, which is set to be
implemented by end-2016, seeks to introduce a
mechanism that ensures the sustainability of public
finances by containing the growth rate of the wage
bill, preventing unjustifiable increases and
ensuring that the wage bill, as a share of GDP,
moves towards levels more in line with the euro
area average. As a principle, the granting of
general increases will be decided by the
government, after consultation with social
partners, taking into consideration the state and the
developments in the economy. The proposed
mechanism is expected, under plausible
macroeconomic assumptions, to lead to a
decreasing compensation of employees (as a share
of GDP) in the medium term, freeing resources
that could be used to support public investment.
9,0
10,0
11,0
12,0
13,0
14,0
15,0
16,0
% o
f G
DP
Cyprus Euro Area European Union
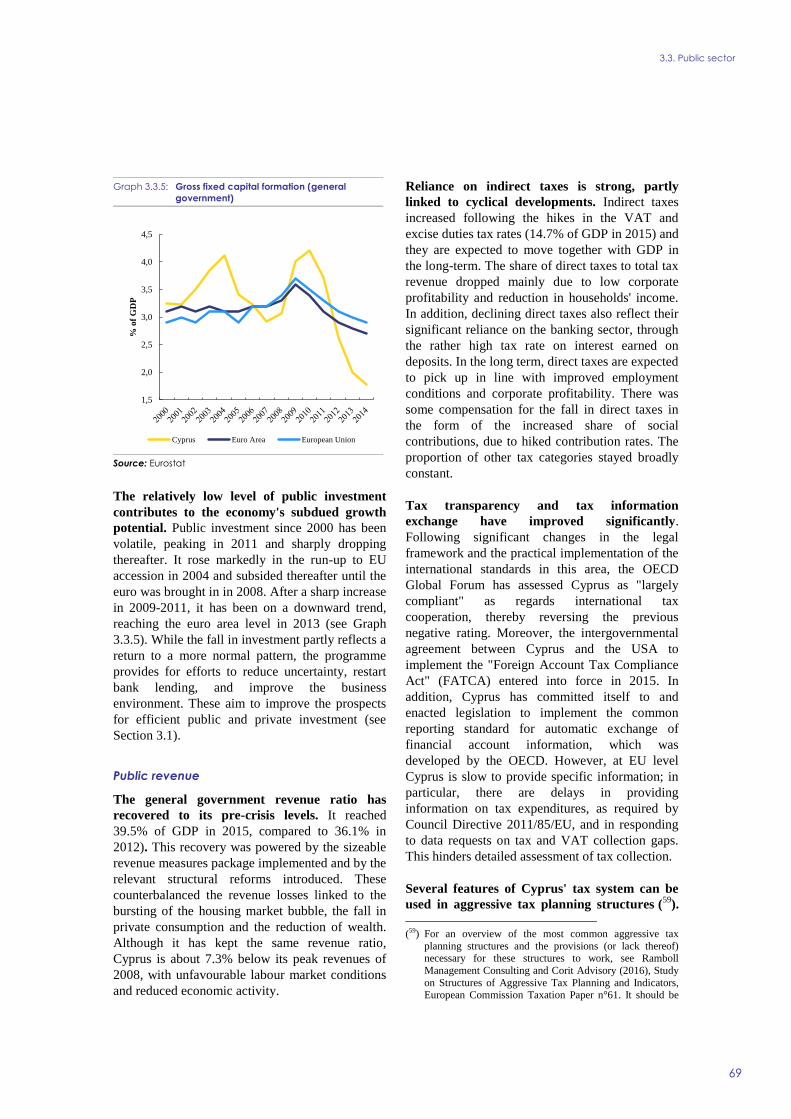
3.3. Public sector
69
Graph 3.3.5: Gross fixed capital formation (general
government)
Source: Eurostat
The relatively low level of public investment
contributes to the economy's subdued growth
potential. Public investment since 2000 has been
volatile, peaking in 2011 and sharply dropping
thereafter. It rose markedly in the run-up to EU
accession in 2004 and subsided thereafter until the
euro was brought in in 2008. After a sharp increase
in 2009-2011, it has been on a downward trend,
reaching the euro area level in 2013 (see Graph
3.3.5). While the fall in investment partly reflects a
return to a more normal pattern, the programme
provides for efforts to reduce uncertainty, restart
bank lending, and improve the business
environment. These aim to improve the prospects
for efficient public and private investment (see
Section 3.1).
Public revenue
The general government revenue ratio has
recovered to its pre-crisis levels. It reached
39.5% of GDP in 2015, compared to 36.1% in
2012). This recovery was powered by the sizeable
revenue measures package implemented and by the
relevant structural reforms introduced. These
counterbalanced the revenue losses linked to the
bursting of the housing market bubble, the fall in
private consumption and the reduction of wealth.
Although it has kept the same revenue ratio,
Cyprus is about 7.3% below its peak revenues of
2008, with unfavourable labour market conditions
and reduced economic activity.
Reliance on indirect taxes is strong, partly
linked to cyclical developments. Indirect taxes
increased following the hikes in the VAT and
excise duties tax rates (14.7% of GDP in 2015) and
they are expected to move together with GDP in
the long-term. The share of direct taxes to total tax
revenue dropped mainly due to low corporate
profitability and reduction in households' income.
In addition, declining direct taxes also reflect their
significant reliance on the banking sector, through
the rather high tax rate on interest earned on
deposits. In the long term, direct taxes are expected
to pick up in line with improved employment
conditions and corporate profitability. There was
some compensation for the fall in direct taxes in
the form of the increased share of social
contributions, due to hiked contribution rates. The
proportion of other tax categories stayed broadly
constant.
Tax transparency and tax information
exchange have improved significantly.
Following significant changes in the legal
framework and the practical implementation of the
international standards in this area, the OECD
Global Forum has assessed Cyprus as "largely
compliant" as regards international tax
cooperation, thereby reversing the previous
negative rating. Moreover, the intergovernmental
agreement between Cyprus and the USA to
implement the "Foreign Account Tax Compliance
Act" (FATCA) entered into force in 2015. In
addition, Cyprus has committed itself to and
enacted legislation to implement the common
reporting standard for automatic exchange of
financial account information, which was
developed by the OECD. However, at EU level
Cyprus is slow to provide specific information; in
particular, there are delays in providing
information on tax expenditures, as required by
Council Directive 2011/85/EU, and in responding
to data requests on tax and VAT collection gaps.
This hinders detailed assessment of tax collection.
Several features of Cyprus' tax system can be
used in aggressive tax planning structures (59
).
(59) For an overview of the most common aggressive tax
planning structures and the provisions (or lack thereof) necessary for these structures to work, see Ramboll
Management Consulting and Corit Advisory (2016), Study
on Structures of Aggressive Tax Planning and Indicators, European Commission Taxation Paper n°61. It should be
1,5
2,0
2,5
3,0
3,5
4,0
4,5
% o
f G
DP
Cyprus Euro Area European Union
3.3. Public sector
70
The absence of anti-abuse rules (60
) and the
absence of withholding taxes on dividend, interest
and royalty (61
) payments made by Cyprus-based
companies vis-à-vis third countries are particularly
relevant. Furthermore, tax rules like the one
concerning the tax residence of companies (62
) or
the patent Box regime (63
) could prompt or
facilitate aggressive tax planning.
Significant reforms of the tax administration
are in progress. These are designed to make
revenue collection more effective and efficient,
to improve taxpayer compliance, and to limit
tax fraud and evasion. The aim is to increase
tax revenue. A comprehensive compliance
strategy for risk identification and analysis has
been developed to address collectible and
unencumbered debt, with the pilot run on
garnishing of bank accounts having been started.
Still, the tax administration has, however, low use
of pre-filling and e-filling (64
) and is less cost
efficient at a EU comparison (1.2% compared to
1.0% of EU (65
)). In addition, important
organisational reforms, namely the integration of
the VAT service and the inland revenue
department into a single tax department, as well as
a single registration process for tax payers, are in
the process of being implemented. The preparation
of a tax procedure code and the creation of a Large
noted that country-specific information provided in the
study gives the state of play on May/June 2015. (60) For example, Controlled Foreign Companies (CFC) rules;
thin capitalisation or interest limitation rules, or rules to
counter mismatches in tax qualification of domestic companies or partnerships and those of a foreign state.
(61) A withholding tax on royalty payments is however levied
when IP rights are used locally (in Cyprus). (62) Based on this rule, companies which are incorporated in
Cyprus are not regarded as being resident there for tax
purposes if their management and control is exercised abroad.
(63) The Code of Conduct Group (Business Taxation) has
endorsed the new standard on patent Boxes which was adopted by the OECD in its 2015 report on BEPS Action 5
and has agreed that existing EU patent Box regimes are not
compatible with this standard. The Group has undertaken to monitor the rollback of existing patent Box regimes as
well as the compliance of new ones with the new standard.
(64) OECD (2015), Tax Administration 2015: Comparative Information on OECD and Other Advanced and Emerging
Economies, OECD Publishing, Paris, pp. 249-256.
http://www.keepeek.com/Digital-Asset-Management/oecd/taxation/tax-administration-
2015_tax_admin-2015-en#page253
(65) Cost per net collection (per 100 units of 2013 revenues), data source OECD (2015), cited in: Tax Reforms in EU
Member States, 2015 and Tax assessment framework
Taxpayer Office are important milestones of this
reform. Towards these milestones, both important
progress and some delays have been observed. The
significant advancement made supported Cyprus'
"doing business" 2016 competitiveness ranking.
The delays observed (in both the integration of
regional tax offices and in the adoption of the tax
procedure code) are holding up the revenue
prospective.
To combat undeclared work, Cyprus is
considering structural reforms, which could
further support revenues. The reforms,
complemented with European Commission- driven
technical assistance, include legislative
amendments and a revision of processes, to
improve Cyprus performance in the area of labour
and social inspections and to safeguard the labour
market. Given the strong exposure of some sectors
of the economy to undeclared work, confronting it
would support public finances, particularly through
indirect taxes and social contributions.
As a step towards more growth-friendly
taxation, Cyprus has put forward a reform of
its property tax regime, though there are
difficulties with its adoption. One of the least
growth-detrimental taxes is considered to be the
recurrent property taxation (66
). Despite some
progress on limiting exemptions and shifting away
from transaction fees, there is a serious delay in the
adoption of the comprehensive immovable
property tax reform (67
),which has been a
programme commitment designed to make the tax
burden fairer and the tax administration more
effective. Although updated property valuations
have been finalised, scepticism in the Parliament
has been delaying the adoption of the legislative
framework for the comprehensive reform.
State-owned utilities
Cyprus intends to privatise a series of State-
owned entities in order to improve
(66) Tax Reforms in EU Member States, 2015 and Tax
assessment framework , 2015 (67) The IPT reform includes: (i) further shift from transaction
to recurrent taxation, (ii) the streamlined tax
administration, and (iii) the broader tax base with limited exemptions and recently updated property values. Since
2011, property tax rates have been increased, allowing for
higher tax revenues, but properties are still being valued at 1980 prices, despite the 2013 general re-evaluation, and tax
administration has not been streamlined.

3.3. Public sector
71
competitiveness. As part of the economic
adjustment programme Cyprus committed to
implement a privatisation plan comprising entities
from various sectors such as transportation (port of
Limassol), energy (Electricity Authority of
Cyprus), telecommunications (Cyprus
Telecommunications Authority), real estate, games
(State Lottery). As of March 2016 only the
concession of the port of Limassol made material
progress, as the granting of the concession was
pending parliamentary approval. These
privatisations are designed to attract foreign
investors as well as strategic expertise, so as to
improve competitiveness.
The telecoms sector, dominated by state-owned
operator CyTA, has relatively high prices and a
significant level of concentration. CyTA is fully
state-owned and was recognised by the National
Regulatory Authority as having significant market
power in all telecoms markets. Its market share has
gradually decreased since the introduction of
competition in 2004 but remains dominant. At
around 65%, its market share in 2014 was
significantly higher than the market shares of main
mobile operators in other EU countries (Graph
3.3.6). Competition remains moderate as reflected
in the relatively high level of prices, notably with
regards to broadband and on the reduced number
of mobile licences, the third having been granted
only in 2014. The cost of international connectivity
for Cyprus’s isolated network is also considered a
driver of operators’ costs. High prices, together
with relatively low digital skills, result in lower
than average internet usage (see Graph 3.3.7).
26 % of the Cypriot population has never used the
internet (the EU average is 16.4 %). This is likely
to weigh on overall productivity growth.
The privatisation of CyTA aims to bring
efficiency gains to the telecoms sector. The
Cypriot Government intends to privatise CyTA in
2016 through a tender procedure, in order to attract
experienced strategic investors. Although it is
possible that only a minority share or part of the
group would be privatised, the aim is to strengthen
CyTA's governance by involving international
investors and trigger efficiency gains by
implementing international best practices.
Together with rising competition from smaller
players, which could weigh on prices, privatisation
may ultimately facilitate the use of information
and communication technologies in the economy
by improving the quality of service and
diversifying supply.
Graph 3.3.6: Main mobile operator market share (%)
Source: European Commission, Digital Agenda Scoreboard
Graph 3.3.7: % of individuals using Internet at least once a
week (2015)
Source: European Commission, Digital Agenda Scoreboard
0
10
20
30
40
50
60
70
80
CY
LU SI
PT
HR
HU
MT
RO LV
AT
LT
SK
EE FI
CZ
DK IE
BG
SE
EU
27
FR
ES IT PL
2010 2014
%
0
10
20
30
40
50
60
70
80
90
100
3.3. Public sector
72
Cyprus has decided to unbundle EAC, the
state-owned electricity company, to increase
transparency and facilitate competition. The
decision to unbundle the electricity network from
EAC's generation and supply activities potentially
opens the way for fundamental changes including
the entry of new players in the market and an
expansion in the share of renewable energy
sources. The ownership unbundling of EAC aims
to create the preconditions for open and equal
access to the electricity grid and is also intended to
streamline decision-making and the investment
process. Cyprus’s decision to unbundle the
electricity distribution and transmission networks
from the commercial activities of the incumbent is
a major step forward, allowing for a clear
separation of interests between the various
functions in the electricity sector. Its aims include
preventing cross-subsidies between commercial
and monopolistic activities, and discouraging
discriminatory behaviour towards competitors and
new entrants. A strong grid company, integrating
the operation of transmission and distribution,
would also have the critical size to ensure its
independence. Finally, unbundling tends to reduce
the regulator’s information asymmetry vis-à-vis
the electricity sector and also enhances the
system’s financial transparency. To reap the full
benefits of the reform, Cyprus will make a
complex set of regulatory, commercial and
strategic choices (Section 3.4). This represents
both an opportunity and a risk to the overall
process.
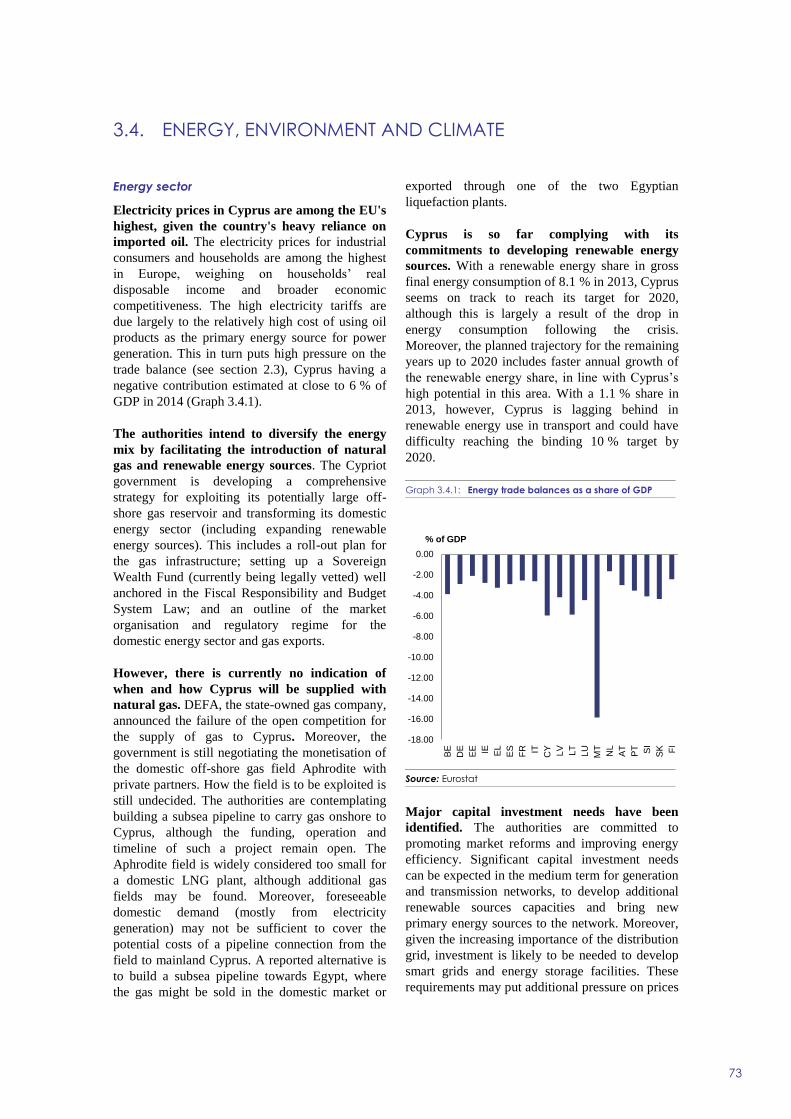
73
Energy sector
Electricity prices in Cyprus are among the EU's
highest, given the country's heavy reliance on
imported oil. The electricity prices for industrial
consumers and households are among the highest
in Europe, weighing on households’ real
disposable income and broader economic
competitiveness. The high electricity tariffs are
due largely to the relatively high cost of using oil
products as the primary energy source for power
generation. This in turn puts high pressure on the
trade balance (see section 2.3), Cyprus having a
negative contribution estimated at close to 6 % of
GDP in 2014 (Graph 3.4.1).
The authorities intend to diversify the energy
mix by facilitating the introduction of natural
gas and renewable energy sources. The Cypriot
government is developing a comprehensive
strategy for exploiting its potentially large off-
shore gas reservoir and transforming its domestic
energy sector (including expanding renewable
energy sources). This includes a roll-out plan for
the gas infrastructure; setting up a Sovereign
Wealth Fund (currently being legally vetted) well
anchored in the Fiscal Responsibility and Budget
System Law; and an outline of the market
organisation and regulatory regime for the
domestic energy sector and gas exports.
However, there is currently no indication of
when and how Cyprus will be supplied with
natural gas. DEFA, the state-owned gas company,
announced the failure of the open competition for
the supply of gas to Cyprus. Moreover, the
government is still negotiating the monetisation of
the domestic off-shore gas field Aphrodite with
private partners. How the field is to be exploited is
still undecided. The authorities are contemplating
building a subsea pipeline to carry gas onshore to
Cyprus, although the funding, operation and
timeline of such a project remain open. The
Aphrodite field is widely considered too small for
a domestic LNG plant, although additional gas
fields may be found. Moreover, foreseeable
domestic demand (mostly from electricity
generation) may not be sufficient to cover the
potential costs of a pipeline connection from the
field to mainland Cyprus. A reported alternative is
to build a subsea pipeline towards Egypt, where
the gas might be sold in the domestic market or
exported through one of the two Egyptian
liquefaction plants.
Cyprus is so far complying with its
commitments to developing renewable energy
sources. With a renewable energy share in gross
final energy consumption of 8.1 % in 2013, Cyprus
seems on track to reach its target for 2020,
although this is largely a result of the drop in
energy consumption following the crisis.
Moreover, the planned trajectory for the remaining
years up to 2020 includes faster annual growth of
the renewable energy share, in line with Cyprus’s
high potential in this area. With a 1.1 % share in
2013, however, Cyprus is lagging behind in
renewable energy use in transport and could have
difficulty reaching the binding 10 % target by
2020.
Graph 3.4.1: Energy trade balances as a share of GDP
Source: Eurostat
Major capital investment needs have been
identified. The authorities are committed to
promoting market reforms and improving energy
efficiency. Significant capital investment needs
can be expected in the medium term for generation
and transmission networks, to develop additional
renewable sources capacities and bring new
primary energy sources to the network. Moreover,
given the increasing importance of the distribution
grid, investment is likely to be needed to develop
smart grids and energy storage facilities. These
requirements may put additional pressure on prices
-18.00
-16.00
-14.00
-12.00
-10.00
-8.00
-6.00
-4.00
-2.00
0.00
BE
DE
EE IE EL
ES
FR IT
CY
LV
LT
LU
MT
NL
AT
PT SI
SK FI
% of GDP
3.4. ENERGY, ENVIRONMENT AND CLIMATE
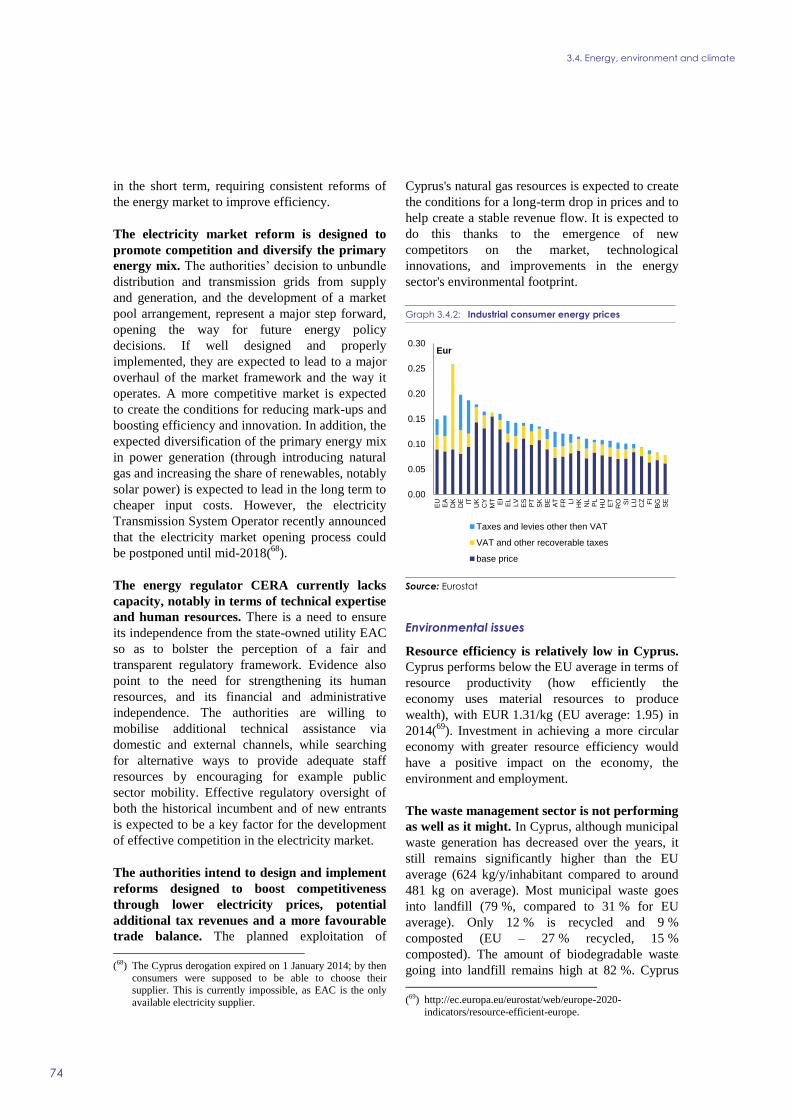
3.4. Energy, environment and climate
74
in the short term, requiring consistent reforms of
the energy market to improve efficiency.
The electricity market reform is designed to
promote competition and diversify the primary
energy mix. The authorities’ decision to unbundle
distribution and transmission grids from supply
and generation, and the development of a market
pool arrangement, represent a major step forward,
opening the way for future energy policy
decisions. If well designed and properly
implemented, they are expected to lead to a major
overhaul of the market framework and the way it
operates. A more competitive market is expected
to create the conditions for reducing mark-ups and
boosting efficiency and innovation. In addition, the
expected diversification of the primary energy mix
in power generation (through introducing natural
gas and increasing the share of renewables, notably
solar power) is expected to lead in the long term to
cheaper input costs. However, the electricity
Transmission System Operator recently announced
that the electricity market opening process could
be postponed until mid-2018(68
).
The energy regulator CERA currently lacks
capacity, notably in terms of technical expertise
and human resources. There is a need to ensure
its independence from the state-owned utility EAC
so as to bolster the perception of a fair and
transparent regulatory framework. Evidence also
point to the need for strengthening its human
resources, and its financial and administrative
independence. The authorities are willing to
mobilise additional technical assistance via
domestic and external channels, while searching
for alternative ways to provide adequate staff
resources by encouraging for example public
sector mobility. Effective regulatory oversight of
both the historical incumbent and of new entrants
is expected to be a key factor for the development
of effective competition in the electricity market.
The authorities intend to design and implement
reforms designed to boost competitiveness
through lower electricity prices, potential
additional tax revenues and a more favourable
trade balance. The planned exploitation of
(68) The Cyprus derogation expired on 1 January 2014; by then
consumers were supposed to be able to choose their supplier. This is currently impossible, as EAC is the only
available electricity supplier.
Cyprus's natural gas resources is expected to create
the conditions for a long-term drop in prices and to
help create a stable revenue flow. It is expected to
do this thanks to the emergence of new
competitors on the market, technological
innovations, and improvements in the energy
sector's environmental footprint.
Graph 3.4.2: Industrial consumer energy prices
Source: Eurostat
Environmental issues
Resource efficiency is relatively low in Cyprus.
Cyprus performs below the EU average in terms of
resource productivity (how efficiently the
economy uses material resources to produce
wealth), with EUR 1.31/kg (EU average: 1.95) in
2014(69
). Investment in achieving a more circular
economy with greater resource efficiency would
have a positive impact on the economy, the
environment and employment.
The waste management sector is not performing
as well as it might. In Cyprus, although municipal
waste generation has decreased over the years, it
still remains significantly higher than the EU
average (624 kg/y/inhabitant compared to around
481 kg on average). Most municipal waste goes
into landfill (79 %, compared to 31 % for EU
average). Only 12 % is recycled and 9 %
composted (EU – 27 % recycled, 15 %
composted). The amount of biodegradable waste
going into landfill remains high at 82 %. Cyprus
(69) http://ec.europa.eu/eurostat/web/europe-2020-
indicators/resource-efficient-europe.
0.00
0.05
0.10
0.15
0.20
0.25
0.30
EU
EA
DK
DE IT
UK
CY
MT EI
EL
LV
ES
PT
SK
BE
AT
FR LI
HK
NL
PL
HU
ET
RO SI
LU
CZ FI
BG
SE
Eur
Taxes and levies other then VAT
VAT and other recoverable taxes
base price
3.4. Energy, environment and climate
75
has taken steps to upgrade its waste management
system, via improving separate collection and
recycling rates. However, managing waste
efficiently and fulfilling the obligations from the
EU Directives on waste remains a challenge. The
Council of Ministers approved the updated
national Waste Management Plan (for municipal
waste) and the Waste Prevention Programme in
November 2015. It was the lack of these plans that
had led to Cyprus's suspension of EU funds for the
2014-2020 programming period.
Water is an extremely significant resource for
Cyprus and its scarcity remains a major
challenge for the island. Protecting water
resources by implementing EU water and marine
legislation entails investments to ensure the long-
term availability of high-quality water, an essential
resource for many economic activities (agriculture,
agro-food industry, energy production, tourism,
etc.). Water management implies technological
and organisational innovations which contribute to
overall job creation, economic growth and
competitiveness.
Cyprus shows relatively weak compliance with
EU environmental legislation regarding
infrastructure development, and in doing so,
may jeopardise its natural capital. Cyprus's very
rich natural environment and biodiversity is among
its strongest assets. Protecting and promoting its
natural capital contributes to developing revenues
in tourism, one of Cyprus’ main economic
activities. Cyprus is one of the countries with the
largest NATURA2000
network as a percentage of its total territory.
However, the environmental assessments that are
mandatory under EU and national law are often not
carried out appropriately in many infrastructure
projects in protected areas. This weakens legal
certainty, slows down projects and can lead to
environmental damage.
Climate policies
Cyprus is well on track to meet its greenhouse
gas emission target. It is required to reduce CO2
emissions in the sectors not covered by the EU
Emissions Trading System by 5% in 2020
compared to 2005, and is expected to achieve this
with a wide margin. A special ad hoc committee
within the Ministry of Agriculture, Rural
Development and Environment developed the
‘Low Carbon Development Strategy of Cyprus’. In
the draft roadmap, Cyprus stated that it would
meet its commitments on greenhouse gas
emissions by reducing dependence on fossil fuels.
This would be done by promoting renewable
energy sources, energy efficiency and climate-
friendly technologies. Cyprus also aims to increase
carbon sequestration from the atmosphere through
afforestation, re-vegetation and land use changes.
There is no policy to address the environmental
impact of the transport sector. This sector is
much more energy-intensive in Cyprus than in
most of the EU. Average emissions of newly
registered passenger cars are at levels above the
EU average. There are no specific, climate-related
programmes in place for the transport sector.
Consequently, no relevant policy developments
were observed in 2015.
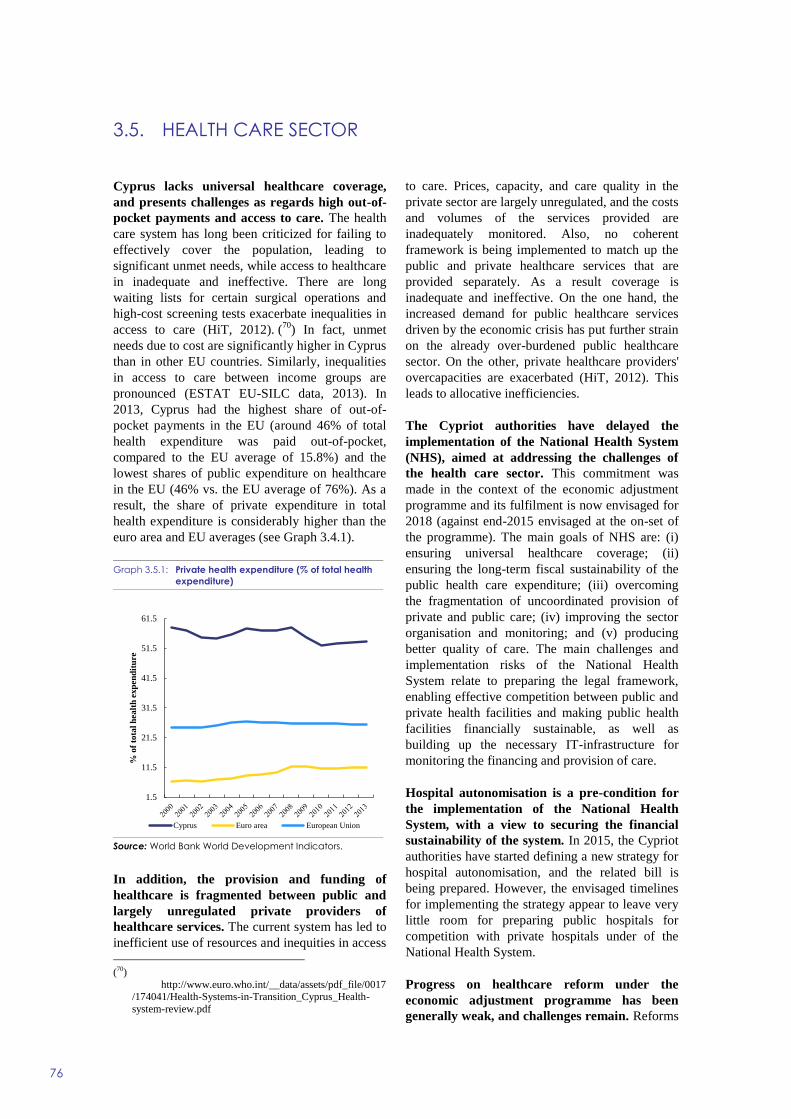
76
Cyprus lacks universal healthcare coverage,
and presents challenges as regards high out-of-
pocket payments and access to care. The health
care system has long been criticized for failing to
effectively cover the population, leading to
significant unmet needs, while access to healthcare
in inadequate and ineffective. There are long
waiting lists for certain surgical operations and
high-cost screening tests exacerbate inequalities in
access to care (HiT, 2012). (70
) In fact, unmet
needs due to cost are significantly higher in Cyprus
than in other EU countries. Similarly, inequalities
in access to care between income groups are
pronounced (ESTAT EU-SILC data, 2013). In
2013, Cyprus had the highest share of out-of-
pocket payments in the EU (around 46% of total
health expenditure was paid out-of-pocket,
compared to the EU average of 15.8%) and the
lowest shares of public expenditure on healthcare
in the EU (46% vs. the EU average of 76%). As a
result, the share of private expenditure in total
health expenditure is considerably higher than the
euro area and EU averages (see Graph 3.4.1).
Graph 3.5.1: Private health expenditure (% of total health
expenditure)
Source: World Bank World Development Indicators.
In addition, the provision and funding of
healthcare is fragmented between public and
largely unregulated private providers of
healthcare services. The current system has led to
inefficient use of resources and inequities in access
(70)
http://www.euro.who.int/__data/assets/pdf_file/0017/174041/Health-Systems-in-Transition_Cyprus_Health-
system-review.pdf
to care. Prices, capacity, and care quality in the
private sector are largely unregulated, and the costs
and volumes of the services provided are
inadequately monitored. Also, no coherent
framework is being implemented to match up the
public and private healthcare services that are
provided separately. As a result coverage is
inadequate and ineffective. On the one hand, the
increased demand for public healthcare services
driven by the economic crisis has put further strain
on the already over-burdened public healthcare
sector. On the other, private healthcare providers'
overcapacities are exacerbated (HiT, 2012). This
leads to allocative inefficiencies.
The Cypriot authorities have delayed the
implementation of the National Health System
(NHS), aimed at addressing the challenges of
the health care sector. This commitment was
made in the context of the economic adjustment
programme and its fulfilment is now envisaged for
2018 (against end-2015 envisaged at the on-set of
the programme). The main goals of NHS are: (i)
ensuring universal healthcare coverage; (ii)
ensuring the long-term fiscal sustainability of the
public health care expenditure; (iii) overcoming
the fragmentation of uncoordinated provision of
private and public care; (iv) improving the sector
organisation and monitoring; and (v) producing
better quality of care. The main challenges and
implementation risks of the National Health
System relate to preparing the legal framework,
enabling effective competition between public and
private health facilities and making public health
facilities financially sustainable, as well as
building up the necessary IT-infrastructure for
monitoring the financing and provision of care.
Hospital autonomisation is a pre-condition for
the implementation of the National Health
System, with a view to securing the financial
sustainability of the system. In 2015, the Cypriot
authorities have started defining a new strategy for
hospital autonomisation, and the related bill is
being prepared. However, the envisaged timelines
for implementing the strategy appear to leave very
little room for preparing public hospitals for
competition with private hospitals under of the
National Health System.
Progress on healthcare reform under the
economic adjustment programme has been
generally weak, and challenges remain. Reforms
1.5
11.5
21.5
31.5
41.5
51.5
61.5
% o
f to
tal
hea
lth
exp
end
itu
re
Cyprus Euro area European Union
3.5. HEALTH CARE SECTOR

3.5. Health care sector
77
in recent years focused on securing short-term
viability, while failing to address the inherent
challenges that the Cypriot healthcare system
faces. The measures taken include stronger means-
tested financing of public healthcare and
introducing financial disincentives for unnecessary
use of medical care. Progress towards
implementing the National Health System has been
weak, due to the fact that several reforms
identified as important stepping stones (such as
e.g. hospital autonomisation, primary healthcare
reform and the finalisation of the tender for the
necessary IT-infrastructure) have been constantly
postponed. If there are any further delays, it is
questionable whether the National Health System
will be a reality by 2018, as planned.
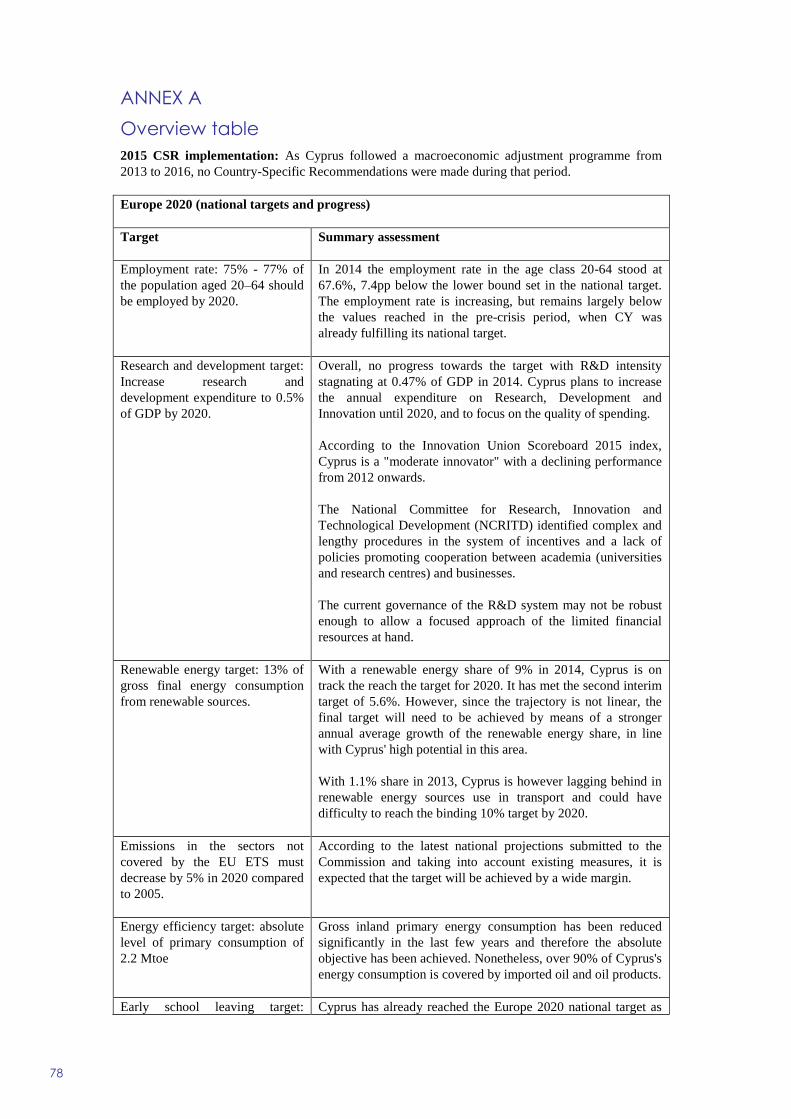
78
Europe 2020 (national targets and progress)
Target Summary assessment
Employment rate: 75% - 77% of
the population aged 20–64 should
be employed by 2020.
In 2014 the employment rate in the age class 20-64 stood at
67.6%, 7.4pp below the lower bound set in the national target.
The employment rate is increasing, but remains largely below
the values reached in the pre-crisis period, when CY was
already fulfilling its national target.
Research and development target:
Increase research and
development expenditure to 0.5%
of GDP by 2020.
Overall, no progress towards the target with R&D intensity
stagnating at 0.47% of GDP in 2014. Cyprus plans to increase
the annual expenditure on Research, Development and
Innovation until 2020, and to focus on the quality of spending.
According to the Innovation Union Scoreboard 2015 index,
Cyprus is a "moderate innovator" with a declining performance
from 2012 onwards.
The National Committee for Research, Innovation and
Technological Development (NCRITD) identified complex and
lengthy procedures in the system of incentives and a lack of
policies promoting cooperation between academia (universities
and research centres) and businesses.
The current governance of the R&D system may not be robust
enough to allow a focused approach of the limited financial
resources at hand.
Renewable energy target: 13% of
gross final energy consumption
from renewable sources.
With a renewable energy share of 9% in 2014, Cyprus is on
track the reach the target for 2020. It has met the second interim
target of 5.6%. However, since the trajectory is not linear, the
final target will need to be achieved by means of a stronger
annual average growth of the renewable energy share, in line
with Cyprus' high potential in this area.
With 1.1% share in 2013, Cyprus is however lagging behind in
renewable energy sources use in transport and could have
difficulty to reach the binding 10% target by 2020.
Emissions in the sectors not
covered by the EU ETS must
decrease by 5% in 2020 compared
to 2005.
According to the latest national projections submitted to the
Commission and taking into account existing measures, it is
expected that the target will be achieved by a wide margin.
Energy efficiency target: absolute
level of primary consumption of
2.2 Mtoe
Gross inland primary energy consumption has been reduced
significantly in the last few years and therefore the absolute
objective has been achieved. Nonetheless, over 90% of Cyprus's
energy consumption is covered by imported oil and oil products.
Early school leaving target: Cyprus has already reached the Europe 2020 national target as
ANNEX A
Overview table
2015 CSR implementation: As Cyprus followed a macroeconomic adjustment programme from
2013 to 2016, no Country-Specific Recommendations were made during that period.
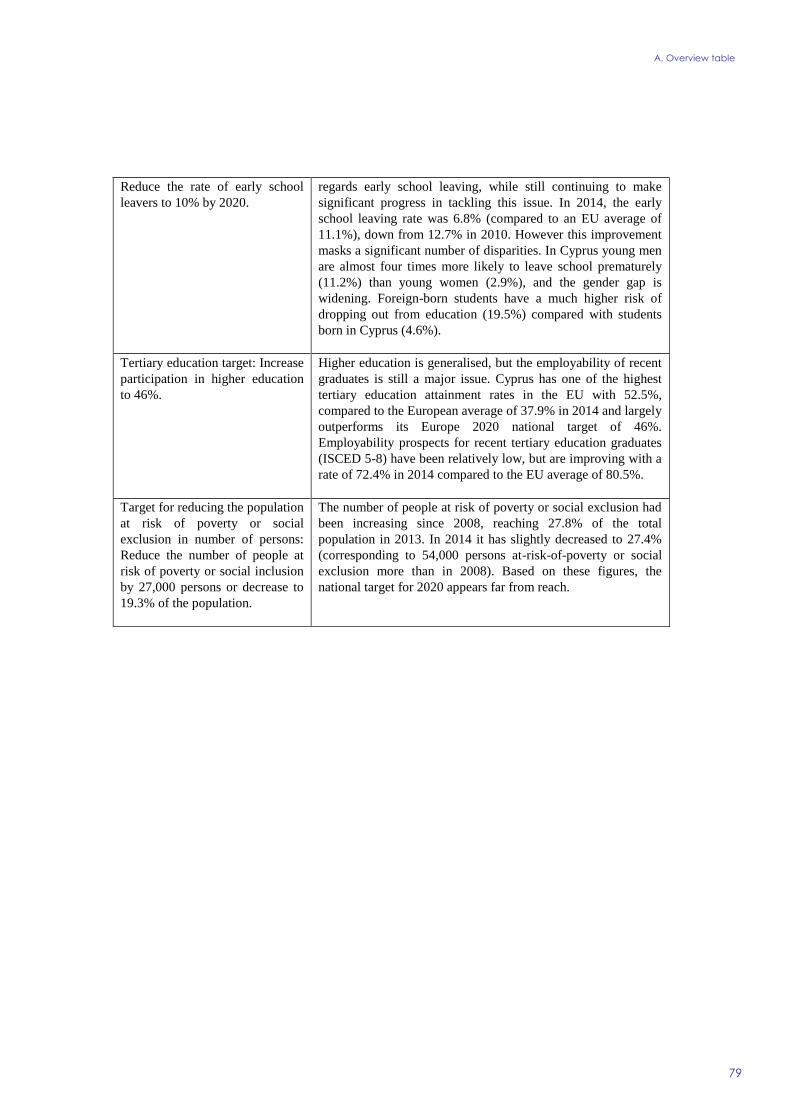
A. Overview table
79
Reduce the rate of early school
leavers to 10% by 2020.
regards early school leaving, while still continuing to make
significant progress in tackling this issue. In 2014, the early
school leaving rate was 6.8% (compared to an EU average of
11.1%), down from 12.7% in 2010. However this improvement
masks a significant number of disparities. In Cyprus young men
are almost four times more likely to leave school prematurely
(11.2%) than young women (2.9%), and the gender gap is
widening. Foreign-born students have a much higher risk of
dropping out from education (19.5%) compared with students
born in Cyprus (4.6%).
Tertiary education target: Increase
participation in higher education
to 46%.
Higher education is generalised, but the employability of recent
graduates is still a major issue. Cyprus has one of the highest
tertiary education attainment rates in the EU with 52.5%,
compared to the European average of 37.9% in 2014 and largely
outperforms its Europe 2020 national target of 46%.
Employability prospects for recent tertiary education graduates
(ISCED 5-8) have been relatively low, but are improving with a
rate of 72.4% in 2014 compared to the EU average of 80.5%.
Target for reducing the population
at risk of poverty or social
exclusion in number of persons:
Reduce the number of people at
risk of poverty or social inclusion
by 27,000 persons or decrease to
19.3% of the population.
The number of people at risk of poverty or social exclusion had
been increasing since 2008, reaching 27.8% of the total
population in 2013. In 2014 it has slightly decreased to 27.4%
(corresponding to 54,000 persons at-risk-of-poverty or social
exclusion more than in 2008). Based on these figures, the
national target for 2020 appears far from reach.
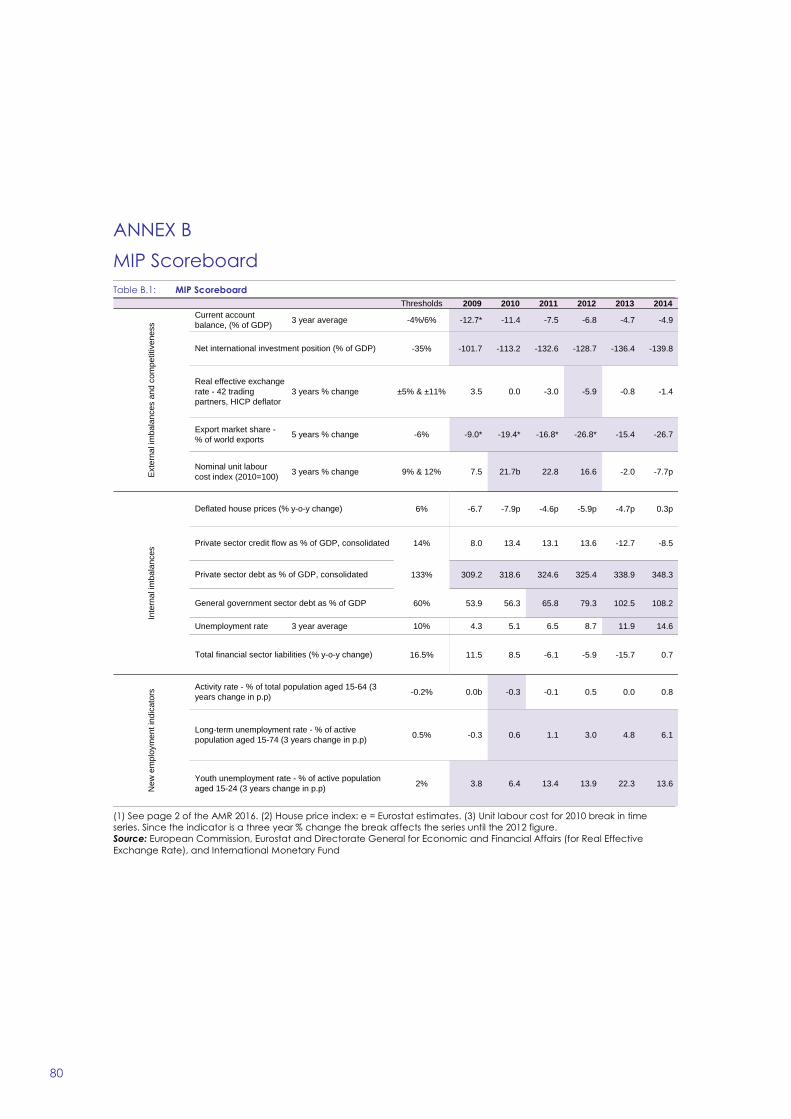
80
ANNEX B
MIP Scoreboard
Table B.1: MIP Scoreboard
(1) See page 2 of the AMR 2016. (2) House price index: e = Eurostat estimates. (3) Unit labour cost for 2010 break in time
series. Since the indicator is a three year % change the break affects the series until the 2012 figure.
Source: European Commission, Eurostat and Directorate General for Economic and Financial Affairs (for Real Effective
Exchange Rate), and International Monetary Fund
Thresholds 2009 2010 2011 2012 2013 2014
Current account
balance, (% of GDP) 3 year average -4%/6%-7.8* -12.7* -11.4 -7.5 -6.8 -4.7 -4.9
-35% -44.1* -101.7 -113.2 -132.6 -128.7 -136.4 -139.8
Real effective exchange
rate - 42 trading
partners, HICP deflator
3 years % change ±5% & ±11% 3.5 0.0 -3.0 -5.9 -0.8 -1.4
Export market share -
% of world exports5 years % change -6% 41.0* -9.0* -19.4* -16.8* -26.8* -15.4 -26.7
Nominal unit labour
cost index (2010=100)3 years % change 9% & 12% 7.5 21.7b 22.8 16.6 -2.0 -7.7p
6% 27.9e -6.7 -7.9p -4.6p -5.9p -4.7p 0.3p
14% 8.0 13.4 13.1 13.6 -12.7 -8.5
133% 309.2 318.6 324.6 325.4 338.9 348.3
60% 53.9 56.3 65.8 79.3 102.5 108.2
Unemployment rate 3 year average 10% 4.3 5.1 6.5 8.7 11.9 14.6
16.5% 11.5 8.5 -6.1 -5.9 -15.7 0.7
-0.2% 0.0b -0.3 -0.1 0.5 0.0 0.8
0.5% -0.3 0.6 1.1 3.0 4.8 6.1
2% 3.8 6.4 13.4 13.9 22.3 13.6
Inte
rna
l im
ba
lan
ce
sE
xte
rna
l im
ba
lan
ce
s a
nd
co
mp
etitive
ne
ss
Ne
w e
mp
loym
en
t in
dic
ato
rs
Net international investment position (% of GDP)
Deflated house prices (% y-o-y change)
Total financial sector liabilities (% y-o-y change)
Private sector credit flow as % of GDP, consolidated
Private sector debt as % of GDP, consolidated
General government sector debt as % of GDP
Activity rate - % of total population aged 15-64 (3
years change in p.p)
Long-term unemployment rate - % of active
population aged 15-74 (3 years change in p.p)
Youth unemployment rate - % of active population
aged 15-24 (3 years change in p.p)
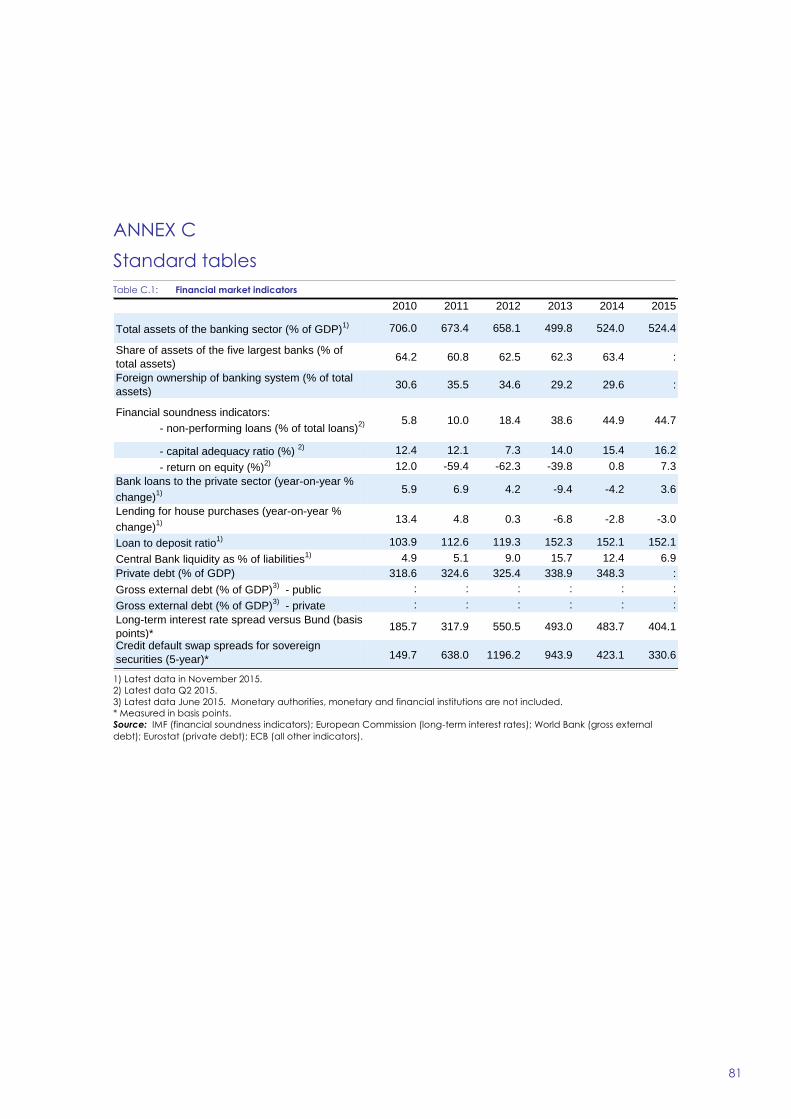
81
ANNEX C
Standard tables
Table C.1: Financial market indicators
1) Latest data in November 2015.
2) Latest data Q2 2015.
3) Latest data June 2015. Monetary authorities, monetary and financial institutions are not included.
* Measured in basis points.
Source: IMF (financial soundness indicators); European Commission (long-term interest rates); World Bank (gross external
debt); Eurostat (private debt); ECB (all other indicators).
2010 2011 2012 2013 2014 2015
Total assets of the banking sector (% of GDP)1) 706.0 673.4 658.1 499.8 524.0 524.4
Share of assets of the five largest banks (% of
total assets)64.2 60.8 62.5 62.3 63.4 :
Foreign ownership of banking system (% of total
assets)30.6 35.5 34.6 29.2 29.6 :
Financial soundness indicators:
- non-performing loans (% of total loans)2) 5.8 10.0 18.4 38.6 44.9 44.7
- capital adequacy ratio (%) 2) 12.4 12.1 7.3 14.0 15.4 16.2
- return on equity (%)2) 12.0 -59.4 -62.3 -39.8 0.8 7.3
Bank loans to the private sector (year-on-year %
change)1) 5.9 6.9 4.2 -9.4 -4.2 3.6
Lending for house purchases (year-on-year %
change)1) 13.4 4.8 0.3 -6.8 -2.8 -3.0
Loan to deposit ratio1) 103.9 112.6 119.3 152.3 152.1 152.1
Central Bank liquidity as % of liabilities1) 4.9 5.1 9.0 15.7 12.4 6.9
Private debt (% of GDP) 318.6 324.6 325.4 338.9 348.3 :
Gross external debt (% of GDP)3)
- public : : : : : :
Gross external debt (% of GDP)3)
- private : : : : : :
Long-term interest rate spread versus Bund (basis
points)*185.7 317.9 550.5 493.0 483.7 404.1
Credit default swap spreads for sovereign
securities (5-year)* 149.7 638.0 1196.2 943.9 423.1 330.6

C. Standard tables
82
Table C.2: Labour market and social indicators
1) Unemployed persons are all those who were not employed but had actively sought work and were ready to begin
working immediately or within two weeks.
2) Long-term unemployed are peoples who have been unemployed for at least 12 months.
3) Not in Education Employment or Training.
4) Average of first three quarters of 2015. Data for total unemployment and youth unemployment rates are seasonally
adjusted.
Source: European Commission (EU Labour Force Survey).
2010 2011 2012 2013 2014 2015 4
Employment rate
(% of population aged 20-64)75 73.4 70.2 67.2 67.6 67.8
Employment growth
(% change from previous year)1 0.5 -3.2 -6 -1.1 0.7
Employment rate of women
(% of female population aged 20-64)68.8 67.7 64.8 62.2 63.9 63.9
Employment rate of men
(% of male population aged 20-64)81.7 79.6 76.1 72.6 71.6 72.1
Employment rate of older workers
(% of population aged 55-64)56.3 54.8 50.7 49.6 46.9 47.8
Part-time employment (% of total employment,
aged 15 years and over)9.5 10.2 10.7 12.7 14.1 13.6
Fixed term employment (% of employees with a fixed
term contract, aged 15 years and over)14 14.1 15 17.4 18.9 18.4
Transitions from temporary to permanent employment 22.1 22.7 24.3 19.1 17.9 -
Unemployment rate1 (% active population,
age group 15-74)6.3 7.9 11.9 15.9 16.1 15.6
Long-term unemployment rate2 (% of labour force) 1.3 1.6 3.6 6.1 7.7 7.0
Youth unemployment rate
(% active population aged 15-24)16.6 22.4 27.7 38.9 36 33.3
Youth NEET3 rate (% of population aged 15-24) 11.7 14.6 16 18.7 17 -
Early leavers from education and training (% of pop.
aged 18-24 with at most lower sec. educ. and not in
further education or training)
12.7 11.3 11.4 9.1 6.8 -
Tertiary educational attainment (% of population aged
30-34 having successfully completed tertiary
education)
45.3 46.2 49.9 47.8 52.5 -
Formal childcare (30 hours or over; % of population
aged less than 3 years)16 17 19 22 - -
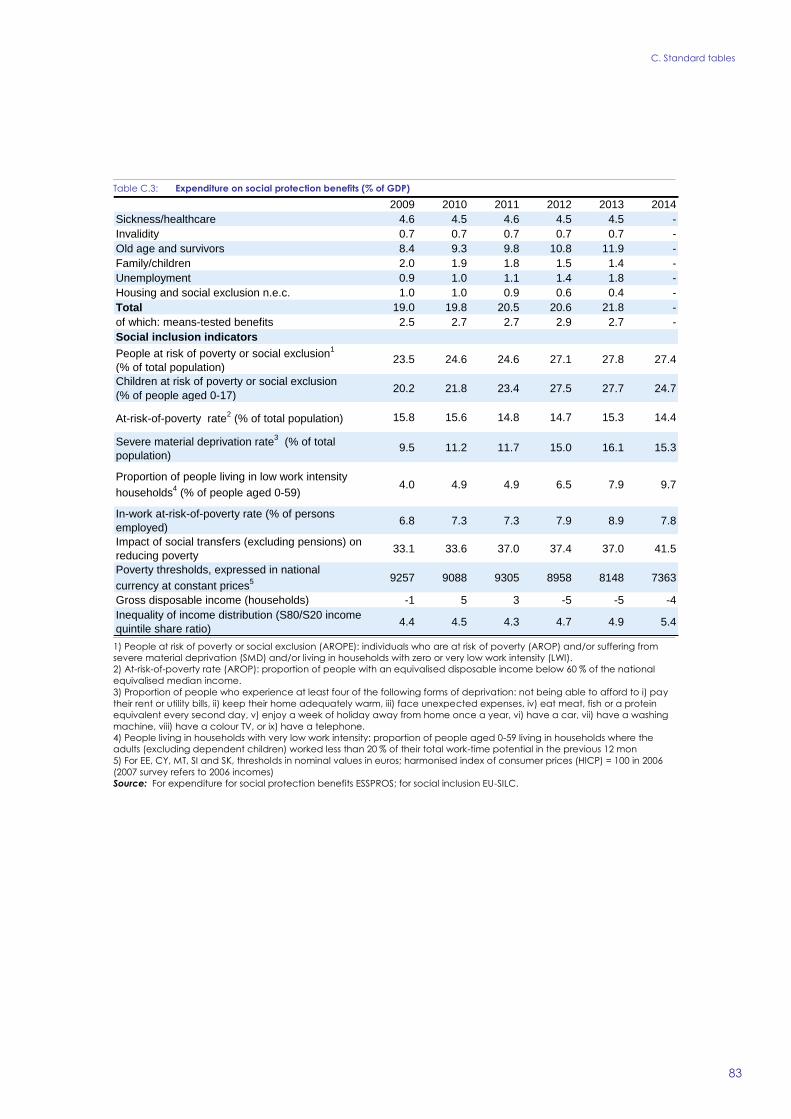
C. Standard tables
83
Table C.3: Expenditure on social protection benefits (% of GDP)
1) People at risk of poverty or social exclusion (AROPE): individuals who are at risk of poverty (AROP) and/or suffering from
severe material deprivation (SMD) and/or living in households with zero or very low work intensity (LWI).
2) At-risk-of-poverty rate (AROP): proportion of people with an equivalised disposable income below 60 % of the national
equivalised median income.
3) Proportion of people who experience at least four of the following forms of deprivation: not being able to afford to i) pay
their rent or utility bills, ii) keep their home adequately warm, iii) face unexpected expenses, iv) eat meat, fish or a protein
equivalent every second day, v) enjoy a week of holiday away from home once a year, vi) have a car, vii) have a washing
machine, viii) have a colour TV, or ix) have a telephone.
4) People living in households with very low work intensity: proportion of people aged 0-59 living in households where the
adults (excluding dependent children) worked less than 20 % of their total work-time potential in the previous 12 mon
5) For EE, CY, MT, SI and SK, thresholds in nominal values in euros; harmonised index of consumer prices (HICP) = 100 in 2006
(2007 survey refers to 2006 incomes)
Source: For expenditure for social protection benefits ESSPROS; for social inclusion EU-SILC.
2009 2010 2011 2012 2013 2014
Sickness/healthcare 4.6 4.5 4.6 4.5 4.5 -
Invalidity 0.7 0.7 0.7 0.7 0.7 -
Old age and survivors 8.4 9.3 9.8 10.8 11.9 -
Family/children 2.0 1.9 1.8 1.5 1.4 -
Unemployment 0.9 1.0 1.1 1.4 1.8 -
Housing and social exclusion n.e.c. 1.0 1.0 0.9 0.6 0.4 -
Total 19.0 19.8 20.5 20.6 21.8 -
of which: means-tested benefits 2.5 2.7 2.7 2.9 2.7 -
Social inclusion indicators
People at risk of poverty or social exclusion1
(% of total population)23.5 24.6 24.6 27.1 27.8 27.4
Children at risk of poverty or social exclusion
(% of people aged 0-17)20.2 21.8 23.4 27.5 27.7 24.7
At-risk-of-poverty rate2 (% of total population) 15.8 15.6 14.8 14.7 15.3 14.4
Severe material deprivation rate3 (% of total
population)9.5 11.2 11.7 15.0 16.1 15.3
Proportion of people living in low work intensity
households4 (% of people aged 0-59)
4.0 4.9 4.9 6.5 7.9 9.7
In-work at-risk-of-poverty rate (% of persons
employed)6.8 7.3 7.3 7.9 8.9 7.8
Impact of social transfers (excluding pensions) on
reducing poverty33.1 33.6 37.0 37.4 37.0 41.5
Poverty thresholds, expressed in national
currency at constant prices5 9257 9088 9305 8958 8148 7363
Gross disposable income (households) -1 5 3 -5 -5 -4
Inequality of income distribution (S80/S20 income
quintile share ratio)4.4 4.5 4.3 4.7 4.9 5.4
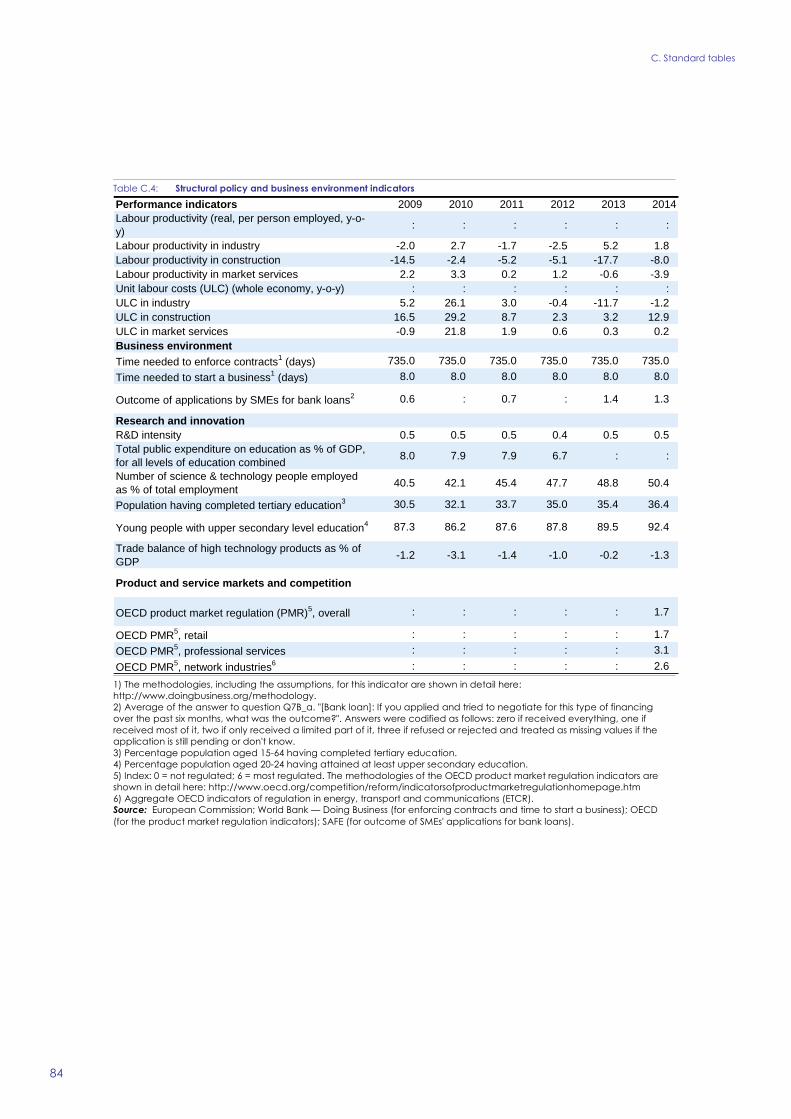
C. Standard tables
84
Table C.4: Structural policy and business environment indicators
1) The methodologies, including the assumptions, for this indicator are shown in detail here:
http://www.doingbusiness.org/methodology.
2) Average of the answer to question Q7B_a. "[Bank loan]: If you applied and tried to negotiate for this type of financing
over the past six months, what was the outcome?". Answers were codified as follows: zero if received everything, one if
received most of it, two if only received a limited part of it, three if refused or rejected and treated as missing values if the
application is still pending or don't know.
3) Percentage population aged 15-64 having completed tertiary education.
4) Percentage population aged 20-24 having attained at least upper secondary education.
5) Index: 0 = not regulated; 6 = most regulated. The methodologies of the OECD product market regulation indicators are
shown in detail here: http://www.oecd.org/competition/reform/indicatorsofproductmarketregulationhomepage.htm
6) Aggregate OECD indicators of regulation in energy, transport and communications (ETCR).
Source: European Commission; World Bank — Doing Business (for enforcing contracts and time to start a business); OECD
(for the product market regulation indicators); SAFE (for outcome of SMEs' applications for bank loans).
Performance indicators 2009 2010 2011 2012 2013 2014
Labour productivity (real, per person employed, y-o-
y): : : : : :
Labour productivity in industry -2.0 2.7 -1.7 -2.5 5.2 1.8
Labour productivity in construction -14.5 -2.4 -5.2 -5.1 -17.7 -8.0
Labour productivity in market services 2.2 3.3 0.2 1.2 -0.6 -3.9
Unit labour costs (ULC) (whole economy, y-o-y) : : : : : :
ULC in industry 5.2 26.1 3.0 -0.4 -11.7 -1.2
ULC in construction 16.5 29.2 8.7 2.3 3.2 12.9
ULC in market services -0.9 21.8 1.9 0.6 0.3 0.2
Business environment
Time needed to enforce contracts1 (days) 735.0 735.0 735.0 735.0 735.0 735.0
Time needed to start a business1 (days) 8.0 8.0 8.0 8.0 8.0 8.0
Outcome of applications by SMEs for bank loans2 0.6 : 0.7 : 1.4 1.3
Research and innovation
R&D intensity 0.5 0.5 0.5 0.4 0.5 0.5
Total public expenditure on education as % of GDP,
for all levels of education combined8.0 7.9 7.9 6.7 : :
Number of science & technology people employed
as % of total employment40.5 42.1 45.4 47.7 48.8 50.4
Population having completed tertiary education3 30.5 32.1 33.7 35.0 35.4 36.4
Young people with upper secondary level education4 87.3 86.2 87.6 87.8 89.5 92.4
Trade balance of high technology products as % of
GDP-1.2 -3.1 -1.4 -1.0 -0.2 -1.3
Product and service markets and competition
OECD product market regulation (PMR)5, overall : : : : : 1.7
OECD PMR5, retail : : : : : 1.7
OECD PMR5, professional services : : : : : 3.1
OECD PMR5, network industries
6 : : : : : 2.6

C. Standard tables
85
Table C.5: Green growth performance
General explanation of the table items:
All macro intensity indicators are expressed as a ratio of a physical quantity to GDP (in 2005 prices)
Energy intensity: gross inland energy consumption (in kgoe) divided by GDP (in EUR)
Carbon intensity: greenhouse gas emissions (in kg CO2 equivalents) divided by GDP (in EUR)
Resource intensity: domestic material consumption (in kg) divided by GDP (in EUR)
Waste intensity: waste (in kg) divided by GDP (in EUR)
Energy balance of trade: the balance of energy exports and imports, expressed as % of GDP
Weighting of energy in HICP: the proportion of "energy" items in the consumption basket used for the construction of the
HICP. Difference between energy price change and inflation: energy component of HICP, and total HICP inflation (annual
% change)
Real unit energy cost: real energy costs as a percentage of total value added for the economy
Environmental taxes over labour taxes and GDP: from European Commission's database, ‘Taxation trends in the European
Union’
Industry energy intensity: final energy consumption of industry (in kgoe) divided by gross value added of industry (in 2005
EUR)
Real unit energy costs for manufacturing industry: real costs as a percentage of value added for manufacturing sectors
Share of energy-intensive industries in the economy: share of gross value added of the energy-intensive industries in GDP
Electricity and gas prices for medium-sized industrial users: consumption band 500–20 00MWh and 10 000–100 000 GJ; figures
excl. VAT.
Municipal waste recycling rate: ratio of recycled municipal waste to total municipal waste
Public R&D for energy or for the environment: government spending on R&D (GBAORD) for these categories as % of GDP
Proportion of greenhouse gas (GHG) emissions covered by EU Emission Trading System (ETS): based on greenhouse gas
emissions
(excl land use, land use change and forestry) as reported by Member States to the European Environment Agency)
Transport energy intensity: final energy consumption of transport activity (kgoe) divided by transport industry gross value
added (in 2005 EUR)
Transport carbon intensity: greenhouse gas emissions in transport activity divided by gross value added of the transport
sector
Energy import dependency: net energy imports divided by gross inland energy consumption incl. consumption of
international bunker fuels
Aggregated supplier concentration index: covers oil, gas and coal. Smaller values indicate larger diversification and hence
lower risk.
Diversification of the energy mix: Herfindahl index over natural gas, total petrol products, nuclear heat, renewable energies
and solid fuels. * European Commission and European Environment Agency
Source: European Commission (Eurostat) unless indicated otherwise
2009 2010 2011 2012 2013 2014
Macroeconomic
Energy intensity kgoe / € 0.19 0.18 0.17 0.17 0.15 :
Carbon intensity kg / € 0.61 0.59 0.57 0.55 0.54 :
Resource intensity (reciprocal
of resource productivity)kg / € 1.49 1.37 1.34 1.01 0.85 0.87
Waste intensity kg / € : 0.14 : 0.13 : :
Energy balance of trade % GDP -4.6 -6.0 -6.8 -7.6 -6.4 -5.9
Weighting of energy in HICP % 12.03 10.57 8.73 9.41 9.53 9.33
Difference between energy
price change and inflation % -16.5 18.9 14.0 17.9 -7.0 -8.8
Real unit of energy cost
% of
value
added
7.3 7.3 7.3 : : :
Ratio of environmental taxes to
labour taxesratio 4.0 4.1 4.1 4.4 3.9 3.8
Ratio of environmental taxes to
GDPratio 2.8 2.8 2.8 2.6 2.7 3.1
Sectoral
Industry energy intensity kgoe / € 0.19 0.17 0.16 0.14 0.17 :
Real unit energy cost for
manufacturing industry
% of
value
added
17.0 17.0 17.0 : : :
Share of energy-intensive
industries in the economy% GDP 4.85 5.06 4.76 4.46 4.24 :
Electricity prices for medium-
sized industrial users€ / kWh 0.13 0.16 0.19 0.23 0.20 0.18
Gas prices for medium-sized
industrial users€ / kWh : : : : : :
Public R&D for energy % GDP 0.00 0.00 0.00 0.00 0.00 0.00
Public R&D for environmental
protection% GDP 0.01 0.00 0.00 0.00 0.00 0.00
Municipal waste recycling rate % 8.3 15.1 20.7 22.1 21.4 :
Share of GHG emissions
covered by ETS*% 52.1 50.6 47.5 47.3 48.3 52.7
Transport energy intensity kgoe / € 1.00 0.96 1.04 1.03 0.92 :
Transport carbon intensity kg / € 2.21 2.14 2.23 2.21 1.96 :
Security of energy supply
Energy import dependency % 96.3 100.8 92.4 97.0 96.4 :
Aggregated supplier
concentration indexHHI 1.1 0.2 0.0 0.0 : :
Diversification of energy mix HHI 0.92 0.91 0.91 0.90 0.88 :