Embed Size (px)
Citation preview
Gideon SmithCIO, AXA-IM Rosenberg Equities
Financial Standard Best Practice Forum – ESG
Sustainable InvestingIntegrating sustainability in your core equity portfolios
This document is intended for the use of wholesale clients only and should not be relied upon by retail clients or investors. Circulation must be restricted accordingly. Any reproduction of this information, in whole or in part, is prohibited.

1
• The current RI landscape
- Ethical versus ESG versus Impact investing
- The path towards standards
• How investors can integrate ESG in their investment process
- The link between ESG outcomes and investment outcomes
- Building a scoring framework
- Going beyond exclusions – targeting and engagement
• The state of ESG data and future trends
- What will ESG integration look like in the future
- What types of ESG research are managers pursuing
- How can managers and advisors stay ahead of the game
What we’re going to cover…

Source: Broadridge
2
Inconsistency
• Vagueness of definitions, terminology, standards and objectives?
• Inconsistency of agencies and ratings?
• ESG quality of information?
Responsible Investing – the classic questions
Greenwashing
• Potential for mis selling ESG?
• Credibility of due diligence?
Returns / profitability
• Are ESG returns lower than non-ESG returns?
• Is the asset management industry confusing its fiduciary responsibility?
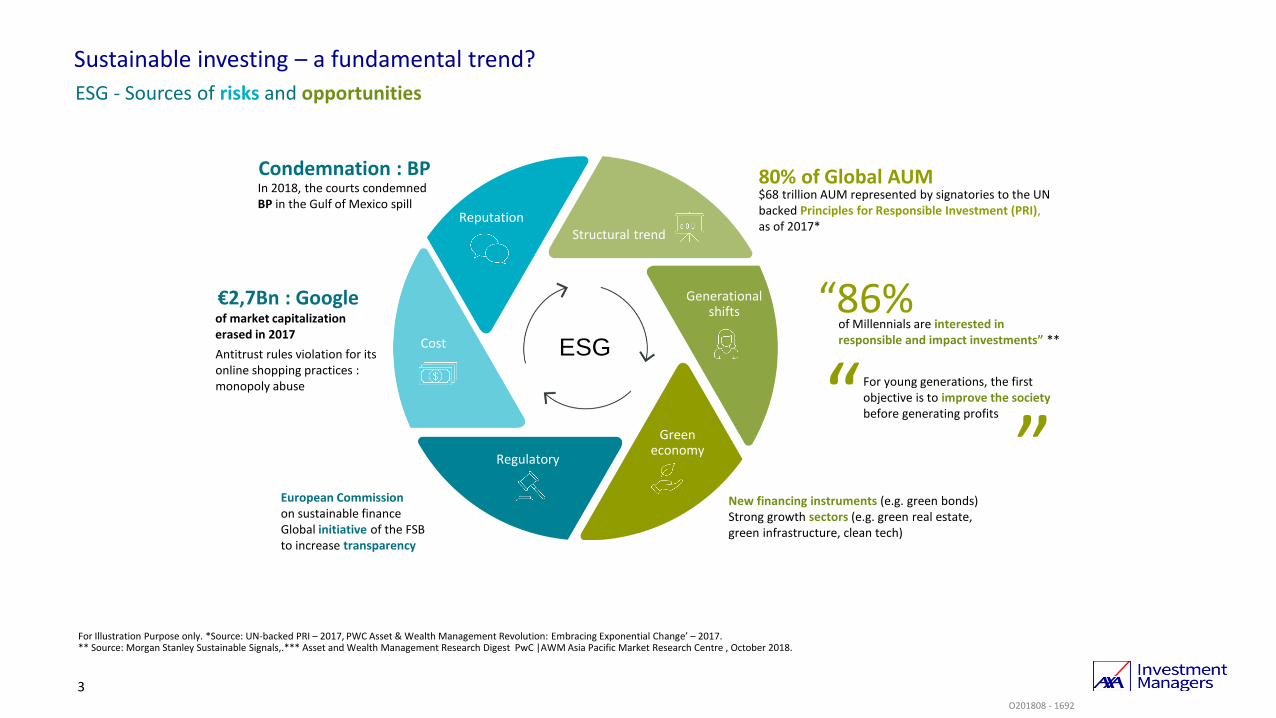
Sustainable investing – a fundamental trend?
ESG - Sources of risks and opportunities
For Illustration Purpose only. *Source: UN-backed PRI – 2017, PWC Asset & Wealth Management Revolution: Embracing Exponential Change’ – 2017.** Source: Morgan Stanley Sustainable Signals,.*** Asset and Wealth Management Research Digest PwC |AWM Asia Pacific Market Research Centre , October 2018.
3
European Commission on sustainable financeGlobal initiative of the FSB to increase transparency
New financing instruments (e.g. green bonds)Strong growth sectors (e.g. green real estate, green infrastructure, clean tech)
€2,7Bn : Googleof market capitalization erased in 2017
Antitrust rules violation for its online shopping practices : monopoly abuse
Condemnation : BPIn 2018, the courts condemned BP in the Gulf of Mexico spill
Regulatory
Cost
Generational shifts
Reputation
Green economy
Structural trend
of Millennials are interested in responsible and impact investments” **
“86%
$68 trillion AUM represented by signatories to the UN backed Principles for Responsible Investment (PRI), as of 2017*
80% of Global AUM
ESG
O201808 - 1692
For young generations, the first objective is to improve the society before generating profits“
”
Fin
an
cia
l re
turn
s Market
returns
or better
Below
market
returns
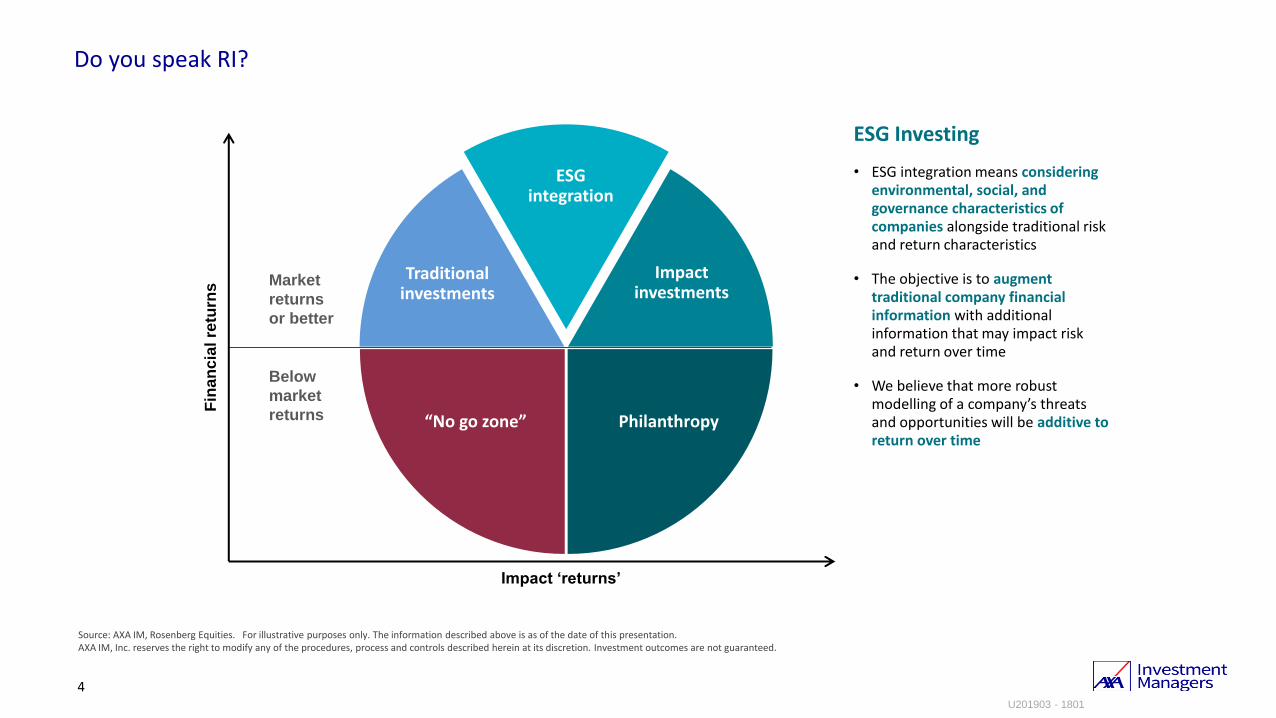
Do you speak RI?
Source: AXA IM, Rosenberg Equities. For illustrative purposes only. The information described above is as of the date of this presentation. AXA IM, Inc. reserves the right to modify any of the procedures, process and controls described herein at its discretion. Investment outcomes are not guaranteed.
4
Impact ‘returns’
Philanthropy“No go zone”
Traditional investments
ESG integration
Impact investments
ESG Investing
• ESG integration means considering environmental, social, and governance characteristics of companies alongside traditional risk and return characteristics
• The objective is to augment traditional company financial information with additional information that may impact risk and return over time
• We believe that more robust modelling of a company’s threats and opportunities will be additive to return over time
U201903 - 1801
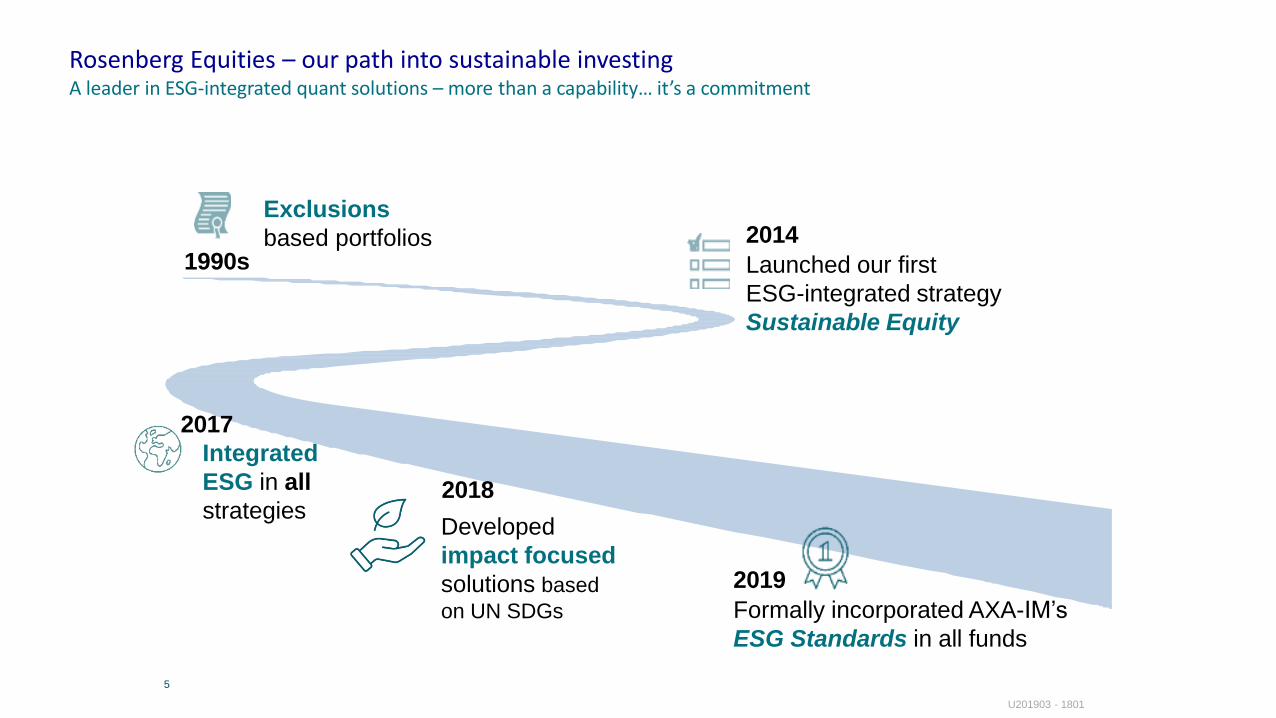
Rosenberg Equities – our path into sustainable investingA leader in ESG-integrated quant solutions – more than a capability… it’s a commitment
Exclusions
based portfolios1990s
2014
Launched our first
ESG-integrated strategy
Sustainable Equity
2017
Integrated
ESG in all
strategies2018
Developed
impact focused
solutions based
on UN SDGs
2019
Formally incorporated AXA-IM’s
ESG Standards in all funds
U201903 - 1801
5

Integrating ESG in an investment process

Intended outcomes are targets only and are not guaranteed. *ESG data not available for the full universe.
7
ESG information is economic in nature
• Long-term trends and shifting investor preferences will increasingly link ESG to fundamentals
• Not well represented in traditional investment information (e.g. financial statements); not typically required by regulators or standardized
• Complementary to traditional fundamentals – it may change our opinion of the fundamental ‘worth’ of a stock
How to integrate ESG systematically
• Be committed – ESG data is fully integrated across all client portfolios*
• Adapt the ‘objective function’ to consider ESG information alongside risk and return considerations
• Engagement and voting are key components of our commitment to active management
Expected impact
• Reduced exposure to companies with severe controversies
• Lower-than-benchmark carbon footprint and water intensity
• Better overall ESG score
ESG integration
Our belief and motivation
G201802 - 1616

Source: Rosenberg Equities, AXA IM RI Team, MSCI. Exhibit created March 2019. For illustrative purposes only. Starting universe is MSCI All Country World Index. The information set forth above is based on hypothetical backtesting of "portfolios" of the “best” ESG and “worst” ESG names in the starting universe in every month during the timeframe shown. Please note the theoretical “portfolios” are not actual or hypothetical Rosenberg Equities portfolios. The hypothetical “portfolios” are not available for investment and are for educational purposes only. Best and Worst ESG names are defined as Top 20% and Bottom 20% of portfolio determined by the AXA IM RI Team. Hypothetical “portfolios” are capitalization neutral, they are square-root of market cap weighted and are rebalanced monthly. ESG Scores used for analysis were scores used in implemented portfolios at a given point in time, though prior to August 2014 the ESG data was not available in real-time. For more information, please refer to the backtest disclosures in the Appendix.
ESG and fundamental drivers of risk and return
MSCI All-Country World Index
“Best vs Worst” ESG ranked companies and financial metrics
8
MSCI ACWI Index Top 20% ESG Bottom 20% ESG
U201908- 1872
Source: AXA IM, Rosenberg Equities, December 2019. For illustrative purposes only. AXA IM reserves the right to modify these processes at any time.
9
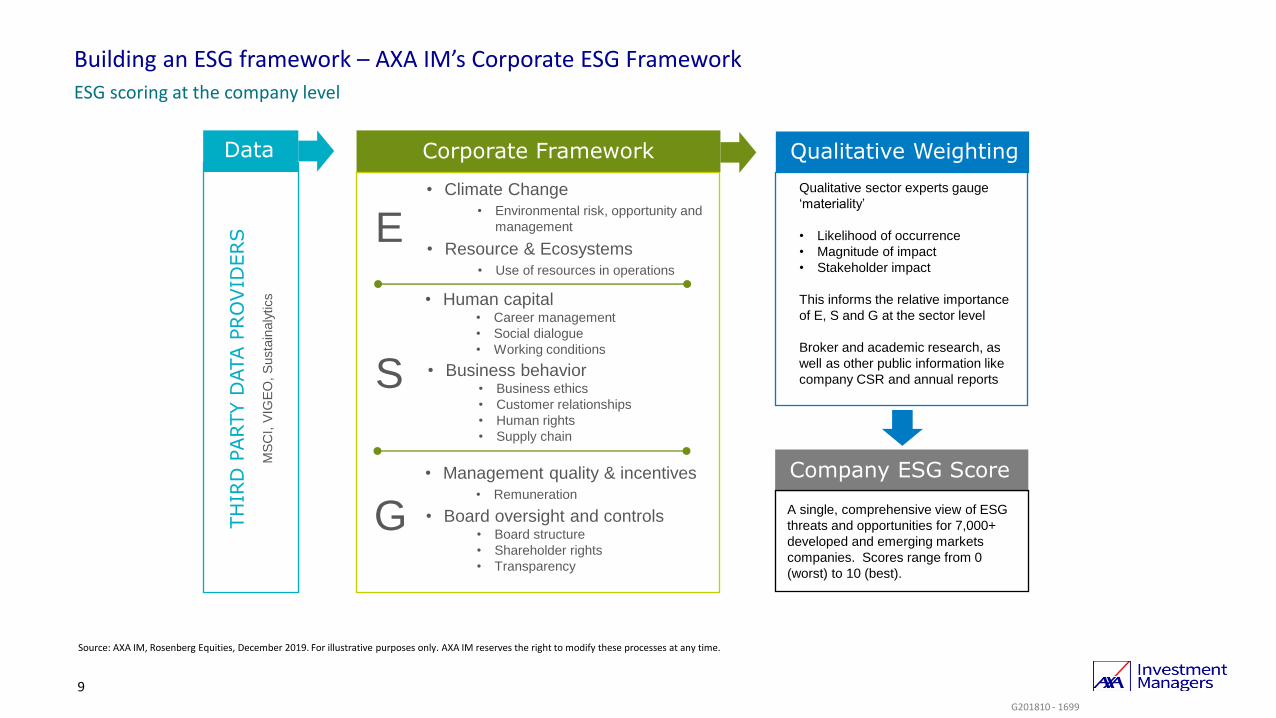
Building an ESG framework – AXA IM’s Corporate ESG Framework
ESG scoring at the company level
Corporate Framework
• Climate Change• Environmental risk, opportunity and
management
• Resource & Ecosystems• Use of resources in operations
• Human capital• Career management
• Social dialogue
• Working conditions
• Business behavior• Business ethics
• Customer relationships
• Human rights
• Supply chain
• Management quality & incentives• Remuneration
• Board oversight and controls• Board structure
• Shareholder rights
• Transparency
G
E
S
Data
TH
IRD
PARTY D
ATA P
RO
VID
ERS
MS
CI, V
IGE
O, S
usta
inaly
tics
Qualitative Weighting
Qualitative sector experts gauge
‘materiality’
• Likelihood of occurrence
• Magnitude of impact
• Stakeholder impact
This informs the relative importance
of E, S and G at the sector level
Broker and academic research, as
well as other public information like
company CSR and annual reports
Company ESG Score
A single, comprehensive view of ESG
threats and opportunities for 7,000+
developed and emerging markets
companies. Scores range from 0
(worst) to 10 (best).
G201810 - 1699
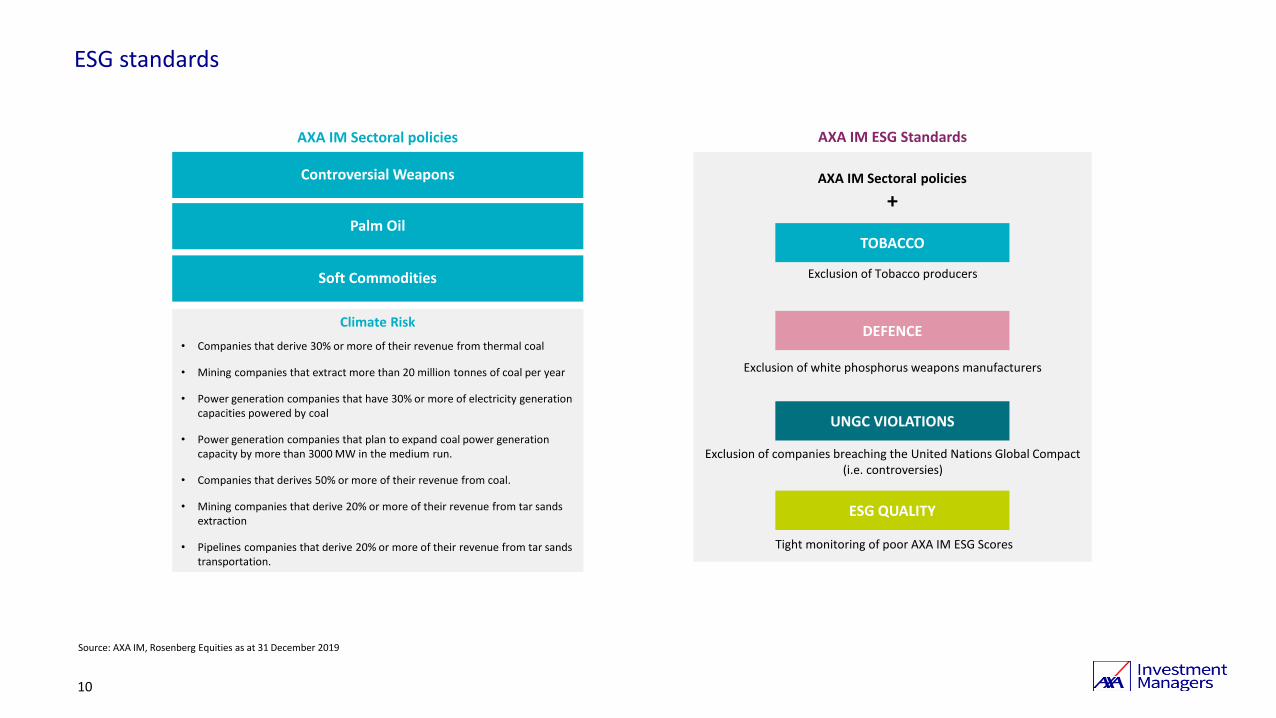
Controversial Weapons
ESG standards
Source: AXA IM, Rosenberg Equities as at 31 December 2019
10
AXA IM Sectoral policies
Climate Risk
• Companies that derive 30% or more of their revenue from thermal coal
• Mining companies that extract more than 20 million tonnes of coal per year
• Power generation companies that have 30% or more of electricity generation capacities powered by coal
• Power generation companies that plan to expand coal power generation capacity by more than 3000 MW in the medium run.
• Companies that derives 50% or more of their revenue from coal.
• Mining companies that derive 20% or more of their revenue from tar sands extraction
• Pipelines companies that derive 20% or more of their revenue from tar sands transportation.
AXA IM ESG Standards
TOBACCO
DEFENCE
ESG QUALITY
UNGC VIOLATIONS
Exclusion of Tobacco producers
Exclusion of companies breaching the United Nations Global Compact (i.e. controversies)
Tight monitoring of poor AXA IM ESG Scores
Exclusion of white phosphorus weapons manufacturers
AXA IM Sectoral policies
+Palm Oil
Soft Commodities

ESG integration is not just about exclusion…
11
ESG
Integration
TargetingHigher ESG metrics
Lower carbon footprint
Lower water intensity
Voting and EngagementIn-house voting policy
Individual & collective engagement
ExcludingSevere controversies
Tobacco
Source: Rosenberg Equities as of March 2020. The investment objectives and/or features set forth above illustrate our strategy and approach only. Each specific investor’s experience may vary. No assurance is made that these investment objectives and/or features will be achieved.
G201803 - 1611

Active stewardship
Voting and engagement
Source AXA IM as of 31/12/2017. Engagement activities are not conducted by Rosenberg Equities directly. No representation is made as to the outcome of such engagement activities.
12
Voting Engagement
A crucial part of the dialogue between a company and its shareholders
Fundamental aspect of fiduciary duty
ObjectiveInfluence companies to adopt highest corporate governance standards
Our Focus• Board structure• Directors’ remuneration• Audit integrity• Shareholders’ rights• Mitigating of ESG Risks
The process of dialogue and resolution of identified matters of concern between a company and its shareholders
ObjectiveEnsure that our investors continue to derive value from their holdings by dealing effectively with concerns which may impact performance
Our Focus• ESG issues that impact on
sustainable performance• Use broad investor influence• Use of voting rights to enhance
engagement
U201807 - 1675
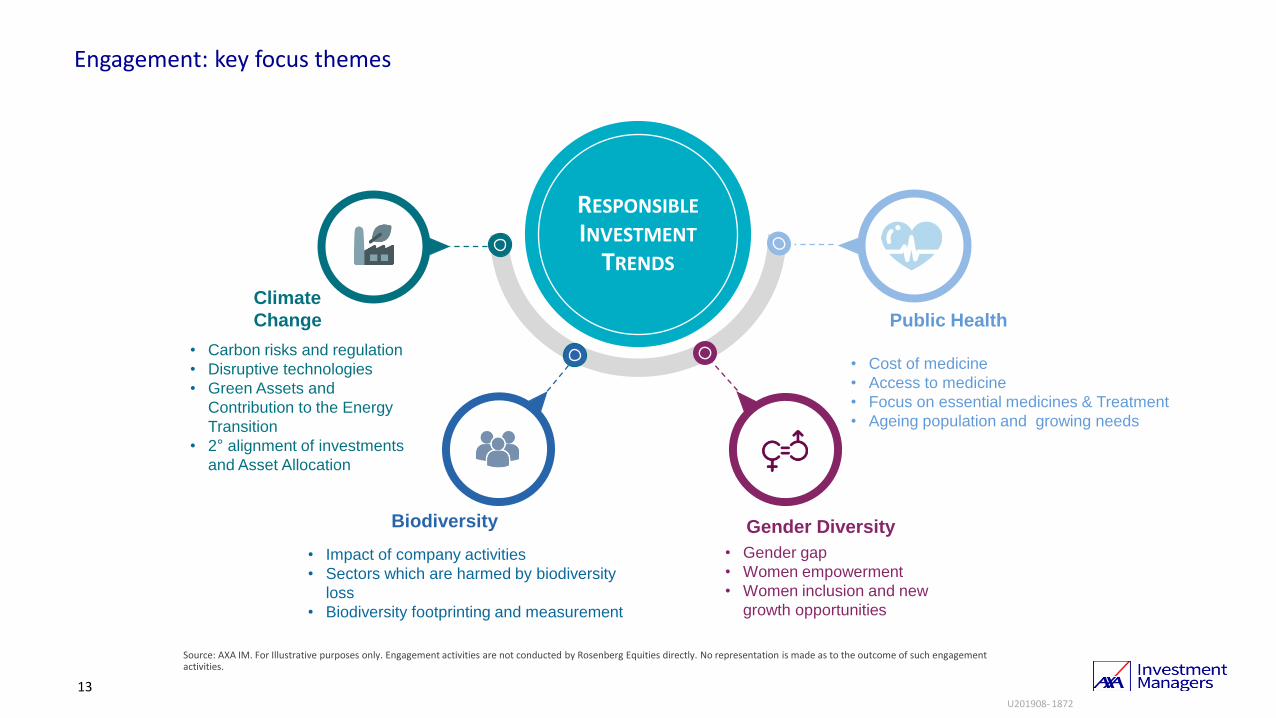
RESPONSIBLE
INVESTMENT
TRENDS
13
Climate
Change
Biodiversity
Public Health
Gender Diversity
• Impact of company activities
• Sectors which are harmed by biodiversity
loss
• Biodiversity footprinting and measurement
• Gender gap
• Women empowerment
• Women inclusion and new
growth opportunities
• Carbon risks and regulation
• Disruptive technologies
• Green Assets and
Contribution to the Energy
Transition
• 2° alignment of investments
and Asset Allocation
• Cost of medicine
• Access to medicine
• Focus on essential medicines & Treatment
• Ageing population and growing needs
Source: AXA IM. For Illustrative purposes only. Engagement activities are not conducted by Rosenberg Equities directly. No representation is made as to the outcome of such engagement activities.
Engagement: key focus themes
U201908- 1872
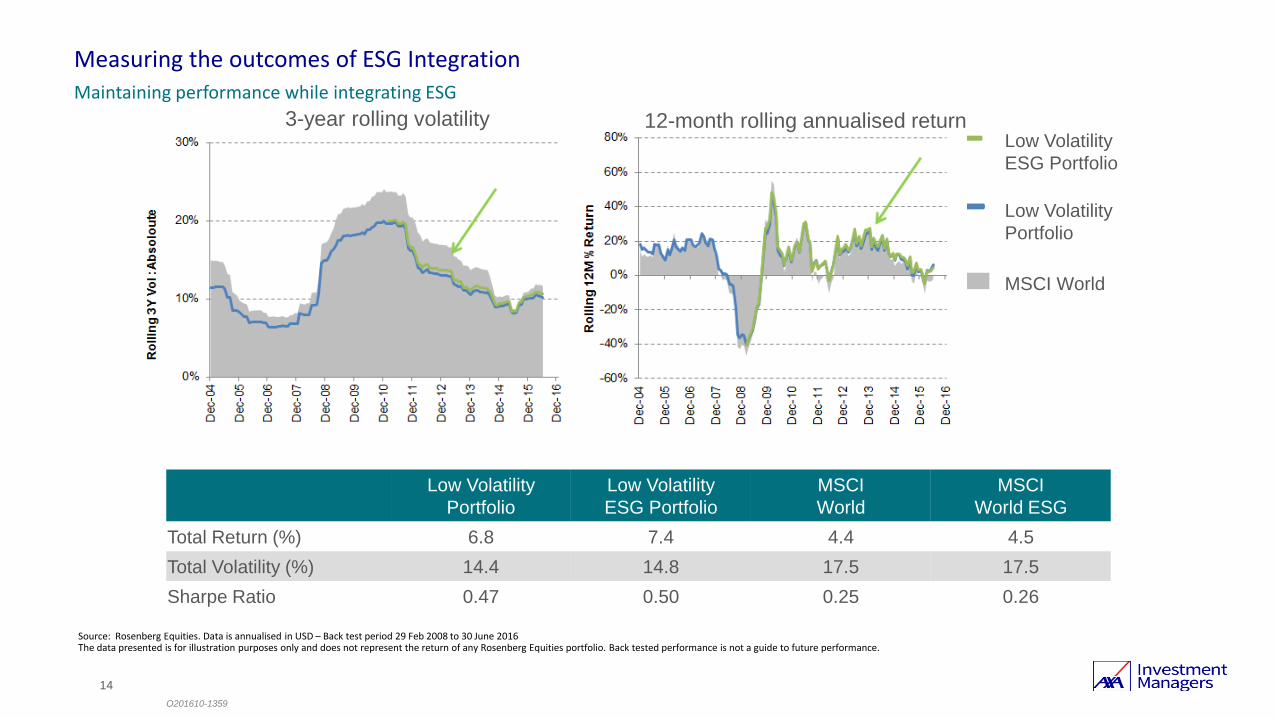
Measuring the outcomes of ESG Integration
Maintaining performance while integrating ESG
Source: Rosenberg Equities. Data is annualised in USD – Back test period 29 Feb 2008 to 30 June 2016The data presented is for illustration purposes only and does not represent the return of any Rosenberg Equities portfolio. Back tested performance is not a guide to future performance.
14
O201610-1359
Low Volatility
Portfolio
Low Volatility
ESG Portfolio
MSCI
World
MSCI
World ESG
Total Return (%) 6.8 7.4 4.4 4.5
Total Volatility (%) 14.4 14.8 17.5 17.5
Sharpe Ratio 0.47 0.50 0.25 0.26
3-year rolling volatility
MSCI World
Low Volatility
Portfolio
Low Volatility
ESG Portfolio
12-month rolling annualised return

ESG into the future…

AXA IM / Rosenberg Equities may modify its research agenda at its discretion at any time
16
New ESG data allow us to integrate ESG at the heart of the investment process
We’ve seen an explosion in alternative data – including many new ESG datasets
- We believe this ‘extra-financial data to be economic in nature
These new ESG datasets allow for innovative ESG investment research:- Using diversity data to better forecast future earnings quality
- Using carbon intensity data to adjust company valuations
- Using natural language processing to monitor companies engagement with environmental risks
- ‘Decarbonization’ – moving from carbon footprints to carbon footpaths
What’s next for ESG?
ESG integration 2.0
U201908- 1872

17
More and more alternative dataWhat do we mean by ESG alternative data?
Source: Rosenberg Equities as of 30 December 2019
U201903 - 1801
How does a company operate?
Traditional ESG Data
How is a company
poised for transition?
Regulatory and
transition risk.
Location of company,
suppliers, customers,
staff
Physical/transition risk, scenario analysis
What does a company make?
How do those products map to societal orenvironmental goals?
Impact and green revenues
What does newsflow and text-based coverage say about a company?
Sentiment andcommitment
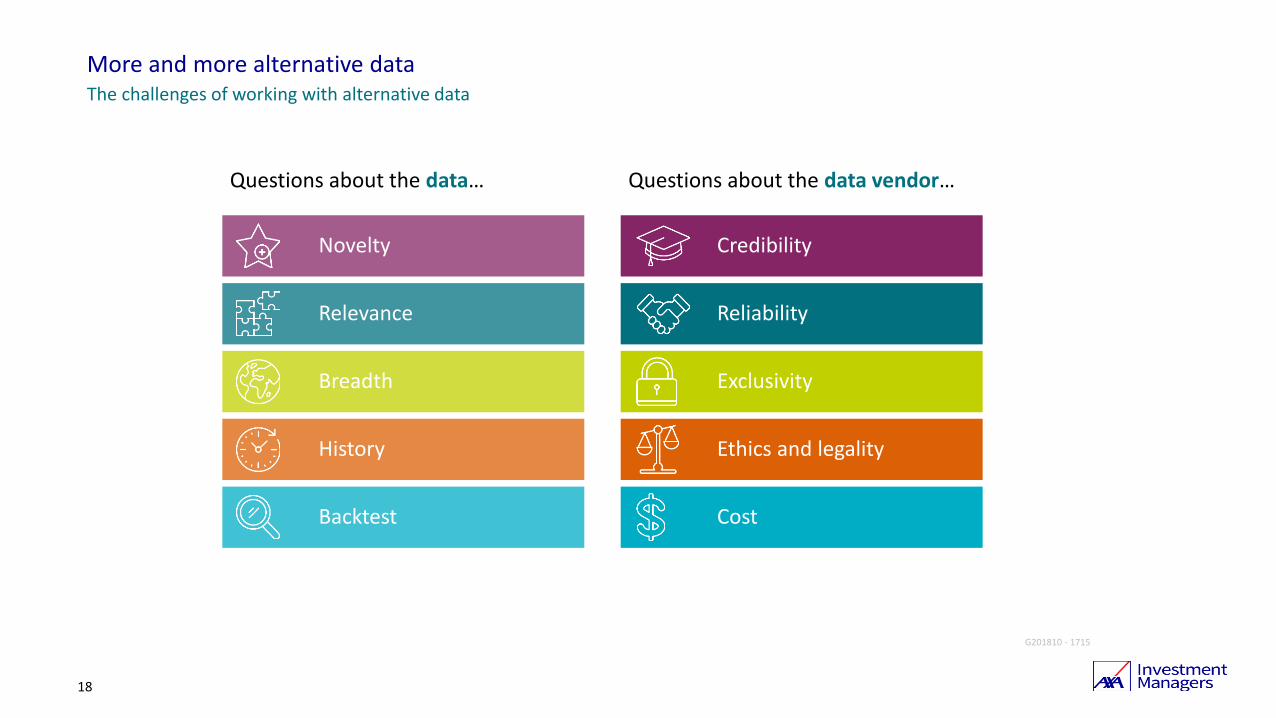
Credibility
Reliability
Exclusivity
Ethics and legality
Cost
18
More and more alternative dataThe challenges of working with alternative data
Questions about the data… Questions about the data vendor…
Novelty
Relevance
Breadth
History
Backtest
G201810 - 1715

19
Using diversity data to better forecast future earnings quality
Does diversity provide profitability protection?
Source: Rosenberg Equities, Asset4. The ‘US Market’ is the largest 1,000 US stocks in the Rosenberg Equities universe over period of analysis. Profitability is defined as return on equity net extraordinary items
(ROEX). ROEX quartiles represent 25% of market cap when ranked on profitability. Averages are calculated over period January 2005 – July 2017. Please note that higher forward ROEX does not necessarily
translate to higher stock returns.
0%
10%
20%
30%
40%
50%
US Market Bottom ROEX Quartile Poor ROEX Quartile Good ROEX Quartile Top ROEX Quartile
Mean reversion of RoE – pressure on profitability
Average (Current) ROEX Average 12-Month Forward ROEX
U201903 - 1801
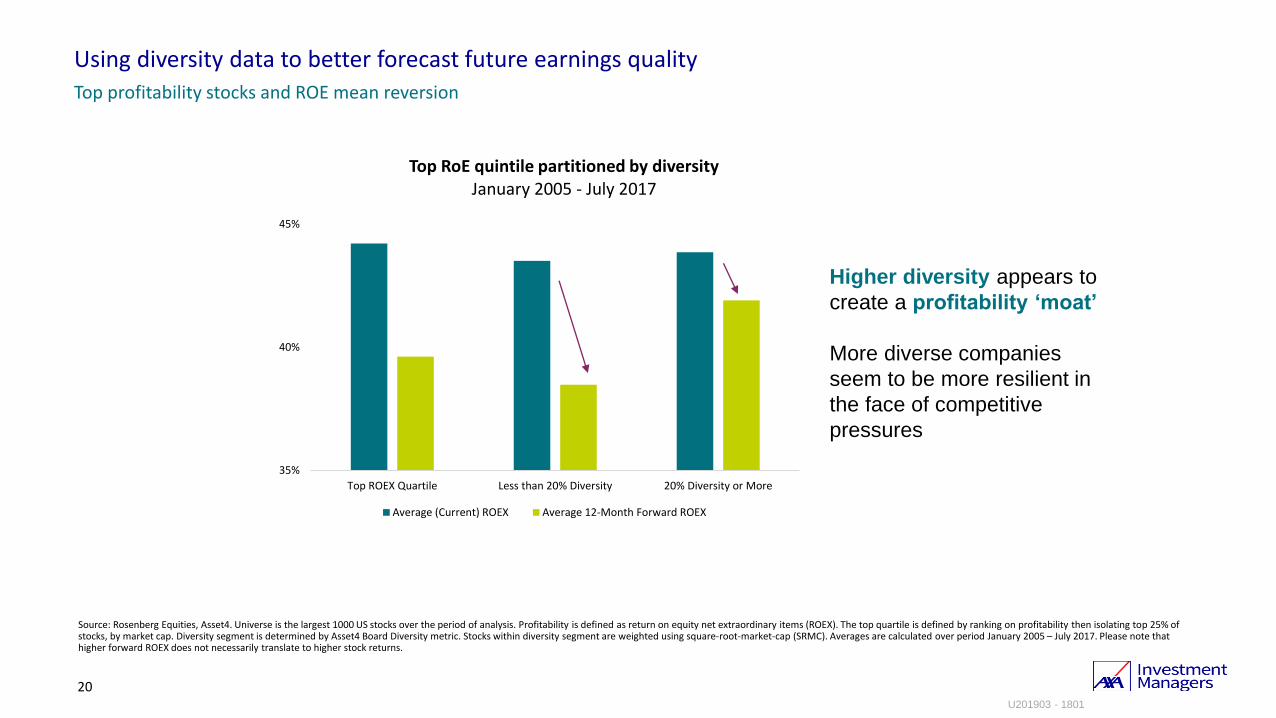
Using diversity data to better forecast future earnings quality
Top profitability stocks and ROE mean reversion
Source: Rosenberg Equities, Asset4. Universe is the largest 1000 US stocks over the period of analysis. Profitability is defined as return on equity net extraordinary items (ROEX). The top quartile is defined by ranking on profitability then isolating top 25% of stocks, by market cap. Diversity segment is determined by Asset4 Board Diversity metric. Stocks within diversity segment are weighted using square-root-market-cap (SRMC). Averages are calculated over period January 2005 – July 2017. Please note that higher forward ROEX does not necessarily translate to higher stock returns.
20
Higher diversity appears to
create a profitability ‘moat’
More diverse companies
seem to be more resilient in
the face of competitive
pressures
35%
40%
45%
Top ROEX Quartile Less than 20% Diversity 20% Diversity or More
Top RoE quintile partitioned by diversity January 2005 - July 2017
Average (Current) ROEX Average 12-Month Forward ROEX
U201903 - 1801

$0.00
$0.50
$1.00
$1.50
$2.00
$2.50
$3.00
Dec-07 Sep-08 Jun-09 Mar-10 Dec-10 Sep-11 Jun-12 Mar-13 Dec-13 Sep-14 Jun-15 Mar-16 Dec-16 Sep-17 Jun-18
Ro
llin
g 1
2-M
on
th A
vera
ge C
ross
-Se
ctio
nal
Re
gre
ssio
n C
oe
ffic
ien
t
Market Appraisal of Select Business LinesGlobal Universe
SOAP
BEVERGE
LIQUOR
ALUMINUM
STEEL
COAL
Source: Rosenberg Equities, Trucost. Universe is all Global stocks covered by Trucost for which Trucost ‘s Carbon-Weighted Disclosure score was greater than 90%. Exhibit shows rolling12-month average monthly cross-sectional Market Appraisal (regression coefficient) for select business line assets per share over period December 2007– December 2018. At 31 December 2018 there were 2,950 securities in the Universe.
21
Using carbon intensity data to adjust company valuations
Carbon data can be included in our valuation models to determine an ‘implied price’ of carbon
U201908- 1872
Market Appraisals are driven by all forward-looking sentiment… including ESG criteria
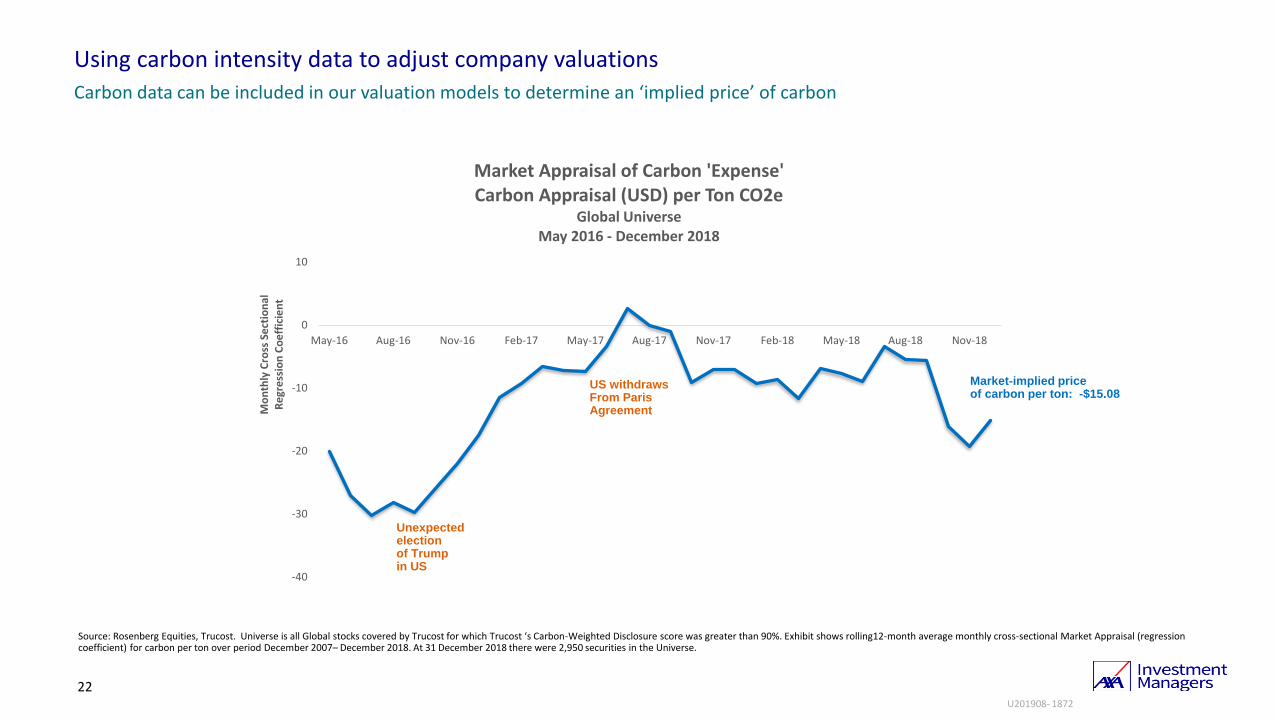
Source: Rosenberg Equities, Trucost. Universe is all Global stocks covered by Trucost for which Trucost ‘s Carbon-Weighted Disclosure score was greater than 90%. Exhibit shows rolling12-month average monthly cross-sectional Market Appraisal (regression coefficient) for carbon per ton over period December 2007– December 2018. At 31 December 2018 there were 2,950 securities in the Universe.
22
Using carbon intensity data to adjust company valuations
Carbon data can be included in our valuation models to determine an ‘implied price’ of carbon
Unexpectedelectionof Trumpin US
US withdrawsFrom ParisAgreement
-40
-30
-20
-10
0
10
May-16 Aug-16 Nov-16 Feb-17 May-17 Aug-17 Nov-17 Feb-18 May-18 Aug-18 Nov-18
Mo
nth
ly C
ross
Se
ctio
nal
Re
gre
ssio
n C
oe
ffic
ien
t
Market Appraisal of Carbon 'Expense'Carbon Appraisal (USD) per Ton CO2e
Global UniverseMay 2016 - December 2018
Market-implied priceof carbon per ton: -$15.08
U201908- 1872

Using natural language processing to monitor “environmental catastrophe” Risk
Using NLP techniques on 10K filings
Source: SEC EDGAR filings from 2005-2019, Rosenberg Equities
23
• Companies are impacted significantly by physical risk due to climate change & severe weather events
• We are using NLP techniques to identify use of ‘catastrophe’ words (e.g. wildfire) and implied perception of related risks
• Preliminary analysis shows that companies are increasingly mentioning these ‘catastrophe’ words and that their implied importance is also increasing
• We are also analyzing different categories of words – environmental, emissions, regulatory, renewable energy etc.
O201905-1838
fire rain winter storm
earthquake tsunami snow storm
hurricane wildfire unusually cold
flood typhoon storm surge
storm seismic activity severe snow
tornado volcano marine ice flow
drought ice storm extreme rainfall
Examples of ‘natural disaster’ words
24
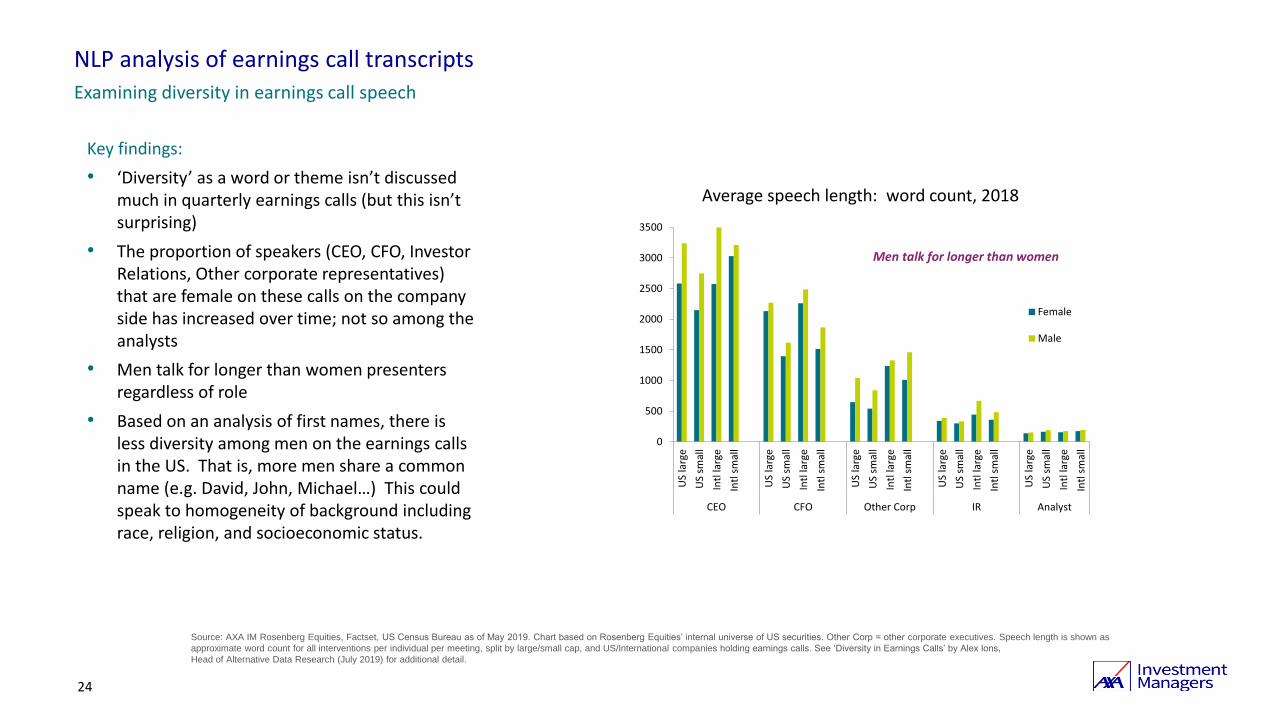
NLP analysis of earnings call transcripts
Examining diversity in earnings call speech
Source: AXA IM Rosenberg Equities, Factset, US Census Bureau as of May 2019. Chart based on Rosenberg Equities’ internal universe of US securities. Other Corp = other corporate executives. Speech length is shown as
approximate word count for all interventions per individual per meeting, split by large/small cap, and US/International companies holding earnings calls. See ‘Diversity in Earnings Calls’ by Alex Ions,
Head of Alternative Data Research (July 2019) for additional detail.
Key findings:
• ‘Diversity’ as a word or theme isn’t discussed much in quarterly earnings calls (but this isn’t surprising)
• The proportion of speakers (CEO, CFO, Investor Relations, Other corporate representatives) that are female on these calls on the company side has increased over time; not so among the analysts
• Men talk for longer than women presenters regardless of role
• Based on an analysis of first names, there is less diversity among men on the earnings calls in the US. That is, more men share a common name (e.g. David, John, Michael…) This could speak to homogeneity of background including race, religion, and socioeconomic status.
Average speech length: word count, 2018
0
500
1000
1500
2000
2500
3000
3500
US
larg
e
US
smal
l
Intl
larg
e
Intl
sm
all
US
larg
e
US
smal
l
Intl
larg
e
Intl
sm
all
US
larg
e
US
smal
l
Intl
larg
e
Intl
sm
all
US
larg
e
US
smal
l
Intl
larg
e
Intl
sm
all
US
larg
e
US
smal
l
Intl
larg
e
Intl
sm
all
CEO CFO Other Corp IR Analyst
Female
Male
Men talk for longer than women

Source: Rosenberg Equities, MSCI, Trucost – April 2019. Point in time analysis using data as at 30 April 2019. Starting universe is MSCI World Index. Carbon Intensity is defined as Direct + First Tier Indirect CO2e in tonnes / $M Revenue. Exhibits show ratio of Carbon Intensity for various buckets relative to MSCI World Index. Sectors based on GICS classifications.30
‘Decarbonization’ – moving from carbon footprints to carbon footpaths It is “easy” to reduce portfolio carbon footprint, but…
Divesting from utilities reduces investment opportunity and removes ability to foster or accelerate incumbents’ transition through engagement
Divesting from the top 5% of polluters reduces overall carbon intensity by 41%
U201908- 1872
Source: Rosenberg Equities, MSCI, Trucost – April 2019. Point in time analysis using data as at 30 April 2019. Starting universe is MSCI World Index. Carbon Intensity is defined as Direct + First Tier Indirect CO2e in tonnes / $M Revenue. Exhibits show ratio of Carbon Intensity for various buckets relative to MSCI World Index. Sectors based on GICS classifications.26
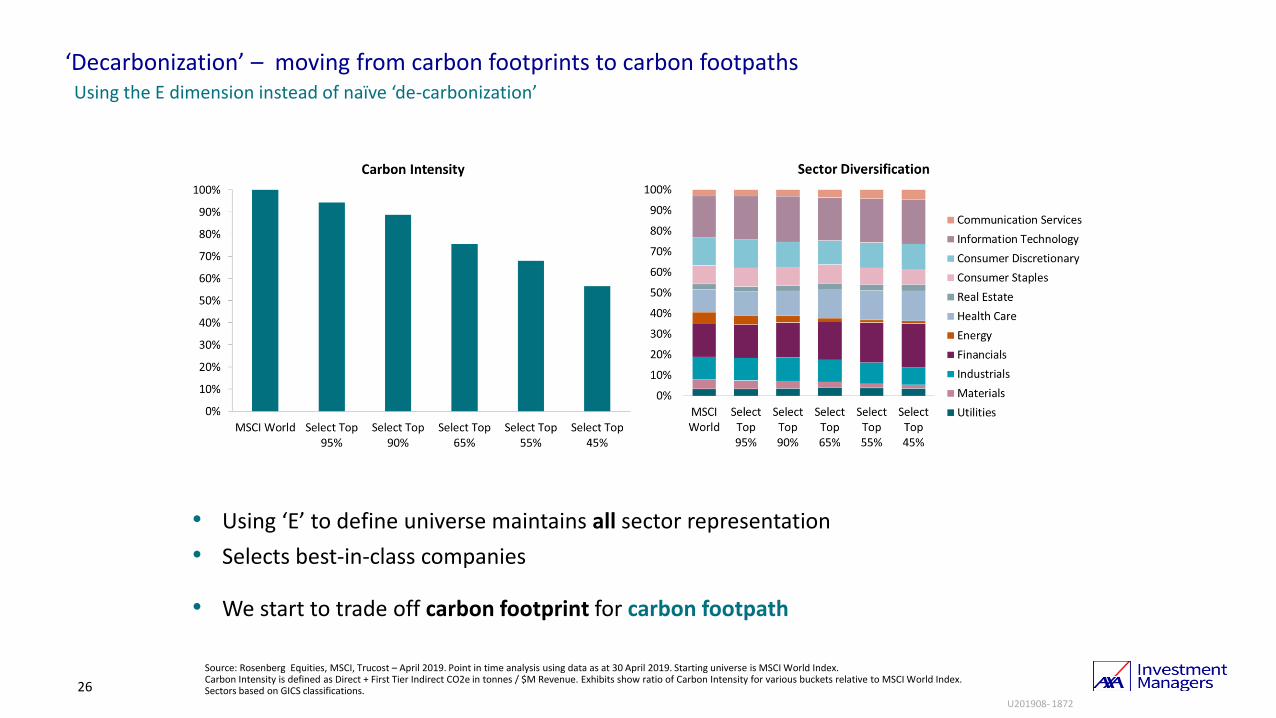
‘Decarbonization’ – moving from carbon footprints to carbon footpaths Using the E dimension instead of naïve ‘de-carbonization’
• Using ‘E’ to define universe maintains all sector representation
• Selects best-in-class companies
• We start to trade off carbon footprint for carbon footpath
U201908- 1872
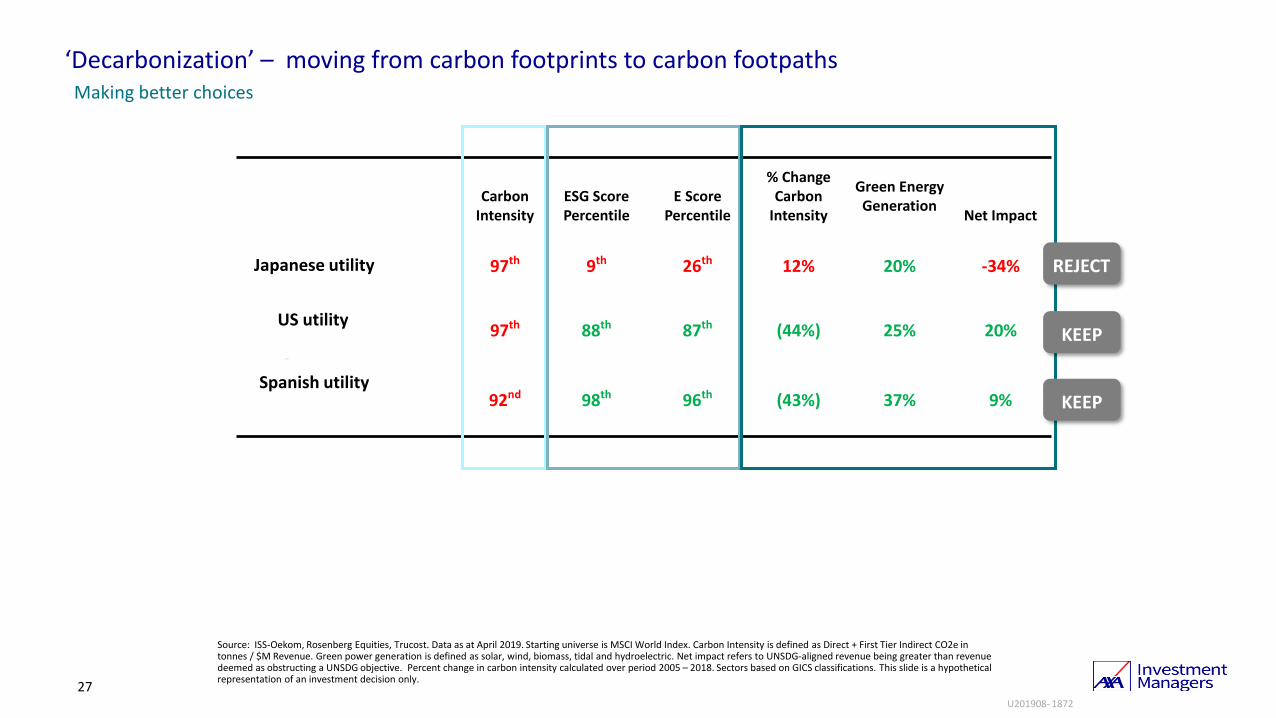
Source: ISS-Oekom, Rosenberg Equities, Trucost. Data as at April 2019. Starting universe is MSCI World Index. Carbon Intensity is defined as Direct + First Tier Indirect CO2e in tonnes / $M Revenue. Green power generation is defined as solar, wind, biomass, tidal and hydroelectric. Net impact refers to UNSDG-aligned revenue being greater than revenue deemed as obstructing a UNSDG objective. Percent change in carbon intensity calculated over period 2005 – 2018. Sectors based on GICS classifications. This slide is a hypothetical representation of an investment decision only.
27
‘Decarbonization’ – moving from carbon footprints to carbon footpaths Making better choices
Carbon Intensity
ESG Score Percentile
E Score Percentile
% Change Carbon
Intensity
Green Energy Generation
Net Impact
97th 9th 26th 12% 20% -34%
97th 88th 87th (44%) 25% 20%
92nd 98th 96th (43%) 37% 9%
REJECT
KEEP
KEEP
Japanese utility
US utility
Spanish utility
U201908- 1872

Sustainable InvestingIntegrating sustainability in your core equity portfolios

We believe the best ‘sustainable investment’ is one that investors will stick with
Without all three elements investors will lose interest in sustainable investing or will simply be pressured to abandon it.
29
Financial performance
Attractivefees
ESG impact
What is truly sustainable investing?
G201901 - 1762
Supplemental information

Source AXA IM, April 2020 Portfolio is AXA IM Sustainable Equity Fund. The reference to league tables and awards are not an indicator of future performance or places in league tables or awards. Investment in the Fund is subject to the Fund’s offering documents. Please refer to the important disclaimers at the back of the presentation.
AXA IM Sustainable Equity Fund Summary
As of 21-Apr-20 As of Nov-19
AU201910 - 14172
As of Feb-20
5 Year track record
49% lowercarbon intensityvs. MSCI ACWI ex-Australia Index
TER of 35bps
Diversified global equity fund
Fund AUM A$106m Strategy AUM A$6.5bn
Local platforms:
Asgard
BT Wrap
BT Panorama
CFS FirstWrap
IOOF
HUB24 Invest & Super
Praemium
uXchange
AMP (MyNorth, North, Summit, iAccess)
Focused on companies that deliver sustainable earnings to create a defensive portfolio

At Inception
MARKETSince inception the strategy has delivered:
• Outperformance versus market cap indices
• Lower volatility and less drawdown during market turmoil
• Improved ESG score, consistently lower carbon footprint
Source: AXA IM, March 2020. Portfolio refers to the representative account in the strategy, which was selected based on having a typical investment setup and adequate assets under management. An investor's experience may vary. *Representative account inception date 7 August 2014. Performance is in AUD, gross of fees and gross of all withholding tax, calculated and compounded daily with income reinvested and close of business prices as of 31 March 2020. The deduction of fees reduces the level of returns, for more information on the effect of management fees on returns, please see the fees section of the important information slides. Past performance is not a guide to future performance. Annualised Volatility and Sharpe Ratio calculations do not include partial month returns. The representative account's performance indicator, the MSCI ACWI ex Australia Index, is given as a basis for comparison only.
AXA IM Sustainable Equity
Live performance track record as of 31 March 2020
32
Risk and Return PerformanceCumulative Performance
AU202001- 15509
3 Month 1 Yr. 3 Yr. 5 Yr.Since
Inception*
Return (% AUD)
Portfolio -7.0 6.5 12.4 9.9 13.8
Benchmark -9.3 3.9 10.1 8.2 11.8
Excess performance
2.3 2.6 2.3 1.7 2.1
Sharpe ratio
Portfolio 0.43 1.06 0.80 1.14
Benchmark 0.19 0.75 0.58 0.87
AnnualisedCumulative
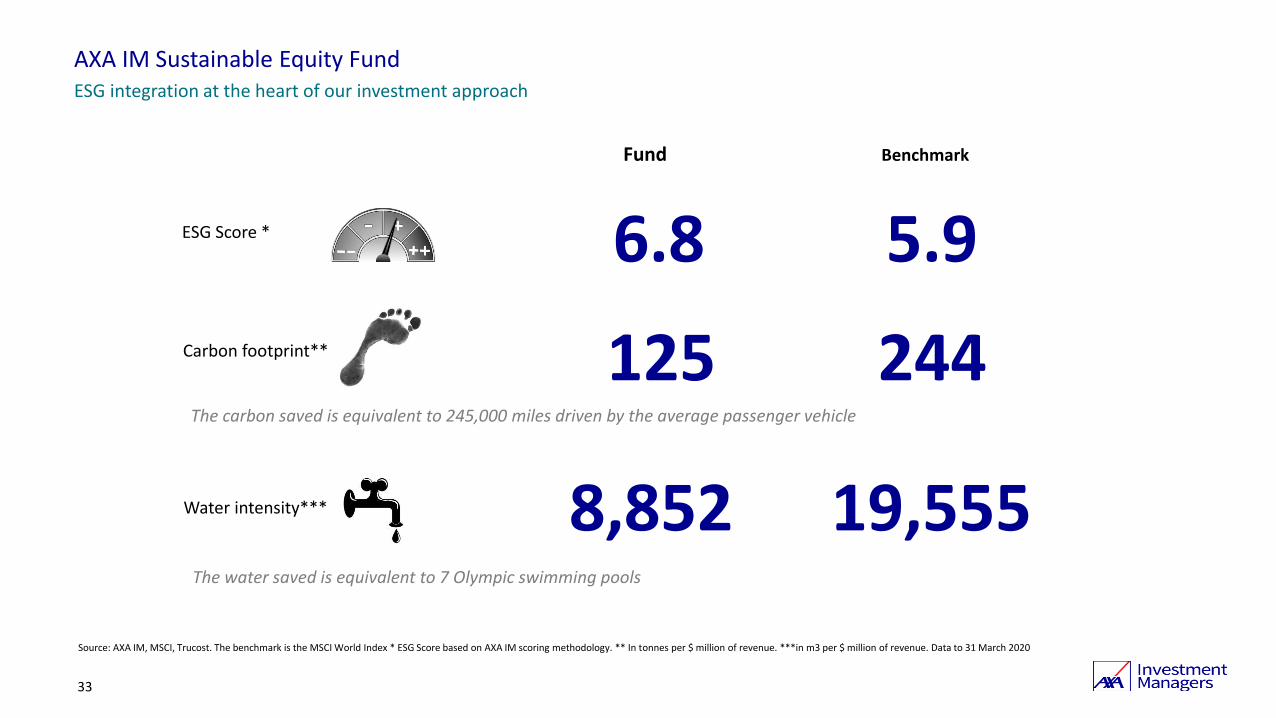
Source: AXA IM, MSCI, Trucost. The benchmark is the MSCI World Index * ESG Score based on AXA IM scoring methodology. ** In tonnes per $ million of revenue. ***in m3 per $ million of revenue. Data to 31 March 2020
33
ESG integration at the heart of our investment approach
Carbon footprint** 125 244
Fund Benchmark
Water intensity*** 8,852 19,555
The carbon saved is equivalent to 245,000 miles driven by the average passenger vehicle
The water saved is equivalent to 7 Olympic swimming pools
ESG Score * 6.8 5.9
AXA IM Sustainable Equity Fund

34
Sustainable Equity | Additional ESG and UNSDG-aligned KPIs
31 March 2020
Source: Rosenberg Equities, The UN Sustainable Development Goals Report, MSCI, ISS-Oekom, Sustainalytics as at 31 March 2020. The UNSDG refers to the United Nations Sustainable Development Goals. ‘Exposure’ is cap-weighted exposure for Fund and Benchmark on specified date. Benchmark is MSCI ACWI ex Australia.
Human Health and Society The Environment and Planet
Fund has greater exposure to thebest ‘E’ stocks – these are companieswith better ‘green’ operationalpractices
Fund also has more exposure to companies with > 2% revenue (net) fromsignificantly ‘green’ products like solarenergy, wind energy, battery technology,LEDs…
… and less exposure to companies with> 2% revenue (net) from significantly‘brown’ products like coal and oil
Severe Controversy ExposureFund: 1.5%Benchmark: 2.2%
Tobacco ExposureFund: 0%Benchmark: 0.9%
Controversial Weapons ExposureFund: 0%Benchmark: 0.5%
Board Gender Diversity ExposureFund: 27%Benchmark: 25%
1.7%
6.5%
6.3%3.9%
Sustainable Equity Fund Benchmark
Significant Green/ Brown Revenue (Net) alligned to SDG 13 Climate Action
Green
Brown
5%13%
27%
33%
62%
48%
6% 4%
Sustainable Equity Benchmark
Environmental (E) Score Distribution
8 to 10
6 to 8
4 to 6
2 to 4
0 to 2

AXA IM Sustainable Equity Fund
2019 voting statistics
Source: AXA IM as at 31 December 2019
35
Key figures Breakdown of votes against management
412 /418 (98.6%) meetings voted in 2019
184 meetings with at least one vote against management
5465 resolutions of which 354 votes against
6%
94%
Against
For
32%
26%
16%
13%
4%
9%
Board issues Remuneration
ESG opportunities & risk Capital issues
Accounts & Auditors Other
AXA IM Sustainable Equity Fund
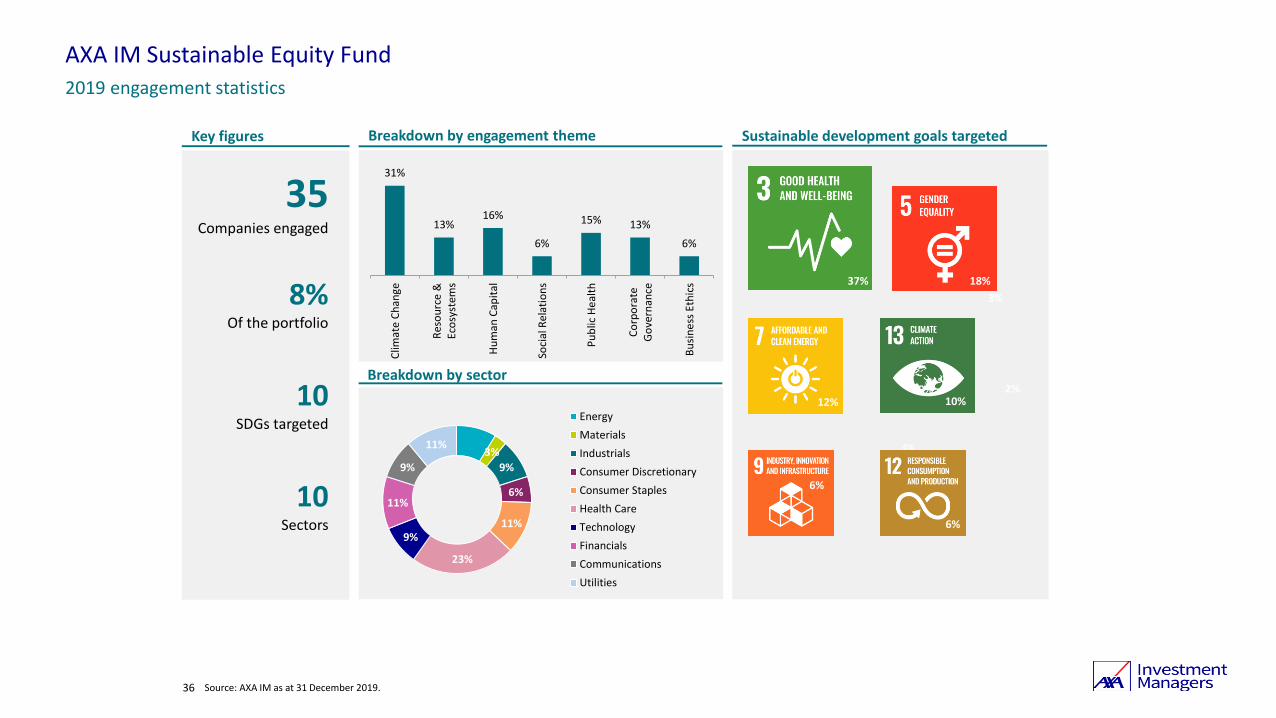
36 Source: AXA IM as at 31 December 2019.
35Companies engaged
8%Of the portfolio
10SDGs targeted
10Sectors
3%
2% 2% 2%
2% 1%
Key figures Breakdown by engagement theme
Breakdown by sector
Sustainable development goals targeted
37% 18%
12%9%
6%
4%
2019 engagement statistics
10%
6%
3%
9%
6%
11%
23%
9%
11%
9%
11%
Energy
Materials
Industrials
Consumer Discretionary
Consumer Staples
Health Care
Technology
Financials
Communications
Utilities
31%
13%16%
6%
15% 13%
6%
Clim
ate
Ch
ange
Res
ou
rce
&Ec
osy
stem
s
Hu
man
Cap
ital
Soci
al R
elat
ion
s
Pu
blic
He
alth
Co
rpo
rate
Go
vern
ance
Bu
sin
ess
Eth
ics

The risk factors below are not exhaustive and in particular, there may be risk factors specific to this specific strategy that are not specified herein. Prospective investors should carefully read the relevant asset manager disclosures and the portfolio’s final documentation, if any, in its entirety, including any of its amendments or supplements.
Systematic Model Risk: We seek to achieve clients’ investment objectives primarily in reliance on signals generated by analytical models. We have established certain systematic rules and processes for generating trading signals, implementing trades, and
managing risk, but there is no guarantee that these rules or processes will effectively implement the models’ buy and sell signals or manage the risk associated with such signals. Allocation, selection, and weighting of assets are also determined using systematic
models. It is possible that the design of such models may not result in the selection of the best performing assets.
Global Investments Risk: Investments in foreign securities, i.e. securities denominated in a currency different from the portfolio’s Reference Currency, offer potential benefits not available from investments solely in securities denominated in the portfolio’s
Reference Currency. However, it also involves significant risks that are not typically associated with investing in securities denominated in the portfolio’s Reference Currency. Indeed, foreign investments may be affected by movements of exchange rates, changes
in laws, or restrictions applicable to such investments and changes in exchange control regulations (e.g. currency blockage).
In addition, if a portfolio with investments in currencies different from its Reference Currency is unhedged, the investor is exposed to currency risk.
Issuers are generally subject to different accounting, auditing, and financial reporting standards in different countries throughout the world. The volume of trading, the volatility of prices, and the liquidity of issuers may vary in the markets of different countries. In
addition, the level of government supervision and regulation of securities exchanges, securities dealers, and listed and unlisted companies is different throughout the world. The laws of some countries may limit the portfolio’s ability to invest in securities of
certain issuers located in those countries. Different markets have different clearance and settlement procedures. Delays in settlement could result in temporary periods when a portion of the portfolio’s assets is uninvested and no return is earned thereon. The
inability of the portfolio to make intended securities purchases due to settlement problems could cause the portfolio to miss attractive investment opportunities. Inability to dispose of a portfolio's securities due to settlement problems could result either in losses
to the portfolio, due to subsequent declines in value of the portfolio's securities, or, if the portfolio has entered into a contract to sell the securities, could result in possible liability to the purchaser.
With respect to certain countries, there is a possibility of expropriation or confiscatory taxation, imposition of withholding taxes on dividend or interest payments, limitations on the removal of portfolios or other assets of the portfolios, political or social instability
or diplomatic developments, which could affect investments in those countries. An issuer of securities may be domiciled in a country other than a country in which currency the instrument is denominated.
The values and relative yields of investments in the securities markets of different countries, and their associated risks, are expected to change independently of each other. Periods of economic uncertainty may result in volatility of market prices and in turn the
portfolio’s value.
Geographic/Political Risk: The economies and financial markets of certain regions, such as but not limited to Asia, can be highly interdependent and may decline all at the same time. Changes in economic and tax policies, government instability, war or other
political or economic actions or factors may have an adverse effect on foreign investments.
Investment in China A Shares via the Stock Connect Program Risk: Investments in China A shares (shares issued by domestic markets in mainland China in Chinese renminbi) may occur through the Stock Connect program. China A shares are generally only
available for investment by residents of mainland China or by foreign investors through tightly regulated structures. The Stock Connect program is one structure through which foreign investors can invest in China A shares by providing mutual market access via the
Hong Kong Stock Exchange, Shanghai Stock Exchange, and Shenzhen Stock Exchange. In addition to the risks described above, investment via the Stock Connect program also involves various risks with investment limitations, settlement operational risk, execution
issues, and ownership of Stock Connect securities.
Equity Risk: Individual security level prices on equity markets may fluctuate namely pursuant to investor's expectations or anticipations, causing high potential volatility. Volatility on equity markets has historically been much greater than the volatility of fixed
income markets. Should the price of equities fall within the portfolio, the portfolio’s total value will also fall.
Liquidity & Counterparty Risk: Low liquidity under certain market conditions might lead the portfolio to face difficulties valuing, purchasing, or selling all/part of its assets and result in potential impact on the portfolio’s value. Bankruptcy, insolvency, or
payment/delivery failure of any of the counterparties used by the investment manager, may lead to a payment or delivery default.
Market Risk: Some markets in which the strategy may invest may prove at times to be highly volatile or insufficiently liquid. This may affect significantly the market price of securities and, therefore the portfolio value.
Operational Risk: Operational processes, including those related to the safekeeping of assets may fail, resulting in losses.
AXA IM Sustainable Equity
Main risks
AU202001- 15509

AXA IM Sustainable Equity has received Silver Morningstar Analyst Rating™ as of 21/4/2020. © 2020 Morningstar, Inc. All rights reserved. Neither Morningstar, its affiliates, nor the content providers guarantee the data or content contained herein to be accurate,
complete or timely nor will they have any liability for its use or distribution. Any general advice or ‘class service’ have been prepared by Morningstar Australasia Pty Ltd (ABN: 95 090 665 544, AFSL: 240892) and/or Morningstar Research Ltd, subsidiaries of
Morningstar, Inc, without reference to your objectives, financial situation or needs. Refer to our Financial Services Guide (FSG) for more information at www.morningstar.com.au/s/fsg.pdf. You should consider the advice in light of these matters and if applicable, the
relevant Product Disclosure Statement before making any decision to invest. Our publications, ratings and products should be viewed as an additional investment resource, not as your sole source of information. Past performance does not necessarily indicate a
financial product’s future performance. To obtain advice tailored to your situation, contact a professional financial adviser.
The Zenith Investment Partners (ABN 27 103 132 672, AFS Licence 226872) (“Zenith”) rating (assigned 27 November 2019) referred to in this document is limited to “General Advice” (s766B Corporations Act 2001) for Wholesale clients only. This advice has been
prepared without taking into account the objectives, financial situation or needs of any individual and is subject to change at any time without prior notice. It is not a specific recommendation to purchase, sell or hold the relevant product. Investors should seek
independent financial advice before making an investment decision and should consider the appropriateness of this advice in light of their own objectives, financial situation and needs. Investors should obtain a copy of, and consider the PDS or offer document
before making any decision and refer to the full Zenith Product Assessment available on the Zenith website. Past performance is not an indication of future performance. Zenith usually charges the product issuer, fund manager or related party to conduct Product
Assessments. Full details regarding Zenith’s methodology, ratings definitions and regulatory compliance are available on our Product Assessments and at http://www.zenithpartners.com.au/RegulatoryGuidelines
The Lonsec Rating (assigned – January 2020) presented in this document are published by Lonsec Research Pty Ltd ABN 11 151 658 561 AFSL 421445. The Rating is limited to “General Advice” (as defined in the Corporations Act 2001 (Cth)) and based solely on
consideration of the investment merits of the financial product. Past performance information is for illustrative purposes only and is not indicative of future performance. It is not a recommendation to purchase, sell or hold AXA Investment Management product, and
you should seek independent financial advice before investing in these products. The Rating is subject to change without notice and Lonsec assumes no obligation to update the relevant documents following publication. Lonsec receives a fee from the Fund Manager
for researching the product using comprehensive and objective criteria. For further information regarding Lonsec’s Ratings methodology, please refer to our website at: http://www.lonsecresearch.com.au/research-solutions/our-ratings
The RIAA Certification Symbol signifies that a product or service offers an investment style that takes into account environmental, social, governance or ethical considerations. The Symbol also signifies that the AXA IM Sustainable Equity Fund has adopted strict
disclosure practices required under the Responsible Investment Certification Program for the category of Product Provider. The Certification Symbol is a Registered Trade Mark of the Responsible Investment Association Australasia (RIAA). Detailed information about
RIAA, the Symbol and AXA Investment Managers methodology, performance and stock holdings can be found at www.responsibleinvestment.org together with details about other responsible investment products certified by RIAA. The Responsible Investment
Certification Program does not constitute financial product advice. Neither the Certification Symbol nor RIAA recommends to any person that any financial product is a suitable investment or that returns are guaranteed. Appropriate professional advice should be
sought prior to making an investment decision. RIAA does not hold an Australian Financial Services Licence.
Important Disclaimers:
37AU202001- 15509

Backtests: Please see the detailed backtest disclosure provided, where applicable.
Characteristics: Please note that in this report, the specified benchmark excludes certain benchmark constituent securities that Rosenberg Equities deems not to have sufficient publicly available accounting data for valuation purposes. As such, please note that the “benchmark” portfolio characteristics shown are calculated in good faith by Rosenberg Equities based on an adjusted benchmark and may, therefore, deviate from the characteristics of the unadjusted benchmark. Price/earnings data forecast is based on IBES 1-year forward earnings estimates. Dividend yield is not guaranteed and will change in the future. Premia and discounts represent the ratio of fund exposure to benchmark exposure. For example, if the benchmark has a forward earnings yield of 8% andthe fund 9.5%, the premium is 19%, or (9.5% - 8%) / 8% = 19%. No representation is made that Rosenberg Equities will achieve the objectives and characteristics set forth in this presentation.
ESG: Consideration of ESG factors may limit the types and number of investment opportunities available. Under certain market conditions, an ESG integrated portfolio may underperform strategies that do not consider ESG factors. ESG considerations may also affect the portfolio’s relative investment performance depending on whether affected sectors or investments are in or out of favor at any given moment. In addition, we may be unsuccessful in creating a portfolio exhibiting more positive ESG characteristics and/or which assigns more weight to such companies. Where referred to in the presentation, “ESG Score” refers to an AXA IM internal and proprietary scoring methodology developed by AXA IM’s Responsible Investment Team which reflects a company’s performance across a range of environmental (E), social (S), and governance (G) criteria. An ESG Score may not be available for all of the assets in AXA IM’s universe. It applies a floor at 0 (worst) and a cap at 10 (best).
Exposures: Industry exposures are based on Rosenberg Equities internal industry classifications. Sector exposures are based on MSCI classifications.
Proprietary Rosenberg Factor Definitions:
Rosenberg Quality: Combines Rosenberg Equities’ proprietary Earnings Sustainability and Change in Earnings Sustainability models as of the date shown in the relevant slide.
Rosenberg Value: Combines Rosenberg Equities’ proprietary valuation and earnings forecast models as well as a ‘value trap’ filter based on predicted short-term volatility as of the date set forth in the relevant slide.
Rosenberg Momentum: Combines price momentum with analyst revisions and a natural language processing news sentiment measure as of the date set forth in the relevant slide.
Simple Factor Definitions:
Low Volatility: We measure a stock’s volatility relative to the market (its beta) and stock-specific risk over the long term (5-year horizon).
Quality: We measure simple Return on Equity (RoE).
Value: Within the value spectrum we use two key value measures: price-to-book and price-to-recurring earnings. In this way, we hope to capture the varying flavours of value investing, acknowledging that they do not always perform in unison.
Momentum: We measure trailing price momentum of a security relative to its local market over the last year, ignoring the most recent month to reduce the effect of short-term price reversal
Fees: Returns, except where indicated otherwise, are gross of management fees. An investor’s actual return will be reduced by management fees and other expenses the investor may incur. Further information on AXA Rosenberg Investment Management LLC’s fees may be found in its Form ADV Part 2 and/or provided upon request. The collection of management fees produces a compounding effect on the total rate of return net of management fees. As an example, the effect of management fees on the total value of an investor’s portfolio assuming a) quarterly fee assessment, b) $1,000,000 investment, c) portfolio return of 8% a year, and d) 1.00% annual investment management fee would be $10,416 in the first year, and cumulatively $59,816 over five years and $143,430 over ten years. Past performance is not a guide to future performance.
Important information (Page 1)
G201910 - 14311
40
Filter: Volatility is based on a Rosenberg Equities measure which combines beta and stock specific risk. Earnings quality is based on a Rosenberg Equities’ measure of earning sustainability. Screening levels are based on square root of market cap to limit individual stock impact. The stock examples provided are for illustrative purposes only. No representation is made that these examples are past or current recommendations, nor whether they were successful or not. Any stock examples specifically identifiedin these materials do not represent all of the securities purchased, sold or recommended for the client’s accounts. It should not be assumed that investment in the stock examples referenced will be profitable.
Funds: Investment in particular funds, where referenced, is subject to the funds’ offering documents. The funds listed may not be available for sale in your jurisdiction. Please contact AXA IM for further information. Any descriptions set forth represent ourbroad strategy and approach only and may not equate to the stated investment objective as per the prospectus. No assurance is made that these features will be achieved.
Morningstar: Morningstar rankings reflect the performance of a fund relative to its competitors in the relevant Morningstar category. The rankings are not indicative of future performance, nor any investor’s specific experience.
Organizational Charts: All organizational charts, where present, are simplified. For more detailed information, please contact AXA IM.
Our Investment Philosophy and Process: No representation is given that Rosenberg Equities’ ability to identify companies with superior earnings (or that being able to do so generally) equates to outperformance over a benchmark. Rosenberg Equities reserves the right to modify any of the procedures, processes or controls described at its discretion. The information described is as of the date of this presentation.
Overlapping Time Periods: Where applicable, backtested performance and live track records should each be evaluated by investors separately. The live track record indicates the performance of the strategy as our investment process existed (and evolved) during the timeframe shown. However, the backtested returns utilized the investment process in place as of the date such returns were calculated (i.e. the “current” investment process” as applied retroactively to the entire time period shown. Where periodsare overlapping between the backtested and live returns, deviation in returns should be expected. As such, new investors to the strategy should be aware that backtested performance and the live track record are not necessarily equivalent or comparable. Going forward, while our current (or then-current) investment process always represents our best ideas at a particular point in time, actual portfolio performance could be better, worse, or remain the same.
Representative Accounts: Representative accounts are chosen on the basis of having adequate assets under management and an investment setup that is typical of other portfolios in the strategy so as to effectuate a fair and accurate comparison. An investor’s experience may vary.
Returns: Unless otherwise stated, returns do not include transactions costs and are gross of fees.
Sharpe Ratio: Sharpe Ratios are based on a simplified measure that calculates Total Return/Total Volatility and does not include any adjustment for the risk-free rate of return.
Stock Examples: Any stock examples specifically identified in these materials do not represent all of the securities purchased, sold or recommended for any investor’s account. It should not be assumed that investment in the stock examples referenced will be profitable.
Strategy: The investment objectives and/or features set forth above illustrate our strategy and approach only. Each specific investor’s experience may vary. No assurance is made that these investment objectives and/or features will be achieved.
Trading Costs: Historical trading costs may not persist into the future. No representation is made regarding future trading costs.
Universe: Rosenberg Equities has fundamental data for, and is actively valuing, approximately 23,000 companies globally as of the date of this presentation. This figure varies depending on the overall number of companies that are in existence and listed at any point in time. Where an alternative number of securities is referenced, the reference is to a subset of the global universe.
Volatility & Earnings Sustainability: Volatility and Earnings Sustainability are proprietary Rosenberg Equities measures. Where the investment universe is divided into buckets, the division is as follows: low = bottom 30%, middle = next 40%, high = top 30% of names within each region each month over the specific time period shown. These buckets are formed with square-root of market cap weights and are not necessarily controlled for small cap bias nor investability.
Important information (Page 2)
G201910 - 14311
41
This performance information was derived from hypothetical backtesting of the AXA Investment Managers’ Sustainable Equity strategy and/or AXA Investment Managers’ Sustainable Equity strategy for the period(s) indicated elsewhere in this presentation. The investment strategy was not available to clients during the backtest period (or a portion thereof)
Backtesting is conducted by a computer program that starts on the first day of the backtest period and estimates the return that the strategy would have achieved if the output from the Sustainable Equity screening and portfolio process, as relevant, had been fully implemented. The performance data shown has not been verified by an independent calculation agent. The actual strategies that will be made available to investors going forward may use different trading frequencies than was used in the backtests, and the universe of securities that will be used in an actual portfolio may not reflect the universe of securities used in these backtests.
The selection universe used during the strategy backtesting was the MSCI World Standard Index. Backtested portfolios were rebalanced quarterly and a 100% fill rate was assumed.
For Sustainable Equity portfolios AXA Investment Managers ESG opinion data was used to up- or down-weight individual holdings so as to produce an Sustainable Equity portfolio that has the objective of improving the ESG profile of the backtested portfolio along dimensions selected and measured by the AXA Investment Managers’ SRI team while broadly maintaining the investment characteristics of the underlying Sustainable Equity strategy. ESG opinion data used in backtesting typically has been refreshed once per year, and ESG data coverage may have been unavailable or varied over time for a significant proportion of the selection universe during the backtest period in question.
Backtested performance (including other characteristics) does not represent actual performance and should not be interpreted as an indication of such performance. Actual performance for client accounts may be materially lower than backtested performance because the latter is achieved through the retroactive application of model portfolios designed with the benefit of hindsight. As a result, the models theoretically may be changed from time to time and the effect on performance results could be either favorable or unfavorable. Additional reasons why backtested performance may differ from actual results include the following: (1) backtested performance was achieved by means of retroactive application of a systematic process constructed on the basis of historical data; (2) backtested performance does not include the effect of any material economic and market factors that might have an effect on an investment adviser’s decision-making process if the adviser were actually managing clients’ money; (3) backtesting does not factor in any intervention (whether in a positive or negative manner) which may be made by AXA Investment Managers’ investment team with an actual portfolio over time; (4) backtests are adjusted to reflect the reinvestment of dividends and other income and are gross of fees and do not reflect transaction costs, custody fees, market impact, security liquidity, actual trading fill rates, and other material factors that may affect actual performance and characteristics; and (5) the actual strategy that will be made available to investors going forward may use different trading frequencies and a different universe of securities than was used in the backtest. Backtested data representing output from a research project may differ from actual account performance and characteristics because the investment strategy may be adjusted at any time, for any reason, and can continue to be changed until desired or better results are achieved. Since trades have not actually been executed, results may haveunder- or over-compensated for the impact, if any, of certain market factors, such as lack of liquidity. No cash balance or cash flow is included in the calculation.
In addition, the historical dataset used in the simulation contains information that may not have been available to AXA Investment Managers in real time during the simulation period, such as data errors that have been discovered and corrected and/or changes resulting from research enhancements to AXA Investment Managers’ investment models or processes.
As with any investment strategy, there is the potential for profit as well as the possibility of loss. The firm does not guarantee any minimum level of investment performance or the success of any portfolio or investment strategy. All investments involve risk and investment recommendations will not always be profitable. Past performance does not guarantee future results.
The backtested performance shown is gross of management fees. An investor’s actual return will be reduced by management fees and other expenses the investor may incur. Past (or backtested hypothetical) performance does not equate to future performance. Further information on the firm’s fees may be found in its Form ADV Part 2 (for US investors) or provided upon request. The collection of management fees produces a compounding effect on the total rate of return net of management fees. As an example, the effect of management fees on the total value of an investor’s portfolio assuming a) quarterly fee assessment, b) $1,000,000 investment, c) portfolio return of 8% a year, and d) 1.00% annual investment management fee would be $10,416 in the first year, and cumulatively $59,816 over five years and $143,430 over ten years.
Important backtest disclosures
Sustainable Equity Strategy
G201708 - 1514
This communication is for professional/institutional investors only and must not be relied upon by retail investors. Any reproduction/redistribution of this information is prohibited.
This material is published for informational purposes only and is neither an offer to enter into, or a term or condition of any business or agreement with the recipient or any other party, nor is it a solicitation for any services, securities, or funds herein, nor is it intended to provide investment, tax, or legal advice. If this material refers to funds, investments made therein are subject to the relevant fund documents. This material is not intended for distribution to persons or in jurisdictions where prohibited. No representation is made that any of the services, securities, or funds herein are suitable for any particular investor, and therefore, any prospective investor should consult their financial or other advisors about the appropriateness thereof. No representation or warranty is given as to the accuracy or completeness of this material. Investments may decrease in value and that past or backtested performance is no guide to future performance. Forward-looking or simulated data or information herein are subject to inherent limitations and are based upon assumptions that may not materialize, and may vary significantly from actual results. Investment models, research, and risk controls described herein do not guarantee against loss of principal or that any investmentobjectives shown herein will be achieved. The data, projections, forecasts, anticipations, hypotheses and/or opinions herein are subjective, and are not necessarily used or followed by the firm or its affiliates who may act based on their own opinions and as independent departments or entities within the organization. This information is always subject to change and all rights are reserved thereof. Performance shown, unless otherwise stated, is gross of management fees. An investor’s actual return will be reduced by management fees and other expenses the investor may incur.
The firm seeks to achieve its clients’ investment objectives primarily through reliance on the modelling of proprietary and 3rd party financial and non-financial data, information, and considerations, the sources, weights, and implementation of which may be subject to change and/or the discretion of the firm regardless of whether described herein or elsewhere. Although many of its investment approaches are driven by bottom-up stock selection akin to that of a traditional fundamental investor, the firm seeks to achieve its clients’ investment objectives primarily in reliance on analytical models. The goal of the firm’s systematic approach is not to replicate a perfect “model” portfolio; instead, like other long-term, fundamentally oriented investors, it seeks to create portfolios possessing ex ante those fundamental and statistically important characteristics reflecting our investment beliefs. The firm’s ability to implement its investment objectives depends on various considerations such as the models’ economic, analytical and mathematical underpinnings, the accurate encapsulation of those principles in a complex computational (including software code) environment, the quality of the models’ data inputs, changes in market conditions, and the successful expression of the models' views into the investment portfolio construction process. Many of these have subjective elements that present the possibility of human error. While the investment process principally relies on models, the firm’s process also incorporates the investment judgment of its portfolio managers who may exercise discretion in attempting to capture the intent of the models, particularly in changing market conditions. The firm’s success in implementing its investment objectives may depend on the ability of portfolio managers and others to interpret and implement the signals generated by the models. The firm has established certain systematic rules and processes for monitoring client portfolios to ensure that they are managed in accordance with their investment objectives, but there is no guarantee that these rules or processes will effectively manage the risks associated with its investment process under all market conditions. While the firm employs controls designed to assure that our models are sound in their development and appropriately adapted, calibrated and configured, analytical error, software development errors, and implementation errors are an inherent risk of complex analytical models and quantitative investment management processes. These errors may be extremely hard to detect, and some may go undetected for long periods of time or indefinitely. The firm’s controls, including our escalation policies, are designed to ensure that certain types of errors are subject to review once discovered. However, the effect of errors on our investment process and, where relevant, performance (which can be either positive or negative) may not be fully apparent even when discovered. When the firm discovers an investment process error in one of its models, itmay in good faith and in accordance with its obligations, decide not to correct the error, to delay correction of an error, or develop other methodology to address the error, if not inconsistent with the client’s interests. Also, the firm generally will not disclose to affected clients investment process errors that are not the result of a contractual or regulatory breach, or that are non-compensable, unless it otherwise determines that information regarding the error is material to its clients.
If MSCI information appears herein, it may only be used for your internal use, it may not be reproduced or re-disseminated in any form, and it may not be used as a basis for, or a component of, any financial instruments or products or indices. None of the MSCI information is intended to constitute investment advice or a recommendation to make (or refrain from making) any kind of investment decision and may not be relied on as such. Historical data and analysis should not be taken as an indication or guarantee ofany future performance analysis, forecast or prediction. The MSCI information is provided on an “as is” basis and the user of this information assumes the entire risk of any use made of this information. MSCI, each of its affiliates and each other person involved in or related to compiling, computing or creating any MSCI information (collectively, the “MSCI Parties”) expressly disclaims all warranties (including, without limitation, any warranties of originality, accuracy, completeness, timeliness, non-infringement, merchantability and fitness for a particular purpose) with respect to this information. Without limiting any of the foregoing, in no event shall any MSCI Party have any liability for any direct, indirect, special, incidental, punitive, consequential (including, without limitation, lost profits) or any other damages. (www.mscibarra.com).
Certain ESG data provided by and/or calculated using Trucost data. Trucost reserves all intellectual and other proprietary rights in Trucost data.
©2020 AXA Investment Managers. All rights reserved.
Global disclaimer
42
G201905 - 1830