Embed Size (px)
Citation preview

Please cite: Phys. Chem. Chem. Phys., 2013, 15, 8506-8519
1
This document represents the final manuscript submitted prior to publication. Please cite the published work:
O. L. G. Alderman, A. C. Hannon, D. Holland, S. Feller, G. Lehr, A. J. Vitale, U. Hoppe, M. v Zimmermann, A. Watenphul,
Phys. Chem. Chem. Phys., 2013, 15, 8506-8519, DOI: 10.1039/C3CP51348C
Please cite: Phys. Chem. Chem. Phys., 2013, 15, 8506-8519
2
Lone-Pair Distribution and Plumbite Network
Formation in High Lead Silicate Glass,
80PbO.20SiO2 †
Oliver L. G. Alderman,a Alex C. Hannon,b Diane Holland,a Steve Feller,c Gloria
Lehr,c Adam Vitale,c Uwe Hoppe,d Martin v. Zimmerman,e Anke Watenphule
a. Department of Physics, University of Warwick, CV4 7AL, UK b. ISIS Facility, Rutherford Appleton Laboratory, Chilton, Didcot, Oxon OX11 0QX, UK
c. Physics Department, Coe College, Cedar Rapids, IA 52402, USA d. Institut für Physik, Universität Rostock, 18051 Rostock, Germany
e. Deutsches Elektronen-Synchrotron DESY, Notkestrasse 85, D-22603 Hamburg, Germany
Abstract
For the first time a detailed structural model has been determined which shows how the lone-pairs
of electrons are arranged relative to each other in a glass network containing lone-pair cations. High
energy x-ray and neutron diffraction patterns of a very high lead content silicate glass
(80PbO.20SiO2) have been used to build three-dimensional models using empirical potential
structure refinement. Coordination number and bond angle distributions reveal structural similarity
to crystalline Pb11Si3O17 and α- and β-PbO, and therefore strong evidence for a plumbite glass
network built from pyramidal [PbOm] polyhedra (m~3-4), with stereochemically active lone-pairs,
although with greater disorder in the first coordination shell of lead compared to the first
coordination shell of silicon. The oxygen atoms are coordinated predominantly to four cations.
Explicit introduction of lone-pair entities into some models leads to modification of the local Pb
environment, whilst still allowing for reproduction of the measured diffraction patterns, thus
demonstrating the non-uniqueness of the solutions. Nonetheless, the models share many features
with crystalline Pb11Si3O17, including the O-Pb-O bond angle distribution, which is more highly
structured than reported for lower Pb content glasses using reverse Monte Carlo techniques. The
lone-pair separation of 2.85 Å in the model glasses compares favourably with that estimated in α-
PbO as 2.88 Å, and these lone-pairs organise to create voids in the glass, just as they create channels
in Pb11Si3O17 and interlayer spaces in the PbO polymorphs.
† Electronic supplementary information (ESI) available: Full experimental details: X-ray diffraction; Neutron diffraction;
EDX measurements. Total scattering formalism. Neutron and x-ray diffraction from a vitreous SiO2 standard. Additional
EPSR modelling results: Partial pair interference functions; Low Q neutron and x-ray distinct scattering functions;
coordination number histograms; Oxygen speciation within Pb11Si3O17. Linking the silicate Qn speciation to the fraction of
plumbite oxygen. X-ray differential correlation function.

Please cite: Phys. Chem. Chem. Phys., 2013, 15, 8506-8519
3
Introduction
A clear picture of the role of lone-pairs (LPs) of electrons in a glass is important for an understanding
of non-linear optical (NLO) properties,1-2 and their location in the network is of interest from a
fundamental structural point of view.3 However, the location of LPs in a structure cannot be
measured directly, but has to be derived indirectly from other structural information. Therefore it is
necessary to build up a comprehensive model of the structure of a material in order to infer the
location of the LPs, and this is what we have done for a lead silicate glass with an extremely high
lead content.
The results from numerous studies (using diffraction,4-15 Pb LIII edge EXAFS,16-18 ESR,19 29Si MAS
NMR,14, 20-23 207Pb NMR,16, 22, 24-25 XPS,26-29 vibrational spectroscopy23, 30-34 and molecular dynamics18, 35-
41) show that most, if not all, Pb2+ cations in lead silicate glasses exist in environments similar to
those found in the known crystalline silicates42-47 and monoxides48-49 of lead. That is, they have an
occupied non-bonding or LP orbital, and a low coordination number of three or four oxygens
distributed anisotropically about the lead cation. Such low coordination to oxygen is associated with
a larger degree of covalency in the Pb-O bonds and these types of [PbOm] units (m~3-4) are
conducive to the formation of a glass network.50
Rapid twin-roller quenching has recently been used to prepare lead silicate glasses with up to
83 mol% PbO,23 which is well beyond the conventional glass-forming limit of 67 mol% PbO, at which
the silicate network is completely depolymerised into monomeric Q0 species ([SiO4]4- anions). For
lead silicate glasses to form beyond this limit, there must be a Pb-O based plumbite subnetwork
containing ‘plumbite’ oxygen atoms bonded only to Pb2+, and PbO is therefore considered as an
intermediate oxide, between glass-modifying and glass-forming oxides.51 There is evidence from
both x-ray photoelectron28-29 (XPS) and 29Si MAS NMR22-23 spectroscopies that plumbite oxygens exist
in lead silicate glasses from as little as 50 mol% PbO.
The occurrence of glasses with PbO contents beyond the conventional glass-forming limit raises the
important fundamental structural question of how the [PbOm] polyhedra connect together to form
the plumbite subnetwork, and in particular how the LPs are arranged; simplistically one might expect
an avoidance of close proximity between these centres of negative charge. On the basis of a Reverse
Monte Carlo (RMC) simulation of x-ray and neutron diffraction data for lead silicate glasses
containing 34, 50 and 65 mol% PbO,12, 15 it has recently been concluded that lead silicate glasses
contain a large amount of ‘free volume’, in comparison to sodium or calcium silicate glasses.
However, the role of the stereochemically active electron lone-pairs on the Pb2+ ions, particularly in
relation to the free volume, was not considered. A different structural model for lead silicate glasses
has been proposed by Takaishi et al.,14 in which the Pb cations are present predominantly as PbO3
trigonal pyramids, which are interconnected by edges to form Pb2O4 moieties, and have opposed
orientations arising from steric repulsion between their respective electron lone-pairs. Whether or
not a three-dimensional space-filling model, with the correct atomic number density, can be
constructed based on such motifs was not addressed.
Diffraction is a key experimental technique for the investigation of glass structure,52 but lead-
containing glass presents particular difficulty due to the very high absorption of x-rays by Pb. This
difficulty may be overcome by performing x-ray diffraction using high energy x-rays at a synchrotron

Please cite: Phys. Chem. Chem. Phys., 2013, 15, 8506-8519
4
source, but the results are very strongly dominated by the contribution from the Pb. Thus an
investigation of lead silicate glasses by x-ray diffraction alone is rather insensitive to oxygen and to
the silicate part of the network. On the other hand, neutron diffraction is much more sensitive to
oxygen in particular, and hence a combined study using both high energy x-ray diffraction and
neutron diffraction is much more informative about the detailed glass structure.
In contrast to perfect crystals, no unique solution exists for the structure of an amorphous material,
and hence modelling techniques are required to characterise the structure. For example, classical
molecular dynamics (MD) has been used to predict the structure of lead silicate glasses.18, 35-41
However, all of the interatomic potentials employed are inappropriate for the treatment of the
highly polarisable Pb2+ cation, which interacts anisotropically if the electron lone-pair has p-character
and is stereochemically active.35 An alternative to structure prediction by MD is to use an empirical
approach, such as RMC,53 in which the atoms in a model are moved so as to optimise the agreement
with experimental diffraction data. A difficulty of the RMC method is that the simulation results
depend on the initial model, so that the final structure is essentially a refinement of the original
configuration and still has many of the same topological properties.54 Instead we have used the
related technique of empirical potential structure refinement (EPSR) to investigate the local
geometrical arrangement of oxygen about Pb2+ cations, and also the way in which the [PbOm]
polyhedra interconnect and the corresponding disposition of the electron LPs. In the EPSR approach,
the potential between the atoms in the model is adjusted to optimise the agreement with diffraction
data,55 and hence the structural model obtained is less dependent on the assumptions used to form
the initial model.
Pure lead monoxide glass has never been obtained, but binary oxide glasses, with general formula
xPbO.(100 - x)MaOb, can be obtained over wide ranges of PbO concentration. Heavy-metal oxide
(HMO) glasses1 include those with >50 cation % Pb and have wide ranging technological applications.
For example HMO glasses are typified by large infrared transmission windows, low working and glass
transformation temperatures, and high refractive indices and higher order electric susceptibilities
due to the large polarisabilities and hyperpolarisabilities of heavy-metal cations. Hence HMO glasses
find application as low loss fibres, glass solders, and NLO materials, as well as radiation shields and
hosts for scintillating inclusions.1 We report a combined high energy x-ray diffraction and neutron
diffraction study of the structure of a glass of composition 80PbO.20SiO2, made by rapid twin-roller
quenching.56 This composition is chosen to be near to the high PbO limit for glass formation by this
method, and the results obtained are complementary to the multispectroscopic results obtained by
Feller et al.23 for lead silicate glasses with a wide range of composition, which are sensitive to the
silicate subnetwork, but do not provide information on the disposition of the LPs.
Experimental
Glass Preparation and Characterisation
Powders of PbO (Aldrich, 99.9+ %) and SiO2 (Aldrich, 99.6 %) were mixed in quantities to yield 10 g
batches of glass with a PbO:SiO2 molar ratio of 4:1. The mixtures were placed in pure platinum
crucibles in an electric furnace held at 1000oC for 20 minutes. After this period, the mass loss was
recorded and the crucibles replaced into the furnace for an additional 10 minutes. The liquids were

Please cite: Phys. Chem. Chem. Phys., 2013, 15, 8506-8519
5
vitrified using rapid twin-roller quenching (estimated cooling rate 105 K/s).57 The resultant flakes
of translucent glass were yellow-gold in colour.
Density measurements (Table 1) were made using helium gas in a Quantachrome Micropycnometer
and glass composition was measured using energy dispersive x-ray spectroscopy (EDX) in a Zeiss
SUPRA 55-VP FEG SEM operating at an accelerating voltage of 20 kV. Glass composition was
estimated in several additional ways (Table 1): i) from PbO mass loss during melting, ii) by
extrapolating from literature density values,58-59 iii) by requiring that the Si-O coordination number
measured by neutron diffraction (ND) be 3.96 ± 0.05, in accord with the value measured for vitreous
silica (see ESI). All methods indicate a slightly lower PbO content than nominal, likely due to
volatilisation of PbO from the melt. The ND derived glass composition of 79.5 ± 0.5 mol% PbO will
be used in all subsequent analyses. EDX also ruled out significant levels (> 0.5 at.%) of impurity.
X-ray Diffraction
Wiggler beamline BW560 on the synchrotron radiation source DORIS III, HASYLAB at DESY, was used
for an x-ray diffraction measurement of the powdered glass, which was held inside a 1.5 mm
diameter silica glass capillary (20 μm wall thickness). Measurements of an empty capillary and the
empty instrument were made to allow removal of background scattering. The x-ray energy of
84.768 keV (wavelength 0.14626 Å), was optimised so as to minimise the photoelectric absorption
cross-section whilst avoiding fluorescence associated with the Pb K-edge at 88.0045 keV.61 Use of
such high energy x-rays also makes accessible a large maximum scattering vector magnitude,
Qmax = 23.62 Å-1, at the maximum scattering angle of 32.0o. Data were collected in three angular
ranges using different attenuators between sample and detector, owing to the form factor
dependence of x-ray signal, and to ensure that the count rate in the Ge detector did not greatly
exceed 5 x 10⁴ counts per second. All sets of data were combined after omission of bad points,
dead-time correction, normalisation to the incident beam monitor counts, correction for the
geometrical arrangement of the detector and sample and scaling as required for datasets for which
different levels of in-beam attenuation were used. A very small irregularity in the diffraction pattern
at 3.85 Å-1 is attributed to a crystallite, possibly of β-PbO49 (the (131) reflection), and was neglected
during analysis. A vitreous silica standard was also measured, see ESI.
Neutron Diffraction
A time-of-flight neutron diffraction measurement was made using the GEM62 diffractometer at the
ISIS Facility, Rutherford Appleton Laboratory, UK. The glass, in the form of small (few mm2) flakes,
was loaded into a thin (25 μm) walled vanadium can of internal diameter 8.3 mm. Data were
collected with sufficient statistics to justify use of a maximum scattering vector magnitude of
Qmax = 40.0 Å-1 for the Fourier transform. Measurements were also performed on an empty
vanadium can, the empty instrument, and an 8.34 mm diameter vanadium rod for normalisation
purposes and to allow for subtraction of background signals. A vitreous silica standard was also
measured, see ESI.
Structure Refinement
Empirical potential structure refinement (EPSR)63 is a method for generating physically reasonable
atomistic models of condensed amorphous systems which are consistent with total scattering

Please cite: Phys. Chem. Chem. Phys., 2013, 15, 8506-8519
6
measurements. It is related to the RMC53 method, but distinct in that it is based on a Monte Carlo
simulation using interatomic pair-potentials, with the constraints from the diffraction data imposed
as a perturbation on the starting reference potentials. The various constraints that must be imposed
during RMC modelling in order to ensure physically plausible models are therefore naturally included
in EPSR by way of the reference potential. Here four different models are derived, using slightly
different reference potentials, and will be referred to for simplicity as the: i) ionic model; ii) lone-pair
model; iii) Q0 model; and iv) Q0 + lone-pair model.
All four employ reference potentials consisting of standard Lennard-Jones plus Coulomb terms, but
the lone-pair models have the Pb introduced as pseudomolecular entities (dipoles), as a crude
means of representing a stereochemically active LP of electrons on all Pb sites. The Q0 models have
a minimum distance of approach64-65 for Si-Si pairs set at 3.5 Å in order to force complete
depolymerisation of the silicate part of the glass network. Table 2 lists the parameters of the
potentials used, and the Lennard-Jones well depths and radii follow from the Lorentz-Berthelot
mixing rules: εij = (εiεj)1/2 and σij = (σi + σj)/2. A prime has been used to denote the fact that the
parameters for the Pb atom must be modified in the presence of the lone-pair. The Pb’-LP
separation was set at rPb’LP = 1.0 Å, as calculated for α-PbO by lone-pair localisation methods.66-67
This was held essentially constant by setting the coefficient of the intramolecular potential energy68-
69 to a large value (1 x 10⁸ Å-1 a.m.u.-1/2), whilst setting the Pb’ and LP masses to be equal, to
maximise the reduced mass. In addition, minimum distances of approach were set64-65 at: 3.0 Å (Si-
Pb), 3.1 Å (Pb-Pb), 2.6 Å (Si-LP) and 2.7 Å (Pb’-LP, intermolecular). The Lennard-Jones, Coulomb and
empirical terms of the potentials were each smoothly truncated, as described by Soper.63, 70 A large
cut-off radius of 16 Å was required due to long-range, real-space oscillations of the Pb-Pb partial pair
distribution. Models were composed of 4400 atoms (2400 O, 400 Si and 1600 Pb or Pb’-LP) inside a
cubic box with periodic boundary conditions and edge length L = 42.92 Å, derived from the
measured atomic number density (Table 1). A starting model was obtained by successive NVT
Monte Carlo equilibrations of the system under the reference potential, at 1300 K, 600 K and finally
300 K, before the empirical potential refinement began. Structural parameters and their
distributions are reported as averages over many (> 103) configurations of the models as they
fluctuate about the final equilibrium energy, at which the scattering cross-sections of model and
experiment are in good agreement. The maximum allowed amplitude of the empirical potential was
210 kJ mol-1, in the ionic and Q0 models, and 164 kJ mol-1 in the lone-pair models.
Results
Distinct Scattering and Correlation Functions
The program GudrunX71-72 was used to correct the x-ray data for the effects of polarisation,
absorption and multiple scattering, removal of backgrounds, normalisation using the Krogh-Moe73
and Norman74 method, and extraction of iX(Q) by removal of the self-scattering (including the
Compton fraction) and sharpening according to equation 3 (ESI). A small residual background, slowly
varying with Q, was removed using the top hat convolution method.71, 75 The neutron diffraction
data were corrected, using the GudrunN72 software and the Atlas76 suite of programs, for
absorption, multiple scattering, inelasticity effects, backgrounds, and normalised to obtain iN(Q).
The distinct scattering functions iX(Q) and iN(Q) for the high lead glass are shown in Fig. 1. The high Q
regions show discernible oscillations out to at least 20 Å-1 for the x-ray function, and 35 Å-1 in the
Please cite: Phys. Chem. Chem. Phys., 2013, 15, 8506-8519
7
neutron case. The reason for the difference is partly due to the very high weighting of the Pb-Pb pair
term for x-ray diffraction, which is more strongly damped in Q-space than the O-O and Pb-O terms
which dominate the high Q region of the neutron iN(Q). The implication of this is that the
distribution of nearest neighbour Pb-Pb interatomic distances is broader than those for O-O and Pb-
O. This becomes clear by inspection of the real-space correlation functions, TR(r) (R = N or X), shown
in Fig. 2. Knowledge of the different x-ray and neutron weighting functions and of lead silicate
crystal structures42-47 allows the nearest neighbour peaks to be assigned in accord with previous
diffraction based studies on lead silicates.4-15 The peak corresponding to the Si-O bond length at
1.635(2) Å in TN(r) is practically negligible in TX(r), which shows a first clear peak at 2.23 Å, assigned
to short Pb-O bonds characteristic of asymmetric sites with stereochemically active lone-pairs. The
distribution of Pb-O bonds in TX(r) clearly extends further to the high r side, as has been observed for
silicate glasses with lower Pb concentrations by diffraction4-15 and EXAFS.16-18 Other contributions to
TX(r) below 3 Å are negligible. Above 3 Å, TX(r) shows very large amplitude oscillations about the
average scattering density TX,0(r), arising almost solely from the radial distribution of Pb-Pb atomic
separations, with the nearest neighbour Pb-Pb separation at 3.72 Å. Additionally a peak is
observed at 2.67 Å in TN(r), which arises from O-O distances within [SiO4] tetrahedra.
Correlation Function Peak Fits
Gaussian distributions, appropriately convolved with the Fourier transform of the Lorch M(Q)77 (see
ESI) were fitted to the low r peaks of TN(r). First the Si-O peak and the leading edge of the Pb-O
feature were fitted. The area of the Si-O peak yields NSiO, the coordination of silicon by oxygen, and
hence NOSi (equation 14, ESI) which, based on the assumption of a corner sharing tetrahedral silicate
subnetwork, can be used to predict the intratetrahedral ([SiO4]) coordination number, NOO = 3 NOSi,
and hence the peak area, AOO. Furthermore rOO = (8/3)1/2rSiO, based on ideal tetrahedral geometry.
The contribution of the intratetrahedral O-O separations to TR(r) can then be predicted, providing a
final assumption regarding the root mean square (RMS) deviation, <uOO2>1/2, is made, and, to good
approximation, the value is considered the same as that measured for pure vitreous silica (see ESI).
The residual obtained by subtracting the fitted Si-O, Pb-O and calculated O-O peaks from TN(r) shows
a peak at 2.42 Å which is assigned to longer Pb-O bonds. Although fitting of multiple symmetric
distributions to a clearly asymmetric Pb-O bond length distribution is somewhat arbitrary, it provides
a convenient means for its characterisation, and the average coordination numbers calculated from
the fits can be summed to give a total NPbO and hence NOPb. The four bond length distributions
derived from TN(r), suitably weighted and broadened for x-rays, were then subtracted from TX(r),
revealing a third contribution to the Pb-O distribution, centred at 2.65 Å. This was readily
resolvable from the extremely low weighted O-O pair term in the x-ray case, and was then finally
adjusted by allowing its parameters to vary in order to best fit TN(r). TX(r) in the region of its
strongest peak at 3.72 Å is strongly dominated by the Pb-Pb term and hence this peak was fitted
solely in terms of Pb-Pb distances (neglecting all other terms, including Pb-Si and Pb-O, as supported
by the crystal simulation, Fig. 3, see below). The results of the fitting are summarised in Table 3 and
illustrated in Fig. 3.
Glass Structure Models
The four EPSR derived glass structure models all yielded good fits to the diffraction data,63 with R-
factors (Table 4) close to 2 x 10⁻³. The fits are shown in Figs 4, S5 and S6 and Table 4 lists the total
Please cite: Phys. Chem. Chem. Phys., 2013, 15, 8506-8519
8
energies of the models, showing that the energy is significantly lowered by the introduction of the
lone-pairs (Pb’-LP dipoles). Fig. 4 compares the ionic and lone-pair model interference functions to
those measured by x-ray and neutron diffraction. The weighted partial pair interference functions
are also displayed, clearly demonstrating the negligible contribution, to the x-ray signal, of terms not
containing Pb and the extremely small contribution from the Si-Si terms to both x-ray and neutron
diffraction patterns. The main difference between the ionic and lone-pair models is visible in the O-
O pair term, particularly for Q < 16 Å-1. This is manifest in the gOO(r), Fig. 5, as a deviation between
the two model distributions at separations beyond the first (intratetrahedral [SiO4]) peak, and is
interpreted in terms of a modification of the local structure about the Pb atoms, due to LP
interactions.
Comparison to Crystalline Pb11Si3O17
It is useful to compare the structure of crystalline Pb11Si3O1745 which is close in composition
(78.57 mol% PbO) to the glass. The large unit cell, which contains 22 distinct Pb sites, makes for a
particularly rich comparison. The TR(r) simulated for the crystal using the XTAL program,78 along with
the appropriately weighted partial pair correlation functions, are shown in Fig. 3. They have been
broadened with the same real-space resolution functions as for the experimental results, and for the
effects of thermal motion using the RMS deviations in interatomic distances, <uij2>1/2, obtained by
peak fitting (Table 3), with a constant value <uij2>1/2 = 0.15 Å applied at larger distances in the cases
where the nearest neighbour value for <uij2>1/2 is less than 0.15 Å. These are approximations which
typically lead to over broadening of the nearest neighbour peaks if significant static disorder is
present in the crystal structure, such as for the Si-O peak, Fig. 3.
Discussion
High lead oxide glass studies
We consider the present structural study to be important, in that the 80 mol% PbO lead silicate has
the highest lead content (at.%) of any oxide glass studied to date, and is well beyond the
conventional glass-forming limit of 66.7 mol% PbO. The preceeding statement is justified as follows.
High lead oxide glasses from PbO-M2O3 systems such as the lead borates,79 aluminates80 and
gallates,81-82 contain a lower atom percentage Pb than the PbO-MO2 glasses, such as the silicates.
For example, at 80 mol% PbO, the MO2 glasses contain 36.4 at.% Pb whilst the M2O3 glasses contain
only 30.8 at.% Pb. An x-ray diffraction study on lead titanate glasses83 includes claims of a
composition of 90 mol% PbO, however, the laboratory x-ray diffraction data are of insufficient
quality to rule out Al2O3 contents (arising from crucible contamination) larger than those stated, and
the absence of a Pb-O peak in the radial distribution function was not explained. Takaishi et al.14
claimed to have studied an 89 mol% PbO lead silicate glass, however, their radial distribution
function is consistent with a much lower Pb concentration, estimated at 72 mol% PbO from their
reported glass density of 7.50 g/cm3. Combined with the fact that the authors14 do not take into
account apodization effects, their quoted coordination numbers are subject to large uncertainties.
An extremely dense (9.3 g/cm3) lead silicate glass, with as high as 96 mol% PbO, has been reported,84
but under the assumption that only a maximum of 4 mol% SiO2 entered the melt from the porcelain
crucible used. In attempting to replicate the results we obtained a lead aluminosilicate glass of
approximate composition 73PbO.17SiO2.10Al2O3, see ESI. There is also a report of silicate glass
formation at 91.2 mol% PbO,85 although the density is very similar to that measured for the

Please cite: Phys. Chem. Chem. Phys., 2013, 15, 8506-8519
9
80 mol% PbO glass of the present study and the refractive index reported is close to other reports58-
59 for glasses in the 60 to 70 mol% PbO range.
Short Range Order
Several key points can be made regarding the peak fit parameters, Table 3. Firstly, the data are
consistent with Si species which are four-fold coordinated to oxygen. The average NPbO = 3.77(2) is
close to four, whilst showing a distribution of bond lengths, similar to Pb11Si3O1745 (see Fig. 3). This is
in contrast to α-PbO,48 which contains highly uniform [PbO4] square pyramids, with a single Pb-O
bond length of 2.329 Å, and indeed to β-PbO,49 which contains distorted [PbO4] pyramids, with two
short ( 2.23 Å) and two longer (2.481 Å) bonds. The literature on lead silicate glasses, suggests that
NPbO and NSiO are approximately independent of glass composition and thus NOX (X = Si, Pb) must
change across the glass forming range. In the high lead glass, the average NOSi = 0.67(2) is less than
one, and this is independent evidence for some oxygen atoms being bonded only to Pb in the first
coordination shell, and the existence of a plumbite glass network. The total NOPb = 2.48(2) on the
other hand, is greater than two. The glass network is therefore not constructed with oxygen
coordinated to two cations, as in vitreous SiO2, for example, with the total NOX = 3.15(3).
The TR(r) of the glass and Pb11Si3O1745 crystal are similar at short range (Fig. 3) and the positions of
peaks in the partial pair correlation functions confirm the assignment of the peaks in the glass.
tPbO(r) (eqn (S11), (ESI†)) of the crystal does not drop to zero after the first maximum, as tSiO(r) does.
The residual after peak fitting to TN(r) for the glass, in the 3 Å region, can therefore be assigned to
the Pb-O and O-O partials, on the basis of the tij(r) simulated for the crystal, which amounts to
assuming similar Pb-O-Pb and Pb-O-Si bond angles.
Average coordination numbers, ijN (equation 15, ESI), calculated over the ensembles of model
configurations, are given in Table 5, along with their respective distributions (see also ESI Fig. S7). All
models contain the majority of lead in [PbO4] and [PbO3] polyhedra (r2 = 2.7 Å), see Fig. 6. Bond
angle distributions (BADs) for O-X-O and X-O-X triplets are displayed in Fig. 7. The O-Pb-O BAD is
broad and asymmetric, peaking close to 80o, but with a broad shoulder spanning the obtuse angle
region. This is remarkably similar to the distribution in the crystal Pb11Si3O17,45 and is therefore
characteristic of highly asymmetric [PbOm] polyhedra typical of Pb with sp3 or sp3d hybridisation and
stereochemically active electron lone-pairs occupying one orbital with greater p-character. For
comparison, the highly uniform [PbO4] pyramids found in α-PbO48 contain four O-Pb-O angles of
74.5o and two of 117.8o, whilst the more distorted [PbO4] pyramids of β-PbO49 have corresponding
angles of 76.8o (two), 80.0o (two), 90.3o (one) and 146.6o (one). That is, all three crystalline
compounds contain a preponderance of angles close to 80o, but with some larger angles, as is
necessary for [PbOm] pyramidal geometries with coordination number m > 3. Inspection of Fig. 6,
which shows part of a single model configuration, confirms that Pb atoms are highly off-centred
within their coordination polyhedra, and that these polyhedra display a distribution of different
distortions compared to ideal square or trigonal pyramids. It is also apparent (Fig. 6) that the [PbOm]
polyhedra often share edges with each other, and with [SiO4] tetrahedra, and that voids exist within
the plumbite network, which tend to be occupied by electron lone-pairs.
An inspection of the Pb11Si3O1745 crystal structure reveals that it too contains edge-sharing [PbOm]
units, as well as voids occupied by lone-pair electron density, manifest as channels along the ( 0 1 1 )

Please cite: Phys. Chem. Chem. Phys., 2013, 15, 8506-8519
10
direction, see Fig. 6. Such features also define the α-48 and β-PbO49 crystal structures, both of which
contain [PbO4] pyramids which share all of their edges, and within which voids are manifest as
extended two-dimensional layers (Fig. 6).
The first peak in gOO(r) (Fig. 5) at about 2.67 Å arises from [SiO4] tetrahedra, whilst the second peak,
at 3.0 to 3.1 Å, corresponds to intrapolyhedral O-O distances within the [PbOm]. The latter peak is
at a shorter distance in the lone-pair model, demonstrating that the polarisation of the Pb’-LP
moieties acts to push the oxygen atoms bonded to the Pb atom closer together than in the ionic and
Q0 models, in accord with VSEPR86-88 theory. This is manifest in the difference between the O-Pb-O
BADs of the four models (Fig. 7), where the lone-pair results in a larger proportion of smaller bond
angles, and hence a more well defined [PbOm] local geometry. There are striking differences
between the O-Pb-O BADs in Fig. 7 and that extracted by Kohara et al.,15 by RMC, for a lead silicate
glass containing 65 mol% PbO. The RMC derived O-Pb-O BAD is broader, extending from 50 to 180o,
with a poorly defined peak close to 60o. Despite differences in glass composition between the two
studies, this is suggestive that RMC and EPSR are capable of deriving qualitatively different models
that are both consistent with the same diffraction data sets; although we note that the real-space
resolution of our neutron diffraction data is higher. We plan to extend our study in the future to
allow a more direct comparison between models for glasses of the same compositions. A point in
favour of the EPSR approach is the qualitative similarity between the O-Pb-O BADs of the model
glass and the crystal Pb11Si3O17.45 The model Pb-O-Pb BADs are also similar to this crystal (Fig. 7). The
mean Pb-O-Pb angles (Table 4) are all close to 110o, similar to the 106.8o in Pb11Si3O17,45 whilst the
RMS deviations (Table 4) are slightly larger than the 9.3o of the crystal. Therefore there is a tendency
for the oxygen atom environment to be similar to the [OPb4] distorted tetrahedral geometry which is
present in α-PbO48 (mean angle 109.6o with RMS deviation 5.8o).
Oxygen may form bonds with more than one element giving [OSipPbq], and Table S2 of the ESI details
the speciation for crystalline Pb11Si3O17,45 as [OPbSi], [OPb2Si] and [OPb4] in approximately equal
proportions, when considering short Pb-O bonds only (r2 = 2.7 Å). When longer Pb-O bonds are
included (r2 = 3.27 Å), the majority of oxygen atoms are coordinated to four cations, either [OSiPb3]
or [OPb4]. A minority of the longer Pb-O bonds are to bridging oxygen atoms (i.e. [OSi2Pb] species).
The distributions of [OSipPbq] species in the glass models have not been quantified. Nevertheless,
their O-Si and O-Pb coordination number distributions are similar to those of the crystal (Table 5),
although slightly broader. Therefore it is likely that the distribution of [OSipPbq] species in the models
are also similar to those of the crystal (Table S2, ESI).
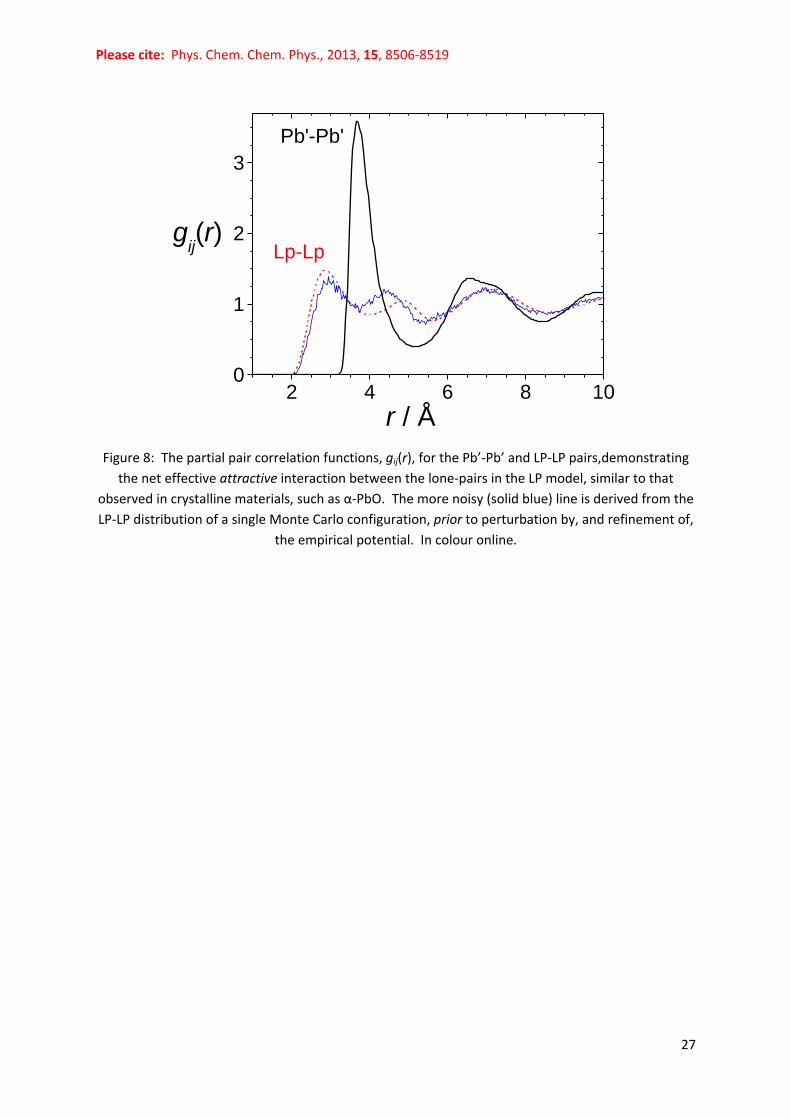
Fig. 8 shows the LP-LP partial pair correlation function, gLPLP(r), and the nearest neighbour LP-LP
distance at 2.85 Å is significantly lower than that for Pb’-Pb’ at 3.68 Å. Hence one can infer a net
‘effective attractive interaction’ between the negative poles of the Pb’-LP dipoles. In fact, if one
decorates the α-PbO48 crystal structure with lone-pairs (Fig. 6) by lone-pair localisation methods,66-67
one obtains a nearest neighbour distance rLPLP = 2.88 Å, corresponding to the distance between the
lone-pairs which fill the interlayer spaces of the crystal. Since the only LP-LP interaction term defined
by the reference potential during modelling was the repulsive Coulomb term, the ‘effective
attractive interaction’ is a direct consequence of the packing requirements of the system under the
specified density and the constraints arising from the other pairwise interactions, including
attractive (‘intermolecular’) Pb-LP forces. It is not imposed by the diffraction data via the empirical
potential because it is observed in the Monte Carlo simulations performed prior to the introduction

Please cite: Phys. Chem. Chem. Phys., 2013, 15, 8506-8519
11
of the data (Fig. 8) and empirical potential refinement. Hence we conclude that the free volume
found in RMC models of lead silicate glasses by Kohara et al.15 arises as a result of stereochemically
active lone-pairs in the glasses. Notably, the voids visible in Fig. 6, within the lone-pair model, are
less apparent in the ionic and Q0 models.
Although the O-X-O and Pb-O-Pb BADs of the glass models and Pb11Si3O1745 are similar, Fig. 7 shows
that the Si-O-Si BAD of the crystal resembles only those of the depolymerised, Q0 and Q0 + LP,
models. The crystal contains Q0, [SiO4]4-, monomers and Q1, [Si2O7]6-, dimers only, and it is the large
Si-O-Si bond angles of the dimers that comprise the BAD shown in Fig. 7. The large proportion of
smaller bond angles in the ionic and lone-pair models of the glass is indicative of more highly
polymerised silicate units. The reason for their existence is discussed in the following section, and
was the motivation behind the derivation of the depolymerised models.
Si Q-speciation and the uniqueness of the models
A problem with empirical modelling based on diffraction data occurs when a given species is
sufficiently dilute that some or all of its contributions to the distinct scattering are negligible with
respect to other terms. This is the case for the Si-Si pair term (Fig. 1) of the high lead silicate glass,
and is compounded by the relatively small atomic number and neutron scattering length of Si. Fig. 4
clearly illustrates the fact that the Si-Si terms are negligible for both radiation types. The result is
that the functions SSiSi(Q) and gSiSi(r) are effectively constrained only indirectly by the diffraction data,
and their structure arises primarily from the constraints of the average density and, in the case of
EPSR, the reference potentials. Hence SSiSi(Q) and gSiSi(r) are the most poorly determined pair terms.
A commonly discussed feature of the intermediate range order in silicate glasses is the Qn species
distribution, where n is the number of bridging oxygen atoms about a Si, or, equivalently, the
nearest neighbour Si-Si coordination number. 29Si MAS NMR has had a tremendous impact in this
field, since it is possible to estimate the Q-species distribution from the chemical shift distribution of
the spectrum. This technique has been applied to a series of lead silicate glasses,23 made in the
same manner as that reported here, and allows for an independent test of the empirically derived
glass structure models. Table 5 gives the Si-Si coordination number distributions (CNDs) of the
models, alongside the equivalent values derived from 29Si MAS NMR.23 It is clear that the ionic and
lone-pair models are over-polymerised with respect to the interpretation of the NMR data, and this
in turn implies that a larger fraction of oxygen is contained within the plumbite subnetwork of the
models than is indicated by the NMR measurements on the glass. It is these “plumbite oxygens”
which provide strong evidence for a plumbite subnetwork, i.e. regions of the glass in which the
connectivity involves only lead and oxygen. The abundance of these oxygen species is intrinsically
linked with the number of bridging oxygen atoms, and overpolymerisation of the silicate network
naturally leads to an overestimation of the plumbite oxygen fraction. This is clear in the O-Si
coordination number distributions of Table 5 where it can be seen that the (close to) complete
depolymerisation enforced in the Q0 and Q0 + LP models results in a smaller plumbite oxygen
fraction (oxygen bonded to zero silicon atoms) as compared to the ionic and lone-pair models, and
better agreement with the values derived from 29Si MAS NMR23 and for Pb11Si3O1745 (also see ESI,
Fig. S7).
Kohara et al.15 derived an RMC model of a lead silicate glass with 65 mol% PbO which is under-
polymerised compared to 29Si MAS NMR data14, 22-23 on glasses of the same composition. Interatomic

Please cite: Phys. Chem. Chem. Phys., 2013, 15, 8506-8519
12
potentials play no part in the RMC method, and hence it would appear that the over-polymerisation
of the EPSR models occurs as a result of Si clustering under the influence of the interatomic
potentials. This situation requires addressing, in both RMC and EPSR cases, and work is underway to
improve the models by introducing reference potential terms which act to drive them toward the
experimentally determined Qn species distributions. In the Q0 and Q0 + LP models, this was
achieved, using a crude but effective means, by forcing Si-Si pairs to be at least 3.5 Å apart. The
result is that the vast majority (97.9(7) %) of silicate anions exist as Q0 monomers (Table 5, ESI
Fig. S7). The remaining 2.1(7) % are present as Q1 dimers with large Si-O-Si bond angles, Fig. 7. The
fact that models with different Qn species distributions have similar R-factors (Table 4) demonstrates
the non-uniqueness of the model fits to the diffraction data, and emphasises the insensitivity of the
diffraction data to Si-Si correlations. However, it is important to note the robustness of other
features, particularly the Pb-O and Pb-Pb partial pair distribution functions (Fig. 5) and the O-Pb-O
and Pb-O-Pb BADs (Fig. 7). Comparing the ionic model to the Q0 model (Fig 5 and Table 5) shows
that the distributions of short (< 2.7 Å) Pb-O bonds and coordination numbers are unaffected, whilst
subtle changes occur within the longer (2.7 < r < 3.27 Å) bond length region, which effectively
compensate for the changes visible in the O-O term, resulting in slightly higher Pb-O coordination in
this region. Other changes concomitant with the change in Q-species distribution (ESI equations S16
to S18) occur in the O-X CNDs (Table 5, ESI Fig. S7) and in the Pb-Si pair distribution (Fig. 5), with the
depolymerisation of the silicate anions resulting in a higher Pb-Si nearest neighbour coordination
number.
Intermediate Range Order
The first sharp diffraction peak (FSDP) is a consequence of ordering on length scales beyond nearest
neighbour correlations. The distinct x-ray and neutron scattering functions (Fig. 1) both show this
clear, sharp peak at Q1 = 2.04(1) Å-1, as well as a pre-peak at Q0 = 1.06(1) Å-1, which is much more
clearly evident in iN(Q). Table 6 lists the positions and widths of the two peaks extracted by fitting of
Lorentzian lineshapes89 to their leading edges, along with their associated periodicities and
correlation lengths. It is clear from Fig. 4 that the FSDP arises predominantly from Pb-Pb
separations, and that the periodicity of 3.08(2) Å can be related to that of the x-ray TX(r) (Fig 2),
which is dominated by the Pb-Pb partial correlation function (Fig. 5). The extent of the real-space
oscillations, implied by the large correlation length of 19.6(6) Å, is most clearly evident in Fig. S8 of
the ESI which shows DX(r) = TX(r) - TX,0(r) out to 30 Å. Table 6 also lists the parameters of the FSDP of
vitreous silica,89 which has a larger periodicity (4.11(5) Å) and a shorter correlation length (10.0(3) Å)
associated with it. Therefore the plumbite glass network is characterised by greater medium range
order compared to the silicate network (of pure SiO2 glass). This appears to be a consequence of the
compact nature of the plumbite network, which is characterised by high oxygen-cation coordination
numbers, significant edge-sharing of [PbOm] units and the presence of sterically active electron lone-
pairs which organise to create voids in the glass network, see Fig. 6. These voids are typically
separated by single chains or layers of the plumbite network, with similar character (LP organisation)
to regions found within the related crystalline materials.
A pre-peak similar to that observed here has previously been observed by neutron diffraction from
high lead (≥ 50 mol% PbO) silicate glasses,10-12, 14-15 lying at approximately 1.2 Å-1, as well as from high
lead aluminate80 and gallate81-82 glasses. The partial structure factors extracted by modelling (Fig. 4,
ESI Fig. S4) indicate that the Si-O and O-O terms are the main contributors to the Q0 = 1.06(1) Å-1

Please cite: Phys. Chem. Chem. Phys., 2013, 15, 8506-8519
13
feature, and hence we conclude that it arises from the broad distribution of nearest-neighbour
distances between dispersed silicate anions, presumably those which are separated by chains or
layers of the plumbite network. The pre-peak has a longer periodicity than for the lower lead silicate
glasses that have been studied previously,10-12, 14-15 which is consistent with the more dilute silicate
anions having, on average, a larger separation. This average silicate anion-anion separation can be
calculated from glass density, ρ0, the atomic fraction of silicon, cSi, and the Qn distribution, giving 3/1
0Si
012
c
QQr
Q ,
which yields rQ(100% Q0) = 5.8 Å, rQ(100% Q1) = 7.3 Å and rQ(NMR) = 6.3 Å using the 29Si MAS NMR
derived23 Qn speciation (neglecting the 3% Q2). Although this approach neglects the size and shape
of the anions, the fact that rQ(NMR) is greater than the periodicity of 5.94(6) Å implies that the
silicate anions are inhomogeneously distributed within the glass. The fact that rQ(100% Q0) is less
than the periodicity (5.94(6) Å) is indirect evidence for residual polymerisation of the silicate
subnetwork, and the existence of Q1, or more highly polymerised, units. Indeed, this statement is
supported by the small shift in the position of the diffraction peak to higher Q ( 1.10 Å-1) in the Q0
model (ESI Fig. S6) which implies a periodicity of only 5.7 Å.
Interrogation of the ionic and lone-pair models, reveals that most (87 %) Pb atoms have a Si atom
within 4.2 Å (ESI Fig. S7) and rising to 93 % in the Q0 model (ESI, Fig. S7). Considering the
overestimation of the numbers of bridging (Si-O-Si) and plumbite (Pb-O-Pbq) oxygen in the former
two models, it is conceivable that at least one Si is required within the nearest neighbour cation shell
around each Pb to help stabilise the supercooled melt against crystallisation.
The limit of glass formation in the PbO-SiO2 system?
If there were no plumbite oxygens and no plumbite subnetwork, then the limit of glass formation
would be 66.7 mol% PbO, at which composition all oxygens are non-bridging and all silicate anions
are Q0 monomers. Since lead silicate glasses form beyond this limit, this raises the question of what
is it that limits glass formation, and similarly, why does a pure PbO glass not form? It is, however,
important to note that the limit of glass formation is not a precisely defined composition, because it
depends on the glass preparation method, and there are conflicting reports of the limit. For the
rapid twin-roller quenching method used to prepare our sample the limit of glass formation is
around 83 mol% PbO.23 On the one hand, Bansal and Doremus have given the upper limit of glass
formation by normal quenching as 74 mol% PbO90 and Mazurin et al. have similarly given the upper
limit as 75 mol% PbO,91 whilst on the other hand Kohara et al.15 state that it is well known that
glasses can be formed up to 90 mol% PbO. There is a claim in the literature of glass formation at 96
mol% PbO,84 but this is almost certainly not reliable (see ESI S1). There is also a report of glass
formation at 91.2 mol% PbO,85 although the refractive index and density reported imply a much
lower PbO content. The SciGlass database58-59 does not give any other reports of glass formation or
properties for more than 75 mol% PbO, but gives many reports for compositions of 75 mol% PbO
and less. One of the reasons for differing reports of the high PbO limit for glass formation is that it
depends on the glass preparation method; different preparation methods have different quench
rates, and a glass can only be formed if the quench rate is rapid in comparison with the timescales

Please cite: Phys. Chem. Chem. Phys., 2013, 15, 8506-8519
14
involved in the crystallisation process. Thus it is worthwhile to consider the factors which may limit
or promote glass formation, even though the exact limit is not known reliably.
It should be noted that the silicate subnetwork retains some degree of polymerisation right up to
83 mol% PbO,23 and therefore the number of oxygens bonded only to Pb is not minimised (as in the
100% Q0 case). This can be envisaged as an equilibrium between Pb-O-Si links and a mix of Pb-O-Pb
and Si-O-Si links. The presence of Pb-O-Pb entities is related to the presence of edge-sharing [PbOm]
polyhedra, increasing the fraction of which will ultimately destabilise glass formation, the fully edge-
shared PbO crystals being the limiting case. The broad distribution of local Pb environments also
plays a role, similar to the distribution of Si-O-Si bond and torsion angles in SiO2 glass, providing
flexibility to allow for disordered network formation. Thus it seems that sufficient corner-sharing
and local Pb environment disorder, combined with silicate anions with a (relatively) broad Q species
distribution, are required to hinder crystallisation kinetics and allow glass formation. Notably, MgO-
SiO2 glasses can be formed right up to the conventional glass forming limit of 66.7 mol% MgO,92-93
using containerless levitation techniques, and, at 66.7 mol% MgO, are more highly polymerised94-95
than the stoichiometric mineral enstatite, which is purely Q0. Another example is the Li2O-SiO2
system, for which glass formation has been observed almost up to the orthosilicate (66.7 mol% M2O)
composition, at which point a degree of silicate anion polymerisation remains.96 Recently, however,
it has been demonstrated that a purely Q0 glass can be obtained,97 for aerodynamically levitated
72(Ca0.5Mg0.5O).28SiO2. In this case the structural and topological frustration required to prevent
crystallisation comes not from a distribution of Q species, but from the dissimilarity of the Ca2+ and
Mg2+ cations. On this basis alone one would not expect a purely Q0 lead silicate glass to form, but it
is interesting to consider the possibility of using aerodynamic levitation to increase the accessible
glass-forming range. Foreseeable problems with this include the volatilisation of lead from the
molten droplet, and the necessity for careful control of the redox conditions to prevent formation of
metallic or tetravalent lead.
Conclusions
A glass of composition 80PbO.20SiO2 can be formed by rapid roller-quenching. Contributions to the
stabilisation of the glass come from the presence of: (i) a distribution of Qn silicon species; (ii) a
distribution of different [PbOm] pyramidal units and (iii) a plumbite subnetwork with a mix of corner
and edge-sharing. The practical limit to glass-formation may occur when the fraction of edge-sharing
becomes too large to support a random network.
Introduction of Pb into some of the structural models as dipolar entities, to represent the electron
lone-pair on Pb2+, demonstrates that the lone-pairs organise to create voids within the glass
network, just as in crystalline materials, such as α-PbO,48 where lone-pairs occupy interlayer spaces,
with nearest neighbour distance 2.88 Å, the same as that found for the models of the glass (2.85 Å).
The distributions of coordination numbers and bond angles (O-Pb-O and Pb-O-Pb) in 80PbO.20SiO2
glass, obtained by empirical potential structure refinements of neutron and x-ray diffraction
patterns, provide strong evidence for structural similarity to related crystalline compounds. These
include primarily the lead silicate Pb11Si3O17 45 and, to a lesser extent, the α and β polymorphs of lead
monoxide, all of which contain Pb at the apex of pyramidal polyhedra, and O at the centre of
tetrahedron-like geometries, owing to the significant p-character and hence stereochemical activity
of the Pb electron lone-pair.

Please cite: Phys. Chem. Chem. Phys., 2013, 15, 8506-8519
15
Four structural models could be derived, with similarly good agreement with the diffraction data,
but with appreciable differences in structure. This highlights the need for care when drawing
conclusions from such analyses. What is more, the models show qualitative differences to published
results15 on lead silicate glasses (containing less Pb) using reverse Monte Carlo modelling. In
particular, the O-Pb-O bond angle distributions are more highly structured as a result of the use of
interatomic potentials in the present study, showing greater similarity to the distributions in the
aforementioned crystalline systems.
The contribution from Si-Si pairs to the diffraction pattern is negligible, in the case of both neutrons
and x-rays, due to dilution and small scattering factors. This leads to an overpolymerised silicate
subnetwork in unconstrained models, as compared to 29Si MAS NMR results. Models which
reproduce the diffraction data at least equally well, were derived, within which the silicate anions
were forced to completely depolymerise into monomeric [SiO4]4- units, and hence the robustness of
the conclusions regarding the plumbite part of the network demonstrated. Work is underway to
incorporate more sophisticated constraints from 29Si MAS NMR to drive the models toward the
correct Qn speciations.
Acknowledgements
This work was funded by the STFC Centre for Materials Physics and Chemistry under Grant
CMPC09105 and the EPSRC and NSF-DMR grant 0904615. Dr. Emma Barney is thanked for
commenting on the manuscript.

Please cite: Phys. Chem. Chem. Phys., 2013, 15, 8506-8519
16
References
1. W. H. Dumbaugh and J. C. Lapp, J. Am. Ceram. Soc., 1992, 75, 2315-2326. 2. S. R. Friberg and P. W. Smith, IEEE J. Quantum Electron., 1987, 23, 2089-2094. 3. E. R. Barney, A. C. Hannon, N. Laorodphan and D. Holland, J. Phys. Chem. C, 2011, 115,
14997-15007. 4. M. Imaoka and A. Hasegawa, Journal of the Ceramic Association, Japan, 1980, 88, 141-150. 5. H. Morikawa, Y. Takagi and H. Ohno, J. Non-Cryst. Solids, 1982, 53, 173-182. 6. H. Ohno, K. Igarashi, Y. Takagi, H. Toratani, K. Furukawa, J. Mochinaga, T. Nakamura and T.
Izumitani, J Jpn I Met, 1983, 47, 132-141. 7. H. Hasegawa and M. Imaoka, J. Non-Cryst. Solids, 1984, 68, 157-158. 8. H. Morikawa, Y. Takagi and H. Ohno, J Non-Cryst Solids, 1984, 68, 159-162. 9. M. Imaoka, H. Hasegawa and I. Yasui, J Non-Cryst Solids, 1986, 85, 393-412. 10. K. Yamada, A. Matsumoto, N. Niimura, T. Fukunaga, N. Hayashi and N. Watanabe, J Phys Soc
Jpn, 1986, 55, 831-837. 11. K. Suzuya, D. L. Price, M. L. Saboungi and H. Ohno, Nucl Instrum Meth B, 1997, 133, 57-61. 12. K. Suzuya, S. Kohara and H. Ohno, Jpn J Appl Phys 1, 1999, 38, 144-147. 13. U. Hoppe, R. Kranold, A. Ghosh, C. Landron, J. Neuefeind and P. Jovari, J Non-Cryst Solids,
2003, 328, 146-156. 14. T. Takaishi, M. Takahashi, J. Jin, T. Uchino, T. Yoko and M. Takahashi, J. Am. Ceram. Soc.,
2005, 88, 1591-1596. 15. S. Kohara, H. Ohno, M. Takata, T. Usuki, H. Morita, K. Suzuya, J. Akola and L. Pusztai, Physical
Review B, 2010, 82, 134209 134201-134207. 16. F. Fayon, C. Landron, K. Sakurai, C. Bessada and D. Massiot, J Non-Cryst Solids, 1999, 243, 39-
44. 17. V. R. Mastelaro, E. D. Zanotto, N. C. Lequeux and R. Cortes, J. Non-Cryst. Solids, 2000, 262,
191-199. 18. J. Rybicki, A. Rybicka, A. Witkowska, G. Bergmanski, A. Di Cicco, M. Minicucci and G. Mancini,
J Phys-Condens Mat, 2001, 13, 9781-9797. 19. H. Hosono, H. Kawazoe and T. Kanazawa, Journal of the Ceramic Association, Japan, 1982,
90, 544-551. 20. E. Lippmaa, A. Samoson, M. Magi, R. Teeaar, J. Schraml and J. Gotz, J. Non-Cryst. Solids,
1982, 50, 215-218. 21. R. Dupree, N. Ford and D. Holland, Phys Chem Glasses, 1987, 28, 78-84. 22. F. Fayon, C. Bessada, D. Massiot, I. Farnan and J. P. Coutures, J Non-Cryst Solids, 1998, 232,
403-408. 23. S. Feller, G. Lodden, A. Riley, T. Edwards, J. Croskrey, A. Schue, D. Liss, D. Stentz, S. Blair, M.
Kelley, G. Smith, S. Singleton, M. Affatigato, D. Holland, M. E. Smith, E. I. Kamitsos, C. P. E. Varsamis and E. Ioannou, J. Non-Cryst. Solids, 2010, 356, 304-313.
24. L. Leventhal and A. J. Bray, Phys Chem Glasses, 1965, 6, 113-125. 25. T. Yoko, K. Tadanaga, F. Miyaji and S. Sakka, J. Non-Cryst. Solids, 1992, 150, 192-196. 26. B. M. J. Smets and T. P. A. Lommen, J. Non-Cryst. Solids, 1982, 48, 423-430. 27. P. W. Wang and L. P. Zhang, J. Non-Cryst. Solids, 1996, 194, 129-134. 28. I. A. Gee, D. Holland and C. F. McConville, Phys Chem Glasses, 2001, 42, 339-348. 29. K. N. Dalby, H. W. Nesbitt, V. P. Zakaznova-Herzog and P. L. King, Geochim Cosmochim Ac,
2007, 71, 4297-4313. 30. T. Furukawa, S. A. Brawer and W. B. White, J Mater Sci, 1978, 13, 268-282. 31. C. A. Worrell and T. Henshall, J. Non-Cryst. Solids, 1978, 29, 283-299. 32. B. Piriou and H. Arashi, High Temp Sci, 1980, 13, 299-313. 33. L. P. Liu, Z Phys B Con Mat, 1993, 90, 393-399. 34. D. D. Meneses, M. Malki and P. Echegut, J. Non-Cryst. Solids, 2006, 352, 769-776. 35. K. V. Damodaran, B. G. Rao and K. J. Rao, Phys Chem Glasses, 1990, 31, 212-216.

Please cite: Phys. Chem. Chem. Phys., 2013, 15, 8506-8519
17
36. G. Cormier, T. Peres and J. A. Capobianco, J Non-Cryst Solids, 1996, 195, 125-137. 37. J. Rybicki, W. Alda, A. Rybicka and S. Feliziani, Comput Phys Commun, 1996, 97, 191-194. 38. T. Peres, D. A. Litton, J. A. Capobianco and S. H. Garofalini, J. Non-Cryst. Solids, 1997, 221, 34-
46. 39. T. Peres, D. A. Litton, J. A. Capobianco and S. H. Garofalini, Philos Mag B, 1998, 77, 389-396. 40. A. Rybicka, J. Rybicki, A. Witkowska, S. Feliziani and G. Mancini, Computational Methods in
Science and Technology, 1999, 5, 67-74. 41. G. Bergmanski, M. Bialoskorski, M. Rychcik-Leyk, A. Witkowska, J. Rybicki, G. Mancini, S.
Frigio and S. Feliziani, Task Quarterly, 2004, 8, 393-412. 42. M. L. Boucher and D. R. Peacor, Z Kristallogr Krist, 1968, 126, 98-111. 43. L. S. D. Glasser, R. A. Howie and R. M. Smart, Acta Crystallogr B, 1981, 37, 303-306. 44. K. Kato, Acta Crystallographica, 1980, B36, 2539-2545. 45. K. Kato, Acta Crystallographica, 1982, B38, 57-62. 46. S. V. Krivovichev and P. C. Burns, Zapiski Vserossijskogo Mineralogicheskogo Obshchestva,
2004, 133, 70-76. 47. W. Petter, A. B. Harnik and U. Keppler, Zeitschrift Fur Kristallographie Kristallgeometrie
Kristallphysik Kristallchemie, 1971, 133, 445-458. 48. R. G. Dickinson and J. B. Friauf, J Am Chem Soc, 1924, 46, 2457-2463. 49. R. J. Hill, Acta Crystallogr C, 1985, 41, 1281-1284. 50. K. Fajans and N. J. Kreidl, J Am Ceram Soc, 1948, 31, 105-114. 51. K. H. Sun, J. Am. Ceram. Soc., 1947, 30, 277-281. 52. A. C. Wright, in Experimental Techniques of Glass Science, eds. C. J. Simmons and O. H. El-
Bayoumi, American Ceramic Society, Westerville1993, pp. 205-314. 53. R. L. McGreevy, J. Phys.: Condens. Matter, 2001, 13, R877-R913. 54. R. L. McGreevy and P. Zetterström, J. Non-Cryst. Solids, 2001, 293-295, 297-303. 55. A. K. Soper, Phys. Rev. B, 2005, 72. 56. A. J. Havel, S. A. Feller, M. Affatigato and M. Karns, Glass Technol.: Eur. J. Glass Sci. Technol.
A, 2009, 50, 227-229. 57. A. J. Havel, S. A. Feller, M. Affatigato, M. Karns and M. Karns, Glass Technol-Part A, 2009, 50,
227-229. 58. SciGlass Professional 7.3, ITC Inc.2008. 59. O. V. Mazurin, M. V. Strel'tsina, T. P. Shvaiko-Shvaikovskaya and A. O. Mazurina, Glass Phys.
Chem, 2003, 29, 555-570. 60. H. F. Poulsen, J. Neuefeind, H. B. Neumann, J. R. Schneider and M. D. Zeidler, J. Non-Cryst.
Solids, 1995, 188, 63-74. 61. J. A. Bearden and A. F. Burr, Rev. Mod. Phys., 1967, 39, 125. 62. A. C. Hannon, Nuclear Instruments and Methods in Physics Research Section A-Accelerators
Spectrometers Detectors and Associated Equipment, 2005, 551, 88-107. 63. A. K. Soper, Phys Rev B, 2005, 72, 104204. 64. A. K. Soper, J Phys-Condens Mat, 2010, 22, 404210. 65. A. K. Soper, J Phys-Condens Mat, 2011, 23, 365402. 66. C. Pirovano, M. S. Islam, R. N. Vannier, G. Nowogrocki and G. Mairesse, Solid State Ionics,
2001, 140, 115-123. 67. D. Lebellac, J. M. Kiat and P. Garnier, J Solid State Chem, 1995, 114, 459-468. 68. D. T. Bowron and S. Diaz-Moreno, J Phys Chem B, 2009, 113, 11858-11864. 69. A. K. Soper, Chemical Physics, 2000, 258, 121-137. 70. A. K. Soper, Chemical Physics, 1996, 202, 295-306. 71. A. K. Soper and E. R. Barney, J. Appl. Cryst., 2011, 44, 714-726. 72. A. K. Soper, Rutherford Appleton Laboratory Technical Report, RAL-TR-2011-013, 2011. 73. J. Krogh-Moe, Acta Cryst., 1956, 9, 951-953. 74. N. Norman, Acta Cryst., 1957, 10, 370-373.

Please cite: Phys. Chem. Chem. Phys., 2013, 15, 8506-8519
18
75. A. K. Soper, Mol. Phys., 2009, 107, 1667-1684. 76. A. C. Hannon, W. S. Howells and A. K. Soper, Inst Phys Conf Ser, 1990, 193-211. 77. E. Lorch, Journal of Physics C: Solid State Physics, 1969, 2, 229. 78. A. C. Hannon, Rutherford Appleton Laboratory Technical Report, RAL-93-063, 1993. 79. T. Takaishi, J. S. Jin, T. Uchino and T. Yoko, J Am Ceram Soc, 2000, 83, 2543-2548. 80. E. R. Barney, A. C. Hannon, D. Holland, D. Winslow, B. Rijal, M. Affatigato and S. A. Feller, J
Non-Cryst Solids, 2007, 353, 1741-1747. 81. A. C. Hannon, J. M. Parker and B. Vessal, J Non-Cryst Solids, 1998, 232, 51-58. 82. A. C. Hannon, J. M. Parker and B. Vessal, J Non-Cryst Solids, 1996, 196, 187-192. 83. Y. Dimitriev, V. Mihailova and E. Gattef, Phys Chem Glasses, 1993, 34, 114-116. 84. C. Dayanand, G. Bhikshamaiah and M. Salagram, Mater Lett, 1995, 23, 309-315. 85. E. Ellis, D. W. Johnson, A. Breeze, P. M. Magee and P. G. Perkins, Philos Mag B, 1979, 40,
125-137. 86. R. J. Gillespie and E. A. Robinson, Angewandte Chemie-International Edition, 1996, 35, 495-
514. 87. R. J. Gillespie and I. Hargittai, The VSEPR Model of Molecular Geometry, Prentice Hall
International, London, 1991. 88. R. Gillespie and R. Nyholm, Quarterly Reviews, Chemical Society, 1957, 11, 339-380. 89. A. C. Wright, Phys. Chem. Glasses: Eur. J. Glass Sci. Technol. B, 2008, 49, 103-117. 90. N. Bansal and R. H. Doremus, Academic Press, Orlando1986, pp. 54-56. 91. O. V. Mazurin, M. V. Streltsina and T. P. Shvaiko-Shvaikovskaya, Handbook of glass data. Part
A, silica glass and binary silicate glasses, Elsevier, Amsterdam, 1983. 92. S. Kohara, J. Akola, H. Morita, K. Suzuya, J. K. R. Weber, M. C. Wilding and C. J. Benmore, P
Natl Acad Sci USA, 2011, 108, 14780-14785. 93. S. Kohara, K. Suzuya, K. Takeuchi, C. K. Loong, M. Grimsditch, J. K. R. Weber, J. A. Tangeman
and T. S. Key, Science, 2004, 303, 1649-1652. 94. S. Sen, H. Maekawa and G. N. Papatheodorou, J. Phys. Chem. B, 2009, 113, 15243-15248. 95. S. Sen and J. A. Tangeman, Am. Miner., 2008, 93, 946–949. 96. C. Larson, J. Doerr, M. Affatigato, S. Feller, D. Holland and M. E. Smith, J Phys-Condens Mat,
2006, 18, 11323-11331. 97. N. K. Nasikas, T. G. Edwards, S. Sen and G. N. Papatheodorou, J. Phys. Chem. B, 2012, 116,
2696-2702.

Please cite: Phys. Chem. Chem. Phys., 2013, 15, 8506-8519
19
Figure 1: The x-ray and neutron distinct scattering for high lead silicate glass, iX(Q) and iN(Q) (solid
lines). Dashed lines show suitable magnifications of the data in order to highlight the oscillations at
high Q.
0 5 10 15 20 25 30 35 40-0.6
-0.4
-0.2
0.0
0.2 x10
Q / Å
-1
-2
0
2
4x25
iN(Q
) / barn
s p
er
ato
m p
er
ste
radia
n
iX(Q
) / per
ste
radia
n p
er
ele
ctr
on

Please cite: Phys. Chem. Chem. Phys., 2013, 15, 8506-8519
20
Figure 2: The x-ray and neutron correlation functions, TX(r) and TN(r), of high lead silicate glass
obtained with a Lorch modification function77 and Qmax = 23.62 and 40.00 Å-1 respectively. The
average density contributions TX,0(r) and TN,0(r) are shown as thin lines.
0 2 4 6 8 10
0
1
2
3
TN(r
) / b
arn
s p
er
Å2
r / Å
TX(r
) / p
er
ele
ctr
on
pe
r Å
2
0
2
4
6
8

Please cite: Phys. Chem. Chem. Phys., 2013, 15, 8506-8519
21
Figure 3: The TR(r) of Fig. 2 are shown over reduced regions of r (open circles, black). Upper panels
show the sum of the fitted peaks overlaid (solid line, red), with individual peaks offset below this,
and residual further offset below. The lower panels show the measured TR(r) (open circles) together
with the simulated TR(r) for crystalline Pb11Si3O1745 (solid line, red), with the appropriately weighted
partial correlation functions and residual (grey) offset below, as in the upper panels. Only the Pb
containing partials are shown in the x-ray case, and the Si-Si partial has been omitted from the
neutron figure (negligibly small). See main text for details. In colour online.
-1
0
1
2
3
Pb-P
b
Si-
O
Si-
O
Pb-O
Pb-O
Pb-P
b
0
1
TX(r
) o
r w
eig
hte
d t
ijX(r
) /
pe
r Å
2
Pb-O
O-O
Pb-O
r / Å
TN(r
) o
r w
eig
hte
d t
ijN(r
) /
ba
rns p
er
Å2
2 3 4 5
-2
0
2
4
6
8
2 3 4 5
-1
0
1
2 Measured glass
Sum peaks or Crystal T(r)
Si-O
Pb-Si
O-O
Pb-O
Pb-Pb
Residual

Please cite: Phys. Chem. Chem. Phys., 2013, 15, 8506-8519
22
Figure 4: Interference functions measured (open circles) by neutron (left) and x-ray (right)
diffraction for the 80PbO.20SiO2 glass, compared with the model functions, ionic model: thick (black)
line, lone-pair model: thin dotted (magenta) line. The appropriately weighted partial interference
functions are shown vertically offset for clarity, in the same order in both panels. For clarity, the
functions for the Q0 models have been omitted, but see Fig. S4, ESI, for the weighting factor free
partial interference functions for the Q0 model. In colour online.
0 5 10 15 20 25
-4
-3
-2
-1
0
1
Q.i
X(Q
) or
(2
-
ij)wijX
Q(S
ij(Q)
- 1)
elec
tron
-1st
erad
ian
-1Å
-1
Si-Si
Pb-Si
Pb-Pb
Si-O
Pb-O
Q.i
N(Q
) or
(2
-
ij)wijN
Q(S
ij(Q)
- 1)
barn
s at
om-1
ster
adia
n-1
Å-1
O-O
Q / Å-1
5 10 15 20
-5
0
5
10

Please cite: Phys. Chem. Chem. Phys., 2013, 15, 8506-8519
23
Figure 5: The partial pair correlation functions, gij(r), derived from the models. Vertical offsets have
been used for clarity. Vertical lines indicate cut-offs used during determination of coordination
number distributions (CNDs) and bond-angle distributions (BADs). In colour online.
2 3 4 5
0
3
6
9
12
15
18
21
24
Ionic
LP
Q0
Q0 + LP
gij(r)
r / Å
Si-Si
Pb-Si
Pb-Pb
O-O
Pb-O
Si-O

Please cite: Phys. Chem. Chem. Phys., 2013, 15, 8506-8519
24
Figure 6: Top: 5 x 1 x 1 supercell of α-PbO48 viewed along the [010] direction. Middle: Unit cell of
Pb11Si3O1745 viewed along the [01-1] direction. Bottom: Snapshot (approx. 31 x 24 Å) of part of a
single configuration of the lone-pair model of 80PbO.20SiO2 lead silicate glass. The region shown
consists of an approximately 5 Å thick slice. Silicon atoms are shown within shaded (blue)
a
b
c
d

Please cite: Phys. Chem. Chem. Phys., 2013, 15, 8506-8519
25
tetrahedra, lead atoms as large (grey) spheres, bonded to oxygen atoms (smaller spheres, red). Lone
pairs are shown within α-PbO and the glass as yellow spheres.66-67 Pb-O bonds shorter than 2.7 Å are
shown as solid lines, whilst those between 2.7 and 3.27 Å in length are dashed. The lone-pairs fill
voids in the glass structure, such as those labelled a and b. Edge sharing [PbOm] units are in
evidence, including those labelled c and d. The cationic coordination spheres have been filled,
whereas the anionic ones have not. In colour online.

Please cite: Phys. Chem. Chem. Phys., 2013, 15, 8506-8519
26
Figure 7: Bond angle histograms from the EPSR models, with 1o bins. Arrows indicate the direction
of change of the O-Pb-O BAD upon introduction of the LPs. The more discrete histograms (solid blue
lines) correspond to the distributions in crystalline Pb11Si3O17,45 arbitrarily scaled and with 2o bins.
The same bond length cut-offs apply as in Table 5, with only the shorter (< 2.7 Å) Pb-O bonds
included. In colour online.
0 40 80 120 160 0 40 80 120 160
LP
Ionic
Q0
Q0 + LP
Pb11
Si3O
17
Si-O-Si
O-Pb-O
P(
)
Bond Angle / degrees
Pb-O-Pb
O-Si-O
Please cite: Phys. Chem. Chem. Phys., 2013, 15, 8506-8519
27
Figure 8: The partial pair correlation functions, gij(r), for the Pb’-Pb’ and LP-LP pairs,demonstrating
the net effective attractive interaction between the lone-pairs in the LP model, similar to that
observed in crystalline materials, such as α-PbO. The more noisy (solid blue) line is derived from the
LP-LP distribution of a single Monte Carlo configuration, prior to perturbation by, and refinement of,
the empirical potential. In colour online.
2 4 6 8 100
1
2
3
Pb'-Pb'
Lp-Lp
r / Å
gij(r)

Please cite: Phys. Chem. Chem. Phys., 2013, 15, 8506-8519
28
Table 1: Measured bulk properties of the high lead silicate glass, see main text for details.
Property Value
Mass density, g/cm3 ρm 7.95 ± 0.05 Number density, atoms/Å3 ρ0 0.05564 ± 0.00040 Molar volume, cm3/mol VM 23.87 ± 0.21
Glass composition (mol% PbO)
Nominal 80.00 Mass loss derived 79.97 ± 0.03 Density derived 78.11 ± 1.63 EDX analysis 77.03 ± 0.57 ND derived 79.50 ± 0.50
Table 2: Parameters defining the interatomic pair potentials used in the structure refinements. The
Pb’ and LP parameters were used only in the lone-pair and Q0 + lone-pair models, see main text for
details.
Ion ε, kJmol-1 σ, Å m, (a.m.u.) q/e
Si 2.49 0.72 28 2
O 0.92 3.16 16 -1
Pb 0.60 2.07 207 1
Pb’ 0.60 2.21 103.5 1.5
LP 0.00 0.00 103.5 -0.5

Please cite: Phys. Chem. Chem. Phys., 2013, 15, 8506-8519
29
Table 3: Parameters from peak fitting to TN(r) and TX(r) measured for the 80 mol% PbO silicate
glass, see main text for details of the peak fitting procedure. Statistical errors from the fitting
procedure are given in parentheses. The final column indicates whether the values are obtained
from fitting TN(r) or TX(r), see text for details.
Atom pair i-j rij, Å <uij2>1/2, Å Nij Origin
Si-O 1.6348(23) 0.050(3) 3.92(14) N
O-Si 0.67(2) N
Pb-O 2.2300(3) 0.0802(3) 2.29(1) N
2.4227(10) 0.071(2) 0.85(1) N
2.6507(34) 0.083(3) 0.63(2) X + N
Total Pb-O 3.77(2) X + N
Total O-Pb 2.48(2) X + N
O-O [SiO4]* 2.6695(38) 0.079(1) 1.95(9) N*
Pb-Pb† 3.7204(17) 0.227(1) 8.02(4) X
*Parameters fixed at those predicted from Si-O peak area and position and assumption of
tetrahedral geometry. Width fixed at that measured for vitreous silica. †Neglecting contributions
from other terms, including Pb-Si and Pb-O.
Table 4: Selected properties of the EPSR derived glass structure models.
Model
Parameter Ionic Lone-pair Q0 Q0 + LP
R-factor63 (x 103) 1.88 1.95 1.84 1.82 Total energy, kJmol-1 -540.5 -592.2 -541.9 -572.6 Mean O-Si-O angle, o 109.4 109.4 109.4 109.8 RMS deviation, o 4.2 4.4 4.0 5.1 Mean Pb-O-Pb angle, o 110.8 110.4 110.1 109.7 RMS deviation, o 13.9 14.4 13.3 14.2

Please cite: Phys. Chem. Chem. Phys., 2013, 15, 8506-8519
30
Table 5: Average coordination numbers ( ijN , as defined in equation 15, ESI) and coordination
number distributions (CNDs), expressed as percentages, for various atom pairs in the EPSR models of
the glass, and in crystalline Pb11Si3O17.45 Standard deviations are shown in parentheses. The Q
species distribution for an 80PbO.20SiO2 glass, measured by 29Si MAS NMR,23 has been used to
estimate the Si-Si and O-Si CNDs, shown for comparison. The upper cut-off radius, r2, (equation 15,
ESI) is given in the first column. Effectively, r1 = 0 in all cases. Values smaller than 0.01% are
expressed as italicised zeros. A few percent of Pb are coordinated to seven O for r2 = 3.27 Å. See Fig.
S7 of the ESI for a graphical representation.
Atom pair System
Coordination number Average ijN
(r2, Å) 0 1 2 3 4 5 6
Si-O Ionic 0 0 0 0.1(1) 99.87(2) 0 0 4.00(8)
(2.0) Lone-pair 0 0 0 0.04(10) 99.9(2) 0 0 4.00(6)
Q0 0 0 0 1.0(3) 99.0(3) 0 0 3.99(10)
Q0 + LP 0 0 0 9.5(6) 90.5(6) 0 0 3.90(29)
Pb11Si3O17 0 0 0 0 100 0 0 4.00(0)
O-Si Ionic 44.17(1) 45.09(0) 10.74(4) 0.03(2) 0 0 0 0.67(66)
(2.0) Lone-pair 44.4(2) 44.68(6) 10.64(3) 0.22(2) 0 0 0 0.67(67)
Q0 33.75(1) 66.00(2) 0.25(5) 0 0 0 0 0.66(48)
Q0 + LP 35.43(4) 64.05(7) 0.52(9) 0 0 0 0 0.65(49)
Pb11Si3O17 35.3 58.8 5.9 0 0 0 0 0.71(57)
29Si MAS NMR 35(3) 63(1) 3(4) 0 0 0 0 0.68(1)
Si-Si Ionic 18.6(3) 38.5(6) 32(1) 9.5(7) 1.3(5) 0.02(8) 0 1.36(94)
(3.62) Lone-pair 16.7(3) 40.4(5) 30.0(6) 10.5(5) 2.0(3) 0.2(1) 0 1.41(97)
Q0 97.9(7) 2.1(7) 0 0 0 0 0 0.02(14)
Q0 + LP 96(1) 4(1) 0 0 0 0 0 0.04(21)
Pb11Si3O17 33.3 66.7 0 0 0 0 0 0.67(47)
29Si MAS NMR 71(3) 26(3) 3(3) 0 0 0 0 0.32(28)
Pb-O Ionic 0 0.3(1) 6.2(5) 38(1) 48(1) 6.9(5) 0.1(1) 3.55(73)
(2.7) Lone-pair 0 0.04(5) 4.1(4) 42.9(8) 44.7(9) 8.1(5) 0.2(1) 3.57(71)
Q0 0 0.3(1) 6.7(5) 39(1) 48(1) 6.3(5) 0.1(1) 3.54(73)
Q0 + LP 0 0.04(5) 4.0(4) 40.9(9) 48(1) 7.2(5) 0.1(1) 3.58(69)
Pb11Si3O17 0 0 0 45.5 45.5 9.1 0 3.64(64)
O-Pb Ionic 7.1(3) 16.0(5) 30.7(7) 25.6(7) 20.6(6) 0.08(5) 0 2.37(1.18)
(2.7) Lone-pair 7.5(2) 15.0(4) 30.3(5) 26.4(6) 20.8(5) 0.06(5) 0 2.38(1.19)
Q0 0.6(1) 19.6(7) 42.4(7) 18.5(6) 18.9(5) 0.08(5) 0 2.36(1.02)
Q0 + LP 1.1(1) 18.0(5) 41.9(5) 19.0(5) 20.0(4) 0.07(5) 0 2.39(1.03)
Pb11Si3O17 5.9 23.5 29.4 11.8 29.4 0 0 2.35(1.28)
Pb-O Ionic 0 0 0.03(4) 3.8(4) 34(1) 41(1) 17.6(9) 4.84(89)
(3.27) Lone-pair 0 0 0.29(9) 10.3(5) 35.4(9) 35.8(9) 14.9(7) 4.65(98)
Q0 0 0 0 2.6(4) 28(1) 41(1) 22.1(7) 5.00(93)
Q0 + LP 0 0 0.15(6) 6.9(4) 34.3(7) 37.3(9) 22.7 4.77(97)
Pb11Si3O17 0 0 0 4.5 27.3 45.5 22.7 4.86(81)
O-Pb Ionic 1.5(1) 6.2(3) 16.8(8) 28.3(7) 39.3(6) 6.7(5) 1.0(2) 3.22(1.12)
(3.27) Lone-pair 2.4(2) 6.2(3) 19.9(5) 29.2(6) 36.0(5) 5.7(3) 0.7(1) 3.10(1.14)
Q0 0 0.8(1) 16.8(6) 39.9(6) 34.2(5) 7.2(4) 1.1(2) 3.34(90)
Q0 + LP 0.18(5) 1.8(2) 23.9(5) 35.3(6) 32.5(5) 5.7(3) 0.7(1) 3.18(95)
Pb11Si3O17 2.9 2.9 11.8 41.2 41.2 0 0 3.15(94)

Please cite: Phys. Chem. Chem. Phys., 2013, 15, 8506-8519
31
Table 6: Values obtained by fitting of Lorentzian lineshapes to the FSDPs of the x-ray and neutron
distinct scattering functions, and to the pre-peak of the neutron distinct scattering function.
Equivalent parameters for vitreous SiO2 based on the Q and ΔQ obtained by Wright89 are shown for
comparison.
Peak position
Q, Å-1
Peak width
ΔQ, Å-1
Periodicity 2π/Q, Å
Correlation Length
2π/ΔQ, Å
Number of periods
Q/ΔQ Assignment
2.04(1) 0.32(1) 3.08(2) 19.6(6) 6.4(2) Interlayer Pb-Pb 1.06(1) 0.56(1) 5.94(6) 11.3(2) 1.90(4) Dilute silicate anions 1.53(2) 0.63(2) 4.11(5) 10.0(3) 2.43(8) Network cages in SiO2