Embed Size (px)
Citation preview

This file is part of the following reference:
Yan, Zi (2009) The development of a Rasch measurement physical fitness scale for Hong Kong
primary school-aged students. PhD thesis, James Cook University
Access to this file is available from:
http://eprints.jcu.edu.au/5569
THE DEVELOPMENT OF A RASCH MEASUREMENT
PHYSICAL FITNESS SCALE FOR HONG KONG
PRIMARY SCHOOL-AGED STUDENTS
Thesis submitted by
YAN Zi
M.Ed
in September 2009
in partial fulfillment of the requirements
for the degree of Doctor of Philosophy
in the School of Education
James Cook University

I
STATEMENT OF ACCESS
I, the undersigned, author of this work, understand that James Cook University will make this
thesis available for use within the University Library and, via the Australian Digital Theses
network, for use elsewhere.
I understand that, as an unpublished work, a thesis has significant protection under the
Copyright Act and I do not wish to place any further restriction on access to this work.
____________________________ _______________________
YAN Zi Date
22 September 2009

II
STATEMENT OF SOURCES
DECLARATION
I declare that this thesis is my own work and has not been submitted in any form for another
degree or diploma at any university or other institution of tertiary education. Information
derived from the published or unpublished work of others has been acknowledged in the text
and a list of references is given.
____________________________ ______________________
YAN Zi Date
22 September 2009

III
STATEMENT OF SOURCES
ELECTRONIC COPY
I, undersigned, the author of this work, declare that the electronic copy of this thesis provided
to the James Cook University Library is an accurate copy of the print thesis submitted, within
the limits of the technology available.
____________________________ ______________________
YAN Zi Date
22 September 2009

IV
STATEMENT ON THE CONTRIBUTION OF OTHERS
Supervisors:
Professor Trevor G. Bond and Dr David Lake
Financial Support:
School of Education, JCU: Tuition-waiver
School of Education, JCU: Postgraduate research student support funding
Data Collection:
I would like to express my appreciation to the generous support of the partner school in
Hong Kong: Baptist (STW) Lui Ming Choi Primary School. Special thanks go to the
Principal, Dr. Tang Mei Xin, who provided me with access to the school’s existing data.
____________________________ ____________________________
YAN Zi Date
22 September 2009

V
ACKNOWLEDGEMENTS
First and foremost, I would like to express my most sincere thanks to my admirable
supervisor, Prof. Trevor G. Bond. This research could not have been accomplished without
his invaluable advice, inspiration, direction, and encouragement throughout the
implementation of this research. His brilliance as a mentor and sense of humor as a friend
deeply influenced me in pursuit of my goal.
I also would like to thank Dr. David Lake for his efforts in helping me to complete this
research. Special thanks are given to Prof. Magdalena M. C. Mok whose full support made
my study a lot easier. Many colleagues, in particular Dr. Mike Linacre, contributed to this
research by sharing their professional expertise and providing constructive advices. There
are many other people not listed here who helped me in a variety of ways. Thank to all of
them.
Thanks are also due to the staff of the School of Education at JCU for the generous help I
received during this research.
Finally, I wish to express my deepest gratitude to my wife, Lu You, and my parents for their
unconditional support and encouragement.
VI
ABSTRACT
The main purpose of this study was to develop a Rasch Measurement Physical Fitness Scale
(RMPFS) consisting of the physical fitness indicators routinely used in Hong Kong primary
schools. Data used in this study were retrieved from the database of a Hong Kong primary
school covering students’ physical fitness data over academic years 2002-03 to 2006-07.
The indicators of physical fitness include Body Mass Index (BMI), 6-minute Run, 9-minute
Run, 1-minute Sit-ups, Sit-and-Reach, Right Handgrip, Left Handgrip, Standard Push-ups,
and Modified Push-ups. Each indicator reflects one of the five usually recognized
components of physical fitness: body composition, cardiorespiratory fitness, flexibility,
muscular strength, and muscular endurance. After data cleaning, a total of 9,439 student
records were used for the Rasch scale development.
Following a series of iterative Rasch analyses, a RMPFS integrating three key core
components of physical fitness (i.e., cardiorespiratory fitness, muscular endurance, and
muscular strength) was developed successfully. The RMPFS and its scale indicators showed
fit to the Rasch model sufficient for the intended purposes of measuring overall fitness of
children and tracking fitness levels over time. The RMPFS measures were then used to
display Hong Kong primary school-aged students’ overall physical fitness levels and
developmental trends effectively, and the percentile distributions of overall physical fitness,
measured by the RMPFS, for age, height, weight, and BMI were illustrated graphically for
the sample of students in this research.
Compared to traditional approaches to measurement in physical fitness, this Rasch
calibrated physical fitness scale has the following advantages. The first, the Rasch
measurement logit scale provides interval measures that have consistent and stable meaning
regarding the distances between persons or items, therefore, facilitating meaningful
comparisons. The second, the RMPFS provides sample-distribution free and

VII
item-distribution free measures. The third, the RMPFS developed in this study can calibrate
primary school-aged students’ overall fitness levels on the common scale if students had
performed on any one physical fitness indicator from among those calibrated into the scale.
The successful development and application of the RMPFS provides strong evidence of the
benefits derived from the techniques used in this research, so that physical fitness data can
reflect students’ physical fitness more objectively. Major implications for physical education
practice include dividing students into groups based on fitness levels rather than sex in PE
classes. Although BMI is not an appropriate indicator of overall physical fitness, height and
weight are appropriate moderate correlates of overall physical fitness. Moreover, the
existence of considerable individual differences in overall physical fitness at any one grade
level justifies the necessity of developing appropriate fitness programmes that accommodate
students’ individualized requirements and reminds teachers to cater for students’ individual
needs in PE classes. This research also provided practical value to the partner school with
regard to its PE programmes.
The findings of this study will be informative to physical education teaching practice and
policy making by providing a better knowledge basis for interpreting physical fitness
assessment results and giving appropriate feedback to students. The limitations of this study
are related to the large measurement errors for RMPFS person estimates such that overall
physical fitness estimations at the individual level have measurement errors too large to
allow almost any meaningful distinctions to be made between individuals. The overall
physical fitness measures and changes at the group level are more precise and, therefore,
informative for depicting students’ physical fitness development. Future research could
attempt to find solutions to reduce the measurement error of person estimates such as
developing and calibrating new physical fitness indicators into the Rasch scale.
VIII
TABLE OF CONTENTS
STATEMENT OF ACCESS ........................................................................................................... I
STATEMENT OF SOURCES: DECLARATION ......................................................................... II
STATEMENT OF SOURCES: ELECTRONIC COPY ................................................................ III
STATEMENT ON THE CONTRIBUTION OF OTHERS ......................................................... IV
ACKNOWLEDGEMENTS .......................................................................................................... V
ABSTRACT ................................................................................................................................ VI
TABLE OF CONTENTS........................................................................................................... VIII
LIST OF TABLES ....................................................................................................................... XI
LIST OF FIGURES .................................................................................................................... XII
CHAPTER ONE: INTRODUCTION ............................................................................................ 1
Background ............................................................................................................................ 1
Purpose of Study ..................................................................................................................... 4
Significance of Study.............................................................................................................. 4
Research Questions ................................................................................................................ 7
Basic Assumptions.................................................................................................................. 8
CHAPTER TWO: LITERATURE REVIEW ................................................................................. 9
Physical Fitness ...................................................................................................................... 9
Overview ........................................................................................................................ 9
The Structure of Physical Fitness ................................................................................. 10
Body Composition ........................................................................................................ 11
Cardiorespiratory Fitness .............................................................................................. 12
Muscular Strength ......................................................................................................... 13
Muscular Endurance ..................................................................................................... 13
Flexibility ..................................................................................................................... 14
Physical Fitness Test Protocols ..................................................................................... 14
Standards of Scores ...................................................................................................... 18
Physical Fitness Tests/Indicators in Hong Kong Primary Schools ............................... 19
Item Response Theory .......................................................................................................... 22
Rasch Model ......................................................................................................................... 26
The Mathematical Formulation of the Rasch Model ............................................................ 28
The Main Features of Rasch Model...................................................................................... 31
Linearity of Data ........................................................................................................... 31
Parameter Separation .................................................................................................... 32
A Single Scale for Items and Persons ........................................................................... 34
Unidimensionality ........................................................................................................ 35
Fit to the Rasch Model.................................................................................................. 36
Application of Rasch Model in Physical Education and Sports Science ...................... 39
Summary .............................................................................................................................. 43

IX
CHAPTER THREE: METHODOLOGY ..................................................................................... 44
Sample .................................................................................................................................. 44
Instruments: Physical Fitness Indicators .............................................................................. 45
BMI .............................................................................................................................. 45
6/9-minute Run ............................................................................................................. 46
1-minute Sit-ups ........................................................................................................... 46
Handgrip (Right and Left) ............................................................................................ 47
Sit-and-Reach ............................................................................................................... 47
Push-ups (Standard Push-ups and Modified Push-ups) ................................................ 48
Data Collection ..................................................................................................................... 50
Data Collation ....................................................................................................................... 53
Data Analyses ....................................................................................................................... 55
Model ............................................................................................................................ 55
Software ........................................................................................................................ 56
Iterative Sequence of Analytical Steps ......................................................................... 57
Ethics and Confidentiality .................................................................................................... 59
Limitations of Study Design ................................................................................................. 60
Sequencing of Research ....................................................................................................... 60
CHAPTER FOUR: DEVELOPMENT OF THE RMPFS ............................................................ 62
Introduction .......................................................................................................................... 62
Consideration of BMI ........................................................................................................... 62
Rasch Analyses Based on Raw Scores ................................................................................. 63
Logarithmic Transformation of Raw Scores ......................................................................... 69
Rasch Analyses of 9-Category Data (8 Indicators) ............................................................... 70
Rasch Analyses of 9-Category Data (7 Indicators) ............................................................... 72
Rasch Analyses of 9-Category Data (6 Indicators) ............................................................... 77
Rasch Analyses of 9-Category Data (4 Indicators) ............................................................... 80
Optimizing Category Structure ............................................................................................. 82
Rasch Analyses of 7-Category Data ..................................................................................... 84
Rasch Analyses of 7-Category Data without Underfitting Persons ...................................... 92
Considerations of Sex Differential Item Functioning (DIF) ................................................. 94
Properties of the RMPFS ...................................................................................................... 97
Summary ............................................................................................................................ 104
CHAPTER FIVE: RESULTS I MEASUREMENT OF STUDENTS’ OVERALL PHYSICAL
FITNESS .................................................................................................................................... 107
Introduction ........................................................................................................................ 107
Students’ Overall Fitness Development by Age ................................................................. 108
Sex Differences in Overall Fitness Development ............................................................... 110
Students’ Overall Fitness Development by Academic Year and Level ............................... 113
Students’ Overall Fitness Development by Cohort ............................................................. 115
Exemplar Cases .................................................................................................................. 119
Summary ............................................................................................................................ 123
CHAPTER SIX: RESULTS II RELATIONSHIPS BETWEEN RMPFS MEASURE AND
ANTHROPOMETRIC INDICATORS ....................................................................................... 126

X
RMPFS Measure by Age .................................................................................................... 127
The Relationship among RMPFS Measure, Height, Weight, and BMI .............................. 129
RMPFS Measure by Height ................................................................................................ 131
RMPFS Measure by Weight ............................................................................................... 133
RMPFS Measure by BMI ................................................................................................... 135
Summary ............................................................................................................................ 137
CHAPTER SEVEN: CONCLUSON AND DISCUSSION ........................................................ 139
Overview ............................................................................................................................ 139
Main Findings ..................................................................................................................... 141
Implications for Practice ..................................................................................................... 144
Recommendations for Future Research .............................................................................. 147
Summary ............................................................................................................................ 150
REFERENCE LIST .................................................................................................................... 151
APPENDIX A: DATA USE AGREEMENT ............................................................................... 166

XI
LIST OF TABLES
Table 2.1 Indicators for Health-Related Physical Fitness ................................................ 19
Table 3.1 Details of the Sample ....................................................................................... 45
Table 3.2 Physical Fitness Test Used in the Partner School ............................................. 49
Table 3.3 Data Summary .................................................................................................. 52
Table 3.4 Frequency of Zero Value .................................................................................. 53
Table 3.5 Frequency of Extreme Score ............................................................................ 54
Table 3.6 Descriptive Statistics of the Data ..................................................................... 55
Table 4.1 Categories for 6-minute Run and 9-minute Run .............................................. 64
Table 4.2 Raw Scores in Rasch Analyses ......................................................................... 64
Table 4.3 Scale Property (1) ............................................................................................. 65
Table 4.4 Category Structure for the 6-minute Run Data ................................................. 67
Table 4.5 Scale Property (2) ............................................................................................. 72
Table 4.6 Correlations among Fitness Indicators ............................................................. 73
Table 4.7 Scale Property (3) ............................................................................................. 74
Table 4.8 1st Contrast Plot for Scale 3 .............................................................................. 75
Table 4.9 Largest Standardized Residual Correlations for Scale 3 .................................. 76
Table 4.10 Largest Standardized Residual Correlations for Scale 4 .................................. 77
Table 4.11 Scale Property (4) ............................................................................................. 78
Table 4.12 Scale Property (5) ............................................................................................. 80
Table 4.13 Dimensionality Table for 4-indicator Scale (Scale 5) ...................................... 81
Table 4.14 Category Structure for the 6-minute Run Adopting 9-category Data ............... 83
Table 4.15 The Category Functioning of All the 4 indicators ............................................ 85
Table 4.16 Scale Property (6) ............................................................................................. 91
Table 4.17 Scale Property (7) ............................................................................................. 93
Table 4.18 Sex DIF of the Four Indicators ......................................................................... 95
Table 4.19 Scale Property (8) ............................................................................................. 96
Table 4.20 Scale Properties of the RMPFS ........................................................................ 99
Table 5.1 Overall Fitness Measure by Age .................................................................... 109
Table 5.2 Sex Differences in Overall Fitness ................................................................. 111
Table 5.3 Fitness Changes and Conjoint Measurement Error for Exceptional Groups .. 115
Table 5.4 Score Distributions in Two Indicators for Focus Group and Reference Group
............................................................................................................................................. 118
Table 6.1 Correlations among RMPFS Measure, Height, Weight, and BMI ................. 130

XII
LIST OF FIGURES
Figure 2.1 Item Characteristic Curves for 1-PL Model ......................................................... 23
Figure 2.2 Item Characteristic Curves for 2-PL Model ......................................................... 24
Figure 2.3 Item Characteristic Curves for 3-PL Model ......................................................... 25
Figure 4.1 Category Probability Curves for the 6-minute Run Data ..................................... 68
Figure 4.2 Category Probability Curves for the 6-minute Run Adopting 9-category Structure
............................................................................................................................... 71
Figure 4.3 Category Probability Curves for the 6-minute Run Adopting 9-category Structure
............................................................................................................................... 84
Figure 4.4 Category Probability Curves of the 4 Indicators Adopting 7-Category Structure 90
Figure 4.5 Item Map of the RMPFS.................................................................................... 100
Figure 4.6 Empirical (blue) and Expected (red) Item Characteristic Curves for RMPFS
Indicators ............................................................................................................. 102
Figure 4.7 Category Probability Curves for RMPFS Indicators ......................................... 103
Figure 5.1 Overall Fitness Development by Age (M ± 1S.D.) ............................................ 109
Figure 5.2 Overall Fitness Development by Age and Sex .................................................. 111
Figure 5.3 Overall Fitness Development by Age and Sex (M ± 1S.D.) .............................. 112
Figure 5.4 Students’ Overall Fitness Development by Academic Year and Level .............. 114
Figure 5.5 Students’ Overall Fitness Development by Academic Year and Level (M ± 1S.E.)
............................................................................................................................................. 114
Figure 5.6 Students’ Overall Fitness Development by Cohort and Academic Year ............ 116
Figure 5.7 Students’ Overall Fitness Development by Cohort and Academic Year (M ± 1S.E.)
............................................................................................................................................. 117
Figure 5.8 Individual Overall Fitness Developmental Profiles of Students ........................ 120
Figure 5.9 Individual Overall Fitness Developmental Profiles of Students (M ± 1S.E.) .... 121
Figure 5.10 Comparison between Students C and E ........................................................... 122
Figure 5.11 Overall Fitness Developmental Profiles of the Cohort 2003P1 (M ± 1S.E.) ... 123
Figure 6.1 RMPFS Measure for Age Percentiles (Boys) .................................................... 128
Figure 6.2 RMPFS Measure for Age Percentiles (Girls) .................................................... 128
Figure 6.3 RMPFS Measure for Height Percentiles (Boys) ................................................ 132
Figure 6.4 RMPFS Measure for Height Percentiles (Girls) ................................................ 132
Figure 6.5 RMPFS Measure for Weight Percentiles (Boys) ............................................... 134
Figure 6.6 RMPFS Measure for Weight Percentiles (Girls)................................................ 134
Figure 6.7 RMPFS Measure for BMI Percentiles (Boys) ................................................... 136
Figure 6.8 RMPFS Measure for BMI Percentiles (Girls) ................................................... 136
1
CHAPTER ONE
INTRODUCTION
Background
There is no doubt that children’s physical fitness is an important issue for parents,
educators, and the whole society. The World Health Organization (2002) officially
encouraged a physically active lifestyle for children in order to enhance children’s
physical fitness and reduce the risk of health problems. The justification of this
declaration was supported by many researchers (e.g., Biddle, Gerely, & Stensel, 2004;
Hasselstrom, Hansen, Froberg, & Andersen, 2002; Janz, Dawson, & Mahoney, 2002) who
claimed that good physical fitness and appropriate physical activity in children and
adolescents have positive influence for their current and future health. On the other hand,
good physical fitness is also beneficial to children’s psychological variables. For example,
Tortolero, Taylor, and Murray (2000) reported that physical fitness and physical activity
in children are related to higher self-esteem, self-efficacy, and perceived physical
competence and lower degree of depression and stress. A study conducted by the
California Department of Education (2005) indicated that there was a strong positive
relationship between physical fitness and academic achievement for grades 5, 7, and 9
students in California, the United States, although no causal evidence was found for such
relationship.
Some similar evidence comes from the Hong Kong contexts. After an intensive review of
existing data and research, Hui (2001) concluded that physical activity can effectively
prevent and lower the risk of major diseases and health concerns such as obesity,
coronary heart disease, diabetes, colon cancer, stroke, hypertension, osteoporosis, and

2
mental distress in Hong Kong Chinese populations. The positive relationship between
physical activities and academic achievement was also found for Hong Kong children.
Lindner (1997) reported that Hong Kong students with better academic performance
participated in physical activities more frequently than did students with poorer academic
performance.
Given the important role physical fitness might play in children’s life, it is difficult to
overestimate the importance of obtaining a clear and accurate profile of children’s
physical fitness levels so that education administrators, schools, and teachers can develop
and conduct appropriate physical fitness programs for children. In order to get such a
physical fitness profile, reliable assessment tools must be utilized and the measurement
results much be interpreted correctly.
In the current physical education contexts, the normal practice is that different
components of physical fitness, such as body composition, cardiorespiratory fitness,
flexibility, muscular endurance, and muscular strength, are assessed using different
indicators and children’s ability in these components is reported and interpreted
independently. The indicators widely used in Hong Kong primary schools include
6/9-minute Run, 1-minute Sit-ups, Push-ups, Sit-and-Reach, and so on. The same
approach is also used in large-scale physical fitness research projects. For example, To
(1985) administered the Asian Committee’s Standardized Physical Fitness Tests to 6,000
Hong Kong school-aged children. Nine indicators were included in the physical fitness
battery to assess five health-related components (anthropometric measures,
cardiorespiratory endurance, muscular strength, muscular endurance, and flexibility) and
one skill-related component (speed). In another study, Fu (1994) applied the
ICHPER.SD-ASIA Health-related Fitness Test in Hong Kong schools and collected data
from 20,304 school-aged children in 1990-91. The test battery covered four components
including anthropometric measures, muscular endurance, flexibility, and cardiorespiratory
endurance. In both projects, students’ performances for each indicator were reported and
ability in each component of physical fitness was interpreted independently.
3
The traditional approaches to physical fitness assessment result in, at least, two
deficiencies. The first is that the interpretation of scores in physical fitness indicators is
questionable. The evaluations and reports of children’s physical fitness are all based on
their raw scores for component-related physical fitness indicators. Since the raw scores
indicate only the ordering of the children’s performance, but have little inferential value
about is the size of the differences between different raw scores, this method might not
provide valid “measures” (Bond & Fox, 2007; Wright & Mok, 2000). For example, it is
obvious that a child who completes 30 sit-ups in 1-minute Sit-ups test has better muscular
endurance than a child who completes only 20 sit-ups in the same time. Unless raw data
such as these are put to some other use, such as estimating VO2max, it is difficult, even
impossible, to tell the exact ability difference between these two children along the
continuum of muscular endurance. The second deficiency is about the efficiency of
assessment. The current method of physical fitness assessment widely used in physical
education teaching and research contexts is obviously not an economical approach
because students must take all the separate tests in order to get the whole picture about
their abilities on different components of physical fitness. The time consuming
assessment task in the physical education curriculum increases teachers’ workload and
occupies resources which should be put into teaching (Drewett, 1991).
Is it possible to generate “measures” based on but beyond raw scores to reflect children’s
physical fitness levels? These measures would locate children’s positions appropriately
along the physical fitness continuum and add inferential value which cannot be provided
by raw scores, to children’s performances on physical fitness assessment.
Is it possible to combine the separate physical fitness indicators or, at least, some of them
into a single indicator which could support the calibration of children’s “overall” physical
fitness levels? The overall physical fitness indicator would facilitate interpretation and
reporting of the results of physical fitness assessment.
This study aims to find possible solutions to these two questions by adopting a Rasch
4
measurement approach.
Purpose of Study
The main purpose of this study was to develop a Rasch Measurement Physical Fitness
Scale (RMPFS) consisting of the physical fitness indicators routinely used in Hong Kong
primary schools. The aim was to calibrate primary school-aged students’ overall physical
fitness levels by integrating different components of health-related physical fitness
including body composition, cardiorespiratory fitness, flexibility, muscular endurance,
and muscular strength. Rasch calibration of the raw scores for physical fitness indicators
would transform those scores into interval measures on a logit (log odds unit) scale, so
that the interval measures would have consistent meaning for both person and item
estimates so that interpretation of person ability and item difficulty takes place in a single
stable framework.
Furthermore, if a suitable RMPFS were developed it could be used to analyse
cross-sectional and longitudinal data of different cohorts of students’ to map
developmental trends in overall physical fitness and the changing patterns of students’
Rasch physical fitness measures.
Significance of Study
Numerous studies have been conducted on the relationship between health-related
physical fitness, or the components of health-related physical fitness, and other physical
or psychological variables including the relationship between cardiorespiratory fitness
and metabolic syndrome (Kullo, Hensrud, & Allison, 2002), the relationship between
cardiorespiratory fitness and self-reported physical function in cancer patients (Thorsen,
Nystad, Stigum, Hjermstad, Oldervoll, Martinsen et al., 2006), the relationship among
5
cardiovascular fitness, percentage of body fat and moderate and vigorous intensities of
physical activity (Gutin, Yin, Humphries, & Barbeau, 2005), the relationship between
physical fitness and psychological well being (Blignaut, 1998), and the relationship
between physical fitness and academic achievement for elementary and middle school
students in the United States (California Department of Education, 2005) as well as for
Hong Kong children and youth (Lindner, 1997). There is also research concerning the
relationships among different components of health-related physical fitness. For example,
Marsh and Redmayne (1994) studied the relationship between components of physical
fitness and components of physical self-concept of 105 young adolescent girls aged 13 to
14 years. Five physical fitness components including endurance, balance, flexibility,
static strength, and explosive strength/power were examined in that study. The findings
indicated that the correlations among the five components of physical fitness varied from
0.024 to 0.437.
However, the researcher has found no attempt to combine the indicators of different
components of health-related physical fitness into one overall physical fitness indicator in
the current research literature. This study would be a meaningful start with the purpose of
establishing a unidimensional Rasch-scaled indicator which integrates students’
performances on different components of physical fitness tests to represent primary
school-aged students’ overall health-related physical fitness. With this scale, the
health-related physical fitness level of any primary school-aged student, irrespective of
sex and age, could be located in the common trait continuum in a simple and efficient
way. That would be an innovative and practical way for Hong Kong schools and teachers
to evaluate primary school-aged students’ health-related physical fitness because their
overall fitness levels could be calibrated on the common scale even if the student takes
only one of physical fitness tests from among the several components.
Compared to traditional approaches to physical fitness assessment, the Rasch calibrated
physical fitness scale and indicators have the following advantages.

6
The first, a Rasch scale provides interval measures which facilitate interpretation of
physical fitness assessment results and comparisons among children. Although raw data
appear as interval units, they indicate only ordering but not any proportional meaning in
terms of physical fitness. For example, 2,000m. is twice as far as 1,000m from an
algebraic perspective. There is no doubt that boy A who has completed 2,000 metres in a
9-minute Run test has better cardiorespiratory fitness than boy B who completed only
1,000 metres. But it is hard to know exactly the difference in physical fitness levels
between these two boys. One cannot say that A is as twice physically fit as B because the
difficulty of completing the second 1,000m. is much higher than running the first 1,000m
in a 9-minute Run test. The Rasch-scaled indicator can solve this inferential problem
because the logit scale provides linear interval measures that have consistent and stable
meaning regarding the differences in physical fitness levels between persons or items.
The second, a Rasch scale provides sample distribution-free and item distribution-free
measures. Measurement should be “objective” and objective measurement should be
sample distribution-free and item distribution-free. A Rasch calibrated fitness scale could
fulfill this requirement. With a Rasch scale, there is no need for any specific reference
norm to give a student’s rank or percentile. Both students and physical fitness indicators
can be located on the common physical fitness scale directly, making it easy to compare
students’ performances on different physical fitness indicators as long as the indicator is
calibrated on the scale.
The third, a Rasch scale makes it possible to construct an overall physical fitness
indicator that summarizes a student’s physical fitness in different components.
Traditionally, different components of physical fitness have different indicators. It is very
complicated and inconvenient to obtain a clear picture of a student’s overall physical
fitness unless a multifaceted profile which contains scores to each component of physical
fitness was provided (Fleishman, 1964; Marsh, 1993). The researcher found no attempt to
combine the indicators of different components into an overall physical fitness indicator
in the research literature. Although the possibility of doing so could be debatable topic,

7
the benefits which would derive from having a single overall fitness measure suggest that
it is well worth trying. If the overall physical fitness indicator works well, primary
school-aged students’ overall physical fitness levels could be calibrated on the common
scale even if the student just takes only one of the physical fitness tests from among the
five components. That will be very meaningful to physical education teaching since
assessment of students’ physical fitness is a time consuming task and is regarded as one
of the major challenges for physical educators (Drewett, 1991). A simplified indicator and
reporting system would provide a more cost efficient method and reduce teachers’
workload so that they could put more time and resources into the teaching and learning
that promotes children’s health.
In summary, the findings of this study could be very helpful to physical education
teaching and policy making by providing a better knowledge basis for interpreting
physical fitness assessment results and giving appropriate feedback to students.
Research Questions
The present study aims to address the following questions related to the physical fitness
indicators used with the Hong Kong primary school-aged students:
1. Is it possible to develop a RMPFS which integrates all five, or at least some,
components of health-related physical fitness?
2. To what extent does the RMPFS that is developed to measure students’ overall
physical fitness fit to the Rasch model?
3. To what extent can the overall physical fitness indicator effectively describe the
development of Hong Kong primary school-aged students’ overall physical fitness
over time?
4. What are the relationships among primary school-aged students’ overall physical

8
fitness measured by the RMPFS and other factors, such as age, height, and weight?
Basic Assumptions
The present study relies on these two basic assumptions which follow:
1. The physical fitness indicators used in this study are reliable and valid to assess
primary school-aged students’ abilities on the components of health-related physical
fitness; and
2. The data, i.e., the records of primary school-aged students’ performances on physical
fitness indicators, collected by physical education teachers are authentic and reliable.

9
CHAPTER TWO
LITERATURE REVIEW
Physical Fitness
Overview
In order to make valid measurements, a clear definition of the trait or construct under
measurement must be consolidated at the first stage. Fitness is an elusive concept that has
no universally accepted definition in the context of exercise and health (Bouchard,
Shephard, Stephens, Sutton, & McPherson, 1990). Nevertheless, the common point
shared by different conceptualizations is that it is related to, but different from, health and
wellness (Corbin, Welk, Corbin, & Welk, 2006). Generally speaking, fitness is a many
faceted construct which has different aspects including physical fitness, emotional fitness,
social fitness, spiritual fitness, intellectual fitness, and environmental fitness (Miller, 2006;
Powers, Dodd, & Noland, 2006). It is no doubt that, from the physical educators’
perspective, physical fitness is of prime interest. Generally, it is accepted that physical
fitness is made up of two components, namely, health-related and skill-related
components (Corbin et al., 2006; Miller, 2006; Williams, Harageones, Johnson, & Smith,
2000).
Over recent decades, physical fitness has been defined from different perspectives and
assessed using many methods. The conception of physical fitness based on military or
athletic purpose has survived centuries since the ancient Chinese and Athenians (Sharkey,
1991). In the 20th century, the definition of physical fitness has shifted slowly towards a
work- or living-related conception. For example, Clarke (1979) defined physical fitness
as the ability to carry out daily tasks with enough energy and alertness without extreme

10
fatigue and still have energy to handle emergencies and enjoy leisure time. Clarke (1979,
p.28) further pointed out the importance of physical fitness to individuals in modern
society by emphasizing that “Physical fitness affects all phases of human existence. It is
vital for the whole person in order to permit total effectiveness”. In a research report
provided by U.S. Department of Health and Human Services (1996), physical fitness is
regarded as a set of traits that people have or obtain to take part in physical activity.
Howley and Franks (1997) defined physical fitness from a health science perspective.
They proposed physical fitness as a state of well-being with low risk of health problems
and energy to perform a variety of physical activities. More recently, physical fitness has
been viewed from a broader perspective. Corbin and his colleagues (2006) defined
physical fitness as
… the body’s ability to function efficiently and effectively. It consists of
health-related physical fitness and skill-related physical fitness, which have at least
eleven components, each of which contributes to total quality of life. Physical fitness
also includes metabolic fitness and bone integrity. Physical fitness is associated with
a person’s ability to work effectively, enjoy leisure time, be healthy, resist
hypokinetic diseases, and meet emergency situations. (Corbin et al., 2006, p.7)
The Structure of Physical Fitness
In traditional opinion widely accepted among physical fitness educators and researchers,
physical fitness is a multidimensional construct, and no single indicator or component
adequately represents the entire construct (Fleishman, 1964; Marsh, 1993; Safrit, 1981;
Sharkey, 1991). The components emphasized by skill-related physical fitness include
speed, agility, balance, coordination, power, and reaction time (Corbin et al., 2006; Miller,
2006; Pate, 1983). In contrast, health-related physical fitness consists of body
composition, cardiorespiratory fitness, flexibility, muscular strength, and muscular
11
endurance (Corbin et al., 2006; Golding, 2000; Miller, 2006; Williams et al., 2000).
Although skill-related physical fitness is related to an individual’s health just as is
health-related physical fitness, it is more appropriately interpreted as an indicator of
athletic or sporting performance rather than of health, especially from a physical
education perspective. On the other hand, health-related physical fitness and its
components are directly associated with good health and lower risk of health problems
(Corbin et al., 2006). Recently, less importance has been paid to skill-related physical
fitness by researchers and educators in determining overall physical fitness levels, while
more and more importance has been attached to health-related components of physical
fitness which help to ensure healthy and efficient function of organic systems of the body
(Hinson, 1995; Miller, 2006; Pate, 1994; Safrit, 1990). This study also focuses on
health-related physical fitness.
From the classic definition used in the majority of contemporary research (e.g.,
AAHPERD, 1989; Corbin et al., 2006; Council of Europe, 1988; Golding, 2000; Hinson,
1995; Miller, 2006; Williams et al., 2000), the widely accepted conception of
health-related physical fitness can be summarized as a five-component concept consisting
of body composition, cardiorespiratory fitness, muscular strength, muscular endurance,
and flexibility. This conceptual structure was also promoted in Hong Kong by the School
Physical Fitness Award Scheme (Hong Kong Education and Manpower Bureau, 2005b)
which was supported by the Hong Kong Education and Manpower Bureau and Hong
Kong Childhealth Foundation.
Body Composition
Body composition refers to the body fat weight and lean body weight (Miller, 2006). This
two-component model is popular among physical fitness educators and researchers
(Heyward, 2002; Vehrs & Hager, 2006). In this model, the body is ‘divided’ into a fat
component and a fat-free component. The percentage of body fat is usually used to

12
classify the level of body composition. There are many sophisticated methods to assess
percentage of body fat, such as air displacement plethysmography (e.g., BodPod), Dual
Electron X-Ray Absorptiometry (DEXA), and magnetic resonance imaging (MRI).
However, the widely used field indicator for body composition estimates in physical
education is skinfold method. The results of measured folds give an estimate of the
percentage of an individual’s fat component mass in contrast to the fat-free component
mass including water, muscle, and bone. When equipment-dependent body fat estimates
are not available, the BMI is used to provide some information related to body
composition although it is not a recommended method since it does not estimate the
percentage of body fat (Miller, 2006). BMI is defined as body weight (kg) divided by
height (m) squared (BMI = weight (kg) / height (m)2). It can be seen from the definition
and assessment methods that, distinguished from other fitness components, body
composition is a non-performance indicator of health-related physical fitness.
Cardiorespiratory Fitness
Cardiorespiratory fitness, also known as aerobic fitness, is defined as the ability to
perform whole body exercise involving large muscle groups at moderate to high intensity
for prolonged periods (American College of Sports Medicine, 2000). Cardiorespiratory
fitness is of special importance in maintaining good health for youth since good
cardiorespiratory system fitness is helpful both for weight control and protection from
heart disease (U.S. Department of Health and Human Services, 1996). There are many
kinds of field indicators of cardiorespiratory fitness used in physical education, including
1-mile, 1.5-mile, and 3-mile run/walk, 9-minute and 12-minute run, 12-minute swimming,
and so on. In western countries (e.g., U.S., Australia) the 1-mile run and 9-minute run are
widely used indicators to assess cardiorespiratory fitness of children aged five or older,
while other indicators are usually used for school-aged students and adults. Another
popular indicator of cardiorespiratory fitness is the Progressive Aerobic Cardiovascular

13
Endurance Run (PACER) which provides a valid alternative to the customary distance run
(The Cooper Institute, 2004). PACER is recommended for all ages, but is strongly
encouraged for students of key stage 3 (grades 7 to 10).
Muscular Strength
Muscular strength refers to the ability of a muscle or muscle group to develop maximal
force in a single contraction (Heyward, 2002). Muscular strength can be classified into
three types: isometric strength, isotonic strength, and isokinetic strength (Baumgartner,
Jackson, Mahar, & Rowe, 2007; Heyward, 2002). Laboratory tests using cable
tensiometers, load cells and dynamometers are very popular in assessing muscular
strength. Weight-training machines and free weights serve as alternatives in settings
without those sophisticated instruments. However, in physical education contexts, the
field indicators such as arm lift, leg strength, shoulder lift, torso strength, and handgrip
strength are common indicators of muscular strength because those tests do not require
expensive equipment and are easily administered to a large sample.
Muscular Endurance
Muscular endurance is the ability of a muscle or a muscle group to resist a sub-maximum
force for extended periods (Heyward, 2002). Muscular endurance can be classified into
static endurance and dynamic endurance. If the resistance is immovable, the muscle or
muscle group exerts static endurance. If muscle contractions involve joint movement, the
muscle or muscle group exerts dynamic endurance. Many indicators with limited
equipment requirement are very popular among schools to assess students’ muscular
endurance. These indicators include sit-ups, curl-ups, pull-ups, and push-ups. Sit-ups and
curl-ups assess abdominal endurance which is of importance not only in promoting good
posture as well as correct pelvic alignment but also in maintaining lower back health. The

14
pull-ups and push-ups assess upper body, arm and shoulder girdle endurance which is
related to maintenance of correct posture.
Flexibility
Flexibility refers to the ability to move a joint or series joints through a maximum range
of motion without injury (Heyward, 2002). There is no doubt that certain levels and types
of flexibility are necessary for individuals to perform physical activity, but the appropriate
degree of flexibility is still a question among physical educators and researchers
(Baumgartner et al., 2007). Many valid and practical field indicators are available for
physical educators to assess flexibility, such as sit-and-reach, trunk and neck extension,
flexed arm hang, should stretch, and shoulder-and-wrist elevation.
Physical Fitness Test Protocols
Methods of assessing physical fitness can be categorized into two types: laboratory
methods and field methods. Laboratory methods are normally used in small-scale
research because it requires expensive equipment and extensive training of test
administrators that are not available in most of schools. The test batteries developed in
most of large-scale physical fitness programme are categorized as field methods. These
kinds of tests have few equipment requirements and are easily conducted in the large
sample typically found in physical education settings.
Many physical fitness test protocols have been developed with the purpose of reflecting
individuals’ performances on different components of physical fitness. In United States,
the first national physical fitness test for youth was the AAHPER Youth Fitness Test
developed by the American Association for Health, Physical Education and Recreation
(1958). In 1980, the American Alliance of Health, Physical Education, Recreation and
15
Dance (AAHPERD) Health-Related Physical Fitness Test (AAHPERD, 1980) was
developed on the basis of the earlier AAHPER Youth Fitness Test for use with college
students to assess health-related components of physical fitness rather than skill-related
physical fitness. The AAHPERD Health-Related Physical Fitness Test assesses four
components including 1) cardiorespiratory capacity and endurance; 2) body composition;
3) abdominal muscular strength and endurance; and 4) flexibility. Norms of college
students on the AAHPERD test battery were also developed (Pate, 1985) so that physical
fitness educators could interpret testing results in a convenient way.
In 1989, the Physical Best Physical Fitness Program was introduced by AAHPERD in
order to enhance students’ physical fitness by providing both program activities and a test
battery (AAHPERD, 1989). The program aimed to equip students with more knowledge
of physical activities and skills as well as to motivate students to be more involved in
physical activities so that they might enjoy lifelong fitness and good health. The Physical
Best program incorporates five health-related components: 1) aerobic endurance, 2) body
composition, 3) abdominal muscular strength and endurance, 4) upper-body muscular
strength and endurance, and 5) flexibility. Unlike the AAHPERD Health-Related Physical
Fitness Test that is used in a norm-referenced framework, the Physical Best program
utilizes criterion-referenced standards to interpret students’ performances on physical
fitness tests. That means children’s performances are compared to a health fitness
standard instead of norm-data.
The Cooper Institute for Aerobics Research (CIAR) developed the FITNESSGRAM
which aimed at providing comprehensive health-related fitness assessment and a
computerized reporting system. In 1993, AAHPERD endorsed and promoted the
FITNESSGRAM as a replacement for the Physical Best fitness tests (Miller, 2006). The
FITNESSGRAM assesses six health-related components including 1) aerobic capacity, 2)
body composition, 3) abdominal strength and endurance, 4) trunk extensor strength and
flexibility, 5) upper body strength and endurance, and 6) flexibility. Similar to the
Physical Best program, criterion-referenced standards are used by the FITNESSGRAM in
16
interpreting assessment results (The Cooper Institute, 2004).
Another nationwide program for physical fitness in the United States is the YMCA
Fitness Testing and Assessment Program which was developed by the Young Men's
Christian Association (YMCA). The first edition of Y’s Way to Physical Fitness including
a standardized fitness assessment protocol was published in 1973 and revised in 1982 and
again in 1989. In the fourth edition of YMCA Fitness Testing Manual published in 2000,
five components of physical fitness were included in the assessment protocol: body
composition, cardiovascular ability, flexibility, muscular strength, and muscular
endurance (Golding, 2000).
There are also many important developments in physical fitness assessment outside
United States. For example, the Manitoba Department of Education (Canada) (1977)
developed the Manitoba Physical Performance Test for use with boys and girls aged 5 to
19. Indicators were designed to assess four components of health-related physical fitness
including 1) cardiovascular endurance; 2) flexibility; 3) muscular endurance; and 4) body
composition. A national fitness test protocol for Canadians aged 15 to 69 - the Canadian
Physical Activity, Fitness & Lifestyle Appraisal Manual - was developed by the Canadian
Society for Exercise Physiology (1998). This manual is a health-related physical fitness
assessment protocol which covers three components including 1) body composition, 2)
aerobic fitness, and 3) musculoskeletal fitness. The indicators for body composition
include BMI, sum of five skinfolds (SO5S), waist girth (WG), and sum of two trunk
skinfolds (SO2S). The aerobic fitness is assessed using the mCAFT - an indirect,
submaximal test – which investigates heart rate response to progressively increasing,
pre-determined workloads. The indicators for musculoskeletal fitness include grip
strength, push-ups, sit-and-reach, partial curl-up, vertical jump, peak leg power, and back
extension. In other words, the musculoskeletal fitness consists of health-related
components (muscular strength, muscular endurance, flexibility) as well as a skill-related
component (muscular power).

17
Many European countries have their own physical fitness assessment programme: the
European Test of Physical Fitness (EUROFIT TEST) developed by the Council of Europe
(1988). This test battery covers five health-related components including 1)
anthropometric measures; 2) flexibility; 3) strength; 4) muscular endurance; and 5)
cardiorespiratory endurance as well as skill-related components such as balance and
speed.
Some of the indicators in the fitness batteries discussed above (e.g., the AAHPERD
Health-Related Physical Fitness Test) are now commonly used in Hong Kong schools for
assessing students’ health profiles, as well as for talent identification (McManus, Sung, &
Tsang, 2003). In order to enhance Hong Kong students’ awareness of health-related
physical fitness and to encourage children to be involved in more physical activities, the
Hong Kong Education and Manpower Bureau and Hong Kong Childhealth Foundation
promoted the School Physical Fitness Award Scheme (Hong Kong Education and
Manpower Bureau, 2005b). This scheme contains fitness indicators assessing students’
fitnss level on five health-related components including 1) body composition; 2)
cardiorespiratory endurance; 3) muscular strength; 4) muscular endurance; and 5)
flexibility. Most Hong Kong schools, both primary and secondary, adopted this scheme
and used the local test battery provided to assess students’ fitness levels.
In recent decades, fitness batteries specifically developed for Asian children were used in
several important large scale physical fitness research projects conducted in Hong Kong.
To (1985) administered the Asian Committee’s Standardized Physical Fitness Tests to
6,000 Hong Kong school children. Nine indicators were included in the assessment
protocol covering five health-related components including 1) anthropometric measures;
2) cardiorespiratory endurance; 3) muscular strength; 4) muscular endurance; and 5)
flexibility as well as one skill-related component - speed.
Fu (1994) collected physical fitness data from 20,304 Hong Kong school children using
the ICHPER.SD-ASIA Health-related Fitness Test in 1990-91. The ICHPER.SD-ASIA

18
Health-related Fitness Test aims to provide an alternative program for national fitness
assessment programs in Asian countries, many of which still emphasize skill-related
physical fitness. This test protocol covers four health-related components including
anthropometric measures, muscular endurance, flexibility, and cardiorespiratory
endurance.
Standards of Scores
Another important issue relating to the physical fitness assessment has to do with the
score standards. When interpreting the raw data obtained from the physical fitness
assessments, one cannot attach meaning to a score without a reference standard. Normally,
there are two kinds of standards - norm-referenced and criterion-referenced standards -
which are widely accepted among researchers. A norm-referenced standard refers to the
average level of performance of members of a well-defined sample. In this approach,
children’s performances on physical fitness indicators are compared to those of a
reference group. It is worth noting that the norm (i.e., average) level does not always
mean a desirable level of physical fitness (Baumgartner et al., 2007) because the norm is
based on a specific group whose average level might vary considerably from the desirable
or criterion level. A criterion-referenced standard, on the other hand, refers to a standard
of performance which indicates a desired level of performance that an individual should
attain. Using a criterion-referenced standard, children’s performance on a physical fitness
indicator is compared to the standard which was established based on the relationship
between scientific data and physical fitness or health rather than on others’ score which
might or might not reflect desired levels of health. Among the fitness batteries mentioned
in above section, some are norm-referenced tests (i.e., the AAHPERD Health-Related
Physical Fitness Test), and some are criterion-referenced tests (i.e., the FITNESSGRAM
and the YMCA Fitness Testing and Assessment Program).

19
Physical Fitness Tests/Indicators in Hong Kong Primary Schools
There are many field tests/indicators which are used for the assessment of the five
health-related physical fitness components which are promoted in Hong Kong by the
School Physical Fitness Award Scheme. Some of the indicators that are widely used for
physical fitness assessment in many countries are summarized in Error! Reference
source not found..
Table 2.1 Indicators for Health-Related Physical Fitness
Component
Covered
Indicators Factors Tested
Body
Composition
Skinfold measurements Body Composition
Air displacement plethysmography
(BOD POD)
Body Composition
BMI Body Composition
Waist girth Body Composition
Cardiorespiratory
Fitness
1-mile run (for all students) Cardiorespiratory Fitness
9-minute run (for all students) Cardiorespiratory Fitness
1.5-mile run (for students 13 years or
older)
Cardiorespiratory Fitness
The PACER (for all ages) Cardiorespiratory Fitness
Step test Cardiorespiratory Fitness
The bicycle ergometer test Cardiorespiratory Fitness
Muscular
Strength
Handgrip Static strength of grip
muscles
1-Repetition Maximum (RM) bench
press (ages 20 or above)
Arm extension muscles
1-Repetition Maximum (RM) leg
press (ages 20 or above)
Lower leg extension
muscles
Sit-ups (strength) (ages 12 or above) Abdominal and trunk
flexion muscles
Pull-up (strength) (ages 12 or above) Arm and shoulder girdle
strength
Muscular
Endurance
1-minute Sit-ups (endurance) (ages 5
or above)
Abdominal endurance
Curl-up (ages 5 or above) Abdominal endurance
Push-ups and modified push-ups
(ages 10 or above)
Arm and shoulder girdle
endurance

20
Pull-up (endurance) (ages 9 or
above)
Arm and shoulder girdle
endurance
Modified Pull-up (ages 5 or above) Upper body muscular
endurance
Flexed-arm hang (ages 9 or above) Arm and shoulder girdle
endurance
Flexibility
Sit-and-reach (ages 5 or above) low back and hamstring
flexibility
Back-saver sit-and-reach hamstring flexibility
Trunk and neck extension (ages 6 or
above)
Relative flexibility of the
trunk
Shoulder and wrist elevation (ages 6
or above)
Relative flexibility of the
shoulder and wrist
Shoulder stretch Should flexibility
The School Physical Fitness Award Scheme has adopted the following indicators to assess
the five components of health-related physical fitness in Hong Kong. Two sites skinfold
method (sum of triceps and calf skinfolds) is used to estimate the body composition. A
6/9-minute Run indicator is used to assess the cardiorespiratory system. The flexibility of
back and the hamstring (back of the upper legs) muscles is assessed using a
Sit-and-Reach indicator. Handgrip (right and left) indicator is used as the indicator to
evaluate the static strength of the right and left hand flexor muscles. Two different
indicators are used for primary and second students to assess their muscular endurance. A
1-minute Sit-ups indicator is used to assess primary school-aged students’ endurance of
the abdominal muscles. A Push-ups indicator is used to assess secondary school-aged
male students’ arm and shoulder girdle endurance while a modified Push-ups (bent-knee
Push-ups) indicator is used for secondary school-aged female students as the alternative
to the standard Push-ups indicator. It can be seen that Hong Kong practice of physical
fitness assessment is consistent with that in many other countries. All the fitness
indicators included in the School Physical Fitness Award Scheme are listed in Table 2.1
except the 6-minute Run.
Hong Kong primary schools adopted norm-referenced standards in interpreting students’
raw scores for these physical fitness indicators. The norm-referenced standards for the

21
current physical fitness indicators in Hong Kong were obtained through a program carried
out by the Education Department and Hong Kong Child Health Foundation in 1999 and
2000. The sample comprised 4,600 primary school-aged students aged 6 to 12 years from
23 Hong Kong primary schools (Hong Kong Education and Manpower Bureau, 2005b).
Percentile ranks transformed from raw scores were used to evaluate each student’s
performance in relation to that of peers of the same age and sex. For example, a
performance of 19 repeats on a 1-minute Sit-ups test is at the 75th percentile for a
6-year-old boy. That means 75% of the 6-year-old boys completed fewer than 19 sit-ups
in the test. A 6-point ordinal score was then ascribed to the student according to her/his
percentile rank in order to make the scores more understandable to students and their
parents. The scale allocation is as follow:
0: < 10%
1: 10% - 25%
2: 25% - 50%
3: 50% - 75%
4: 75% - 90%
5: ≥ 90%
It is worth noting that the percentile ranks provide only a rough basis for comparison
among students and could be regarded as an indicator of students’ relative strengths and
weaknesses (Williams et al., 2000). However, even the percentile ranks fail to provide
accurate or direct information about students’ ability in the latent trait under measurement.
Use of numbers/counts and their allocation of norm referenced ratings do not allow for
the direct assessment of the abilities against some objective standard.
22
Item Response Theory
Molenaar (1995) briefly summarized the history of measurement of human behavior as a
step by step development from measurement by fiat, to formal measurement, to Classical
Test Theory (CTT), and finally to Item Response Theory (IRT). Without strict quality
control processes, measurement by fiat relied only on the domain experts’ judgments and
claims. Formal measurement made it possible to assess the quality of measurement by
introducing some necessary assumptions and restrictions of empirical data into
measurement. CTT made a further progress by dividing the total test score into a true
score component and an error component. However, CTT makes so few, weak
assumptions for measurement that it faces a test validity dilemma. Individual ability
parameters are dependent on a given test under a given circumstance, and item difficulty
parameters also rely on a given group of examinees assumed to be a representative
sample of a given population. This kind of item dependence and sample dependence
inherent to CTT makes it impossible to predict individuals’ response to items unless those
items have been previously administered to similar individuals (Lord, 1980).
IRT is a latent trait model with the purpose of measuring an unobservable, or latent,
variable. The latent trait of a person cannot be observed directly and is reflected by test
scores or performances. As an alternative approach to CTT, IRT is a family of
mathematical descriptions of the probability of an individual’s response to an item. The
individual’s ability parameter (usually denoted θ) and the item’s difficulty parameter
(usually denoted b) are estimated on the same latent trait (Wainer & Mislevy, 2000).
IRT’s underlying idea is that the probability of an answer of any person to a given item is
a simple function of the person’s position on the latent trait and the relevant item
parameters (Molenaar, 1995). IRT models describe the probabilistic relationship between
an individual’s position on the latent trait and the position of the item that the individual
encountered (Molenaar, 1995; Weiss, 1983).
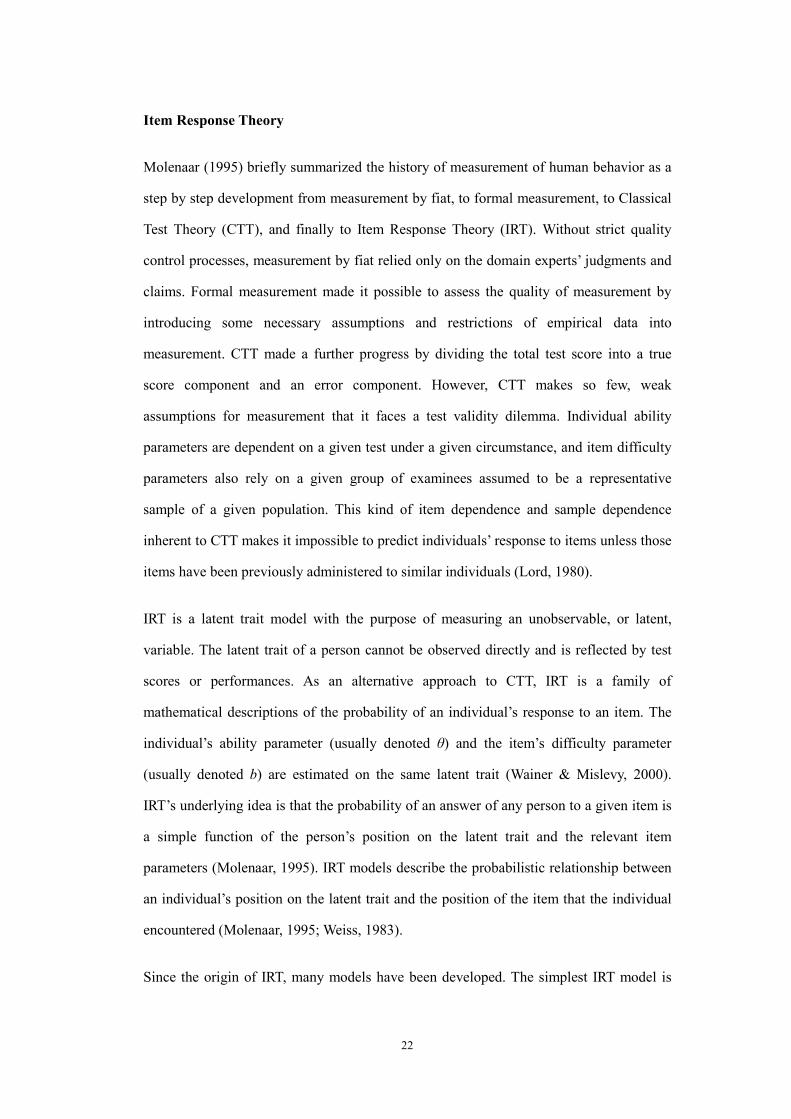
Since the origin of IRT, many models have been developed. The simplest IRT model is
23
the one-parameter logistic model (1-PL model). It is so called because this model
concerns only a single item parameter, i.e., item difficulty (b), and predicts probabilistic
response based on the interaction between item difficulty and individual ability (Wainer
& Mislevy, 2000). The model can be expressed as the logistic function.
Where P(θ) is the probability of individual with a given ability θ answering correctly to a
particular item with difficulty level b. The interaction between person ability and item
difficulty could be described more clearly in Item Characteristic Curves (ICC) (also
termed trace lines or item response functions). Figure 2.2 presents an example of an ICC
for the 1-PL model. The three curves in the figure represent three items with different
difficulties. It can be seen that, for a person with given ability, the probability of getting
the right answer to an item is only determined by the item difficulty.
Figure 2.1 Item Characteristic Curves for 1-PL Model
(1)
Ability
Pro
bab
ilit
y o
f R
igh
t A
nsw
er
P(θ) = 1
1+ e – ( θ - b)
24
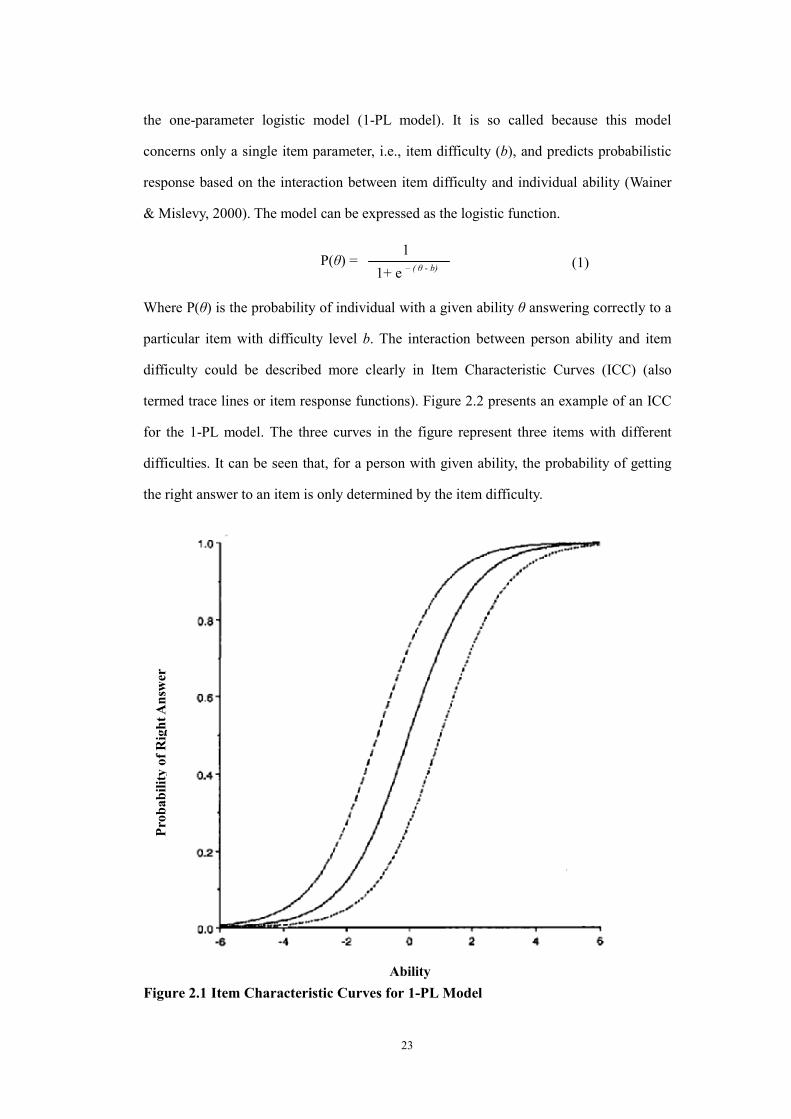
In addition to item difficulty (b), the two-parameter logistic model (2-PL model)
incorporates a second item parameter, item discrimination (usually denoted a), to account
for the response to a particular item besides item difficulty. Item discrimination is
represented by the slope of the ICC. An item with a steeper curve is more discriminating
than an item with flatter curve. The equation for 2-PL model is
The relevant ICCs in Figure 2.3 facilitate understanding of the 2-PL model.
Figure 2.2 Item Characteristic Curves for 2-PL Model
The item discrimination (a) is characterized as the slope of the curves. It can be seen that,
unlike the ICCs of the 1-PL model in which the curves have the same slope (see Figure
2.2), the curves in the 2-PL model have different slopes. Figure 2.3 presents three items
(2)
Ability
Pro
bab
ilit
y o
f R
igh
t A
nsw
er
P(θ) = 1
1+ e – a ( θ - b)
25
with different item discriminations. In the 2-PL model, the probability of a person with a
given ability level to get the right answer is influenced by the item difficulty and item
discrimination simultaneously.
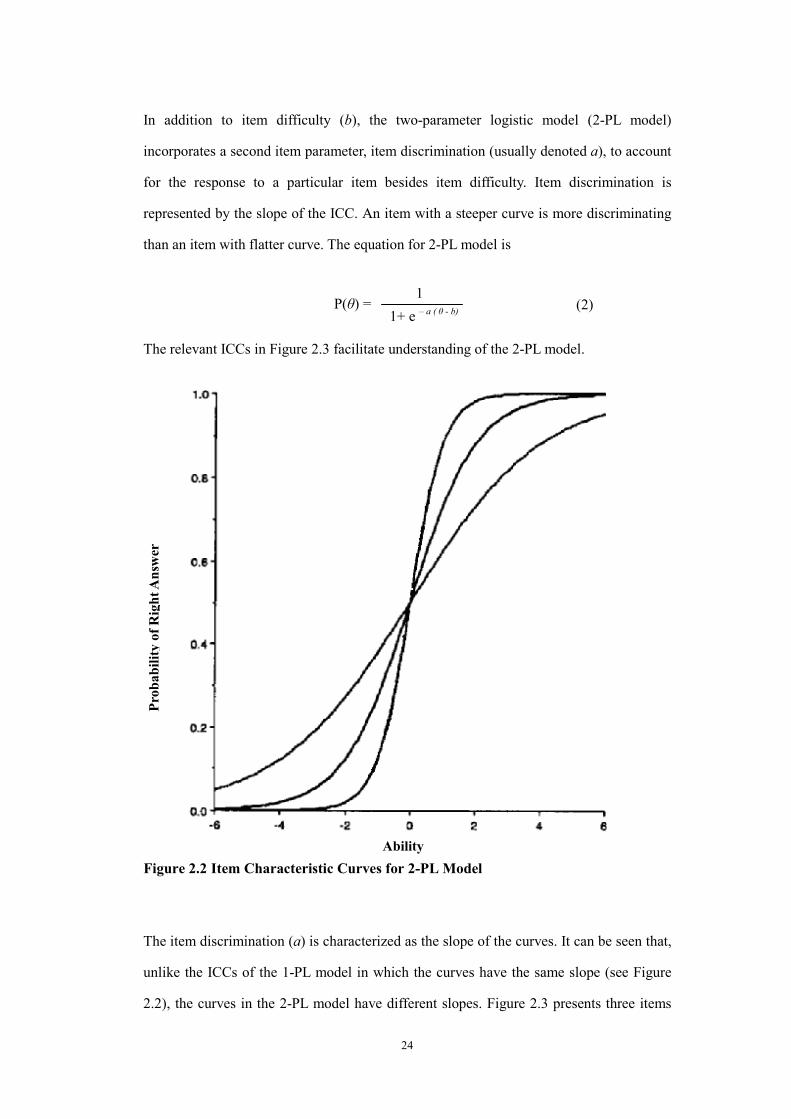
The three-parameter logistic model (3-PL model) expands the 2-PL model by adding a
third item parameter, a pseudo-chance parameter (also known as guessing parameter,
usually denoted c), in the model. The c parameter is the low point of the ICC as it nears
negative infinity on the horizontal axis, i.e., the probability of getting the item right for a
person with “zero ability”. The model can be expressed by the following equation.
Figure 2.3 Item Characteristic Curves for 3-PL Model
(3)
Ability
Pro
bab
ilit
y o
f R
igh
t A
nsw
er
P(θ) = c + 1 - c
1+ e – a ( θ - b)

26
Example ICCs for the 3-PL model are presented in Figure 2.4. The two curves in the
figure represent two items with different pseudo-chance parameter. It can be seen that, the
probabilities of getting these two items right by guessing for a person with “zero ability”
are different.
Rasch Model
The Rasch model for measurement (e.g., Andrich, 1988) is a latent trait model named
after the Danish mathematician and statistician Georg Rasch (1901-1980) who originally
developed this model. The mathematical exposition of Rasch model is similar to that of
IRT, and the Rasch model is often, somewhat misleadingly, regarded as a special case of
the 1-PL model making the other two parameters - item discrimination parameter (a) and
guessing parameter (c) - constant. However, Rasch model distinguished itself from other
IRT models with its unique features. As pointed out by Wright (1997), variant item
discrimination (a) indicates item bias and multidimensionality which should be rejected
by objective measurement, and guessing (c) should not be regarded as an item parameter
but an unreliable person liability. Therefore, Rasch model does not parameterized item
discrimination and guessing in the measurement model, but treats variation in
discrimination and guessing as sources of noises for which researchers should try to
diagnose the impact on the measurement.
Although Rasch model was developed originally in educational contexts, it was expected
to solve a basic measurement problem common to all social sciences (Andersen, 1995). In
order to parallel the kind of objective, fundamental measurement executed successfully in
the physical sciences, the Rasch Model sets up objective rules of measurement for the
human sciences (Bond & Fox, 2007) so that more objective and invariant information can
be provided by human science measures.
The Rasch model is a mathematical ideal which sets prior standards and structure the
27
collected data must meet in order to achieve objective measurement. Unlike more general
IRT and multidimensional models or other statistical approaches that adopt a “the model
fits data” position and use different parameters to accommodate the idiosyncrasies of the
data set, the Rasch model requires that “data fit the model” (Andrich, 2004). This is one
of the key differences between Rasch-based studies and other quantitative studies in the
human sciences, including physical fitness studies. For example, a number of studies in
physical fitness (Fleishman, 1964; Marsh, 1993; Ponthieux & Barker, 1963; Rarick &
Dobbins, 1975) have conducted factor analyses on physical fitness indicators and tried to
identify the structure of physical fitness. There are two general methods in the factor
analytic approach - exploratory factor analyses and confirmatory factor analyses – and
both of these two methods have deficiencies in building objective measurement.
Exploratory factor analyses, stated by Marsh (1993), give researchers little control over
the resulting factor solutions. Researchers have no way to test any a priori factor structure;
what the data produced is the final result. As for confirmatory factor analyses, although it
allows researchers to test their a priori factor structures and provides indices to judge the
degree of match between the proposed factor structure and the empirical data, it fails to
construct an objective and fundamental measurement because the data serve as a “reality”
and the proposed factor model is used to account for those data only. When the proposed
model cannot explain the data properly, the model has to be modified and parameters
have to be redefined until the revised model fit the data well enough. Consequently, it is
almost impossible to obtain a stable and unique structure of physical fitness tests because
the samples change and the indicators vary among the different studies. Just imagine that
scientists use a case-based developed thermometer to indicate temperature, how could the
results be stable and properly communicated among researchers? In this sense, it is no
wonder that there are large discrepancies among results of different studies on the same
physical fitness topic because researchers have not built up an objective scale/ruler that
can be used to measure physical fitness under the inevitable variety of different
circumstances. In contrast, in Rasch analyses, the requirements set by Rasch model have
to be met by the data set so that a scale/ruler constructed in one study could be applied

28
directly into other suitable situations. The measurement results under different
circumstances could then be communicated in a stable framework. This feature provides a
stronger basis for constructing fundamental measures from raw data.
Given the review of the quantitative approaches open for adoption in such a research
project, the position taken in this research thesis is the primacy of the requirement to
produce measures based on the principles espoused by Rasch measurement. As a
consequence, this particular research will explicitly adopt the Rasch ‘data must fit the
model’ requirement for the construction of fitness measures.
The Mathematical Formulation of the Rasch Model
The underlying mathematical model of Rasch analyses deals with the probabilistic
relation between any item’s difficulty and any person’s ability (Bond & Fox, 2007). When
a person’s ability exceeds an item’s difficulty level, the person is more likely to give the
correct answer rather than the incorrect answer to that item. When an item’s difficulty
level exceeds a person’s ability, that person is more likely to give an incorrect rather than
correct answer to that item. When a person’s ability is equal to an item’s difficulty level,
the probability of giving correct/incorrect answer is set at 50 percent.
The Rasch model estimates the person ability measure and item difficulty measure in the
exactly same way. Firstly, it calculates the ratio of each person’s percentage of correct
answers over the percentage of incorrect answers, and then transforms that ratio into odds
of a successful response. Finally, the natural logarithm of those odds are calculated as the
person ability measure (or, similarly, for the item difficulty measure). Through several
rounds of iteration, the raw data are transformed into interval measures of person ability
and item difficulty which are independent of the particular samples of items and persons
used to produce these estimates (Bond & Fox, 2007).
Wright and Stone (1979) stated that Rasch model has two expectations, i.e., (1) a person

29
with higher ability level should always have a greater probability of success on any item
than a person with lower ability level, and (2) any person should always be more likely to
do better on an easier item than on a harder one. The outcome of a person’s answer to a
given item is determined by the comparison of person ability and item difficulty. The
relationship among probability of correct answer, person ability, and item difficulty is
expressed in Equation (4) (Bond & Fox, 2007).
Pmi (xmi = 1/ θm, δi) = exp (θm - δi) / [1 + exp (θm - δi)] (4)
If Pmi is used to denote the probability of person m succeed on item i, then the probability
that person m would fail on item i is (1 - Pmi). For person n, the probability of success and
failure on item i is Pni and (1 - Pni) respectively.
The ability difference between person m and person n, could be inspected with the
following ratio
i.e.,
It is reasonable to expect the above ratio would remain unchanged when we use item j
instead of item i if the measurement is objective. That means
Then
Now, let’s assume person n is a “standard” person and item j is a “standard” item and the
ability of person n is equal to the difficulty of item j. Then, Pnj = 0.5. We get
P (m succeed on i) AND P (n fail on i)
P (m fail on i) AND P (n succeed on i)
Pmi(1 - Pni)
(1 - Pmi) Pni
Pmi (1 - Pni)
(1 - Pmi) Pni
Pmj (1 - Pnj)
(1 - Pmj) Pnj =
Pmi
1 - Pmi
Pmj (1 - Pnj) Pni
(1 - Pmj) Pnj(1 - Pni) =

30
If we define
And
Then
And finally
Pmi = exp (θm - δi) / [1 + exp (θm - δi)]
Given any specific θm and δi, the equation could be expressed as
Pmi (xmi = 1/ θm, δi) = exp (θm - δi) / [1 + exp (θm - δi)]
where Pni (xni = 1/ θm, δi) is the probability that person with ability (θm) gives a correct
answer (x = 1) to an item with item difficulty (δi).
When the person ability (θm) is equal to item difficulty (δi), the θm - δi difference is equal
to zero and the exp (θm - δi) is equal to one. Then the value of the equation is equal to 0.5,
indicating that the probability of giving correct answer is 50 percent. When person ability
(θm) is higher than item difficulty (δi), the chance of success is higher than 50 percent.
Conversely, when person ability (θm) is lower than item difficulty (δi), the chance of
success is lower than 50 percent. As person ability increases, the probability of correctly
answering increases to an asymptote of 1. Likewise, as person ability decreases, the
Pmi
1 - Pmi
Pmj Pni
(1 - Pmj)(1 - Pni) =
Pmi
1 - Pmi = θm - δi
Pmj
1- Pmj = θm which stands for the ability of person m ln ( )
1- Pni
Pni = δi which stands for the difficulty of item i ln ( )
ln ( )

31
chance of correctly answering decreases to an asymptote of zero.
The Main Features of Rasch Model
Linearity of Data
All observations begin as raw data and the raw data might not be the valid “measure”
because they have little inferential value (Wright, 1997; Wright & Mok, 2000). Bond and
Fox (2007) also stated that the inferential meaning one gets from raw data is only the
ordering of the persons or the items, but not about “how much” is, say, the size of, the
distance between the scores. Distances are distorted and the proportional meaning which
is crucial to measurement is hidden by the superficiality of ordinal raw data. In the
physical education contexts, the students’ raw scores for some physical fitness indicators
are recorded as interval units of distance, time or weight, but it does not mean that they
are equal-interval measures of fitness because the “unit” has not constant meaning. As
stated by Linacre (2000), although the units appear as linear measures, their meaning as
physical fitness scores is not linear because linearity implies adding one more unit make
equal-size increment. For example, students’ performances on 9-minute Run are recorded
with the unit “metre (m)”, but “m” is not of the same meaning for different scores. The
first 100 m during the running is easy but the 100 m after completing 1,000 m is very
hard for primary school-aged students. Although the meaning of “m” is constant on the
distance scale, it is not necessarily the same case on the fitness scale. In the same way,
one cannot say that a student who completes 1,500 m in the 9-minute Run is 50 percent
more physically fit than another student who only complete 1,000 m because the
difficulty level of the third 500 m in the 9-minute time limit is much higher than is the
first or second 500 m. Thus the raw scores recorded with the unit “m” might not be a
valid measure of fitness in the assessment of students’ ability on 9-minute Run.
Linearity is a basic assumption of any statistics including factor analyses (Wright &
32
Masters, 1982). Physical fitness data, however, are not additive or linear because they
indicate only ordering but not any proportional meaning. Thus it is not appropriate to
apply factor analytic approach directly to physical fitness raw data as factor analyses is
properly used on interval level data. In this sense, the results of many physical fitness
studies remain equivocal since statistics, such as factor analyses, are inappropriate if used
on the non-linear raw data of physical fitness assessments. These non-linear raw data
must be constructed into sample-distribution free and item-distribution free measures
before they can be analysed using statistics requiring linear, interval data input (Wright,
1997). The Rasch model overcomes this problem by transforming non-linear raw data
into logit scale measures which have constant interval meaning and provide objective,
fundamental, linear measurement from ordered category responses (Linacre, 2006a). For
some researchers (e.g., Fischer, 1995), the Rasch model is the only method available to
transform ordinal observations into linear measures.
Parameter Separation
Traditional methods of quantification also make it difficult to compare individuals’
performance in physical fitness indicators because the scores are item-dependent and the
interpretation of scores is sample-dependent. This is one of the major disadvantages of
CTT. Suppose a boy has completed 40 sit-ups in the 1-minute Sit-ups test; how many
curl-ups could he complete in the curl-up test? Nobody knows unless the curl-up test was
previously administered to him. The scores change when the items change even if the test
taker remains the same. Which one of the following is better: 40 sit-ups in the 1-minute
Sit-ups test or 30 curl-ups in the curl-up test? It’s hard to make a decision because the raw
scores provide us very limited information about these two scores’ positions on the
continuum of abdominal muscular endurance. A similar problem is encountered when we
want to compare the cardiorespiratory fitness of primary 3 students and primary 4
students in Hong Kong. The 6-minute Run is the cardiorespiratory fitness indicator for
33
primary 1 to 3 students, while 9-minute Run is used for primary 4 to 6 students. It’s not
surprising that a primary 4 student obtained dramatically increased scores on the
cardiorespiratory fitness indicator than in the previous year. The question is how can we
make a judgment about whether the increment comes from the student’s physical
development or is just a consequence of the extra 3 minutes of running time in the test?
Instead of raw scores, standardised scores, such as z-scores and t-scores, were
recommended for use in comparing different types of physical fitness scoring (Miller,
2006). However, standard scores are sample-dependent scores. That means the
comparisons based on standard scores can be made only between students within the
same sample from which the standard scores were computed because the means and
standard deviations are expected to vary across different samples. It is a similar case for
percentile ranks. For example: if a 9-year-old boy scored 15 on a 1-minute Sit-ups test,
his performance is rated 5th percentile according to the norms for the Health-Related
Physical Fitness Test (AAHPERD, 1980), but at 25th percentile according to the norms for
Hong Kong primary school-aged students (Hong Kong Education and Manpower Bureau,
2005b).
With the purpose of solving the inherent problems of the CTT, Wright and Stone (1979)
pointed out that measurement should be “objective” and listed two complementary
requirements. One is that the calibration of items/indicators must be sample-distribution
free, that is, independent of the particular sample used for item calibration. The other is
that the measure of the latent trait must be item-distribution free, that is, independent of
the particular items/indicators used for measuring the persons. This feature is referred as
“parameter separation” or “invariance of parameters” (Bond & Fox, 2007; Embretson, &
Reise, 2000; Wright & Masters, 1982; Wright & Mok, 2000).
It can be found that, in expression (4), the function is determined only by the ability of
person m (θm), and the difficulty level of item (δi). That means the Rasch model
provides the person ability and item difficulty estimates that are independent of the
34
distribution of the latent trait in the particular item / person calibration sample. Thus
the Rasch model satisfies the requirement of objective measurement - parameter
separation.
Ideally, the calibrated measures for both items and persons in a measurement scale
should be invariant across any reasonable circumstance. However, it is not realistic to
achieve this goal in real world when trying to solve measurement problems. The actual
Rasch calibrations might vary depending upon the different combination of item
difficulty and person ability (Zhu & Cole, 1996). Bond and Fox (2007) pointed out
that it is the differences (i.e., the intervals) between item and person estimates (relative
position of items and persons) but not the estimates themselves that should remain
constant across different, but related measurement circumstances. In this sense, Rasch
measurement provides interval-level, rather than ratio-level ability and difficulty
measures (Stevens, 1959).
A Single Scale for Items and Persons
By the means of logarithmic transformation, Rasch analyses prevails over traditional
approaches to measurement by calibrating persons and items on the same unidimensional
scale (Bond & Fox, 2007; Wright & Masters, 1982). Since the person and item estimates
represent the same unidimensional construct, a person who can succeed on the more
difficult items on a scale should also succeed on the easier items. In other words, both
persons and items can be placed on a common trait continuum one by one. The items are
ordered by their difficulty levels from easy to hard, and persons are ordered by their
ability levels from low to high. In such a way, direct comparisons between person
abilities and item difficulties can be easily conducted based on their locations on the trait
continuum.
This is a very important and distinctive feature of the Rasch model which can be applied

35
in physical fitness measurement in a meaningful way. From a traditional perspective for
physical fitness measurement, it is hard to predict a student’s performance on a physical
fitness test which has not been administered to the student even if a similar test has been
administered because no information about the relationship between these two tests has
been provided. However, this problem could be solved through Rasch calibration. These
two physical fitness tests/indicators could be calibrated on a Rasch scale and each of them
has a location on the same trait (i.e., physical fitness) continuum. Their locations on the
trait continuum indicate their difficulty levels. If one of these two tests was administered
to a student, her/his performance on another test could be predicted through the relative
position of these two tests on the trait continuum. Similarly, any other physical fitness
tests/indicators could be calibrated on the same Rasch scale and the student’s
performance could be predicted based on the information provided by the locations of
tests/indicators in relation to the student’s location on the trait continuum.
Unidimensionality
Measurement should focus on one attribute or dimension at one time (Bond & Fox, 2007).
Unidimensionality makes objective measurement possible and interpretation of test
results more meaningful. Although human behaviors are, in many cases, multifaceted and
so complicated that it is difficult to conceive them as a single indicator, carefully
constructing a scale measuring one attribute at one time is still possible and will reduce
the confusion caused by having many latent traits underlying the measurement scores.
Traditionally, physical fitness is regarded as a multifaceted or multidimensional construct
which consists of different components such as strength, endurance, flexibility, and so on.
It is not likely that one unidimensional indicator would be capable of adequately
representing the entire construct (Fleishman, 1964; Marsh, 1993; Safrit, 1981; Sharkey,
1991). This point of view certainly seems reasonable when looking at a fitness battery in
which each indicator assesses one component, some might call it one dimension, of

36
physical fitness. However, the fact that indicators are component-related does not deny
the possibility that there is one latent trait underlying all, or at least some, of the
components. This unique latent trait determines students’ performances on all
component-related indicators. Through Rasch analyses, a unidimensional scale might be
developed to measure that latent trait.
Local independence is another important requirement of Rasch model. Although Lord
(1980) insisted that local independence was not an additional assumption, but an
indispensable feature of unidimensionality, Rasch researchers (e.g., Purya, 2007; Wright,
1996; Zhu & Cole, 1996) prefer to regard local independence as another requirement of
Rasch model beyond unidimensionality. Local independence refers to the requirement
that the response to one item, no matter right or wrong, should have no influence on the
responses to any other item within the same test. That means any two items should be
mutually independent. This requirement is not a harsh one for physical fitness indicators.
Each indicator of fitness battery is designed specifically for one component and has little
direct linkage to other components. Empirical research (e.g., Marsh & Redmayne, 1994)
also indicated that there are only low correlations among students’ abilities on different
components of physical fitness.
Fit to the Rasch Model
Rasch model is an ideal model and it is impossible to fulfill perfectly the model’s
requirements in real world measurements. For example, a test as simple as primary 1
mathematics quiz might involve students’ reading comprehension ability besides the main
dimension, mathematics ability, which is the latent trait the test meant to measure.
Students’ performances on the 1-minute Sit-ups test may be influenced by the weather,
students’ physical status and willingness, the severity of the rater, and many other
unpredictable factors. Smith (2002) stated that unidimensionality should be viewed as a
continuum rather than as a simple yes or no decision. He pointed out that the important
37
question is “at what point on the continuum does multidimensionality threaten the
interpretation of the item and person estimates” (p. 206).
Although it is reasonable to admit to the complexity and imperfections in measurement,
instrument developers and users should know the extent to which the data meet the
requirements of the measurement model. Goodness-of-fit statistics generated from the
Rasch analyses provide important indices to examine the extent to which the empirical
data match the requirements of the Rasch model. An item with poor goodness-of-fit
probably reflects something other than just the target latent trait or that the trait is
inappropriately defined (Zhu & Cole, 1996).
Smith and Miao (1992) compared the power of Rasch fit statistics and principal
component analyses in assessing unidimensionality using simulated two-factor (X and Y)
data sets. A total of 50 items and a sample of 1,000 persons were used in the simulated
data sets. The common variance between these two underlying factors had different
values (.01, .04, .09, .16, .25, .36, .50, .64, .75), and the ratios of items in these two
factors varied (45 vs. 5, 40 vs. 10, 35 vs. 15, 30 vs. 20, 25 vs. 25) for each data set. Thus a
total of 45 different combinations of situations were generated. The results showed that
principal component analyses performed well in detecting the second factor if the second
factor has less than 64% common variance and 20% or more of the items load on that
factor. Rasch fit statistics were sensitive in detecting the second factor if less than a
specific ratio of items load on that factor in different situations. The ratio varied from
30% to 10% depending on the common variance. Finally, they suggested that if an
instrument was assured to be a unidimensional measure, then factor analytic method is
explicitly not appropriate because it expects more than one uncorrelated factors in the
data set. If the purpose is to assess unidimensionality of existing data, it is better to use
both the factor analytic method and Rasch fit statistics to complement each other.
However, Wright (1996) argued that factor analytic methods have inherent drawbacks in
assessing dimensionality of empirical data sets considering they analyse the matrix of raw

38
responses because the both the raw responses and the residuals left after extraction of the
first factor are non-linear. Therefore, he suggested implementing an improved method of
factor analyses – Rasch factor analyses of the item/person residuals – instead of
traditional factor analytic methods. Smith (2002) also supported the idea that linear factor
analytic methods might not be appropriate tools to examine the unidimensionality
requirement of Rasch model because linear factor analyses assumes a normal distribution
of the data while Rasch model does not.
Many Rasch computer programs (e.g., WINSTEPS) provide two forms of chi-square fit
statistics: Outfit Mean Square (Outfit MNSQ) and Infit Mean Square (Infit MNSQ).
These statistics are based on the computation of residuals. A residual refers to the
difference between the observed score and the model’s expectation. The Outfit MNSQ is
the mean of squared standardized residuals. The Infit MNSQ is the mean of squared
standardized residuals, each weighted by its model variance. Outfit MNSQ is sensitive to
extreme (outlier) data because of the impact of large residuals for misfitting outliers,
while Infit MNSQ is more sensitive to well-targeted cases because the variance
(weighting) is larger for well-targeted cases than for outliers (Bond & Fox, 2007; Smith,
2002).
Values of Outfit and Infit MNSQ values can range from 0 to positive infinity with an
expected value of 1.0. A value of 1.0 means the empirical data fit the Rasch model
perfectly. Values of Outfit and Infit MNSQ much higher than 1.0 (underfit) suggest that
there is more variation in the empirical data than that expected by Rasch model, while
values much lower than 1.0 (overfit) imply that there is less variation in the empirical
data than that expected by Rasch model. In other words, the response string is too
predictable (Linacre, 2006a). More emphasis should be put on underfitting (much higher
than 1.0) rather than on overfitting (much lower than 1.0) performances because
underfitting cases are more harmful to measurement. Underfit is caused by haphazard
response strings that impair the quality of measures. On the other hand, overfit does little
harm to measurement although it may result in less efficiency or overrate the quality of
39
measures (Bond & Fox, 2007). The criterion of acceptable range of Infit MNSQ and
Outfit MNSQ depends rather on the different purposes of the research. Linacre (2006a)
suggested that MNSQ falling into the range of 0.5 to 1.5 indicated a productive
measurement, while many researchers adopt a stricter standard, e.g., range of 0.7 to 1.3
(e.g., Mok, Cheong, Moore, & Kennedy, 2006; Zhu & Cole, 1996) or range of 0.8 to 1.4
(Wolfe & Chiu, 1999).
Infit and Outfit statistics also have standardized forms. In WINSTEPS, the standardized
form of Infit and Outfit is reported as Infit ZSTD and Outfit ZSTD. The standardized Infit
and Outfit have approximately normalized t distribution with an expected value of 0 and
an S.D. of 1.0.
However, there is reason to be suitably circumspect in the use of fit indices for the Rasch
model. Wright and Panchapakesan (1969) stated that it was not recommended to delete all
items with large item “misfit” value. Instead, the test designer should examine the
“misfit” items carefully and find out possible effects of other factors such as
discrimination and guessing in these items. Bond and Fox (2007) also suggested using fit
statistics to detect problematic item and person performance but not use them as a simple
criterion to delete items from a test.
Application of Rasch Model in Physical Education and Sports Science
Rasch analyses has been widely accepted and well studied in educational measurement
research (e.g., Elder, McNamara, & Congdon, 2003; Merrell & Tymms 2005; Mok, 2004;
Waugh, 2002, 2003; Waugh, Hii, & Islam, 2000; Weaver, 2005). There is also an
abundance of Rasch applications in health and medical science (e.g., Barley & Jones,
2006; Fitzpatrick, Norquist, Dawson, & Jenkinson, 2003; Hsueh, Wang, Sheu, & Hsieh,
2004; McHorney & Monahan, 2004; Strong, Kahler, Ramsey, & Brown, 2003; Tesio,
2003).
40
Recently the Rasch model has been applied in sports and exercise science studies by a
growing number of researchers. For example, Bowles and Ram (2006) found that Rasch
analyses and the model fit statistics provided by Rasch model produce an equal-interval
scale which provided more objective and consistent information about volleyball players’
ability than could be obtained by traditional instruments. Coaches could utilize that
information for drill and design of training sessions. Based on Rasch analyses, Zhu,
Timm, and Ainsworth (2001) optimized an instrument measuring women’s exercise
perseverance and barriers by collapsing a five-category response scale to a three-category
response scale. Heesch, Masse, and Dunn (2006) used Rasch modeling to re-validate
three scales related to physical activity including the Physical Activity Enjoyment Scale,
the Benefits of Physical Activity Scale, and the Barriers to Physical Activity Scale. Useful
information about the validity of the three scales was provided and critical suggestions
were made to improve the effectiveness of those scales based on results of Rasch analyses.
In a semi-simulation study of motor function tasks, Zhu (2001) found that Rasch
modeling could accurately equate different tests so that tests could be compared on a
single scale, and cross-test scores could be interpreted in the same framework.
In the physical education domain, the Rasch model was also applied to develop or
improve physical tests as valid instruments. Zhu and Kurz (1994) used the Rasch Partial
Credit Model to assess children’s gross motor competence. A total of 128 children aged
from 3 to 9 years were asked to complete four different striking tasks. Partial scores were
given based on their performance on the tasks and were analysed with Rasch Partial
Credit Model. They concluded that the Rasch model made it possible to analyse
children’s motor process quantitatively. Hands and Larkin (2001) investigated the
construct of a general motor ability in young children with the Rasch Extended Logistic
Model. Participants consisted of 332 five- and six-year old children who were asked to
perform 24 motor skills. As a result, two separate, unidimensional scales were developed
for boys and for girls respectively. Zhu and Cole (1996) calibrated a gross motor
instrument, which was interpreted based upon total score in a norm-referenced framework,

41
with the many-facets Rasch model. They demonstrated the advantages of the Rasch
model over the traditional norm-referenced interpretation including parameter separation,
sharing the same metric among items and examinees, and providing linear measures.
More importantly, the person measures, together with S.E. and fit statistics, provided
useful diagnostic information for examinees to identify their strength and weakness. They
also designed a user-friendly work sheet to facilitate communication between total score
and Rasch logit measures. With the work sheet, test administrators could easily transform
the total scores into logit measures without any knowledge of Rasch model.
Safrit, Zhu, Costa, and Zhang (1992) used the Rasch Poisson Counts Model to investigate
the difficulty levels of eighteen different Sit-ups indicators and built up a Sit-ups indicator
bank for the purpose of clinical adaptive testing. In another similar study, Zhu and Safrit
(1993) calibrated the 1-minute Sit-ups indicator using a national data set. Data from 8,723
children aged from 10 to 18 were analysed with the Rasch Poisson Counts Model. The
result indicated that the difficulty level of the 1-minute Sit-ups indicator (-2.80 logits)
was rather easy for most of children whose ability levels ranged from 0.09 to 1.39 logits.
The average of boys’ abilities was higher than the average of girls’ abilities and the
average ability increased with the children’s age. However, another important finding of
this study is that the model-data fit was not good as expected, especially for the low
ability group. Although the Rasch Poisson Counts Model is regarded as the most suitable
model for time-limited psychomotor data such as 1-minute Sit-ups indicator (Safrit et al.,
1992; Zhu & Safrit, 1993), its application is still limited for several reasons. For example,
Rasch Poisson Counts Model assumes examinees complete the item at a constant speed
through the whole test which, unfortunately, is often not the case. The speed with which
examinees complete sit-ups usually becomes slower and slower because of fatigue when
examinees completed greater number of repetitions. Furthermore, the effect of
dependency caused by fatigue violates the Rasch Poisson Counts Model’s assumption and,
therefore, reduces its appropriateness for time-limited psychomotor data.
The Rasch model has been applied to combine closely related but different scales to

42
assess the unidimensional construct. For example, an interesting study was conducted in
the health care domain to combine two scales into one unidimensional scale (Hsueh et al.,
2004). The 10-item Barthel Index (BI) assessing activities of daily living (ADL) and the
15-item Frenchay Activities Index (FAI) assessing instrumental ADL were administered
to a total of 245 patients at one year after stroke. The data from these two scales were
combined together and analysed with the Rasch model. The result indicated that all but 2
items of the FAI fit the unidimensional Rasch model very well, indicating that the BI and
the FAI assess a single unidimensional construct. Further analyses of the 23-item
unidimensional scale revealed that it had high person reliability (0.94) and the item
difficulties were well targeted for the patient sample. A conversion table was offered to
transform combined BI and FAI raw scores into Rasch measures. Thus a clinically useful
instrument was developed by combining the BI and the FAI scales and the new scale had
improved range and sensitivity for assessing comprehensive ADL function.
However, this kind of combining attempt is seldom found in physical education literature.
Traditional opinions concerning physical fitness conceptualize it as a multidimensional
construct, and the only possible way to present a student’s overall physical fitness level is
to provide a multidimensional profile which contains scores for each component of
physical fitness (Fleishman, 1964; Marsh, 1993). However, a single “overall” fitness
score is still necessary in many situations, especially for physical education teachers and
students because a single score make it easy to summarize a student’s overall physical
fitness (Fleishman, 1964). In most cases, the overall fitness score is obtained by simply
summing or averaging the scores for different components of physical fitness. It is not
surprising, according to Fleishman (1964), this kind of overall fitness score loses rich
information about specific factors and, therefore, one should be very cautious in
interpreting that kind of overall score. Marsh (1993) recommended constructing, if
necessary, a weighted summary score that assigns an optimal weight to each component
based on theoretical and empirical research. But it will be a big challenge to get a
so-called “optimal” weight for different components because the weights may need

43
modification according to particular criterion or particular research purposes. Given that
this research has adopted the Rasch model requirement that “the data should fit the
model”, reviewing the possibilities of others of the family of the IRT models should be
left to the possible research project mentioned in Chapter Seven.
Summary
The use and interpretation of fitness assessment have important educational and
psychological consequences (Mahar & Rowe, 2008). The definition and structure of
physical fitness was discussed in this chapter. It is widely accepted in the current
literature that five components including body composition, cardiorespiratory fitness,
flexibility, muscular strength, and muscular endurance actually contribute to
health-related physical fitness.
Physical fitness components are not isolated but are interrelated. Each component contributes
an essential element to physical fitness (Clarke, 1979). Although the possibility of combining
all the five fitness components into a single overall fitness scale could be a debatable topic,
the benefits which would derive from having a single overall measure suggest that it is well
worth trying. The Rasch model is an apt tool for developing such a unidimensional scale
considering its advantages over traditional test theory. The first, a Rasch scale provides
equal-interval measures so as to facilitate interpretation of physical fitness assessment results
and comparisons among children. The second, a Rasch scale provides sample distribution-free
and item distribution-free measures. Both of students and physical fitness indicators can be
located on the common physical fitness scale directly. The third, a Rasch scale makes it
possible to construct an overall physical fitness indicator that summarizes a student’s physical
fitness in different components. With the overall physical fitness indicator, primary
school-aged students’ overall physical fitness levels could be calibrated on the common scale
even if the student just takes only one of physical fitness tests from among the five
components.

44
CHAPTER THREE
METHODOLOGY
As proposed in Chapter One, this study employed quantitative methods adopted from the
Rasch measurement perspective to develop a physical fitness scale. This chapter outlines
the important aspects of the research methodology including the sample characteristics,
the instruments used to obtain students’ physical fitness data, the procedures for data
collection, and issues related to research ethics and data confidentiality. The methods
chosen for data analyses are also justified and described in this chapter. Finally, the
limitations of study design are discussed.
Sample
Data used in this study were retrieved from the assessment records database of a large,
regional Hong Kong primary school. This school is a government-subsidized primary
school located in the north-eastern New Territories of Hong Kong. This school routinely
has five classes in each year level from primary 1 to primary 6 with over 1,000 students
enrolled.
The data cover that school’s students’ physical fitness records over the academic years
2002-03 to 2006-07. There are two rounds of students’ records for each academic year
except 2002-03 for which the records for the 2nd
semester were not put into the school’s
database. Initially, a total of 10,512 student records were included in the data pool for this
study. Finally 9,439 records were kept for scale development after excluding exceptional
and unreasonably extreme data. It is worth pointing out that each record does not
necessarily refer to an independent student since this is a longitudinal data set over five

45
years and most students would have several records over time in the data set. Of the
records, there are 5,149 (54.6%) male and 4,290 female (45.4%) records. The ages for all
records in years range from 6 to 13 (M = 8.53, SD = 1.73). Four records did not include
age information. The details of the sample used in this study are presented in Table 3.1.
Table 3.1 Details of the Sample
Academic
year 2002-03 2003-04 2004-05 2005-06 2006-07
Semester 1st 2
nd 1
st 2
nd 1
st 2
nd 1
st 2
nd 1
st 2
nd Total
Male 510 0 556 551 572 574 592 590 606 598 5149
Female 458 0 472 468 492 489 488 487 468 468 4290
Total 968 0 1028 1019 1064 1063 1080 1077 1074 1066 9439
Age 6 7 8 9 10 11 12 13 Total
Male 837 900 877 845 813 779 94 4 5149
Female 666 701 727 742 717 672 61 0 4286
Total 1503 1601 1604 1587 1530 1451 155 4 9435
Instruments: Physical Fitness Indicators
Students’ performances on different components of physical fitness were assessed using a
variety of indicators. While there are many fitness batteries developed to assess children’s
physical fitness, most of the primary schools in Hong Kong, including the partner school
of this study, administer the physical fitness battery recommended by the School Physical
Fitness Award Scheme (Hong Kong Education and Manpower Bureau, 2005b) except that
the body composition is not assessed using skinfold method but indicated by BMI
because the skinfold method of body fat assessment requires special equipment which is
not available in many schools including the partner school of this study.
BMI
Although the BMI does not assess the percentage of body fat and is usually used as an
indicator of obesity (Vehrs & Hager, 2006), it is accepted worldwide as an alternative
indicator of body composition when more direct techniques for body fat estimation are

46
not available. Hong Kong primary schools measure students’ height and weight routinely
so that the BMI could be calculated conveniently. BMI is defined as body weight (in
kilograms) divided by height (in metres) squared (BMI = weight (kg) / height (m)2).
Teachers and students in Hong Kong schools are very familiar with the concept and
calculation of BMI. A “Weight for Height Chart” developed by Leung (1993) is routinely
used in Hong Kong schools to help to judge whether primary school-aged students are
obese or underweight (Hong Kong Education and Manpower Bureau, 2005a).
6/9-minute Run
The 6 or 9-minute Run test is administered in most of Hong Kong primary schools to
assess students’ cardiorespiratory fitness. The student runs/walks around the basketball
court for a 6 or 9 minute period (as appropriate) and the distance covered is recorded in
metres as the score. The 6-minute Run test is administered to grades 1 to 3 students and
the 9-minute Run test is administered to grades 4 to 6 students. The 9-minute Run test is
commonly used in western countries and research reports it as having test-retest
reliability coefficient of 0.94 and a validity coefficient of 0.90 using maximum oxygen
consumption as the criterion (Miller, 2006).
1-minute Sit-ups
Generally speaking, there are two different forms of the sit-ups protocol. The sit-ups test
with a weight plate or a dumbbell behind the performer’s neck is designed to assess the
strength of abdominal muscles (Johnson & Nelson, 1986); the other, the 1-minute Sit-ups
test, aims to assess the endurance of the abdominal muscles (AAHPERD, 1980). Hong
Kong primary schools adopt the 1-minute Sit-ups test to assess students’ muscular
endurance since it requires almost no equipment and is very convenient to administer in
large-scale assessments. In the 1-minute Sit-ups test, the student lies face-up on the mat
with knees bent, with arms crossed against the chest and feet pressed on the floor by a

47
partner. One correct repetition involves sitting-up from the mat, touching the elbows to
the thighs, then lowering the upper body and returning to the original position. The
number of correct sit-up repetitions the student completes in 1 minute is recorded as the
score. The test-retest reliability coefficients of 1-minute Sit-ups test ranges from 0.68 to
0.94 in different studies (Miller, 2006).
Handgrip (Right and Left)
A hand-grip dynamometer can be used to test students’ static strength of flexor muscles or
static endurance of flexor muscles depending on the testing method used (Heyward,
2002). The grip strength test requires the performer to squeeze the dynamometer as hard
as possible using one brief maximal contraction, while the grip endurance test requires
the performer to squeeze the dynamometer as hard as possible and hold for 1 minute. The
isometric grip strength test generally has reliability coefficients of more than 0.90, and the
correlations among the arm, shoulder, torso, and leg isometric strength test range from
0.82 to 0.92 (Baumgartner et al., 2007). The handgrip test adopted in Hong Kong primary
schools is the grip strength test with the purpose of assessing the static strength of flexor
muscles of right and left hands. In a Handgrip test, the student stands erect, with the arm
extended, and squeezes the dynamometer as hard as possible using right/ then left hand.
The best score of three trials is recorded in kilograms as the final score for each hand.
Sit-and-Reach
The standard Sit-and-Reach test (AAHPERD, 1980) is used by most of Hong Kong
primary schools to assess students’ flexibility. This test has test-retest reliability
coefficients of 0.70 or higher and concurrent validity coefficients ranging from 0.80 to
0.90 (Miller, 2006). In a standard Sit-and-Reach test, the student sits on the mat with
knees extended and heels shoulder-width apart, placing soles of feet against a
Sit-and-Reach box which has a scale in centimetres, keeping two hands parallel and

48
fingertips overlapping. Then the student reaches forward slowly and as far as possible
towards the box four times and holds the position of the maximum reach for at least one
second at the fourth trial. The distance the student reaches at the fourth attempt is
recorded in centimeters as the score. There are many other kinds of sit-and-reach tests.
Some are alternatives to the standard Sit-and-Reach test (e.g., V Sit-and-Reach test;
Golding, Myers, & Sinning, 1989), and others are designed for specific purposes
including back-saver Sit-and-Reach test (The Cooper Institute, 2004), the modified
Sit-and-Reach test (Hoeger, 1989), and the chair Sit-and-Reach test (Jones, Rikli, Max, &
Noffal, 1998). Most of these sit-and-reach tests aim to assess lower back and hamstring
flexibility. However, validation studies demonstrated that the sit-and-reach test is a more
valid test of hamstring flexibility than of lower back flexibility. For example, Jackson and
Baker (1986) reported that the correlation between the performance on the sit-and-reach
test and the criterion of hamstring flexibility was 0.64, and the correlation between the
performance on the sit-and-reach test and the criterion of low back flexibility was 0.28.
Push-ups (Standard Push-ups and Modified Push-ups)
Although the push-ups test is used more often in Hong Kong secondary schools than
primary schools, the partner school administered the push-ups test in some semesters, as a
supplementary fitness test, to assess students’ arm and shoulder girdle endurance. There
are two kinds of push-ups tests: the Standard Push-ups test is administered to grades 3 to
6 boys and the Modified Push-ups test administered to grades 1 to 2 boys and grades 1 to
6 girls. In Standard Push-ups, the student lies face down on the mat with the body straight,
arms bent, and hands shoulder-width apart on the mat. Using the toes as the pivot point
and the student pushes upward to a straight-arm position, then lowers the body to the
original position. This is one repetition. Below criterion push-ups should be corrected and
should not be counted. The student tries to complete as many push-ups as possible
without rest. The test should be terminated if the tester corrects the action of the student

49
twice. The Modified Push-ups test is similar to the Standard Push-ups except that the
knees are bent and the student uses the knees as the pivot point to complete the push-ups.
The number of correct push-ups completed by the student is recorded as the score. The
Modified Push-ups test has a reported reliability coefficient of 0.93 (Miller, 2006).
The physical fitness test protocols adopted by the partner schools of this study are
summarized in Table 3.2.
Table 3.2 Physical Fitness Test Used in the Partner School
Test Administration Object Scoring
BM
I
BMI = weight (kg) / height (m)2
Body
Composition -
6/9
-min
ute
Ru
n
The student runs/walks around the
basketball court for a 6-minute period
(children aged eight or below) or for a
9-minute period (children aged nine or
above).
The
cardiorespiratory
fitness
The
distance
(m.)
covered in
6/9 minutes
1-m
inute
Sit
-up
s
The student lies on her/his back on the mat
with knees bent, crossing her/his arms
against the chest and having her/his feet
pressed on the floor by her/his partner.
The student sits-up, touching the elbows to
the thighs, then lower the upper body and
return to the original position. This is one
repetition.
The endurance of
abdominal
muscles
The
number of
correct
sit-ups in
one minute
Han
dg
rip
(R
& L
) Adjust the handgrip dynamometer to a
position which suits the student. The
student stands erect, with the arm extended,
squeezes the dynamometer as hard as
possible using right/left hand. Three trials
should be administered.
The static strength
of grip squeezing
muscles of
right/left hand
The best
score (k.)
of the three
trials for
each hand

50
Pu
sh-u
ps
(Sta
ndar
d P
ush
-up
s, M
odif
ied
Pu
sh-u
ps)
As for Standard Push-ups, the student lies
face down on the mat with the body straight
on the toes, arms bent, and hands
shoulder-width apart on the mat. Pushes
upward to a straight-arm position, then
lower the body to the original position. This
is one repetition. The student should
complete the exercise as many times as
possible. The test should be terminated if
the tester corrects the action of the student
twice. The Modified Push-ups is similar to
the Standard Push-ups except that knees
bent and the student uses the knees as the
pivot point to complete push-ups.
Arm and shoulder
girdle muscular
endurance
The count
of correct
push-ups
Note. Adapted from the Teacher Handbook of Hong Kong School Physical Fitness Award
Schemes (Hong Kong Education and Manpower Bureau, 2005b).
Data Collection
The source of the data for this study is the existing database of a large, regional Hong
Kong primary school. This source is appropriate for the main purpose of this study, i.e.,
constructing a Rasch measurement physical fitness scale for Hong Kong primary
school-aged students. Normally, it might be expected that a very large sample be used for
scale construction. However, it is not straightforward to obtain such a quality data set
with as many cases / time-points as that provided by the school’s database, especially for
time-consuming assessment tasks as physical fitness assessments. Furthermore, even
though it would not be realistic to conduct a specifically developed longitudinal study
within the three-year PhD program, the existing school longitudinal data set covering
Sit
-an
d-R
each
The student sits on the mat with knees
extended and heels shoulder-width apart,
placing soles of feet against the box,
keeping two hands parallel and fingertips
overlapping. Then the student reaches
forward slowly and as far as possible along
the box four times and holds the position of
the maximum reach at least one second at
the fourth trial.
The flexibility of
the lower back the
hamstring (back
of the upper legs)
muscles
The
distance
(cm.) the
student
reaches at
the fourth
trial

51
students’ physical fitness data over academic years 2002-03 to 2006-07 makes it possible
to track students’ developmental trends in physical fitness over five years. Based on the
above considerations, this study did not undertake the collection of more physical fitness
data, but put the most research effort into constructing the Rasch measurement scale
based on the existing school fitness assessment data.
The selected partner school is very well regarded in Hong Kong for its commitment to
promotion of children’s health and diverse physical education programmes. Atypically for
primary schools in general and Hong Kong schools in particular, this school has invested
a huge amount of manpower and other resources in physical education. For example, nine
full-time PE teachers were employed by this school when the data were collected, which
was most unusual for any primary school in Hong Kong. This school had three PE classes
per week while other primary schools usually had two. In order to encourage a physically
active life style and reduce the risk of students’ health problems, this school named the
first break in school days as the “dynamic break”. All students and teachers would go out
of classroom to take part in sports or games. A variety of facilities, such as a sport
climbing wall and physical fitness room, were provided by this school for students’
physical activity. This school is the only primary school in Hong Kong that owns an
indoor swimming pool. Furthermore, this school played active role in cooperative
physical education projects with external parties. For example, it was the first CATCH
(Coordinated Approach Towards Children’s Health) school in Hong Kong. From
academic year 2005-06 on, it participated in a three-year project on physical fitness
assessment conducted by a local institute.
In the partner school, the physical education teachers administered the fitness battery,
once each semester, during their regular PE classes and recorded students’ performances
for these indicators according to the guidelines provided by Hong Kong government. The
students’ scores then were input manually into the school’s database. Normally, the
physical fitness battery was administered each January for the 1st semester, and each June
for the 2nd
semester.

52
Although the physical fitness battery was administered routinely twice a year to all
students, some tests were administered only once a year in particular academic years (e.g.,
the Handgrip test in academic year 2003-04 and 2004-05) due to shortage of manpower
or other reasons. The details of each indicator having students’ performances recorded are
listed in Table 3.3.
Table 3.3 Data Summary
Academic year 2002-03 2003-04 2004-05 2005-06 2006-07
Semester 1st 2
nd 1
st 2
nd 1
st 2
nd 1
st 2
nd 1
st 2
nd
Height ���� ���� ���� ���� ���� ���� ���� ���� ����
Weight ���� ���� ���� ���� ���� ���� ���� ���� ����
6-minute Run ���� ���� ���� ���� ���� ���� ���� ����
9-minute Run ���� ���� ���� ���� ���� ���� ���� ����
1-minute Sit-ups ���� ���� ���� ���� ���� ���� ���� ����
Sit-and-Reach ���� ���� ���� ���� ���� ���� ���� ���� ����
Right Handgrip ���� ���� ���� ���� ���� ����
Left Handgrip ���� ���� ���� ���� ���� ����
Standard Push-ups ���� ���� ���� ���� ���� ����
Modified Push-ups ���� ���� ���� ���� ���� ����
The two approaches to timing and sampling of data for physical fitness studies are the
cross-sectional approach and longitudinal approach. The data from longitudinal studies
have the added advantage of investigating participants’ developmental trends in physical
fitness (Welsman & Armstrong, 2007). Nevertheless, the cross-sectional approach is used
more often than the longitudinal approach because cross-sectional data are easier to
collect (Baumgartner et al., 2007). It is a similar case in Hong Kong. There are numerous
cross-sectional studies of Hong Kong students’ performances on different components of
physical fitness across various ages, but very few longitudinal studies tracking children’s
fitness development over time have been conducted (McManus et al., 2003). In this study,
the data set provides both cross-sectional data – grades 1 to 6 in each semester – and
longitudinal data – those same cohorts across several semesters – so that both
cross-sectional comparisons and developmental track analyses of students’ overall
physical fitness can be undertaken.
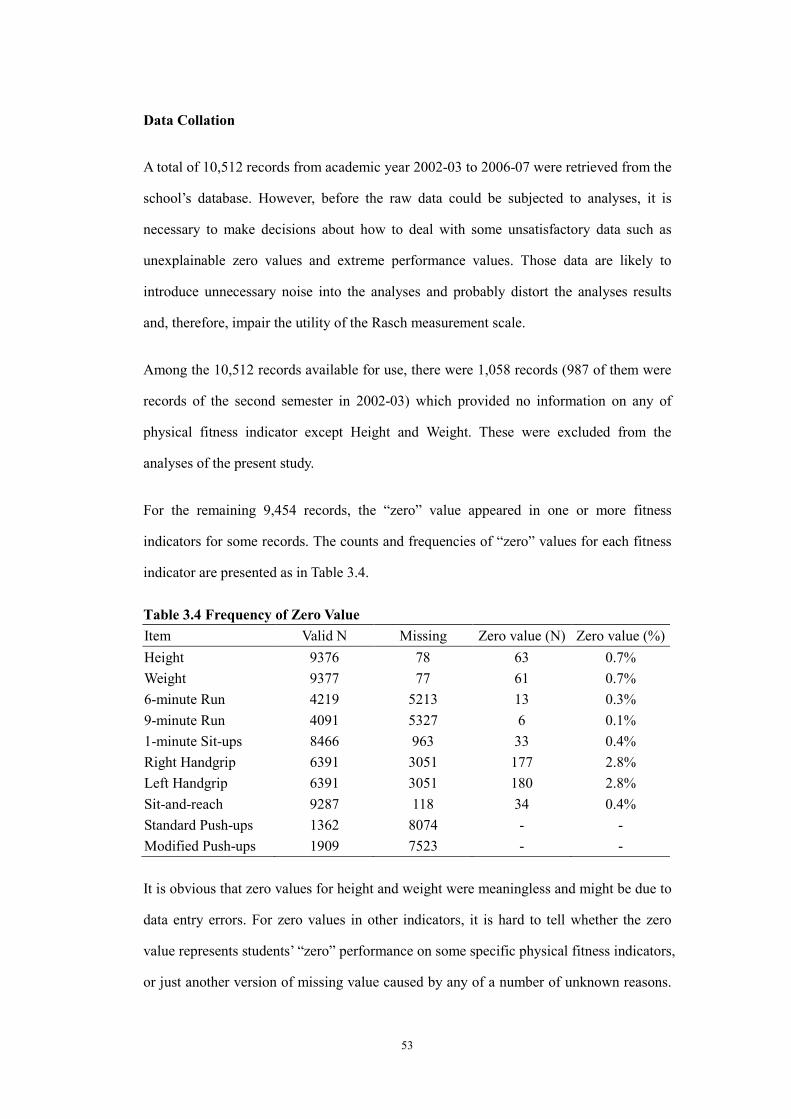
53
Data Collation
A total of 10,512 records from academic year 2002-03 to 2006-07 were retrieved from the
school’s database. However, before the raw data could be subjected to analyses, it is
necessary to make decisions about how to deal with some unsatisfactory data such as
unexplainable zero values and extreme performance values. Those data are likely to
introduce unnecessary noise into the analyses and probably distort the analyses results
and, therefore, impair the utility of the Rasch measurement scale.
Among the 10,512 records available for use, there were 1,058 records (987 of them were
records of the second semester in 2002-03) which provided no information on any of
physical fitness indicator except Height and Weight. These were excluded from the
analyses of the present study.
For the remaining 9,454 records, the “zero” value appeared in one or more fitness
indicators for some records. The counts and frequencies of “zero” values for each fitness
indicator are presented as in Table 3.4.
Table 3.4 Frequency of Zero Value
Item Valid N Missing Zero value (N) Zero value (%)
Height 9376 78 63 0.7%
Weight 9377 77 61 0.7%
6-minute Run 4219 5213 13 0.3%
9-minute Run 4091 5327 6 0.1%
1-minute Sit-ups 8466 963 33 0.4%
Right Handgrip 6391 3051 177 2.8%
Left Handgrip 6391 3051 180 2.8%
Sit-and-reach 9287 118 34 0.4%
Standard Push-ups 1362 8074 - -
Modified Push-ups 1909 7523 - -
It is obvious that zero values for height and weight were meaningless and might be due to
data entry errors. For zero values in other indicators, it is hard to tell whether the zero
value represents students’ “zero” performance on some specific physical fitness indicators,
or just another version of missing value caused by any of a number of unknown reasons.
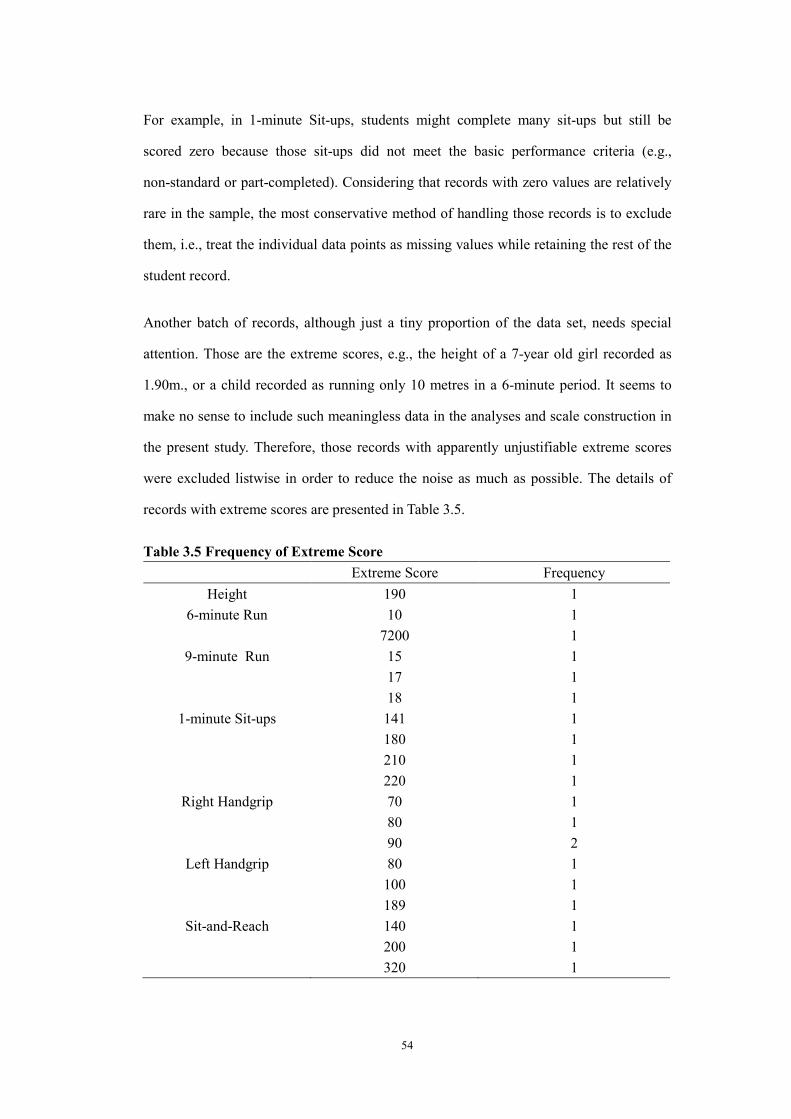
54
For example, in 1-minute Sit-ups, students might complete many sit-ups but still be
scored zero because those sit-ups did not meet the basic performance criteria (e.g.,
non-standard or part-completed). Considering that records with zero values are relatively
rare in the sample, the most conservative method of handling those records is to exclude
them, i.e., treat the individual data points as missing values while retaining the rest of the
student record.
Another batch of records, although just a tiny proportion of the data set, needs special
attention. Those are the extreme scores, e.g., the height of a 7-year old girl recorded as
1.90m., or a child recorded as running only 10 metres in a 6-minute period. It seems to
make no sense to include such meaningless data in the analyses and scale construction in
the present study. Therefore, those records with apparently unjustifiable extreme scores
were excluded listwise in order to reduce the noise as much as possible. The details of
records with extreme scores are presented in Table 3.5.
Table 3.5 Frequency of Extreme Score
Extreme Score Frequency
Height 190 1
6-minute Run 10 1
7200 1
9-minute Run 15 1
17 1
18 1
1-minute Sit-ups 141 1
180 1
210 1
220 1
Right Handgrip 70 1
80 1
90 2
Left Handgrip 80 1
100 1
189 1
Sit-and-Reach 140 1
200 1
320 1

55
A total of 20 apparently unjustifiable extreme scores appeared in 15 records. Excluding
those 15 student records produces a total of 9,439 records to be used for the analyses in
this study.
The descriptive summary of scores for all physical fitness indicators utilized in this study
is presented in Table 3.6.
Table 3.6 Descriptive Statistics of the Data
Unit Subjects Mean SD Min. Max. Valid N
BMI All 16.8 2.9 10.1 38.2 9286
6-minute Run Metre Grades 1 - 3 836 169.8 360 1520 4204
9-minute Run Metre Grades 4 - 6 1319 271.3 560 2240 4082
1-minute Sit-ups Count All 25 10.2 1 63 8429
Right Handgrip Kilogram All 12 5.3 1 41 6211
Left Handgrip Kilogram All 12 5.1 1 37 6208
Sit-and-Reach Centimetre All 28 7.0 2 51 9250
Standard Push-ups Count Grades 3-6
boys 29 15.3 1 75 1362
Modified Push-ups Count Grades 1-2
boys & Grades
1-6 girls
35 16.9 3 82 1909
Data Analyses
Model
The Rasch Poisson Counts Model has been used to measure physical fitness in a number
of studies (e.g., Safrit et al., 1992; Zhu & Safrit, 1993). Nevertheless, the appropriateness
of the Rasch Poisson Counts Model in time-limited psychomotor performances such as
1-minute Sit-ups test scores is dubious because some of the model’s assumptions are not
satisfied by such data: the Rasch Poisson Counts Model assumes that examinees should
complete the repetitions at a constant speed through the whole performance. However, the
effect caused by fatigue in the 1-minute Sit-ups test violates this assumption; repetition
speed is usually slower and slower as examinees complete greater numbers of sit-ups
during the one minute period.

56
In contrast, the Partial Credit Model is possibly the best option for Rasch analyses with
the physical fitness data in this study considering that definition of the rating scale for
physical fitness indicators is unique for each fitness item. The Partial Credit Model is
different from the dichotomous model in which all items have only correct or incorrect
response options, in that it provides for “partially correct response(s)” between
completely correct and incorrect responses. It also allows for more than one gradation
from one ordered category to the next. Although the rating scale model also provides for
partially correct responses and more than one gradation per item, it requires that all items
share the same rating scale structure. In contrast, the Partial Credit Model allows the
number and structure of the rating scale categories to vary from item to item (Masters,
1982).
Software
The software package used for Rasch analyses in the present study is WINSTEPS 3.0
programme (Linacre, 2006a). WINSTEPS dates from 1983 when Ben Wright and Mike
Linacre developed the first Rasch program with the ability of handling missing data –
MSCALE. WINSTEPS is now widely used in Rasch model application studies in a
variety of fields such as educational and psychological assessment, medical research, and
attitude surveys. WINSTEPS can handle maximally 30,000 items with up to 255
categories per item for 10,000,000 persons. The Rasch models implemented in
WINSTEPS include the Rasch “dichotomous”, Andrich “rating scale”, Masters “partial
credit”, Bradley-Terry “paired comparison”, Glas “success”, Linacre “failure” models and
most combinations of these models. Other models such as binomial trials and Poisson can
also be analysed by anchoring (fixing) the response structure to accord with the response
model.

57
Iterative Sequence of Analytical Steps
The intention was that the RMPFS in this study would be developed from a Rasch
measurement perspective and the fitness indicators that violated Rasch measurement
requirements would be excluded from the scale. More specifically, this study took the
strong “data fit the model” position in developing the physical fitness scale. The physical
fitness indicators that were retained would then comprise the RMPFS which would be
used to measure primary school-aged students’ overall physical fitness and track their
developmental trends in physical fitness. It is necessary to explain and to justify the
iterative sequence of analytical steps used to investigate the quality of the indicators and
to decide whether an indicator should be retained or excluded. This section summarizes
nine criteria used in the procedure for scale development.
1. Investigations from practical perspective. Practical considerations before
undertaking data analyses could uncover some factors detrimental to scale
development but which would not be detected by statistical approaches. For
example, unwanted errors occurred during the procedure for data collection and
data entry could damage the quality of data and, therefore, make the data analyses
less meaningful. Furthermore, some indicators might have special features that
could make it inappropriate for inclusion into the development of the Rasch
measurement scale.
2. Response category structure. Successful implementation of polytomous Rasch
measurement requires well functioning categories for each indicator in the scale.
Four diagnostic indicators including category frequencies, average measures,
threshold calibrations, and category probability curves could be used to control the
quality of response category structure.
3. Fit statistics for indicators. WINSTEPS program provides both MNSQ and ZSTD
for Infit and Outfit statistics. Considering the huge sample size (n > 9,000) in this
study, MNSQ is used as a criterion for scale quality assurance instead of ZSTD
because ZSTD was highly sensitive to sample size, while MNSQ was relatively

58
stable (Smith, Rush, Fallowfield, Velikova, & Sharpe, 2008). A huge sample size
makes ZSTD so powerful that it probably magnifies the misfit between the model
and the data (Mok, Cheong, Moore, & Kennedy, 2006). Wu (as cited in Bond &
Fox, 2007, p. 241) also pointed out that most items are likely to be rejected if
ZSTD is used to detect misfit when the sample is large enough.
4. Point-measure correlations for indicators. The point-measure correlation
coefficient of an indicator refers to the correlation between measure of the indicator
and the overall measure of the trait under measurement (Linacre, 2006b).
Theoretically, the value of a point-measure correlation coefficient should fall into
the range between –1 and +1. The higher the value of the point-measure coefficient
is, the higher the relationship between the item measure and the overall measure.
Normally, a point-measure correlation coefficient higher than 0.4 indicates
acceptable consistency among indicators’ polarity in the scale.
5. Rasch reliability. Rasch measurement provides both person reliability and item
reliability. The Rasch person reliability refers to the consistency of person ordering
along the trait continuum measured by the scale (Smith, 2001; Wright & Masters,
1982). The Rasch person reliability is influenced by the spread of item difficulties
and the number of items that are targeted at the sample of persons. Appropriate
spread of item difficulties should separate persons into distinctive ability groups.
Sufficient numbers of targeted items should reduce the error of person ability
estimates by providing enough information about person ability and, therefore,
enhance person reliability. The Rasch item reliability indicates replicability of item
placements along the trait continuum if the same set of items were administered to
another similar sample of persons (Bond & Fox, 2007). High item reliabilities
require the sample of persons to have a wide range of abilities. At the same time,
large enough numbers of persons with appropriate ability levels to estimate the
item difficulties should enhance the item reliability.
6. Variance explained by measures. The Rasch model describes the variance of
observations as comprising a predictable component generated by the Rasch

59
measures and a random component (Linacre, 2006a). Variance explained by the
measures refers to the proportion of variance of observations that could be
explained by the item difficulties, person abilities and rating scale structures in
Rasch analyses (Linacre, 2006a). A higher proportion of variance explained by
Rasch measures means that the Rasch model has better capacity for predicting
performances of the items and persons.
7. Local independence. Local independence refers to the requirement that the
response to any one item, whether right or wrong, should have no influence on the
responses to any other item within the test. That means that the responses to any
two items should be mutually independent.
8. Influence of underfitting persons. The influence of extremely misfitting persons,
especially underfitting persons (MNSQ fit statistics are much higher than 1.0), on
scale quality would be investigated. The noise introduced by misfit would be
reduced as much as possible.
9. Consideration of sex Differential Item Functioning (DIF). DIF is a criterion
regularly used to describe an item’s quality in a scale. For an item with DIF,
different groups of students of the same ability level would have different item
scores (American Education Research Association, American Psychological
Association, and National Council on Measurement in Education, 1999). It is
obviously not productive to include items with DIF in a measurement scale.
Ethics and Confidentiality
The objects of this study are the children’s physical fitness data retrieved from the
existing database of a Hong Kong primary school. There was no data collection
procedure in this study, such as testing and interviewing, which might involve direct
contact between the researcher and students. Therefore, no physical or psychological risks
to participants could be raised by this analytical study.

60
Prior consent for using the school’s data by the researcher was obtained from the partner
school at the beginning of this study. A written agreement (Appendix A) about data
availability, use and confidentiality was co-signed by the principal of the school and the
researcher in September 2007.
The researcher guaranteed that the data would be used only for research purposes and that
the confidentiality of students’ name or any other personally identifying details in the data
set was assured. However, it is worth noting that third parties - other than the school and
the researcher - could access the data set due to the ownership the school has of the data.
Limitations of Study Design
Since it is difficult to obtain comprehensive physical fitness data sets as that provided by
the partner school from other Hong Kong primary schools due to the availability of data
and schools’ willingness to release internal information, this study relied exclusively on
the data from the partner school. That brings limitations to the study which prevents the
immediate generalization of the physical fitness scale developed in this study to other
Hong Kong primary schools.
Thus this study’s core value remains in trying a new approach to physical fitness
measurement and building up a good model practice - rather than providing a
ready-for-use instrument for physical fitness assessment.
Sequencing of Research
The researcher was enrolled in the PhD program through the School of Education at JCU
over three years, from May 2006 to May 2009, to conduct this study. This study focused
on the construction of RMPFS and the implementation of this scale to track students’
physical fitness development. Therefore, most time and resources have been spent on
61
these two tasks. The idea of constructing an overall Rasch measurement physical fitness
scale was initiated by the researcher and was proposed at the Pacific Rim Objective
Measurement Symposium (PROMS) in July 2007 in Taiwan and the preliminary results
were presented at PROMS in August 2008 in Tokyo. Just as expected, most of the
specialist audience showed great interest in such a debatable topic. Nobody, from either
the PE domain or Rasch field, challenged the benefits which would derive from having a
single overall physical fitness measure although some of them had doubts as to whether
that goal could actually be achieved. Invaluable feedback and comments from PE and
Rasch colleagues at the conference and thereafter through emails provided guidance
during the procedure for scale development.

62
CHAPTER FOUR
DEVELOPMENT OF THE RMPFS
Introduction
This chapter describes the procedures for development of the RMPFS. Nine physical
fitness indicators including BMI, 6-minute Run, 9-minute Run, 1-minute Sit-ups,
Standard Push-ups, Modified Push-ups, Sit-and-Reach, Right Handgrip, and Left
Handgrip were investigated thoroughly from a Rasch measurement perspective. It was
necessary to use a logarithmic transformation of the raw data and to create a 7-category
response structure obtained through category collapsing to obtain optimal category
functioning for the rating scales of the RMPFS indicators.
Consideration of BMI
Before the physical fitness indicators were submitted together into WINSTEPS to
construct the Rasch measurement scale, each indicator was examined carefully to judge
its appropriateness for inclusion into the RMPFS. BMI was excluded at this stage for the
following two reasons: The first, BMI is a rough index appropriate for reporting adiposity
at the population level but not optimal for use with individuals because of the
unacceptable prediction error (Heyward, 2002; Stratton & Williams, 2007). BMI provides
information related to body composition. Although not a perfect predictor, BMI has been
shown to be a valid predictor for percentage of body fat. However, it does not directly
estimate the percentage of body fat which is used to classify the level of body
composition.
63
The second, BMI is a trait with an inverted U-shaped - rather than a linear - distribution.
According to a report on obesity published by the World Health Organization (1998), the
range between 18.5 and 24.9 is the optimal BMI zone in terms of physical fitness, a BMI
ranging from 25.0 to 29.9 is regarded as overweight, and a BMI higher than 29.9
indicates levels of obesity often associated with high risk of health problems. On the other
hand, a BMI less than 18.5 is regarded as underweight which is normally caused by
dystrophy and is associated with other health problems as well. Thus, a higher BMI score
does not necessarily stand for a better level of physical fitness; nor does a lower BMI
score necessarily stand for a better physical fitness level. This is a distinctive feature
which sets BMI apart from other physical fitness indicators. For example, a student who
covers 1,000m. in a 9-minute Run test has better cardiorespiratory fitness than a student
who covers 800m. or 600m. Similarly, a higher score on a 1-minute Sit-ups test indicates
a higher level of muscular endurance than a lower score in the same test. Combining BMI
together with other physical fitness indicators in the Rasch measurement scale would
contradict one of the requirements of Rasch model: all items in the same scale should
function in the same (linear) direction along the underlying latent trait under measure.
Rasch Analyses Based on Raw Scores
Among the remaining eight indicators, 1-minute Sit-ups, Standard Push-ups, Modified
Push-ups, Sit-and-Reach, Right Handgrip, and Left Handgrip are ready for Rasch
analyses using WINSTEPS software because the raw scores for these indicators have
fewer than 255 categories that can be accommodated by WINSTEPS. However, the raw
data for 6-minute Run and 9-minute Run are inappropriate for use with WINSTEPS
directly because there are far more than 255 categories in the raw data. Therefore, it is
necessary to transform the raw scores of the 6-minute Run and 9-minute Run into an
appropriate number of categories which are amenable for Rasch analyses using
WINSTEPS software.
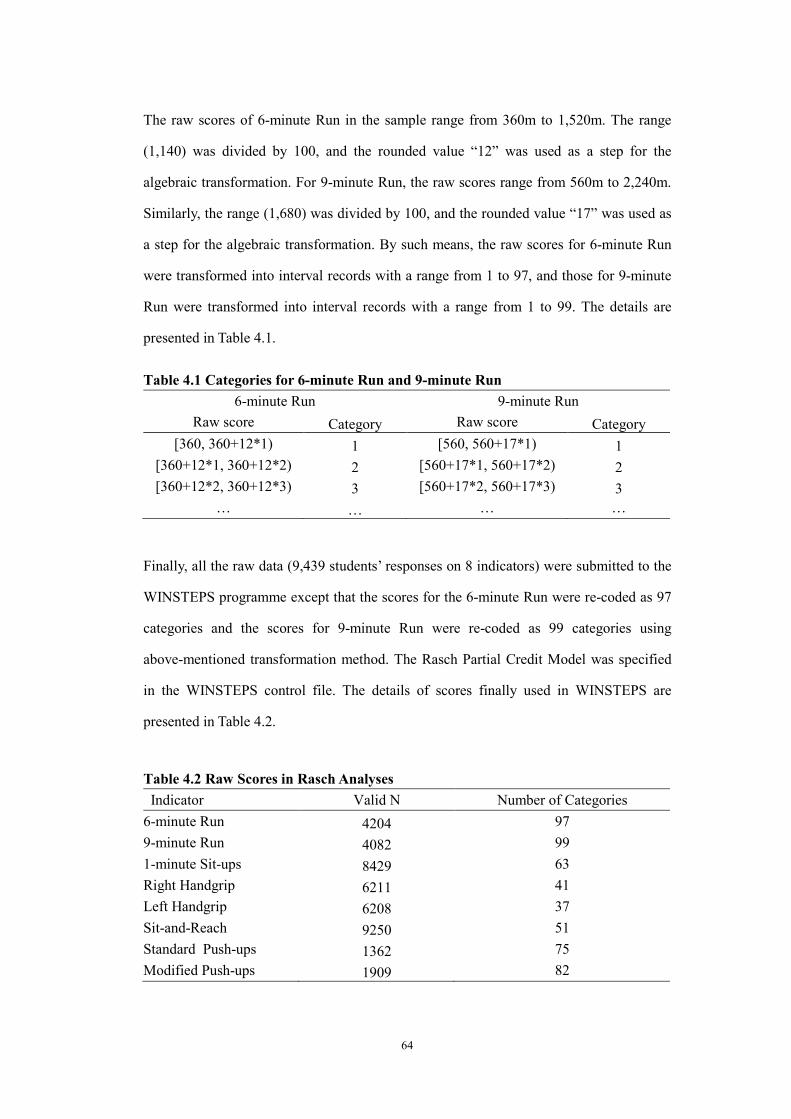
64
The raw scores of 6-minute Run in the sample range from 360m to 1,520m. The range
(1,140) was divided by 100, and the rounded value “12” was used as a step for the
algebraic transformation. For 9-minute Run, the raw scores range from 560m to 2,240m.
Similarly, the range (1,680) was divided by 100, and the rounded value “17” was used as
a step for the algebraic transformation. By such means, the raw scores for 6-minute Run
were transformed into interval records with a range from 1 to 97, and those for 9-minute
Run were transformed into interval records with a range from 1 to 99. The details are
presented in Table 4.1.
Table 4.1 Categories for 6-minute Run and 9-minute Run
6-minute Run 9-minute Run
Raw score Category Raw score Category
[360, 360+12*1) 1 [560, 560+17*1) 1
[360+12*1, 360+12*2) 2 [560+17*1, 560+17*2) 2
[360+12*2, 360+12*3) 3 [560+17*2, 560+17*3) 3
… … … …
Finally, all the raw data (9,439 students’ responses on 8 indicators) were submitted to the
WINSTEPS programme except that the scores for the 6-minute Run were re-coded as 97
categories and the scores for 9-minute Run were re-coded as 99 categories using
above-mentioned transformation method. The Rasch Partial Credit Model was specified
in the WINSTEPS control file. The details of scores finally used in WINSTEPS are
presented in Table 4.2.
Table 4.2 Raw Scores in Rasch Analyses
Indicator Valid N Number of Categories
6-minute Run 4204 97
9-minute Run 4082 99
1-minute Sit-ups 8429 63
Right Handgrip 6211 41
Left Handgrip 6208 37
Sit-and-Reach 9250 51
Standard Push-ups 1362 75
Modified Push-ups 1909 82

65
The Rasch model provides a number of indices that can be used to check the quality of a
measurement scale (Wright & Masters, 1982). These indices widely used in literature
include the Outfit and Infit statistics, the point-measure correlation coefficient, the Rasch
reliability for both person and item, and the variance explained by the measures.
The psychometric properties of the Rasch scale constructed based these data are
presented in Table 4.3. It can be seen that the Infit and Outfit MNSQ for most of the
indicators - except Sit-and-Reach and Modified Push-ups - range from 0.87 to 1.03. The
Infit and Outfit MNSQ for Sit-and-Reach and Modified Push-ups are higher than 1.20,
indicating underfit to the Rasch model’s requirements. The point-measure correlations for
all indicators fall in the productive range of 0.45 to 0.76. That indicates all indicators are
of the same polarity along the latent trait. The Rasch item reliability is 1.00, while the
Rasch person reliability of the scale is much lower at 0.55. This is not surprising
considering there are nearly 10,000 person records used to calibrate the indicator
estimates, but only 8 indicators are used to estimate the person abilities. In other words,
there is more than enough information provided for each indicator, but, for each person,
the information provided is rather limited, such that the errors of indicator estimates are
very small but the errors of the person estimates are fairly large. The variance explained
by the underlying measure is 58.2%. In summary, these indices of scale quality suggest
that it might be productive to investigate the possibilities for scale improvement.
Table 4.3 Scale Property (1)
Indicator Infit
MNSQ
Outfit
MNSQ
Point-Measure
Correlation
Rasch Reliability
(Person/Item)
Variance Explained
by Measure
6-minute Run 0.89 0.89 0.74
0.55/1.00 58.2%
9-minute Run 1.02 1.03 0.76
1-minute Sit-ups 0.91 0.91 0.71
Right Handgrip 0.89 0.90 0.57
Left Handgrip 0.87 0.88 0.58
Sit-and-Reach 1.24 1.25 0.45
Standard Push-ups 0.98 0.98 0.75
Modified Push-ups 1.41 1.44 0.60

66
There are a number of factors that probably lead to the poor performance of the scale. In
the case of this study, the item category structure should be investigated carefully in the
first step. Although WINSTEPS has very generous limits to items’ response category
structure, the analyses results would make no sense if the response categories function
poorly. The 6-minute Run can be used as an example to demonstrate the salient features
of the response category structure of the data. Table 4.4 and Figure 4.1 present the
category structure and category probability curves for the 6-minute Run.
Due to the space limit, Table 4.4 presents just part of the response categories as examples.
Three columns in Table 4.4 are worthy of discussion, namely, observed count, observed
average, and structure calibration. The column “observed count” provides information
about frequencies of categories observed in the data set. The column “observed average”
is the average measure for each category. The column “structure calibration” presents
threshold calibrations or threshold difficulties. Threshold calibrations refer to the position
on the latent trait where the probability of being observed in category n and category n-1
is the same (i.e., 50%).
As indicated in Table 4.4, the frequencies in categories are very uneven. Some categories
(e.g., categories 24 and 31) have a frequency counts of over 400, while many categories
have zero frequency which means those values were not observed meaningfully. It is
expected that the average measures of categories and threshold calibrations should
advance monotonically if the data fit to the Rasch model. The results presented in this
table show that the average measures of categories barely advanced and there were some
reversed average measures (marked by * in the table) as well as reversed threshold
calibrations.
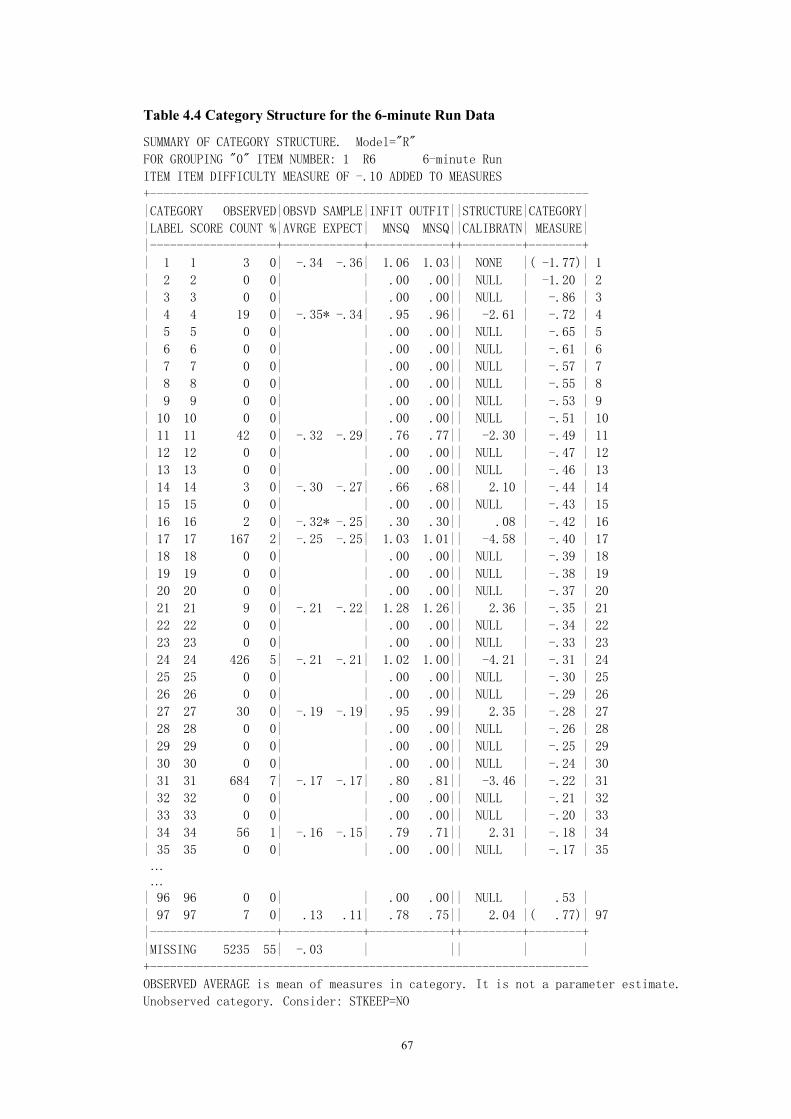
67
Table 4.4 Category Structure for the 6-minute Run Data
SUMMARY OF CATEGORY STRUCTURE. Model="R"
FOR GROUPING "0" ITEM NUMBER: 1 R6 6-minute Run
ITEM ITEM DIFFICULTY MEASURE OF -.10 ADDED TO MEASURES
+------------------------------------------------------------------
|CATEGORY OBSERVED|OBSVD SAMPLE|INFIT OUTFIT||STRUCTURE|CATEGORY|
|LABEL SCORE COUNT %|AVRGE EXPECT| MNSQ MNSQ||CALIBRATN| MEASURE|
|-------------------+------------+------------++---------+--------+
| 1 1 3 0| -.34 -.36| 1.06 1.03|| NONE |( -1.77)| 1
| 2 2 0 0| | .00 .00|| NULL | -1.20 | 2
| 3 3 0 0| | .00 .00|| NULL | -.86 | 3
| 4 4 19 0| -.35* -.34| .95 .96|| -2.61 | -.72 | 4
| 5 5 0 0| | .00 .00|| NULL | -.65 | 5
| 6 6 0 0| | .00 .00|| NULL | -.61 | 6
| 7 7 0 0| | .00 .00|| NULL | -.57 | 7
| 8 8 0 0| | .00 .00|| NULL | -.55 | 8
| 9 9 0 0| | .00 .00|| NULL | -.53 | 9
| 10 10 0 0| | .00 .00|| NULL | -.51 | 10
| 11 11 42 0| -.32 -.29| .76 .77|| -2.30 | -.49 | 11
| 12 12 0 0| | .00 .00|| NULL | -.47 | 12
| 13 13 0 0| | .00 .00|| NULL | -.46 | 13
| 14 14 3 0| -.30 -.27| .66 .68|| 2.10 | -.44 | 14
| 15 15 0 0| | .00 .00|| NULL | -.43 | 15
| 16 16 2 0| -.32* -.25| .30 .30|| .08 | -.42 | 16
| 17 17 167 2| -.25 -.25| 1.03 1.01|| -4.58 | -.40 | 17
| 18 18 0 0| | .00 .00|| NULL | -.39 | 18
| 19 19 0 0| | .00 .00|| NULL | -.38 | 19
| 20 20 0 0| | .00 .00|| NULL | -.37 | 20
| 21 21 9 0| -.21 -.22| 1.28 1.26|| 2.36 | -.35 | 21
| 22 22 0 0| | .00 .00|| NULL | -.34 | 22
| 23 23 0 0| | .00 .00|| NULL | -.33 | 23
| 24 24 426 5| -.21 -.21| 1.02 1.00|| -4.21 | -.31 | 24
| 25 25 0 0| | .00 .00|| NULL | -.30 | 25
| 26 26 0 0| | .00 .00|| NULL | -.29 | 26
| 27 27 30 0| -.19 -.19| .95 .99|| 2.35 | -.28 | 27
| 28 28 0 0| | .00 .00|| NULL | -.26 | 28
| 29 29 0 0| | .00 .00|| NULL | -.25 | 29
| 30 30 0 0| | .00 .00|| NULL | -.24 | 30
| 31 31 684 7| -.17 -.17| .80 .81|| -3.46 | -.22 | 31
| 32 32 0 0| | .00 .00|| NULL | -.21 | 32
| 33 33 0 0| | .00 .00|| NULL | -.20 | 33
| 34 34 56 1| -.16 -.15| .79 .71|| 2.31 | -.18 | 34
| 35 35 0 0| | .00 .00|| NULL | -.17 | 35 … …
| 96 96 0 0| | .00 .00|| NULL | .53 |
| 97 97 7 0| .13 .11| .78 .75|| 2.04 |( .77)| 97
|-------------------+------------+------------++---------+--------+
|MISSING 5235 55| -.03 | || | |
+------------------------------------------------------------------
OBSERVED AVERAGE is mean of measures in category. It is not a parameter estimate.
Unobserved category. Consider: STKEEP=NO

68
Figure 4.1 presents the category probability curves which show the probability of
choosing a specific category for every combination of person ability and item difficulty.
In the probability curve graph, the x-axis stands for the difference between person ability
and item difficulty, the y-axis stands for the probability of choosing a given category. It
can be seen from Figure 4.1 that many categories have no distinct peak in the graph, i.e.,
they are totally submerged by others. That means they were performed rarely by the
children in this sample.
Figure 4.1 Category Probability Curves for the 6-minute Run Data
Other indicators have similar features in their category structure for the raw data. The
results imply that there are many redundant categories which were not actually selected
by even one single respondent. Therefore, it is necessary to collapse some adjacent
categories in order to produce a better category structure and make meaningful analyses

69
and interpretation possible.
Logarithmic Transformation of Raw Scores
As shown in the above sections, there is no problem for the Rasch analyses software (e.g.,
WINSTEPS can analyse up to 255 category levels per item) to handle data with a huge
number of categories, but many more than the necessary category levels probably
introduces challenges to interpretation of the analyses results. In the above analyses, the
number of category levels for indicators ranges from 37 to 99. From a practical
perspective, it is unlikely that students’ performances for physical fitness indicators have
so many qualitatively different levels. Ten metres in a 6-minute Run test or one
centimetre in a Sit-and-Reach test are not likely to indicate a meaningful difference in
physical fitness level, even if that small difference did move a child’s fitness estimate
from a higher to a lower category. Thus it makes little sense to undertake analyses based
on the raw scores with so many unnecessary category levels.
The results of Rasch analyses with recoded scores on 6/9-minute Run and raw scores on
other fitness indicators show that the response category structure has at least four
weaknesses: 1) uneven distribution of respondents among categories; 2) barely advancing
average measures for categories and threshold calibrations; 3) rarely observed category
probability curves for many response categories; and 4) some reversed average measures
and threshold calibrations meaning higher test scores do not necessarily indicate higher
levels of physical fitness. Those deficiencies indicate the necessity of recoding raw scores
into qualitatively different levels to make meaningful category structure for each indicator.
Furthermore, re-expressing raw data into ordered categories would help to interpret the
analyses results easily and detect departures from fit more clearly (Linacre, 2000;
Mosteller & Tukey, 1977).
The Poisson logarithmic transformation was used to transform the raw scores into a data

70
set with more even distribution and more meaningful category structure. The
transformation can be expressed as
Where L is the lowest value of the observations, and H is the highest value of the
observations. The number “8” was chosen just because a 9-category structure was the
intended transformation target.
This Poisson logarithmic transformation broke the observations into intervals such that all
observations in the interval are classified into the same category level. After the
transformation, students’ performances for each fitness indicator were divided into 9
category levels.
Rasch Analyses of 9-Category Data (8 Indicators)
The 9-cateogry data were put into WINSTEPS programme and Rasch analyses was
undertaken again. Figure 4.2 shows that the 9-category response scale has much better
functioning than did the raw observations. Although there are some categories still totally
submerged by others (e.g., categories 2 and 4), this graph provides a clearer picture of
response categories’ functioning and would facilitate the interpretation of the results.
Scored category = 1 + 8 * log(H+1) - log(L+1)
log(observation+1) - log(L+1) (5)
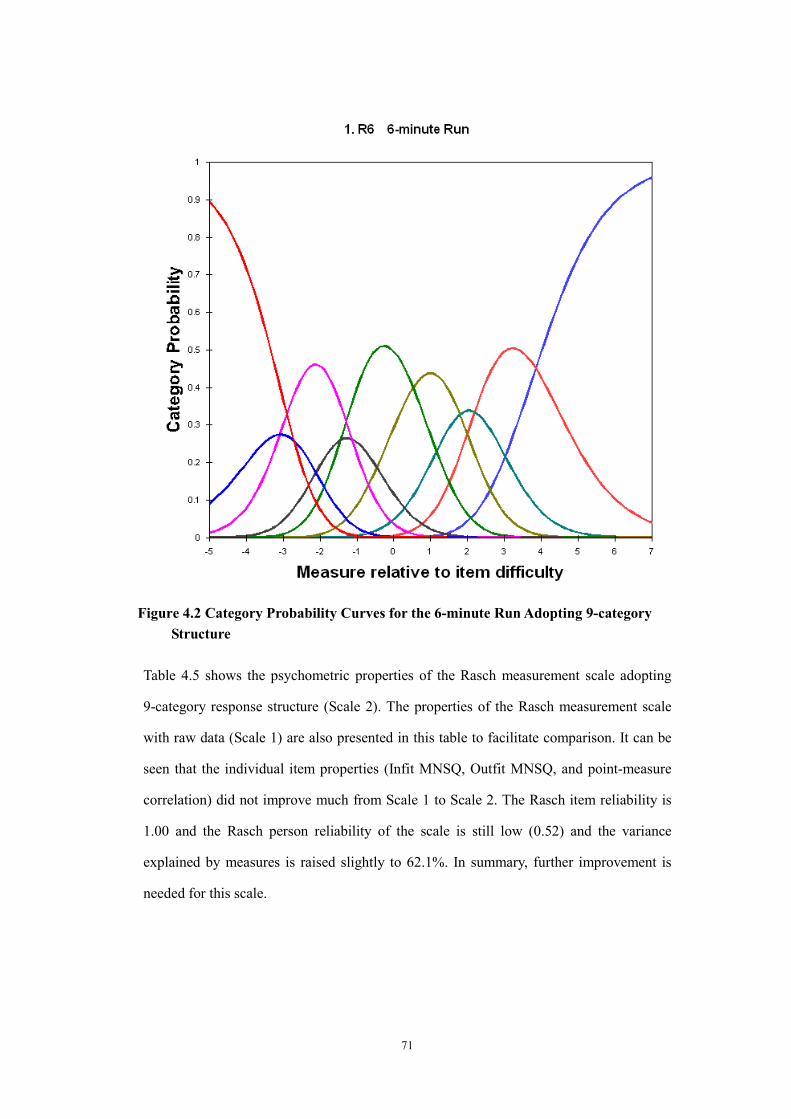
71
Figure 4.2 Category Probability Curves for the 6-minute Run Adopting 9-category
Structure
Table 4.5 shows the psychometric properties of the Rasch measurement scale adopting
9-category response structure (Scale 2). The properties of the Rasch measurement scale
with raw data (Scale 1) are also presented in this table to facilitate comparison. It can be
seen that the individual item properties (Infit MNSQ, Outfit MNSQ, and point-measure
correlation) did not improve much from Scale 1 to Scale 2. The Rasch item reliability is
1.00 and the Rasch person reliability of the scale is still low (0.52) and the variance
explained by measures is raised slightly to 62.1%. In summary, further improvement is
needed for this scale.

72
Table 4.5 Scale Property (2)
Infit
MNSQ
Outfit
MNSQ
Point-Measure
Correlation
Rasch Reliability
(Person/Item)
Variance Explained
by Measures
8-indicator Raw score (Scale 1)
6-minute Run 0.89 0.89 0.74
0.55/1.00 58.2%
9-minute Run 1.02 1.03 0.76
1-minute Sit-ups 0.91 0.91 0.71
Right Handgrip 0.89 0.90 0.57
Left Handgrip 0.87 0.88 0.58
Sit-and-Reach 1.24 1.25 0.45
Standard Push-ups 0.98 0.98 0.75
Modified Push-ups 1.41 1.44 0.60
8-indicator 9-category (Scale 2)
6-minute Run 1.03 1.03 0.58
0.52/1.00 62.1%
9-minute Run 1.09 1.09 0.65
1-minute Sit-ups 0.93 0.91 0.63
Right Handgrip 0.76 0.75 0.73
Left Handgrip 0.74 0.72 0.73
Sit-and-Reach 1.21 1.27 0.42
Standard Push-ups 1.01 1.01 0.70
Modified Push-ups 1.49 1.48 0.47
Rasch Analyses of 9-Category Data (7 Indicators)
Careful investigations of all the indicators showed that, among the eight indicators,
Sit-and-Reach, which is used to assess flexibility, is distinct from others in some
important ways. For example, students’ performances for other physical fitness indicators
increase monotonically with students’ age, but it is not the case for Sit-and-Reach.
Furthermore, the flexibility component has relatively small correlations with other
components of physical fitness. For example, the Marsh and Redmayne (1994) study of
correlations among components of physical fitness (endurance, balance, flexibility, static
strength, and explosive strength/power) found that the correlations involving the
endurance component are larger than the correlations involving the flexibility component.
This is consistent with the findings of this study. Table 4.6 presents the correlations
among students’ performances on the 8 physical fitness indicators. It can be seen that the

73
lowest inter-correlations involved Sit-and-Reach and Modified Push-ups.
Table 4.6 Correlations among Fitness Indicators
6-minute
Run
9-minute
Run
1-minute
Sit-ups
Right
Handgrip
Left
Handgrip
Sit-and-
Reach
Standard
Push-ups
Modified
Push-ups
6-minute Run -
9-minute Run -a -
1-minute Sit-ups .197**
.319**
-
Right Handgrip .098**
.144**
.268**
-
Left Handgrip .126**
.141**
.272**
.818**
-
Sit-and-Reach .049**
.119**
.168**
.039**
.042**
-
Standard Push-ups .242**
.420**
.399**
.153**
.134**
.211**
-
Modified Push-ups .035 .296**
.097**
-.204**
-.190**
.068**
-a -
Note. a Cannot be computed because at least one of the variables is constant.
** Correlation is significant at the 0.01 level (2-tailed).
The low correlation between the flexibility component and other components of physical
fitness can be supported by empirical observations. For example, it is not surprising to see
that a marathon champion who has excellent cardiorespiratory fitness but cannot touch
his toes.
Therefore, Sit-and-Reach was excluded from the Rasch analyses to see if there was any
subsequent scale improvement. The properties of the 7-indicator scale without
Sit-and-Reach (Scale 3) are presented in Table 4.7. It might be argued that exclusion of
one indicator from the scale reduce the raw score range of the scale so might reduce the
Rasch reliability of the scale. However, the results in Table 4.7 show that the Rasch
person reliability increased appreciably from 0.52 to 0.66. This progress in scale property
along with the qualitative considerations above, justified the exclusion of Sit-and-Reach
from the scale. The Rasch item reliability was 1.00. The point-measure correlations for all
indicators range from 0.51 to 0.76 implying that all indicators are of the same polarity
along the latent trait. But the variance explained by the measure changed very little from
Scale 2, and the Infit and Outfit MNSQ of indicators in Scale 3 are not yet satisfactory,
for three indicators including Right Handgrip, Left Handgrip, and Modified Push-ups.
Right Handgrip and Left Handgrip are overfitting and Modified Push-ups is extremely
underfitting.
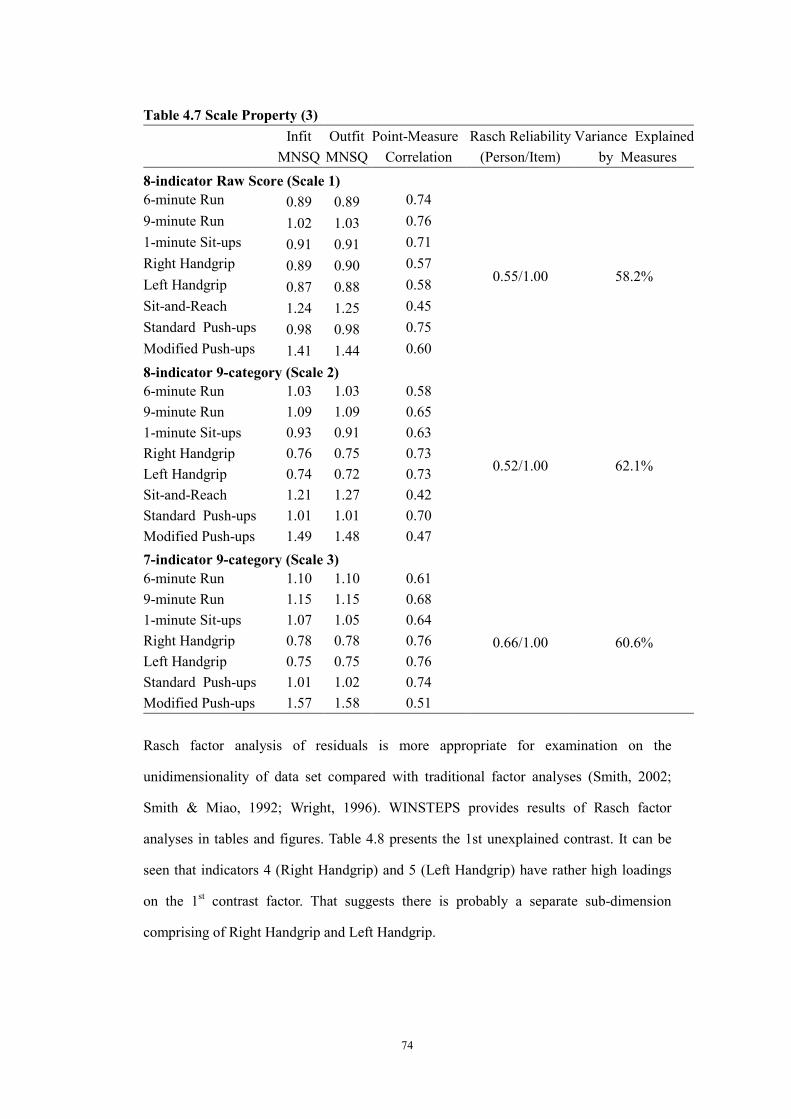
74
Table 4.7 Scale Property (3)
Infit
MNSQ
Outfit
MNSQ
Point-Measure
Correlation
Rasch Reliability
(Person/Item)
Variance Explained
by Measures
8-indicator Raw Score (Scale 1)
6-minute Run 0.89 0.89 0.74
0.55/1.00 58.2%
9-minute Run 1.02 1.03 0.76
1-minute Sit-ups 0.91 0.91 0.71
Right Handgrip 0.89 0.90 0.57
Left Handgrip 0.87 0.88 0.58
Sit-and-Reach 1.24 1.25 0.45
Standard Push-ups 0.98 0.98 0.75
Modified Push-ups 1.41 1.44 0.60
8-indicator 9-category (Scale 2)
6-minute Run 1.03 1.03 0.58
0.52/1.00 62.1%
9-minute Run 1.09 1.09 0.65
1-minute Sit-ups 0.93 0.91 0.63
Right Handgrip 0.76 0.75 0.73
Left Handgrip 0.74 0.72 0.73
Sit-and-Reach 1.21 1.27 0.42
Standard Push-ups 1.01 1.01 0.70
Modified Push-ups 1.49 1.48 0.47
7-indicator 9-category (Scale 3)
6-minute Run 1.10 1.10 0.61
0.66/1.00 60.6%
9-minute Run 1.15 1.15 0.68
1-minute Sit-ups 1.07 1.05 0.64
Right Handgrip 0.78 0.78 0.76
Left Handgrip 0.75 0.75 0.76
Standard Push-ups 1.01 1.02 0.74
Modified Push-ups 1.57 1.58 0.51
Rasch factor analysis of residuals is more appropriate for examination on the
unidimensionality of data set compared with traditional factor analyses (Smith, 2002;
Smith & Miao, 1992; Wright, 1996). WINSTEPS provides results of Rasch factor
analyses in tables and figures. Table 4.8 presents the 1st unexplained contrast. It can be
seen that indicators 4 (Right Handgrip) and 5 (Left Handgrip) have rather high loadings
on the 1st contrast factor. That suggests there is probably a separate sub-dimension
comprising of Right Handgrip and Left Handgrip.

75
Table 4.8 1st Contrast Plot for Scale 3
STANDARDIZED RESIDUAL CONTRAST 1 PLOT
Table of STANDARDIZED RESIDUAL variance (in Eigenvalue units)
Empirical Modeled
Total variance in observations = 17.8 100.0% 100.0%
Variance explained by measures = 10.8 60.6% 60.7%
Unexplained variance (total) = 7.0 39.4% 100.0% 39.3%
Unexplned variance in 1st contrast = 2.1 12.1% 30.7%
-1 0 1
++--------------------------------+--------------------------------++ COUNT
.9 + | +
| | 5 4 | 2
.8 + | +
| | |
.7 + | +
C | | |
O .6 + | +
N | | |
T .5 + | +
R | | |
A .4 + | +
S | | |
T .3 + | +
| | |
1 .2 + | +
| | |
L .1 + | +
O | | |
A .0 +---------------------------------|---------------------------------+
D | | |
I -.1 + | +
N | | |
G -.2 + | 6 + 1
| | |
-.3 + 7 | + 1
| 1 | | 1
-.4 + | +
| 3 | 2 | 2
++--------------------------------+--------------------------------++
-1 0 1
ITEM MEASURE
COUNT: 1 1 1 1 2 1
Table 4.9 further shows that the correlation between Right Handgrip and Left Handgrip
residuals is 0.52, i.e., they share about 27% of their variance in common. These results
are very likely to indicate local dependency between these two items. In this case, there
seems no doubt that students’ performances on Right Handgrip or Left Handgrip have

76
reciprocal influences on each other.
Table 4.9 Largest Standardized Residual Correlations for Scale 3
LARGEST STANDARDIZED RESIDUAL CORRELATIONS
USED TO IDENTIFY DEPENDENT ITEMS
+--------------------------------------------------------------------+
|RESIDUL| ENTRY | ENTRY |
|CORRELN|NUMBER ITEM |NUMBER ITEM |
|-------+----------------------------+-------------------------------|
| .52 | 4 RH Right Handgrip | 5 LH Left Handgrip |
|-------+----------------------------+-------------------------------|
| -.39 | 3 SU Sit-ups | 5 LH Left Handgrip |
| -.38 | 3 SU Sit-ups | 4 RH Right Handgrip |
| -.36 | 2 R9 9-minute Run | 5 LH Left Handgrip |
| -.36 | 2 R9 9-minute Run | 4 RH Right Handgrip |
| -.31 | 1 R6 6-minute Run | 4 RH Right Handgrip |
| -.30 | 1 R6 6-minute Run | 5 LH Left Handgrip |
| -.28 | 4 RH Right Handgrip | 7 MPU Modified Push-ups |
| -.26 | 5 LH Left Handgrip | 7 MPU Modified Push-ups |
| -.19 | 5 LH Left Handgrip | 6 SPU Standard Push-ups |
+--------------------------------------------------------------------+
In order to meet the Rasch model requirement for local independence of all indicators and
to improve the measurement scale, it is necessary and reasonable to use only one grip
indicator rather than two. One of the promising choices is to use Dominant Handgrip
instead of Right Handgrip and Left Handgrip. In this case, the higher score of right
handgrip and left handgrip was chosen as the Dominant Handgrip result for each student.
Besides Right Handgrip and Left Handgrip, local dependence is also likely to occur
between 6-minute Run and 9-minute Run considering their very similar nature. However,
this is not the case in this study. Since the 6-minute Run test is administered to grades 1 to
3 students only, and 9-minute Run test is administered to grades 4 to 6 students only,
there is no single case that has scores on both 6-minute Run and 9-minute Run in the data
set. Therefore, there is no need to deal with these two run indicators in the manner which
has been adopted for Right Handgrip and Left Handgrip.
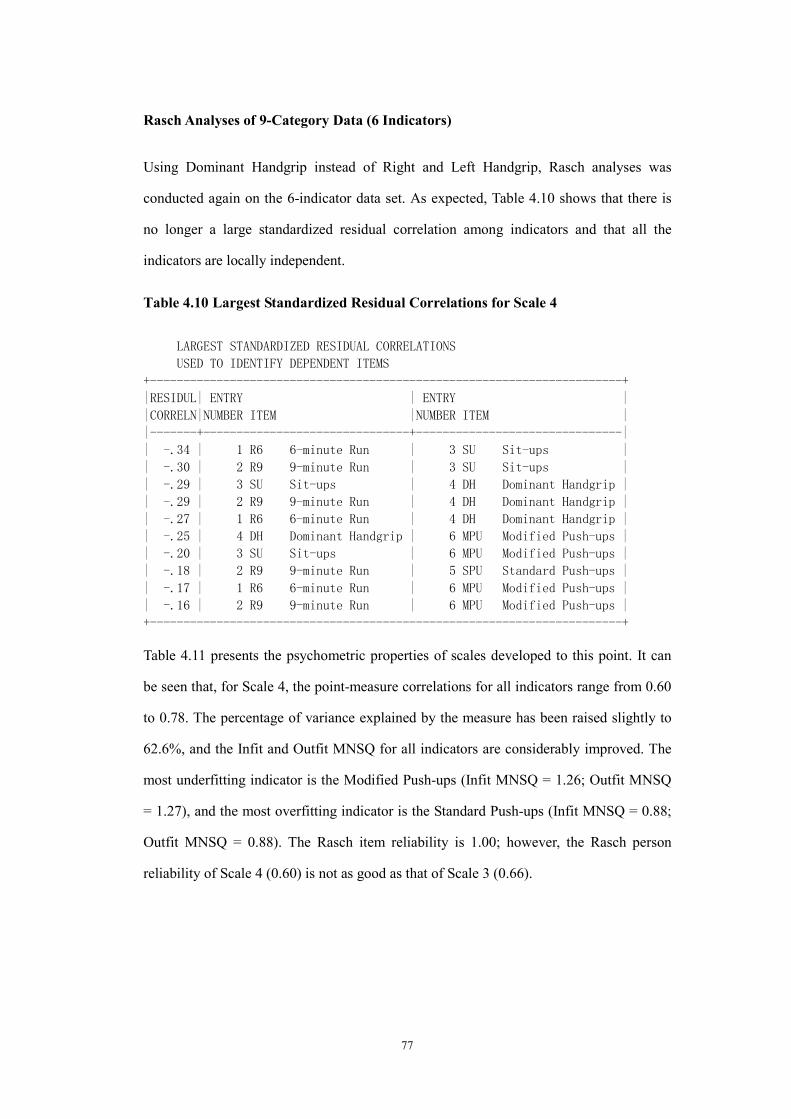
77
Rasch Analyses of 9-Category Data (6 Indicators)
Using Dominant Handgrip instead of Right and Left Handgrip, Rasch analyses was
conducted again on the 6-indicator data set. As expected, Table 4.10 shows that there is
no longer a large standardized residual correlation among indicators and that all the
indicators are locally independent.
Table 4.10 Largest Standardized Residual Correlations for Scale 4
LARGEST STANDARDIZED RESIDUAL CORRELATIONS
USED TO IDENTIFY DEPENDENT ITEMS
+-----------------------------------------------------------------------+
|RESIDUL| ENTRY | ENTRY |
|CORRELN|NUMBER ITEM |NUMBER ITEM |
|-------+-------------------------------+-------------------------------|
| -.34 | 1 R6 6-minute Run | 3 SU Sit-ups |
| -.30 | 2 R9 9-minute Run | 3 SU Sit-ups |
| -.29 | 3 SU Sit-ups | 4 DH Dominant Handgrip |
| -.29 | 2 R9 9-minute Run | 4 DH Dominant Handgrip |
| -.27 | 1 R6 6-minute Run | 4 DH Dominant Handgrip |
| -.25 | 4 DH Dominant Handgrip | 6 MPU Modified Push-ups |
| -.20 | 3 SU Sit-ups | 6 MPU Modified Push-ups |
| -.18 | 2 R9 9-minute Run | 5 SPU Standard Push-ups |
| -.17 | 1 R6 6-minute Run | 6 MPU Modified Push-ups |
| -.16 | 2 R9 9-minute Run | 6 MPU Modified Push-ups |
+-----------------------------------------------------------------------+
Table 4.11 presents the psychometric properties of scales developed to this point. It can
be seen that, for Scale 4, the point-measure correlations for all indicators range from 0.60
to 0.78. The percentage of variance explained by the measure has been raised slightly to
62.6%, and the Infit and Outfit MNSQ for all indicators are considerably improved. The
most underfitting indicator is the Modified Push-ups (Infit MNSQ = 1.26; Outfit MNSQ
= 1.27), and the most overfitting indicator is the Standard Push-ups (Infit MNSQ = 0.88;
Outfit MNSQ = 0.88). The Rasch item reliability is 1.00; however, the Rasch person
reliability of Scale 4 (0.60) is not as good as that of Scale 3 (0.66).
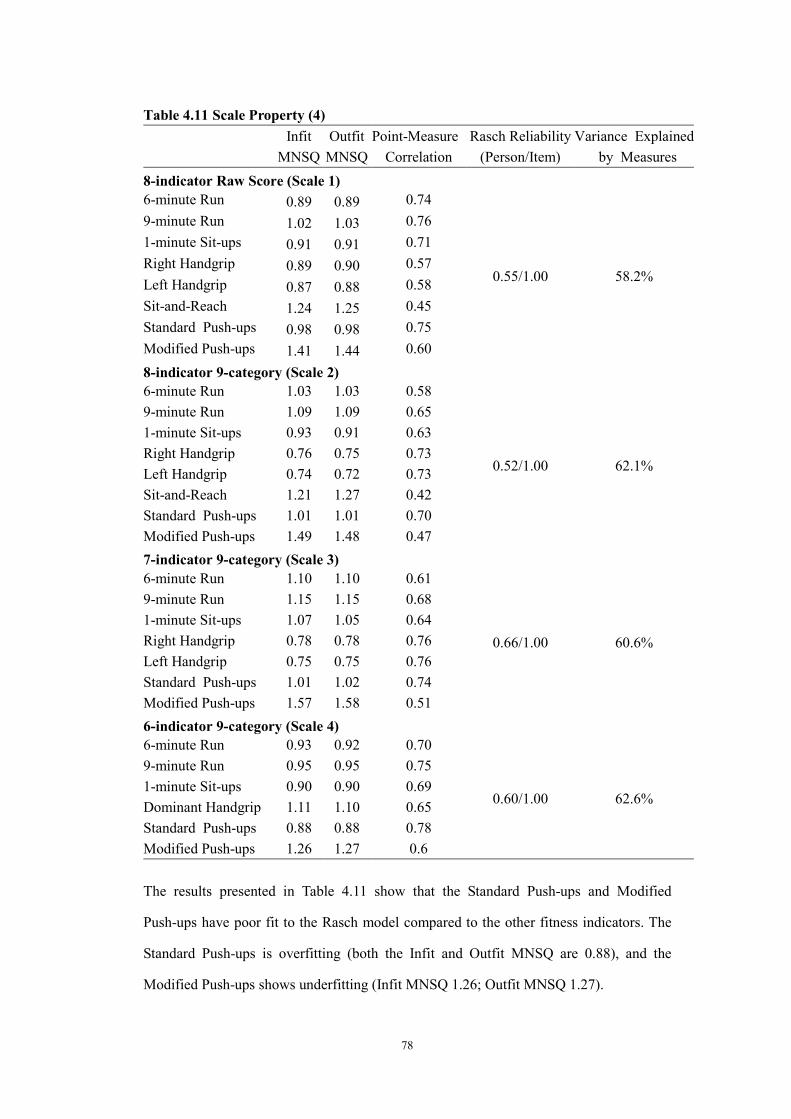
78
Table 4.11 Scale Property (4)
Infit
MNSQ
Outfit
MNSQ
Point-Measure
Correlation
Rasch Reliability
(Person/Item)
Variance Explained
by Measures
8-indicator Raw Score (Scale 1)
6-minute Run 0.89 0.89 0.74
0.55/1.00 58.2%
9-minute Run 1.02 1.03 0.76
1-minute Sit-ups 0.91 0.91 0.71
Right Handgrip 0.89 0.90 0.57
Left Handgrip 0.87 0.88 0.58
Sit-and-Reach 1.24 1.25 0.45
Standard Push-ups 0.98 0.98 0.75
Modified Push-ups 1.41 1.44 0.60
8-indicator 9-category (Scale 2)
6-minute Run 1.03 1.03 0.58
0.52/1.00 62.1%
9-minute Run 1.09 1.09 0.65
1-minute Sit-ups 0.93 0.91 0.63
Right Handgrip 0.76 0.75 0.73
Left Handgrip 0.74 0.72 0.73
Sit-and-Reach 1.21 1.27 0.42
Standard Push-ups 1.01 1.01 0.70
Modified Push-ups 1.49 1.48 0.47
7-indicator 9-category (Scale 3)
6-minute Run 1.10 1.10 0.61
0.66/1.00 60.6%
9-minute Run 1.15 1.15 0.68
1-minute Sit-ups 1.07 1.05 0.64
Right Handgrip 0.78 0.78 0.76
Left Handgrip 0.75 0.75 0.76
Standard Push-ups 1.01 1.02 0.74
Modified Push-ups 1.57 1.58 0.51
6-indicator 9-category (Scale 4)
6-minute Run 0.93 0.92 0.70
0.60/1.00 62.6%
9-minute Run 0.95 0.95 0.75
1-minute Sit-ups 0.90 0.90 0.69
Dominant Handgrip 1.11 1.10 0.65
Standard Push-ups 0.88 0.88 0.78
Modified Push-ups 1.26 1.27 0.6
The results presented in Table 4.11 show that the Standard Push-ups and Modified
Push-ups have poor fit to the Rasch model compared to the other fitness indicators. The
Standard Push-ups is overfitting (both the Infit and Outfit MNSQ are 0.88), and the
Modified Push-ups shows underfitting (Infit MNSQ 1.26; Outfit MNSQ 1.27).

79
Although deleting items with large “misfit” values is often considered, the fit statistics
should act as a criterion to detect problematic items and the test designer should examine
the “misfit” items carefully to uncover the possible effects of other influences (Bond &
Fox, 2007; Wright & Panchapakesan, 1969). In this case, the reasons of the poor
performance of Standard Push-ups and Modified Push-ups in the scale are probably
related to the following points.
The first, in Hong Kong, the Standard Push-ups and Modified Push-ups are not
commonly used fitness indicators for primary school-aged students. The Standard
Push-ups test is normally administered to Secondary male students, and the Modified
Push-ups test is normally administered to Secondary female students. The partner school
of this study used these two indicators just as supplementary tests to assess the
component of muscular endurance before academic year 2005-06. They were no longer
administered after the second semester of academic year 2005-06. Moreover, these two
tests were administered to only a small portion of students before academic year 2005-06.
Among the 9,439 cases, 1,362 (14.4%) cases have Standard Push-ups records, and 1,909
(20.2%) cases have Modified Push-ups records.
The second reason is related to the nature of the Push-ups test. The test would be
terminated only if the tester twice corrects the action of the student. Therefore, both the
tester’s leniency/severity and the student’s performance might have influence on the test
results. Different testers are likely to use slightly different criteria to judge whether a
push-up completed by the student is a correct one or not. On the other hand, these two
tests have no time limit but have an assumption about students’ willingness, i.e., students
were assumed to try their best to complete as many push-ups as possible until they cannot
do any more. But it is not always the case. Since some students will try their best while
the others will not, the testing results might not reflect only the students’ actual levels of
muscular endurance.
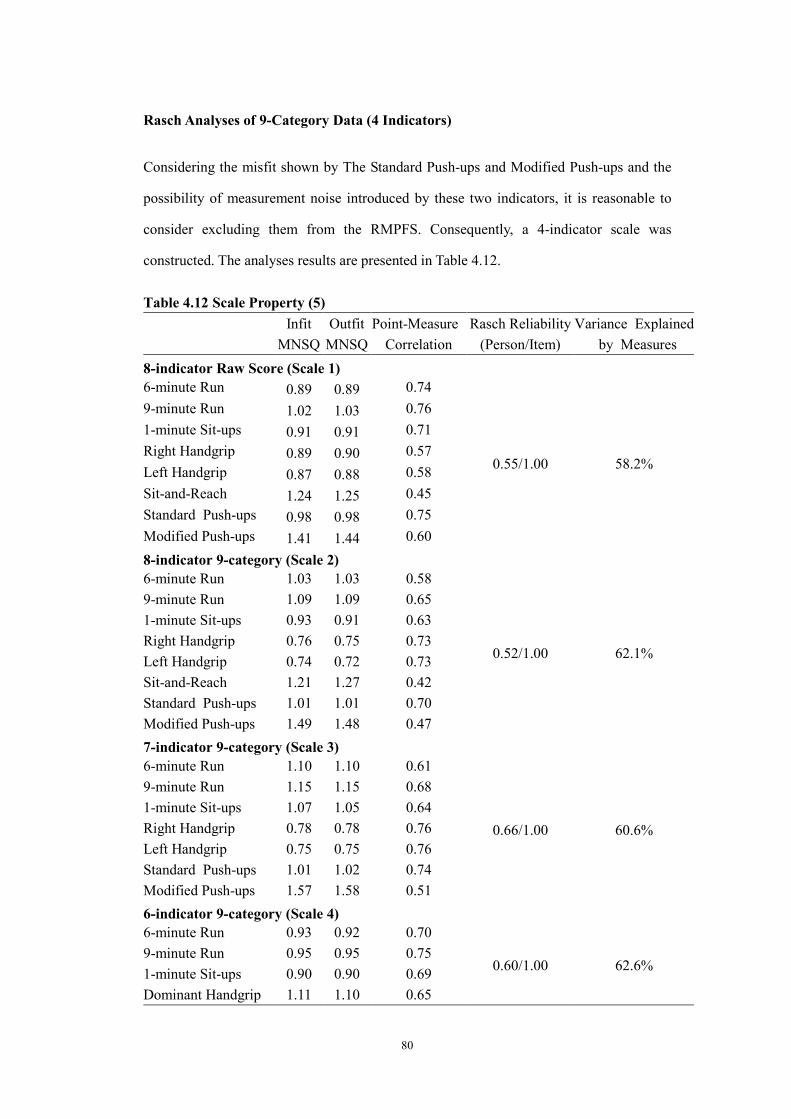
80
Rasch Analyses of 9-Category Data (4 Indicators)
Considering the misfit shown by The Standard Push-ups and Modified Push-ups and the
possibility of measurement noise introduced by these two indicators, it is reasonable to
consider excluding them from the RMPFS. Consequently, a 4-indicator scale was
constructed. The analyses results are presented in Table 4.12.
Table 4.12 Scale Property (5)
Infit
MNSQ
Outfit
MNSQ
Point-Measure
Correlation
Rasch Reliability
(Person/Item)
Variance Explained
by Measures
8-indicator Raw Score (Scale 1)
6-minute Run 0.89 0.89 0.74
0.55/1.00 58.2%
9-minute Run 1.02 1.03 0.76
1-minute Sit-ups 0.91 0.91 0.71
Right Handgrip 0.89 0.90 0.57
Left Handgrip 0.87 0.88 0.58
Sit-and-Reach 1.24 1.25 0.45
Standard Push-ups 0.98 0.98 0.75
Modified Push-ups 1.41 1.44 0.60
8-indicator 9-category (Scale 2)
6-minute Run 1.03 1.03 0.58
0.52/1.00 62.1%
9-minute Run 1.09 1.09 0.65
1-minute Sit-ups 0.93 0.91 0.63
Right Handgrip 0.76 0.75 0.73
Left Handgrip 0.74 0.72 0.73
Sit-and-Reach 1.21 1.27 0.42
Standard Push-ups 1.01 1.01 0.70
Modified Push-ups 1.49 1.48 0.47
7-indicator 9-category (Scale 3)
6-minute Run 1.10 1.10 0.61
0.66/1.00 60.6%
9-minute Run 1.15 1.15 0.68
1-minute Sit-ups 1.07 1.05 0.64
Right Handgrip 0.78 0.78 0.76
Left Handgrip 0.75 0.75 0.76
Standard Push-ups 1.01 1.02 0.74
Modified Push-ups 1.57 1.58 0.51
6-indicator 9-category (Scale 4)
6-minute Run 0.93 0.92 0.70
0.60/1.00 62.6% 9-minute Run 0.95 0.95 0.75
1-minute Sit-ups 0.90 0.90 0.69
Dominant Handgrip 1.11 1.10 0.65
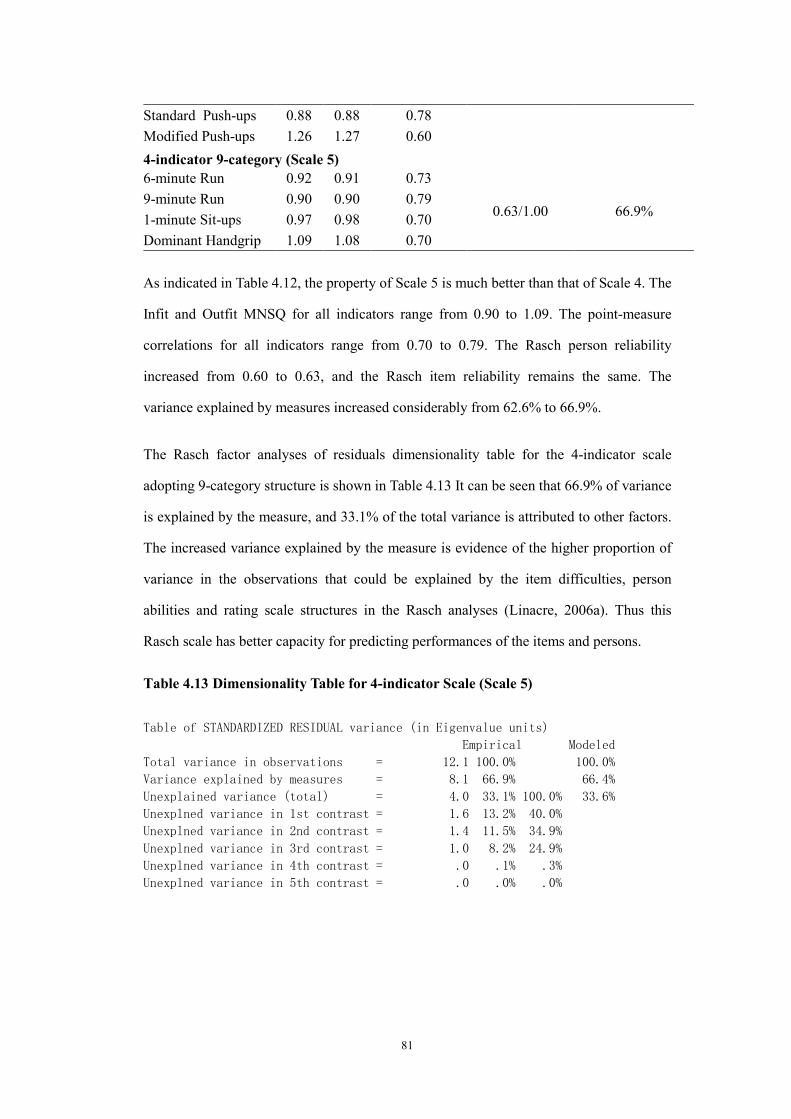
81
Standard Push-ups 0.88 0.88 0.78
Modified Push-ups 1.26 1.27 0.60
4-indicator 9-category (Scale 5)
6-minute Run 0.92 0.91 0.73
0.63/1.00 66.9% 9-minute Run 0.90 0.90 0.79
1-minute Sit-ups 0.97 0.98 0.70
Dominant Handgrip 1.09 1.08 0.70
As indicated in Table 4.12, the property of Scale 5 is much better than that of Scale 4. The
Infit and Outfit MNSQ for all indicators range from 0.90 to 1.09. The point-measure
correlations for all indicators range from 0.70 to 0.79. The Rasch person reliability
increased from 0.60 to 0.63, and the Rasch item reliability remains the same. The
variance explained by measures increased considerably from 62.6% to 66.9%.
The Rasch factor analyses of residuals dimensionality table for the 4-indicator scale
adopting 9-category structure is shown in Table 4.13 It can be seen that 66.9% of variance
is explained by the measure, and 33.1% of the total variance is attributed to other factors.
The increased variance explained by the measure is evidence of the higher proportion of
variance in the observations that could be explained by the item difficulties, person
abilities and rating scale structures in the Rasch analyses (Linacre, 2006a). Thus this
Rasch scale has better capacity for predicting performances of the items and persons.
Table 4.13 Dimensionality Table for 4-indicator Scale (Scale 5)
Table of STANDARDIZED RESIDUAL variance (in Eigenvalue units)
Empirical Modeled
Total variance in observations = 12.1 100.0% 100.0%
Variance explained by measures = 8.1 66.9% 66.4%
Unexplained variance (total) = 4.0 33.1% 100.0% 33.6%
Unexplned variance in 1st contrast = 1.6 13.2% 40.0%
Unexplned variance in 2nd contrast = 1.4 11.5% 34.9%
Unexplned variance in 3rd contrast = 1.0 8.2% 24.9%
Unexplned variance in 4th contrast = .0 .1% .3%
Unexplned variance in 5th contrast = .0 .0% .0%

82
Optimizing Category Structure
Well functioning categories for each indicator should be achieved in order to implement
polytomous Rasch measurement successfully. Generally speaking, there are four
diagnostic indicators to help to control the quality of category structure (i.e., category
frequencies, average measures, threshold calibrations, and category probability curves)
(Linacre, 2002).
Reasonable category frequencies must satisfy two aspects: a) each response category
should have enough observations, i.e., there is reasonable number of respondents who
choose any specific category; and b) the observations should have a regular distribution,
such as uniform, normal, and bimodal distribution, across all categories.
Average measures of categories should increase monotonically in the same direction as
the latent trait increase. That means the higher categories along the trait metric should
have higher average measures than the lower categories on the same metric. For example,
in a 6-minute Run test, the category of 1,000m. should represent higher cardiorespiratory
fitness than does the category of 600m.
Threshold calibrations, conceptualized as Rasch-Thurstone thresholds in the Partial
Credit Model, refer to the difficulty level at which the probability of choosing the lower
category is exceeded by the probability of choosing the next higher category (Bond &
Fox, 2007; p105). Obviously, threshold calibrations should increase monotonically just as
do the average measures for the same reason.
Category probability curves show the probability of choosing a specific category for
every combination of person ability and item difficulty. For reasonable probability curves,
each category should have a peak in the graph. That means each category should be the
most probable option for a given group of persons with specific level of ability.
Table 4.14 presents the category structure for 6-minute Run adopting 9-category data for
that indicator.
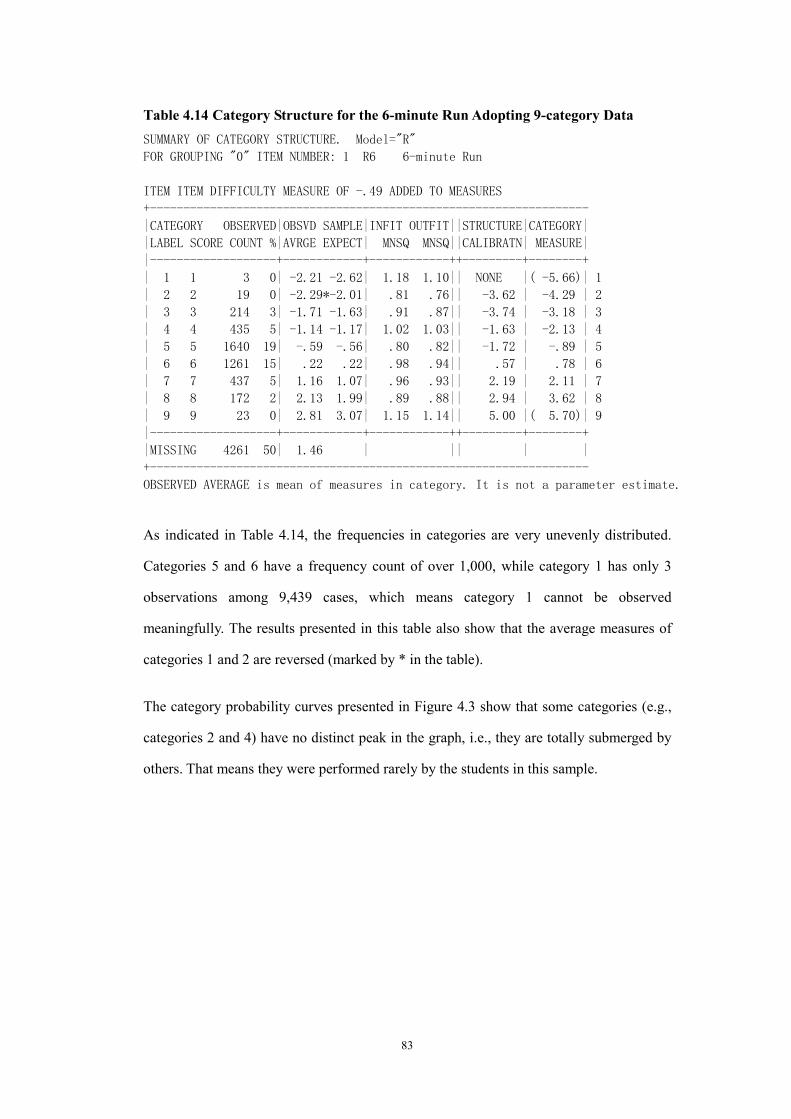
83
Table 4.14 Category Structure for the 6-minute Run Adopting 9-category Data
SUMMARY OF CATEGORY STRUCTURE. Model="R"
FOR GROUPING "0" ITEM NUMBER: 1 R6 6-minute Run
ITEM ITEM DIFFICULTY MEASURE OF -.49 ADDED TO MEASURES
+------------------------------------------------------------------
|CATEGORY OBSERVED|OBSVD SAMPLE|INFIT OUTFIT||STRUCTURE|CATEGORY|
|LABEL SCORE COUNT %|AVRGE EXPECT| MNSQ MNSQ||CALIBRATN| MEASURE|
|-------------------+------------+------------++---------+--------+
| 1 1 3 0| -2.21 -2.62| 1.18 1.10|| NONE |( -5.66)| 1
| 2 2 19 0| -2.29*-2.01| .81 .76|| -3.62 | -4.29 | 2
| 3 3 214 3| -1.71 -1.63| .91 .87|| -3.74 | -3.18 | 3
| 4 4 435 5| -1.14 -1.17| 1.02 1.03|| -1.63 | -2.13 | 4
| 5 5 1640 19| -.59 -.56| .80 .82|| -1.72 | -.89 | 5
| 6 6 1261 15| .22 .22| .98 .94|| .57 | .78 | 6
| 7 7 437 5| 1.16 1.07| .96 .93|| 2.19 | 2.11 | 7
| 8 8 172 2| 2.13 1.99| .89 .88|| 2.94 | 3.62 | 8
| 9 9 23 0| 2.81 3.07| 1.15 1.14|| 5.00 |( 5.70)| 9
|-------------------+------------+------------++---------+--------+
|MISSING 4261 50| 1.46 | || | |
+------------------------------------------------------------------
OBSERVED AVERAGE is mean of measures in category. It is not a parameter estimate.
As indicated in Table 4.14, the frequencies in categories are very unevenly distributed.
Categories 5 and 6 have a frequency count of over 1,000, while category 1 has only 3
observations among 9,439 cases, which means category 1 cannot be observed
meaningfully. The results presented in this table also show that the average measures of
categories 1 and 2 are reversed (marked by * in the table).
The category probability curves presented in Figure 4.3 show that some categories (e.g.,
categories 2 and 4) have no distinct peak in the graph, i.e., they are totally submerged by
others. That means they were performed rarely by the students in this sample.
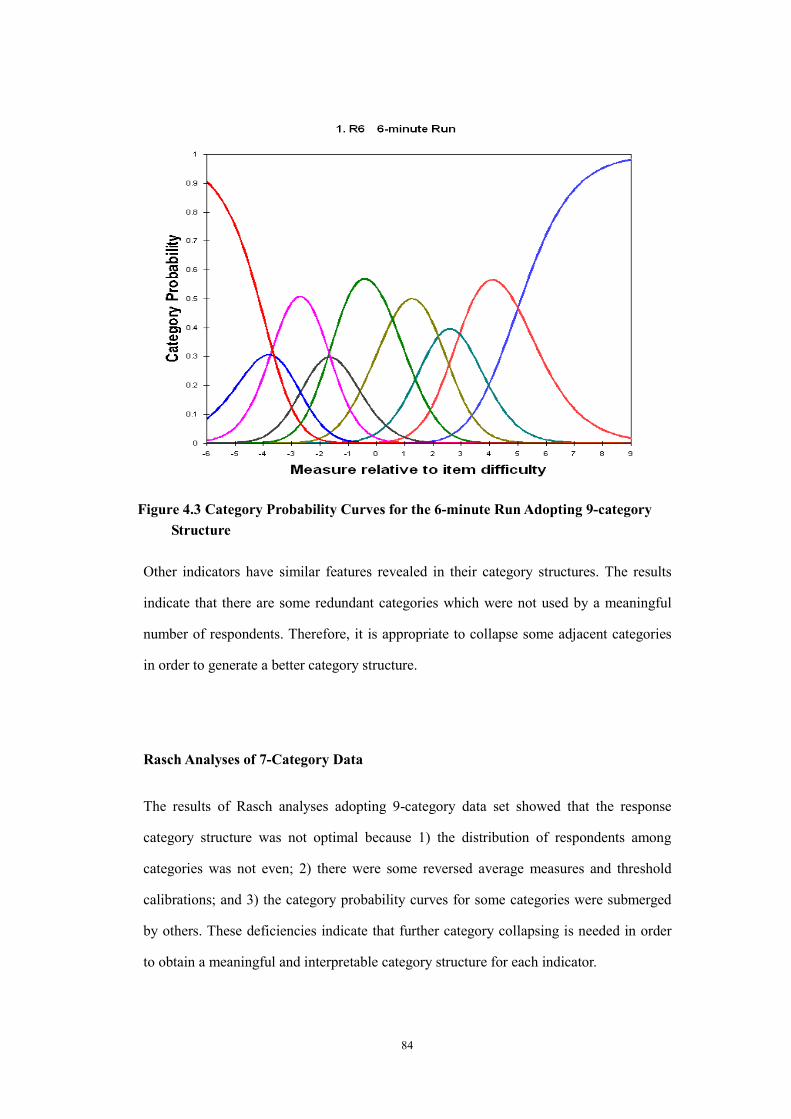
84
Figure 4.3 Category Probability Curves for the 6-minute Run Adopting 9-category
Structure
Other indicators have similar features revealed in their category structures. The results
indicate that there are some redundant categories which were not used by a meaningful
number of respondents. Therefore, it is appropriate to collapse some adjacent categories
in order to generate a better category structure.
Rasch Analyses of 7-Category Data
The results of Rasch analyses adopting 9-category data set showed that the response
category structure was not optimal because 1) the distribution of respondents among
categories was not even; 2) there were some reversed average measures and threshold
calibrations; and 3) the category probability curves for some categories were submerged
by others. These deficiencies indicate that further category collapsing is needed in order
to obtain a meaningful and interpretable category structure for each indicator.
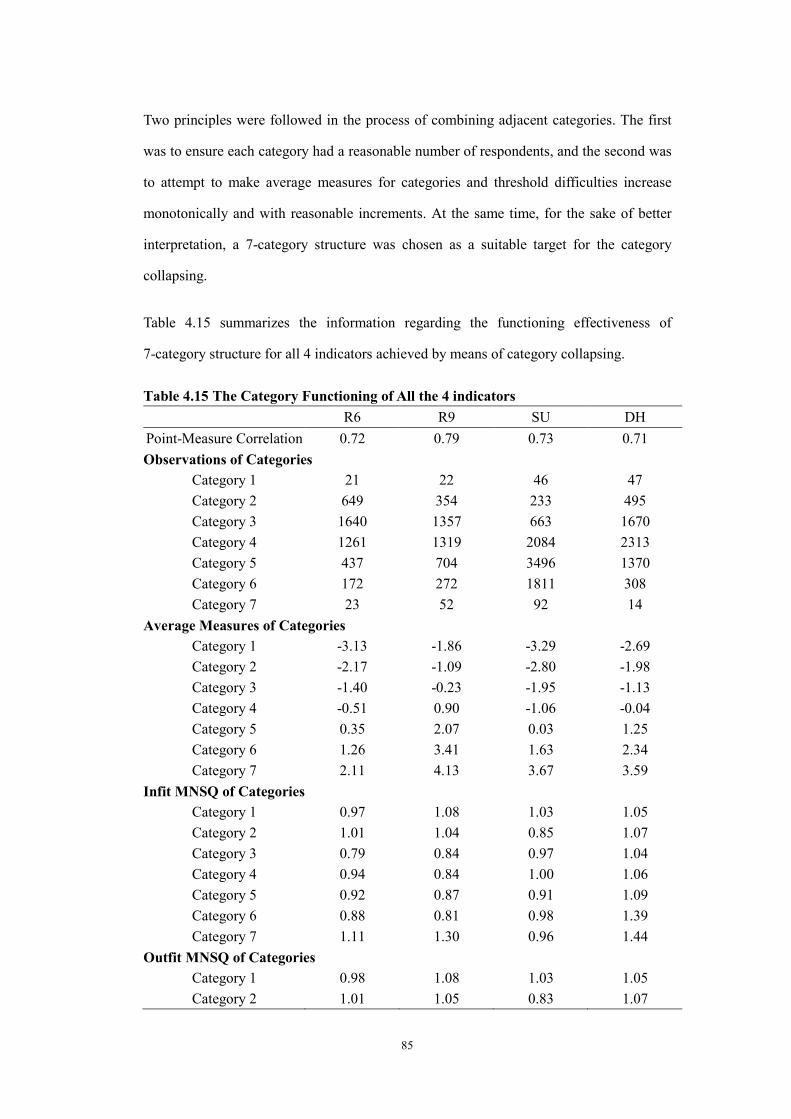
85
Two principles were followed in the process of combining adjacent categories. The first
was to ensure each category had a reasonable number of respondents, and the second was
to attempt to make average measures for categories and threshold difficulties increase
monotonically and with reasonable increments. At the same time, for the sake of better
interpretation, a 7-category structure was chosen as a suitable target for the category
collapsing.
Table 4.15 summarizes the information regarding the functioning effectiveness of
7-category structure for all 4 indicators achieved by means of category collapsing.
Table 4.15 The Category Functioning of All the 4 indicators
R6 R9 SU DH
Point-Measure Correlation 0.72 0.79 0.73 0.71
Observations of Categories
Category 1 21 22 46 47
Category 2 649 354 233 495
Category 3 1640 1357 663 1670
Category 4 1261 1319 2084 2313
Category 5 437 704 3496 1370
Category 6 172 272 1811 308
Category 7 23 52 92 14
Average Measures of Categories
Category 1 -3.13 -1.86 -3.29 -2.69
Category 2 -2.17 -1.09 -2.80 -1.98
Category 3 -1.40 -0.23 -1.95 -1.13
Category 4 -0.51 0.90 -1.06 -0.04
Category 5 0.35 2.07 0.03 1.25
Category 6 1.26 3.41 1.63 2.34
Category 7 2.11 4.13 3.67 3.59
Infit MNSQ of Categories
Category 1 0.97 1.08 1.03 1.05
Category 2 1.01 1.04 0.85 1.07
Category 3 0.79 0.84 0.97 1.04
Category 4 0.94 0.84 1.00 1.06
Category 5 0.92 0.87 0.91 1.09
Category 6 0.88 0.81 0.98 1.39
Category 7 1.11 1.30 0.96 1.44
Outfit MNSQ of Categories
Category 1 0.98 1.08 1.03 1.05
Category 2 1.01 1.05 0.83 1.07
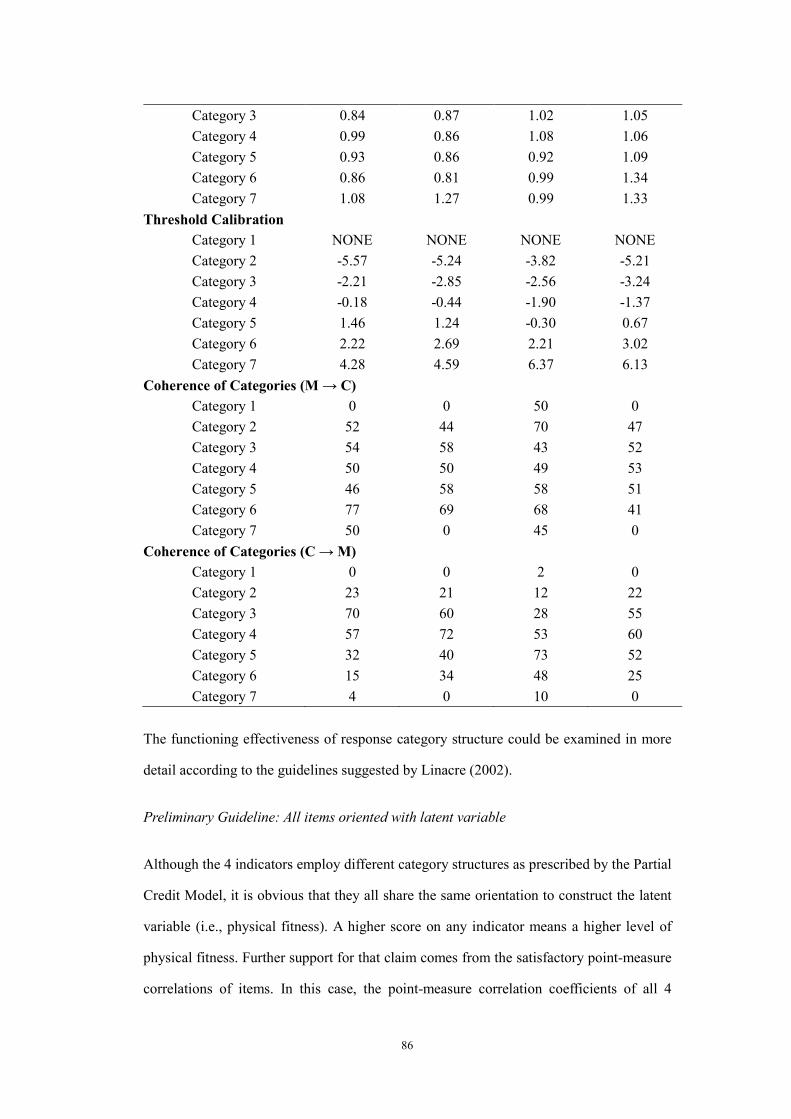
86
Category 3 0.84 0.87 1.02 1.05
Category 4 0.99 0.86 1.08 1.06
Category 5 0.93 0.86 0.92 1.09
Category 6 0.86 0.81 0.99 1.34
Category 7 1.08 1.27 0.99 1.33
Threshold Calibration
Category 1 NONE NONE NONE NONE
Category 2 -5.57 -5.24 -3.82 -5.21
Category 3 -2.21 -2.85 -2.56 -3.24
Category 4 -0.18 -0.44 -1.90 -1.37
Category 5 1.46 1.24 -0.30 0.67
Category 6 2.22 2.69 2.21 3.02
Category 7 4.28 4.59 6.37 6.13
Coherence of Categories (M → C)
Category 1 0 0 50 0
Category 2 52 44 70 47
Category 3 54 58 43 52
Category 4 50 50 49 53
Category 5 46 58 58 51
Category 6 77 69 68 41
Category 7 50 0 45 0
Coherence of Categories (C → M)
Category 1 0 0 2 0
Category 2 23 21 12 22
Category 3 70 60 28 55
Category 4 57 72 53 60
Category 5 32 40 73 52
Category 6 15 34 48 25
Category 7 4 0 10 0
The functioning effectiveness of response category structure could be examined in more
detail according to the guidelines suggested by Linacre (2002).
Preliminary Guideline: All items oriented with latent variable
Although the 4 indicators employ different category structures as prescribed by the Partial
Credit Model, it is obvious that they all share the same orientation to construct the latent
variable (i.e., physical fitness). A higher score on any indicator means a higher level of
physical fitness. Further support for that claim comes from the satisfactory point-measure
correlations of items. In this case, the point-measure correlation coefficients of all 4

87
indicators range from 0.71 to 0.79. That means all indicators share the same polarity
along the measured latent trait (Linacre, 2002).
Guideline #1: At least 10 observations of each category
Stable estimation of category threshold measures requires sufficient frequency of
observations in each category. Linacre (2002) suggested ensuring at least 10 observations
per category for a reasonable degree of stability. As indicated in Table 4.15, the data for
scale development meet this requirement. The number of observations of all categories
for each indicator ranges between 14 (category 7 for Dominant Handgrip) and 3496
(category 5 for 1-minute Sit-ups) with a mean of 879. Most of the categories for each
indicator have more than 100 observations except categories 1 and 7.
Guideline #2: Regular observation distribution
According to Linacre’s (2002) suggestions, although a uniform distribution of
observations is the best choice for threshold calibrations, some other regular or
substantively meaningful observation distributions including uniform distributions,
unimodal distributions peaking in central or extreme categories, and bimodal distributions
peaking in extreme categories are acceptable. In contrast, highly skewed distributions
with long “tails” tend to be troublesome for scale construction. As shown in Table 4.15,
the observation distributions across categories for all the 4 indicators are unimodal
distributions peaking in a central category (category 3 for 6-minute Run and 9-minute
Run, category 5 for 1-minute Sit-ups, and category 4 for Dominant Handgrip) and show
smooth decreases to category 1 and category 7 respectively.
Guideline #3: Average measures advance monotonically with category
The average measures of categories indicate the levels of the measured variable held by
the group of observations for that category. Therefore it naturally follows that a higher
category would have a higher average measure than a lower category. That is, the average
measures of categories should advance monotonically with category. As indicated in
88
Table 4.15, the average measures of categories for all indicators satisfied this requirement.
The increase between adjacent categories ranges from 0.49 to 2.04 logits with a mean of
1.02 logits, supporting the quality of the scale by ensuring that empirical observations in
higher categories correspond to higher measures of the underlying latent trait.
Guideline #4: Outfit mean-squares less than 2.0
Higher Outfit mean-squares (MNSQ) fit indices suggest that more noise than useful
information is provided by the observations. It normally indicates unexpected use of the
category by respondents (Linacre, 2002). The results in Table 4.15 show that the Outfit
and Infit MNSQs for all of categories range from 0.79 to 1.44, and most of them are very
close to 1.0.
Guideline #5: Step calibration advance
Advancing step (i.e., threshold) calibrations ensure that each category would be the most
probable option for a reasonable proportion of respondents with a given amount of the
underlying variable, thereby, avoiding “threshold disordering” (Bond & Fox, 2007;
Linacre, 2002). Failure to fulfill this requirement often indicates that some categories
have too low a probability of being observed. In the case of this scale, the threshold
calibrations of categories for all indicators advance monotonically. The size of the
increases between adjacent thresholds ranges between 0.66 and 4.16 logits with a mean
advance of 2.06 logits. The results suggest that the responses of students with higher
physical fitness levels are more likely to be observed in higher categories.
Guideline #6: Ratings imply measures, and measures imply ratings
The coherence depicted by Guideline #6 refers to the percentages of expected ratings
which are actually observed in that category (i.e., M → C) and the percentages of
expected measures implied by observed ratings (i.e., C → M). In this case, the
measure-to-category coherence (M → C) for all categories with 5 exceptions (category 1
for 6-minute Run, 9-minute Run, and Dominant Handgrip, and category 7 for 9-minute
89
Run and Dominant Handgrip) ranges from 41% to 77%, which means 41% to 77% of
respondents’ performances placed in these categories by measures were actually located
in those categories. The majority of coherence indicators are around 50% - an acceptable
level of coherence in general. The category-to-measure (C → M) coherence for categories
1, 2, and 7 is 23% or less, which means fewer than 23% of respondents located in these
categories were measured in these categories. For categories 3 to 6, the
category-to-measure (C → M) coherence ranges from 15% to 73%, with the majority of
coherences indicators around 50%. In summary, the measure-to-category coherence and
category-to-measure coherence for most of the categories except categories 1 to 7 are
acceptable.
Guideline #7: Step difficulties advance by at least 1.4 logits
For a 3-category scale, step(threshold) difficulties must advance by at least 1.4 logits for
items with these categories, but for 4 or 5 categories, a shorter distance between the
consecutive threshold calibrations (e.g., 1.0 logits) is acceptable (Linacre, 2002). As
shown in Table 4.15, the distances between adjacent threshold calibrations are all larger
than 1.0 with only two exceptions: for 6-minute Run, the distances between threshold 4
(intersection between categories 4 and 5) and threshold 5 (intersection between categories
5 and 6) is 0.76 logits, and for 1-minute Sit-ups, the distances between threshold 2
(intersection between categories 2 and 3) and threshold 3 (intersection between categories
3 and 4) is 0.66 logits.
Guideline #8: Step difficulties advance by less than 5.0 logits
Just like Guideline #7, Guideline #8 also concerns about the distances between two
consecutive threshold calibrations and suggests that the distance between any two
consecutive threshold calibrations should be less than 5.0 logits in order to make sure
categories provide precise information (Linacre, 2002). This requirement is always
fulfilled in the case of this scale. As shown in Table 4.15, the maximum distance between
adjacent threshold calibrations is 4.16 logits.

90
Figure 4.4 Category Probability Curves of the 4 Indicators Adopting 7-Category
Structure
Figure 4.4 presents the category probability curves for each indicator. It can be seen from
the graph that each category of each indicator has its own distinct peak. That means each
category is most likely performed by a sample of respondents with a specific level of
physical fitness.
Table 4.16 presents the property of Scale 6 (the 4-indicator scale with 7-category
response structure) and compares it with the previous versions of the scale. It can be seen
that the property of Scale 6 has little difference from that of Scale 5. The primary

91
advantage of Scale 6 is related to the optimal functioning of its response category
structure.
Table 4.16 Scale Property (6)
Infit
MNSQ
Outfit
MNSQ
Point-Measure
Correlation
Rasch Reliability
(Person/Item)
Variance Explained
by Measures
8-indicator Raw Score (Scale 1)
6-minute Run 0.89 0.89 0.74
0.55/1.00 58.2%
9-minute Run 1.02 1.03 0.76
1-minute Sit-ups 0.91 0.91 0.71
Right Handgrip 0.89 0.90 0.57
Left Handgrip 0.87 0.88 0.58
Sit-and-Reach 1.24 1.25 0.45
Standard Push-ups 0.98 0.98 0.75
Modified Push-ups 1.41 1.44 0.60
8-indicator 9-category (Scale 2)
6-minute Run 1.03 1.03 0.58
0.52/1.00 62.1%
9-minute Run 1.09 1.09 0.65
1-minute Sit-ups 0.93 0.91 0.63
Right Handgrip 0.76 0.75 0.73
Left Handgrip 0.74 0.72 0.73
Sit-and-Reach 1.21 1.27 0.42
Standard Push-ups 1.01 1.01 0.70
Modified Push-ups 1.49 1.48 0.47
7-indicator 9-category (Scale 3)
6-minute Run 1.10 1.10 0.61
0.66/1.00 60.6%
9-minute Run 1.15 1.15 0.68
1-minute Sit-ups 1.07 1.05 0.64
Right Handgrip 0.78 0.78 0.76
Left Handgrip 0.75 0.75 0.76
Standard Push-ups 1.01 1.02 0.74
Modified Push-ups 1.57 1.58 0.51
6-indicator 9-category (Scale 4)
6-minute Run 0.93 0.92 0.70
0.60/1.00 62.6%
9-minute Run 0.95 0.95 0.75
1-minute Sit-ups 0.90 0.90 0.69
Dominant Handgrip 1.11 1.10 0.65
Standard Push-ups 0.88 0.88 0.78
Modified Push-ups 1.26 1.27 0.6
4-indicator 9-category (Scale 5)
6-minute Run 0.92 0.91 0.73 0.63/1.00 66.9%
9-minute Run 0.90 0.90 0.79

92
1-minute Sit-ups 0.97 0.98 0.70
Dominant Handgrip 1.09 1.08 0.70
4-indicator 7-category (Scale 6)
6-minute Run 0.92 0.95 0.72
0.62/1.00 68.7% 9-minute Run 0.90 0.91 0.79
1-minute Sit-ups 0.95 0.99 0.73
Dominant Handgrip 1.10 1.10 0.71
Rasch Analyses of 7-Category Data without Underfitting Persons
Although the results of Rasch analyses on the 7-category data show that the 4-indicator
scale had acceptable fit to the Rasch model, it could be improved further. As Verhelst and
Glas (1995) stated, there are two methods from which researchers could select to improve
the Rasch measurement scale construction. The one is to eliminate one or more “bad”
items and the other is to exclude temporarily some test takers whose performances do not
fit the Rasch model. In this case, eliminating items from the scale is not the preferable
option because only 4 fitness indicators are retained in the scale and all of them are
“good” items from both the practical and Rasch measurement perspectives. Consequently,
the alternative – eliminating misfitting persons – was carried out in an attempt to improve
the measurement characteristics of the physical fitness scale. It also conforms to the basic
principle of scale construction – using the best data to construct the best scale – because,
by definition, misfitting persons introduce unexpected noise to the data analyses.
Bond and Fox (2007) pointed out that underfitting persons (MNSQ fit statistics are much
higher than 1.0) are more detrimental to calibrating a measurement scale than are
overfitting persons (MNSQ fit statistics are much lower than 1.0). Linacre (2002) further
stated that Outfit MNSQ fit indices higher than 2.0 indicate more noise than useful
information provided by the observations. Consequently, persons were excluded from the
scale construction if either the Outfit MNSQ or Infit MNSQ was higher than 2.0 in latest
round of analyses. Finally, a total of 8,469 cases which had at least one score for any of
the four indicators (6-minute Run, 9-minute Run, 1-minute Sit-ups, and Dominant

93
Handgrip) were included, and 1,185 cases that were extremely underfitting to the Rasch
model were excluded and Rasch analyses is conducted again. Detailed investigation of
the performances of underfitting persons showed that there was no detectable pattern held
or shared by the underfitting persons.
Table 4.17 presents the property of the 4-indicator scale without underfitting persons
(Scale 7), in which the scale and the indicators show good fit to the Rasch model.
Table 4.17 Scale Property (7)
Infit
MNSQ
Outfit
MNSQ
Point-Measure
Correlation
Rasch Reliability
(Person/Item)
Variance Explained
by Measures
8-indicator Raw Score (Scale 1)
6-minute Run 0.89 0.89 0.74
0.55/1.00 58.2%
9-minute Run 1.02 1.03 0.76
1-minute Sit-ups 0.91 0.91 0.71
Right Handgrip 0.89 0.90 0.57
Left Handgrip 0.87 0.88 0.58
Sit-and-Reach 1.24 1.25 0.45
Standard Push-ups 0.98 0.98 0.75
Modified Push-ups 1.41 1.44 0.60
8-indicator 9-category (Scale 2)
6-minute Run 1.03 1.03 0.58
0.52/1.00 62.1%
9-minute Run 1.09 1.09 0.65
1-minute Sit-ups 0.93 0.91 0.63
Right Handgrip 0.76 0.75 0.73
Left Handgrip 0.74 0.72 0.73
Sit-and-Reach 1.21 1.27 0.42
Standard Push-ups 1.01 1.01 0.70
Modified Push-ups 1.49 1.48 0.47
7-indicator 9-category (Scale 3)
6-minute Run 1.10 1.10 0.61
0.66/1.00 60.6%
9-minute Run 1.15 1.15 0.68
1-minute Sit-ups 1.07 1.05 0.64
Right Handgrip 0.78 0.78 0.76
Left Handgrip 0.75 0.75 0.76
Standard Push-ups 1.01 1.02 0.74
Modified Push-ups 1.57 1.58 0.51
6-indicator 9-category (Scale 4)
6-minute Run 0.93 0.92 0.70 0.60/1.00 62.6%
9-minute Run 0.95 0.95 0.75

94
1-minute Sit-ups 0.90 0.90 0.69
Dominant Handgrip 1.11 1.10 0.65
Standard Push-ups 0.88 0.88 0.78
Modified Push-ups 1.26 1.27 0.6
4-indicator 9-category (Scale 5)
6-minute Run 0.92 0.91 0.73
0.63/1.00 66.9% 9-minute Run 0.90 0.90 0.79
1-minute Sit-ups 0.97 0.98 0.70
Dominant Handgrip 1.09 1.08 0.70
4-indicator 7-category (Scale 6)
6-minute Run 0.92 0.95 0.72
0.62/1.00 68.7% 9-minute Run 0.90 0.91 0.79
1-minute Sit-ups 0.95 0.99 0.73
Dominant Handgrip 1.10 1.10 0.71
4-indicator 7-category without Underfitting Persons (Scale 7)
6-minute Run 0.93 0.96 0.78
0.77/1.00 81.5% 9-minute Run 0.85 0.88 0.86
1-minute Sit-ups 0.95 1.00 0.79
Dominant Handgrip 1.11 1.13 0.79
It can be seen that, for Scale 7, the Infit and Outfit MNSQ for all indicators range from
0.85 (Infit MNSQ of 9-minute Run) to 1.13 (Outfit MNSQ of Dominant Handgrip). The
point-measure correlations for all indicators fall in the range between 0.78 and 0.86. The
Rasch item reliability is 1.00. Compared with Scale 6, Scale 7 has significant
improvement in both Rasch person reliability and variance explained by measures. The
Rasch person reliability of Scale 7 is 0.77 (0.62 for Scale 6), and the measures explained
81.5% of the total variance (68.7% for Scale 6).
Considerations of Sex Differential Item Functioning (DIF)
DIF occurs when different groups of students of the same level of latent trait have
different scores on an item in a test (Embretson & Reise, 2000). An item with DIF
displays unexpected behavior or shows bias to some specific groups of students. The
Mantel-Haenszel statistic is a typical indicator which has been used in many studies to
detect DIF (e.g., Clauser & Mazor, 1998; Hidalgo & LóPez-Pina, 2004; Holland &
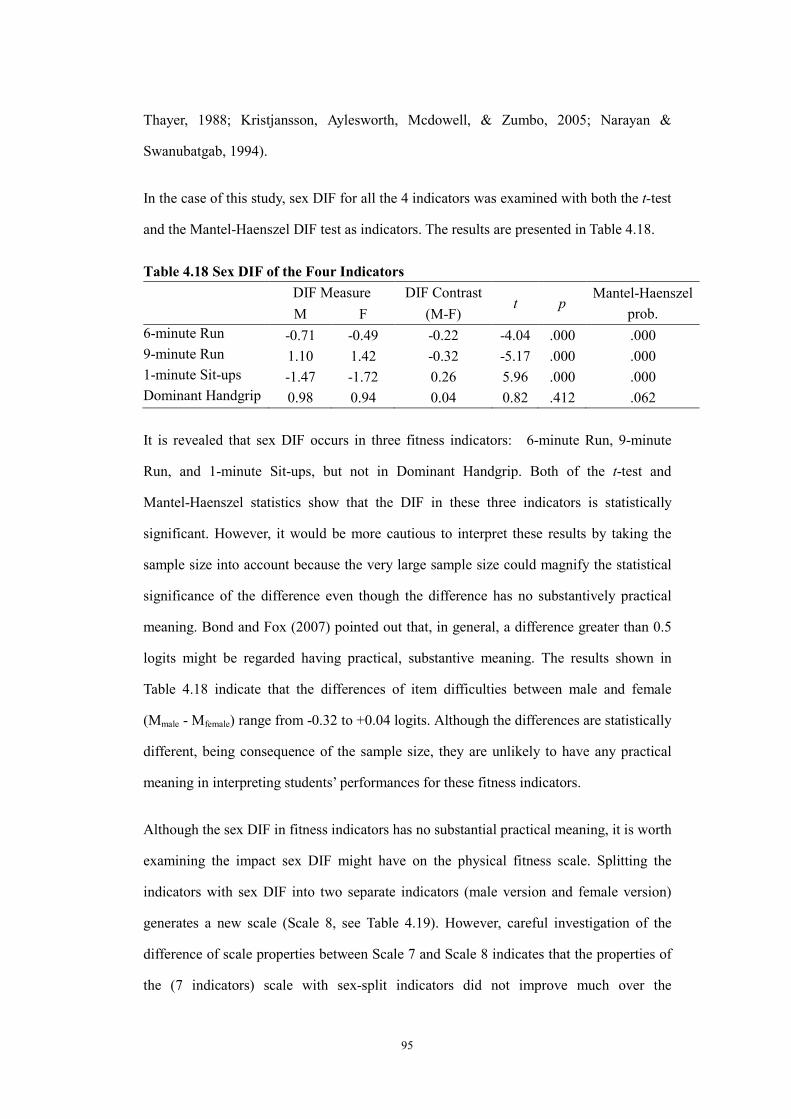
95
Thayer, 1988; Kristjansson, Aylesworth, Mcdowell, & Zumbo, 2005; Narayan &
Swanubatgab, 1994).
In the case of this study, sex DIF for all the 4 indicators was examined with both the t-test
and the Mantel-Haenszel DIF test as indicators. The results are presented in Table 4.18.
Table 4.18 Sex DIF of the Four Indicators
DIF Measure DIF Contrast t p
Mantel-Haenszel
prob. M F (M-F)
6-minute Run -0.71 -0.49 -0.22 -4.04 .000 .000
9-minute Run 1.10 1.42 -0.32 -5.17 .000 .000
1-minute Sit-ups -1.47 -1.72 0.26 5.96 .000 .000
Dominant Handgrip 0.98 0.94 0.04 0.82 .412 .062
It is revealed that sex DIF occurs in three fitness indicators: 6-minute Run, 9-minute
Run, and 1-minute Sit-ups, but not in Dominant Handgrip. Both of the t-test and
Mantel-Haenszel statistics show that the DIF in these three indicators is statistically
significant. However, it would be more cautious to interpret these results by taking the
sample size into account because the very large sample size could magnify the statistical
significance of the difference even though the difference has no substantively practical
meaning. Bond and Fox (2007) pointed out that, in general, a difference greater than 0.5
logits might be regarded having practical, substantive meaning. The results shown in
Table 4.18 indicate that the differences of item difficulties between male and female
(Mmale - Mfemale) range from -0.32 to +0.04 logits. Although the differences are statistically
different, being consequence of the sample size, they are unlikely to have any practical
meaning in interpreting students’ performances for these fitness indicators.
Although the sex DIF in fitness indicators has no substantial practical meaning, it is worth
examining the impact sex DIF might have on the physical fitness scale. Splitting the
indicators with sex DIF into two separate indicators (male version and female version)
generates a new scale (Scale 8, see Table 4.19). However, careful investigation of the
difference of scale properties between Scale 7 and Scale 8 indicates that the properties of
the (7 indicators) scale with sex-split indicators did not improve much over the
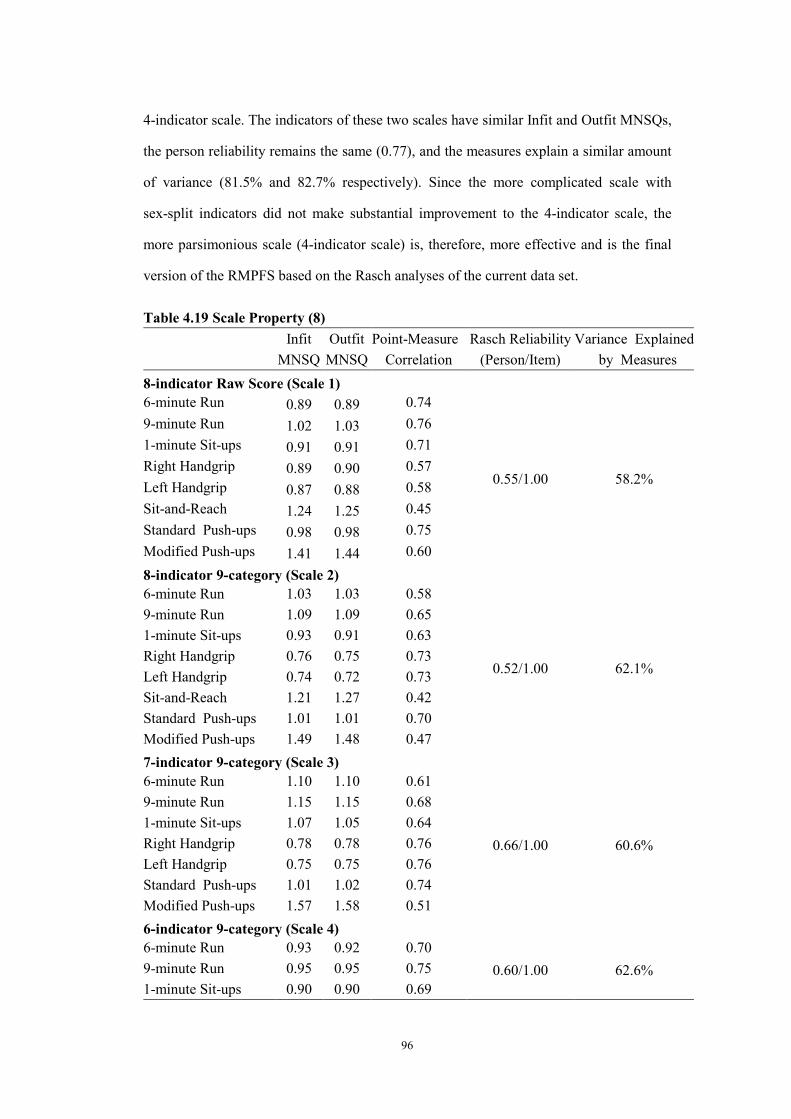
96
4-indicator scale. The indicators of these two scales have similar Infit and Outfit MNSQs,
the person reliability remains the same (0.77), and the measures explain a similar amount
of variance (81.5% and 82.7% respectively). Since the more complicated scale with
sex-split indicators did not make substantial improvement to the 4-indicator scale, the
more parsimonious scale (4-indicator scale) is, therefore, more effective and is the final
version of the RMPFS based on the Rasch analyses of the current data set.
Table 4.19 Scale Property (8)
Infit
MNSQ
Outfit
MNSQ
Point-Measure
Correlation
Rasch Reliability
(Person/Item)
Variance Explained
by Measures
8-indicator Raw Score (Scale 1)
6-minute Run 0.89 0.89 0.74
0.55/1.00 58.2%
9-minute Run 1.02 1.03 0.76
1-minute Sit-ups 0.91 0.91 0.71
Right Handgrip 0.89 0.90 0.57
Left Handgrip 0.87 0.88 0.58
Sit-and-Reach 1.24 1.25 0.45
Standard Push-ups 0.98 0.98 0.75
Modified Push-ups 1.41 1.44 0.60
8-indicator 9-category (Scale 2)
6-minute Run 1.03 1.03 0.58
0.52/1.00 62.1%
9-minute Run 1.09 1.09 0.65
1-minute Sit-ups 0.93 0.91 0.63
Right Handgrip 0.76 0.75 0.73
Left Handgrip 0.74 0.72 0.73
Sit-and-Reach 1.21 1.27 0.42
Standard Push-ups 1.01 1.01 0.70
Modified Push-ups 1.49 1.48 0.47
7-indicator 9-category (Scale 3)
6-minute Run 1.10 1.10 0.61
0.66/1.00 60.6%
9-minute Run 1.15 1.15 0.68
1-minute Sit-ups 1.07 1.05 0.64
Right Handgrip 0.78 0.78 0.76
Left Handgrip 0.75 0.75 0.76
Standard Push-ups 1.01 1.02 0.74
Modified Push-ups 1.57 1.58 0.51
6-indicator 9-category (Scale 4)
6-minute Run 0.93 0.92 0.70
0.60/1.00 62.6% 9-minute Run 0.95 0.95 0.75
1-minute Sit-ups 0.90 0.90 0.69
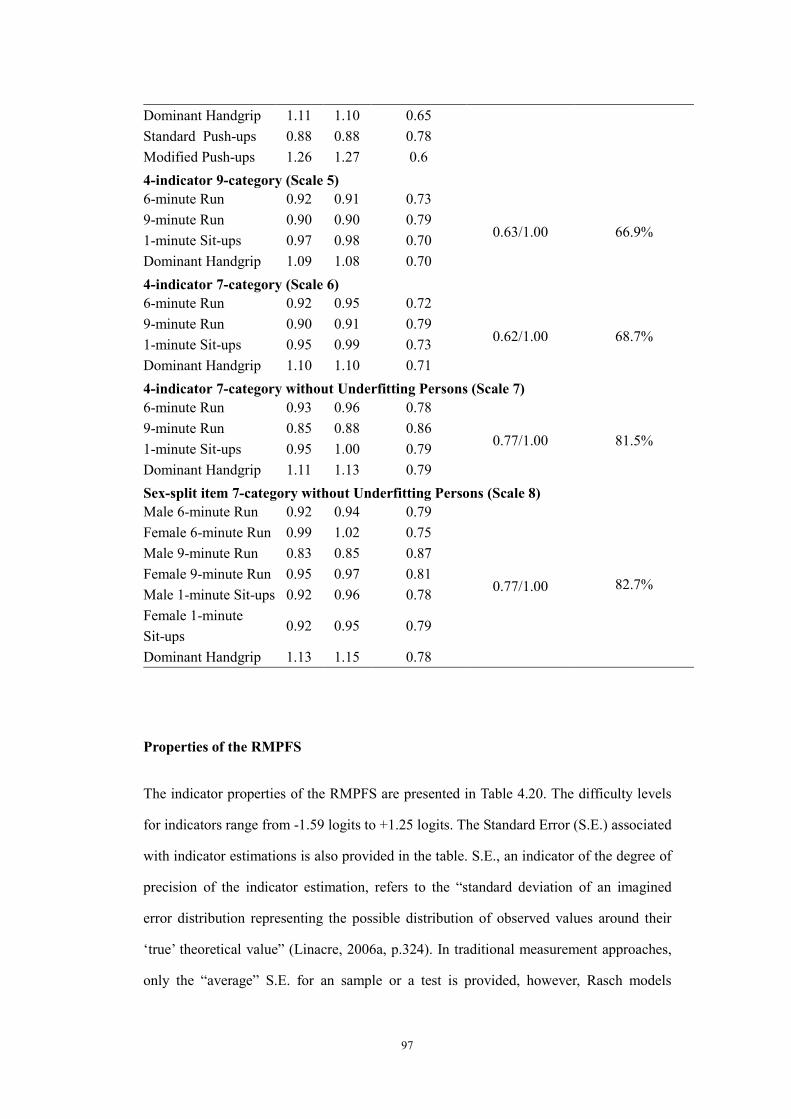
97
Dominant Handgrip 1.11 1.10 0.65
Standard Push-ups 0.88 0.88 0.78
Modified Push-ups 1.26 1.27 0.6
4-indicator 9-category (Scale 5)
6-minute Run 0.92 0.91 0.73
0.63/1.00 66.9% 9-minute Run 0.90 0.90 0.79
1-minute Sit-ups 0.97 0.98 0.70
Dominant Handgrip 1.09 1.08 0.70
4-indicator 7-category (Scale 6)
6-minute Run 0.92 0.95 0.72
0.62/1.00 68.7% 9-minute Run 0.90 0.91 0.79
1-minute Sit-ups 0.95 0.99 0.73
Dominant Handgrip 1.10 1.10 0.71
4-indicator 7-category without Underfitting Persons (Scale 7)
6-minute Run 0.93 0.96 0.78
0.77/1.00 81.5% 9-minute Run 0.85 0.88 0.86
1-minute Sit-ups 0.95 1.00 0.79
Dominant Handgrip 1.11 1.13 0.79
Sex-split item 7-category without Underfitting Persons (Scale 8)
Male 6-minute Run 0.92 0.94 0.79
0.77/1.00 82.7%
Female 6-minute Run 0.99 1.02 0.75
Male 9-minute Run 0.83 0.85 0.87
Female 9-minute Run 0.95 0.97 0.81
Male 1-minute Sit-ups 0.92 0.96 0.78
Female 1-minute
Sit-ups 0.92 0.95 0.79
Dominant Handgrip 1.13 1.15 0.78
Properties of the RMPFS
The indicator properties of the RMPFS are presented in Table 4.20. The difficulty levels
for indicators range from -1.59 logits to +1.25 logits. The Standard Error (S.E.) associated
with indicator estimations is also provided in the table. S.E., an indicator of the degree of
precision of the indicator estimation, refers to the “standard deviation of an imagined
error distribution representing the possible distribution of observed values around their
‘true’ theoretical value” (Linacre, 2006a, p.324). In traditional measurement approaches,
only the “average” S.E. for an sample or a test is provided, however, Rasch models

98
provide separate S.E. for each and every estimation of person ability and item difficulty
(Linacre, 2000; Smith, 2001). Separate S.Es provide more useful information for
examining the precision of estimates for individual persons and items than does the
“average” S.E. for a sample or test. The results in Table 4.20 show that the S.Es for the
estimations of 6-minute Run and 9-minute Run are 0.03 logits, and the S.Es for the
estimations of 1-minute Sit-ups and Dominant Handgrip are 0.02 logits. These small S.Es
are a consequence of large sample size and imply that the indicator difficulty estimations
are quite precise.
Table 4.20 presents several important indices used to examine the quality of the resultant
RMPFS from a Rasch measurement perspective. The indices include Infit and Outfit
MNSQ, point-measure correlations, person separation index, Rasch person reliability,
item separation index, and Rasch item reliability. As shown in Table 4.20, the Infit and
Outfit MNSQ for all indicators are very close to 1.0. The minimum value is 0.85 (Infit
MNSQ for 9-minute Run), and the maximum value is 1.13 (Outfit MNSQ for Dominant
Handgrip). The results suggest that the indicators have sufficient fit to the Rasch model
for practical measurement purposes – especially for such low-stakes decisions. The
point-measure correlations for all the 4 indicators approximate 0.8. That supports the
claim that all the indicators function at the same direction as a part of the latent trait under
measure. The Rasch item reliability is 1.00 and the Rasch person reliability is 0.77. The
Rasch person reliability is not very high but acceptable considering this is a consequence
of retaining only four items in the RMPFS. Smith (2001) proposed that, in addition to
Rasch reliability, researchers should use separation indices (person separation index and
item separation index) to indicate the spread of person measures or item calibrations
along the variable under measure in S.E. units. The separation indices can be
mathematically transformed from Rasch reliability and have two advantages: 1)
separation indices are linear estimations while Rasch reliability is non-linear; and 2)
separation indices can range from zero to infinity while Rasch reliabilities are restricted in
the range of zero to one (Smith, 2001). The higher separation indices derive from higher
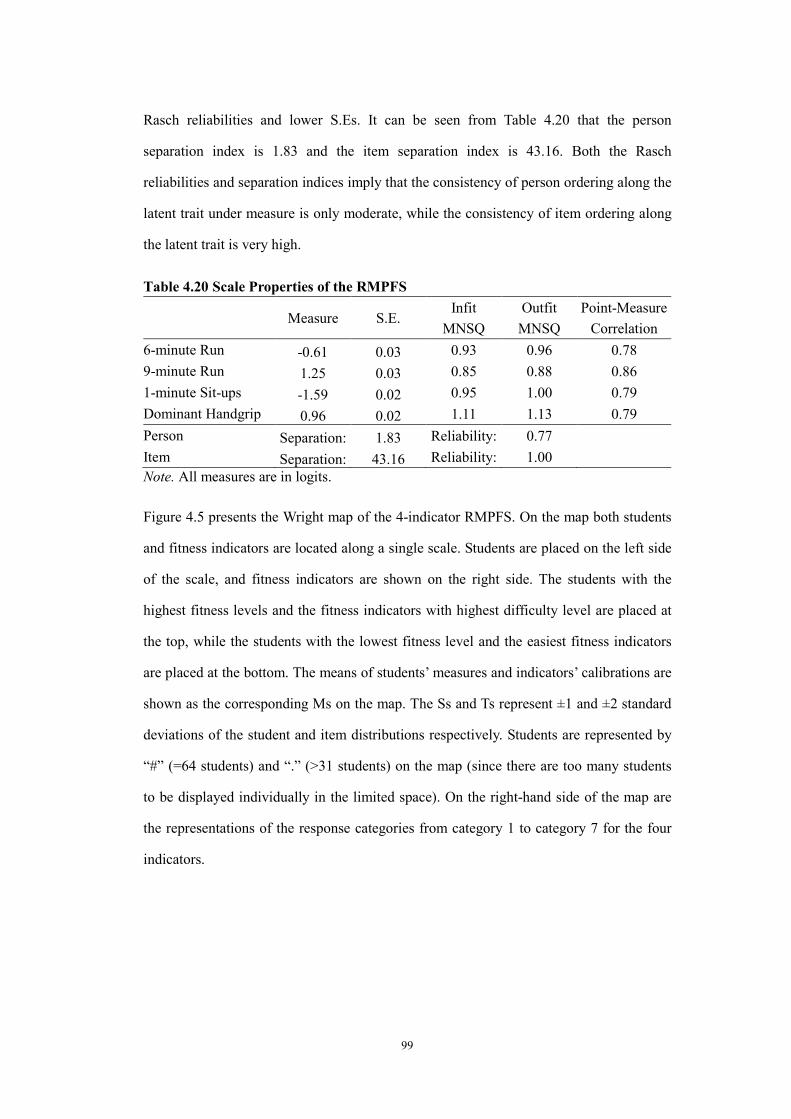
99
Rasch reliabilities and lower S.Es. It can be seen from Table 4.20 that the person
separation index is 1.83 and the item separation index is 43.16. Both the Rasch
reliabilities and separation indices imply that the consistency of person ordering along the
latent trait under measure is only moderate, while the consistency of item ordering along
the latent trait is very high.
Table 4.20 Scale Properties of the RMPFS
Measure S.E.
Infit
MNSQ
Outfit
MNSQ
Point-Measure
Correlation
6-minute Run -0.61 0.03 0.93 0.96 0.78
9-minute Run 1.25 0.03 0.85 0.88 0.86
1-minute Sit-ups -1.59 0.02 0.95 1.00 0.79
Dominant Handgrip 0.96 0.02 1.11 1.13 0.79
Person Separation: 1.83 Reliability: 0.77
Item Separation: 43.16 Reliability: 1.00
Note. All measures are in logits.
Figure 4.5 presents the Wright map of the 4-indicator RMPFS. On the map both students
and fitness indicators are located along a single scale. Students are placed on the left side
of the scale, and fitness indicators are shown on the right side. The students with the
highest fitness levels and the fitness indicators with highest difficulty level are placed at
the top, while the students with the lowest fitness level and the easiest fitness indicators
are placed at the bottom. The means of students’ measures and indicators’ calibrations are
shown as the corresponding Ms on the map. The Ss and Ts represent ±1 and ±2 standard
deviations of the student and item distributions respectively. Students are represented by
“#” (=64 students) and “.” (>31 students) on the map (since there are too many students
to be displayed individually in the limited space). On the right-hand side of the map are
the representations of the response categories from category 1 to category 7 for the four
indicators.
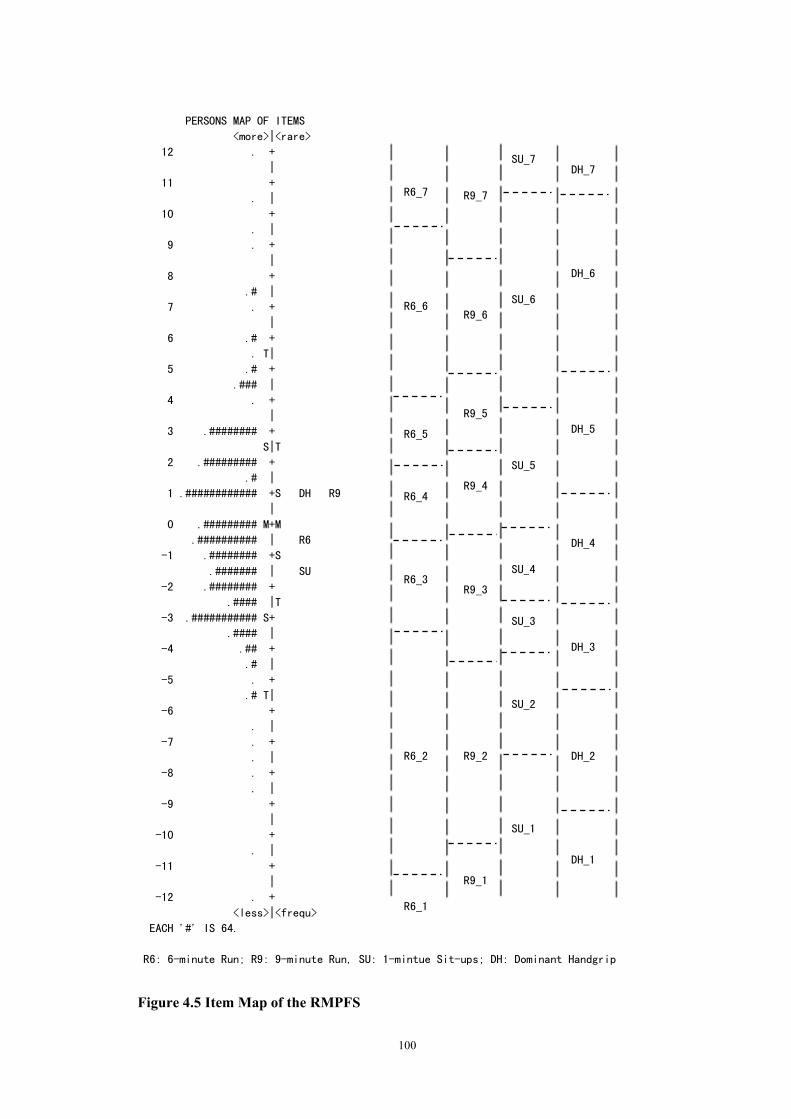
100
PERSONS MAP OF ITEMS
<more>|<rare>
12 . +
|
11 +
. |
10 +
. |
9 . +
|
8 +
.# |
7 . +
|
6 .# +
. T|
5 .# +
.### |
4 . +
|
3 .######## +
S|T
2 .######### +
.# |
1 .############ +S DH R9
|
0 .######### M+M
.########## | R6
-1 .######## +S
.####### | SU
-2 .######## +
.#### |T
-3 .########### S+
.#### |
-4 .## +
.# |
-5 . +
.# T|
-6 +
. |
-7 . +
. |
-8 . +
. |
-9 +
|
-10 +
. |
-11 +
|
-12 . +
<less>|<frequ>
EACH '#' IS 64.
R6: 6-minute Run; R9: 9-minute Run, SU: 1-mintue Sit-ups; DH: Dominant Handgrip
R6_2
R6_3
R6_1
R6_5
R6_6
R6_7
R6_4
R9_3
R9_4
R9_2
R9_6
R9_5
R9_7
R9_1
SU_2
SU_3
SU_1
SU_4
SU_5
SU_6
SU_7
DH_2
DH_3
DH_1
DH_4
DH_5
DH_6
DH_7
Figure 4.5 Item Map of the RMPFS

101
It can be seen that the difficulty levels of the RMPFS physical fitness indicators (M =
0.00, SD = 1.16) are appropriate for these students’ fitness levels (M = -0.21, SD = 2.78).
The range of indicators’ difficulty (-1.59 to 1.25 logits) is much smaller than the range of
students’ ability (-12.86 to 11.17 logits). However, the ranges of difficulty levels of
categories for each indicator, as presented on the right-hand side of the map, reveals that
the indicators overall provide good coverage of the fitness of the primary school students
in this sample.
The Item Characteristic Curves (ICC) and category probability curves provide further
support for the valid functioning of the scale. Figure 4.6 presents the empirical and
expected ICCs for the four indicators. In these graphs, the Y axes represent the students’
actual scores (blue) v. those expected by the model (red), and X axes - measure relative to
item difficulty - refers to the difference between the indicator difficulty and person ability.
It can be seen that the empirical ICCs match the theoretical ICCs reasonably well,
especially for students’ with median fitness levels located around the middle of the curves.
There are larger discrepancies between the empirical and theoretical ICCs for the most
able and the least able students located at the extremes of the curves. The reason is that if
person ability is close to indicator difficulty (students located at the middle of the curves,
where difficulty-ability is close to zero), the indicator provides more information about
the person and indicator interaction, thus reducing the error of person ability estimates
and giving more precise measurement. When person ability differs considerably from (i.e.,
is much higher or lower than) the indicator difficulty (students located at the extremes of
the curves), the indicator provides much less information about the person / indicator
interaction, and the measurement is then, less precise.
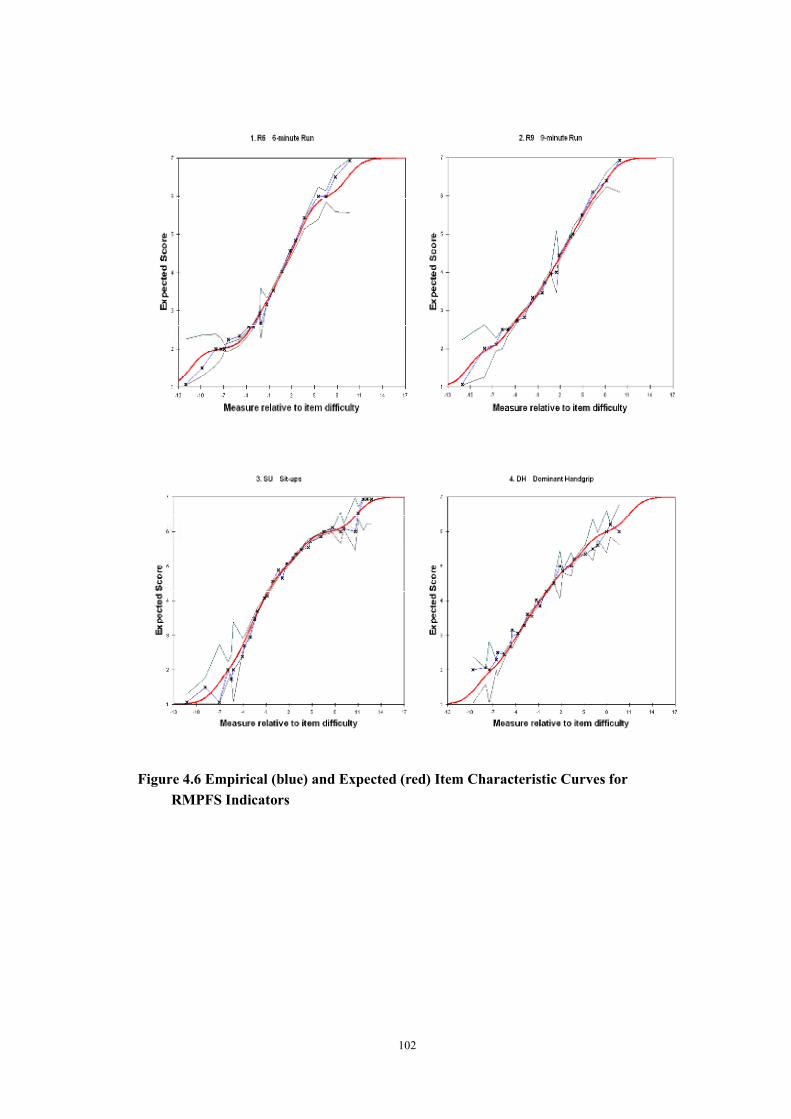
102
Figure 4.6 Empirical (blue) and Expected (red) Item Characteristic Curves for
RMPFS Indicators

103
The category probability curves for each of the four indicators presented in Figure 4.7
show that each performance category has a distinct peak in the graph for all four
indicators. That means each category for each indicator was the most probable
performance level for given groups of persons with any specific level of physical fitness.
There is no evidence of “threshold disordering” (Bond & Fox, 2007; Linacre, 2002) and
threshold calibrations advance monotonically with category, indicating that higher
performance categories correspond to higher measures of physical fitness.
Figure 4.7 Category Probability Curves for RMPFS Indicators

104
Summary
Through a theory-driven development procedure guided by Rasch model principles as
well as practical considerations, a physical fitness scale was developed and refined step
by step and, finally, a four-indicator RMPFS which integrates and reflects three key
components of health-related physical fitness: cardiorespiratory fitness, muscular
endurance, and muscular strength, was established. The important steps in the
development procedure for the Rasch measurement scale include the following ones:
1. BMI was excluded from the scale because BMI is not an optimal indicator for body
composition and it is a trait with inverted U-shape characteristics rather than a linear
one.
2. The raw scores for each indicator were transformed using logarithmic transformation
into 9 category levels with meaningful differences.
3. Sit-and-Reach was excluded from the scale because its low correlation with other
physical fitness indicators and its distinct feature apart from other indicators made it
inappropriate for inclusion in the scale.
4. Left Handgrip and Right Handgrip were excluded (as individual indicators) from the
scale because they violate one key Rasch requirement – local independence among
indicators. One single indicator – Dominant Handgrip – was used instead of Left
Handgrip and Right Handgrip to measure students’ muscular strength.
5. Standard and Modified Push-ups were excluded from the scale. It appears that
possible data collecting and reporting errors contributed to misfit of these two
indicators to the Rasch model.
6. The functioning of the response category structure was examined and a more
appropriate response category structure (7-category) was used instead of the earlier
9-category structure.

105
7. The impact of extremely underfitting persons to the 4-indicator scale was
investigated and a scale with better properties was developed after excluding those
extremely underfitting persons from the scale construction process.
8. Sex DIF in three of the four indicators was statistically significant, but has no
practical substantive meaning. Furthermore, the comparison between 4-indicator
scale and 7-indicator (including sex-split indicators) showed little difference, so the
simpler efficient 4-indicator scale was regarded as the final version of the RMPFS
for this investigation.
Finally, four physical fitness indicators including 6-mintue Run, 9-minute Run, 1-mintue
Sit-ups and Dominant Handgrip were successfully calibrated to form the RMPFS which
integrates three key components of physical fitness including cardiorespiratory fitness,
muscular endurance, and muscular strength into an overall measure of health-related
physical fitness suitable for use with primary school children in Hong Kong. The RMPFS
and its scale indicators show fit to the Rasch model sufficient for the intended purposes.
In traditional approaches to physical fitness assessment, students’ performances on each
fitness indicator are recorded and interpreted separately. For example, the 6 or 9-minute
Run tests students’ cardiorespiratory fitness and is interpreted independently from
muscular strength or endurance. Similarly, the 1-minute Sit-ups test demonstrates
students’ muscular endurance capacity, but does not reflect cardiorespiratory fitness levels.
That approach treats components of physical fitness as independent unrelated aspects.
Each aspect must be tested and interpreted separately, and students’ ability in one aspect
does not provide information for predicting their performances on other aspects. In
contrast, a RMPFS performance score provides an overall physical fitness measure based
on the student’s performance on the four fitness indicators. This overall measure,
obtained through Rasch calibration, is contributed by the three components, but it is not
the simple or weighted “average” of the performance on the components. With the
RMPFS, students’ overall fitness measures can be located along the overall fitness

106
continuum and interpreted in a stable interpretive framework.
107
CHAPTER FIVE
RESULTS I
MEASUREMENT OF STUDENTS’ OVERALL PHYSICAL FITNESS
Introduction
Following the development of the RMPFS, this chapter reports the application of the
developed physical fitness scale to measure students’ overall physical fitness. Further, it
reveals age and sex differences in students’ overall physical fitness development and the
features of overall physical fitness development for different cohorts in the sample for the
study. This chapter further depicts the unique development tracks of some individual
students which were selected from the sample for the study to demonstrate the variety of
students’ physical fitness development.
During the development of the RMPFS, a total of 8,469 cases which had at least one
score for one of the four indicators (6-minute Run, 9-minute Run, 1-minute Sit-ups, and
Dominant Handgrip) were input into the Rasch analyses and, finally, 1,185 cases were
excluded because they are extremely underfitting to the Rasch model’s measurement
requirements. In other words, the Rasch analyses identified 1,185 underfitting cases from
the data set with the RMPFS if the four indicators’ difficulty values were estimated. In
contrast, if the calibrated item locations were anchored to the scale to measure all students,
the Rasch analyses identified more underfitting cases (N=1,814). In order to provide
better measurement of all students in this sample without generating too many
underfitting cases, the scale with unanchored item locations (Scale 6 described in Chapter
Four) is used as an instrument to measure the overall physical fitness level of students in
this sample and track their development over time.
Many studies concerning students’ change or development over time compare the
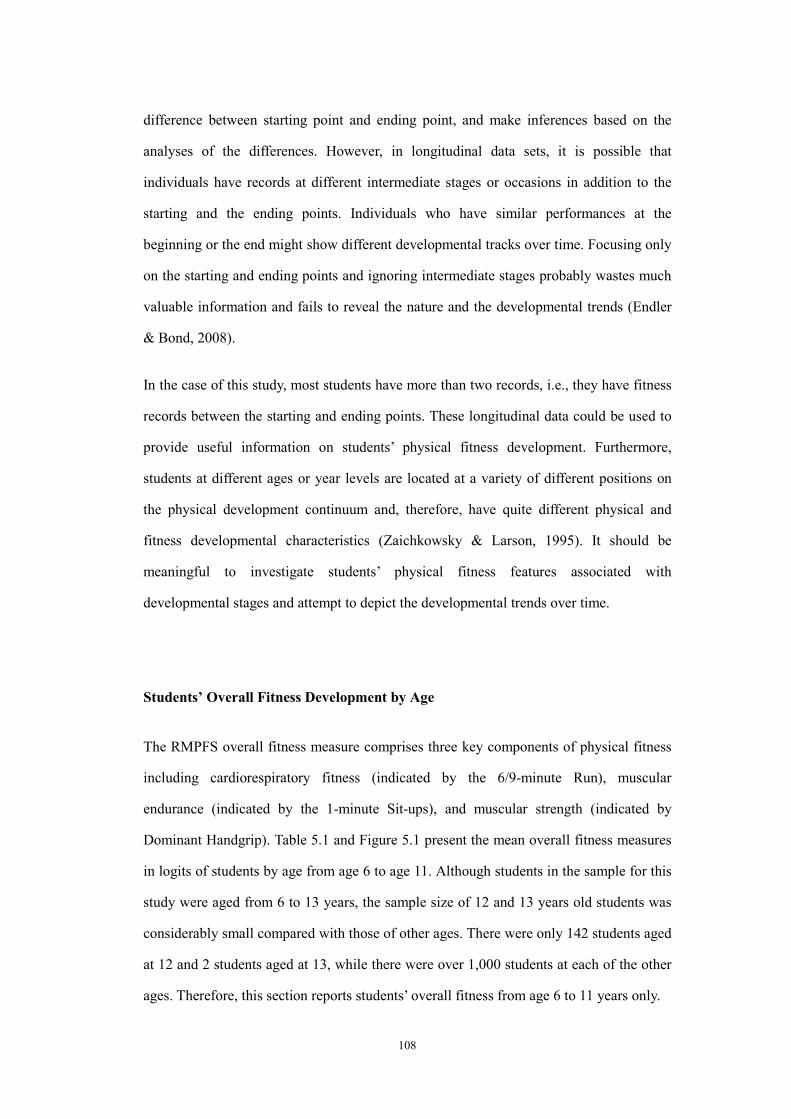
108
difference between starting point and ending point, and make inferences based on the
analyses of the differences. However, in longitudinal data sets, it is possible that
individuals have records at different intermediate stages or occasions in addition to the
starting and the ending points. Individuals who have similar performances at the
beginning or the end might show different developmental tracks over time. Focusing only
on the starting and ending points and ignoring intermediate stages probably wastes much
valuable information and fails to reveal the nature and the developmental trends (Endler
& Bond, 2008).
In the case of this study, most students have more than two records, i.e., they have fitness
records between the starting and ending points. These longitudinal data could be used to
provide useful information on students’ physical fitness development. Furthermore,
students at different ages or year levels are located at a variety of different positions on
the physical development continuum and, therefore, have quite different physical and
fitness developmental characteristics (Zaichkowsky & Larson, 1995). It should be
meaningful to investigate students’ physical fitness features associated with
developmental stages and attempt to depict the developmental trends over time.
Students’ Overall Fitness Development by Age
The RMPFS overall fitness measure comprises three key components of physical fitness
including cardiorespiratory fitness (indicated by the 6/9-minute Run), muscular
endurance (indicated by the 1-minute Sit-ups), and muscular strength (indicated by
Dominant Handgrip). Table 5.1 and Figure 5.1 present the mean overall fitness measures
in logits of students by age from age 6 to age 11. Although students in the sample for this
study were aged from 6 to 13 years, the sample size of 12 and 13 years old students was
considerably small compared with those of other ages. There were only 142 students aged
at 12 and 2 students aged at 13, while there were over 1,000 students at each of the other
ages. Therefore, this section reports students’ overall fitness from age 6 to 11 years only.
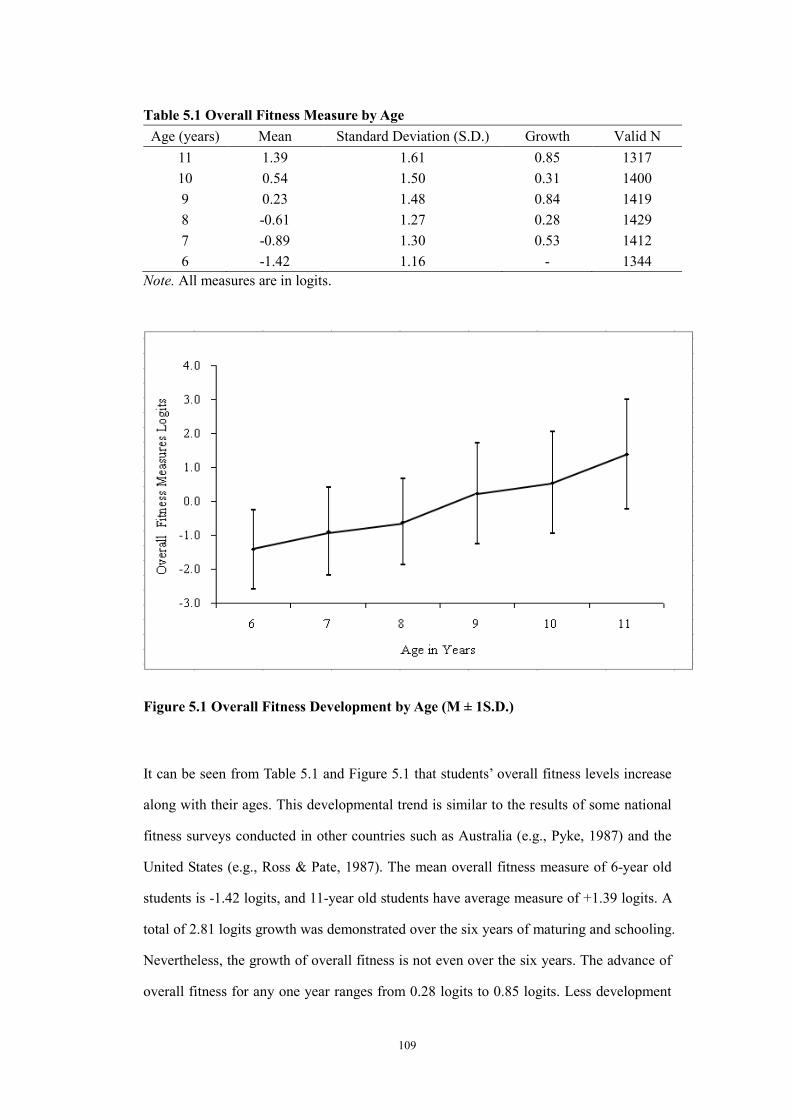
109
Table 5.1 Overall Fitness Measure by Age
Age (years) Mean Standard Deviation (S.D.) Growth Valid N
11 1.39 1.61 0.85 1317
10 0.54 1.50 0.31 1400
9 0.23 1.48 0.84 1419
8 -0.61 1.27 0.28 1429
7 -0.89 1.30 0.53 1412
6 -1.42 1.16 - 1344
Note. All measures are in logits.
Figure 5.1 Overall Fitness Development by Age (M ± 1S.D.)
It can be seen from Table 5.1 and Figure 5.1 that students’ overall fitness levels increase
along with their ages. This developmental trend is similar to the results of some national
fitness surveys conducted in other countries such as Australia (e.g., Pyke, 1987) and the
United States (e.g., Ross & Pate, 1987). The mean overall fitness measure of 6-year old
students is -1.42 logits, and 11-year old students have average measure of +1.39 logits. A
total of 2.81 logits growth was demonstrated over the six years of maturing and schooling.
Nevertheless, the growth of overall fitness is not even over the six years. The advance of
overall fitness for any one year ranges from 0.28 logits to 0.85 logits. Less development
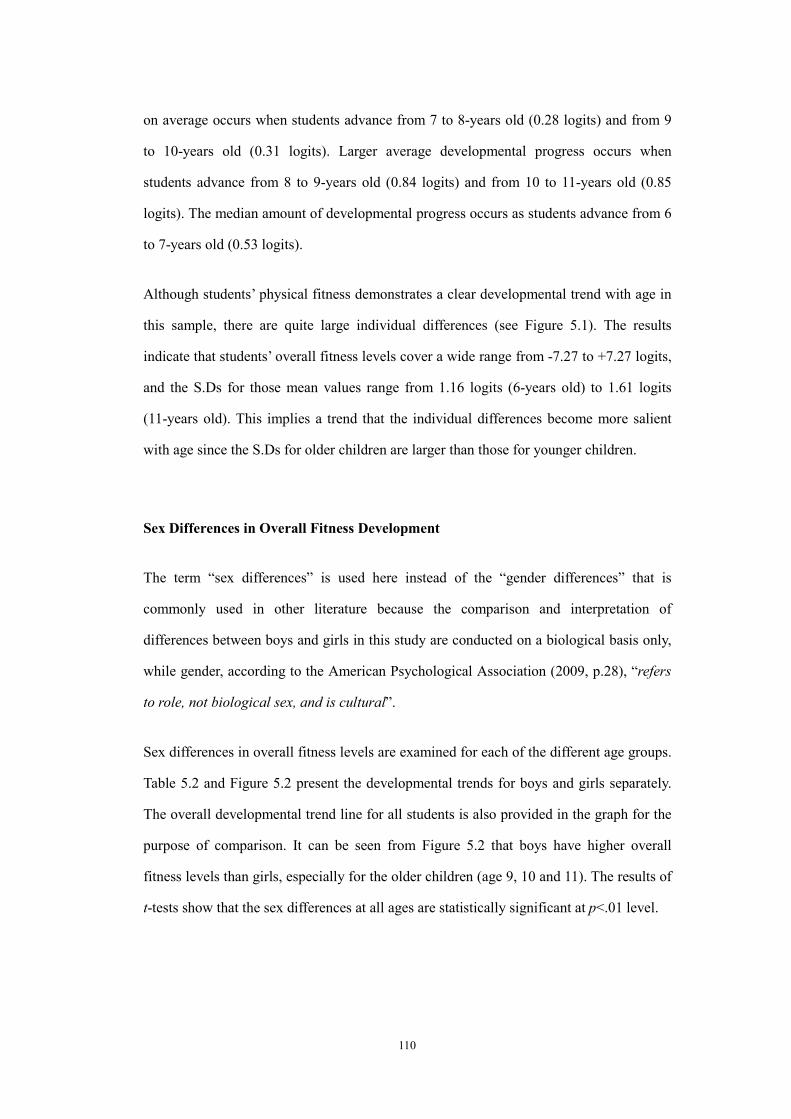
110
on average occurs when students advance from 7 to 8-years old (0.28 logits) and from 9
to 10-years old (0.31 logits). Larger average developmental progress occurs when
students advance from 8 to 9-years old (0.84 logits) and from 10 to 11-years old (0.85
logits). The median amount of developmental progress occurs as students advance from 6
to 7-years old (0.53 logits).
Although students’ physical fitness demonstrates a clear developmental trend with age in
this sample, there are quite large individual differences (see Figure 5.1). The results
indicate that students’ overall fitness levels cover a wide range from -7.27 to +7.27 logits,
and the S.Ds for those mean values range from 1.16 logits (6-years old) to 1.61 logits
(11-years old). This implies a trend that the individual differences become more salient
with age since the S.Ds for older children are larger than those for younger children.
Sex Differences in Overall Fitness Development
The term “sex differences” is used here instead of the “gender differences” that is
commonly used in other literature because the comparison and interpretation of
differences between boys and girls in this study are conducted on a biological basis only,
while gender, according to the American Psychological Association (2009, p.28), “refers
to role, not biological sex, and is cultural”.
Sex differences in overall fitness levels are examined for each of the different age groups.
Table 5.2 and Figure 5.2 present the developmental trends for boys and girls separately.
The overall developmental trend line for all students is also provided in the graph for the
purpose of comparison. It can be seen from Figure 5.2 that boys have higher overall
fitness levels than girls, especially for the older children (age 9, 10 and 11). The results of
t-tests show that the sex differences at all ages are statistically significant at p<.01 level.

111
Table 5.2 Sex Differences in Overall Fitness
Age Male Female
Difference (boys - girls) Mean S.D. Mean S.D.
11 1.77 1.61 0.93 1.48 0.84**
10 0.81 1.58 0.23 1.34 0.58**
9 0.43 1.59 0.01 1.31 0.42**
8 -0.45 1.32 -0.81 1.18 0.36**
7 -0.75 1.32 -1.07 1.25 0.32**
6 -1.30 1.17 -1.58 1.12 0.28**
Note. All measures are in logits. **
p <.01.
Figure 5.2 Overall Fitness Development by Age and Sex
Figure 5.3 shows the developmental trend for boys and girls with S.Ds. It can be seen that
there is a very large overlap of the overall fitness estimations for boys and girls of the
same age. For example, the mean estimation of overall fitness for 8-years old boys is
-0.45 logits, while the mean estimation of overall fitness for 8-years old girls is -0.80
logits. Although the boys’ mean value is 0.3 S.D. higher than the mean estimation for
girls, approximately 38% of 8-years old girls have higher overall fitness measures than
the average of boys of the same age.
112
Figure 5.3 Overall Fitness Development by Age and Sex (M ± 1S.D.)
In general, the sex difference of overall fitness is statistically significant (p <.01) in favor
of boys for all age groups. However, those differences are blurred when S.Ds are taken
into account, just as has been shown in Figure 5.3. It is worth recalling that statistically
significant difference is not necessarily the same as meaningful difference. A minute
difference might be detected as statistically significant, especially with large sample, even
though that difference has very little practical meaning. It is appropriate to regard a
difference greater than 0.5 logits to have practical, substantive meaning (Bond & Fox,
2007). In terms of overall physical fitness, the sex differences at age 6 to 9 are less than
0.5 logits but the differences increase with students’ age. For students aged 10 and 11, the
sex differences are more than 0.5 logits. Therefore, it is prudent to conclude that there is
no empirical fitness evidence for dividing students into sex-based groups for physical
education for junior primary school-aged students at age of 6 to 9, but sex of the student
could be a consideration influencing the grouping of senior primary school-aged students
at age of 10 or 11, for physical fitness based activities.

113
Students’ Overall Fitness Development by Academic Year and Level
Figure 5.4 presents students’ overall fitness development by academic year. Each line
with six markers in this figure represents cross-sectional students’ performances of six
grade groupings (P1 to P6) in each semester of any one academic year. The performance
line is labeled with the semester and academic year. For example, the line “2003 1”
presents students’ overall fitness levels of six levels in the 1st semester of the academic
year 2003-04. Note that students’ overall fitness measures in the academic year 2002-03
were not included here because, in the academic year 2002-03, there were records on only
four physical fitness indicators including BMI, Sit-and-Reach, Standard Push-ups, and
Modified Push-ups, each of which were excluded from the RMPFS.
It can be seen from the figure that, with just four exceptions, students’ overall fitness
levels increase as the year level advances. The four exceptions are Primary 3 and Primary
5 for the 2nd
semester of academic year 2003-04, Primary 5 for the 2nd
semester of
academic year 2004-05, and Primary 2 for the 2nd
semester of academic year 2006-07.
These four groups of students have lower overall fitness levels than do their counterparts
in the lower year level.
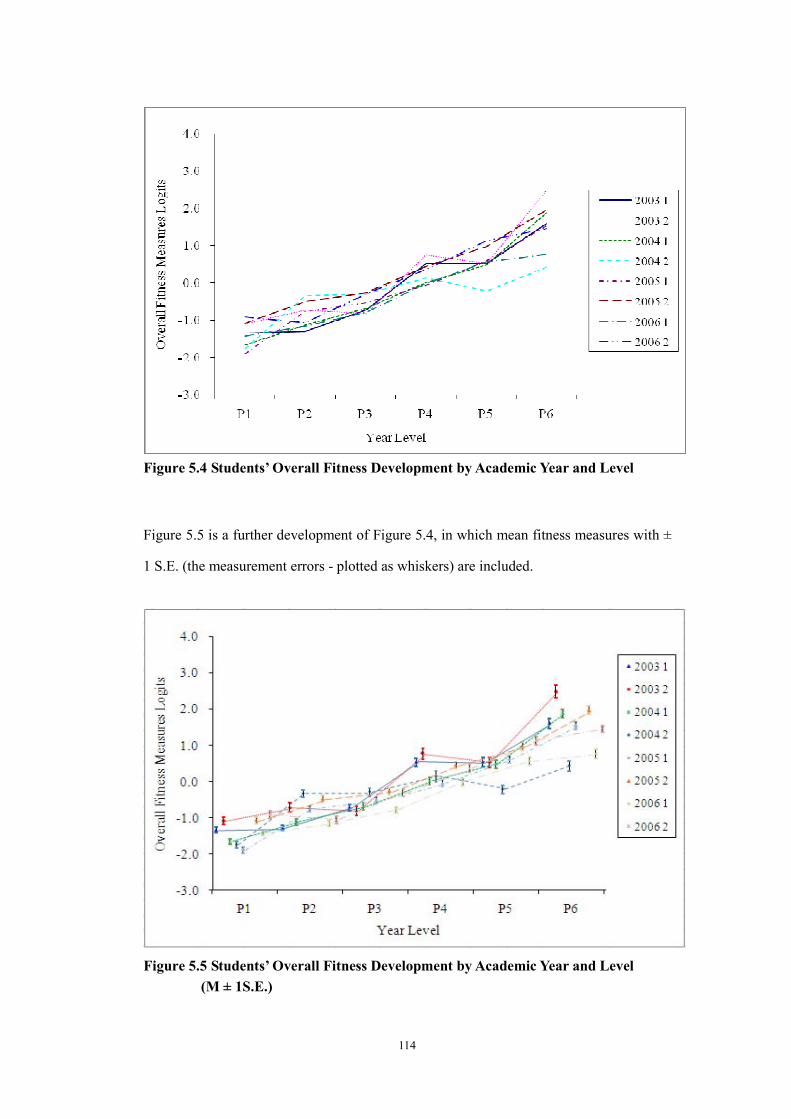
114
Figure 5.4 Students’ Overall Fitness Development by Academic Year and Level
Figure 5.5 is a further development of Figure 5.4, in which mean fitness measures with ±
1 S.E. (the measurement errors - plotted as whiskers) are included.
Figure 5.5 Students’ Overall Fitness Development by Academic Year and Level
(M ± 1S.E.)

115
Table 5.3 presents the differences and the conjoint measurement errors (sum of
measurement errors of the consecutive year levels) of the four exceptions mentioned
above.
Table 5.3 Fitness Changes and Conjoint Measurement Error for Exceptional Groups
Exception Cohort Decrease in Fitness
Measures
Conjoint Measurement
Error
1 Primary 3, 2
nd Semester,
2003-04 -0.10 0.25 (0.13 + 0.12)
2 Primary 5, 2
nd Semester,
2003-04 -0.23 0.27 (0.14 + 0.13)
3 Primary 5, 2
nd Semester,
2004-05 -0.36 0.25 (0.14 + 0.11)
4 Primary 2, 2
nd Semester,
2006-07 -0.15 0.18 (0.09 + 0.09)
Note. All measures are in logits.
The information provided in Figure 5.5 and Table 5.3 shows that the differences for three
exceptions (exceptions 1, 2, and 4) have no substantial or practical meaning when
conjoint measurement error is taken into account. In other words, the negative differences
do not reflect “real” differences in fitness as they do not extend beyond measurement
error. Only the difference between Primary 4 and Primary 5 in the 2nd
semester of
academic year 2004-05 (exception 3) is larger than the conjoint measurement error. That
indicates in academic year 2004-05, the overall fitness level of Primary 5 students was
measurably lower than the overall fitness level of Primary 4 students and the difference is
related directly to the measured trait (i.e., overall fitness) rather than the measurement
error.
Students’ Overall Fitness Development by Cohort
Figure 5.6 presents students’ overall fitness development by cohort along the academic
year. Each line in the graph represents a single cohort which is labeled with the academic
year and year level of students’ first record. For example, if the cohort’s first record was
at Primary 1 in academic year 2004-05, then the cohort is labeled with 2004P1. It is

116
signified by a blue dashed line and continues until Semester 2, 2006-07. Similarly, the
cohort is labeled with 2003P2 if the cohort’s first record was at Primary 2 in academic
year 2003-04. It is signified by a green dashed line and continues until Semester 2,
2006-07.
Figure 5.6 Students’ Overall Fitness Development by Cohort and Academic Year
Figure 5.7 includes the S.E. for each estimate so that measurable differences for the mean
levels might be more easily and meaningfully interpreted.

117
Figure 5.7 Students’ Overall Fitness Development by Cohort and Academic Year
(M ± 1S.E.)
It can be expected that, in general, the overall fitness level of each cohort increases with
the academic year since children’s age advances as well. However, there are two dramatic
decreases for Primary 5 and Primary 6 in the 2nd
semester of academic year 2004-05. This
observation conforms to the findings mentioned in the earlier section, that Primary 5 and
Primary 6 students in the 2nd
semester of academic year 2004-05 demonstrated
measurably lower overall fitness levels than did their counterparts in other academic
years.
In order to investigate the underlying reasons for this unusual phenomenon, the
performances of Primary 5 and Primary 6 students in the 2nd
semester of academic year
2004-05 (focus group) and their counterparts in other cohorts (reference group) were
compared. Since the focus group has scores for 9-minute Run and 1-minute Sit-ups only,
the comparisons were conducted for these two fitness indicators. Table 5.4 presents the
score distribution of these two fitness indicators for focus group and reference group
respectively.
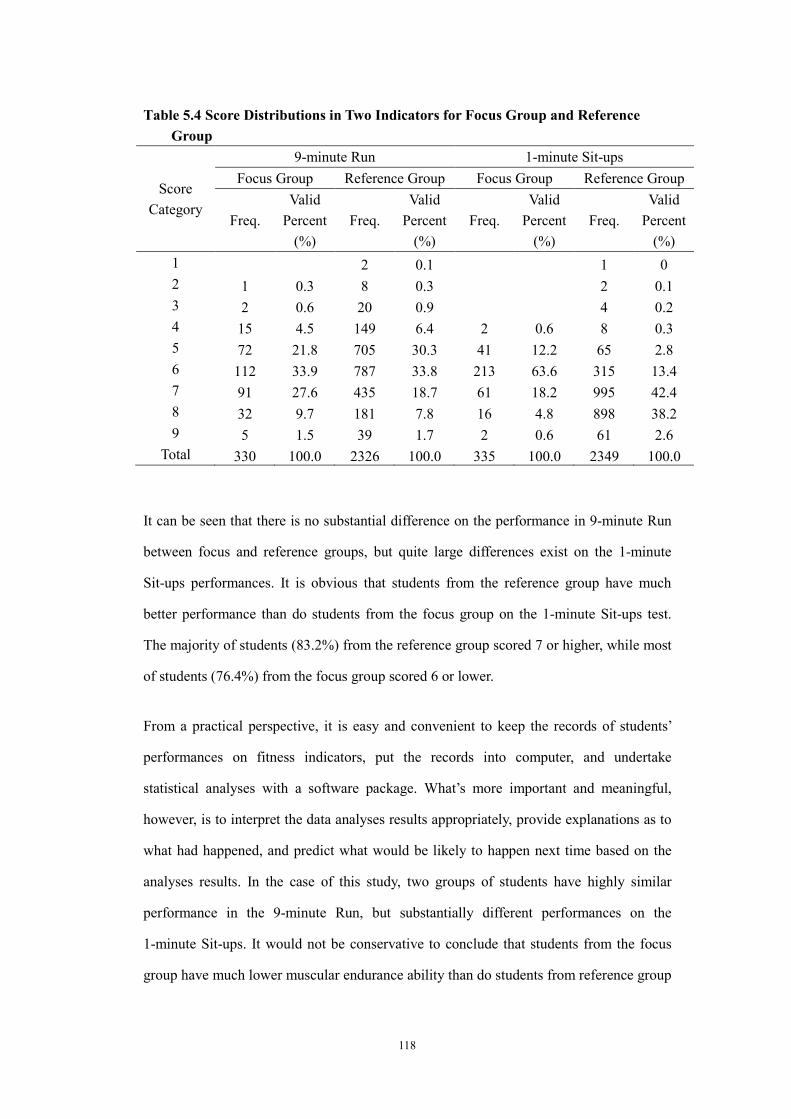
118
Table 5.4 Score Distributions in Two Indicators for Focus Group and Reference
Group
Score
Category
9-minute Run 1-minute Sit-ups
Focus Group Reference Group Focus Group Reference Group
Freq.
Valid
Percent
(%)
Freq.
Valid
Percent
(%)
Freq.
Valid
Percent
(%)
Freq.
Valid
Percent
(%)
1 2 0.1 1 0
2 1 0.3 8 0.3 2 0.1
3 2 0.6 20 0.9 4 0.2
4 15 4.5 149 6.4 2 0.6 8 0.3
5 72 21.8 705 30.3 41 12.2 65 2.8
6 112 33.9 787 33.8 213 63.6 315 13.4
7 91 27.6 435 18.7 61 18.2 995 42.4
8 32 9.7 181 7.8 16 4.8 898 38.2
9 5 1.5 39 1.7 2 0.6 61 2.6
Total 330 100.0 2326 100.0 335 100.0 2349 100.0
It can be seen that there is no substantial difference on the performance in 9-minute Run
between focus and reference groups, but quite large differences exist on the 1-minute
Sit-ups performances. It is obvious that students from the reference group have much
better performance than do students from the focus group on the 1-minute Sit-ups test.
The majority of students (83.2%) from the reference group scored 7 or higher, while most
of students (76.4%) from the focus group scored 6 or lower.
From a practical perspective, it is easy and convenient to keep the records of students’
performances on fitness indicators, put the records into computer, and undertake
statistical analyses with a software package. What’s more important and meaningful,
however, is to interpret the data analyses results appropriately, provide explanations as to
what had happened, and predict what would be likely to happen next time based on the
analyses results. In the case of this study, two groups of students have highly similar
performance in the 9-minute Run, but substantially different performances on the
1-minute Sit-ups. It would not be conservative to conclude that students from the focus
group have much lower muscular endurance ability than do students from reference group

119
just based on the result that they completed many fewer sit-ups. This is because the
difference might not come from variation of students’ abilities alone, but from other
factors which might influence the data collection, e.g., rater leniency/severity. Students’
performances for 1-minute Sit-ups are recorded as the number of correct sit-ups
completed in one minute. However, whether any one sit-up repetition is “correct” or not
is determined by the rater’s subjective judgment. A severe rater might underestimate a
student’s ability by counting fewer repetitions as “correct”, while a lenient rater might
overestimate a student’s ability by treating partially completed or non-standard repetitions
as “correct”. In the case of this study, it is quite likely that students from the focus group
had severe raters at that occasion, while their counterparts in reference group were
“lucky” enough to have more lenient raters. On the other hand, this kind of rater
difference did not occur in the 9-minute Run because the performance in this test is
objectively recorded as the distance a student runs or walks in 9 minutes. The whole
scoring procedure does not involve raters’ subjective judgments. The rater merely keeps
record of the distance covered in the elapsed time but does not evaluate the quality of the
performance, i.e., whether a student completes the task by running, walking, or even
skipping and jumping.
Exemplar Cases
In addition to investigations of students’ overall fitness development at the group level, it
would be informative to have a closer look at some exemplar cases in order to illustrate
the considerable possible variation in individual development patterns of overall fitness
over time. Figure 5.8 shows the developmental profiles of 5 exemplar students selected
from the cohort 2003P1 where each student has 8 records (overall RMPFS fitness
measures) across four consecutive academic years. Among the five exemplar students,
there are three boys (Student A, B, and C) and two girls (Student D and E). The variation
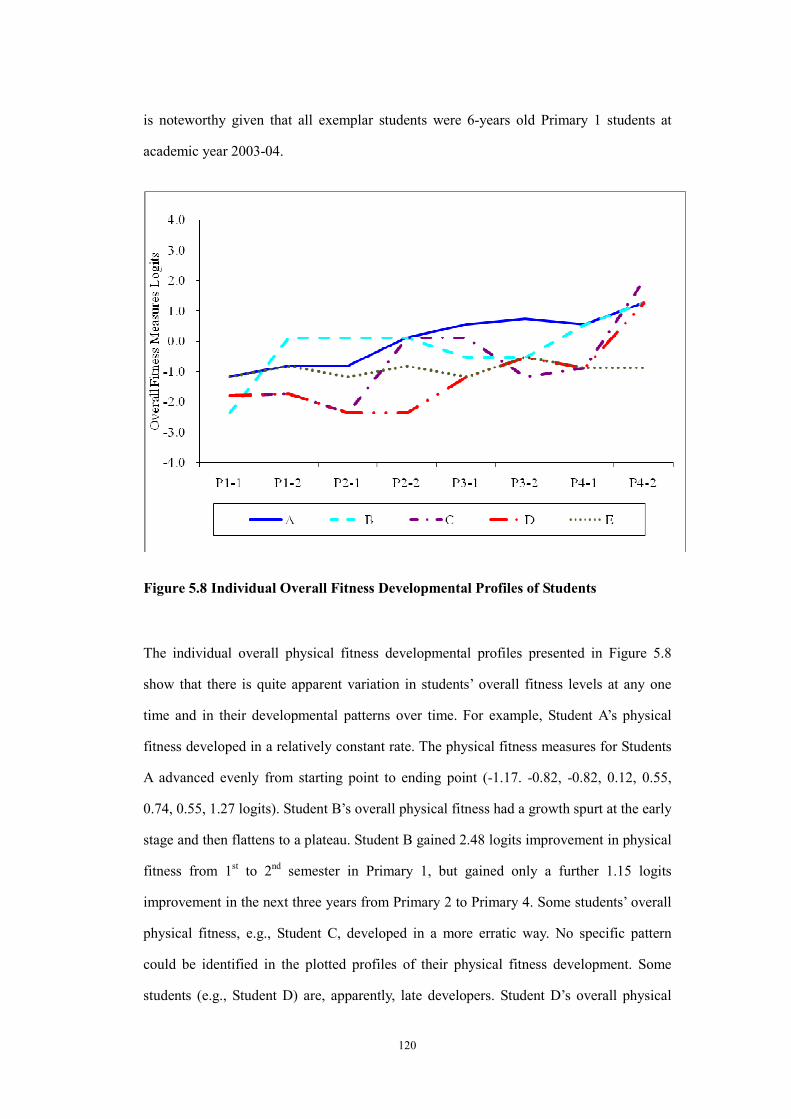
120
is noteworthy given that all exemplar students were 6-years old Primary 1 students at
academic year 2003-04.
Figure 5.8 Individual Overall Fitness Developmental Profiles of Students
The individual overall physical fitness developmental profiles presented in Figure 5.8
show that there is quite apparent variation in students’ overall fitness levels at any one
time and in their developmental patterns over time. For example, Student A’s physical
fitness developed in a relatively constant rate. The physical fitness measures for Students
A advanced evenly from starting point to ending point (-1.17. -0.82, -0.82, 0.12, 0.55,
0.74, 0.55, 1.27 logits). Student B’s overall physical fitness had a growth spurt at the early
stage and then flattens to a plateau. Student B gained 2.48 logits improvement in physical
fitness from 1st to 2
nd semester in Primary 1, but gained only a further 1.15 logits
improvement in the next three years from Primary 2 to Primary 4. Some students’ overall
physical fitness, e.g., Student C, developed in a more erratic way. No specific pattern
could be identified in the plotted profiles of their physical fitness development. Some
students (e.g., Student D) are, apparently, late developers. Student D’s overall physical
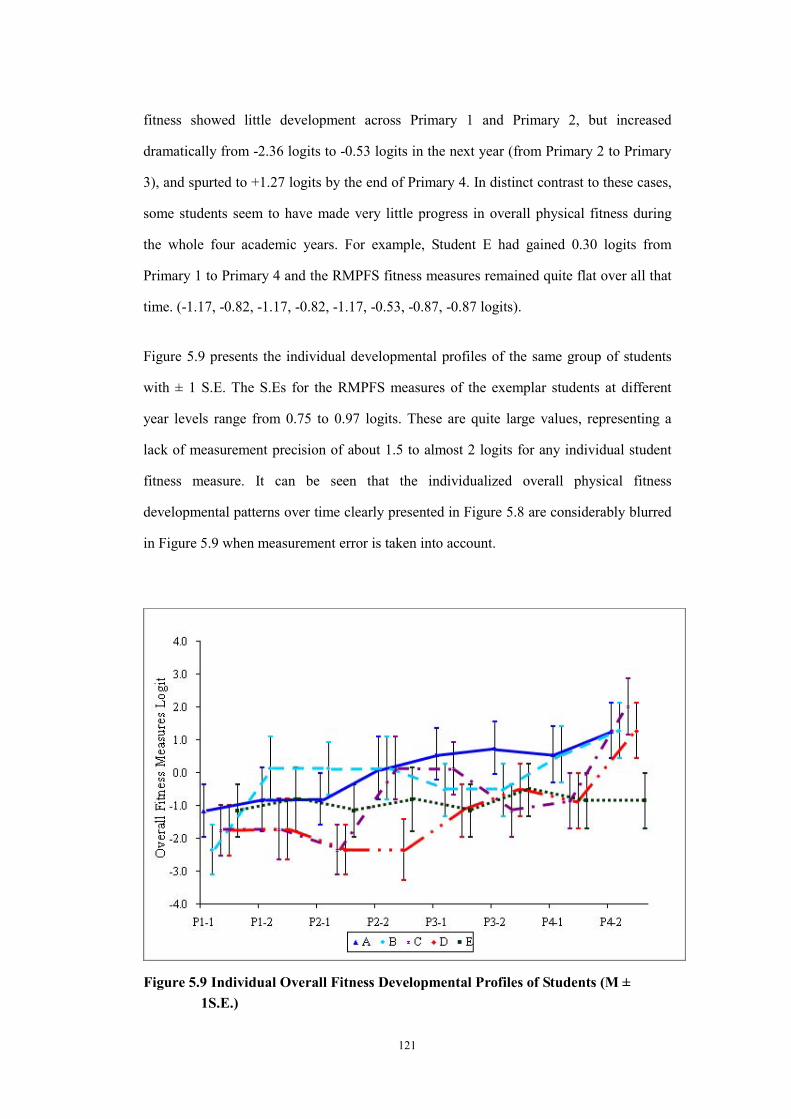
121
fitness showed little development across Primary 1 and Primary 2, but increased
dramatically from -2.36 logits to -0.53 logits in the next year (from Primary 2 to Primary
3), and spurted to +1.27 logits by the end of Primary 4. In distinct contrast to these cases,
some students seem to have made very little progress in overall physical fitness during
the whole four academic years. For example, Student E had gained 0.30 logits from
Primary 1 to Primary 4 and the RMPFS fitness measures remained quite flat over all that
time. (-1.17, -0.82, -1.17, -0.82, -1.17, -0.53, -0.87, -0.87 logits).
Figure 5.9 presents the individual developmental profiles of the same group of students
with ± 1 S.E. The S.Es for the RMPFS measures of the exemplar students at different
year levels range from 0.75 to 0.97 logits. These are quite large values, representing a
lack of measurement precision of about 1.5 to almost 2 logits for any individual student
fitness measure. It can be seen that the individualized overall physical fitness
developmental patterns over time clearly presented in Figure 5.8 are considerably blurred
in Figure 5.9 when measurement error is taken into account.
Figure 5.9 Individual Overall Fitness Developmental Profiles of Students (M ±
1S.E.)
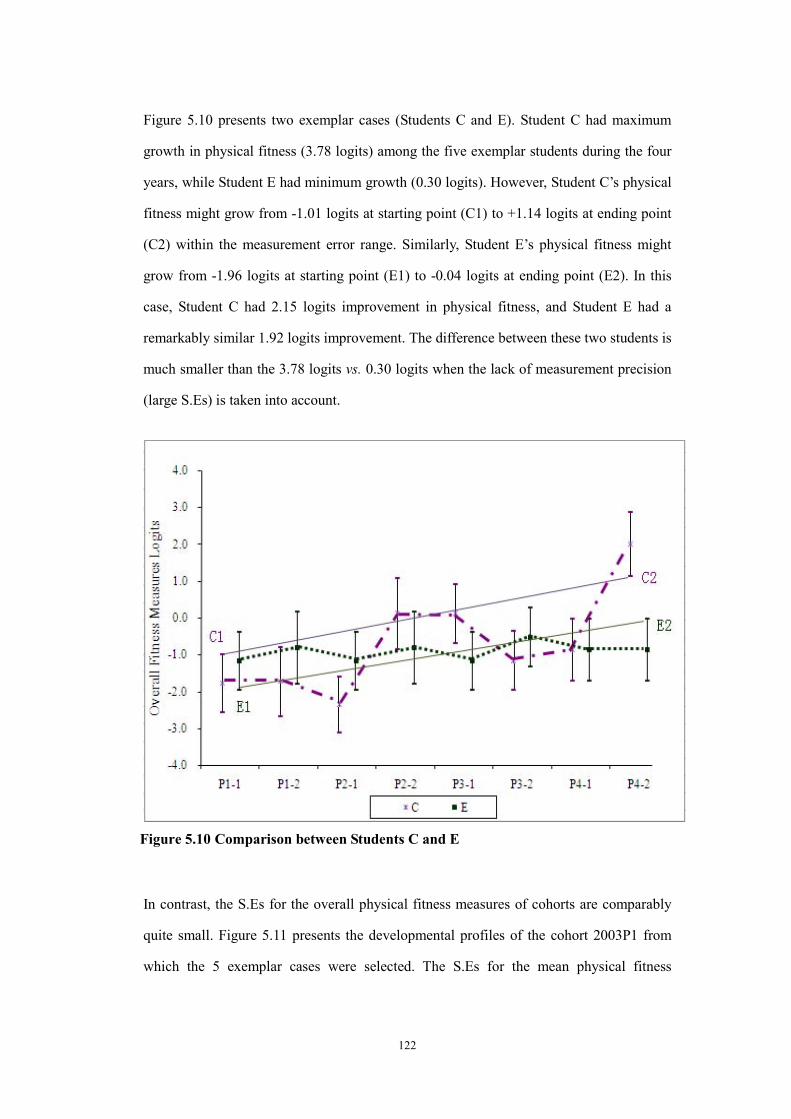
122
Figure 5.10 presents two exemplar cases (Students C and E). Student C had maximum
growth in physical fitness (3.78 logits) among the five exemplar students during the four
years, while Student E had minimum growth (0.30 logits). However, Student C’s physical
fitness might grow from -1.01 logits at starting point (C1) to +1.14 logits at ending point
(C2) within the measurement error range. Similarly, Student E’s physical fitness might
grow from -1.96 logits at starting point (E1) to -0.04 logits at ending point (E2). In this
case, Student C had 2.15 logits improvement in physical fitness, and Student E had a
remarkably similar 1.92 logits improvement. The difference between these two students is
much smaller than the 3.78 logits vs. 0.30 logits when the lack of measurement precision
(large S.Es) is taken into account.
Figure 5.10 Comparison between Students C and E
In contrast, the S.Es for the overall physical fitness measures of cohorts are comparably
quite small. Figure 5.11 presents the developmental profiles of the cohort 2003P1 from
which the 5 exemplar cases were selected. The S.Es for the mean physical fitness

123
measures of different year levels in this cohort range from 0.04 to 0.06 logits. In other
words, the estimates for the mean fitness of cohorts are quite precise.
Figure 5.11 Overall Fitness Developmental Profiles of the Cohort 2003P1 (M ± 1S.E.)
In summary, it would not be cautious to make inferences about students’ overall physical
fitness estimations at the individual level because the measurement error is too large to
allow almost any meaningful distinctions to be made between the fitness levels of
individuals; not between any two students nor between any two time points for a
particular student. The overall physical fitness measures and changes at the group level
are more precise and, therefore, informative to depict students’ physical fitness
development.
Summary
This chapter used the RMPFS to measure students’ overall physical fitness and track the
physical fitness developmental trends in terms of Rasch-scaled measures. As described in
124
this chapter, students’ overall fitness levels increase monotonically from 6-years old to
11-years old, although the rate of development is not even across the six years. The
results also showed quite large individual differences in students’ physical fitness
development.
In general, boys have higher overall fitness levels than girls of the same age and the
differences are statistically significant. However, the sex differences for students aged 6
to 9 years are less than 0.5 logits and have no practical importance. There is a large
overlap of the overall fitness estimations for boys and girls of the same age when taking
S.Ds into account. Therefore, it would not be appropriate to divide students aged 6 to 9
years into sex-based groups for physical education lessons. .
Students’ overall fitness levels increase with academic year and year level since children’s
age advances as well except that, in the 2nd
semester of academic year 2004-05, Primary 5
and Primary 6 students demonstrated measurably lower overall fitness levels than did
their counterparts in other academic years and even their counterparts in lower year levels
in the same academic year. Investigation of the difference between this group of students
and other Primary 5 and Primary 6 students revealed that the significant difference of
students’ overall fitness measures is not attributable to the objectively scored 9-minute
Run, but is related to the 1-minute Sit-ups indicator on which students’ performance
might be related to factors other than students’ physical fitness, such as rater
leniency/severity.
In addition to investigations of students’ overall physical fitness and developmental trends
at the group level, the individual overall fitness and developmental trends over time were
also examined through exemplar cases. The results showed considerable apparent
variation in students’ overall fitness levels at any one time and their developmental
patterns over time. The S.Es for the overall physical fitness measures of the exemplar
students are quite large, indicating a lack of measurement precision. In contrast, the S.Es

125
for the overall physical fitness measures of cohorts are comparably small, suggesting that
the estimates for the mean fitness of cohorts are quite precise.
126
CHAPTER SIX
RESULTS II
RELATIONSHIPS BETWEEN RMPFS MEASURE AND ANTHROPOMETRIC
INDICATORS
The relationships between physical fitness and other aspects of human behavior have
attracted considerable research interest and have been investigated in medical and health
studies (e.g., Erikssen, Liestøl, Bjørnholt, Thaulow, Sandvik, & Erikssen, 1998;
Katzmarzyk, Malina, & Bouchard, 1999; Kullo et al., 2002; Kyröläinen, Häkkinen,
Kautiainen, Santtila, Pihlainen, & Häkkinen, 2008; Rankinen, Church, Rice, Bouchard, &
Blair, 2007; Thorsen et al., 2006; Twisk, Kemper, & Van Mechelen, 2000; Williams, 2001)
as well as in physical education and physical activity studies (e.g., Brunet, Chaput, &
Tremblay, 2007; Gutin et al., 2005; Kamtsios & Digelidis, 2007; Rowlands, Eston, &
Ingledew, 1999; Stratton, Canoy, Boddy, Taylor, Hackett, & Buchan, 2007). Those studies
have contributed to a better understanding of associations between physical fitness and a
variety of other aspects including BMI, body fat, nutritional habits, physical activity, and
health problems such as coronary heart disease and cancer for both youths and adults. It is
worth noting that physical fitness investigated in those studies is not a composite
conception but indicators are treated as separate and independent components or even, in
most of the medical and health studies, are seen as identical to cardiovascular fitness or
maximal aerobic capacity and have nothing to do with other components.
However, the present study proposed a new conceptualization of overall physical fitness
which can be measured through Rasch calibration of students’ performances on different
physical fitness indicators. Instead of examining the separate physical fitness components
one by one as has been done in traditional physical fitness assessment, the RMPFS
127
measure described the overall picture of students’ physical fitness and placed students in
order on the linear continuum of physical fitness.
This chapter aims to detect the relationships between students’ overall physical fitness,
measured by the RMPFS, and anthropometric indicators including age, height, weight,
and BMI for the students in this sample. The relationships are described in the form of
percentile distributions. It is worth pointing out that percentile ranks, which are often used
in traditional fitness assessment and reporting system, are not on an equal-interval scale
so that they are not appropriate for use as direct indicators of students’ physical fitness.
However, this chapter is to use percentile distribution to set up a reference database for
comparative interpretation of students’ RMPFS measures rather than to place students on
the physical fitness continuum. The percentile distributions are helpful in interpreting
students’ RMPFS measures in a conventional and somewhat “friendly”, for some people,
way, especially for the sample used in this study. Seven percentile curves (3%, 10%, 25%,
50%, 75%, 90%, 97%) are to be used in figures to describe the distributions of students’
RMPFS measures in the relationship with age, height, weight, and BMI.
RMPFS Measure by Age
Chapter Five reports the average values of RMPFS measures for students aged 6 through
11 years and displays the overall fitness developmental trend for students at the group
level. This section shows the percentile distribution of RMPFS measures for each age
group. Although students’ age ranges from 6 to 13 in the sample used in this study, the
sample size of students aged 12 and 13 years is very small (142 at age of 12 and 2 at age
of 13 respectively) compared to other ages. Therefore, the following analyses and
discussion cover students aged 6 to 11 years only. Figure 6.1 and Figure 6.2 present the
RMPFS measure for age percentiles for boys and girls respectively.
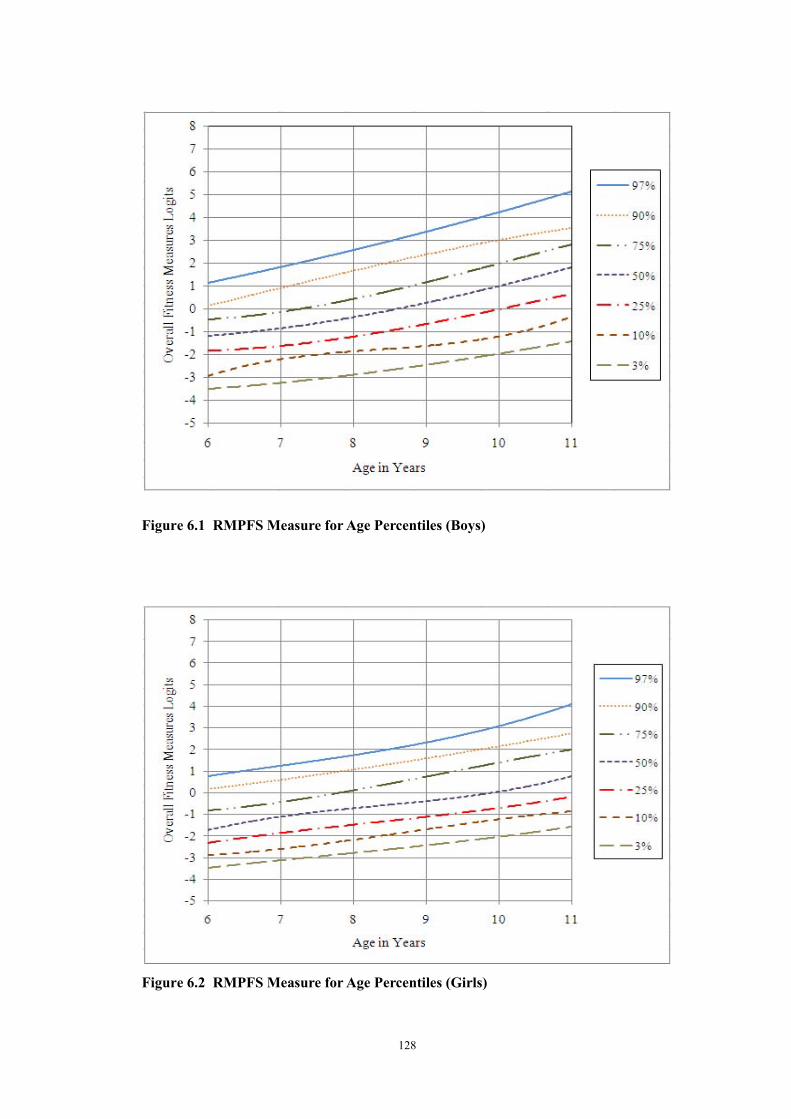
128
Figure 6.1 RMPFS Measure for Age Percentiles (Boys)
Figure 6.2 RMPFS Measure for Age Percentiles (Girls)
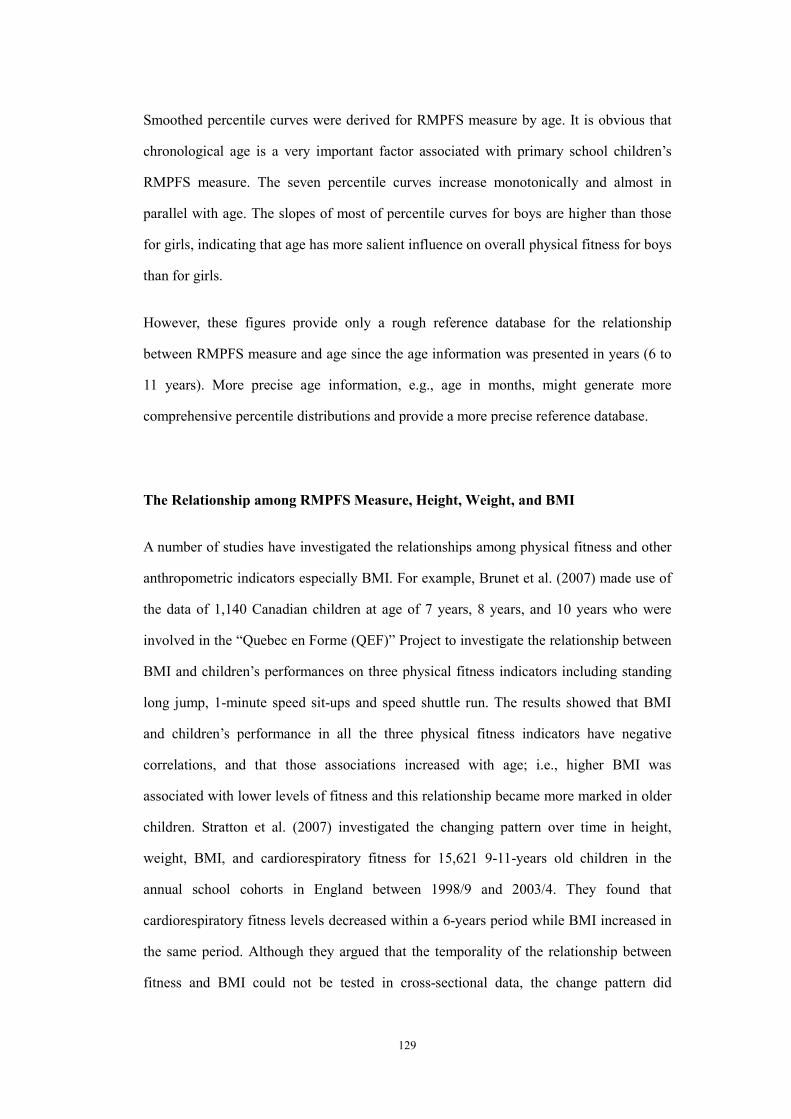
129
Smoothed percentile curves were derived for RMPFS measure by age. It is obvious that
chronological age is a very important factor associated with primary school children’s
RMPFS measure. The seven percentile curves increase monotonically and almost in
parallel with age. The slopes of most of percentile curves for boys are higher than those
for girls, indicating that age has more salient influence on overall physical fitness for boys
than for girls.
However, these figures provide only a rough reference database for the relationship
between RMPFS measure and age since the age information was presented in years (6 to
11 years). More precise age information, e.g., age in months, might generate more
comprehensive percentile distributions and provide a more precise reference database.
The Relationship among RMPFS Measure, Height, Weight, and BMI
A number of studies have investigated the relationships among physical fitness and other
anthropometric indicators especially BMI. For example, Brunet et al. (2007) made use of
the data of 1,140 Canadian children at age of 7 years, 8 years, and 10 years who were
involved in the “Quebec en Forme (QEF)” Project to investigate the relationship between
BMI and children’s performances on three physical fitness indicators including standing
long jump, 1-minute speed sit-ups and speed shuttle run. The results showed that BMI
and children’s performance in all the three physical fitness indicators have negative
correlations, and that those associations increased with age; i.e., higher BMI was
associated with lower levels of fitness and this relationship became more marked in older
children. Stratton et al. (2007) investigated the changing pattern over time in height,
weight, BMI, and cardiorespiratory fitness for 15,621 9-11-years old children in the
annual school cohorts in England between 1998/9 and 2003/4. They found that
cardiorespiratory fitness levels decreased within a 6-years period while BMI increased in
the same period. Although they argued that the temporality of the relationship between
fitness and BMI could not be tested in cross-sectional data, the change pattern did

130
indicate a negative correlation between cardiorespiratory fitness and BMI. In another
study, Kamtsios and Digelidis (2007) examined 5th and 6th grades students with different
BMIs and found that overweight and obese students had lower performances on three
physical fitness indicators including long jump, 30m. speed run and 20m. shuttle run.
In the present study, the correlations among RMPFS measure, height, weight, and BMI
are presented in Table 6.1 .
Table 6.1 Correlations among RMPFS Measure, Height, Weight, and BMI
Height Weight BMI
RMPFS measure .525**
.356**
.069**
R-sq .276 .127 .005
Note. **
p <.01.
It is revealed that the correlations between RMPFS measure and height or weight are
0.525 and 0.356 respectively and these correlations reach statistical significance at .01
level. While the correlation between RMPFS measure and BMI is statistically significant
(due, at least in part, to the large sample size), the amount of variance explained (.005) is
remarkably low. These results do not align with the findings of some previous studies
(e.g., Brunet et al., 2007; Kamtsios & Digelidis, 2007; Stratton et al., 2007). However, the
discrepancy is not surprising because the conceptions of physical fitness are different
between the present study and other studies mentioned above. In other studies, the
physical fitness is treated in a traditional way. Components of fitness were assessed with
different indicators and students’ performances on each indicator were recorded and
interpreted separately. The object under investigation was the association between
weight/BMI and each component but not the overall physical fitness. In the present study,
the physical fitness is conceptualized as an overall construct which integrates students’
performances on 6-minute Run, 9-minute Run, 1-minute Sit-ups, and Dominant Handgrip.
Students’ traits in cardiorespiratory fitness, muscular endurance, and muscular strength
function together have their own contributions to the overall physical fitness. Another
possible reason leading to the discrepancy of results between this study and other studies

131
is that Hong Kong primary school-aged students, especially girls, have lower BMI and
smaller BMI range than their counterparts in western countries. For example, the 7-years,
8-years, and 10-years old girls in this sample have a mean value of 15.8 (S.D. = 2.2), 16.1
(S.D. = 2.4), and 16.8 (S.D. = 2.6) respectively. In contrast, the girls in Brunet et al.’s
(2007) sample have a mean value of 16.3 (S.D. = 2.1), 17.0 (S.D. = 2.8), and 18.5 (S.D. =
3.4) respectively. The different range and positions on the BMI continuum probably
resulted in different correlations between BMI and physical fitness.
RMPFS Measure by Height
Figure 6.3 presents the RMPFS measure for height percentiles for boys and Figure 6.4
presents the same results for girls. Students’ height ranges from 101 to 175 cm, but many
of categories at the extremes of the height continuum have fewer than 10 observations
and some categories have only 1 observation. In order to reduce the noise introduced by
unexpected observations and generate meaningful percentile curves, it is suitably
conservative to include only those height categories with 30 or more observations for the
calculation of percentiles. Consequently, height categories ranging between 112 and 154
cm for boys and between 112 and 153 cm for girls are plotted against RMPFS measure in
Figure 6.3 and Figure 6.4 respectively.

132
Figure 6.3 RMPFS Measure for Height Percentiles (Boys)
Figure 6.4 RMPFS Measure for Height Percentiles (Girls)

133
Smoothed percentile curves were derived for RMPFS measure by height. It can be seen
that height is a factor of great influence on overall physical fitness. The high percentile
curves (e.g., 75%, 90%, 95%) are steeper than low percentile curves (e.g., 3% and 10%),
suggesting that there are more apparent variation of overall physical fitness for taller
students than for shorter students.
The height percentile can thus be used to investigate an individual student’s RMPFS
measure relative to other students of the same height, but not necessarily of the same age
or weight.
RMPFS Measure by Weight
Figure 6.5 and Figure 6.6 present the RMPFS measure for weight percentiles for boys and
girls respectively. Students’ weight ranges from 13 to 81 kg, but, again, some extreme
weight categories have so few observations that it is not possible to generate meaningful
percentile curves. Therefore, only weight categories with 30 or more observations are
included in the figures. Consequently, the weight categories ranging between 18 and 50
kg for boys are plotted in Figure 6.5 and the weight groups ranging between 17 and 45 kg
for girls are plotted in Figure 6.6 .
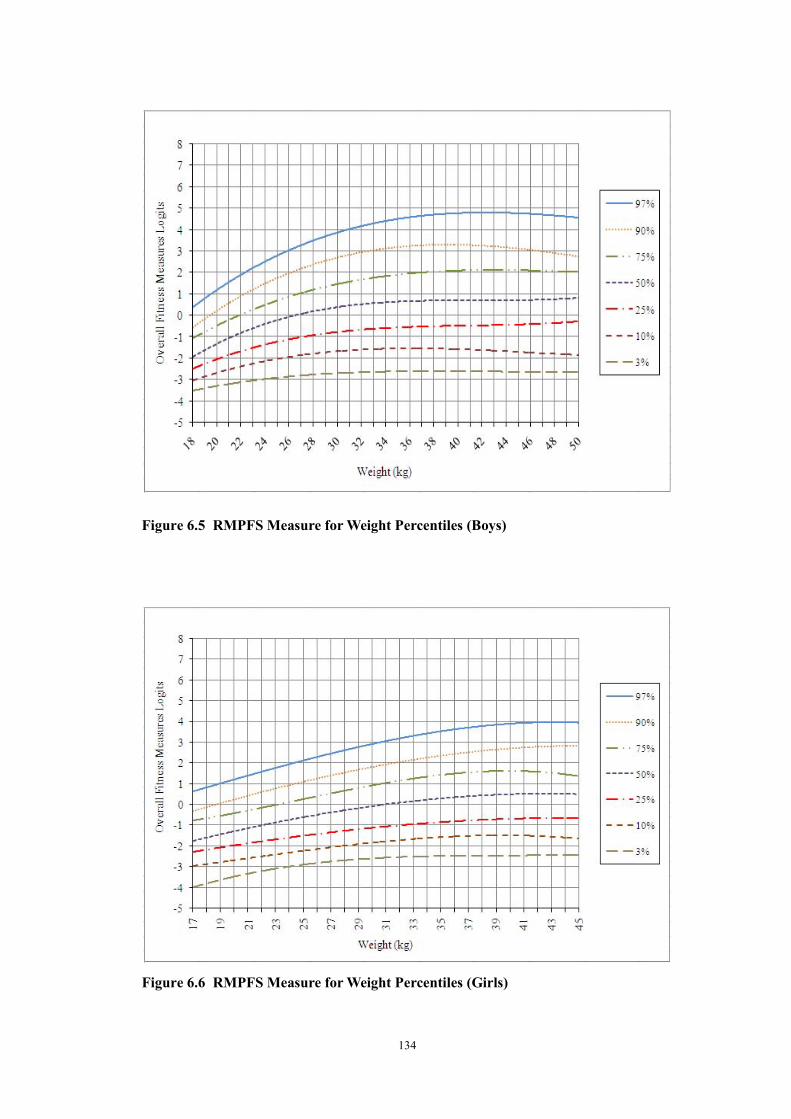
134
Figure 6.5 RMPFS Measure for Weight Percentiles (Boys)
Figure 6.6 RMPFS Measure for Weight Percentiles (Girls)
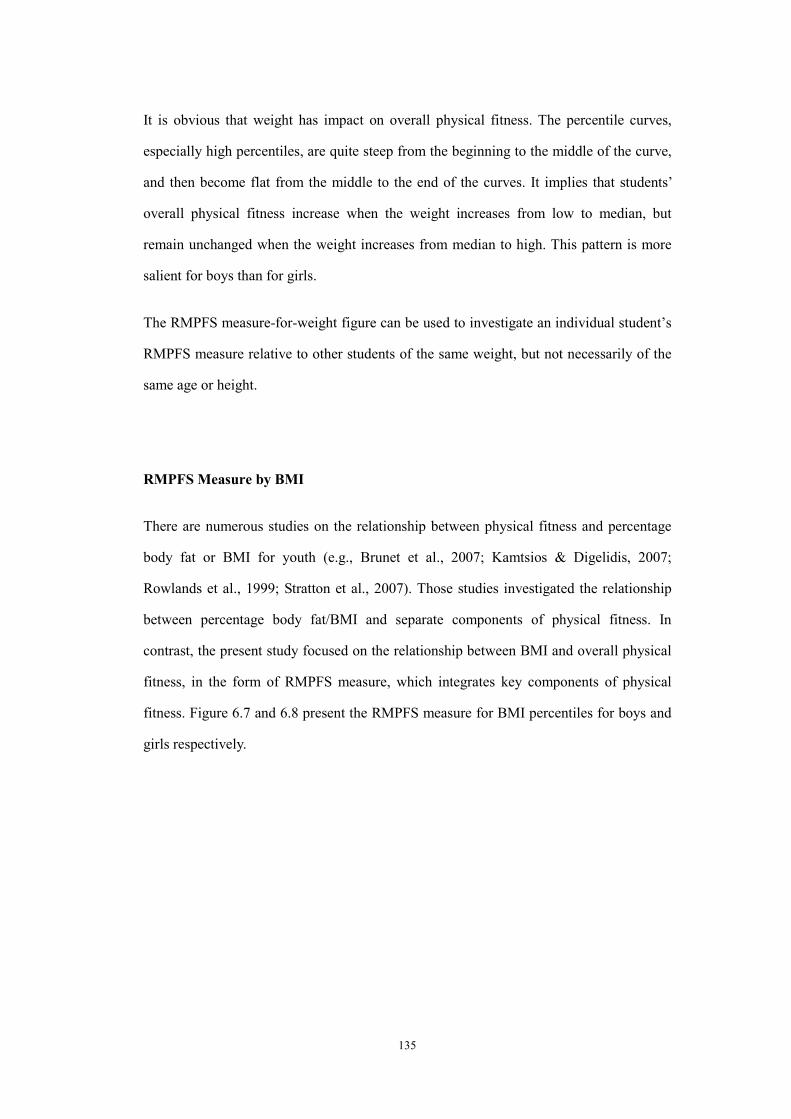
135
It is obvious that weight has impact on overall physical fitness. The percentile curves,
especially high percentiles, are quite steep from the beginning to the middle of the curve,
and then become flat from the middle to the end of the curves. It implies that students’
overall physical fitness increase when the weight increases from low to median, but
remain unchanged when the weight increases from median to high. This pattern is more
salient for boys than for girls.
The RMPFS measure-for-weight figure can be used to investigate an individual student’s
RMPFS measure relative to other students of the same weight, but not necessarily of the
same age or height.
RMPFS Measure by BMI
There are numerous studies on the relationship between physical fitness and percentage
body fat or BMI for youth (e.g., Brunet et al., 2007; Kamtsios & Digelidis, 2007;
Rowlands et al., 1999; Stratton et al., 2007). Those studies investigated the relationship
between percentage body fat/BMI and separate components of physical fitness. In
contrast, the present study focused on the relationship between BMI and overall physical
fitness, in the form of RMPFS measure, which integrates key components of physical
fitness. Figure 6.7 and 6.8 present the RMPFS measure for BMI percentiles for boys and
girls respectively.
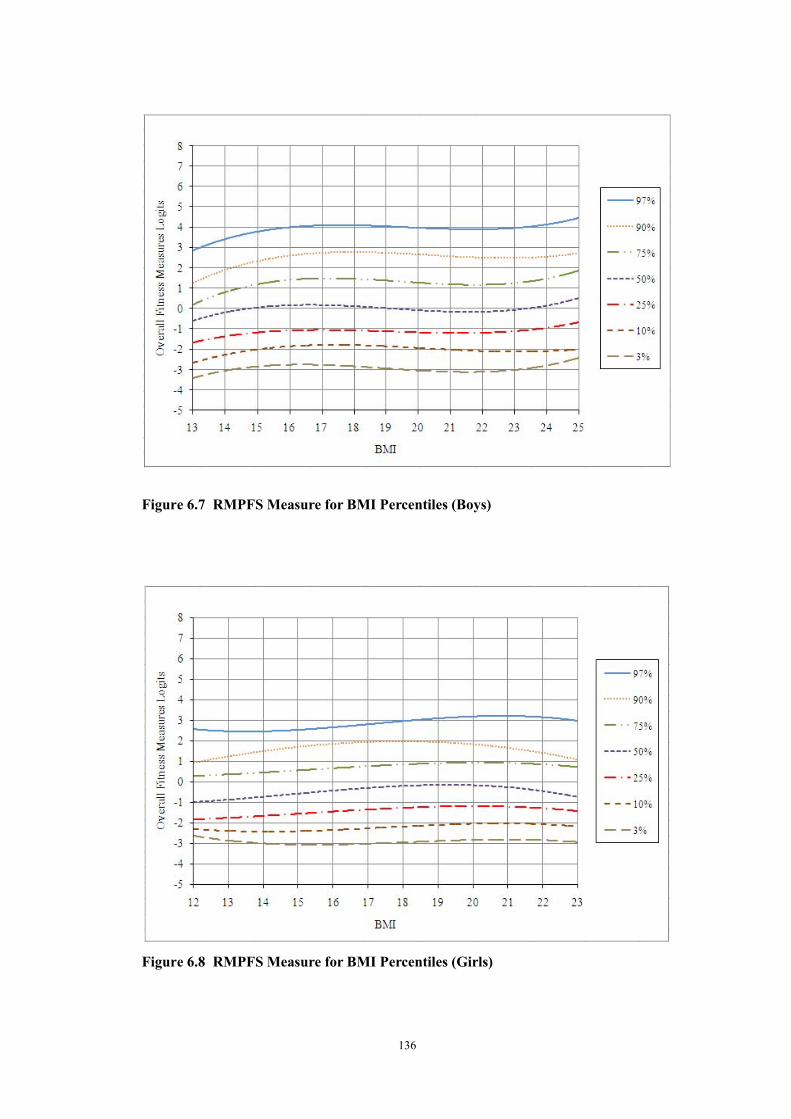
136
Figure 6.7 RMPFS Measure for BMI Percentiles (Boys)
Figure 6.8 RMPFS Measure for BMI Percentiles (Girls)

137
Although students’ BMI ranges from 10 to 38, only BMI categories with 30 or more
observations are included in the percentile distributions. Consequently, the BMI
categories ranging between 13 and 25 for boys and between 12 and 23 for girls are
plotted in Figure 6.7 and 6.8 respectively. The percentile curves presented are quite flat,
indicating that the BMI has very low correlation with students’ overall physical fitness.
The RMPFS measure-for-BMI figure can be used to investigate an individual student’s
RMPFS measure relative to other students of the same BMI.
Summary
In this chapter, percentile distributions of overall physical fitness, in the form of RMPFS
measure, were calculated from both the cross-sectional and longitudinal data. Seven
smoothed percentile curves (3%, 10%, 25%, 50%, 75%, 90%, 97%) were presented in
each graph to depict the relationships between RMPFS measures and age, height, weight,
and BMI for male and female students in the sample used in this study.
The percentile distributions presented in this chapter can be used to monitor,
cross-sectionally and longitudinally, an individual student’s RMPFS measure relative to
other students of the same age, height, weight, or BMI. This will provide a convenient
and direct method to indicate a student’s rank relative to the whole sample used in this
study by plotting the student on the percentile distributions according to the particular
anthropometric attribute (age, height, weight, or BMI).
Since the percentile distributions were calculated based on a particular sample, it might
not be appropriate to immediately generalize the profiles to other Hong Kong primary
schools or to the whole Hong Kong population due to the sampling limitation.
Nevertheless, the percentile distributions provided a school-based reference for a better
interpretation of students’ RMPFS measures and provide further evidence of the benefits
that could be derived if the techniques used in this research could be implemented
138
successfully in other research situations. It should also provide a highly useful empirical
resource to assist physical education teachers to cater for students’ developmental status
and, therefore, deliver appropriate fitness programmes to accommodate individualized
requirements. It would behove teachers to pay special attention to the extreme values (for
example, above 97% or below 3%) and to explore the answers for several questions
concerning those extreme values, such as, was the physical fitness measurement for those
with extreme values correct or accurate? Should these children be given priority for
possible follow-up action?

139
CHAPTER SEVEN
CONCLUSON AND DISCUSSION
Overview
This research was inspired by two deficiencies inherent to traditional approaches to
physical fitness assessment. The first, the high dependence on raw scores for
component-related physical fitness indicators, limits the validity and accuracy of the
interpretation of physical fitness assessment results because raw scores (unless used to
derive further information, e.g., estimated VO2max) indicate only the ordering of the
performances, but might not provide “measures” with inferential value about the size of
the differences between different raw scores (Bond & Fox, 2007; Wright & Mok, 2000).
The second, the traditional approaches to physical fitness assessment is not an economical
approach because it requires students to attempt all of the separate fitness indicators in
order to get the whole picture about their abilities on the different components of physical
fitness. Therefore, this research attempted to develop a new technique which could
provide valid measures of students’ overall physical fitness in an efficient way.
Towards that end, this thesis outlined the background and proposed the purpose of the
study – to develop a Rasch Measurement Physical Fitness Scale (RMPFS) consisting of
the physical fitness indicators routinely used in Hong Kong primary schools. The
significance of the study, the advantages the RMPFS has compared to traditional
approaches to physical fitness assessment, four research questions, and two basic
assumptions for the study were outlined.
The literature review introduced a definition of physical fitness based on the structure of
physical fitness as described by experts in the research field. Physical fitness test
protocols and indicators used both in western countries and Hong Kong for children
140
fitness assessment were summarized as well. Furthermore, the Rasch model was
discussed thoroughly with regard to its theoretical proposition, mathematical formulation,
main features, and the existing applications of Rasch measurement in physical education
and sports science. Although the Rasch model has been applied to develop or improve
physical tests or motor ability scale as valid instruments in some studies (e.g., Bowles &
Ram, 2006; Hands & Larkin, 2001; Heesch et al., 2006; Safrit et al., 1992; Zhu & Cole,
1996; Zhu & Kurz, 1994; Zhu & Safrit, 1993; Zhu et al., 2001), no attempt to combine a
range of different physical fitness indicators into a single overall physical fitness scale
was found in current literature.
Methodological issues remain at the heart of the research enterprise. Important aspects of
the research methodology include consideration of the sample characteristics, as well as
the fitness indicators administered in Hong Kong primary schools to obtain students’
physical fitness data, along with the procedures for the collection of those data. Another
important argument in this thesis has been concerning the justification of the Partial
Credit Rasch Model as the more appropriate choice for creating fitness measures with the
physical fitness data in this research. An iterative sequence of analytical steps was
adopted and nine criteria were established to investigate the quality of the indicators and
the ensuing scale.
Through thorough investigations derived from Rasch measurement along with some
practical considerations, four physical fitness indicators (i.e., 6-mintue Run, 9-minute
Run, 1-mintue Sit-ups and Dominant Handgrip) were successfully calibrated to form the
RMPFS for Hong Kong primary school-aged students. The other five indicators (i.e.,
BMI, Sit-and-Reach, Right Handgrip, Left Handgrip, Standard Push-ups, and Modified
Push-ups) were excluded from the scale for different and sufficient reasons. This RMPFS
scale integrates three key components of physical fitness (i.e., cardiorespiratory fitness,
muscular endurance, and muscular strength) into an overall measure of health-related
physical fitness. The analytical results indicated that the RMPFS and its scale indicators
showed sufficient fit to the Rasch model.

141
The developed RMPFS was successfully implemented to measure primary school-aged
students’ overall physical fitness levels and the Rasch-scaled overall physical fitness
measures were examined against variables such as age, sex, and cohort. Students’ overall
physical fitness measures increase monotonically with age although the rate of
development varied at different stages. Sex differences are statistically significant in favor
of boys, but the differences for students aged 6 to 9 years are of no practical importance.
Investigations on the overall fitness measures of different cohorts located two occasions
of unexpected decrease in fitness for some cohorts and further exploration found that it
might be influenced by subjectivity of the testing process. In addition to measurement of
students overall fitness at group level, five exemplar cases (three boys and two girls)
showed the apparent variety of individual students’ overall fitness levels at any one time
as well as their developmental patterns.
Moreover, the relationships between students’ overall physical fitness, measured by the
RMPFS, and anthropometric indicators including age, height, weight, and BMI were
depicted for male and female students in the sample used in this research. The
relationships are described in the form of percentile distributions (3%, 10%, 25%, 50%,
75%, 90%, 97%) which are empirically helpful for comparative interpretation of students’
RMPFS measures since it provided a school-based reference. Any student’s rank relative
to the whole sample used in this research could be obtained by plotting the student into
the percentile distributions according to any chose anthropometric trait.
Main Findings
The main findings of the study can be summarized succinctly as follows:
1. A RMPFS integrating three key core components of physical fitness (i.e.,
cardiorespiratory fitness, muscular endurance, and muscular strength) was developed
through the Rasch calibration of primary school-aged students’ physical fitness data

142
provided by a large partner school in Hong Kong.
Four physical fitness indicators - 6-mintue Run, 9-minute Run, 1-minute Sit-ups and
Dominant Handgrip - were successfully calibrated to form the RMPFS. Another six
routinely collected fitness indicators - BMI, Sit-and-Reach, Right Handgrip, Left
Handgrip, Standard Push-ups, and Modified Push-ups - were excluded from the RMPFS
because of violation of the Rasch model’s requirements or practical considerations. The
RMPFS can provide an overall measure of health-related physical fitness for students.
This approach has a number of benefits over relying on the independent scores for
separate fitness indicators or components. Even if the student had performed on any one
of the four RMPFS physical fitness indicators, that student can be given an overall
RMPFS fitness measure. This overall measure combines core fitness components -
cardiorespiratory fitness, muscular endurance, and muscular strength - but is not the
simple “average” of the performance on different components. The RMPFS overall
fitness measure is equal-interval measure which has consistent and stable meaning with
regard to the distances between persons or items so that it facilitates meaningful
interpretation and comparison of students’ performances on physical fitness indicators.
The measure is sample-distribution free and item-distribution free. That means
item/indicator measures should be independent of the particular sample used for item
calibration and person measures should be independent of the particular items/indicators
used for measuring the persons. Furthermore, the RMPFS can calibrate students’ overall
fitness levels and the indicator difficulties on a single unidimensional scale so that direct
comparisons between person abilities and item difficulties can be easily conducted based
on their locations on the latent trait continuum.
2. The RMPFS and its scale indicators showed fit to the Rasch model sufficient for the
intended purposes of measuring overall fitness of children and tracking fitness levels
over time.
The difficulty levels for the 4 calibrated indicators in the RMPFS range from -1.59 logits

143
to +1.25 logits; those locations are associated with very small S.Es (0.02 – 0.03 logits).
The indicators’ difficulties (M = 0.00, SD = 1.16) are appropriately matched to the fitness
levels (M = -0.21, SD = 2.78) of students in this sample. The Infit and Outfit MNSQ
statistics for all indicators range between 0.85 (Infit MNSQ for 9-minute Run) and 1.13
(Outfit MNSQ for Dominant Handgrip). All the 4 indicators are of the same polarity since
the point-measure correlations for all of the RMPFS indicators approximate 0.8. The
Rasch item reliability is 1.00 and the Rasch person reliability is 0.77. The item separation
index is 43.16 and the person separation index is 1.83. These results suggest that the scale
and indicators have sufficient fit to the Rasch model for practical measurement purposes
– especially for such low-stakes decisions. The Item Characteristic Curves (ICC) and
category probability curves provide further support for the valid functioning of the
RMPFS scale. The empirical ICCs match the theoretical ICCs reasonably well, especially
for students with median fitness levels, i.e., those located around the middle of the curves.
The category probability curves for each of the four indicators show that the category
structure for each indicator functions very well.
3. The RMPFS measures displayed Hong Kong primary school-aged students’ overall
physical fitness levels and developmental trends effectively.
Students’ RMPFS measures increase monotonically from 6-years old to 11-years old,
although the rate of development is not even across the six years, and increase with
academic year and year level. There is statistically significant sex difference in overall
RMPFS fitness levels favoring boys. Investigations of exemplar cases showed apparent
variation in students’ overall fitness levels at any one time and their developmental
patterns over time. However, it is worth noting that the S.Es for the RMPFS measures at
the individual level are quite large, while very small at the group (e.g., class, cohort or
year) level. Therefore, the RMPFS measures and changes at the group level are more
informative in depicting students’ physical fitness development and it is not
recommended to make high-stakes inferences about students’ overall physical fitness
estimations at the individual level because of the large measure error. Although some

144
other aggregation of the fitness data to produce an overall fitness score might be possible,
the interval measurement characteristics of the RMPFS measures are demonstrably
suitable for the tracking task.
4. The percentile distributions of overall physical fitness, measured by the RMPFS, for
age, height, weight, and BMI were described graphically for the sample of this
research.
Seven smoothed percentile curves (3%, 10%, 25%, 50%, 75%, 90%, 97%) were
presented in graphs to depict the relationships between RMPFS measures and the
traditionally used age, height, weight, and BMI indicators for male and female students in
the sample used in this research. The percentile distributions facilitate provide better
interpretation of students’ RMPFS measures by providing a school-based reference and
can be used to monitor an individual student’s RMPFS measure relative to other students
of the same age, height, weight, or BMI in a convenient and straightforward way. The
percentile distributions also provide a highly useful empirical resource to assist physical
education teaching. Teachers can make use of the information obtained from the
percentile distributions to accommodate students’ individualized requirements in
delivering appropriate fitness programmes.
Implications for Practice
This research has important implications for practice in the field of physical education
and physical fitness programme delivery for students in Hong Kong primary schools.
1. The successful development and application of the RMPFS provides strong evidence
of the benefits derived from the techniques used in this research. It acts as a model
practice that could be transplanted to other similar samples to build up school-based
database so that more meaningful interpretation of physical fitness assessment results
can be achieved.
145
2. As described in Chapter Five, two groups of students with substantially different
overall physical fitness have highly similar performances on 9-minute Run, but
different performances on 1-minute Sit-ups. It is reasonable to draw an inference that
the difference might not come from students’ fitness levels, but perhaps from other
factors which might influence the assessment results; it is possible that rater severity
could be one of these. This fact suggests that physical fitness indicators administered
for primary school-aged students should be more objective in order to reduce
unexpected influence as much as possible and obtain reliable measurement data really
reflecting students’ physical fitness. For example, it should be helpful to use
standardized procedure for test administration in order to achieve consistency among
raters’ severity in physical fitness tests which involve raters’ subjective judgments,
e.g., 1-minute Sit-ups.
3. It is usual practice in Hong Kong to divide students into sex-based groups in PE
classes. However, this is not the advice that would be given, based on the findings of
this research - especially for junior primary school-aged students aged 6 to 9 years.
Although, in terms of mean values, boys have statistically significantly higher levels
of overall fitness than girls of the same age, there is a very large overlap of the overall
fitness estimations for boys and girls. In other words, although boys are expected, on
average, to be fitter than girls, but it would not be appropriate to make individual
judgments, predictions or grouping just because of sex. Arbitrarily dividing students
into sex-based groups and deliver different fitness programmes to these groups is not
based on the empirical evidence. The levels of fitness programmes should reflect the
developmental trends, rather than a priori sex–based assumptions which, inter alia,
would neglect the needs of boys with relatively low fitness levels and girls with
relatively high fitness levels as well as ignore the similarities of fitness levels among
many boys and girls. In contrast, it seems more defensible to divide students into
groups based on fitness levels in PE classes. For example, students within, or across
year levels could be divided conveniently into three groups, namely, high fitness,

146
median fitness, and low fitness groups. Different programmes and physical activities
then could be designed specifically for these groups so that students’ more
individualized requirements would not be overlooked. Furthermore, considering the
high correlation between height and overall physical fitness, even height-based
grouping would be better than sex-based grouping.
4. The findings of this research show that there are apparent individual differences in
both overall physical fitness levels and developmental patterns for primary
school-aged students. Therefore, physical education teachers need to cater for
students’ individual requirements and develop appropriate fitness programmes that
could accommodate students’ individualized requirements. This will be a
considerable challenge to teachers used to traditional whole-class or sex-based group
delivery of physical fitness programmes.
5. Height and weight are appropriate correlates of overall physical fitness. However, the
use of BMI as an appropriate indicator of overall physical fitness is ill-conceived.
BMI could be used as a good indicator of obesity and an alternative indicator of body
composition. The correlation between BMI and overall physical fitness for Hong
Kong primary school-aged students, measured by the RMPFS, is close to zero.
Therefore, it indicates that interpretation of BMI results should be more cautious
especially when it is presented together with other fitness assessment results.
6. This research has practical values for the partner school. The first, the partner school
has dedicated a lot of resources to physical education, such as the sport climbing wall,
the physical fitness room, the indoor swimming pool, the extra teaching time as well
as teaching manpower for physical education classes. Although growth of students’
fitness has always been accepted implicitly, now the evidence of fitness growth can
be made explicit to all stakeholders including teachers, school sponsors and parents.
Thus the partner school’s investment in physical education can be justified, at least in
part, by reference to the empirical evidence provided by this research. The second,

147
the RMPFS facilitates reporting students’ fitness profiles by class or cohort at group
level as well as at individual level as long as individual results are used for low-stakes
decisions only. The school and parents now have a useful and convenient tool to
investigate students’ fitness growth over time. Furthermore, this research has
suggestions with practical benefits for physical education teachers in the partner
school, such as the recommendations on student grouping methods in PE classes
made in the third point of this section.
Recommendations for Future Research
This research addressed problems inherent in traditional approaches to physical fitness
assessment. However, this research has its own limitations and future research with
emphasis on the following aspects will extend the contributions of this research to
physical fitness assessment.
The first, since this study took the “data fit the model” position, the RMPFS integrates
three components only, the indicators for other two components (BMI for body
composition and Sit-and-Reach for flexibility) were excluded from the scale due to
failure to fulfill the Rasch requirements or for other practical considerations. However,
these two components can’t be simply regarded as not related to the overall fitness at all.
They were not integrated into the overall fitness measure because they have no
appropriate indicators that can be calibrated into the RMPFS with sufficient fit to the
Rasch model. Future research could explore this point further through two angles. One is
to stick to the position of “data fit the model” and to make efforts to identify appropriate
indicators for the components of body composition which can be successfully calibrated
into the Rasch measurement scale. And those attempts could be made in a smaller, more
closely controlled fitness testing context. The other is to explore the multi-dimensional
and continuous Rasch models so as to identify a model to fit the data. However, this “the
model fit data” approach probably loses the strong measurement benefits which could be

148
derived from Rasch model.
The second, the RMPFS developed in this research relies exclusively on the data from the
partner school. That brings a limitation to the study which prevents the immediate
generalization of the physical fitness scale developed in this research to other Hong Kong
primary schools. Future research could utilize the technique used in this research and
extend to a larger sample which might be representative for the whole Hong Kong
primary school-aged student population so that a Rasch measurement physical fitness
scale could be developed for use with the entire Hong Kong primary school-aged student
body. On the other hand, future research could use the same technique to develop
school-based databases for other similar samples and derive the same benefits for other
schools. This research also has potential to be extended outside Hong Kong, such as
nearby in mainland China. The scale developed and techniques used in this research will
be very helpful to investigations on physical fitness measurement for mainland China
primary schools. In addition to replicating the practical benefits, there are also theoretical
benefits that could be derived from applying the same technique to other samples. The
invariance of indicator measures (sample-distribution free) is one of the Rasch model’s
requirements. That means indicator measures should be independent of the particular
sample used for indicator calibration. However, this research itself did not provide direct
evidence of this feature since it did not apply the RMPFS to other samples. Future
investigations of the invariance of indicator measures using already existing data from
other Hong Kong schools or collected in mainland China schools could provide more
evidence of validation to the RMPFS.
The third, the physical fitness data of the partner school did not function as well as might
have been hoped in the Rasch analyses. Individual person estimates obtained by the
RMPFS are associated with quite large measurement errors, although the estimates at the
group level are quite precise. It limits the use of the overall fitness measure in tracking
individuals’ physical fitness development. Future research could attempt to find solutions
to reduce the measurement errors of person estimates such as developing and calibrating

149
more appropriate physical fitness indicators into the Rasch scale. More indicators would
provide more information to person estimation so that the overall fitness measure at the
individual level could be more precise. There are two concerns need to be addressed with
regard to calibrating more indicators into the RMPFS. On the one hand, what kind of
indicators should be added into the scale? Body composition and flexibility have been
shown to be inappropriate for inclusion into the overall physical fitness measure, but
other indicators for the three components (i.e., cardiorespiratory fitness, muscular
endurance, and muscular strength) could be considered in future studies. On the other
hand, how many additional indicators are needed to be calibrated to the scale in order to
obtain individual person estimates with sufficient measurement precision? According to
Bond and Fox (2007), a difference greater than 0.5 logits might be regarded having both
statistical and practical meaning. Thus a person estimate with a S.E. less than 0.5 logits
should be acceptable. The following formula describes the mathematic relationship
between the S.E. of person estimates and the number of indicators (M. Linacre, personal
communication, March 27, 2009).
S.E. = k / sqrt (L) (6)
Where k is a constant depending on the indicator format, and L is the number of
indicators in the scale. At present, the mean of model S.E. of person estimates obtained
from the 3-indicator RMPFS – 6-minute Run and 9-minute Run act as a single indicator
in fact because no student has scores on both of them – is 1.12 logits. According to the
equation (5), around 15 indicators are needed in order to obtain a S.E. of 0.5 logits. That
means calibrating 12 more indicators into the RMPFS could generate individual person
estimates with sufficient precision. However, a dilemma future studies will face is that
adding similar indicators for the same fitness component to the scale will probably add to
the amount of local dependence at the same time. Although it is important and meaningful
to build a scale which can generate individual person estimates with smaller measurement
errors, there is a tension inherent in achieving this goal. More empirical studies are
needed to explore this topic and find a balance between getting more precise person
150
estimates without adding to local dependence among indicators in the future.
This is not to deny that psychometric approaches to data analysis, other than the Rasch
model, might be appropriate for producing a more comprehensive description of the
variability in this large longitudinal data set of children’s physical fitness indicators. At
the conclusion of this research, it remains an open question as to whether other
quantitative approaches might produce results that have better ‘fit of the model to the
data’. The completion of such a project could provide an interesting complement to the
results of the ‘data fit the model’ Rasch measurement approach explicitly adopted at the
outset of this investigation.
Summary
As an integral part of physical education curriculum, fitness assessment itself is not the
goal of physical education, but a formative evaluation to further educational goals
(Silverman, Keating, & Phillips, 2008). It is essential to provide precise and reliable
fitness assessment and meaningful interpretation of assessment results to children, parents,
and teachers so that appropriate follow-up actions could be undertaken to promote
children’s health.
This research explored a new approach to physical fitness measurement which has rarely
been previously discussed in current literature and provided empirical evidence to the
benefits of the new approach. The development of the RMPFS extended Rasch
application in physical education field. The successful implementation of the RMPFS in
depicting students’ overall physical fitness levels and developmental trends built up a
good model of practice for future studies. The major findings and implications for
practice should make contributions to knowledge generation, teaching practice, and
policy-related issues in the field of physical fitness measurement.

151
REFERENCE LIST
American Association for Health, Physical Education and Recreation. (1958). AAHPER
youth fitness test manual. Washington, DC: Author.
American Alliance of Health, Physical Education, Recreation and Dance. (1980).
AAHPERD health related physical fitness test manual. Reston, VA: Author.
American Alliance of Health, Physical Education, Recreation and Dance. (1989).
Physical best: The AAHPERD guide to physical fitness education and assessment.
Reston, VA: Author.
American College of Sports Medicine. (2000). ACSM’s guidelines for exercise testing and
prescription (6th ed.). Philadelphia: Lippincott Williams & Wilkins.
American Education Research Association, American Psychological Association, &
National Council on Measurement in Education. (1999). Standards for educational
and psychological testing. Washington, DC: American Education Research
Association.
American Psychological Association. (2009). Publication manual of the American
Psychological Association (6th ed.). Washington, DC: Author.
Andersen, E. B. (1995). What Georg Rasch would have thought about this book. In G. H.
Fischer & I. W. Molenaar (Eds.), Rasch models: Foundations, recent developments,
and applications (pp. 383-390). NY: Springer.
Andrich, D. (1988). Rasch models for measurement. Newbury Park, CA: Sage
Publications.
Andrich, D. (2004). Controversy and the Rasch model: A characteristic of incompatible
paradigms? Medical Care, 42, 1-16.

152
Barley, E. A., & Jones, P. W. (2006). Repeatability of a Rasch model of the AQ20 over
five assessments. Quality of Life Research, 15(5), 801-809.
Baumgartner, T. A., Jackson, A. S., Mahar, M. T., & Rowe. D. A. (2007). Measurement
for evaluation in physical education & exercise science (8th ed.). Boston, Mass.:
McGraw-Hill.
Biddle, S. J. H., Gorely, T., & Stensel, D. (2004). Health-enhancing physical activity and
sedentary behavior in children and adolescents. Journal of Sports Sciences, 22,
679-701.
Blignaut, L. J. (1998). The relation between physical fitness and psychological wellbeing
of the employee. Unpublished thesis. South Africa: University of South Africa.
Bond, T. G., & Fox, C. M. (2007). Applying the Rasch model: Fundamental measurement
in the human sciences (2nd ed.). Mahwah, N.J.: Erlbaum.
Bouchard, C., Shephard, R. J., Stephens, T., Sutton, J R., & McPherson, B. D. (Eds.).
(1990). Exercise, fitness, and health: A consensus of current knowledge. Champaign
IL: Human Kinetics.
Bowles, R. P., & Ram, N. (2006). Using Rasch measurement to investigate volleyball
skills and inform coaching. Journal of Applied Measurement, 7(1), 39-54.
Brunet, M., Chaput, J. P., & Tremblay, A. (2007). The association between low physical
fitness and high body mass index or waist circumference is increasing with age in
children: the 'Quebec en Forme' Project. International Journal of Obesity, 31(4),
637-643.
California Department of Education. (2005). A study of the relationship between physical
fitness and academic achievement in California using 2004 test results. Retrieved
August 8, 2006, from http://www.cde.ca.gov/ta/tg/pf/documents/2004pftresults.doc.

153
Canadian Society for Exercise Physiology. (1998). The Canadian physical activity, fitness
& lifestyle appraisal (CPAFLA): CSEP’s plan for healthy active living (2nd ed.).
Ottawa, Canada: Author.
Clarke, H. H. (1979). Definition of physical fitness. Journal of Physical Education and
Recreation, 50(8), 28.
Clauser, B. E., & Mazor, K. M. (1998). Using statistical procedures to identify differential
item functioning test items. Educational Measurement: Issues and Practice, 17,
31-44.
Corbin, C. B., Welk, G. J., Corbin, W. R., & Welk, K. A. (2006). Concepts of fitness and
wellness: A comprehensive lifestyle approach. New York: McGraw-Hill.
Council of Europe. (Council for the Development of Sport). (1988). European test of
physical fitness. Rome: Author.
Drewett, P. (1991). Assessment development and challenges in physical education. In N.
Armstrong & A. Sparkes (Eds.), Issues in physical education. London: Cassell.
Hong Kong Education and Manpower Bureau. (2005a). Hong Kong school physical
fitness award schemes: Students’ handbook. Retrieved August 10, 2006, from
http://cd1.emb.hkedcity.net/cd/pe/tc/rr/pfas/handbook
Hong Kong Education and Manpower Bureau. (2005b). Hong Kong school physical
fitness award schemes: Teachers’ handbook. Retrieved August 10, 2006, from
http://cd1.emb.hkedcity.net/cd/pe/tc/rr/pfas/handbook
Elder, C., McNamara, T., & Congdon, P. (2003). Rasch techniques for detecting bias in
performance assessments: an example comparing the performance of native and
non-native speakers on a test of academic English. Journal of Applied Measurement,
4(2), 181-197.
154
Embretson, S. E., & Reise, S. P. (2000). Item Response Theory for Psychologists.
Mahwah: Lawrence Erlbaum.
Endler, L. C., & Bond, T. G. (2008). Changing science outcomes: Cognitive acceleration
in a US setting. Research in Science Education, 38(2), 149-166.
Erikssen, G., Liestøl, K., Bjørnholt, J., Thaulow, E., Sandvik, L., & Erikssen, J. (1998).
Changes in physical fitness and changes in mortality. The Lancet, 352(5), 759-762.
Fischer, G. H. (1995). Derivations of the Rasch model. In G. H. Fischer & I. W. Molenaar
(Eds.), Rasch models: Foundations, recent developments, and applications. New
York: Springer Verlag.
Fitzpatrick, R., Norquist, J. M., Dawson, J., & Jenkinson, C. (2003). Rasch scoring of
outcomes of total hip replacement. Journal of Clinical Epidemiology, 56(1),
68-74.
Fleishman, F. A. (1964). The structure and measurement of physical fitness. NJ:
Prentice-Hall.
Fu, F. H. (1994). Health fitness parameters of Hong Kong school children. Hong Kong,
China: Hong Kong Baptist College.
Golding, L. A. (Ed.). (2000). YMCA fitness testing and assessment manual (4th ed.).
Champaign, IL: Human Kinetics.
Golding, L. A., Myers, C. R., & Sinning, W. E. (1989). The Y’s way to physical fitness
(3rd ed.). Champaign, IL: Human Kinetics.
Gutin, B., Yin, Z., Humphries, M.C., & Barbeau, P. (2005). Relations of moderate and
vigorous physical activity to fitness and fatness in adolescents. The American
Journal of Clinical Nutrition, 81(4), 746-750.
Hands, B., & Larkin, D. (2001). Using the Rasch measurement model to investigate the

155
construct of motor ability in young children. Journal of Applied Measurement,
2(2), 101-120.
Hasselstrom, H., Hansen, S. E., Froberg, K., & Andersen, L. B. (2002). Physical fitness
and physical activity during adolescence as predictors of cardiovascular disease risk
in young adulthood: Danish youth and sports study. An eight-year follow-up study.
International Journal of Sports Medicine, 23(supplement), 27-31.
Heesch, K. C., Masse, L. C., & Dunn, A. L. (2006). Using Rasch modeling to re-evaluate
three scales related to physical activity: Enjoyment, perceived benefits and perceived
barriers. Health Education Research, 21. Retrieved October 3, 2006, from
http://her.oxfordjournals.org/cgi/reprint/cyl054v1
Heyward, V. H. (2002). Advanced fitness assessment and exercise prescription (4th ed.).
Champaign, IL: Human Kinetics.
Hidalgo, M. D., & LóPez-Pina, J. A. (2004). Differential item functioning detection and
effect size: A comparison between logistic regression and Mantel-Haenszel
procedures. Educational and Psychological Measurement, 64(6), 903-915.
Hinson, C. (1995). Fitness for children. Champaign, IL: Human Kinetics.
Hoeger, W. W. K. (1989). Lifetime physical fitness and wellness. Englewood Cliffs, NJ:
Morton.
Holland, P. W., & Thayer, D. T. (1988). Differential item performance and the
Mantel-Haenszel procedure. In H. Wainer & H. I. Braun (Eds.), Test validity
(pp.129-145). Hillsdale, NJ: Lawrence Erlbaum.
Howley, E. T., & Franks, B. D. (1997). Health fitness instructor's handbook (3rd ed.).
Champaign, IL: Human Kinetics.
Hsueh, I. P., Wang, W. C., Sheu, C. F., & Hsieh, C. L. (2004). Rasch analyses of
156
combining two indices to assess comprehensive ADL function in stroke patients.
Stroke, 35(3), 721-726.
Jackson, A. W., & Baker, A. (1986). The relationship of the sit and reach test to criterion
measures of hamstring and back flexibility in young females. Research Quarterly for
Exercise and Sport, 57, 183-186.
Janz, K. F., Dawson, J. D., & Mahoney, L. T. (2002). Increase in physical fitness during
childhood improves cardiovascular health during adolescence: The Muscatine study.
International Journal of Sports Medicine, 23(supplement), 15-21.
Johnson, B. L., & Nelson, J. K. (1986). Practical measurements for evaluation in
physical education (4th ed.). Edina, Minnesota: Burgess.
Jones, C. J., Rikli, R. E., Max. J., & Noffal, G. (1998). The reliability and validity of a
chair sit-and-reach test as a measure of hamstring flexibility in older adults.
Research Quarterly for Exercise and Sport, 69, 338-343.
Kamtsios, S., & Digelidis, N. (2007). Physical fitness, nutritional habits and daily
locomotive action of 12-years children with different body mass index. Inquiries in
Sport & Physical Education, 5(1), 63-71.
Katzmarzyk, P. T., Malina, R. M., & Bouchard, C. (1999). Physical activity, physical
fitness, and coronary heart disease risk factors in youth: The Québec family study.
Preventive Medicine, 29(6), 555-562.
Kristjansson, E., Aylesworth, R., Mcdowell, I., & Zumbo, B. D. (2005). A comparison of
four methods for detecting differential item functioning in ordered response items.
Educational and Psychological Measurement, 65(6), 935-953.
Kullo, I. J., Hensrud, D. D., & Allison, T. G. (2002). Relation of low cardiorespiratory
fitness to the metabolic syndrome in middle-aged men. The American Journal of
Cardiology, 90(7), 795-797.

157
Kyröläinen, H., Häkkinen, K., Kautiainen, H., Santtila, M., Pihlainen, K., & Häkkinen, A.
(2008). Physical fitness, BMI and sickness absence in male military personnel.
Occupational Medicine, 58(4), 251-256.
Leung, S. S. F. (1993). Growth standards for Hong Kong: A territory wide survey in 1993.
Hong Kong, China: The Chinese University of Hong Kong.
Linacre, J. M. (2000). New approaches to determining reliability and validity. Research
Quarterly for Exercise and Sport, 71(2), 129-136.
Linacre, J. M. (2002). Optimizing rating scale category effectiveness. Journal of Applied
Measurement, 3, 85-106.
Linacre, J. M. (2006a). A user’s guide to WINSTEPS/MINISTEP: Rasch-model computer
programs. Chicago, IL: Winsteps.com.
Linacre, J. M. (2006b). Data variance explained by Rasch measures. Rasch Measurement
Transactions, 20(1), 1045.
Lindner, K. J. (1997). Sport participation of Hong Kong children and youth: Relation to
academic performance and perceived ability. Hong Kong Sports Development
Board, Hong Kong.
Lord, F. M. (1980). Applications of item response theory to practical testing problems.
Hillsdale, NJ: Lawrence Erlbaum.
Mahar, M. T., & Rowe, D. A. (2008). Practical guidelines for valid and reliable youth
fitness testing. Measurement in Physical Education and Exercise Science, 12(3),
126-145.
Manitoba Department of Education. (1977). Manitoba physical fitness performance test
manual and fitness objectives. Manitoba, Canada: Author.
Marsh, H. W. (1993). The multidimensional structure of physical fitness: Invariance over
158
gender and age. Research Quarterly for Exercise and Sport, 64(3), 256-273.
Marsh, H. W., & Redmayne, R. S. (1994). A multidimensional physical self-concept and
its relations to multiple components of physical fitness. Journal of Sport & Exercise
Psychology, 16(1), 43-55.
Masters, G. N. (1982). A Rasch model for partial credit scoring. Psychometrika, 47(2),
149-174.
McHorney, C. A., & Monahan, P. O. (2004). Postscript: Applications of Rasch analyses in
health care. Medical Care, 42(supplement), 73-78.
McManus, A., Sung, R., & Tsang, A. (2003). Physical and physiological characteristics
of young people in Hong Kong. Hong Kong, China: Hong Kong Sports
Development Board.
Merrell, C., & Tymms, P. (2005). Rasch analyses of inattentive, hyperactive and
impulsive behaviour in young children and the link with academic achievement.
Journal of Applied Measurement, 6(1), 1-18.
Miller, D. K. (2006). Measurement by the physical educator: Why and how (5th ed.). NY:
McGraw-Hill.
Mok, M. M. C. (2004). Validation of scores from self-learning scales for primary students
using true-score and Rasch measurement methods. Journal of Applied Measurement,
5(3), 258-286.
Mok, M. M. C., Cheong, C. Y., Moore, P. J., & Kennedy, K. J. (2006). The development
and validation of the Self-directed Learning Scales (SLS). Journal of Applied
Measurement, 7(4), 418-449.
Molenaar, I. W. (1995). Some background for item response theory and the Rasch model.
In G. H. Fischer & I. W. Molenaar (Eds.), Rasch models: Foundations, recent

159
developments, and applications (pp. 3-14). NY: Springer.
Mosteller, F., & Tukey, J. (1977). Data analysis and regression. Addison-Wesley.
Narayan, P., & Swanubatgab, H. (1994). Performance of the Mantel-Haenszel and
simultaneous item bias procedures for detecting differential item functioning.
Applied Psychological Measurement, 18, 315-338.
Pate, R. R. (1983). A new definition of youth fitness. The Physician and Sports medicine.
11(4), 77-83.
Pate, R. R. (1985). Norms for college students: Health related physical fitness test.
Reston, VA: American Alliance for Health, Physical Education, Recreation and
Dance.
Pate, R. R. (1994). Fitness testing: Current approaches and purposes in physical
education. In R. R. Pate & R. C. Hohn (Eds.), Health and fitness through
physical education. Champaign, IL: Human Kinetics.
Ponthieux, N. A., & Barker, D. G. (1963). An analyses of the AAHPER Youth Fitness Test.
Research Quarterly, 34, 525-526.
Powers, S. K., Dodd, S. L., & Noland, V. J. (2006). Total fitness and wellness (4th ed.).
San Francisco, CA: Pearson Education.
Purya, B. (2007). Local dependency and Rasch measures. Rasch Measurement
Transactions, 21(3), 1105-1106.
Pyke, J. (1987). Australian health and fitness survey. Adelaide: ACHPER.
Rankinen, T., Church, T. S., Rice, T., Bouchard, C., & Blair, S. N. (2007).
Cardiorespiratory fitness, BMI, and risk of hypertension: The HYPGENE study.
Medicine & Science in Sports & Exercise, 39(10), 1687-1692.

160
Rarick, G. L., & Dobbins, D. A. (1975). Basic components in the motor performance
of children six to nine years of age. Medicine and Science in Sports, 7, 105-110.
Rasch, G. (1960). Probabilistic models for some intelligence and attainment tests (Reprint,
with Foreword and Afterword by B. D. Wright, Chicago: University of Chicago
Press, 1980). Copenhagen, Denmark: Danmarks Paedogogiske Institut.
Ross, J. G., & Pate, R. R. (1987). The national children and youth fitness study II: A
summary of findings. Journal of Physical Education, Recreation and Dance, 58,
51-56.
Rowlands, A. V., Eston, R. G., & Ingledew, D. K. (1999). Relationship between activity
levels, aerobic fitness, and body fat in 8- to 10-yr-old children. Journal of Applied
Physiology, 86(4), 1428-1435.
Safrit, M. J. (1981). Evaluation in physical education. Englewood Cliffs, NJ:
Prentice-Hall.
Safrit, M. J. (1990). The validity and reliability of fitness tests for children: A review.
Pediatric Exercise Science, 2(1), 9-28.
Safrit, M. J., Zhu, W., Costa, M. G., & Zhang, L. (1992). The difficulty of Sit-up tests: An
empirical investigation. Research Quarterly for Exercise and Sport, 63(3), 277-283.
Sharkey, B. J. (1991). New dimensions in aerobic fitness: Current issues in exercise
science. Champaign, IL: Human Kinetics.
Silverman, S., Keating, X. D., & Phillips, S. R. (2008). A lasting impression: A
pedagogical perspective on youth fitness testing. Measurement in Physical
Education and Exercise Science, 12(3), 146-166.
Smith, A. B., Rush, R., Fallowfield, L. J., Velikova, G., & Sharpe, M. (2008). Rasch fit
statistics and sample size considerations for polytomous data. BMC Medical

161
Research Methodology, 8. Retrieved July 7, 2009, from
http://www.biomedcentral.com/1471-2288/8/33
Smith, E. V., Jr. (2001). Evidence for the reliability of measures and the validity of
measure interpretation: A Rasch measurement perspective. Journal of Applied
Measurement, 2, 281-311.
Smith, E. V., Jr. (2002). Detecting and evaluating the impact of multidimensionality using
item fit statistics and principal component analyses of residuals. Journal of Applied
Measurement, 3(2), 205-231.
Smith, R. M., & Miao, C. Y. (1992). Assessing unidimensionality for Rasch measurement.
In M. Wilson (Ed.), Objective measurement: Theory into practice (pp. 316-327).
New Jersey: Ablex.
Stevens, S.S. (1959). Measurement, psychophysics and utility. In C. W. Churchman & P.
Ratoosh (Eds.), Measurement: Definitions and theories. New York: John Wiley.
Stratton, G., Canoy, D., Boddy, L. M., Taylor, S. R., Hackett, A. F., & Buchan, I.E. (2007).
Cardiorespiratory fitness and body mass index of 9-11-year-old English children: A
serial cross-sectional study from 1998 to 2004. International Journal of Obesity,
31(7), 1172-1178.
Stratton, G., & Williams, C. A. (2007). Children and fitness testing. In E. M. Winter, A. M.
Jones, R. C. R. Davison, P. D. Bromley, & T. H. Mercer (Eds.), Sport and exercise
physiology testing guidelines (pp. 211-223). NY: Routledge.
Strong, D. R., Kahler, C. W., Ramsey, S. E., & Brown, R. A. (2003). Finding order in the
DSM-IV nicotine dependence syndrome: A Rasch analyses. Drug and Alcohol
Dependence, 72(2), 151-162.
Tesio, L. (2003). Measuring behaviours and perceptions: Rasch analyses as a tool for
rehabilitation research. Journal of Rehabilitation Medicine, 35(3), 105-115.

162
The Cooper Institute. (2004). Fitnessgram/activitygram test administration manual (3rd
ed.). Champaign, IL: Human Kinetics.
Thorsen, L., Nystad, W., Stigum, H., Hjermstad, M., Oldervoll, L., Martinsen, E. W., et al.
(2006). Cardiorespiratory fitness in relation to self-reported physical function in
cancer patients after chemotherapy. Journal of Sports Medicine and Physical Fitness,
46(1), 122-127.
To, C. Y. (1985). Physical Fitness of Children in Hong Kong. Hong Kong, China: The
Chinese University of Hong Kong Press.
Tortolero, S. R., Taylor, W. C., & Murray, N. G. (2000). Physical activity, physical fitness
and social, psychological and emotional health. In N. Armstrong & W. Van
Mechelen (Eds.), Paediatric exercise science and medicine (pp. 273-293). Oxford:
Oxford University Press.
Twisk, J. W. R., Kemper, H. C. G., & Van Mechelen, W. (2000). Tracking of activity and
fitness and the relationship with cardiovascular disease risk factors. Medicine &
Science in Sports & Exercise, 32(8), 1455-1461.
U.S. Department of Health and Human Services. (1996). Physical activity and health: A
report of the surgeon general. Atlanta, GA: Author.
Vehrs, P., & Hager, R. (2006). Assessment and interpretation of body composition in
physical education. Journal of Physical Education, Recreation & Dance, 77(7),
46-51.
Verhelst, N. D., & Glas, C. A. (1995). The one parameter logistic model. In G. H. Fischer
& I. W. Molenaar (Eds.), Rasch models: Foundations, recent developments, and
applications (pp. 215-237). NY: Springer.
Wainer, H., & Mislevy, R. J. (2000). Item response theory, item calibration, and
proficiency estimation. In H. Wainer, N. J. Dorans, R. Flaugher, B. F. Green, R. J.

163
Mislevy, L. Steinberg, & D. Thissen (Eds.), Computerized adaptive testing: A primer
(2nd ed.). Mahwah, NJ: Lawrence Erlbaum.
Waugh, R. F., (2002). Creating a scale to measure motivation to achieve academically:
Linking attitudes and behaviours using Rasch measurement. British Journal of
Educational Psychology, 72(1), 65-86.
Waugh, R. F. (2003). Measuring attitudes and behaviors to studying and learning for
university students: a Rasch measurement model analyses. Journal of Applied
Measurement, 4(2), 164-180.
Waugh, R. F., Hii, T. K., & Islam, A. (2000). An approach to studying scale for students in
higher education: a Rasch measurement model analyses. Journal of Applied
Measurement, 1(1), 44-62.
Weaver, C. (2005). Using the Rasch model to develop a measure of second language
learners' willingness to communicate within a language classroom. Journal of
Applied Measurement, 6(4), 396-415.
Weiss, D. J. (Ed.). (1983). New horizons in testing: Latent trait test theory and
computerized adaptive testing. New York: Academic Press.
Welsman, J. R., & Armstrong, N. (2007). Interpreting performance in relation to body
size. In N. Armstrong (Ed.), Paediatric exercise physiology. London: Elsevier.
Williams, C. S., Harageones, E. G., Johnson, D. J., & Smith, C. D. (2000). Personal
fitness: Looking good / feeling good (4th ed.). Dubuque, IA: Kendall/Hunt
Publishing Company.
Williams, P. T. (2001). Physical fitness and activity as separate heart disease risk factors:
A meta-analyses. Medicine & Science in Sports & Exercise. 33(5), 754-761.
Wolfe, E. W., & Chiu, C. W. T. (1999). Measuring change across multiple occasions using
164
the Rasch rating scale model. Journal of Outcome Measurement, 3(4), 360-381.
World Health Organization. (1998). Obesity: Preventing and managing a global epidemic.
Report of a WHO Consultation on Obesity. Geneva: Author.
World Health Organization. (2002). A physical active life through everyday transport.
Retrieved August 1, 2006, from http://www.euro.who.int/document/e75662.pdf
Wright, B.D. (1996) Local dependency, correlations and principal components. Rasch
Measurement Transactions, 10(3), 509-511.
Wright, B.D. (1997). A history of social science measurement. Educational Measurement:
Issues and Practice, 16(4), 33-45.
Wright, B. D., & Masters, G. N. (1982). Rating scale analyses. Chicago, IL: MESA Press.
Wright, B. D., & Mok, M. M. C. (2000). Rasch models overview. Journal of Applied
Measurement, 1(1), 83-106.
Wright, B. D., & Panchapakesan, N. (1969). A procedure for sample-free item analyses.
Educational and Psychological Measurement, 29, 23-48.
Wright, B. D., & Stone, M. H. (1979). Best test design. Chicago: MESA Press.
Zaichkowsky, L. D., & Larson, G. A. (1995). Physical, motor, and fitness development in
children and adolescents. Journal of Education, 177(2), 55-79.
Zhu, W. (2001). An empirical investigation of Rasch equating of motor function tasks.
Adapted Physical Activity Quarterly, 18(1), 72-89.
Zhu, W., & Cole, E. L. (1996). Many-faceted Rasch calibration of a gross motor
instrument. Research Quarterly for Exercise and Sport, 67(1), 24-34.
Zhu, W., & Kurz, K. A. (1994). Rasch partial credit analyses of gross motor competence.
Perceptual & Motor Skills, 79(2), 947-961.

165
Zhu, W., & Safrit, M. J. (1993). The calibration of a sit-up task using the Rasch Poisson
Counts Model. Canadian Journal of Applied Physiology, 18(2), 207-219.
Zhu, W., Timm, G., & Ainsworth, B. (2001). Rasch calibration and optimal categorization
of an instrument measuring women’s exercise perseverance and barriers. Research
Quarterly for Exercise and Sport, 72(2), 104-116.

166
APPENDIX A
DATA USE AGREEMENT