Embed Size (px)
Citation preview

R5
10
JournaChemi
Cite this: D
www.rsc.o
This journal is
Electron
Low TemMolybd
Essy Kouad
Received (in XXDOI: 10.1039/
S1. Charact
Fig. S1. TEM im1, (B) 2, (C)
cysteamine, (ISEM imag
Table S1. Crysta
pH Lat
a/Å 12 4
8 9
5 6.127
±0.042
3 7.397
±0.248
2 10.588
1 3.858
±0.125
l of Mastry
DOI: 10.10
org/xxxxxx
© The Royal S
nic Supp
mperatuenum O
dio Fodjo,a D
XXX, XXX) Xth /b000000x
terization of
mages of silver m 3, (D) 5, (F) 8 an) 1 by converting
ge of silver molyb
alline parameters
ttice parameters b/Å c
4.078 ±0.003
9.312 ±0.002
13.079 ± 0.102
7±0
5.445 ±0.044
5±0
± 0.019 14.
013.886 ±
0.042 3.70
aterials
039/c0xx00
Society of Chem
plementa
ure SynthOxides
Da-Wei Li,*
XXXXXXXXX
f silver moly
molybdenum oxidend (G) 12 using gg Ag2Mo2O7 usingbdenum oxide syn
of synthesized si
Intc/Å α/º
.978 0.065
90 1
.742 0.099
90 9
.972 ± .061 739 ± .031
0000x
mistry [year]
ary Infor
hesis and
a Niamien P
X 20XX, Accept
ybdenum ox
e synthesized at pglucose, (H) 1 usig cysteamine, andnthesized at pH 8
lver molybdenum
eraxial angle β/º γ/º90
90
14.5±5.2 90
92.4±5.3 90
90 120
90
rmation
d SERS
Paulin Mariu
ted Xth XXXXX
xides
pH (A) ing d (E) 8.
F25
Theof in bnan70
obtparin Tof wthe75
obtm oxides.S1,S2,S3
Nature of cº
Cubic Ag/
Cubic Ag2
0 Monoclinic A
0 Monoclinic Ag
0 Hexagonal Ag
OrthorhombiMoO
Applica
us,b Trokour
XXXXX 20XX
Fig. S2. SEM ima
e synthesized pnanowires covebasic media, thnospheres aggrtained at pH =rameters of as-sTable S1. As dwhich constitut
e pH, and diftained.
crystal Stna
/Mo* Na
MoO4 Nag
Ag2Mo2O7Nanow
b
g/β-MoO3Nanow
b
g/h-MoO3Nanow
bic Ag/α-3
Nanowb
Dy
[j
ation of S
rey Albertb
age of silver molyusing g
products as indiered by Ag nanhe nanomaterialegation. It shou= 2, are hexagsynthesized prodisplayed in Tabted nanomateriafferent morpho
tructure of nomaterial anospheres anosphere
ggregations wires covered y Ag NPs wires covered y Ag NPs wires covered y Ag NPs wires covered y Ag NPs
ynamic Art
journal], [year],
Silver
and Yi-Tao
ybdenum oxide syglucose
icated in Fig. Snoparticles in aals are essentialould be noted tgonal (Fig. S2oduct at differenable S1, the sizeals decrease wh
ology and crys
SizNanowires/nm
~
65
70-300
70-400
100-500
200-800
ticle Links
Pape
, [vol], 00–00
Long,*a
ynthesized at pH
S1, are constituacidic media whlly nanosphereshat the nanowi). The crystallnt pH are assigne the nanopartichith the increasestalline types
ze of m Ag NPs/n~70
5-80
6-13
6-16
10-29
7-25
►
er
| 1
2
uted hile s or ires line ned cles e of are
nm
Electronic Supplementary Material (ESI) for Journal of Materials Chemistry AThis journal is © The Royal Society of Chemistry 2013

Journal of Materials Chemistry
Cite this: DOI: 10.1039/c0xx00000x
www.rsc.org/xxxxxx
Dynamic Article Links ►
Paper
This journal is © The Royal Society of Chemistry [year] [journal], [year], [vol], 00–00 | 2
Fig. S3. UV-Vis spectrum of as synthesized Ag NPs
S2. As-synthesized Ag NPs absorption spectrum
The synthesized Ag NPs (Fig. S3) show a UV-Vis absorbance 5
peak at λ ~400 nm which is in accordance with previous work.S4
These kinds of Ag NPs have a size distribution between 9 and 15 nm.
Fig. S4. Monitoring of AgxMoxO4x-1 transformation to Ag/Ag2MoO4 using 10
UV-Vis spectroscopy.
S3. Conversion of AgxMoxO4x-1 (Ag/α-MoO3, Ag/β-MoO3, Ag/h-MoO3 and Ag2MoO7) binaries to Ag/Ag2MoO4
The transformation process of the mixture Ag:AgxMoxO4x-1 (x = 15
1, 2) in 97:3 %wt ratio was explored to determine the composition of the nanomaterials of SERS substrate (Si@Ag/AgxMoyOz). UV-Vis and Raman spectroscopy was used accordingly. Fig. S4 displays the spectra recorded at different times after mixing Ag NPs and AgxMoxO4x-1. As can be seen, 20
narrowing of the band peak between 320 and 440 nm (overlapping peaks of Mo6+ at ~350 nm and Ag NPs at ~400 nm towards ~400 nm) is observed, along with an increase in peak intensity (~230 nm and ~400 nm) with time. The disappearance of the peak at ~350 nm (narrowing of broad peak in the range 25
320-440 nm towards ~ 400 nm) could be due to the disappearance of Mo6+ in an octahedral coordination while the increase in peak intensity at ~230 nm and ~400 nm may be due to the appearance of Mo6+ in tetrahedral coordination, and the growth of Ag NPs size respectively. Such tetrahedral coordination environment only 30
exists in Ag2MoO4.S5 Furthermore, the Raman spectra obtained
after 6 h reaction time (Fig. S5) showed the same profile and all the peaks are assigned to Ag2MoO4, thus confirming the results of UV-Vis. Accordingly, it is evident that AgxMoxO4x-1 is transformed to Ag/Ag2MoO4, and the transformation process 35
seems to follow the reaction equation (S1) below:S6
→ (S1)
Where = {1, 2}.
40
Fig. S5. Raman spectra of obtained product from the mixture of 97:3 %wt ratio of Ag NPs:AgxMoxO4x-1 after 6 h reaction time.
Electronic Supplementary Material (ESI) for Journal of Materials Chemistry AThis journal is © The Royal Society of Chemistry 2013
This journal is © The Royal Society of Chemistry [year] Journal Name, [year], [vol], 00–00 | 3
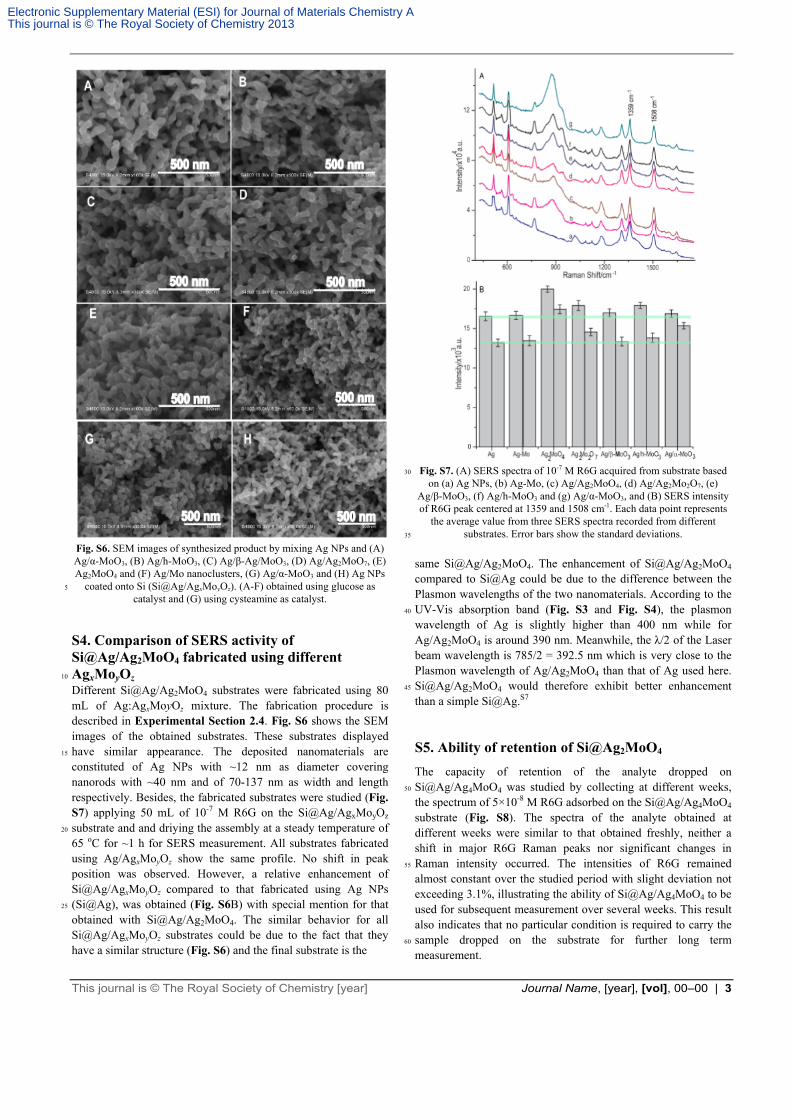
Fig. S6. SEM images of synthesized product by mixing Ag NPs and (A) Ag/α-MoO3, (B) Ag/h-MoO3, (C) Ag/β-Ag/MoO3, (D) Ag/Ag2MoO7, (E) Ag2MoO4 and (F) Ag/Mo nanoclusters, (G) Ag/α-MoO3 and (H) Ag NPs
coated onto Si (Si@Ag/AgxMoyOz). (A-F) obtained using glucose as 5
catalyst and (G) using cysteamine as catalyst.
S4. Comparison of SERS activity of Si@Ag/Ag2MoO4 fabricated using different AgxMoyOz 10
Different Si@Ag/Ag2MoO4 substrates were fabricated using 80 mL of Ag:AgxMoyOz mixture. The fabrication procedure is described in Experimental Section 2.4. Fig. S6 shows the SEM images of the obtained substrates. These substrates displayed have similar appearance. The deposited nanomaterials are 15
constituted of Ag NPs with ~12 nm as diameter covering nanorods with ~40 nm and of 70-137 nm as width and length respectively. Besides, the fabricated substrates were studied (Fig. S7) applying 50 mL of 10-7 M R6G on the Si@Ag/AgxMoyOz substrate and and driying the assembly at a steady temperature of 20
65 oC for ~1 h for SERS measurement. All substrates fabricated using Ag/AgxMoyOz show the same profile. No shift in peak position was observed. However, a relative enhancement of Si@Ag/AgxMoyOz compared to that fabricated using Ag NPs (Si@Ag), was obtained (Fig. S6B) with special mention for that 25
obtained with Si@Ag/Ag2MoO4. The similar behavior for all Si@Ag/AgxMoyOz substrates could be due to the fact that they have a similar structure (Fig. S6) and the final substrate is the
Fig. S7. (A) SERS spectra of 10-7 M R6G acquired from substrate based 30
on (a) Ag NPs, (b) Ag-Mo, (c) Ag/Ag2MoO4, (d) Ag/Ag2Mo2O7, (e) Ag/β-MoO3, (f) Ag/h-MoO3 and (g) Ag/α-MoO3, and (B) SERS intensity of R6G peak centered at 1359 and 1508 cm-1. Each data point represents
the average value from three SERS spectra recorded from different substrates. Error bars show the standard deviations. 35
same Si@Ag/Ag2MoO4. The enhancement of Si@Ag/Ag2MoO4 compared to Si@Ag could be due to the difference between the Plasmon wavelengths of the two nanomaterials. According to the UV-Vis absorption band (Fig. S3 and Fig. S4), the plasmon 40
wavelength of Ag is slightly higher than 400 nm while for Ag/Ag2MoO4 is around 390 nm. Meanwhile, the λ/2 of the Laser beam wavelength is 785/2 = 392.5 nm which is very close to the Plasmon wavelength of Ag/Ag2MoO4 than that of Ag used here. Si@Ag/Ag2MoO4 would therefore exhibit better enhancement 45
than a simple [email protected]
S5. Ability of retention of Si@Ag2MoO4
The capacity of retention of the analyte dropped on Si@Ag/Ag4MoO4 was studied by collecting at different weeks, 50
the spectrum of 5×10⁻⁸ M R6G adsorbed on the Si@Ag/Ag4MoO4 substrate (Fig. S8). The spectra of the analyte obtained at different weeks were similar to that obtained freshly, neither a shift in major R6G Raman peaks nor significant changes in Raman intensity occurred. The intensities of R6G remained 55
almost constant over the studied period with slight deviation not exceeding 3.1%, illustrating the ability of Si@Ag/Ag4MoO4 to be used for subsequent measurement over several weeks. This result also indicates that no particular condition is required to carry the sample dropped on the substrate for further long term 60
measurement.
Electronic Supplementary Material (ESI) for Journal of Materials Chemistry AThis journal is © The Royal Society of Chemistry 2013

4 | Journal Name, [year], [vol], 00–00 This journal is © The Royal Society of Chemistry [year]
Fig. S8. Raman spectra collected from Si@Ag/Ag4MoO4 substrate stored with 10-7 M R6G at different weeks: (a) 0, (b) 1, (c) 2, (d) 3, (e) 4 and (f)
5 weeks. 5
However, it can be noticed that the peak at ~870 cm-1 disappeared after one week of storage of the substrate. This disappearance might suggest that Ag2MoO4 underwent relative deterioration. As Ag/Ag2MoO4 is known to be a good catalyst 10
and as the SERS spectra are not really deteriorated, it can be assumed that Ag2MoO4 undergoes reduction and thus producing Ag and Mo and involving R6G degradation.S8,S9 These new Ag NPs might maintain the SERS enhancement.
S6. Quantification of Si@Ag/Ag4MoO4 15
For a quantitative analysis, the SERS spectra of solution with different concentrations of R6G ranging from 1×10-14 to 3×10⁻¹² M were measured. The SERS spectra of R6G adsorbed on the Si@Ag/Ag2MoO4 substrate, and the intensity profile of the peaks at 610, 1359 and 1508 cm-1 (assigned to the aromatic C–C ring in 20
plane bend and stretching modesS10) as a function of the concentration of R6G are shown in Fig. S9A and Fig. S9B respectively. Increase in peak intensity as function of concentration was observed. It was found that each peak intensity was linearly proportional to the logarithmic concentration of R6G 25
within the range of 1~300×10-14 M with regression equations I (a.u.) = 97051.4+6902.3Log(C/M), R2 = 0.91; I (a.u.) = 64199.0+4520.1Log(C/M), R2 = 0.96 and I (a.u.) = 54430.3+3803.2Log(C/M), R2 = 0.97 for 610, 1359 and 1508 cm-
1 respectively. The observed limit of detection for R6G is 1×10-14 30
M, suggesting that Si@Ag/Ag2MoO4 has a good sensitivity. The SERS enhancement factor (EF) is one of crucial parameter to demonstrate the performance of the substrate. Herein, we estimate this parameter from the standard equation defined as:
(S1) 35
where ISERS and IRS correspond to the Raman intensity of diagnostic band of the R6G adsorbed on the Si@Ag/Ag2MoO4 substrate and the normal Raman respectively; NSERS and NRS are the mole number of R6G under SERS and normal Raman
conditions respectively, taking into account that the experimental 40
conditions, such as the laser wavelength, laser power, microscope objective lens, and measuring conditions on the substrate are identical in all cases. NSERS and NRS are calculated using the Equation S2 assuming that the surface A of the substrate is equivalent at any position point. As a result, a high EF of ~5×10⁸ 45
could be obtained when using CSERS of 10−11 M (ISERS = 14.1 u.a.) and WRS of 1.2 mg (IRS = 440.5 u.a.). The reason for this SERS performance may be attributed to the hot spots or active sites which could coexist between two adjacent Ag/Ag2MoO4 in the nanomaterials film. In this case, R6G molecules adsorbed on 50
these hot spots or active sites might produce strong enhancement.S11
ƒ .
.133 (S2)
Where r = 5 m is beam radius, No = V×CSERS the mole number of R6G dropped on the substrate (V = 50 mL, the volume 55
dropped on the substrate), NRS =WRS/M (M = 479 g/mol is molar mass of R6G) and A = 1cm×1cm the surface of Si sublayer. The factor ƒsh takes into account the shielding of exciting and scattering of light by the nanoparticles. Here, 0.25 has been taken as ƒsh value. 60
The enhancement could be due to the main role that might play Ag2MoO4 in this substrate. It is well known that the presence of nanomaterials supporting Ag nanoparticles could result in a largest electric field near the sharpest surface, thus increasing the local surface plasmon resonance and producing an excellent 65
enhancement.S12,S13 More hot spots or active sites could coexist between two adjacent Ag/Ag2MoO4 nanostructures in the film. In this case, R6G molecules adsorbed on these hot spots or active sites might produce strong enhancement.S14 70
Fig. S9. (A) Raman spectra of R6G at different concentrations: (a) 1, (b) 5, (c) 15, (d) 50, (e) 125 and (f) 300×10-14 M, and (B) plots of intensity as a function of the logarithmic concentration of R6G at 610 cm-1, 1359 cm-1
and 1508 cm-1. Each data point represents the average value from three 75
SERS spectra recorded from different substrates. Error bars show the standard deviations.
Electronic Supplementary Material (ESI) for Journal of Materials Chemistry AThis journal is © The Royal Society of Chemistry 2013

This journal is © The Royal Society of Chemistry [year] Journal Name, [year], [vol], 00–00 | 5
Fig. S10. Raman spectra of (a) Si@Ag/Ag2MoO4 substrate, (b) 5×10⁻⁶ M
aniline, (c) 5×10⁻⁵ M ascorbic acid, (d) 1×10⁻⁷ M dopamine hydrochloride, (e) 5×10⁻⁹ M paraphenylenediamine and (f) their mixture.
5
S7. Determination of target molecule in complex matrices
Four target molecules (aniline, ascorbic acid, dopamine hydrochloride and para-phenylenediamine) were dropped on Si@Ag/Ag2MoO4 and dried . Fig. S10 displays Raman spectra of 10
individual analyte (Fig. S10b-e) and in their mixture (Fig. S10f). As highlighted in yellow, ring in plane deformation peak (1076 cm-1) of aniline,S15 OH out-of-plane deformation peak (725 cm-1) of ascorbic acid,S16 C-O-H symmetric in-plane bending vibrations of dopamine hydrochloride (1270 cm-1),S17 and C-H in plane 15
bending vibration (1165 cm-1) of para-phenylenediamine,S18 could be used as specific peaks to detect the target molecule in the mixture.
Notes and references 20
a Key Laboratory for Advanced Materials & Department of Chemistry. East China University of Science and Technology, 130 Meilong Road, Shanghai, 200237 P. R. CHINA, Tel./fax: +86-21- 64250032. E-mail: [email protected]. b Laboratoire de Chimie Physique. Université de Cocody. 22 BP 582 25
Abidjan 22, Abidjan, Côte d'Ivoire. S1 L. Cheng, Q. Shao, M. Shao, X. Wei, and Z. Wu, J. Phys. Chem. C
2009, 113, 1764. S2 D. Stone, J. Liu, D.P. Singh, C. Muratore, A. A. Voevodin, S.
Mishra, C. Rebholz, Q. Ge, and S. M. Aouadi, Scripta Mater. 2010, 30
62, 735. S3 D. P. Singh, B. Sirota, S. Talpatra, P. Kohli, C. Rebholz, and S. M.
Aouadi, J Nanopart Res. 2012, 14, 781. S4 C.-N. Lok, C.-M. Ho, R. Chen, Q.-Y. He, W.-Y. Yu, H. Sun, P. K.-
H. Tam, J.-F. Chiu, and C.-M. Che, J. Proteome Res. 2006, 5, 916. 35
S5 Y. V. Plyuto, I. V. Babich, I. V. Plyuto, A. D. V. Langeveld, and J. A. Moulijin, Colloid Surface A 1997, 125, 225.
S6 E. Wenda, J. Therm. Anal. 1998, 53, 861. S7 E. Hutter and J.H. Fendler, Adv. Mater. 2004, 16, 1685-1706. S8 M. Feng, M. Zhang, J.-M. Song, X.-G. Li and S.-H. Yu, ACS Nano 40
2011, 5, 6726-6735. S9 J.C. Juarez and R. Morales, Metall. and Mater. Trans. B 2008, 39,
738-745. S10 A. Weiss, and G Haran, J. Phys. Chem. B 2001, 105, 12348.
S11 E. K. Fodjo, S. Riaz, D.-W. Li, L.-L. Qu, N. P. Marius, T. Albert, and 45
Y.-T. Long, Anal. Methods 2012, 4, 3785. S12 J.-L. Yao, J. Tang, D.-Y. Wu, D.-M. Sun, K.-H. Xue, B. Ren, B.-W.
Mao, and Z.-Q. Tian, Surf. Sci. 2002, 514, 108. S13 L. M. Chen, L. B. Luo, Z. H. Chen, M. L. Zhang, J. A. Zapien, C. S.
Lee and S. T. Lee, J. Phys. Chem. C, 2010, 114, 93. 50
S14 J. Hao, M. J. Han, Z. Xu, J. Li and X. Meng, Nanoscale Res. Lett., 2011, 6, 263.
S15 M. Ilic, E. Koglin, A. Pohlmeier, H. D. Narres, and M. J. Schwuger, Langmuir 2000, 16, 8946.
S16 C. Y. Panicker, H. T. Varghese, and D. Philip, Spectrochim. Acta A 55
2006, 65, 802. S17 S. Gunasekaran, R. Thilak Kumar, and S. Ponnusamy, India J. Pure
Ap. Phy. 2007, 45, 884. S18 E. Akalin, and S. Akyuz, J. Mol. Struct. 2001, 563-564, 579. 60
Electronic Supplementary Material (ESI) for Journal of Materials Chemistry AThis journal is © The Royal Society of Chemistry 2013