Embed Size (px)
Citation preview


2
THIS PAGE IS BLANK
i
INTRODUCTION TO ECONOMIC ANALYSIS PAGE
CHAPTER I INTRODUCTION A. What This Book is About................................................................................ 1 B. The Audience.................................................................................................. 1 CHAPTER II THE PROCESS A. Background..................................................................................................... 3 B. The Elements of the Process.......................................................................... 3
1. Establishing Objectives......................................................................... 3 2. Choosing Alternatives........................................................................... 4 3. Formulating Assumptions...................................................................... 6 4. Determining Costs and Benefits........................................................... 7 5. Comparing Costs and Benefits and Ranking....................................... 8 6. Testing Alternatives Under Uncertainty................................................ 9
CHAPTER III INPUT--ESTIMATING COSTS A. Preface--The Approach Input vs Output......................................................... 10 B. Two Costing Methods..................................................................................... 10
1. Industrial Engineering Method.............................................................. 10 2. Parametric Cost Estimating.................................................................. 12
C. Data Sources.................................................................................................. 12 D. Developing CER's........................................................................................... 13 E. Ingredients for Parametric Analysis................................................................. 13 F. Pitfalls.............................................................................................................. 14 G. Judgment........................................................................................................ 14 H. Input--Cost and Time....................................................................................... 15
1. Present Value ....................................................................................... 15 2. Treatment of Inflation............................................................................. 18 3. Treatment of Uncertainty....................................................................... 19
ii
4. Sunk Costs and Incremental Costs........................................................ 20
CHAPTER IV OUTPUT--JUDGING BENEFIT A. Preface............................................................................................................ 21 B. Procedures...................................................................................................... 22
1. Determine and Define Benefits Relevant for Each of the Alternatives of the Economic Analysis............................................ 22
2. Determine Sources of Information for Benefits Listed in Step 1.................................................................................... 25
3. Collection of Information for Benefit Determination............................... 27 4. Summarization, Evaluation & Presentation of Benefits.........................28
CHAPTER V COMPARING ALTERNATIVES A. Preface............................................................................................................ 31 B. The Process--Graphic Analysis........................................................................ 32 C. Conclusion--What To Do with the Results of the Analysis............................... 38 CHAPTER VI A GUIDE FOR REVIEWERS A. The Objective, Assumptions & Alternatives...................................................... 41 B. The Cost Estimate............................................................................................ 41 C. The Benefit Determination................................................................................ 41 D. Selecting from Alternatives............................................................................... 42 DEFINITION OF TERMS......................................................................................... 43

iii
PREFACE
This handbook was reprinted five times in its original edition. The continuing high demand motivated a second edition, which added Chapter IV, “Output--Judging Benefit.” This was written by the Benefit/Output Determination Committee of the Defense Economic Analysis Council and represented an update of benefit determination procedures.
The forward to the first edition has been retained because it presents in succinct form the underlying concept of Economic Analysis.
The Defense Resources Management Institute has updated and is reproducing this
booklet for use by participants in its courses at the Naval Postgraduate School in Monterey, California, and other interested parties.
Defense Resources Management Institute 1522 Cunningham Road, Rm 106 Naval Postgraduate School Monterey, CA 93943-5201, USA
DSN: 878-2104/2306 Commercial: (831) 656-2104/2306 www.nps.navy.mil/drmi/

iv
THIS PAGE IS BLANK

v
FOREWORD
This handbook is a result of the effort by the Defense Economic Analysis Council, Handbook Committee, representing the Services and Agencies of the Department of Defense. It is designed as a starting point for personnel who have little or no experience with Economic Analysis. The Council is guided by the thoughts of the Assistant Secretary of Defense (Comptroller), The Honorable Robert C. Moot:
". . . We will review some common-sense ideas, that are not at all complicated, and see a few simple, practical examples of the application of Economic Analysis. Economic Analysis has much in common with value engineering, cost reduction programs, and cost-benefit staff studies. The Economic Analysis program is, in fact, our attempt at borrowing the best or most practical features of each of these rather different programs and bringing them together in a consolidated set of guidelines. These guidelines can be easily understood and meaningfully applied by all managers from the lowest to the highest level within your Departments.” In discussing what might be done to further the use of Economic Analysis, Mr. Moot
said:
“First, under our participatory management philosophy, the initiative of defining priority areas for doing economic analyses and program evaluations is left to the DOD components. The components are also responsible for assuring that appropriate analyses are included in the decision process.”
“The second point I want to emphasize is that the job ahead, as I see it, is to reform and strengthen an existing system, not to establish a new one. In my judgment, there already exists within the Department a vast amount of manpower and other resources dedicate to performing analysis and reviewing, and using the products of analysis. Our goal is to pull all those individual efforts together.”
“Third, the idea that Economic Analysis must be integrated into the
existing decision process is not new, but it is critical. An analysis should be prepared at the operational level and reviewed by those having a primary responsibility for the success of a program or project. We do not intend for Economic Analysis to become the sole factor in making decisions about efficient use of resources. But it is becoming increasingly apparent that new funding requirements are difficult to justify if local managers have not made a suitable Economic Analysis to back up their decisions. This does not mean, of course, that every project supported by an Economic Analysis will be funded. It does mean that the decision-
vi
maker should at least know the costs and benefits of his actions, and what trade-offs have been indicated in his decisions. To quote a computer manufacturer’s recent ad, ‘No one can take the ultimate we ight of decision-making off your shoulders. But the more you know about how things really are, the lighter the burden will be.’ I believe thorough Economic Analysis of the management problems you face will provide better overall visibility and will assist in your decision-making. The fourth point I want to make is that managers need not be experts in Economic Analysis to get the most benefits from its use -- just as you needn’t be a computer systems analyst to have the computer do things for you. There are capable staffs available to perform Economic Analyses -- but, you must initiate their use and consider the results in arriving at your decisions. Resource Management problems coming to you for decision should have been subjected to an economic analysis by your staffs.”
“Most of the tools and techniques comprising and supporting
Economic Analysis are relatively simple -- they are not sophisticated, esoteric, or far-out -- and they can be used by people with general as opposed to technical backgrounds and experience.”
It is with these thoughts in mind that we present, “The Economic Analysis Handbook.”
EDMUND W. EDMONDS, JR. Colonel, USAF Chairman, Defense Economic
Analysis Council
1
INTRODUCTION CHAPTER I A. WHAT THIS BOOK IS ABOUT
Every manager devotes considerable time and effort to planning for the future, and every plan is concerned primarily with allocating scarce resources. This book explains a process which will aid the manager in making resource allocation decisions. This method of approaching a complex problem of choice is called Economic Analysis.
Economic Analysis concerns the basic problem of economic choice (value received for value sacrificed) and as such, has been applied by each of us implicitly and informally whenever we've made a decision in the market place. This handbook formalizes that decision process. However, our objective is not to present a "cookbook" of detailed procedures, nor is it to deal with abstract concepts. Rather, it attempts to promote understanding of economic analysis concepts and methodology so that these techniques may be used as tools for effective decision making at all echelons within the Department of Defense.
The general format for an Economic Analysis involves the determination of the cost and benefit of each future course of action. Through a cost-benefit or cost-effectiveness analysis the decision maker can utilize a set of facts and figures to select a preferred means of achieving certain goals. After specifying the objectives and assumptions, devising appropriate alternative courses of action, costing these alternatives, and determining the benefits or effectiveness of each alternative, a preferred action or investment may be chosen. The criterion used by the decision maker is the maximization of benefit minus cost if the two are commensurable (e.g., both measured in dollars) or, if they are not, the maximization of benefits for a given cost, or the achievement of a given performance objective at a minimum cost. B. THE AUDIENCE
This book was written in order to establish a procedural routine for personnel who have little or no experience with economic analysis. It will also be of value to those supervisors and functional managers who must initiate or review economic analyses. For those who cannot read this book in its entirety, an adequate knowledge of the methodology of economic analysis can be obtained from Chapter II, "The Process," with special attention to the outline of the method. Additionally, the supervisor or functional manager should become familiar with the "Guide for Reviewers," Chapter VI. Lower echelons are encouraged to develop detailed procedures for analysis appropriate to their missions by using the general procedural routine presented in this Document.

2
THIS PAGE IS BLANK

3
THE PROCESS CHAPTER II A. BACKGROUND
Economic analysis is a conceptual framework for systematically investigating problems of choice. An economic analysis postulates alternative means of satisfying an objective and investigates the costs and benefits of each of these alternatives. This orderly, comprehensive presentation of the important considerations of each alternative assists the manager in making and reviewing decisions. It does this by:
(a) Focusing informal thinking.
(b) Surfacing hidden assumptions, making clear their logical implication
(c) Providing an effective vehicle for communicating the considerations which support a recommendation.
The methodology of economic analysis is depicted on the following pages of this
chapter. The next three chapters of the handbook serve to further define the final three steps of the process. Chapter III discusses the procedures and techniques to be used in estimating costs. Chapter IV delineates a method for determining benefit. Finally, Chapter V presents a method for ranking alternatives and testing the conclusions. B. THE ELEMENTS OF THE PROCESS
The key elements of an economic analysis are: (1) Establishing and defining the goal or objective desired, (2) Searching out hypothetical alternatives for accomplishing the objective, (3) Formulating appropriate assumptions, (4) Determining the cost (inputs) and benefits (outputs) of each alternative, (5) Comparing costs and benefits of all alternatives and ranking the alternatives, and (6) Testing the sensitivity of major uncertainties on the outcome of the analysis. 1 - Establishing Objectives
The most important step in analysis is the first step, the definition of the objective. Most simply stated, an objective is some fixed standard of accomplishment. In establishing an objective, we concurrently and implicitly establish the criteria by which we will measure the relative benefits and costs of each alternative.
In every instance, whether the objective is to provide logistic support, or field an effective weapon system or to provide an organization able to function in terms of quantity, time or degree; the objective of the manager is to best achieve the planned mission of his organization.
4
We may, then, categorize the objective of an analysis according to its impact on the
mission of an organization. There are four levels of abstraction upon which the organization's mission can be
defined. From the least abstract to the most, they are: (1) Basic Activity: The number of man-hours or units of work performed. Examples are: engine hours, aircraft flying hours, hours manned, instructor platform hours. When basic activities are evaluated against a standard or against costs, they fall within a unit's "management indicator" program, (2) Organizational Product: What is produced by an organization. For example, personnel trained, engines repaired, weapons delivered, etc. This form of mission description is applicable to those organizations with a defined, physical output. Organizational products are also used in management indicator programs, (3) Extra-Organizational Value: These include the products or activity of the immediate organization expressed in terms of the benefits received by other organizations or organization levels. For example, the quality of engines repaired, adequacy of persons trained, or tactical assistance as a result of accurate weapons delivery. This is empirical, after the-fact-data that is not necessarily tracked or measured. (4) Social Values: Public benefits which are equally available to all regardless of whether they were directly associated with the organization that provided them. For example: National defense, law enforcement, public highways, environmental control, etc. The definition of this mission level has proved extremely difficult to narrate.
By relating the objective to the current mission of the organization we can establish certain criteria for judging each suggested alternative. For example, each of 100 persons must be trained to perform an error-free overhaul of an aircraft engine after 80 platform hours of instruction or less. We have established three criteria: 100 persons must be trained, their training must be completed in 80 hours or less, and they must be able to execute perfectly what they have learned. 2 - Choosing Alternatives
Once the objective of an economic analysis has been stated, the next step is to determine all feasible means or ways of meeting the objective.
It is the analyst's job to study all feasible alternatives and to present to the decision maker those alternatives most cost effective. This calls for a great deal of skill on the part of the analyst and a certain amount of interaction with the decision maker so that the proper a priori judgments can be made. Often, one who prepares an economic analysis is directed to select alternatives in keeping with certain constraints, e.g., manpower, facilities or funding limitations. This, in itself, tends to eliminate some alternatives. Despite the a priori rejection of some alternatives, it is only through the reiteration of the analysis for many alternatives that the analyst may feel secure in his final recommendation.

5
6
3. Formulating Assumptions Assumptions are statements made to support and reasonably limit the scope of a
study. Because an assumption is a "given" as opposed to a "fact" and relates to a future occurrence, it involves a degree of uncertainty. For this reason, regardless of the degree of impact they might have on the analysis, it is strongly recommended that all assumptions pertinent to its preparation be so identified, for the use of undocumented assumptions detracts from the credibility of an analysis.
Additionally, it is important that we do not confuse assumptions with facts or attempt to ease our role by utilizing assumptions when, with research, factual data could be presented. For example, if we are considering landfill as an alternative to solving a disposal problem stemming from increased waste, we might include in the study, the assumption that sufficient land for this operation is available within a 20 mile radius of the installation. However, in this particular instance, there may have been no obstacle preventing us from the research necessary to present this element of data as a fact rather than as an assumption.
Two very significant assumptions that must be made in all economic analyses concern the "economic life" of each alternative and the period over which we will compare the alternatives. a. Economic Life.
The economic life of a capital investment project is the period of time over which the benefits to be gained from a project may reasonably be expected to accrue. Benefit from a project is limited ultimately by its physical life. This is the period a facility or piece of equipment will be available before it is exhausted in a physical sense, that is, decayed or deteriorated. The economic life of a project is further limited by its technological life. That is the period before which improved technology makes the building, machine, etc., obsolete. The economic life of a project may further be limited by military or political considerations which may suggest benefit accrual for a much shorter period. The economic lives of the alternatives will ultimately govern the time period to be covered by an economic analysis. Economic life is a key variable and it is important to make the best possible determination.
Maximum economic lives are established for the categories of investments listed below even though the equipment or facilities involved may have a physical or technological life of a greater number of years: Automatic Data Processing Equipment - 8 years; Buildings - 25 years; Operating Equipment - 10 years; Utilities, Plants, and Utility Distribution systems -25 years (this category includes investment projects for electricity, water, gas, telephone, and similar utilities); Weapon/Support Systems - The maximum economic life will vary by type of weapon or support system.
7
In general, the economic life will be measured against a stipulated level of threat, or represent the period during which a given mission or function is required or can be supported. Also, if the economic life of a system is expected to be less than the specified maximum life, the shorter life must be used for purposes of the analysis. b. The Period of Comparison.
It is one thing to ascertain the life expectancy of each of our alternatives; it is quite another to appropriately compare these lives within the analysis. When faced with two or more alternatives with different economic lives, the analyst must make an assumption as to when to begin the period of comparison.
The decision maker may state, early in the analysis, at which point in time he wishes any one or all of the alternatives to begin yielding benefits. Given this point in time, the analyst can then determine the first year in which expenditures must be made to satisfy the ''benefit yield date" as set by the decision maker. If the decision maker fails to provide this "benefit yield date," the analyst must arrange the expenditures so that the alternatives begin to produce benefits in the same year.
In either case, the first year in which expenditures will have to be made for any one of the alternatives should be considered the base year or year "1" for all alternatives. For example, it is possible for option A to require investment costs for three years before yielding benefit, while option B has zero costs for that year. This imposes an appropriate interest cost to finance the alternative which requires a longer lead time.
The period of comparison extends through the time during which an asset will perform, or a service will be rendered, according to some established standard of benefit. When an alternative's benefits fall below this standard, its useful life has ended. The alternative with the longest economic life may determine the end of the comparison period. However, the decision maker or analyst may shorten this period consistent with the objectives and assumptions of the analysis. Whether the longest or the shortest life is used as a basis, adjustment for unequal life is required. If the shortest life is used the residual values of the alternatives with longer lives must be recognized in the cost computation for those alternatives. Should the longest life be used to establish the time period of the analysis the cost of extending the benefit producing years of those alternatives with a shorter life must be recognized. Care should be exercised to insure that the complete and valid costs for each alternative for the entire length of the analysis are presented to the decision maker. Another alternative would be to use the Uniform Annual Cost method as a means of comparison.
4 - Determining Costs and Benefit. There are certain formal techniques for conducting a cost analysis. They are explained
in some detail in Chapter III. There are three methods for analyzing costs. Two are supported by a defined formal process. The third is largely dependent upon the judgment of
8
the cost analyst. They are the parametric method and the analogy method. The appropriate estimating method must be determined and exercised by the analyst to arrive at the estimated cost of each alternative. Formal costing techniques normally require the services of a costing specialist. Cost analysts are available within the Comptroller function in most commands. However, adequate cost estimates may be made without the assistance of a cost analyst. The adequacy of the cost analysis must be judged by the decision maker within the context of the problem.
An economic analysis is most effective when applied to situations in which output can be defined in terms of physical yield. It may, however, be applied with less precision where the outputs are not quantifiable and must be accurately defined and measured in terms of relative benefit.
The determination of value or benefit is a tenuous and difficult decision. However, a method for quantifying the more tangible aspects of benefit is presented in Chapter IV. It consists of four steps: (a) Determine, List and Define Relevant Benefits, (b) Establish Sources of Information for Benefit Determination, (c) Collect and Display Information for Benefit Determination, and (d) Summarize, Evaluate and Present Benefit Determination for Alternatives of the Economic Analysis. 5 - Comparing Costs and Benefits and Ranking the Alternatives
The actual comparison of each alternative in terms of its cost and benefit is accomplished in this step. If we can measure cost and benefit -on continuous scales we may use a graphical method of comparison. We start by tabulating and then plotting the cost versus the benefit for each alternative with the high benefit for the low cost. If one alternative is strictly dominant over all time periods and for all levels of effectiveness and cost, we have strict dominance and we can rank our alternatives immediately. Unfortunately, this is not usually the case. It is necessary to constrain the problem in a way that one alternative will be preferable to the others. Thus, we select either a fixed cost or fixed benefit schedule and determine how the alternatives will vary over time. Our analysis may then be repeated for inflated (current year) dollars if necessary, and finally a ranking of alternatives can be made.
The analyst may rank alternatives by one of three general criteria. These criteria
conform to the three basic types of cost/benefit relationships: Unequal Cost/Equal Effectiveness, Equal Cost/Unequal Effectiveness, and Unequal Cost/Unequal Effectiveness. The three criteria are: (a) Least cost for a given level of effectiveness, (b) Most effectiveness for a given cost constraint, (c) Largest ratio of effectiveness to cost.
The first two criteria are easier to handle than the third. The problem with the third criterion is that it tends to wash out levels of expenditure and relative capabilities of the alternatives. For example, the effectiveness to cost ratio of 1:10 applies to an option whose effectiveness is rated at 1000 and whose cost is $10,000 and to a much more austere option whose effectiveness is 10 and whose cost is only $100. The ratio of effectiveness to
9
cost should be used as a criterion only when costs or capabilities are reasonably close for each of the alternatives. 6 - Testing Alternatives Under Uncertainty
Since most important decisions involve elements of uncertainty, an ideal economic analysis should address those areas of uncertainty about the state of the world in the future (technologically, politically, etc.). Techniques that are often used are contingency analysis, sensitivity analysis, and "a fortiori" analysis.
Contingency analysis is the investigation of how the ranking of alternatives holds up when a relevant change in criteria for evaluating the alternatives is postulated, or a major change in the general environment is assumed.
Sensitivity analysis can be applied in a situation where there are a few key parameters about which the analyst is very uncertain. Instead of using expected values for these parameters, the analyst may use several values (say, high, medium, and low) in an attempt to see how sensitive the ranking of the alternatives is to variations in the uncertain parameters.
"A fortiori" analysis is applicable to decision problems where generally accepted intuitive judgment strongly favors one alternative. However, based on preliminary analysis, it appears to the analyst that this alternative might be a poor choice and another may be most advantageous. In performing the analysis of the two, the analyst can deliberately resolve the major uncertainties in favor of the generally favored alternative, and see how the other alternative compares under these adverse conditions. If the latter still looks good, the analyst has a strong case in its favor.
Apart from the usefulness of the techniques discussed above in a direct analytical
sense, they may also contribute insights that can lead to a new alternative that will provide a reasonably good hedge against a range of the more significant uncertainties. This may be difficult to do, but if it can be accomplished, it will offer one of the best ways to compensate for uncertainty.
This is the process of economic analysis. It must be remembered that it is only a tool and should be responsive in its application to the problem, the environment and especially, the prerogatives of the decision maker. The decision maker wants facts. An economic analysis attempts to supply him with these facts so that logical decisions can be made.

10
THIS PAGE IS BLANK

11
INPUT - ESTIMATING COSTS CHAPTER III A. PREFACE: THE APPROACH - INPUT VS OUTPUT
Once we have chosen discrete hypothetical alternatives which may satisfy our objectives, we must reduce each of these alternatives to its most general components. Each alternative will have some "input" (the cost of achieving benefit, worth or yield) and "output" (benefit, worth or yield). This chapter suggests an approach for determining the input (costs) necessary to accomplish future courses of action. B. TWO COSTING METHODS There are many methods for conducting a cost estimate; including Industrial Engineering, Parametric, Analogy, & Factor Costing.1 The two most frequently used methods are described below:
1. Industrial Engineering Method: This approach consists of a consolidation of estimates from various separate work segments into a total project estimate. As an example, the estimated cost of production of a new model "widget," consisting of work contributions from 10 separate work divisions in a plant, could well be a consolidation of 10 separate and detailed estimates, each of which may be composed of several estimates itself.
Estimating by engineering methods is based on extensive knowledge of the system characteristics. It is necessary for the analyst to have a detailed knowledge of the system, the production processes, and the production organization. In using the engineering method, the system or item of hardware is broken down into its lower level components and estimates of each component are made. Parametric methods are usually used in estimating the costs of these components, and the results are combined with estimates of the costs of integrating the components to arrive at a total system cost. An advantage to this method is that it separates the parts of the system on which little data is available and which require special treatment.
However, the detail required for an engineering analysis is not always available to a government cost analyst, thus making this approach difficult to apply. The time expended for each operation such as setup, milling, and filing, must be multiplied by a labor rate and each of these costs must then be added to reach the total cost. The approach is sometimes difficult to apply, even by the vendor. For an example, one large aerospace firm judges that the use of this approach to estimate the cost of an airframe requires more than
1See for example, the Air Force’s The AFSC Cost Estimating Handbook,
Directorate of Cost Analysis, Wright Patterson AFB, Ohio 45433.

12
4000 separate estimates. Additionally, each individual making his separate estimate often has insufficient
information available to make a reliable estimate, and little means to evaluate inherent errors. Therefore, a cost estimate combined from as few as 10 separate estimates also combines the errors in each of those estimates and, in aggregate forms, there is no means of evaluating the errors involved or the level of uncertainty in the estimate.
However, where detailed cost data exist, the Industrial Engineering Method is the best
method for estimating costs.
2. Parametric Cost Estimating: In parametric cost estimating, the total cost of an alternative is based upon ascribed physical and performance characteristics and their relationships to highly aggregated component costs. In other words, a functional relationship must be set up between the total cost of the alternative and the various characteristics or parameters of the alternative. In the formal sense, the term "parameter" is defined as a cost-related explanatory attribute which may assume various values during a particular calculation. For our purposes, it is best to consider a parameter of an alternative as a definable characteristic of that alternative; one of the parts that can be added to give an expression of the value of the whole system, device, or item. Parametric cost estimating is applicable to many situations encountered within the DoD; for this reason, it will be covered in some detail.
The result of a parametric estimate depends directly upon the ability of the analyst to establish relationships between the attributes or elements that make up the alternative. That is, our first job must be to properly choose and then describe the cost influencing factors of the alternative. The descriptions of these factors are called Cost Estimating Relationships (CER). C. DATA SOURCES
Sources for linking the parameters of an alternative to costs include: expert opinion, catalog prices by item, industrial engineering standards, cost estimating relationships for analogous programs, and specific cost estimating relationships.
The data from all these sources are both historical and statistical. That is, we will normally be dealing with relationships that have been established by using statistics from the cost histories of prior programs. Because of this, when using cost/parameter relationships we must keep in mind two things: (1) the uncertainty inherent in the extrapolation of statistics, and (2) whether the indicated relationship is logically sound and reasonable.
The first problem is unavoidable. However, the influence of the second can be diminished through careful checks of the derived relationships. This can be accomplished through inspection, simple test data plots, or by more complicated techniques which

13
involve looking at the parameter over a range of possible values. The more complicated techniques should be left to the qualified Cost Analyst. However, obviously unreasonable relationships can be intuitively analyzed and corrected. When benefit (for example, greater speed) is inversely associated with cost, the relationship should be investigated before attempting to derive the predicted cost of the alternative.
D. DEVELOPING CERs
Central to any parametric analysis of cost, is the development of valid Cost Estimating
Relationships. CERs are developed from the historical cost of like systems and the parameters (e.g., weight, maximum speed, load capacity) of these systems. The statistical technique normally applied to developing CERs from historical cost and parametric data is called regression analysis. Regression analysis is primarily concerned with the determination of the equation of a line or curve which will predict how one variable (e.g., cost) will vary with respect to some parameter (e.g., load capacity).
The techniques of regression analysis are relatively sophisticated and should be used only by an individual familiar with statistical methods. For our purposes, it is sufficient to know that after a regression analysis is conducted, the statistical analyst will provide the manager with first, and most important, the estimating equation, and next, two measures of the usefulness of this equation:
1. The standard error of the estimate. This will show the variance associated with the prediction made from the estimating equation; it expressed how useful the estimating equation is as a tool;
2. The coefficient of correlation. This will express the closeness with which one variable (e.g., load capacity) influences the other variable (cost). Put another way, it measures to what extent the variation of cost is due to the variation in load capacity or whether an amount of the variation in cost is due to certain factors that are not explained by the changes in load capacity. E. INGREDIENTS FOR PARAMETRIC ANALYSIS We can derive a parametric cost estimate of our alternative if we have:
1. The existence of historical cost/parameter information on like systems.
2. The ability to predict with some degree of likelihood the expected parameters of our future alternative; (e.g., weight, maximum speed, or payload).
3. A competent statistical analyst who can tell us if the historical costs of the like systems do vary in some defined way with the chosen parameters. If they do, he will give us the estimating equation. F. PITFALLS
14
Some factors to consider and pitfalls to be avoided when deriving or reviewing CERs
are:
1. Be aware of the source of the estimate, and the purpose for which it is intended. Regardless of the integrity of the individual analyst, it should be expected that some personal or organizational bias may creep in. Contractors naturally want to sell their products or services, and their interests may be served by a high estimate. In this regard you would have an advantage if you have a broad range of historical cost data from several sources while the same data may not be available to private contractors. Application of statistical analysis or simple analogy can give you an excellent means of checking estimates provided from other sources.
2. A simple check of the equations used in cost estimating relationships, along with common sense, will often indicate whether or not the relationship is a reasonable one. The pitfall to be avoided is that an equation may adequately describe one system but not be predictive of another.
3. Consistency of data is essential. When combining data for a regression sample, for instance, it is usually necessary to adjust dollar figures into constant year dollars. Because labor and materials may have not increased at the same rate it may be necessary to consider each separately. If actual expenditure for equipment still in the design state will take place in the future, it may also be necessary to consider inflation factors. In the area of physical characteristics, one must further insure that such common terms as weight, speed, and distance are measured in like units. Often conversion is necessary to be certain that all elements of the sample are indeed compatible.
4. Care must also be taken to insure that historical cost data, which may be accumulated from several sources, truly reflects the actual costs incurred. Accounting differences among studies and contractors could easily result in wide variations in the costs actually included.
5. Finally, do not become so enamored with an estimating model that you ignore the assumptions made in its development, and the reliability of the sample input data. A computer will furnish an impressive and detailed readout, even if the input data is unreliable. Carefully scrutinize sample data, data sources, and assumptions made in developing estimating relationships. G. JUDGMENT
In cases where there are no qualified cost analysts available, or where there is little or no historical information on the specific alternative, or when the cost estimate is required so quickly that an extensive data search is precluded, we must base our cost estimate entirely on expert judgment. Even in cases where we have cost analysts, historical information, and time available and can adopt a formal method of costing, judgment must
15
be used to reach conclusions not directly supported by data. Expert judgment may be used to construct CERs, or to check their behavior when they extend significantly beyond the data base, or when the data base is too small to be statistically significant.
A specialized method of judgment, called the analogy method, may be used to
estimate costs by making direct comparisons with historical information on like or similar existing alternatives or their components. It is, in fact, the most widely used method of analysis to date, although it is surely not the most accurate. The major caution of the analogy method is that it is basically a judgment process and, as a consequence, requires a considerable amount of expertise if it is to be done successfully. There are two types of analogues that may be used. One is based upon similar products and the other upon similar concepts. Similar products can be compared such as using cost data on commercial aircraft. Secondly, when a new concept or system must be costed, experience gained on a different product may be used. An example of this is estimating missile production costs based on aircraft production experience.
The necessity of using experienced judgment to fill gaps in data has long been recognized. In some cases the majority, or even the entirety, of our cost estimate must be based upon judgment. The complexity of the problem, the predisposition of the manager, the point of view of the analysis, the importance of the project (in terms of both mission and finances), and the availability of qualified statistical analysts, all determine the extent of analysis, necessary. The keynote in using judgment must be reasonableness tempered with a large dose of impartiality. Moreover, judgment must always be identified as what it is, a guess, albeit an educated guess. H. INPUT - COST AND TIME
1. Present Value: Most expenditures will be time phased. Since there is time value to
money, it is necessary to determine when the expenditure for the alternative will be made. Economic analysis expands cost analysis activities by examining the effects of the time-value of money on the investment decision. Once cost estimates have been generated, they must be time-phased to allow for alternative expenditure patterns. The time value of money is considered by computing present value costs. Present value costs are computed by applying a discount rate to the time-phased expenditure amounts. The present value costs are the sum total of the discounted costs. The present value of $100 payable in two years can be defined as the amount of money necessary to invest today at compound interest in order to have $100 in two years. Thus, present value depends on the rate of interest, the frequency of compounding, and the time horizon selected.
The present value of the alternative is the money cost which would be required to finance the alternative when a specified percentage could be earned, this then represents the "opportunity cost" of capital. Assuming equal benefits, the alternative whose present value cost is least is the more desirable, because it implies a more efficient allocation of resources. The lowest present value cost means that resources are allocated more efficiently in the sense that fewer current resources must be diverted to satisfy the
16
requirement.
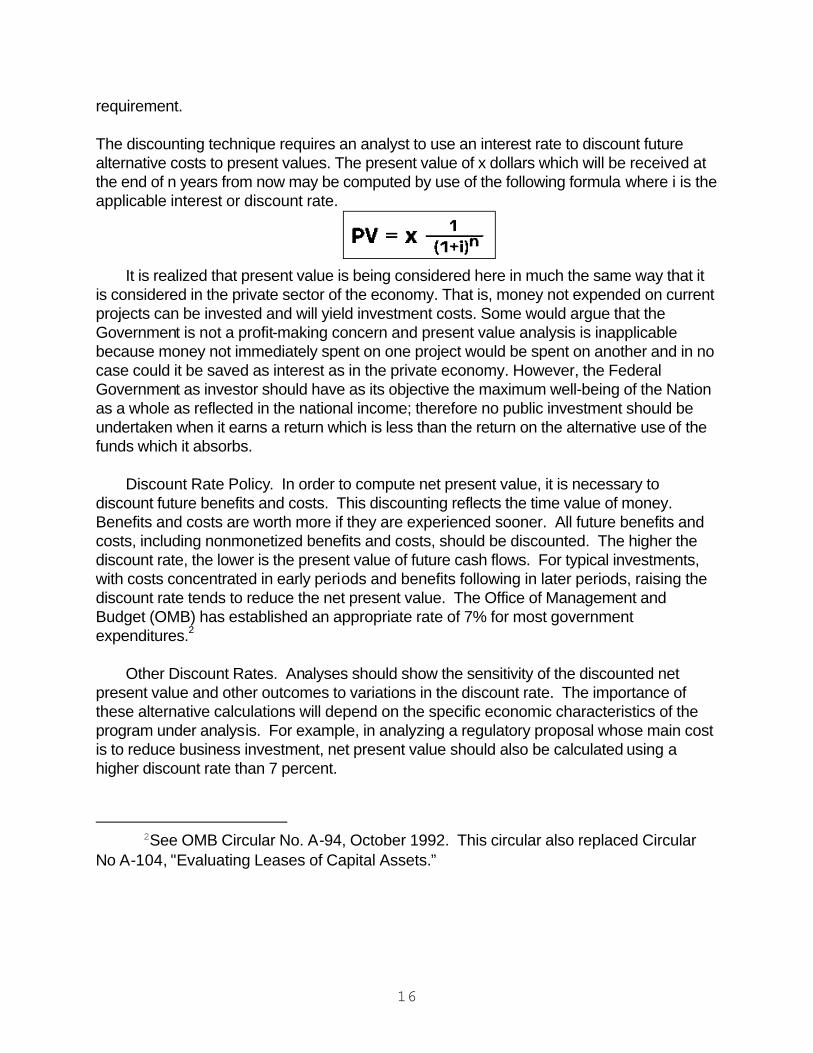
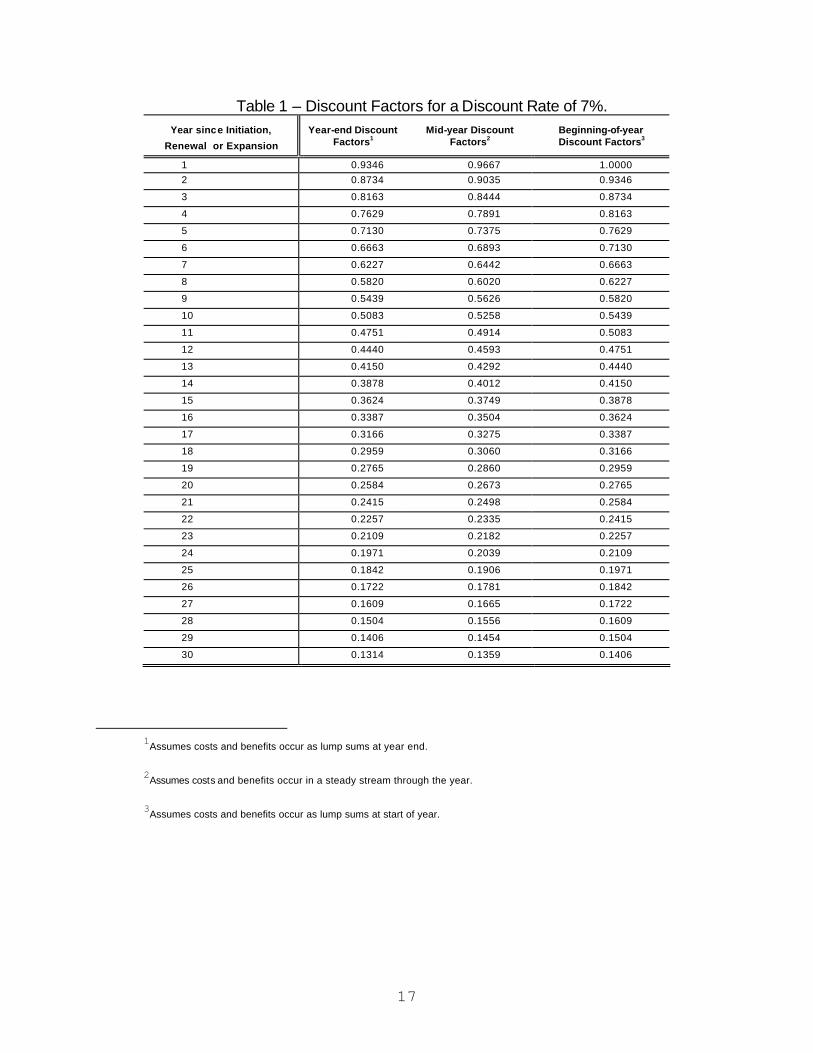
The discounting technique requires an analyst to use an interest rate to discount future alternative costs to present values. The present value of x dollars which will be received at the end of n years from now may be computed by use of the following formula where i is the applicable interest or discount rate.
It is realized that present value is being considered here in much the same way that it
is considered in the private sector of the economy. That is, money not expended on current projects can be invested and will yield investment costs. Some would argue that the Government is not a profit-making concern and present value analysis is inapplicable because money not immediately spent on one project would be spent on another and in no case could it be saved as interest as in the private economy. However, the Federal Government as investor should have as its objective the maximum well-being of the Nation as a whole as reflected in the national income; therefore no public investment should be undertaken when it earns a return which is less than the return on the alternative use of the funds which it absorbs.
Discount Rate Policy. In order to compute net present value, it is necessary to discount future benefits and costs. This discounting reflects the time value of money. Benefits and costs are worth more if they are experienced sooner. All future benefits and costs, including nonmonetized benefits and costs, should be discounted. The higher the discount rate, the lower is the present value of future cash flows. For typical investments, with costs concentrated in early periods and benefits following in later periods, raising the discount rate tends to reduce the net present value. The Office of Management and Budget (OMB) has established an appropriate rate of 7% for most government expenditures.2
Other Discount Rates. Analyses should show the sensitivity of the discounted net
present value and other outcomes to variations in the discount rate. The importance of these alternative calculations will depend on the specific economic characteristics of the program under analysis. For example, in analyzing a regulatory proposal whose main cost is to reduce business investment, net present value should also be calculated using a higher discount rate than 7 percent.
2See OMB Circular No. A-94, October 1992. This circular also replaced Circular
No A-104, "Evaluating Leases of Capital Assets.”
17
Table 1 – Discount Factors for a Discount Rate of 7%.
Year since Initiation,
Renewal or Expansion
Year-end Discount
Factors1
Mid-year Discount
Factors2
Beginning-of-year Discount Factors3
1 0.9346 0.9667 1.0000 2 0.8734 0.9035 0.9346
3 0.8163 0.8444 0.8734
4 0.7629 0.7891 0.8163
5 0.7130 0.7375 0.7629
6 0.6663 0.6893 0.7130
7 0.6227 0.6442 0.6663
8 0.5820 0.6020 0.6227
9 0.5439 0.5626 0.5820
10 0.5083 0.5258 0.5439
11 0.4751 0.4914 0.5083
12 0.4440 0.4593 0.4751
13 0.4150 0.4292 0.4440
14 0.3878 0.4012 0.4150
15 0.3624 0.3749 0.3878
16 0.3387 0.3504 0.3624
17 0.3166 0.3275 0.3387
18 0.2959 0.3060 0.3166
19 0.2765 0.2860 0.2959
20 0.2584 0.2673 0.2765
21 0.2415 0.2498 0.2584
22 0.2257 0.2335 0.2415
23 0.2109 0.2182 0.2257
24 0.1971 0.2039 0.2109
25 0.1842 0.1906 0.1971
26 0.1722 0.1781 0.1842
27 0.1609 0.1665 0.1722
28 0.1504 0.1556 0.1609
29 0.1406 0.1454 0.1504
30 0.1314 0.1359 0.1406
1Assumes costs and benefits occur as lump sums at year end.
2Assumes costs and benefits occur in a steady stream through the year.
3Assumes costs and benefits occur as lump sums at start of year.
18
This technique helps the decision maker evaluate whether dimly perceived benefits are worth their present and future costs. The technique can be helpful in making comparisons of the costs of long-range programs that have different time horizons but have equal benefits. In focusing on cost profiles over time, discounting assures that wrong or uneconomical alternatives are not inadvertently accepted.
In discounting, cost estimates are taken as "givers" and future cash flows are then
made comparable in terms of their present value. Of course, to do this it is assumed that capital has a cost and that the timing of future cash flows is an important factor to consider. In short, discounting is not a cost estimating technique in the sense that it makes the figures more valid or accurate for the analysis. It is an adjustment to show the cost of capital, computed after the cost analysts use all their techniques to put their estimates together.
Both discounted and undiscounted costs are useful for analysis. Raw (undiscounted) costs are needed by the budgeteers for funding purposes and for determining the obligational authority required to finance proposed investments. Present value costs are necessary for making tradeoff analyses in project and force level selection. Discounting is important for planning.
2. Treatment of Inflation. Future inflation is highly uncertain. Analysts should avoid
having to make an assumption about the general rate of inflation whenever possible. Real or Nominal Values. Economic analyses are often most readily accomplished
using real or constant-dollar values, i.e., by measuring benefits and costs in units of stable purchasing power. (Such estimates may reflect expected future changes in relative prices, however, where there is a reasonable basis for estimating such changes.) However, where future benefits and costs are given in nominal terms, i.e., in terms of the future purchasing power of the dollar, the analysis should use these values rather than convert them to constant dollars as, for example, in the case of lease-purchase analysis.
Nominal and real values must not be combined in the same analysis. Logical
consistency requires that analysis be conducted either in one or the other. This may require converting some nominal values to real values, or vice versa.
Recommended Inflation Assumption. When a general inflation assumption is needed,
the rate of increase in the Gross Domestic Product deflator from the Administration’s economic assumptions for the period of the analysis is recommended. For projects or programs that extend beyond the six-year budget horizon, the inflation assumption can be extended by using the inflation rate for the sixth year of the budget forecast. The Administration’s economic forecast is updated twice annually, at the time the budget is published in January or February and at the time of the Mid-Session Review of the Budget in July. Alternative inflation estimates, based on credible private sector forecasts, may be used for sensitivity analysis.
3. Treatment of Uncertainty. Estimates of costs (and benefits) are typically uncertain

19
because of imprecision in both underlying data and modeling assumptions. Because such uncertainty is basic to many analyses, its effects should be analyzed and reported. Useful information in such a report would include the key sources of uncertainty; expected value estimates of outcomes; the sensitivity of results to important sources of uncertainty; and, where possible, the probability distributions of costs (and benefits and net benefits).
Characterizing Uncertainty. Analyses should attempt to characterize the sources and
nature of uncertainty. Ideally, probability distributions of potential benefits, costs, and net benefits should be presented. It should be recognized that many phenomena that are treated as deterministic or certain are, in fact, uncertain. In analyzing uncertain data, objective estimates of probabilities should be used whenever possible. Market data, such as private insurance payments or interest rate differentials, may be useful in identifying and estimating relevant risks. Stochastic simulation methods can be useful for analyzing such phenomena and developing insights into the relevant probability distributions. In any case, the basis for the probability distribution assumptions should be reported. Any limitations of the analysis because of uncertainty or biases surrounding data or assumptions should be discussed.
Expected Values. The expected values of the distributions of benefits, costs, and net
benefits can be obtained by weighting each outcome by its probability of occurrence, and then summing across all potential outcomes. If estimated benefits, costs, and net benefits are characterized by point estimates rather than as probability distributions, the expected value is the appropriate estimate for use.
Estimates that differ from expected values (such as worst-case estimates) may be
provided in addition to expected values, but the rationale for such estimates must be clearly presented. For any such estimate, the analysis should identify the nature and magnitude of any bias. For example, studies of past activities have documented tendencies for cost growth beyond initial expectations; analyses should consider whether past experience suggests that initial estimates of benefits or costs are optimistic.
Sensitivity Analysis. Major assumptions should be varied and net present value and
other outcomes recomputed to determine how sensitive outcomes are to change in the assumptions. The assumptions that deserve the most attention will depend on the dominant benefit and cost elements and the areas of greatest uncertainty of the program being analyzed. For example, in analyzing a retirement program, one would consider changes in the number of beneficiaries, future wage growth, inflation, and the discount rate. In general, sensitivity analysis should be considered for estimates of: (i) benefits and costs; (ii) the discount rate; (iii) the general inflation rate; and (iv) distributional assumptions. Models used in the analysis should be well documented and, where possible, available to facilitate independent review.

20
Other Adjustments for Uncertainty. The absolute variability of a risky outcome can be much less significant than its correlation with other significant determinants of social welfare, such as real national income. In general, variations in the discount rate are not the appropriate method of adjusting net present value for the special risks of particular projects. In some cases, it may be possible to estimate certainty-equivalents which involve adjusting uncertain expected values to account for risk.
. Requirements uncertainty is most noticed in the development of new systems. That is,
when a new system is conceived, its preliminary design seldom turns out to be very similar to the final design. Early estimates of cost for those systems have historically relied heavily upon the preliminary design information. It follows from this that if preliminary characteristics are in error, cost estimates relying on this information will also be in error.
The alternatives analyzed at unit level will not usually involve design considerations and their characteristics do remain constant. However, a cost estimate is still likely to contain error because cost estimating relationships (CERs) cannot be assumed to hold exactly. This means that in estimating a certain cost component as a function of some variable or variables, it is foolhardy to believe that the variables predict the particular cost with certainty.
There are other reasons why cost estimates may be incorrect. For example, errors may be introduced when one is forced to extrapolate beyond the range of the sample or data base from which the estimating relationship is derived. Errors are sometimes introduced by adopting different ground rules. Examples include the use of different discount rates, the use of different price rates, and the use of different price levels expected to prevail in future years.
4. Sunk Costs and Incremental Costs. If costs have been incurred as a result of past
decisions they are known as "sunk costs." Sunk costs should not be included in our cost calculations. Once a decision has been made which causes costs to be incurred, those costs are beyond the control of the current decision. Sunk costs no longer represent any alternative for the decision maker and, if included, would only confuse the decision making problem. The analyst should present only the future cost or "incremental cost" of each alternative. These are those increments of cost that will be incurred as the result of choosing one or another of the alternatives available. They may be looked upon as "consequential costs" since they are the consequences of the decision makers current choice.
21
OUTPUT - JUDGING BENEFIT CHAPTER IV A. PREFACE
The objective of this chapter is to discuss the basic considerations required to present (to the appropriate decision maker) an orderly, comprehensive and meaningful display of all returns (outputs, benefits, yields, worth) expected for each alternative within the scope of the economic analysis under consideration. The returns of each alternative should be expressed so that the decision maker is able to compare the various alternatives of the economic analysis. (For purposes of this handbook, the term "benefits" is used as the overall term for returns (output, products, services, yields, worth).)
By referring to the Chart, "The Process," you will note the position of our objective in the Economic Analysis Process shown as 4.b., "Determine Benefits." This display assists us in focusing on the broad nature of the benefit determination effort and gives a better understanding of the role that those determinations must play in deciding between alternatives.
General aids which apply to all analyses and which will be dealt with more fully in the "Procedures" section of this chapter are:
1. Use a systematic procedure to establish returns in order to minimize strictly subjective judgment.
2. Discover and record all the benefits, whether or not quantifiable, relevant for each of the alternatives developed in Item 2 of "The Process."
3. Express, if possible, the returns of each alternative in terms of a common denominator or a score.
4. Arrange returns according to some hierarchy of values if a common denominator not available.
The consistency and relevance of the benefits available must be carefully examined. An existing measure with which management is familiar has certain advantages in regard to ready acceptance as a benchmark, but it may not be relevant throughout the entire range of the study. The analyst should be as cautious in accepting a benefit measure just because it's there as he should be in introducing a new untried one that simply accommodates only an aspect of his study. The output information effort under DoD Instruction 7045.11, "Improvement and Use of Output Information in the Department of Defense Programming' Planning, and Budgeting System," dated December 17, 1970, and DoD Directive 5010.15, "Defense Integrated Management Engineering System, dated January 13, 1972, should be studied.
22
The Process chart indicates that in Items 1, 2 and 3 of any Economic Analysis: (a) the
objectives of the study are defined in detail, (b) the alternatives or solutions to meet the objectives are provided, and (c) the assumptions are formulated. We are then ready to determine the costs and benefits related to each of the alternatives as spelled out for the particular economic analysis. This chapter will attempt to outline how we go about determining the benefits of each of the options we feel could meet the objectives of the economic analysis problem. It is best, because of the state of the art, that only an overall methodological approach be used to guide our practitioner.
The following suggested Step-by-Step Procedure will greatly facilitate objective benefit determination. Step I - Determine, List and Define Relevant Benefits.
Step I - Determine, List and Define Relevant Benefits
Step II - Establish Sources of Information for Benefit Determination.
Step III - Collect and Display Information for Benefit Determination.
Step IV - Summarize, Evaluate and Present Benefit Determination for Alternatives of the Economic Analysis.
B. PROCEDURES
1. Determine and Define the Benefits Relevant for each of the Alternatives of the Economic Analysis,
a. Determine and list the benefits of each alternative -- whether the benefit is thought to be potentially quantifiable or not quantifiable. List all benefits which may possibly shed light on the economic analysis alternatives. It is quite possible that some of the benefits listed in this first attempt will eventually be discarded and others becoming evident further on in the analysis will be added to the list. For instance, if one method causes ten items to be produced and only two are needed, the greater productive capacity of this system may not be a plus factor. Other considerations may come into play such as availability of storage space, cost of storage, obsolescence, etc.
b. Define each benefit in relation to its respective alternative in the economic analysis. Describe each return as well as you can at this step. Remember that at any point in the Benefit Determination Procedure, new or previously unrecognized evidence may cause us to go back and retrace any one or several steps of the procedure.
During this process consideration should be given to the level of decision of the
economic analysis. For example: Let us assume that in a five-man warehouse at an

23
installation, we store spare parts on seven shelves. We are considering decreasing the layers of vertical shelving in order to obtain greater warehouse efficiency. Instead of having seven shelves, the items will be stored on five shelves so that all items will be accessible without using ladders (ladder is now used when pulling material from the two top shelves). (Although there may be other alternatives for this problem, such as mechanization, we will restrict ourselves for illustrative purposes.) In this case, the decision could be made by the local operating official and benefits related to economic effects on the community (if any) would not be germane; however, benefits related to customer service, employee morale, safety, etc., could well be considered.
However, if the investment is a large one, such as whether or not to consolidate field activities or buy some special equipment, the decision may be at the Service level (and in some cases, probably, at the OSD level). In such cases, benefit determination related to the economics of the community could be one of the determinants for selecting a particular alternative.
Each situation must be dealt with within the context of the total economic analysis under study.
There is no check list available with which to ascertain that all output returns for an alternative of an economic analysis have been included in the benefit determination, and that all are valid for the particular situation. However, in order to assist the analyst in selecting benefits germane to the study and, hopefully, in excluding spuriously related and nonsignificant information for the decision maker, characteristics such as the following could be reviewed when listing and defining benefits:
Discreteness: Is the benefit clearly and concisely identifiable from all of the other benefits? Does it overlap with any other measure? Is it duplicated? Maintain as separate an entity as is possible.
Quantification: Is the benefit directly/indirectly measurable using valid techniques available from the various disciplines used in analysis? If not, can some method for comparability be used? If quantification is not possible, can other techniques such as ranking, etc., be used decision purposes? Quantification is by no means essential for output information to be useful for analytical purposes, although precision and specificity are needed to the greatest feasible degree.
Discriminative: Is the benefit related to the alternative of the economic analysis? Is it discriminating in relation to the objective of the decision maker? Is it spuriously related to the purposes of the decision and should therefore be excluded?
Also, we will find that the benefits expected of any alternative may fall into various "categories" depending on the kind of program, systems, operation, organization, etc., that has been submitted for economic analysis. Terminology used for these categories is generally descriptive of the benefits included. These are not intended as definitive, but as
24
guides to the analyst in the effort to include all benefits related to an alternative. It should also be cautioned that the list is not intended to be all inclusive; it is only illustrative of some of the types of benefit categories that could be applicable depending on the problem. Some of the categories under which benefits appear are:
(1) Production: Number of commodities or items produced for each alternative. For example: Number of meals served, hours flown, components manufactured. This could be related to comparable time periods of the economic analysis (as in productivity).
(2) Productivity: (related to staffing benefits) number of items per man-hour, volume output related to man-hours.
(3) Operating Efficiency: At what rate does the system consume resources to achieve its output? For example, miles per gallon, copies per kilowatt hour, mean days per shipment.
(4) Reliability: This describes the system in terms of its probable failure rate. Useful measures may be mean-time-between-failure, the number of service calls per year, percent refusals per warehouse requests.
(5) Accuracy: What is error rate? Measure errors per operating time period. Number of errors per card punched, errors per hundred records, errors per 100 items produced, etc.
(6) Maintainability/Controllability: Has adequate human engineering been performed? Is the system compatible with adequately trained crew members? When the system does fail, is it difficult to repair because of poor accessibility? A useful measure could be based on the average man-hours necessary for repairs over a given time period, i.e., downtime, or the crew rate necessary to control and maintain the system.
(7) Manageability: Consider how the workload of the organization will be affected by increased or decreased supervision or inspection time as a result of the system. Man-days could be used as a measure; difference in kind of personnel might be a factor as well as availability of type needed.
(8) Integratability: Consider how the workload and product of the organization will be affected by the changes necessitated in modification of existing facilities or equipment, technical data requirements, initial personnel training, warehouse space for raw goods or parts storage, etc.
(9) Availability: When can each system be delivered/implemented; when is it needed to meet proposed output schedules? What is the lead time for spare parts delivery?
(10) Service Life: Consider how long the proposed system will affect the organization's workload or output. What about obsolescence?
25
(11) Quality: Will a better quality product/service be obtained? Could quality be
graded, thus measurable? If not, a description of improvement could be given. What is the impact of the varied quality?
(12) Acceptability: Consider the alternative in terms of whether it may interfere with the operation of parallel organizations or the operation of prerogatives of higher echelon organizations.
(13) Ecology: Consider the ecological aspects of each alternative. What are the current legislative requirements?
(14) Economic: Consider employment benefits, DoD small business obligations, economically depressed area relationships, legislative requirements.
(15) Morale: Employee morale. This could be measured by an opinion sample survey.
(16) Safety: Number of accidents, hazards involved.
(17) Security: Is security built in? Will more precautions be needed? More guards? Are thefts more likely?
Pertinent benefit categories will become evident as the analysis of the alternatives is performed. The benefits, of course, will be defined/ described in accordance with the requirements of each alternative under review. 2. Determine Sources of Information for Benefits Listed in Step 1.
a. Separate the Benefits defined in Step l into two lists as
List I. Benefits where Back-Up Information is Available. Benefits for which information are in usable form is easily obtainable. Next to each benefit listed, indicate source of information, in what form it is available, and in general terms, next to each benefit, how you propose to gather the needed information and the feasibility of doing so. Should the analyst decide that obtaining the needed information is impractical, for whatever reason, he should be able to support his position. This step applies to benefits which may be quantifiable as well as for those which do not seem quantifiable. It is best to obtain the maximum amount of information in estimating parameters. However, this may not always be feasible.
For example, if in Step 1 you have listed "Production of an Item," check actual data available to see if there are weeks, years, etc., of production records with data which could be used for actual production and estimating purposes when valid statistical or

26
other analytical techniques are used. If the immediate organization does not have such information, is it available for a comparable organization? Is prototype data available, etc. me statistician, mathematician, industrial engineer, etc., will be helpful in determining whether there are techniques available in the relevant disciplines that can be applied to substantive information in order to obtain the benefit determination needed for the economic analysis. (Applying various techniques to data already in the system could preclude the cost and time needed to gather additional data.)
For benefits not quantifiable even by ranking, rating, or related methods, list any appropriate available and reliable sources for narrative detail or use experience judgment sources.
List II. Benefits for Which Back-Up Information is not For the remaining benefits, or those for which no information sources have
been readily identified, the analyst will have to do some research in deciding how to obtain information for his benefit determination. Indicate next to each benefit the method proposed in order to obtain information.
In these instances, information may have to be obtained by conducting a 100
percent collection of relevant data for the benefit in question, a sample survey may be possible for obtaining data, field trips by experts conferring with experts may be needed, specialized libraries may serve as sources for relevant input, and other public agencies or private firms and institutions could prove helpful. The specific circumstance will decide the process.
As examples of what is meant by benefits for which information may not readily be available, we cite benefits such as morale of personnel, safety of an operation, etc. In these instances, a statistical sample could be used to produce the data for the system at hand and could be used as benchmark statistics for the related alternatives and for projection purposes. For a weapons system where data may not be available, a combination of parts of existing systems may serve the same purpose.
With the completion of Step 2 of this procedure, the analyst a. Identified and defined or described the benefits resulting from each
alternative required in the particular economic analysis.
b. Sources of information and/or methods for obtaining the information for each benefit.
We can now proceed to Step 3.
27
3. Collection of Information for Benefit Determination
a. Organize the method for collecting information for each benefit, collect the applicable data, and record the information for each alternative of the economic analysis.
b. It must again be emphasized that both the subject matter specialist and the individual knowledgeable in the disciplines concerned with formulating quantifiable and nonquantifiable outputs for analysis purposes must cooperate if adequate usable benefit determinations are to be established.
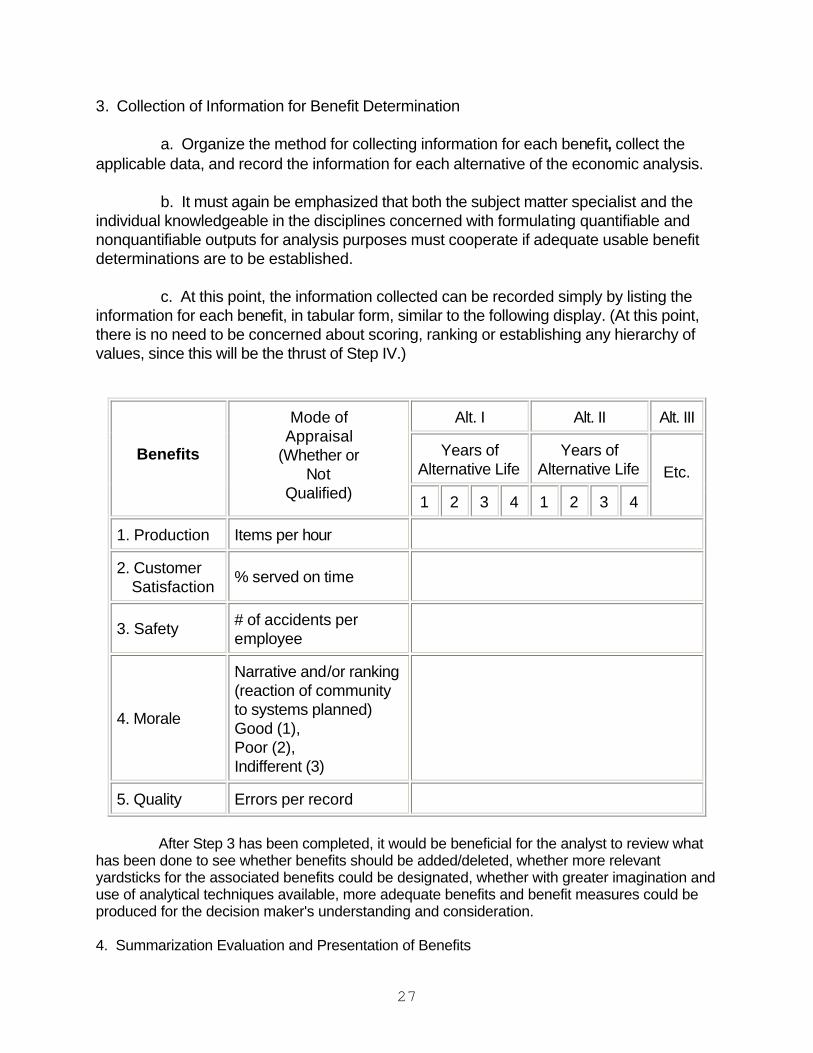
c. At this point, the information collected can be recorded simply by listing the information for each benefit, in tabular form, similar to the following display. (At this point, there is no need to be concerned about scoring, ranking or establishing any hierarchy of values, since this will be the thrust of Step IV.)
Alt. I Alt. II Alt. III
Years of Alternative Life
Years of Alternative Life
Benefits
Mode of Appraisal
(Whether or Not
Qualified) 1 2 3 4 1 2 3 4
Etc.
1. Production Items per hour
2. Customer Satisfaction
% served on time
3. Safety # of accidents per employee
4. Morale
Narrative and/or ranking (reaction of community to systems planned) Good (1), Poor (2), Indifferent (3)
5. Quality Errors per record
After Step 3 has been completed, it would be beneficial for the analyst to review what
has been done to see whether benefits should be added/deleted, whether more relevant yardsticks for the associated benefits could be designated, whether with greater imagination and use of analytical techniques available, more adequate benefits and benefit measures could be produced for the decision maker's understanding and consideration. 4. Summarization Evaluation and Presentation of Benefits
28
In order for benefit determination to be of value for decision maker, comparative
visibility of the benefits of each alternative is necessary. A generalized format, Tables 1 and 2 following, which should, of course, be varied to fit the specific situation, is shown for discussion purposes. The exact method of comparison and the tools and techniques to be used must be left to the analyst in conjunction with the subject matter and professional analytical personnel since proper ''weighing," quantitative and nonquantitative comparisons and over-all scoring of system dimensions will vary with different systems, organizations, programs, etc., being studied in the economic analysis.
Many techniques are available for comparing quantifiable benefits. Some which have been used include graphic analysis, regression analysis, indexing, decision theory, marginal analysis, ratios, linear programming, mathematical and economic statistical modeling. Nonquantifiable benefits may be analyzed by using certain nonparametric statistical techniques. A possible technique for weighing benefits might be a polling technique such as the Delphi method.
In this step, array the benefits and their respective data in order of significance of each benefit to the problem objective. Then, where possible, combine benefits to give a composite score for each alternative. In some problems, it may even be possible to calculate a score for the total alternative directly if data are in the same units. In any event, such consolidation will assist in the decision making process since it reduces some of the detail; however, the detail information for the individual benefits should be accessible. For example, in order to measure the benefit of different warehouse processes, it may be feasible to measure the warehouse's receiving and storing functions. Since receiving is recorded in line items and storing in measurement tons, it is possible to combine the two using a weighted index with respective man-hours for each function as weights. Alternative I warehouse benefit would then be equated with base 100 and variation from this could be on par, better, or worse for other alternatives depending on the weighted index calculated from the estimated or actual data.
Another method of composite scoring would be to convert actual output to some common factor such as dollars. In so doing, we implicitly assign to each benefit a portion of the worth of the combined alternative benefits. For instance, we can predict an expected yearly repair cost based on the mean-time-between-failure and average maintenance for each alternative. In converting to dollars, care should be taken in the mathematical relationship between the cost side of each alternative and the cost conversions on the output/benefit side of the equation.
The most significant problem in determining overall technical and logistical
competence of a system is deciding upon the proper weights to be given to the various benefits. When objective inherent weights of the system, such as relative man-hours, dollars, etc., are not available, the criteria for weighting should be based on how much each contributes to the accomplishment of problem requirements, i.e., the economic analysis problem under consideration.
In situations where it is difficult to project benefits and/or to compute measures, it is desirable to provide as much useful information as possible to enable a decision to be made as to which alternative yields the most benefits.
A composite of total worth or value of a system is not always possible by objective quantitative scoring or weighting. The comparison format, with composites as subtotals of

29
individual benefit statistics, will allow for appraisal by experts and final review by the decision maker.
TABLE 1
SAMPLES OF BENEFIT DETERMINATION DISPLAYS
Alternatives Benefits (In order of significance)
Mode of Appraisal
and/or Measurement
I All Years
II All Years
A. Quantifiable Benefits
1. Productivity # of line items per man-hour
100 50
2. Accuracy in Operations Stockpicker errors per 1000 line items
issued 12 6
3. Customer Satisfaction % shipped on time 70% 90%
4. Safety Employee accidents per year
3 1
(Composite Score - if possible)
B. Nonquantifiable
1. Morale Consensus of employee opinions
Climbing ladders Is not desirable; wastes energy
Desirable since material easier to reach and energy conserved, less tiring
.
30
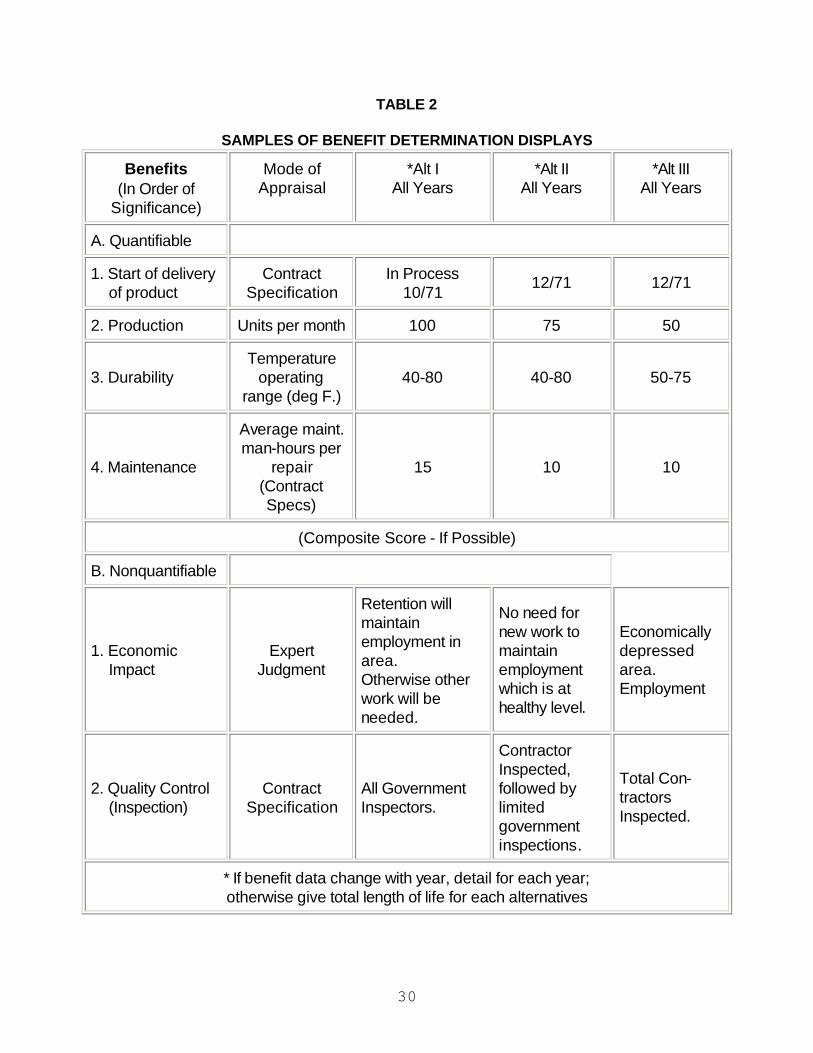
TABLE 2
SAMPLES OF BENEFIT DETERMINATION DISPLAYS
Benefits (In Order of
Significance)
Mode of Appraisal
*Alt I All Years
*Alt II All Years
*Alt III All Years
A. Quantifiable
1. Start of delivery of product
Contract Specification
In Process 10/71
12/71 12/71
2. Production Units per month 100 75 50
3. Durability Temperature
operating range (deg F.)
40-80 40-80 50-75
4. Maintenance
Average maint. man-hours per
repair (Contract Specs)
15 10 10
(Composite Score - If Possible)
B. Nonquantifiable
1. Economic Impact
Expert Judgment
Retention will maintain employment in area. Otherwise other work will be needed.
No need for new work to maintain employment which is at healthy level.
Economically depressed area. Employment
2. Quality Control (Inspection)
Contract Specification
All Government Inspectors.
Contractor Inspected, followed by limited government inspections.
Total Con- tractors Inspected.
* If benefit data change with year, detail for each year; otherwise give total length of life for each alternatives
31
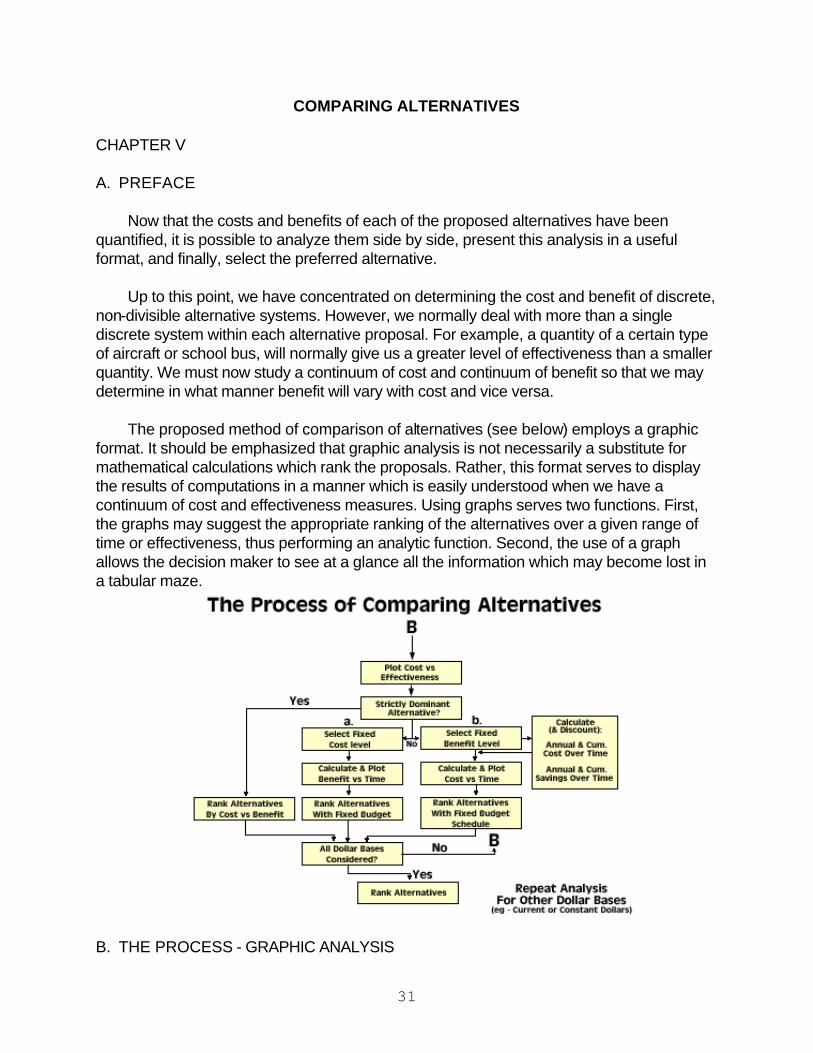
COMPARING ALTERNATIVES CHAPTER V A. PREFACE
Now that the costs and benefits of each of the proposed alternatives have been quantified, it is possible to analyze them side by side, present this analysis in a useful format, and finally, select the preferred alternative.
Up to this point, we have concentrated on determining the cost and benefit of discrete, non-divisible alternative systems. However, we normally deal with more than a single discrete system within each alternative proposal. For example, a quantity of a certain type of aircraft or school bus, will normally give us a greater level of effectiveness than a smaller quantity. We must now study a continuum of cost and continuum of benefit so that we may determine in what manner benefit will vary with cost and vice versa.
The proposed method of comparison of alternatives (see below) employs a graphic format. It should be emphasized that graphic analysis is not necessarily a substitute for mathematical calculations which rank the proposals. Rather, this format serves to display the results of computations in a manner which is easily understood when we have a continuum of cost and effectiveness measures. Using graphs serves two functions. First, the graphs may suggest the appropriate ranking of the alternatives over a given range of time or effectiveness, thus performing an analytic function. Second, the use of a graph allows the decision maker to see at a glance all the information which may become lost in a tabular maze.
B. THE PROCESS - GRAPHIC ANALYSIS
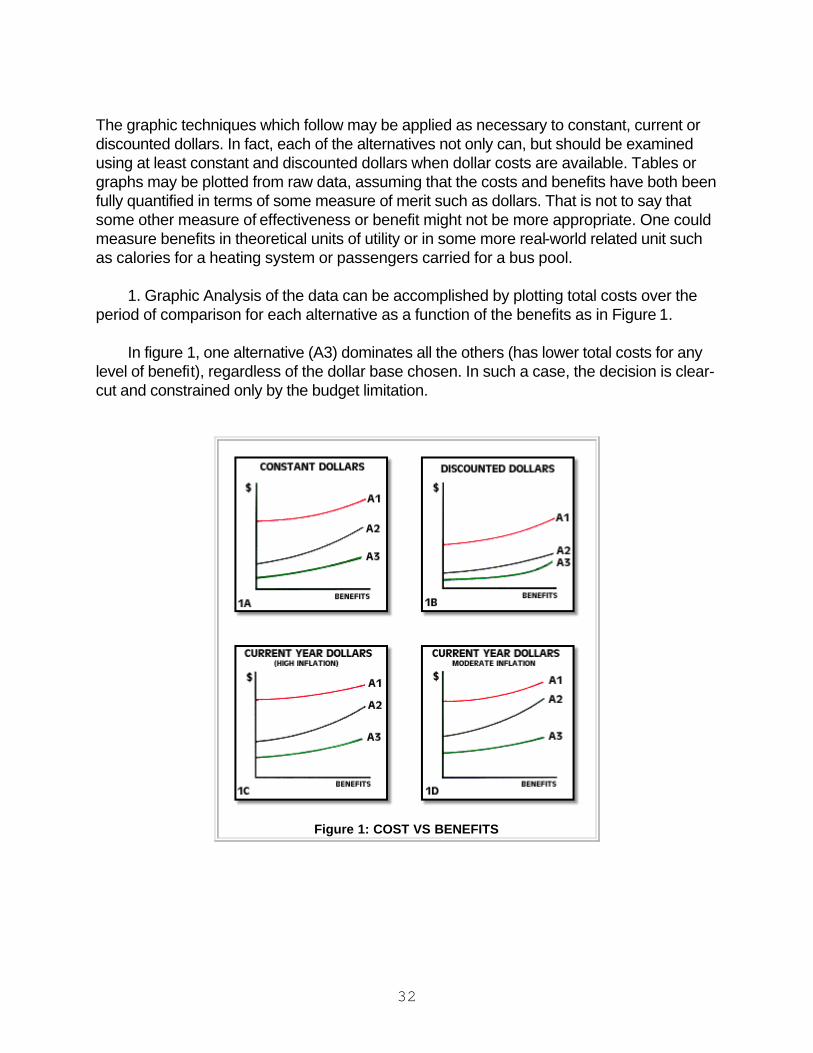
32
The graphic techniques which follow may be applied as necessary to constant, current or discounted dollars. In fact, each of the alternatives not only can, but should be examined using at least constant and discounted dollars when dollar costs are available. Tables or graphs may be plotted from raw data, assuming that the costs and benefits have both been fully quantified in terms of some measure of merit such as dollars. That is not to say that some other measure of effectiveness or benefit might not be more appropriate. One could measure benefits in theoretical units of utility or in some more real-world related unit such as calories for a heating system or passengers carried for a bus pool.
1. Graphic Analysis of the data can be accomplished by plotting total costs over the period of comparison for each alternative as a function of the benefits as in Figure 1.
In figure 1, one alternative (A3) dominates all the others (has lower total costs for any
level of benefit), regardless of the dollar base chosen. In such a case, the decision is clear-cut and constrained only by the budget limitation.
Figure 1: COST VS BENEFITS
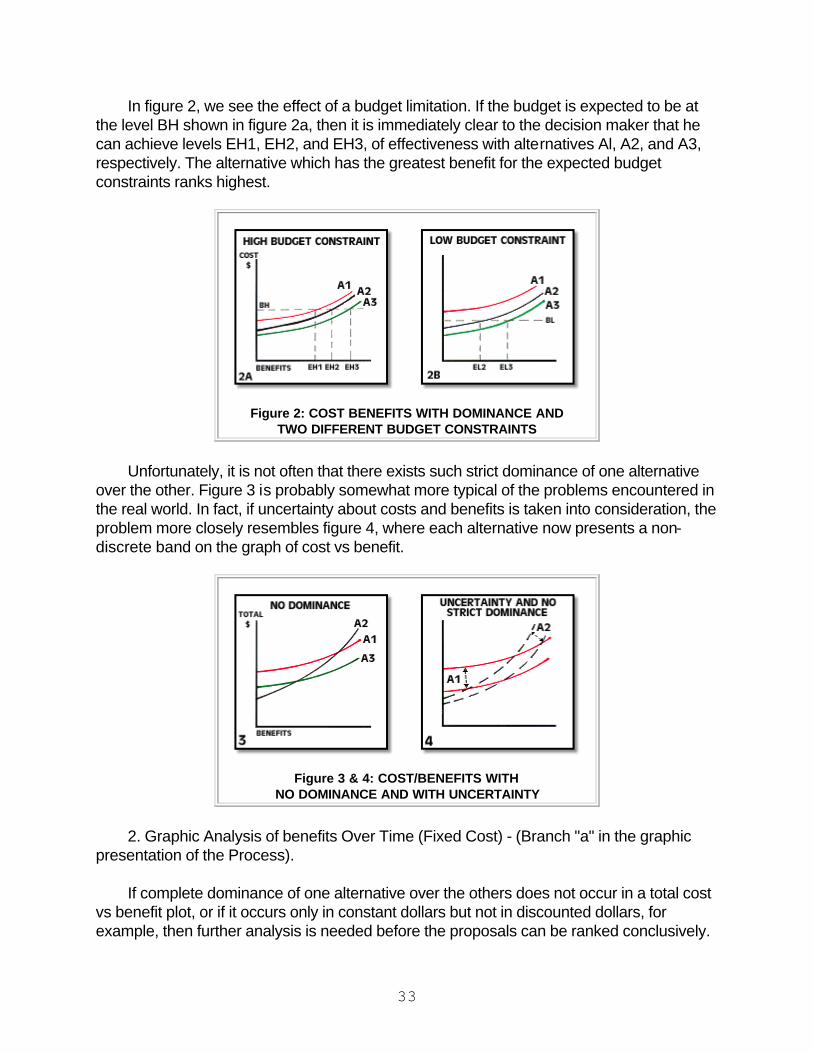
33
In figure 2, we see the effect of a budget limitation. If the budget is expected to be at the level BH shown in figure 2a, then it is immediately clear to the decision maker that he can achieve levels EH1, EH2, and EH3, of effectiveness with alternatives Al, A2, and A3, respectively. The alternative which has the greatest benefit for the expected budget constraints ranks highest.
Figure 2: COST BENEFITS WITH DOMINANCE AND
TWO DIFFERENT BUDGET CONSTRAINTS
Unfortunately, it is not often that there exists such strict dominance of one alternative
over the other. Figure 3 is probably somewhat more typical of the problems encountered in the real world. In fact, if uncertainty about costs and benefits is taken into consideration, the problem more closely resembles figure 4, where each alternative now presents a non-discrete band on the graph of cost vs benefit.
Figure 3 & 4: COST/BENEFITS WITH
NO DOMINANCE AND WITH UNCERTAINTY
2. Graphic Analysis of benefits Over Time (Fixed Cost) - (Branch "a" in the graphic
presentation of the Process).
If complete dominance of one alternative over the others does not occur in a total cost vs benefit plot, or if it occurs only in constant dollars but not in discounted dollars, for example, then further analysis is needed before the proposals can be ranked conclusively.

34
The most common constraint on the problem is a fixed budget level. In such a case, one can limit the level of expenditure for any alternative and then compute the benefits or effectiveness of each alternative in some common measure of merit at that fixed level. For instance, one might plot the benefits for each alternative as a function.of time for the given budget constraint (see figure 5). The budget limitation could be either an annual or a total expenditure limit.
Again, if there is clear dominance of one alternative over the others (figure 5a) for all periods of time considered, then this proposal rank highest. As mentioned before, this is not the most common situation in the real world, since alternatives tend to overlap or to have uncertain benefits over time as figures 5b and 5c indicate.
If the economic life of a given alternative is known with some probability to be 10 or 11 years, then we can select the alternative which maximizes benefits over an economic lifetime as indicated by figure 5b.
We may also plot each alternative with respect to the working time or Flextime we expect from our alternative systems. That is, the benefits of two machines might vary widely, depending upon the intensity with which they are employed. For example figure 5c would indicate that alternative A1 is the proper choice for all usage times less than U1, while A2 would be the choice for the higher range of system use time.
Figure 5: BENEFITS VS TIME AT FIXED
BUDGET LEVEL

35
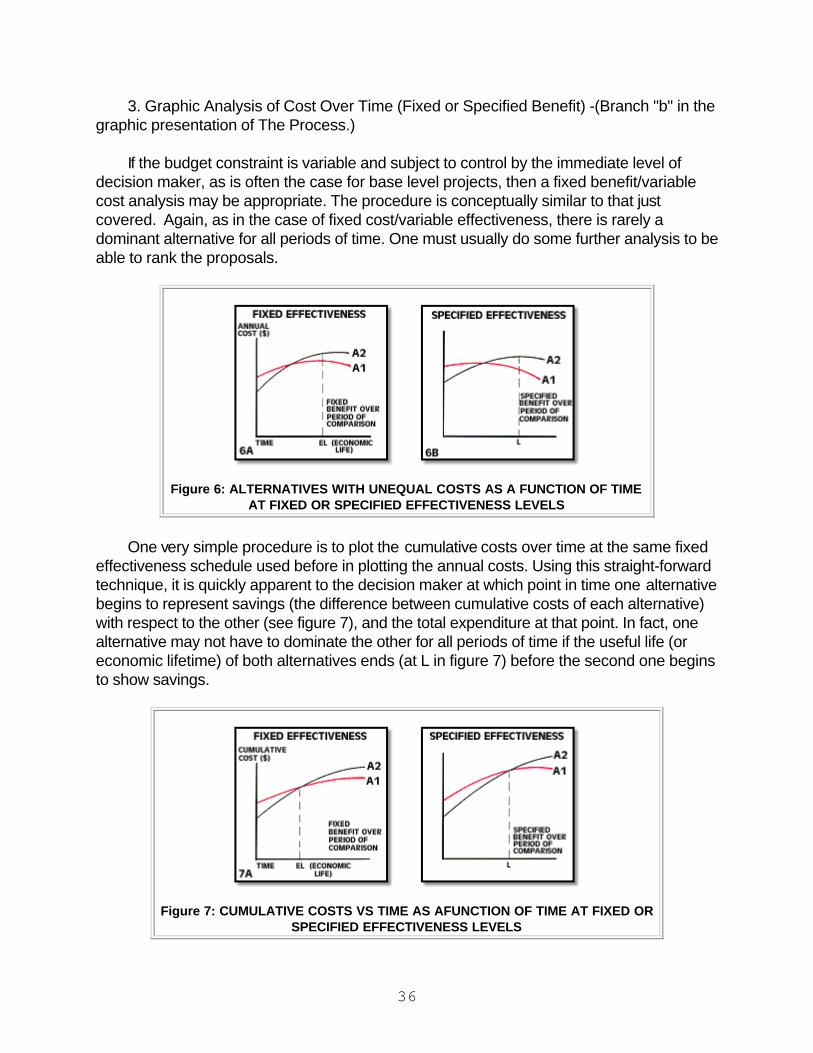
36
3. Graphic Analysis of Cost Over Time (Fixed or Specified Benefit) -(Branch "b" in the graphic presentation of The Process.)
If the budget constraint is variable and subject to control by the immediate level of
decision maker, as is often the case for base level projects, then a fixed benefit/variable cost analysis may be appropriate. The procedure is conceptually similar to that just covered. Again, as in the case of fixed cost/variable effectiveness, there is rarely a dominant alternative for all periods of time. One must usually do some further analysis to be able to rank the proposals.
Figure 6: ALTERNATIVES WITH UNEQUAL COSTS AS A FUNCTION OF TIME
AT FIXED OR SPECIFIED EFFECTIVENESS LEVELS
One very simple procedure is to plot the cumulative costs over time at the same fixed
effectiveness schedule used before in plotting the annual costs. Using this straight-forward technique, it is quickly apparent to the decision maker at which point in time one alternative begins to represent savings (the difference between cumulative costs of each alternative) with respect to the other (see figure 7), and the total expenditure at that point. In fact, one alternative may not have to dominate the other for all periods of time if the useful life (or economic lifetime) of both alternatives ends (at L in figure 7) before the second one begins to show savings.
Figure 7: CUMULATIVE COSTS VS TIME AS AFUNCTION OF TIME AT FIXED OR
SPECIFIED EFFECTIVENESS LEVELS
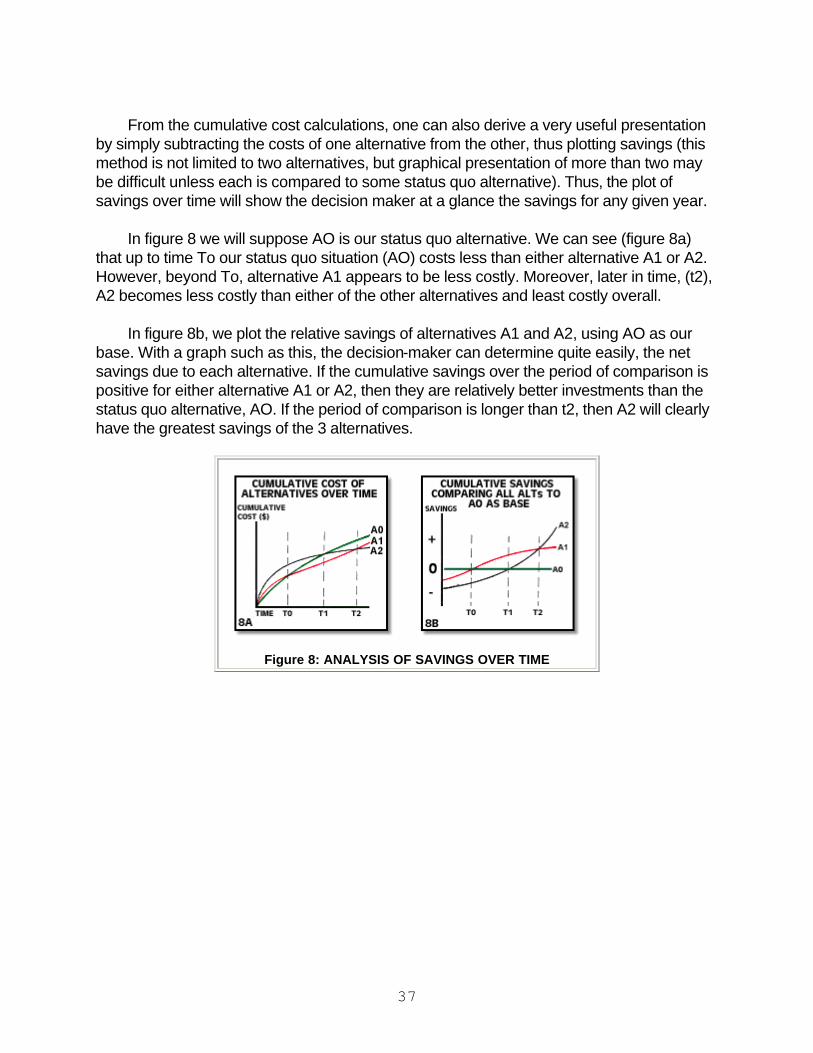
37
From the cumulative cost calculations, one can also derive a very useful presentation
by simply subtracting the costs of one alternative from the other, thus plotting savings (this method is not limited to two alternatives, but graphical presentation of more than two may be difficult unless each is compared to some status quo alternative). Thus, the plot of savings over time will show the decision maker at a glance the savings for any given year.
In figure 8 we will suppose AO is our status quo alternative. We can see (figure 8a) that up to time To our status quo situation (AO) costs less than either alternative A1 or A2. However, beyond To, alternative A1 appears to be less costly. Moreover, later in time, (t2), A2 becomes less costly than either of the other alternatives and least costly overall.
In figure 8b, we plot the relative savings of alternatives A1 and A2, using AO as our base. With a graph such as this, the decision-maker can determine quite easily, the net savings due to each alternative. If the cumulative savings over the period of comparison is positive for either alternative A1 or A2, then they are relatively better investments than the status quo alternative, AO. If the period of comparison is longer than t2, then A2 will clearly have the greatest savings of the 3 alternatives.
Figure 8: ANALYSIS OF SAVINGS OVER TIME
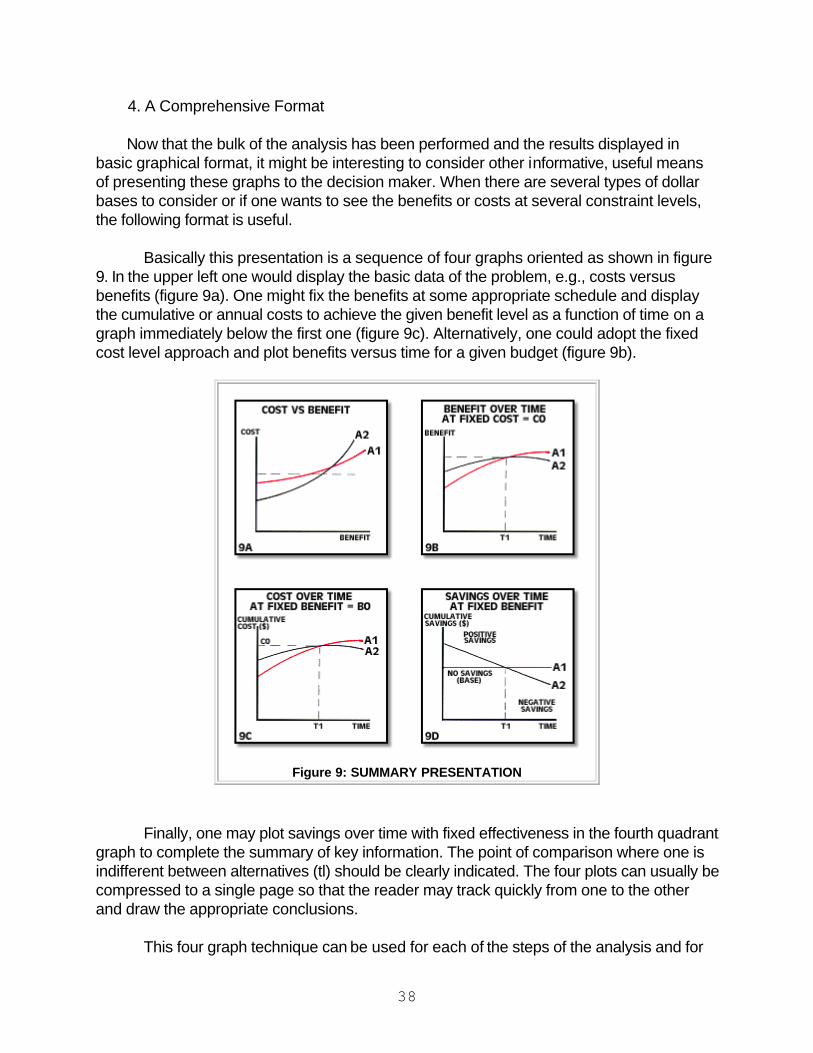
38
4. A Comprehensive Format Now that the bulk of the analysis has been performed and the results displayed in
basic graphical format, it might be interesting to consider other informative, useful means of presenting these graphs to the decision maker. When there are several types of dollar bases to consider or if one wants to see the benefits or costs at several constraint levels, the following format is useful.
Basically this presentation is a sequence of four graphs oriented as shown in figure 9. In the upper left one would display the basic data of the problem, e.g., costs versus benefits (figure 9a). One might fix the benefits at some appropriate schedule and display the cumulative or annual costs to achieve the given benefit level as a function of time on a graph immediately below the first one (figure 9c). Alternatively, one could adopt the fixed cost level approach and plot benefits versus time for a given budget (figure 9b).
Figure 9: SUMMARY PRESENTATION
Finally, one may plot savings over time with fixed effectiveness in the fourth quadrant graph to complete the summary of key information. The point of comparison where one is indifferent between alternatives (tl) should be clearly indicated. The four plots can usually be compressed to a single page so that the reader may track quickly from one to the other and draw the appropriate conclusions.
This four graph technique can be used for each of the steps of the analysis and for
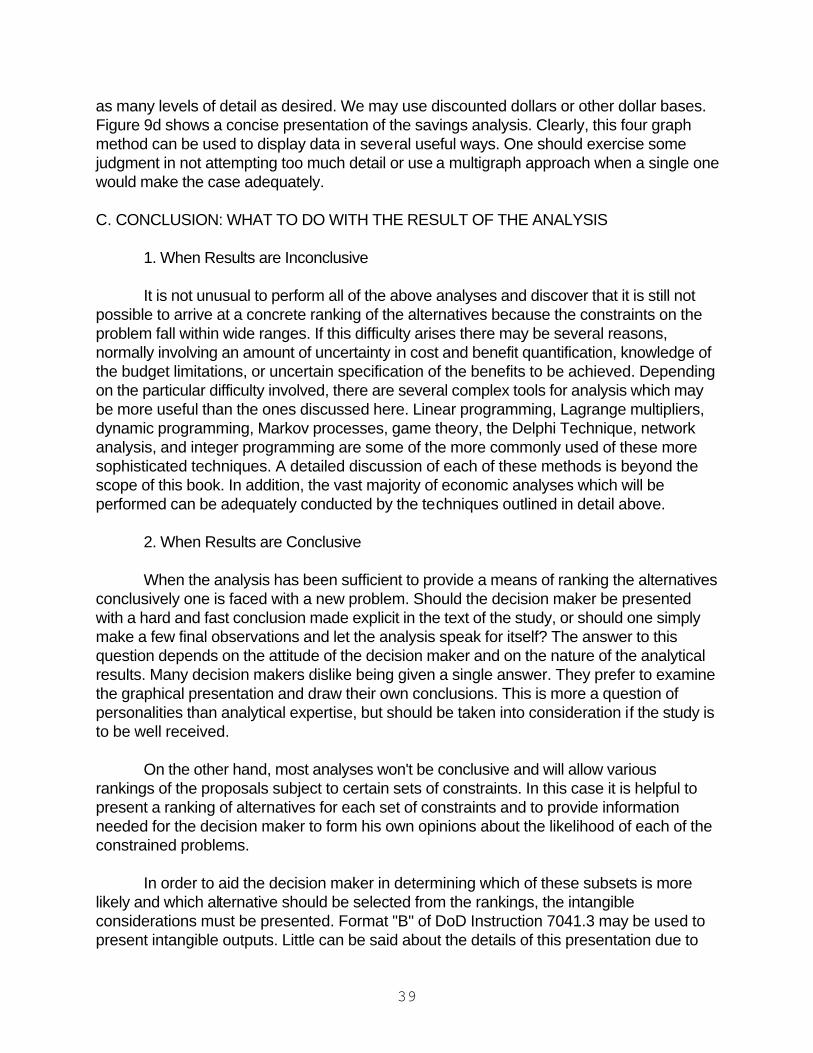
39
as many levels of detail as desired. We may use discounted dollars or other dollar bases. Figure 9d shows a concise presentation of the savings analysis. Clearly, this four graph method can be used to display data in several useful ways. One should exercise some judgment in not attempting too much detail or use a multigraph approach when a single one would make the case adequately. C. CONCLUSION: WHAT TO DO WITH THE RESULT OF THE ANALYSIS
1. When Results are Inconclusive
It is not unusual to perform all of the above analyses and discover that it is still not possible to arrive at a concrete ranking of the alternatives because the constraints on the problem fall within wide ranges. If this difficulty arises there may be several reasons, normally involving an amount of uncertainty in cost and benefit quantification, knowledge of the budget limitations, or uncertain specification of the benefits to be achieved. Depending on the particular difficulty involved, there are several complex tools for analysis which may be more useful than the ones discussed here. Linear programming, Lagrange multipliers, dynamic programming, Markov processes, game theory, the Delphi Technique, network analysis, and integer programming are some of the more commonly used of these more sophisticated techniques. A detailed discussion of each of these methods is beyond the scope of this book. In addition, the vast majority of economic analyses which will be performed can be adequately conducted by the techniques outlined in detail above.
2. When Results are Conclusive
When the analysis has been sufficient to provide a means of ranking the alternatives
conclusively one is faced with a new problem. Should the decision maker be presented with a hard and fast conclusion made explicit in the text of the study, or should one simply make a few final observations and let the analysis speak for itself? The answer to this question depends on the attitude of the decision maker and on the nature of the analytical results. Many decision makers dislike being given a single answer. They prefer to examine the graphical presentation and draw their own conclusions. This is more a question of personalities than analytical expertise, but should be taken into consideration if the study is to be well received.
On the other hand, most analyses won't be conclusive and will allow various rankings of the proposals subject to certain sets of constraints. In this case it is helpful to present a ranking of alternatives for each set of constraints and to provide information needed for the decision maker to form his own opinions about the likelihood of each of the constrained problems.
In order to aid the decision maker in determining which of these subsets is more likely and which alternative should be selected from the rankings, the intangible considerations must be presented. Format "B" of DoD Instruction 7041.3 may be used to present intangible outputs. Little can be said about the details of this presentation due to
40
the number of different situations that may be encountered. However, one should attempt to be impartial and complete in describing each relevant factor and arranging them in some appropriate format.
Finally, if the salvage or other residual value of a proposed investment is quite uncertain and has not been included in the cumulative cost calculations, then it might be better to rank the alternatives, initially, without considering the residuals. Then, as an aid to the decision maker in considering sensitivity, residual value can be shown as an intangible and the ranking procedure repeated.
3. The Big Picture - Externalities
No study of alternative proposals for an investment should be conducted in the dark. This is to say, an analyst should try to be aware of other investment proposals which will be competing for the same budget dollars. For instance, it would be short sighted indeed to perform the above analyses at fixed cost levels which required the entire budget to be dedicated to each alternative. A good analyst would also realize that the decision maker will not be able to consider an alternative which exceeds his budget, regardless of the levels of effectiveness achieved.
On the other hand, once a budget limitation is established, it is still useful to rank the
alternatives according to effectiveness at several levels of fixed cost within the given budget constraint. The premise here is that even a low investment alternative may be better than the status quo. But if the decision maker is shown only an array of high investment proposals, he may not accept any of them, leaving the problem with what could be a highly undesirable status quo solution. In short, the analyst should attempt to incorporate the big picture into his initial approaches to the problem, not realize too late that the conclusions will be unacceptable to the decision maker, regardless of the accuracy of the computational work. .

41
THIS PAGE IS BLANK

42
A GUIDE FOR REVIEWERS CHAPTER VI A. THE OBJECTIVE ASSUMPTIONS AND ALTERNATIVES 1. Is the problem stated the real problem? 2. Are all reasonable assumptions identified and explained? 3. Are assumptions too restrictive? Too broad? 4. Are intuitive judgments identified as such? Are uncertainties treated as facts? Can the
facts be verified? 5. Are any feasible alternatives omitted? 6. Are the alternatives will defined and discrete? Do they overlap? B. THE COST ESTIMATE 1. What costing method was used? Is it appropriate? 2. Are all relevant costs included? Are directly related support and training costs
included? 3. Does the study indicate why certain costs were considered relevant and others not? 4. Are sunk costs excluded? 5. Are the sources of cost data included? Are they accurate? 6. Are the Cost Estimating Relationships valid, if the parametric method was used? Are
extrapolations used without proof? C. THE BENEFIT DETERMINATION 1. Does the analysis ignore some portion of total output? 2. Were the criteria used to measure benefit justified by the context of the study? 3. Was the benefit, in fact, unmeasurable? Has there been a rational assessment of non-
quantifiable factors? 4. Was expert opinion used? Were these experts properly qualified?
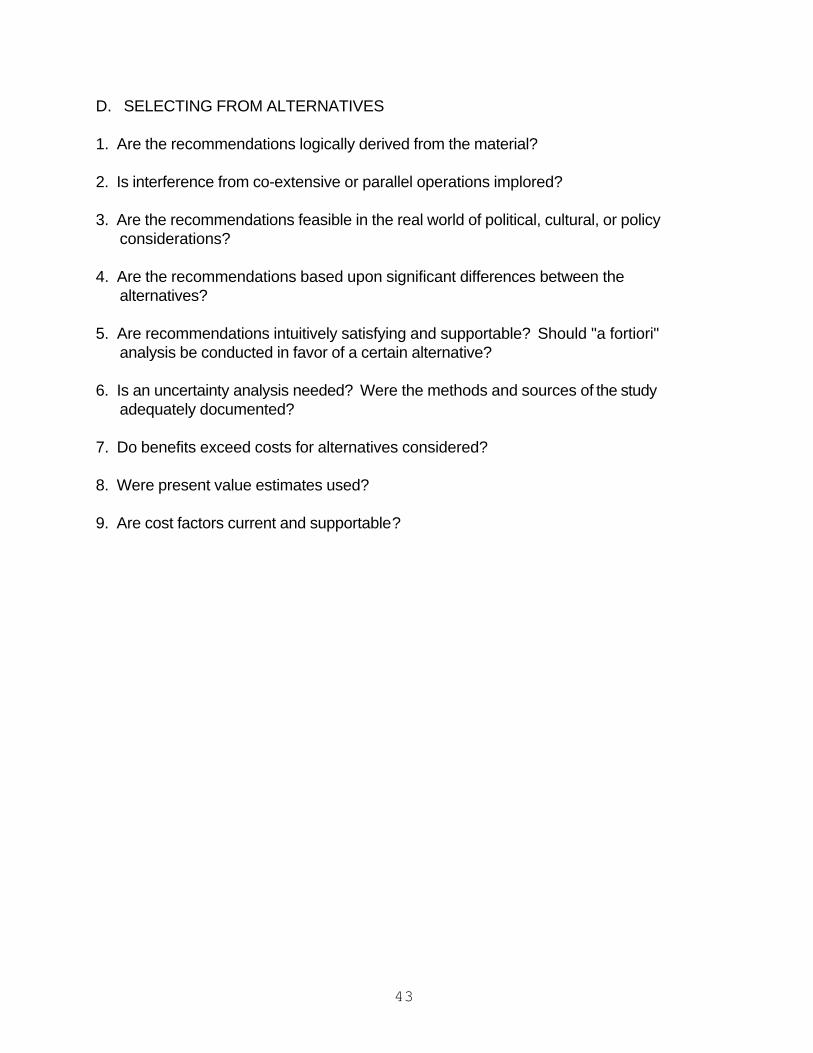
43
D. SELECTING FROM ALTERNATIVES 1. Are the recommendations logically derived from the material? 2. Is interference from co-extensive or parallel operations implored? 3. Are the recommendations feasible in the real world of political, cultural, or policy
considerations? 4. Are the recommendations based upon significant differences between the
alternatives? 5. Are recommendations intuitively satisfying and supportable? Should "a fortiori"
analysis be conducted in favor of a certain alternative? 6. Is an uncertainty analysis needed? Were the methods and sources of the study
adequately documented? 7. Do benefits exceed costs for alternatives considered? 8. Were present value estimates used? 9. Are cost factors current and supportable?
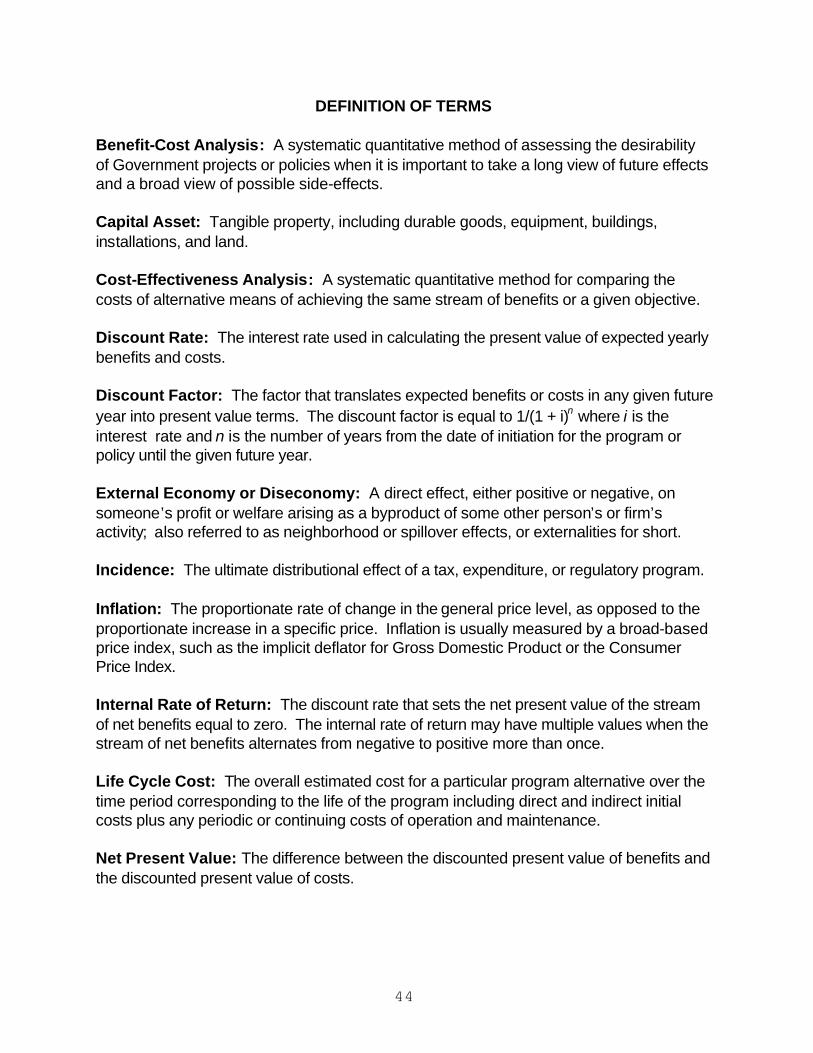
44
DEFINITION OF TERMS
Benefit-Cost Analysis: A systematic quantitative method of assessing the desirability of Government projects or policies when it is important to take a long view of future effects and a broad view of possible side-effects. Capital Asset: Tangible property, including durable goods, equipment, buildings, installations, and land. Cost-Effectiveness Analysis: A systematic quantitative method for comparing the costs of alternative means of achieving the same stream of benefits or a given objective. Discount Rate: The interest rate used in calculating the present value of expected yearly benefits and costs. Discount Factor: The factor that translates expected benefits or costs in any given future year into present value terms. The discount factor is equal to 1/(1 + i)n where i is the interest rate and n is the number of years from the date of initiation for the program or policy until the given future year. External Economy or Diseconomy: A direct effect, either positive or negative, on someone’s profit or welfare arising as a byproduct of some other person’s or firm’s activity; also referred to as neighborhood or spillover effects, or externalities for short. Incidence: The ultimate distributional effect of a tax, expenditure, or regulatory program. Inflation: The proportionate rate of change in the general price level, as opposed to the proportionate increase in a specific price. Inflation is usually measured by a broad-based price index, such as the implicit deflator for Gross Domestic Product or the Consumer Price Index. Internal Rate of Return: The discount rate that sets the net present value of the stream of net benefits equal to zero. The internal rate of return may have multiple values when the stream of net benefits alternates from negative to positive more than once. Life Cycle Cost: The overall estimated cost for a particular program alternative over the time period corresponding to the life of the program including direct and indirect initial costs plus any periodic or continuing costs of operation and maintenance. Net Present Value: The difference between the discounted present value of benefits and the discounted present value of costs.
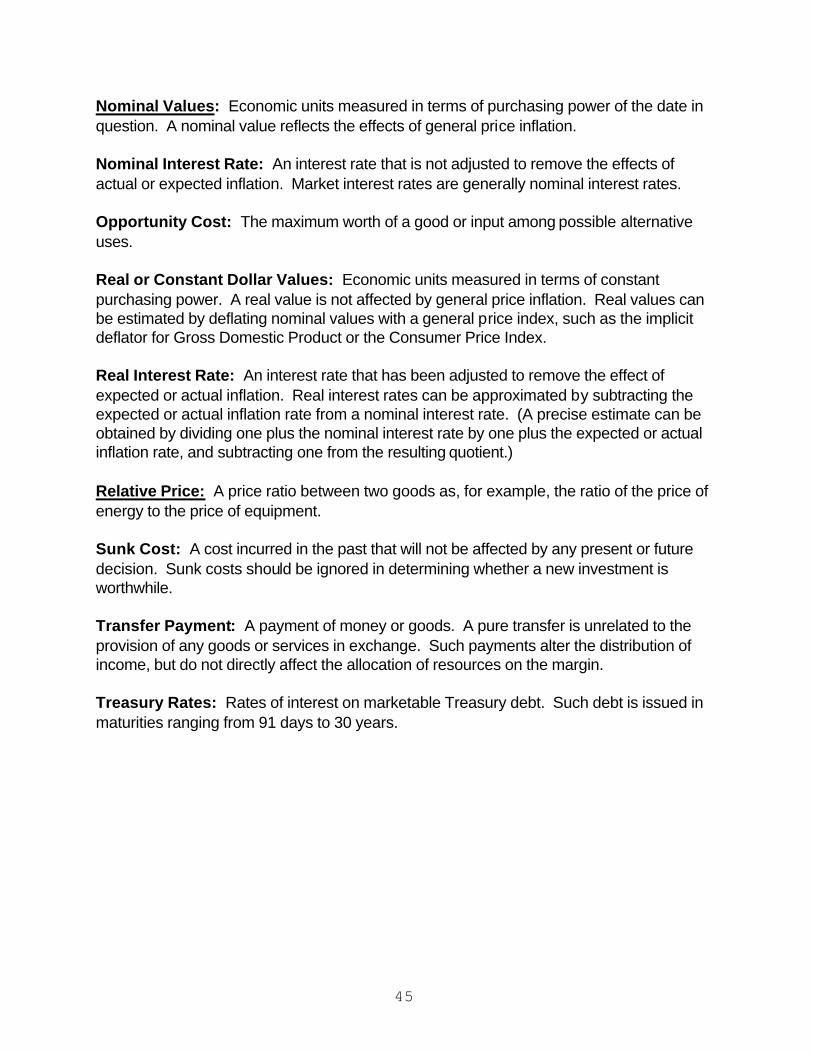
45
Nominal Values: Economic units measured in terms of purchasing power of the date in question. A nominal value reflects the effects of general price inflation. Nominal Interest Rate: An interest rate that is not adjusted to remove the effects of actual or expected inflation. Market interest rates are generally nominal interest rates. Opportunity Cost: The maximum worth of a good or input among possible alternative uses. Real or Constant Dollar Values: Economic units measured in terms of constant purchasing power. A real value is not affected by general price inflation. Real values can be estimated by deflating nominal values with a general price index, such as the implicit deflator for Gross Domestic Product or the Consumer Price Index. Real Interest Rate: An interest rate that has been adjusted to remove the effect of expected or actual inflation. Real interest rates can be approximated by subtracting the expected or actual inflation rate from a nominal interest rate. (A precise estimate can be obtained by dividing one plus the nominal interest rate by one plus the expected or actual inflation rate, and subtracting one from the resulting quotient.) Relative Price: A price ratio between two goods as, for example, the ratio of the price of energy to the price of equipment. Sunk Cost: A cost incurred in the past that will not be affected by any present or future decision. Sunk costs should be ignored in determining whether a new investment is worthwhile. Transfer Payment: A payment of money or goods. A pure transfer is unrelated to the provision of any goods or services in exchange. Such payments alter the distribution of income, but do not directly affect the allocation of resources on the margin. Treasury Rates: Rates of interest on marketable Treasury debt. Such debt is issued in maturities ranging from 91 days to 30 years.


![[This Page Intentionally Blank] - Energy](https://img.pdfslide.net/doc/110x75/6192e70569422b624f5debca/this-page-intentionally-blank-energy.jpg)