Embed Size (px)
Citation preview
This paper might be a pre-copy-editing or a post-print author-produced .pdf of an article accepted for publication. For the
definitive publisher-authenticated version, please refer directly to publishing house’s archive system.
PLEA2005 - The 22nd Conference on Passive and Low Energy Architecture. Beirut, Lebanon, 13-16 November 2005 1/6
SunScapes: extending the ‘solar envelopes’ concept through ‘iso-solar surfaces’
Carlo Ratti1 and Eugenio Morello2
1, 2 SENSEable City Laboratory, MIT, Cambridge, MA, USA
ABSTRACT: This paper develops techniques to improve the concept of ‘solar envelopes’ and tests them on the Milan Trade Fair site, one of the largest real estate developments currently being carried out in Europe. The techniques are based on the image processing of very simple raster models of urban forms, called Digital Elevation Models (DEMs). Two questions are asked: could the new techniques simplify solar envelope calculations, making them more accessible in urban areas? Could they improve the meaning of solar envelopes with reference to the actual irradiation/illumination of the city? This paper shows that both answers are in the affirmative. The second question, in particular, is addressed by introducing the concept of ‘iso-solar surfaces’, extending the concept of solar envelope with energy considerations (two types of iso-solar surfaces can be distinguished: iso-solar rights surfaces, and iso-solar collection surfaces). Iso-solar surfaces radically transform solar envelopes, making them more meaningful and immediate. They could become an easy tool to assess energy-saving strategies and could be used by policy makers and urban planners instead of coarse obstruction angle or similar bylaws. Conference Topic: 2 Design strategies and tools Keywords: solar energy, solar bylaw, solar envelope, iso-solar surface, image processing, digital elevation models, Matlab.
INTRODUCTION
Access to sunlight and daylight has always been one of the key generators of urban form. This has been acknowledged by traditional bylaws, such as those implemented in the planning of New York and other dense cities throughout the world, mostly through the idea of obstruction angles.
It was Knowles [1] who refined the obstruction angle rule and introduced the well-known concept of ‘solar envelope’: a 3-D surface on a given site that does not obstruct more than n hours of sun onto adjacent sites. The idea was later extended by Capeluto and Shaviv [2], who distinguish between ‘solar rights envelopes’ and ‘solar collection envelopes’ – the former resembling Knowles’ initial definition, and the latter examining the total number of sun-hours collected (as opposed to cast) by a particular urban 3-D surface.
While seductive from a theoretical standpoint, solar rights/collection envelopes pose a number of problems. In particular:
1) Difficulties dealing with complex geometries. Solar envelopes are difficult to calculate over extensive urban areas. Even recent software that coupled solar envelope calculations with traditional CAD software [3] fails at the city scale because of its complexity. SEs seem very useful for understanding the potential of regular urban grids, such as in many American cities. The orientation of streets and the street patterns influence the size and the shape of the solar envelopes, as demonstrated by Knowles [4]. But when used on large and irregular urban sites, such as
the case study presented in this paper, the method becomes excessively costly from a computational point of view.
2) Quantification of received energy. Solar envelopes are defined in the scientific literature in terms of discrete numbers of hours of sun or shadow, with little reference to actual radiation or illumination levels. However, an hour of sun at midday has different effects than an hour of sun at dawn. The idea of energy-weighting solar envelopes was hinted at in some seminal work by Knowles, but later abandoned due to computational difficulties.
This paper investigates if both limitations above could be overcome using new techniques for urban analysis, based on the image processing of very simple raster models of urban form: the so-called ‘digital elevation models’ (DEMs). Ratti and Richens [5] show how DEMs are very conducive to the environmental analysis of extensive urban areas. Could they contribute to solar envelope calculations, making them more accessible in urban areas? Could they allow weighting of solar envelopes based on the actual irradiation/illumination of the city?
The answer to the above questions is discussed below, by analysing results of the Milan Trade Fair site case study, which is currently one of the largest real-estate developments in Europe (architects Zaha Hadid, Arata Isozaki, Daniel Libeskind, Pier Paolo Maggiora). Also, the concept of iso-solar surfaces is introduced: that of 3-D geometric envelopes which receive the same amount of solar energy. Two types of iso-solar surfaces can be defined: iso-solar rights
PLEA2005 - The 22nd Conference on Passive and Low Energy Architecture. Beirut, Lebanon, 13-16 November 2005 2/6
surfaces (ISRS) and iso-solar collection surfaces (ISCS). 2. RESEARCH CONTEXT AND DEFINITIONS 2.1 Planning with the sun
Traditional solar laws are based on simple angular criteria, such as obstruction angles rules.
The case of the New York’s Zoning Law of 1916 is emblematic: it was enacted as a reaction against the negative environmental effects caused by excessive building height and density in central Manhattan: construction can “proceed up to a certain height; then the building must step back from the plotline at a certain angle to admit light to the streets. A Tower may then carry 25 percent of the plot area to unlimited heights” [6]. The maximal volume which results from legal prescriptions is well represented in the renderings of Hugh Ferriss, which describe a city of maximal envelopes, “a ghost town of the future […] a collection of 2028 colossal phantom “houses” that together form a Mega-Village” [6].
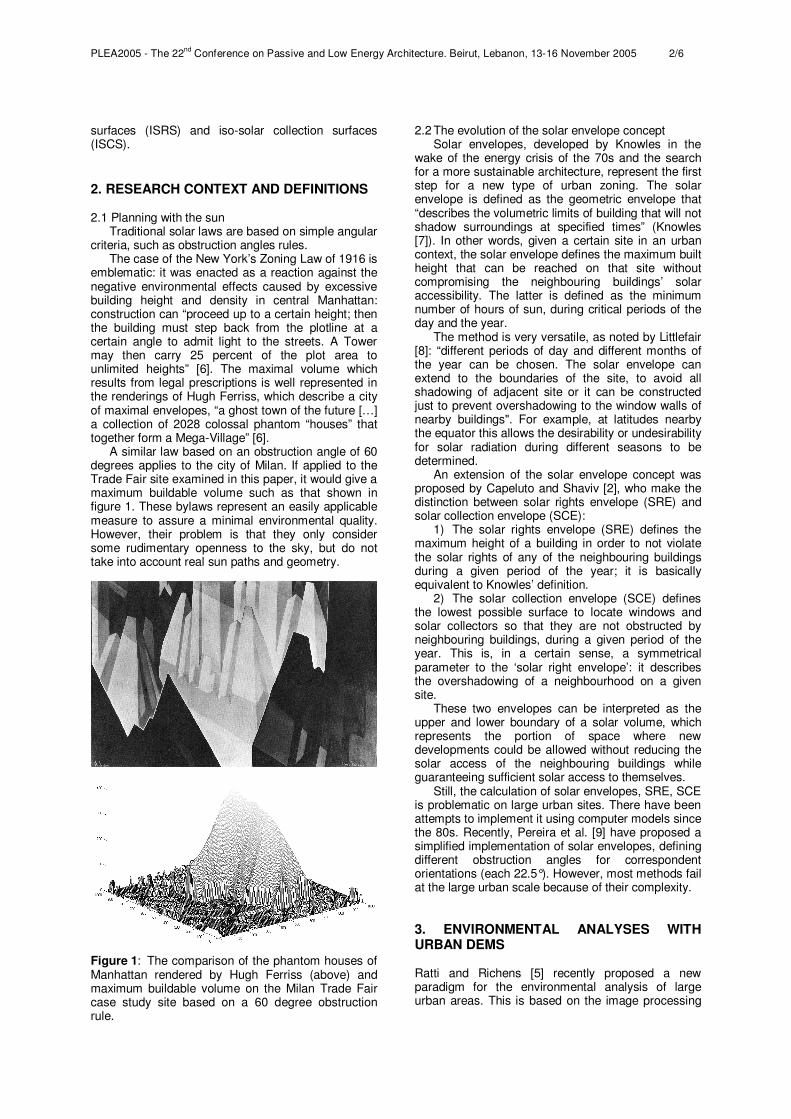
A similar law based on an obstruction angle of 60 degrees applies to the city of Milan. If applied to the Trade Fair site examined in this paper, it would give a maximum buildable volume such as that shown in figure 1. These bylaws represent an easily applicable measure to assure a minimal environmental quality. However, their problem is that they only consider some rudimentary openness to the sky, but do not take into account real sun paths and geometry. Figure 1: The comparison of the phantom houses of Manhattan rendered by Hugh Ferriss (above) and maximum buildable volume on the Milan Trade Fair case study site based on a 60 degree obstruction rule.
2.2 The evolution of the solar envelope concept Solar envelopes, developed by Knowles in the
wake of the energy crisis of the 70s and the search for a more sustainable architecture, represent the first step for a new type of urban zoning. The solar envelope is defined as the geometric envelope that “describes the volumetric limits of building that will not shadow surroundings at specified times” (Knowles [7]). In other words, given a certain site in an urban context, the solar envelope defines the maximum built height that can be reached on that site without compromising the neighbouring buildings’ solar accessibility. The latter is defined as the minimum number of hours of sun, during critical periods of the day and the year.
The method is very versatile, as noted by Littlefair [8]: “different periods of day and different months of the year can be chosen. The solar envelope can extend to the boundaries of the site, to avoid all shadowing of adjacent site or it can be constructed just to prevent overshadowing to the window walls of nearby buildings". For example, at latitudes nearby the equator this allows the desirability or undesirability for solar radiation during different seasons to be determined.
An extension of the solar envelope concept was proposed by Capeluto and Shaviv [2], who make the distinction between solar rights envelope (SRE) and solar collection envelope (SCE):
1) The solar rights envelope (SRE) defines the maximum height of a building in order to not violate the solar rights of any of the neighbouring buildings during a given period of the year; it is basically equivalent to Knowles’ definition.
2) The solar collection envelope (SCE) defines the lowest possible surface to locate windows and solar collectors so that they are not obstructed by neighbouring buildings, during a given period of the year. This is, in a certain sense, a symmetrical parameter to the ‘solar right envelope’: it describes the overshadowing of a neighbourhood on a given site.
These two envelopes can be interpreted as the upper and lower boundary of a solar volume, which represents the portion of space where new developments could be allowed without reducing the solar access of the neighbouring buildings while guaranteeing sufficient solar access to themselves.
Still, the calculation of solar envelopes, SRE, SCE is problematic on large urban sites. There have been attempts to implement it using computer models since the 80s. Recently, Pereira et al. [9] have proposed a simplified implementation of solar envelopes, defining different obstruction angles for correspondent orientations (each 22.5°). However, most methods fail at the large urban scale because of their complexity. 3. ENVIRONMENTAL ANALYSES WITH URBAN DEMS Ratti and Richens [5] recently proposed a new paradigm for the environmental analysis of large urban areas. This is based on the image processing
PLEA2005 - The 22nd Conference on Passive and Low Energy Architecture. Beirut, Lebanon, 13-16 November 2005 3/6
of very simple models of urban form, called Digital Elevation Models (DEMs).
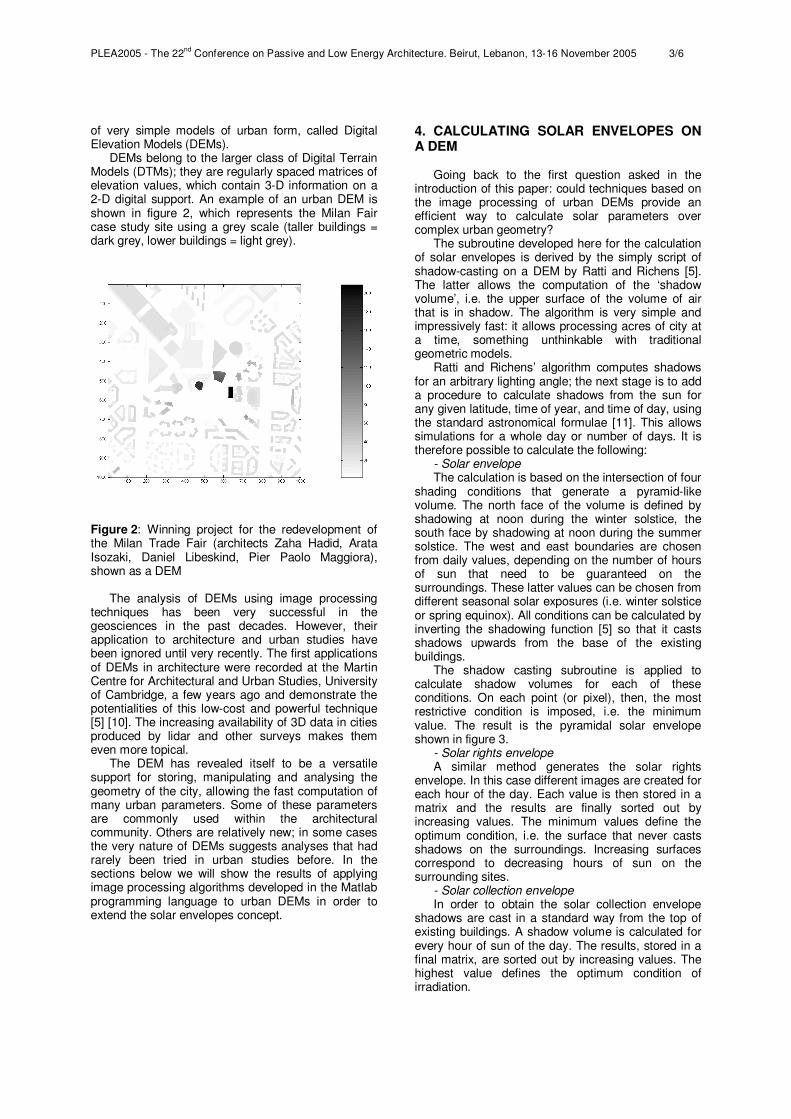
DEMs belong to the larger class of Digital Terrain Models (DTMs); they are regularly spaced matrices of elevation values, which contain 3-D information on a 2-D digital support. An example of an urban DEM is shown in figure 2, which represents the Milan Fair case study site using a grey scale (taller buildings = dark grey, lower buildings = light grey).
Figure 2: Winning project for the redevelopment of the Milan Trade Fair (architects Zaha Hadid, Arata Isozaki, Daniel Libeskind, Pier Paolo Maggiora), shown as a DEM
The analysis of DEMs using image processing
techniques has been very successful in the geosciences in the past decades. However, their application to architecture and urban studies have been ignored until very recently. The first applications of DEMs in architecture were recorded at the Martin Centre for Architectural and Urban Studies, University of Cambridge, a few years ago and demonstrate the potentialities of this low-cost and powerful technique [5] [10]. The increasing availability of 3D data in cities produced by lidar and other surveys makes them even more topical.
The DEM has revealed itself to be a versatile support for storing, manipulating and analysing the geometry of the city, allowing the fast computation of many urban parameters. Some of these parameters are commonly used within the architectural community. Others are relatively new; in some cases the very nature of DEMs suggests analyses that had rarely been tried in urban studies before. In the sections below we will show the results of applying image processing algorithms developed in the Matlab programming language to urban DEMs in order to extend the solar envelopes concept.
4. CALCULATING SOLAR ENVELOPES ON A DEM
Going back to the first question asked in the introduction of this paper: could techniques based on the image processing of urban DEMs provide an efficient way to calculate solar parameters over complex urban geometry?
The subroutine developed here for the calculation of solar envelopes is derived by the simply script of shadow-casting on a DEM by Ratti and Richens [5]. The latter allows the computation of the ‘shadow volume’, i.e. the upper surface of the volume of air that is in shadow. The algorithm is very simple and impressively fast: it allows processing acres of city at a time, something unthinkable with traditional geometric models.
Ratti and Richens’ algorithm computes shadows for an arbitrary lighting angle; the next stage is to add a procedure to calculate shadows from the sun for any given latitude, time of year, and time of day, using the standard astronomical formulae [11]. This allows simulations for a whole day or number of days. It is therefore possible to calculate the following:
- Solar envelope The calculation is based on the intersection of four
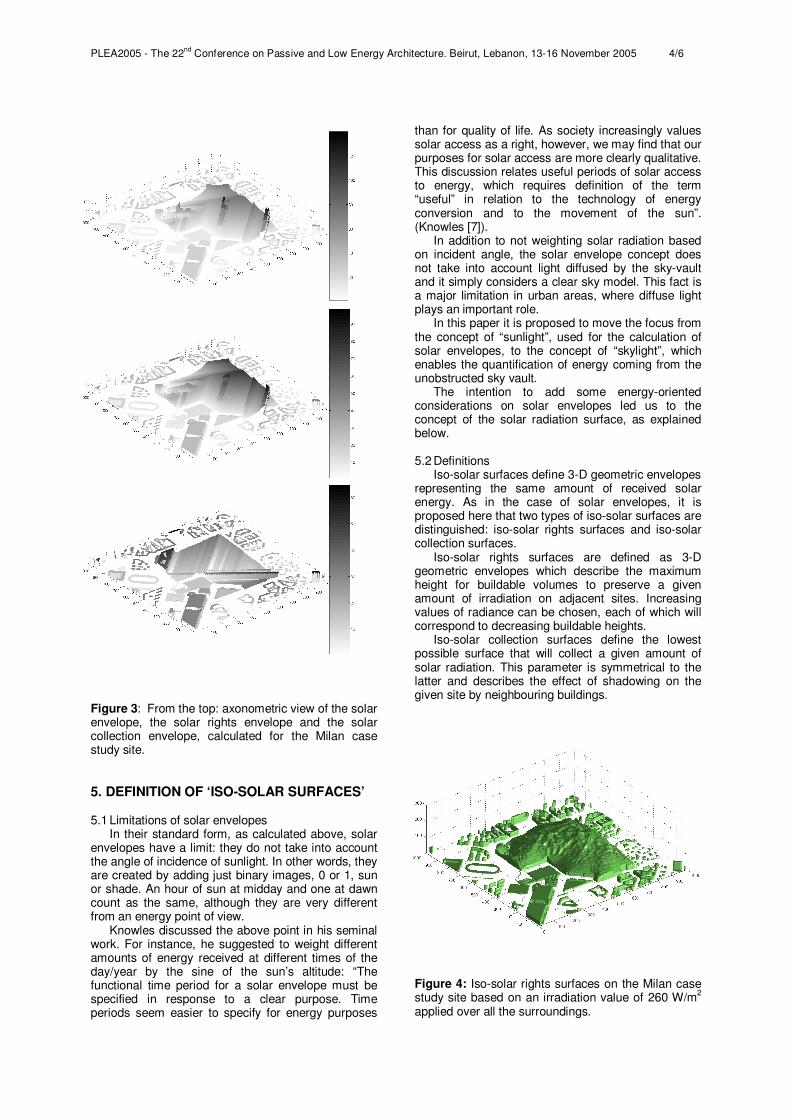
shading conditions that generate a pyramid-like volume. The north face of the volume is defined by shadowing at noon during the winter solstice, the south face by shadowing at noon during the summer solstice. The west and east boundaries are chosen from daily values, depending on the number of hours of sun that need to be guaranteed on the surroundings. These latter values can be chosen from different seasonal solar exposures (i.e. winter solstice or spring equinox). All conditions can be calculated by inverting the shadowing function [5] so that it casts shadows upwards from the base of the existing buildings.
The shadow casting subroutine is applied to calculate shadow volumes for each of these conditions. On each point (or pixel), then, the most restrictive condition is imposed, i.e. the minimum value. The result is the pyramidal solar envelope shown in figure 3.
- Solar rights envelope A similar method generates the solar rights
envelope. In this case different images are created for each hour of the day. Each value is then stored in a matrix and the results are finally sorted out by increasing values. The minimum values define the optimum condition, i.e. the surface that never casts shadows on the surroundings. Increasing surfaces correspond to decreasing hours of sun on the surrounding sites.
- Solar collection envelope In order to obtain the solar collection envelope
shadows are cast in a standard way from the top of existing buildings. A shadow volume is calculated for every hour of sun of the day. The results, stored in a final matrix, are sorted out by increasing values. The highest value defines the optimum condition of irradiation.
PLEA2005 - The 22nd Conference on Passive and Low Energy Architecture. Beirut, Lebanon, 13-16 November 2005 4/6
Figure 3: From the top: axonometric view of the solar envelope, the solar rights envelope and the solar collection envelope, calculated for the Milan case study site. 5. DEFINITION OF ‘ISO-SOLAR SURFACES’ 5.1 Limitations of solar envelopes
In their standard form, as calculated above, solar envelopes have a limit: they do not take into account the angle of incidence of sunlight. In other words, they are created by adding just binary images, 0 or 1, sun or shade. An hour of sun at midday and one at dawn count as the same, although they are very different from an energy point of view.
Knowles discussed the above point in his seminal work. For instance, he suggested to weight different amounts of energy received at different times of the day/year by the sine of the sun’s altitude: “The functional time period for a solar envelope must be specified in response to a clear purpose. Time periods seem easier to specify for energy purposes
than for quality of life. As society increasingly values solar access as a right, however, we may find that our purposes for solar access are more clearly qualitative. This discussion relates useful periods of solar access to energy, which requires definition of the term “useful” in relation to the technology of energy conversion and to the movement of the sun”. (Knowles [7]).
In addition to not weighting solar radiation based on incident angle, the solar envelope concept does not take into account light diffused by the sky-vault and it simply considers a clear sky model. This fact is a major limitation in urban areas, where diffuse light plays an important role.
In this paper it is proposed to move the focus from the concept of “sunlight”, used for the calculation of solar envelopes, to the concept of “skylight”, which enables the quantification of energy coming from the unobstructed sky vault.
The intention to add some energy-oriented considerations on solar envelopes led us to the concept of the solar radiation surface, as explained below. 5.2 Definitions
Iso-solar surfaces define 3-D geometric envelopes representing the same amount of received solar energy. As in the case of solar envelopes, it is proposed here that two types of iso-solar surfaces are distinguished: iso-solar rights surfaces and iso-solar collection surfaces.
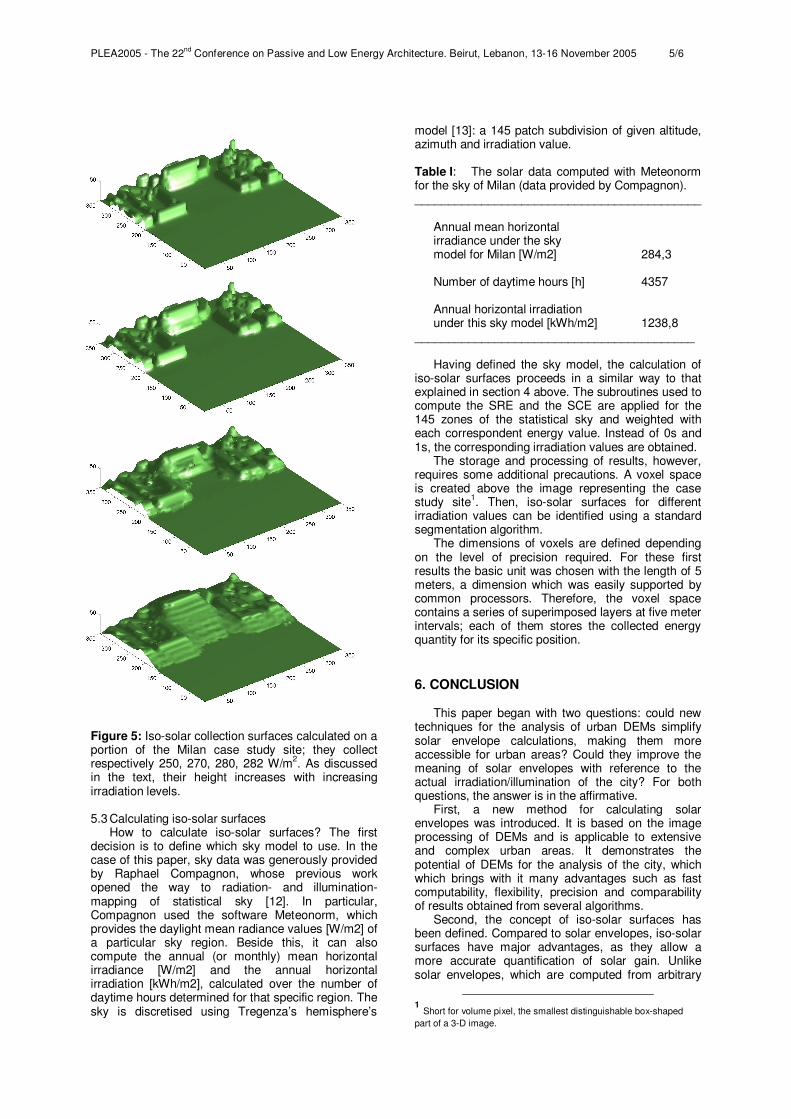
Iso-solar rights surfaces are defined as 3-D geometric envelopes which describe the maximum height for buildable volumes to preserve a given amount of irradiation on adjacent sites. Increasing values of radiance can be chosen, each of which will correspond to decreasing buildable heights.
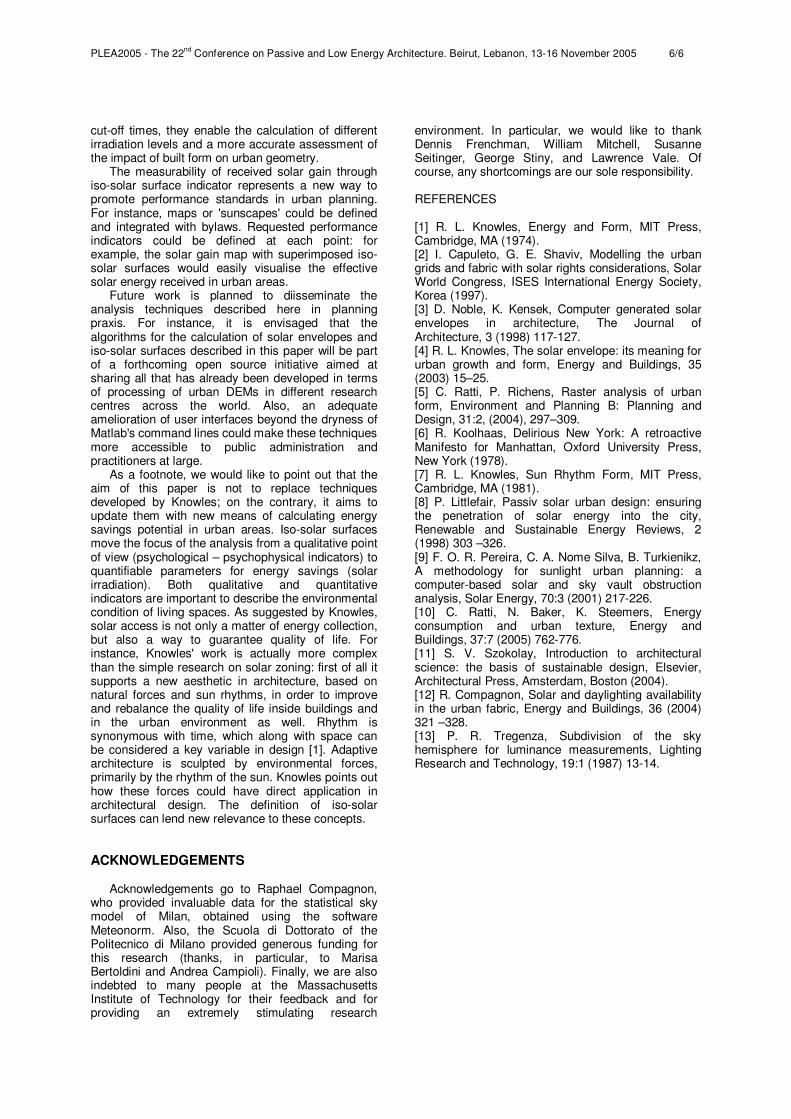
Iso-solar collection surfaces define the lowest possible surface that will collect a given amount of solar radiation. This parameter is symmetrical to the latter and describes the effect of shadowing on the given site by neighbouring buildings.
Figure 4: Iso-solar rights surfaces on the Milan case study site based on an irradiation value of 260 W/m2 applied over all the surroundings.
PLEA2005 - The 22nd Conference on Passive and Low Energy Architecture. Beirut, Lebanon, 13-16 November 2005 5/6
Figure 5: Iso-solar collection surfaces calculated on a portion of the Milan case study site; they collect respectively 250, 270, 280, 282 W/m2. As discussed in the text, their height increases with increasing irradiation levels. 5.3 Calculating iso-solar surfaces
How to calculate iso-solar surfaces? The first decision is to define which sky model to use. In the case of this paper, sky data was generously provided by Raphael Compagnon, whose previous work opened the way to radiation- and illumination-mapping of statistical sky [12]. In particular, Compagnon used the software Meteonorm, which provides the daylight mean radiance values [W/m2] of a particular sky region. Beside this, it can also compute the annual (or monthly) mean horizontal irradiance [W/m2] and the annual horizontal irradiation [kWh/m2], calculated over the number of daytime hours determined for that specific region. The sky is discretised using Tregenza’s hemisphere’s
model [13]: a 145 patch subdivision of given altitude, azimuth and irradiation value.
Table I: The solar data computed with Meteonorm for the sky of Milan (data provided by Compagnon). ___________________________________________
Annual mean horizontal irradiance under the sky model for Milan [W/m2] 284,3 Number of daytime hours [h] 4357
Annual horizontal irradiation
under this sky model [kWh/m2] 1238,8 __________________________________________
Having defined the sky model, the calculation of
iso-solar surfaces proceeds in a similar way to that explained in section 4 above. The subroutines used to compute the SRE and the SCE are applied for the 145 zones of the statistical sky and weighted with each correspondent energy value. Instead of 0s and 1s, the corresponding irradiation values are obtained.
The storage and processing of results, however, requires some additional precautions. A voxel space is created above the image representing the case study site1. Then, iso-solar surfaces for different irradiation values can be identified using a standard segmentation algorithm.
The dimensions of voxels are defined depending on the level of precision required. For these first results the basic unit was chosen with the length of 5 meters, a dimension which was easily supported by common processors. Therefore, the voxel space contains a series of superimposed layers at five meter intervals; each of them stores the collected energy quantity for its specific position. 6. CONCLUSION
This paper began with two questions: could new techniques for the analysis of urban DEMs simplify solar envelope calculations, making them more accessible for urban areas? Could they improve the meaning of solar envelopes with reference to the actual irradiation/illumination of the city? For both questions, the answer is in the affirmative.
First, a new method for calculating solar envelopes was introduced. It is based on the image processing of DEMs and is applicable to extensive and complex urban areas. It demonstrates the potential of DEMs for the analysis of the city, which which brings with it many advantages such as fast computability, flexibility, precision and comparability of results obtained from several algorithms.
Second, the concept of iso-solar surfaces has been defined. Compared to solar envelopes, iso-solar surfaces have major advantages, as they allow a more accurate quantification of solar gain. Unlike solar envelopes, which are computed from arbitrary
1 Short for volume pixel, the smallest distinguishable box-shaped part of a 3-D image.
PLEA2005 - The 22nd Conference on Passive and Low Energy Architecture. Beirut, Lebanon, 13-16 November 2005 6/6
cut-off times, they enable the calculation of different irradiation levels and a more accurate assessment of the impact of built form on urban geometry.
The measurability of received solar gain through iso-solar surface indicator represents a new way to promote performance standards in urban planning. For instance, maps or 'sunscapes' could be defined and integrated with bylaws. Requested performance indicators could be defined at each point: for example, the solar gain map with superimposed iso-solar surfaces would easily visualise the effective solar energy received in urban areas.
Future work is planned to diisseminate the analysis techniques described here in planning praxis. For instance, it is envisaged that the algorithms for the calculation of solar envelopes and iso-solar surfaces described in this paper will be part of a forthcoming open source initiative aimed at sharing all that has already been developed in terms of processing of urban DEMs in different research centres across the world. Also, an adequate amelioration of user interfaces beyond the dryness of Matlab's command lines could make these techniques more accessible to public administration and practitioners at large.
As a footnote, we would like to point out that the aim of this paper is not to replace techniques developed by Knowles; on the contrary, it aims to update them with new means of calculating energy savings potential in urban areas. Iso-solar surfaces move the focus of the analysis from a qualitative point of view (psychological – psychophysical indicators) to quantifiable parameters for energy savings (solar irradiation). Both qualitative and quantitative indicators are important to describe the environmental condition of living spaces. As suggested by Knowles, solar access is not only a matter of energy collection, but also a way to guarantee quality of life. For instance, Knowles' work is actually more complex than the simple research on solar zoning: first of all it supports a new aesthetic in architecture, based on natural forces and sun rhythms, in order to improve and rebalance the quality of life inside buildings and in the urban environment as well. Rhythm is synonymous with time, which along with space can be considered a key variable in design [1]. Adaptive architecture is sculpted by environmental forces, primarily by the rhythm of the sun. Knowles points out how these forces could have direct application in architectural design. The definition of iso-solar surfaces can lend new relevance to these concepts.
ACKNOWLEDGEMENTS
Acknowledgements go to Raphael Compagnon, who provided invaluable data for the statistical sky model of Milan, obtained using the software Meteonorm. Also, the Scuola di Dottorato of the Politecnico di Milano provided generous funding for this research (thanks, in particular, to Marisa Bertoldini and Andrea Campioli). Finally, we are also indebted to many people at the Massachusetts Institute of Technology for their feedback and for providing an extremely stimulating research
environment. In particular, we would like to thank Dennis Frenchman, William Mitchell, Susanne Seitinger, George Stiny, and Lawrence Vale. Of course, any shortcomings are our sole responsibility. REFERENCES [1] R. L. Knowles, Energy and Form, MIT Press, Cambridge, MA (1974). [2] I. Capuleto, G. E. Shaviv, Modelling the urban grids and fabric with solar rights considerations, Solar World Congress, ISES International Energy Society, Korea (1997). [3] D. Noble, K. Kensek, Computer generated solar envelopes in architecture, The Journal of Architecture, 3 (1998) 117-127. [4] R. L. Knowles, The solar envelope: its meaning for urban growth and form, Energy and Buildings, 35 (2003) 15–25. [5] C. Ratti, P. Richens, Raster analysis of urban form, Environment and Planning B: Planning and Design, 31:2, (2004), 297–309. [6] R. Koolhaas, Delirious New York: A retroactive Manifesto for Manhattan, Oxford University Press, New York (1978). [7] R. L. Knowles, Sun Rhythm Form, MIT Press, Cambridge, MA (1981). [8] P. Littlefair, Passiv solar urban design: ensuring the penetration of solar energy into the city, Renewable and Sustainable Energy Reviews, 2 (1998) 303 –326. [9] F. O. R. Pereira, C. A. Nome Silva, B. Turkienikz, A methodology for sunlight urban planning: a computer-based solar and sky vault obstruction analysis, Solar Energy, 70:3 (2001) 217-226. [10] C. Ratti, N. Baker, K. Steemers, Energy consumption and urban texture, Energy and Buildings, 37:7 (2005) 762-776. [11] S. V. Szokolay, Introduction to architectural science: the basis of sustainable design, Elsevier, Architectural Press, Amsterdam, Boston (2004). [12] R. Compagnon, Solar and daylighting availability in the urban fabric, Energy and Buildings, 36 (2004) 321 –328. [13] P. R. Tregenza, Subdivision of the sky hemisphere for luminance measurements, Lighting Research and Technology, 19:1 (1987) 13-14.