Embed Size (px)
Citation preview
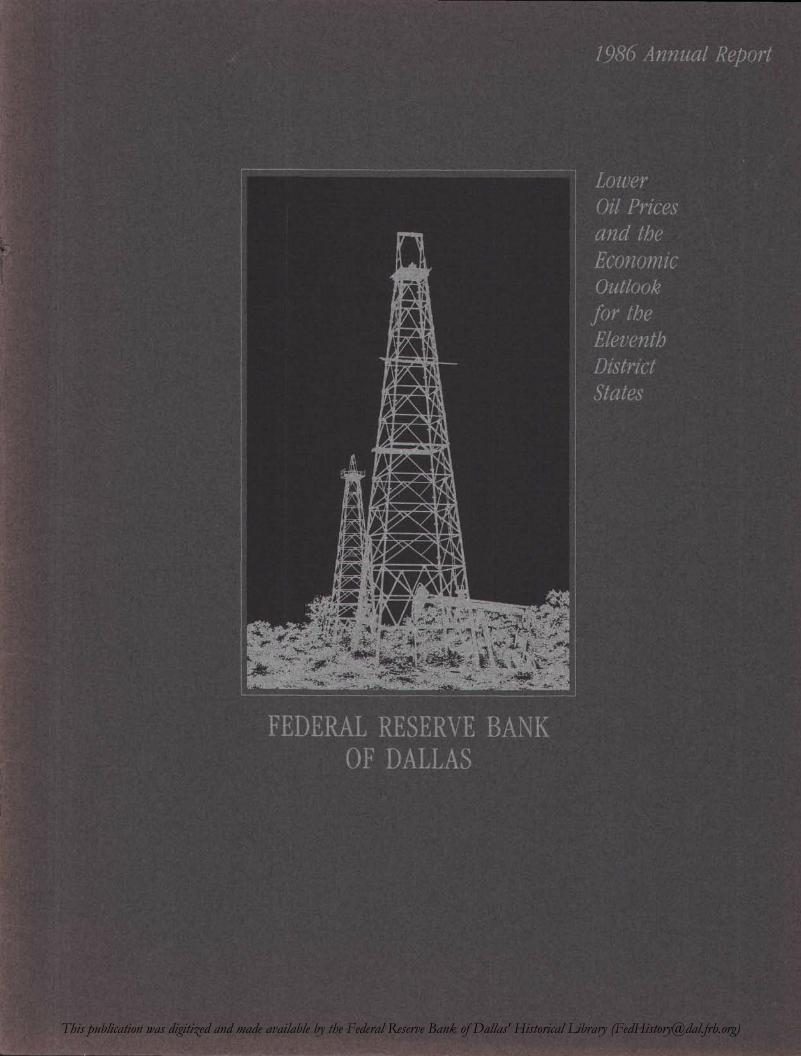
This publication was digitized and made available by the Federal Reserve Bank of Dallas' Historical Library ([email protected])
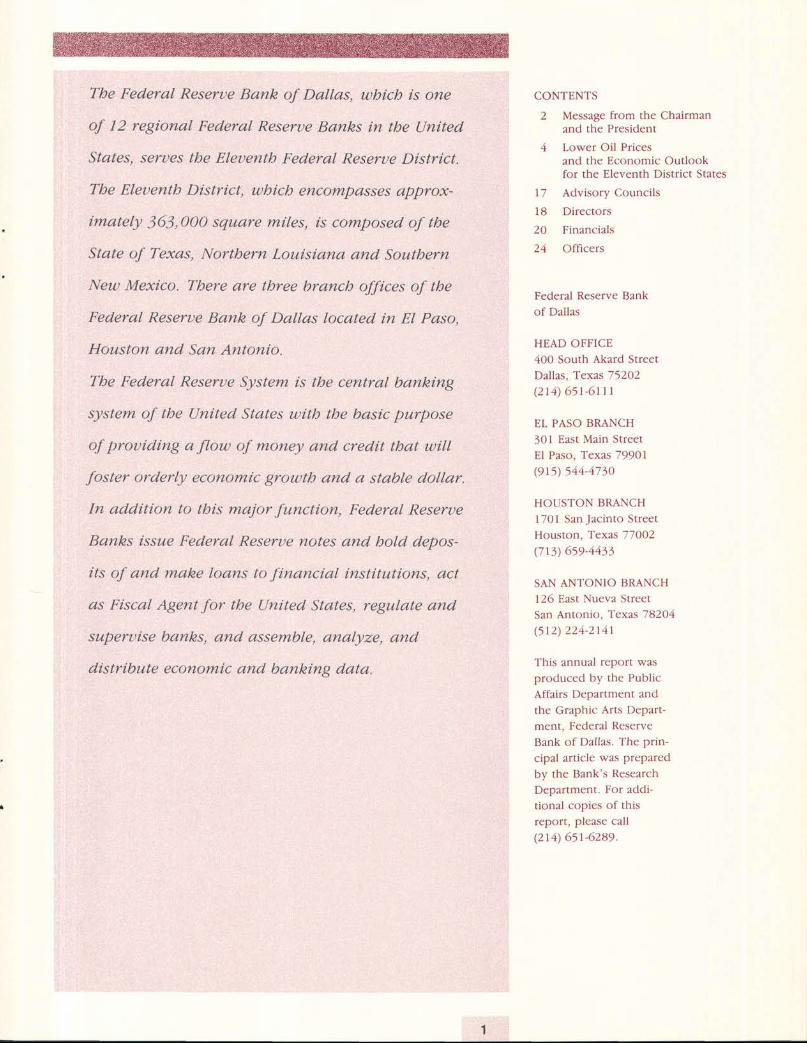
Tbe Federal Reserue Bank of Dallas, wbicb is one
of 12 regional Federal Reserue Banks in tbe United
States, serues tbe Eleuenth Federal Reserue District.
Tbe Eleuentb District, wbicb encompasses ctpprox-
imately 363,000 square miles, is composed of tbe
State of Texas, Nortbern Louisiana and. Soutbern
New Mexico. Tbere are tbree branch offices of tbe
Federal Reserue Bank of Dallas located in El PAso,
Houston and San Antonio.
Tbe Federal Reserue System is tbe central banking
system of tbe United States witb tbe basic purpose
of prouitling a flow of money and credit tbat will
foster orderly economic growtb and a stable dollar.
In addition to tbis major function, Federal Reserue
Banks issue Federal Reserue notes ancl hold depos-
its of ancl make loans to financial institutions, act
as Fiscal Agent for tbe United States, regulate and
superuise banks, and assemble, analyze, Ancl
d.istribute economic and banking data.
CONTENTS
2 Message from the Chairmanand the President
4 Lower Oil Pricesand the Economic Outlookfor the Eleventh Distr ict States
17 Advisory Counci ls
18 Directors
20 Financlals
21 Officers
Federal Reserve Bank
of Dallas
HEAD OFFICE,100 South Akard Street
Dallas, Texas 75202(214) 651 6111
EL PASO BRANCH
301 East Main Street
El Paso, Texas 79901
(915) 544-4730
HOUSTON BRANCH
i701 SanJac in to S t ree t
Houston, Texas 77002
(713) 659 4433
SAN ANTONIO BRANCH
126 East Nueva Street
San Antonio, Texas 78201
(512) 224 2141
This annual report was
produced by the Public
Affairs Department and
thc Graph ic Ar ts Depar t
ment, Federal Reserve
Bank of Dallas. The prin-
cipal art icle was prepared
by the Bank's Research
Department. For acldi-
t ional copies of this
report, please call
(214) 651-6289.
Messagefrom theChaftman
and thePresident
s 1986 is viewed
in retrospect, it
will be remem-
bered as a year
of both rude
awakenings and
challenging op-
portunity. We
have become in-
creasingly aware
that this District's dependence on
the energy sector remains signifi-
cant and that diversification is
essential to sustained growth. In
response to this awareness, we arelearning to reposition ourselvesand to create and draw on new
sources of strength. Traditional
methods of banking in this area aregoing to change dramaticaliy andfrom the experiences of yesterday
we must apply our knowledge to
the challenges of tomorrow.
\trithout question, the region's
economy felt a dramatic impactfrom the effects of failing oilprices. Oil prices fell precipitouslyin early 1986, but late in 1986 andin January of 1987, a general risein prices helped stabilize rhe
energy industry and enhanced the
outlook for 1987. Our dependence
on the energy sector and its effects
on the regional economy are the
topics that this Annual Report ex-plores in detail.
Several other mafor sectors of
this District's economy also de-
cl ined throughout 1986.
Agricultural and real estate sectors
were weak, as were construction
and manufacturing. Lower support
prices and continuing surpluses
should extend the adversity of the
agricultural industry in 1987. The
real estate sector and construction
in general are aiso expected to face
a challenging year. However, based
on recent declines in the value of
the dol lar, manufacturing is ex-pected to show a moderate turn-
around nationally, as well as locaf
ly. In addition, it is anticipated that
the new immigration law, changes
in state fiscal policy, and thepotential impact of federal budget
legislation will have important im-plications for the District.
Strong performances in the ser-vices. clefense, and high-
technology sectors were bright
spots in 1986 and it appears they
wil l continue to be so in 1987. For
the District states-Texas, Loui-
siana, and New Mexico-the
outlook is improving somewhat,
and it is anticipated that positive
benefits will be experienced in this
area in 1987.
While all of these issues have
significantly affected the financial
institutions in this District over the
past year, banking legislation has
presented a new challenge for the
coming year. Legislation in 1986paved the way for interstate bank-ing in both Texas and Louisiana-
providing greater opportunity for
capital to be attracted to the areawhich will certainly have apt.rsi t ive impact on economic
health. In addition, 'Iexas residents
voted to allow limited branch
banking, eliminating a law that had
existed since 1904.
The exact effects of this legisla-
tion may develop slowly and asthe District financial institutions
adapt to these effecrs, so too will
the Federal Reserve. \fith respectto operations, we have set ourgoals and focused our efforts thispast year on providing services
designed to support your efforts inthe efficient operations of your in-
stitutions. We have continued toexplore and introduce new elec-tronic services, making available
key cash management advices
earlier in the day. In response to
user requests, a centralized
customer assistance group has
been created to help resolve prob-
lems and answer financial servicesquestions. lve believe that fhis ser-vice is unique among the Federal
Reserve Banks. Our goals for 1987are to continue to concentrate on
user needs and to serve customer
organizations to the best of our
abi l i ty.
The new year brings about some
new leadership at the Federal
Reserve Bank of Dallas. On Januaryl, Admiral Bobby R. Inman, Chair-
man and Chief Executive Officer
of Westmark Systems, Inc., located
in Austin, officially assumed the
chairmanship of our Board of
Directors. It is a pleasure to extend
our congratulations and support to
him in this responsibility of signifi-
cant importance to the Bank's
operation, as well as to national
Federal Reserve policies.
Looking ahead, encouraging im-provements are foreseen in the
economic outlook, as well aspromising new directions for
financial institutions in this
District. It is our conviction that
this is a time to look back only to
benefit from our experiences of
yesterday, to envision and utilize
the opportunities before us today,
and to strive to accomplish the
goals of tomorrow.
Sincerelv.
(J,*} fi bJ^*Robert H. Bovkin 0President
3
Rogers
of the Board
LowerOil Prices
and the
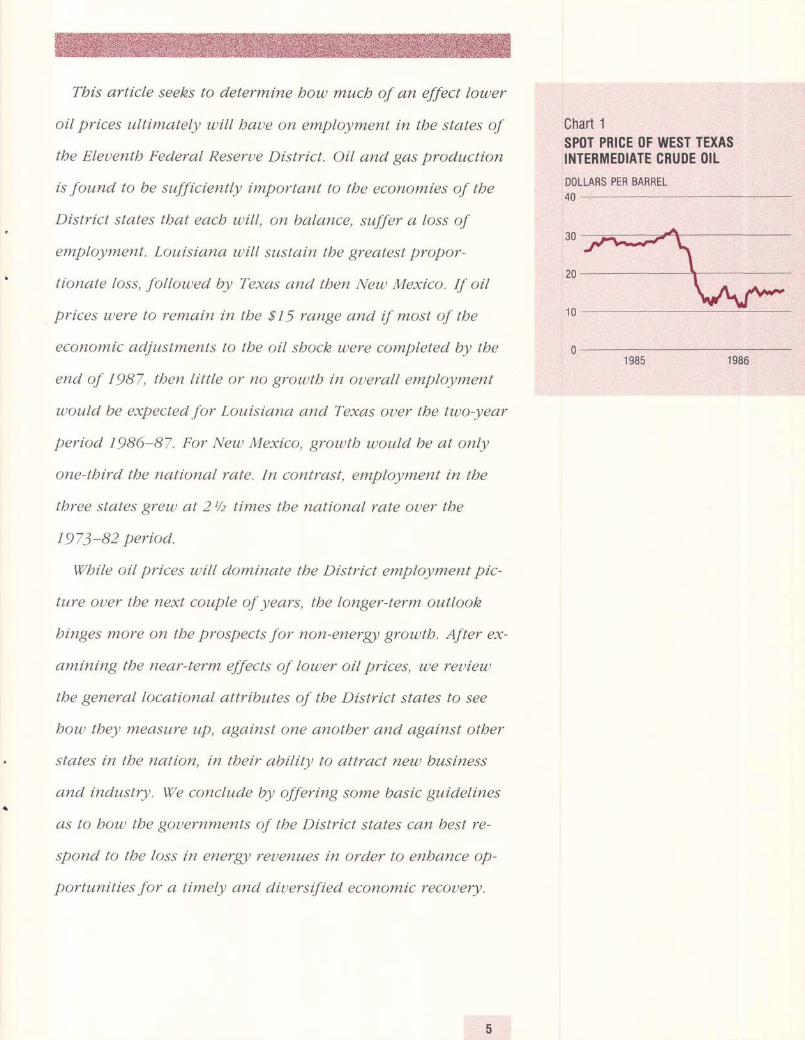
n mid-Nouember 1985, West Texas intermediate
crude oil was sellingfor ff31 per barrel. By tbe end
of Marcb 1986, its price had tumbled to 81 I .50 per
barrel (Cbart 1). Tbat amounts to a 6J-percent
d.ecline in less tban fiue montbs. Rarely in tbe
bistory of markets bas tbe price of sucb an important and
widely traded commodity cbanged so mucb in sucb a sbort
period of time. Analysts are diuided ouer ubetber market
fundamentals will allctw oil prices to remain this lout fctr uery
long. But it is clear tbat expectations baue cbanged and tbat,
at least for tbe next few years, oil prices will be substantially
louer tban preuiously tbougbt.
Tbe fall in oil prices bas bad. a cbilling effect on oil-
prod.ucing industries. National employment in tbe oil and
gas extraction industry dropped. 22 percent in tbe first six
montbs of 1986. Euen more striking, tbe number of rotary
drilling rigs in operation fell 63 percent during tbe same six-
nxontb period. But wbile energJ/ producers suffer, energJ) con-
sumers benefit from tbe reduced cost of oil products and
otber goods and seruices tbat use oil in tbeir procluction.
American consumers uere expected to saue some $60 billion
in energjt costs during 1986 if tbe price of oil aueraged $ 1 5
per barrel.
Economic0utlookfor the
EleventhDistrictStates
Tbis article seeks to determine bow much of an effect lower
oil prices ultimately will baue on employment in tbe states of
tbe Eleuentb Federal Reserue District. Oil and gas production
is found to be sufficiently important to tbe economies of tbe
District states tbat eacb will, on balance, suffer a loss of
employment. Louisiana will sustain the greatest propor-
tionate loss, followed by Texas and tbert Netu Mexico. If oil
prices were to remain in tlse $ 15 range and if most of tbe
economic adjustments to tbe oil sbock were completed. by the
end of 1987, tben little or no groutb in ouerall employment
would be expectecl for Louisiana and Texas ouer the two-year
period. 1986-87. For New Mexico, groutb would be at only
one-tbird tbe national rate. In contrast, employment in tbe
tbree states greu at 21/z times tbe national rate ouer tbe
1973-82 period.
W'bile oil prices uill dominate tbe District employment pic-
ture ouer tbe next couple of years, tbe longer-term outlook
binges more on tbe prospects for non-energJ) growtb. After ex-
amining tbe near-term effects of lower oil prices, we reuiew
tbe general locational attributes of tbe District states to see
bow tbey measure up, against one anotber and. against otber
states in tbe nation, in tbeir ability to attract new business
and industry. 'We
conclude by offering some basic guidelines
as to bow tbe gouernments of tbe District states can best re-
spond to tbe lc,tss in energy reuenues in order to enbance op-
portunities for a timely and diuersified economic recouery.
Chart 1SPOT PRICE OF WEST TEXASINTERMEDIATE CRUDE OILDOLLARS PER BARREL40
30
20
1 0
019861 985
Iflho 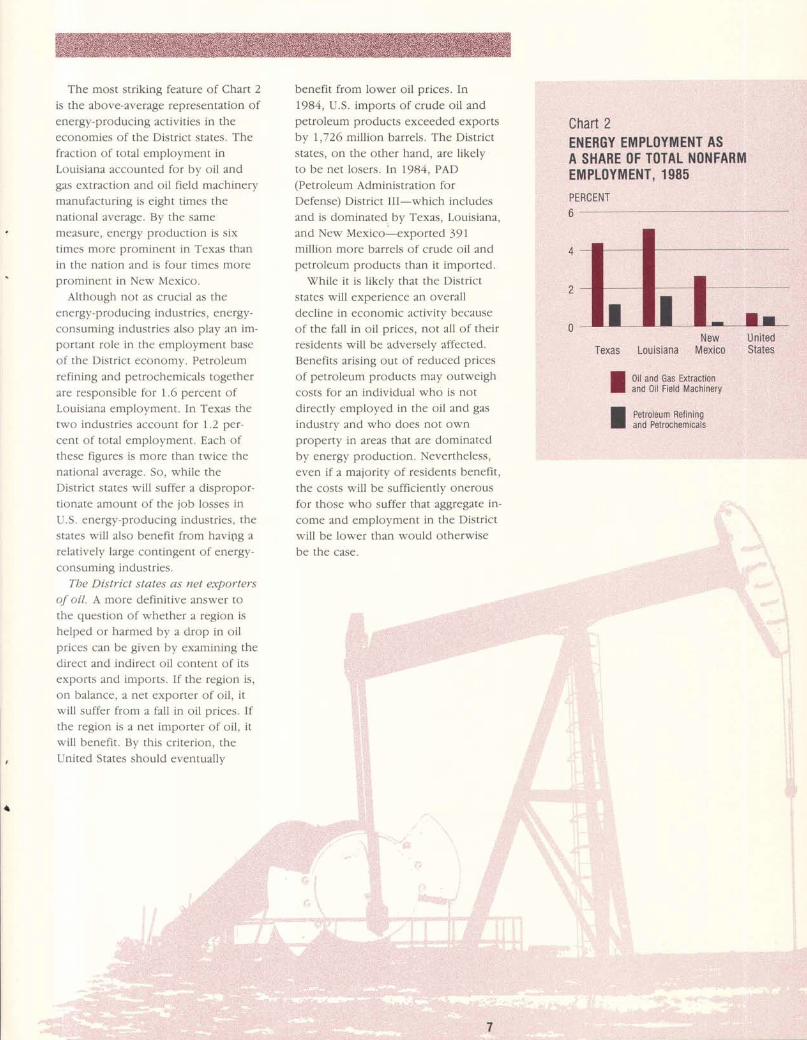
The most str iking feature of Chart 2
is the above-average representation of
energv producing activi t ies in the
economics of the Distr ict states. The
fraction of total emplovment in
Louisiana accountecl for b1. oi l and
gas cxtract ion and oi l f ield machinerv
rnanufacturing is eight t imes the
national average. By the same
measure, energ.v procluct ion is six
t imes more promincnt in Texas than
in the nation and is f i rur t imes more
prornincr-rt in Ncu,' Mexico.
Alt l ' rough not as crucial as the
energr'-pnrducing industr ies, energ)'-
cr- lnsurning industr ies also play an im-
portant role in the ernplovmcnt base
of the Distr icr econom).. Pctroleum
refining and petrochemicals together
are rcsponsible for 1.6 percent of
Louisiana emplovment. In Texas the
t\\ ' 'o incl l lstr ies account for 1.2 per
cent of total emplo_vnrent, Each of
thcse f igurcs is more than twice the
national average. So, while the
Distr ict states wil l suffer a dispropor-
t ionate amount of the job losscs in
LLS. energv-producing inclustr ies, the
statcs rvill also benefit frorn havipg a
rc l : t t i vc lv le rgc c r In t ing ,en t o f encrgr ' -
c0nsuming industr ies.
7'be District states ds net exporters
o.f oil. L rr-rore clefinitivc answer tc)
t l rc ques t ion t r f wht thc r : r rcg ion is
helpecl or harmed b1' a clrop in oi lpr ices can be given b1' exarnining the
direct and incl irect oi l content of i ts
exports ancl imports. I f the region is,
on balance, a net exportcr of oi l , i tq' i l l suffcr from a fal l in oi l pr ices, I f
the region is a net importcr of oi l , i t
r l ' i l l bencfi t . tsr ' this cr i ter ion, the
Linited States shoulcl eventual ly
benefit from lower oil prices. In
1984, U.S. imports of crude oi l and
petroleum products exceeded exports
bv 1,726 mil l ion barrels. The Distr ict
states, on the other hand, are l ikely
to be net losers. In 1984, PAD(Petroleum Administrat ion for
Defense) Distr ict I I I-which inclucies
and is dominated. by Texas, Louisiana,
and Neu' Mexico-exported 391mil l ion more barrels of crude oi l anclpetroleum products than i t imported.
\Xrhi le i t is l ikelv that the Distr ict
states wil l experience an overal l
decl inc in cconomic activi ty because
of the fal l in oi l pr ices, not al l of their
resiclents will be adversely affected.
Bencfi ts arising out of reduced prices
of petroleum products may outweigh
costs for an individual vn'ho is not
direct ly emploved in the oi l and gas
industrv and who does not own
propertv in areas that are dominated
by energv production. Nevertheless,
even i f a majori tv of rcsiclents benefi t ,
the costs n' i l l be suff iciently onerous
fbr those who suffer that aggregate in-
come and emplol 'ment in the Distr ict
n' i l l bc lon e r than woulcl otherwise
be the casc .
Chart 2ENERGY EMPLOYMENT ASA SHARE OF TOTAL NONFARMEMPLOYMENT, 1985
RCENTPE6
NewTexas Louisiana Mexico
I :1,'BiPfl:,'ilffi','1l:,,
I :;n:*,n:nx
U nitedStates
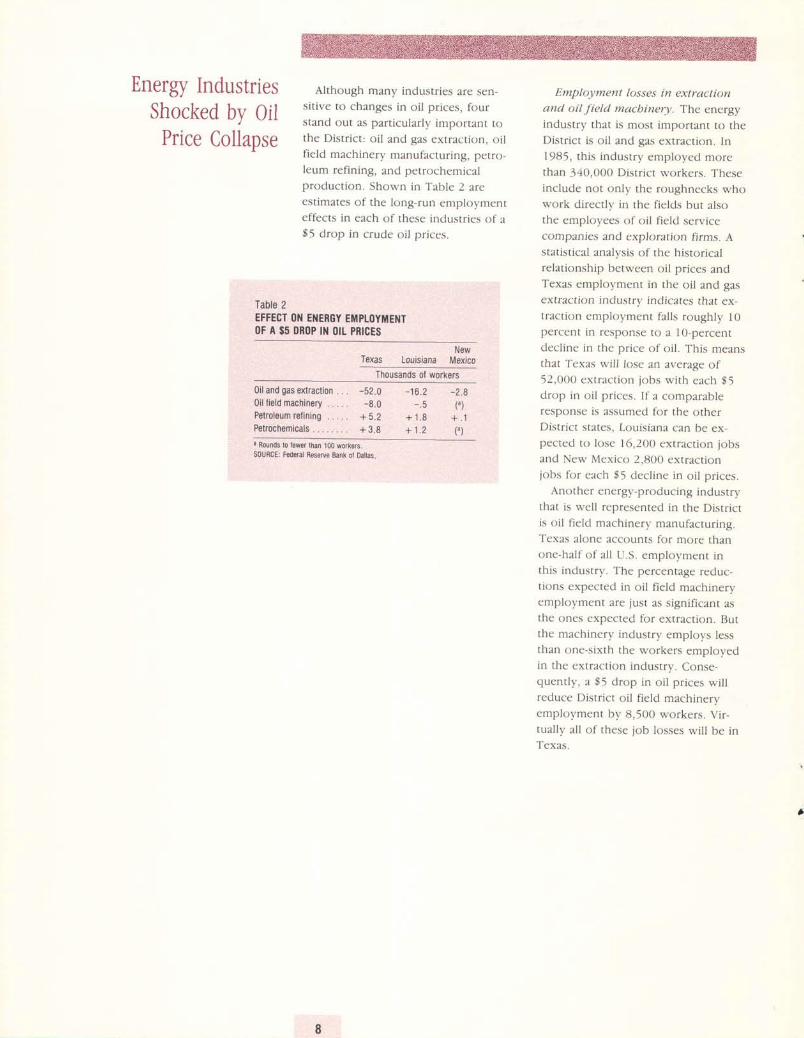
Energy IndustriesShocked by OilPrice Collapse
Although many industries are sen-sit ive to changes in oi l pr ices, fours tand ou t as par t i cu la r ly impor tan t tothe Distr ict: oi l and gas extraction, oi lfield machinery manufacturing, perro-leum refining, and petrochemicalproduction. Shown in Table 2 areestimates of the long-run employmenteffects in each of these industries of a$5 drop in crude oi l pr ices.
Employment losses in extractionand oil field macbinery. The energyindustry that is most important to theDistr ict is oi l and gas extraction. In1985, this industry employed morethan 340,000 Distr ict workers. Theseinclude not only the roughnecks whctwork directly in the fields but alsothe employees of oi l f ield servicecompanies and exploratktn firms. Astat ist ical analysis of the historicalrelationship between oil prices andTexas employment in the oil and gasextraction industry indicates that ex-tract ion employment fal ls roughly l0percent in response to a l0-percentdecl ine in the price of oi l . This meansthat Texas will lose an average of52,000 extraction jobs with each $5drop in oi l pr ices. I f a comparableresponse is assumed for the otherDistr ict states, Louisiana can be ex-pected to lose 16,2OO extracrion iobsand New Mexico 2,800 extractionjobs for each $5 decl ine in oi l pr ices.
Another energy-producing industrythat is well represented in the Distr icri s o i l i i e ld mach inery manufacrur ing .Texas alone accounts for more thanone-half of al l U.S. employment inthis industry. The percentage reduc-tions expected in oil field machineryemployment are just as signif icant asthe ones expected for extract ion. Butthe machinery industry employs lessthan one-sixth the workers employedin the extraction industry. Conse-quently, a $5 drop in oi l pr ices wil lreduce District oil field machineryemplovment by 8,500 workers. Vir-tual ly al l of these job losses wil l be inTexas.
Table 2EFFECT ON EI{ERGY EMPLOYMENT()F A $5 DROP IN OIt PRICES
NewTexas Louisiana Mexico
Thousands of workers0il and gas extractionOil field machinery . .Pelroleum retining . .Petrochemicals . . . . .
-52.0 -16.2 -2.8-8 .0 - .s f )
+ 5 . 2 + 1 . 8 + . 1+ 3 .8 + 1 .2 ( , )
a fiounds to lewer than 100 workers.SoURCE: Federal Reserye Bank ol oailas
EmploJ/ment gains in. refining andpetrocbemicals. In contrast to theireffect on extraction and oil fieldmachinery manufacturing, lower oilprices are expected to raise produc-tion and employment in the refiningand petrochemical indusrries. Adecline in crude oil prices reducesfeedstock costs and forces down theprices of final products. As a result,consumers and producers are en-couraged to substitute petroleum andpetrochemical products for otherfuels and raw materials. A completeadiustment may take years. requir ingchanges in capital to accommodate adifferent energy mix and moreenergy-intensive means of produc-tion. But the long-term effects oflower oil prices on refining andpetrochemical production could besignificant.
Refining employment should riseabout 5 percent with a 1g-percentdrop in oil prices. This means anaverage gain of 5,200 refining iobs inTexas, and 1,800 refining jobs inLouisiana, for every $5 decline in theprice of oil. Employmenr in rhepetrochemical indusrry will besomewhat less responsive to lower oilprices because oil and gas feedstocksaccount for a smaller share of the
costs in that industry. Petrochemical
employment will rise only 3 percent
as a result of a 1O-percent decline in
oil prices. The implication is that
District employment in the petro-
chemical industry will increase by
5,000 jobs for every $5 drop in oi lpflces.
The actual levels of employment in
refining and petrochemicals need notrise during the next few years. Not
only are the stimulative effects oflower oil prices likely to be delayed,
but these industries v/ill continue to
struggle with deregulation and excess
cap^city in world markets. Still, the
drop in oil prices will make refiningand petrochemical employmentgreater fhan would otherwise be the
case.
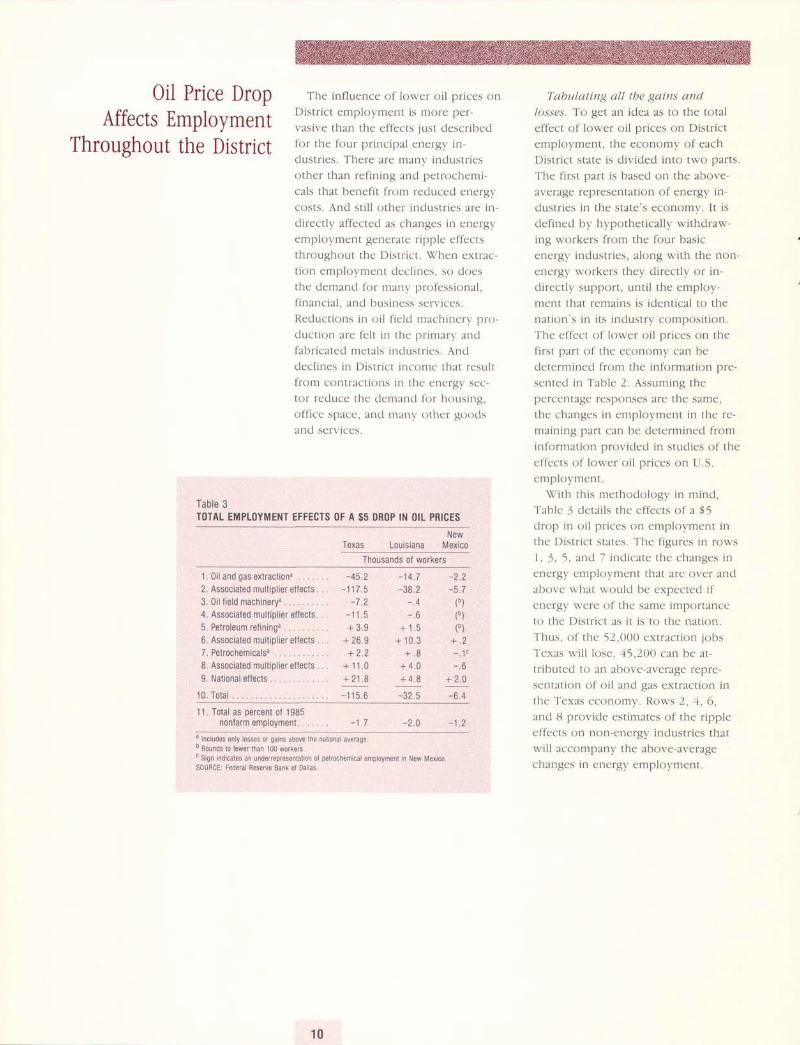
Oil Price Drop The inf luence of lower oi l pr ices onDistr ict cmplovment is more per-
vasive than the effects just describedfor thc fuur p r in t ipa l e nergr i r r
dustr ies. There are manr. industr ies
other than ref ining ancl petrochemi-
cals that benefl t from reducecl energv
costs. And st i l l other inclustr ies are in-
direct ly affected as changes in energvemplovment generate r ipple eff 'ectsthroughout the Distr ict. \when extrac
tion cmplovment decl incs, so doesthe dcmand for ntanl prof 'essional,
f i n l n t i a l , a n d h u s i t t e . s s L r v i ( L s .Recluctions in oi l f ic lcl machincn' pro-
cluct ion are f 'el t in t l"rc priman' andfabricated metals rndustr ics. Andclecl ines in Distr ict income that result
f rom cont rac t ions in the energ) 'sec-tor rcduce the dcmand for housing,
off icc space, ancl ntany ()thcr g()ods
ancl serviccs.
Tabulating all the gains anrl
/osses. To get an idea as to the total
effect of lower oi l pr ices on Distr ict
employment, the economv of each
Distr ict state is divided into two parts
The f irst part is based on the above-
average representation of energf in-
dustr ies in the state's econom)'. I t is
defined bv hl.pothetical ly withdraw-
ing n'orkers from the four basic
energ)' industr ies, along with the non-
energv vu orkers thev directl,v or in-
cl irect l l ' support, unti l the employ-
ment that remains is iclentical to the
nation's in i ts industrv composit ion.
The effect of lower oi l pr ices on the
first part of the economv can be
determined from the information pre-
sented in ' I 'ablc 2. Assuming the
pefcentage responses are the same,
the changes in enplol 'ment in the re-
maining part can be determined from
infbrmation provided in studies of the
effects of lon'er oi l pr ices on U,S.
emplovment .
\ i l i th this methodologv in rnind,
Table J cletai ls the effects of a $5
drop in oi l pr ices on emplovment inthc D i5 t r i c t \ ta tes . Thc l ' i gurcs in r , rs s
l , 3, 5, ancl 7 incl icate the changes in
energv emplovn-rcnt that are over and
abor. 'e what would bc expectecl i f
energ\. were of the same importance
to the Distr ict as i t is to the nation.
Thus , o f the 52 ,000 ex t racr ion jobs
Texas q. i l l lose, . i5,200 can be at-tr ibuted to an above-average r€pre-
sentation of oi l ancl gas cxtract ion in
the Texas econoln.v. Rons 2, 4. 6,
ancl 8 provicle estimates of thc r ipple
efTects on non-cnergv industr ies thatn' i l l accompan\. the above-average
changcs in energ',. en-rployment,
Affects EmploymentThroughout the District
Table 3TOTAL EMPLOYMENT EFFECTS OF A $5 DROP IN OIL PRICES
NewTexas Louisiana Mexico
Thousands of workers
1 . O i l and gasex l r ac t i ona . . . . . .2. Associated multiplier effects . .3. 0 i l f ie ld machinerya4, Associated mul t ip l ier eJlects. .5. Petroleum refininga .6. Associated multiplier e{fects . .7. Petrochemicalsa8. Associated multiplier effects . .9. National eflects
10. Total .
- 1 4 . 7 - 2 . 2-38.2 -5.7
- .4 (o)- , 6 ( o )
+ 1 .5 ( ' )+ 1 0 . 3 + . 2
+ . 8 - . 1 c
+ 4 . 0 - . 6
+ 4 .8 + 2 .0
-45
-7- 1 1
+ 3 . 9+ 26 .9+ 2 . 2
+ 1 1 . 0+ 2 1 . 8- 1 15 .6 - 32 ,5 -6 .4
11. Total as percent of 1985non{arm employment. .
a lncludes only losses or gains above the nat ional avetage.
" Rounds to iewer than 100 workers.c Sign indicates an underrepresenlat ion oi petrochemical employment in New Mexico.S0URCE; Federal Reserve Bank 0t Dal las.
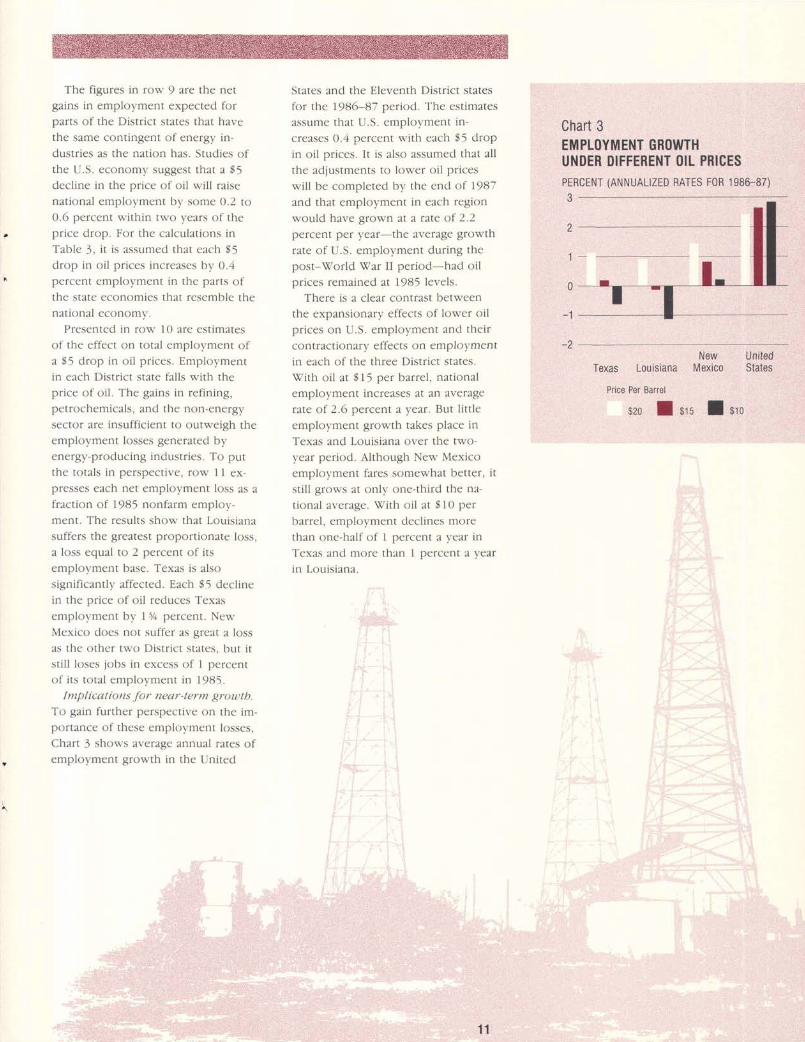
The figures in nrq' 9 are the netgains in emplovment expected forparts of the Distr ict states that have
Ihc samc cont ingcnt , r f encrgr in -
dustr ies as the nation has. Studies ofthe U.S. economv suggest tha t a $5
decl ine in the price of oi l wi l l raise
national emplovment bv some 0.2 to
0.6 percent n' i thin tn'o vears of theprice drop. For the calculat ions in
Table J, i t is assumed that each $5
drop in oi l pr ices increases b1' 0.,1percent emplovment in the parts ofthe state economies that resemble thcnational econontv.
Prescntcd in run I o : l rL cs t im: l t c5
of the effect on total emplovment of
a $5 drop in o i l p r i ces . Emplovment
in each Distr ict state fal ls N,i th theprice of oi l . The gains in ref ining,
petrochemicals, ancl the non-energv
sector are insuff icient to outu'eigh the
emplovment losses generatccl bv
energ.v-producing industr ies. To put
the totals in perspective, rou' 1 1 ex-presses each net emplol 'ment loss as afract ion of 1985 nonfarm emplov
ment, The results shou'that L()uisiana
suff 'ers the greatest proport ionate loss,
a loss equal to 2 percent of i ts
emplovment base. Texas is alscr
signif icantl ,v affected. Each $5 decl ine
in the price of oi l recluces Texas
emplovr-nent bv 1 3/< percent. Nerl
Mexico <Joes not suffer as great a lossas the other tv,.o Distr ict states, but i tst i l l loses jobs in cxcess of I percent
o f i t s to ta l empk;vment in 1985.
Implicaf iotts Jor near-term grou)tb.
To gain further perspectivc on the im-portance of these emplor.ment losses,
Chart 3 shon's average annual rates ofemplo,vment grov! ' th in the United
States and the Eleventh Distr ict states
for the 1986-87 periocl. The estimates
a s s u n ) c t h a r t . 5 . c m p l u r m e n t i n -
creases 0.,1 percent with each $5 drop
in oi l pr ices, I t is also assumed that al l
the adjustments to lov/er oi l pr ices
wil l bc completed by the end of 1987
and that emplo,vmer-rt in each region
r.oulcl have gro$'n at a. rate <tf 2.2
percent Per vear thc average groe'th
rate of U.S. emplol.ment during the
post-\Vofld War II period-hacl oi l
pr ices remained at 1985 levels.
There is a clear contrast betw-een
the expansionarv effects of lon'er oil
pr ices on U.S. emplo,vment and their
contractionar_v effects on emplo),ment
in each of the three Distr ict states,
\f l i th oi1 at $15 per barrel, national
employment increases at an average
ratc of 2.6 percent a year. But l i t t lc
emplo'n.ment gros'th takes place in
Texas and Louisiana over the tsro-
vear period. Although New Mexico
emplol 'ment fares somen'hat better, i t
st i l l grows at onl.v one-third the na
tional average. Vith oi l at $10 per
barrel, employment clecl ines more
than one half of I percent a year in
Texas and more than I percent a year
in Louisiana.
Chart 3EMPLOYMENT GROWTHUNDER DIFFERENT OIL PRICESPERCENT (ANNUALIZED RATES FOR 1986-87)
o
1
0
- 1
-2New
Texas Louisiana Mexico
Price Per Barrel
$20 I s , , l s ro
UnitedStates
The DistrictBusiness Climate
Box ADeterminants of
State Economic Growth
What factors determine the rate 0f economic growthin a state? The fol lowing discussion summarizes whatis known f rom studres of lhe location decisions madeby U.S, businesses and their employees over the pastseveral decades.
Natural attrtbutes. l t is clear from the ex-periences ol Texas, West Virginia, and other stateswith large mineral deposi ls that natural resources canplay an importanl role in the course 0f a state'secon0mic development. But other natural factorsseem to matter too. There is substantial agreement,for example, that the arid and variable cl imates oJ theweslern states contr jbuted signlf lcani ly t0 the growth0l their populat ions during lhe past two decades. Onthe other hand, heat and humidi ly worked to the dis-advantage 0f the southeastern states. The avai labi l i tyof land als0 seems to have been a factor in many loca-t r0n dec is ions . Cap i ta l - in tens ive indus t r ies , in par -t icular, have located with increasing frequency instates with low populat ion densit ies.
Educational attainment, The education level of astate's population does not have much of an effect onits overal l rate of economic growth. But educationlevels do inf luence the c0mposit ion ol business acl iv-i ty that takes place within a state's borders. Thepresence of highly educated and ski l led workers iscri t ical lor technological ly sophist icated industr ies.States with an abundance of low-ski l led workers. onthe other hand, wi l l be more successful in attract ingindustr ies that employ large numbers ol workers per-forming simple and roul ine lob rasks.
Unionism. Virtual ly al l studies show unionizationl0 be 0ne of the most important factors in the location
Adjustments in energy and relatedindustries will continue to dominatethe Distf ict economy over the nextcouple of years. Once these acijust-ments have been made, however, theeconomic health of the Distr ict srateswil l hinge more crucial ly on theirabi l i ty to retain and attract non-energy business. tsox A provicles asummary of the locational attr ibutcsthat have proved to be mosr signif i-can t in cxp la in ing s ta tc cconomicgrowth. Those cri teria are used hcreto see how the l) istr ict states mcasLlreup as potential sites for neq. peopleanci industry.
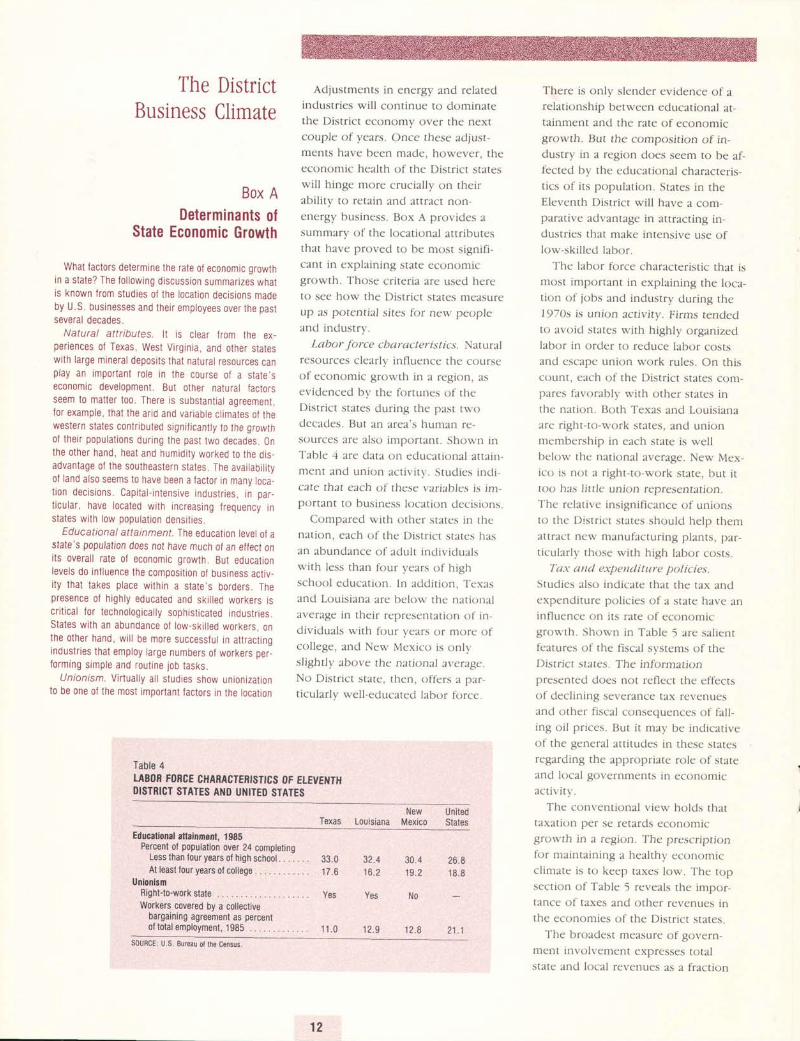
Labctr J-orce c barac t er i s t ic.s. Naturalresources clearly int luence the courseol- ccont.rmic growth i l t a rcgi()n. l lsevidcnced b,v the fortuncs of theDistr ict states during the past twodecades. But an area's truman rc-s()urces arc also important. Shown inTable 4 are data on educational attain,ment ancl union activi ty. Studies inci icate that each of these variab.les is im-portant to busincss location <Jecisit tns.
Compared with othcr states in thenation, each of the Distr ict states hasan abundance of aclult individualswith less than four years of highschool education. ln addit ion, Texasand Louisiana arc below thc nationalaverage in their representation of in-dividuals with four ) 'cars or morc ofcol lege, anci New Mexicr> is onltst ightly ' above rhe narional average.No Distr icr srate, then, offers a par-t icularlv well-educatecl labor tbrce .
There is only slender evidence of arelationship between educational at-tainment and the rate of economicgrov/th. But the composition of in-dustry in a region does seem to be af'-f'ectcd by the educational characteris-t ics of i ts populat ion. States in theEleventh Distr ict wi l l have a com-parative aclvantage in attracting in-dustr ics that make intensive use oflow-ski l lecl labor.
l'hc labor fbrce characteristic that ismost important in explaining the loca-t ion of jobs and industrv during the1970s is union acrivi t ' r , ' . Firms rendedto avoid srates with highly organizedlabor in ordcr to reduce labor costsand cscape union work rules. On thiscount, each of the Dis[ ict states com-pares favorably with other states inthe nation. Both Texas and Louisianaare r ight-to-work states, ancl unionmembership in each state is wellbelou. the national average. New Mex-ico is not a r ight-t<t-work state, but i ttoo has l i t t . le union representation.The rclat ive insignif icance of unionsto the Distr icr srares shoulcl help themattract new manufacturing plants, par-t icularlv those with high labor costs.
Tax attel expenditure policies.
Studies also indicate thar the tax andexpenditure pr>l icies of a state have anin f lucncc on i t s ra tc o f cconomicgron'th. Shown in ' i 'able
5 are sal ientfcatures of thc f iscal systems of theDistr. ict stares. The infofmationprescntccl cioes not reflcct the eff'ectsof decl ining severance tax revenuesancl other fiscal consequences of fall-ing oi l pr ices. Bur i t may be indicativeof the gencral att i tudes in these statesregarding the appropriate role of stateand krcal governments in economicactivi t) ' .
Thc conventional view holds thatta \a l i ( ,n pcr sc rc ta rds cconomicgrorr rh in a rcgiun. Thc prcscript ionlb r n ra i r r ta in ing a hea l thy c ( 'onumicchmate is to keep taxes lon'. The topsection of f 'able 5 reveals the impor-tanL 'c o t - taxcs and r> ther revenues inthe economies of the Distr ict states.
' I 'he broadest measure of govern^
ment involvenlent expresses totalstate and local revenues as a fract ion
Table 4TABOB FORCE CHARACTEEISTICS OF ETEYENTHDISTRICT STATES AI.ID UNITED STATES
New UnitedTexas Louisiana Mexico States
Educalional atlainmont, t9B5Percent of population over 24 completing
Less than four years of high school . . . . . . .At least four years of college .
UnionismRight-to-work stateWorkers covered by a collective
bargaining agreement as percento f to ta l employment . 1985 . . . . .
J J . U
17.6
Yes
1 1 . 0
NO
32.416.2
Yes
30.4 26.819.2 18.8
21.1SoURCE: U.S. Bureau ol the Census.
12.9 12.8
of state personal income. Here there
is great variation between the District
states. Texas is below the national
average in the fraction of personal in-
comc absorbed by state and localrevenues. Louisiana and New Mexico,
on the other hand, are well above the
national average. New Mexico, in par-
ticular, has more than one-fourth ofpersonal income going to state and
lor 'al governments. This fact part ly
reflects that New Mexico is a rela-
t ively poor state, with a great deal ofsubsistence farming and few two-
income famil ies. Nevertheless, judging
from these figures, Texas would be atan advantage, and Louisiana and New
Mexico at a disacJvantage, whenrecruit ing new businesses.
Vhile all taxes are thought to in-
f luencc industry location decisions,
business taxes are often considered
more important than personal taxes.
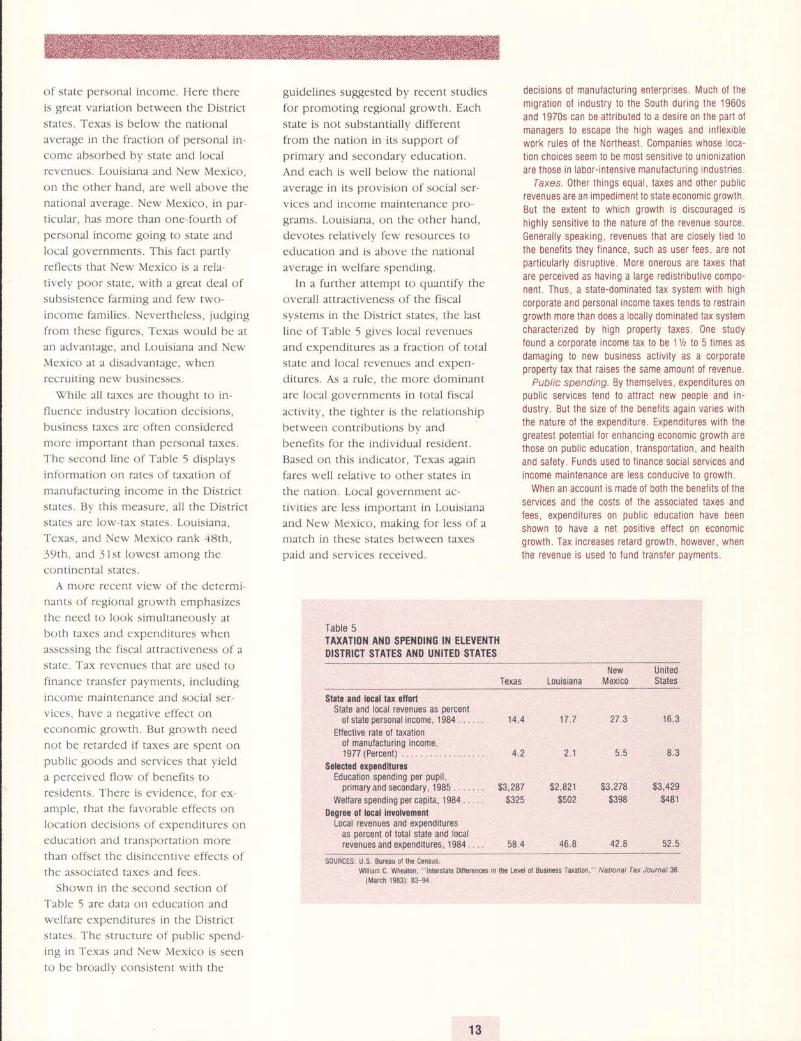
The second l ine of Table 5 displays
information on rates of taxation of
manufacturing income in the District
states. By this measure, al l the Distr ict
states are low-tax states. Louisiana,
Texas, and New Mexico rank 48th,
39 th , and J ls t lowest among the
continental states.
A nlorc recent view of the determi-nants of regional growth emphasizesthe need to look simultaneously at
both taxes and expenditures when
assessing the f iscal attract iveness of a
state. Tax revenues that are used t<>
finance transfer payments, including
income maintenance and social ser-vices, have a negative cffect on
economic growth. But growth need
not be retarded i f taxes are spent onpublic goods and services that yicld
a perceived flow of benefits t<;
residents. ' l 'here is evidence, for ex-amplc, that the favorable effects onlocation decisions of expenditures oneciucation and transportat ion more
than ofTset the disincentive effects of
thc associated taxes and f'ees.
Shown in the second section ofTable 5 are <iata on education and
wclfare expenditures in the Distr ict
states. The structurc of publ ic spend-ing in Texas and Ncw Mexico is seento be broadly consistent with the
guidelines suggested by recent studies
for promoting regional growth. Each
state is not substantially different
from the nation in its support ofprimary and secondary education.
And each is well below the national
average in its provision of social ser-
vices and income maintenance pro-
grams. Louisiana, on the other hand,
devotes relatively few resources to
education and is above the national
average in welfare spending.In a further attempt to quantify the
overall attractiveness of the fiscal
systems in the Distr ict states, the last
line of Table 5 gives local revenues
and expenditures as a fraction of total
state and local revenues and expen-
ditures. As a rule, the more dominant
are local governments in total fiscal
activi ty, the t ighter is the relat ionship
betwecn cont r ibu t ions by and
benefits for the individual resiclent.
Based on this indicator, Texas again
fares well relative to other states in
the nation. Local government ac-
t ivi t ies are less important in Louisiana
and New Mexico, making for less of a
nratch in these states between taxes
paid ancl services received.
Table 5TAXATI0N AilD SPENDII'IG lN ELEVENTHDISTRICT STATES AI{D UNITED STATES
decisions of manufacturing enterprises. Much 0J themigration 0f industry to the South during the 1960sand 1970s can be attr ibuted to a desire on the part 0lmanagers to escape the high wages and inl lexiblework rules 0f the Northeast. Companies whose loca-t ion choices seem to be most sensit ive to unionizationare those in labor-intensive manufacturing industr ies.
faxes. 0ther things equal, taxes and 0ther publ icrevenues are an impediment t0 state economic growth.But the extent to which growth is discouraged rshighly sensit ive to the nature of the revenue source.General ly speaking, revenues that are closely t ied t0the benefi ts they f inance, such as user fees, are notpart icularly disruptive. More onerous are taxes thatare perceived as having a large redistr ibutive compo-nent. Thus, a state-dominated tax system with highcoroorate and 0ersonal income laxes lends t0 restraingrowth more than does a local ly dominated tax systemcharaclerized by high property taxes.0ne studylound a corporate income tax to be l% to 5 t imes asdamaging to new business activi ty as a corporateproperty tax that raises the same amount of revenue.
Public spending. By themselves, expenditures onpublic services tend t0 attract new people and in-dustry. But the size of the benefi ts again varies withthe nature of the expenditure. Expenditures with thegreatest potential for enhancrng economic growth arelhose on public education, transportat ion, and healthand sa{ety. Funds used to f inance social services andincome maintenance are less conducive t0 growth.
When an account is made 0f both the beneli ts o{ theservices and the costs of the associated taxes andfees, expenditures on public education have beenshown lo have a net posit ive el lect on economicgrowth. Tax increases retard growth, however, whenthe revenue is used to fund transfer oavments.
Texas LouisianaNew United
Mexico Slates
Slato and local tax ollortState and local revenues as percent
0f state oersonal income. 1984 .. . . . .Ellective rate ot taxation
of manufacturing income,1977 (Percent)
$s16cl6d oxponditulosEducation spending per pupil,
p r imaryand secondary , 1985. . . . . . .Weltare spending per capita, 1984 . . . . .
0ogroo ol local involvomontLocal revenues and exoenditures
as percent of total state and localrevenues and exoenditures. .1984. . . .
14.4
4 . 2
$3,287$325
58.4
17.7
2 . 1
$2,821$502
46.8
27.3 16 .3
$3,278 $3,429$398 $481
42.8 52.5
6 . J5 .5
SoURCES: U.S. Bureau ot the Census.William C. Wheaton, "lnterstate Diltsrences in the Level 0t Business Tffiti0n," Natlonal Tax Joumal 36
{March 1983): 83-94.
Box ReferencesBart ik, Timothy J. "Business Location Decisions inthe Uniled Stales: Estimales 01 the Effects ofUnronization. Taxes, and 0ther Characterist ics ofStates. " Journal ol Buslness & EconomicStal isl ics 3 (January 1985): 14-22.
Carlton, Dennis W. "The Location and EmploymenlChoices ot New Firms: An Econometric Model withDiscre te and Cont inuous Endogenous Var iab les . "Beview of Economtcs and Statist ics 65 (Auoust1 9 8 3 ) : 4 4 0 - 4 9 .
Helms, L. Jay. "The Eflect of State and Local Taxeson Econ0mic Growth: A Time Series-Cross Secl ionAooroach." Revrew of Economtcs and Slat ist ics67 lNovember 1985): 574-82
Newman, Rober t J . " lndus t ry Migra t ion and Growthin the Soulh. " Revtew of Economtcs andStaflsl lcs 65 (February 1983): 76-86.
P lau t , Thomas R. , and J0seph E. P lu ta . "Bus inessClimate, Taxes and Expenditures, and Slate Industr ialGrowth in the United States." Southern EconomicJourna l 50 (Ju ly 1983) . 99-119,
Wasylenk0, Michael, and Therese McGuire. "Jobsand Taxes: The Effect of Business Climate on States'Employment Growth Rates." Natianal Tax Journal38 (December 1985) : 497-51 1 .
An ot 'eral l dssessment. Thcre is ncr
simple means of sur"nmarizing the
locational attr ibutes of the Distr ict
statcs. Thcv arc al l lon'-union stetcs,
\\'l-tich should help tl-rem ;rttract nes'
manuf)cturing faci l i t ics. I lut thev haveverv cl i f ferent tax :rncl expencl i turcpol icies, Of the three states. Texrs
sccms to ha', 'c the f iscal sYstem that is
most conclLlcir.e tO econor]] ic gron't l ] .
Taxes are los,.. transf-er palntcnts arelovn', ancl a relat ivelv Iargc sharc off iscal act ivi tv takes place l t thc local
level. Louisiana, on the ()thcr hend,
appears to have the lerst xttract ive
f iscal svster-r-r. l ts state ancl krcal
revenlles absorb an abovc-avcrage
share of personal incor-ner vct i t ranks
lSth lon,est in the Llnitccl States in
eclucatior-r spencl ing pcr pupi l , The
other Distr ict state . Nevr' Nlexico. alsohas a rclat ivclv largc f lo\-ernment scc-tor. But the composit ion of i ts spcncl-
it-tg is more favorable fror-n a grou'th
perspectir . 'e, r l . i th greatcr cr-r-tphasis on
e d u c : r t i o n . r r t d l c r r e r t t l r h : t s i s . r t tq.elfare.
In the past the governnrcnts of the
Distr ict states haVe rcl iccl to an e r-
traorcl inart ' clcgrec cln rer,cnucs fnrnr
the taxation of oi l ancl gas procluc-
t ion . Dur ing f l sca l ver r 198J , sevcr -
ance tax col lect ior-rs :rccounte cl f i rr l -
l ) c r ( e n t ( ) l - 8L r lL r ' . l l s l : r t c r ( \ L t lu ( \ in' I 'exas
ancl I-ouisiana and for I 5 pcr-
ccnt of state revenues in Ne\\ ' Xlexico.
J I ) ( ( ' n t r J S l , s c \ c r l n ( ( l J X ( ' s n a t i ( ) l l -
q-rde contr ibutcd onlr ' 3 perccnt tcr
thc revcnues of el l state g()\ 'crnments.
Sincc scverance tax col lcct ions ancl
other energ),related revenues are
sensit ive to oi l ancl gas prices. thc
go\.ernments of the Distr ict states trce
the prospect of ser-erc budget sl-rort-i l l l : i n t , , r ' t t i r l g \ ( J r : . l i : t r r i n g : u t r
signif icant deplet ion of capital
reserves, sorne combir-tat ion ()f spcncl-
ing cuts ancl revenue incrcascs n' i l l bc
necess'tr\ ' .
l?ec o nt ttt e t t d ct t t ( ) | ts ( ) | t c.V ) e I t (/ i t t t res.
As notecl prer. iouslr ' . publ ic spcncl ing( ) n \ ( ) c i a l s c r r i c c s : t n r l i n c r ) n l e t ) l r l i r l l L -
nance appears to have a detr inrental
eff 'ect on the ovcral l lcvel of statc
cconomic activi tv. Cuts in transfer
pfograms, then, might be madeq'ithout reclucir-rg the lonp4-term rate
of ecor-ror-r-ric gro$'th. But other forms
of spending, including education and
transportat ion, seem to be posit ively
relatecl to economic growth, cven
after al lowance for the associated
taxcs and fees. Cnts in these areas are
clearlv advisable onlv nhen service
levels are excessive bv national
standards.
Texas is n-el l beloq, the national
a\.eragc in i ts provision of most
public services. Examples include not
onlv vu.elfare but also education,
public saf 'e$', the environment, and
other services that are highlv valued
bv prospective residents. In the case
of Texas, i t is easier to argue tbr a
selective increase in spending than for
cuts in sen' ices that might alread,v be
regarded as substandard.
Government expenditures absorb a
larger f iact ion of income in New Mex-
ico than in Tcxas. But i t is not ap-
parent that thc potential for economic
groq.'th q'oulcl be enhanccd b_v cut-
t ing spending in Nen' Mexico either,
Per capita n'elfare pa_vments in that
state are alreadv belovu' the national
averagc. And because of the state's
voung age distr ibution and low
populat ion densitv, resiclcnts must
clevote a relat ivclv large share of their
incorncs to taxes in order to provide
even average levcls of eclucation ancl
transportal l()n .
Of the three Distr ict states, Loui
siana stands to benefl t the most From
a restructuring of i ts publ ic spencl ing.
Welfare pevments are above thc na-
t ional xYerxge, and some cuts in this
arca migl-rt be considercd, But i t ma.v
also be desirable for expenditures on
public educ:rt i()n to increase. Support
for publ ic education in Louisiana cur-
renth' is among the lowest in the
L U u n t r \ . a n t l t h i : n r a v r c p r e s e n t t h e
single rnost important obstacle to a
balancecl rccoverv in the state's
cconom\', Thus, a strong argumcnt
c ln bc mr t i c I -o r rcd i rce t ing the ' JCr i v -
i t ies of the Louisiana state go\rern-
ment. There is lcss of a case for
reducing i ts overal l budget.
Guidelinesfor Replacing
Lost Energy Revenues
1 4
I n su r r r , n r t nc o l t l t e l ) l s t r i c t s t x t cs
zpl)cxr to h: lvc provi t lcc l cxccssive
: l n )oUr t . s O f l t t r l t l i c s c rV i ccs be c l n r se O f
: l s l ) ec i x l : l c cess t ( ) r - n i ne l l l r c venues .
I l : r t he r . t hc n t i l i o r i r v o f r r s i c l cn t s i t ave
srnrplv ecclr - t i rcr l thcse se rv ices l t . . l t ' t i
f i c i e l l v l ou p r i c cs . \ \ ' i r l t t hc c l ec l i r r c l r
e nergV rcVcnLles. i t is incr- i t r l t le t l ' rat
r cs i c l en t s n to r c f u i l r ' r ce l i ze t he cos t o f
p rov i c i i r r g pub l i c se r r - i c cs . l t shou l c l
n ( ) t l ) c p r csL ln tec l . l rO \ \ rVc r , t l t l r t t he
clesi recl resl )onse t ( ) thesc highcr
pr ices is : r c l r : rst ic cr- t r te i lntcnt rn t l te
: l n roL ln t l nc l q r , r a l i t t o f se r v i ccs . I n -
c lcccl . n 'he n the i ) rescnt c l t : r r rcte r of
pub l i c spe nc l i ng i n t l t c I ) r s t r i c t i s
cvulr -ur teci in l ight o1- resr-r l ts 1 l -or l
s tuci ics 0f the c lctct 'nt inents Ot '
rcg, l ( )n ' . l l ecr l r ror . l ic g l ' ( ) \ \ ' t l ) . thc con
clusion rnost r -c lc i i lv c l r : r* n is t l t : l t l r l tv
f isc:r l inrbelanccs rcsul t ing l ront rc
chrcecl cncrgv reve nLles r i 'oulc l l tc bet
I t f . t t l t i r ' t s r t r i l l l t ( , U S l t t ( \ \ ' n t r ( i l t
c l c r ses t hun t h r -Ough s l t cnc l i ng cu t s .
llet r t nt ttt t' t t t/ tt I I r t t t s r t t t t? t'a t t I t ()s.
13 : r s i c p r i nc i p l cs o l pu l t l i c f i n rncc sug -
gcs t : r nL ru l l ) c r o f gu i c l c l i n cs f i r r r e i s i ng
s t i l t c r e ve l r L l es . F i r s t . t o t he e \ t e l t t
1 - r r i s s i b l r . pu l t l i c se r l i ces shou l c l be
l i n l r nccc l t l t l c t ue l t use r f c cs enc l
bcnc l i t t l r xes . ' l
i t r s e l t l t r o : r ch l t r o r t c l t s
: l t i gh t n r : l t ch l t e lween f t r n t l s cO l l c c tec l
: rnr i scrv i t cs rccci r .c t l . Pert icul : r r arels
n he r-e grc l t te r e rnphesis on Llscr
churges nt ight be c lesi reble ncluclc:
h i ghe r - c c l r r cu t i r t n enc l h i ghu 'av c r t r r
st ruct t ( ) l t . l io l c-r l tmplc, t r i i l ton al lc l
f e cs l t t hc [ ' n iVc r s r t v o f l ' e x?s x t
Aus t i n e re r - ough l l one ha l f t hc t Lu t i ( ) n
l e vc l s : r t t he L n i \ e r s i t l o f Ca l i f i r r n i e
( l 3c r ke l e r ) : r nc l i n i r e r s i r r - o f I l l i no i s
( t l b : r n : t ) . : r nc l t l t c v a r c ( ) n l \ ' onc - t l t i r c l
t he t u l t i on a t t hc l . n i v c l ' s i t \ , o f
, \ l ic 'h igan (Ann Albor ' ) . ' l
r - r i t ion in-
cre: lses et 1 ' ru l - r l ic ut- r ivcrs i t ies i r - r ' Icxas
coulc l bc crrg ineerecl so as t ( ) t '1 l ise
sr, rbst : rnt i l r l nt : \ \ ' revcnLtcs \ \ , i l le et the
s : l n re t i n re n r : r i [ r t l l i n i ng s i gn i f i c rn t
subs rc l i c s f i r r i n s t r t e r cs i dcn t s .
l i o r n r : l nv t vpcs o l p t r b l i c se r v i ces .
t l - rc bcne f i ts : r rc u ' tc lc lv c l ispclsccl , encl
i t i s uneconon t i ce l t o i c l cn t i f v pa r
t i c r r l : r r bcne f i c i : r r i es . Examp les i nc l uc l c
st : l te l ) r is()1rs l rnci q i tve rnntcnt adnt i t ' t -
is t r : r t ion. , \ s l tor t f : r l l rn thcse . r reas
lnLlst l )e : rc lc l resscr l t l t r r tugh gcncral
t : lx lncrc: lses. 1n cl-roosing thc appropri2tc tex vchicle . prcfcrcnceshou lc l bc g ivcn to l )c rsone l texes ,f:r lhcr thxn busi lrcss ttxers, xnd totuxcs r.r'itl'r :r bro:rcl it:tse, such asirrcome encl gencral sl t les.
Persona l taxcs arc gcner l l l r .p refc'rrecl to business taxes bcceusc thevtencl to correlatc rnore 1-r ighlr. n-i thbcneli ts. I lcl iancc on bLlsincss texation rr ight be jr-rst i f- iecl i f the re is : lp()tcntial lbr cxport ing the tax burclcr-rto out-of-state lesidcnts. Br-rt in r, ier i ., r f t l l c . t t h . t : r r t l i : t l t U l i l l ) r ' t i t i ( ' l t i l l
[) istr lct export rnarkcts ancl lr i t l -r therel ' . l t ive nrobi l i t \ ' of l let ion:r l ;rncl inter-l lat ional capitxl , i t seents Llnl ikcl\ 'that taxes levicd against l tusinesscsopereting in thc Dist l ict states coulclbc sl-r i f tccl ci thcr to nonresidcnt cctr"r-sLlnte rs ol t() nonrcsiclcnt orr ncrs ofcapit:r l . Taxes on corporatc prot i ts orrr-rclustr ial propcrtv $,oulcl r-norc l ikelr,fa l l on I ) i s t r i c t co l tsun ters , norkcrs .ancl lancktn'ncrs.
The tar basc uscd to gencrate aclcl i-t ion:r l revenLlcs shoulcl bc bro:rcl.I l roacl-basccl taxcs offe r e stablcsourcc of rcr-cnues, nhich taci l i tateskrng range plenning of publ ic sen' icccicl ivcrl ' , And bv str iking a hrge classot ccononric tct iVit ics, thev keep to alniui l lulr thc cxtent tO n.hicl-recor-torrr ic choiccs arc cl istorteci.
The rrtost prcvalent broad,basecitexcs l l re t .rn inco|nc xnd general salcs.\\ 'hcn the t\ \ 'o : l rc c()mparccl. salestexcs havc the xcl\ 'antagc of not ta-\r |rg s:rVrrrg. thLls l)cing ncutral r .r . i thfcspcct to hr>useholcl clccrsions as tt .rhos- to elkrcatc n.calth bctvueen pres-ent lr-rcl futuLe cr)nsLrnlpt i()n. But salesl . r \ (s : l r c t r p i r : r l l1 rLgr ( .s \ i \ c . s in t cthe proport ion of farni lv incomespent on goods and scrvices subjectto tax fal ls as incontc r ises. Ancl inl ight of thc recent rcf i)rm in t-edcraltax la[-s, salcs taxes sut-fcr the furthcrci isach'antagc of not beirrg deciuctiblcuncler thc f 'ecleral incorne tax. In sunl,therc is no clcar basis for pref 'crence\\ I t t n Chr)osing b(l \ \ c(]n ; tn inLr )m(.tex ancl a gencral sales tax. L]cleed,the vast majori tv of states derivcsubstantiel rcvcnues frorn boths()ufces.
ConclusionEach of the states in the Eleventh
Federal Reserve District is highly
dependent on oi l and gas production.
And each will suffer a net loss of
employment as a result of lower oi l
pr ices. Estimates presented in this ar-
ticle indicate that if oil prices were to
remain in the $15 range, employment
in Louisiana, Texas, and New Mexico
by the end of 1987 would be some
4t/z percent,4 percent, and 3 percent
lower than would otherwise be the
case. This translates into a total loss
o f more than 350,000 jobs in the
three Distr ict states.
The drop in oi l pr ices and the at-
tendant employment losses in energ\ '-
producing industr ies are events that
are largely outside the control of the
governments of the Distr ict states.
But decisions concerning taxation and
spending provide one avenue through
which pol icymakers can inf luence the
course of economic growth and
development in their states.
Particularly crucial at this time are
decisions regarding the replacement
of lost severance tax and other
energy-related revenues. For decades,
a natural endowment of easily taxable
mineral wealth has enabled the
governments of the District states to
offer services at artificially low prices.
\flith the drop in oil prices, the
Distr ict states must now compete on
more even terms when offering pres-
ent and prospective residents a
package of taxes and public services.
To the extent possible, it is naturally
desirable to avoid tax increases by
cutting any wasteful and superfluous
government spending. But i t may be
no less desirable for taxes to be raised
or broadened if that is the only way
of providing adequate services in
such basic areas as police and fire
protection, transportat ion, and educa-
tion-all of which are important con-
siderations in the location decisions
of people and industry.
A.V. Riter,Jr.Council President.
InterFirst Bank Tyler, N,A.
Tyler, Texas
James A. NtickCentral Bank
Monroe, Louisiana
Ifilliam E. BradyDenton SaLtings Association
Denton, Texas
Ronald Brown
RepublicBank Houston
Houston, Texas
J. Wayland BennettCouncil President
Texas Tecb Uniuersity
Lubbock, Texas
Rob€rt M. CarterFarmer
Plainuieu, Texas
John O. ChapmanRancber
Cbapman Rancb, Texas
Lloyd E. Cline
Lloyd Cline Farms, Inc.
Lamesa, Texas
Kenneth L. BurgessFirst Stale Bank
Abilene, Texas
H.O, Bursum, IIIFirst State Bank
Socoffo, New Mexico
John H. DaltonFreedom Capital
Corporation
San Antonio, Texas
Marvln llancock, Jr.Capital Bank
Dallds, Texas
J.B. Cooper, Jr.Farmer
Roscoe, Texas
Carolyn Draper3-D Distrlbution
Slstems, Itxc.
Dallas, Texas
SharonJobeTCP Industries, Iltc.
Dallas, Texas
Robert W. Philip
Artbur Andersen
E Company
Dallas, Texas
Paul Mltchell
CommunicatorsCredit Union
Houston, Texas
Garry OwenFirst Federal Sa|ings Bank
of Nev MexicoRosuell, New Mexico
Lowell Smlth, Jr.Firs, state BankRio Vista, Texas
T,D.WallaceLouisiana Credit Union
League
Sbreueport, Louisiana
Dan PusteiovskyG,6P. Seed ComPanJ), Inc.
Aquilla, Texas
Villtam P. Steph€nsNeu Mexico Department
of AgricultureLas Cruces, Neu Mexico
J. Alfred washlngtonFocus Communications
GroupDallas, Texas
Cados A. ZunigaLaredo FreishlSeruices, Inc.Laredo, T'exas
Advisory Council ofFinancial Institutions
Advisory Council ofSmall Businessand Agriculture
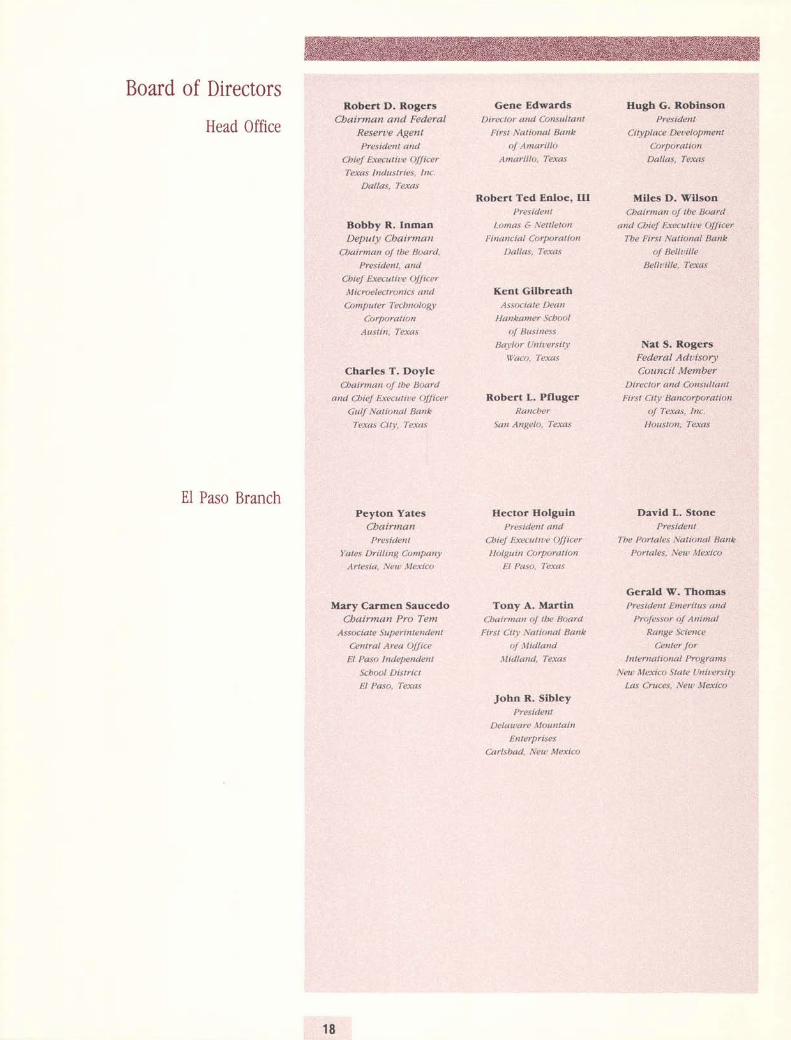
Board of Directors
Head 0ffice
El PasoBranch
Robert D. Rogers
Cbairman and Federal
Reserue Agent
President and
Chief Ereculirc OJJicer
Texas Industries, Inc.
Dallas, Texas
Bobby R. Inman
DePUU) chairman
Cbairman of the Board,
President, anal
Cbief Executirc OIJicer
Microelectronics and
Computer Tecbnok)gJ'
C0rP)ralion
Austin, Texas
Chades T. Doyle
Chairman oJ tbe tsoard
and CbieJ Executil'e Ollicer
GuU National Rdnk
Texas Ci\), 'l'exas
Peyton Yates
Cbairman
President
Yates Drilling Conqatry
Artesid, Neu'Mexico
Mary Carmen Saucedo
Cbairman Pro Tem
Associate Superintendent
Central Area OJJice
F.l Paso Indepen.lent
Scbool District
El Paso, Texas
Gene Edwards
Direclor ancl Consultanl
First National Bank
oI Amaril lo
Arnarillo, 'fexas
Robert Ted Enloe, III
Presidenl
Lonas €" Netlletott
I i nanc idl CorQora I iort
Dallas, Texas
Kent Gilbreath
Associate Dean
Hankamer Scbool
oJ Bltsiness
B.t)'lor Unircrsit!
Vaco, Texas
Robert L. Pfluger
Rattcber
San Angelo, Teras
Hector Holguin
President dnd
ChieJ F:xecu t irc OJJicer
Holguin abrPoratton
Il l Paso.' l-exas
Tony A. Martin
ClJairilnn oJ the Board
F-irst Cit),' National Bank
oJ ,vidland
,lliclland, Texds
John R. Sibley
President
Delau,are M()untain
Enterprises
Carlsbacl. Neut Mexico
Hugh G. Robinson
President
CiUplace DeL'elopment
CorPoration
Dallas, Texas
Miles D. WllsonCbairman oI tbe Board
and Cbief Executit,e Officer
T'he First Nationdl Bank
oI BellL'ille
Belh.'ille, Texas
Nat S. RogersFederal AduisoryCouncil Member
Direclor and Consul tant
First Citj BancorporationoJ Texas, Inc.
Houston, Texas
Davld L. Stone
President
Tbe Portales National Bank
Portales, Neu fuIexico
Gerald W. Thomas
Presiclent Emeritus ancl
Prokssor oI Animal
Ranqe Science
Cenler IorInternational Programs
Nu Mexico State Uni[ersity
Las Cruces, Neu Mexico
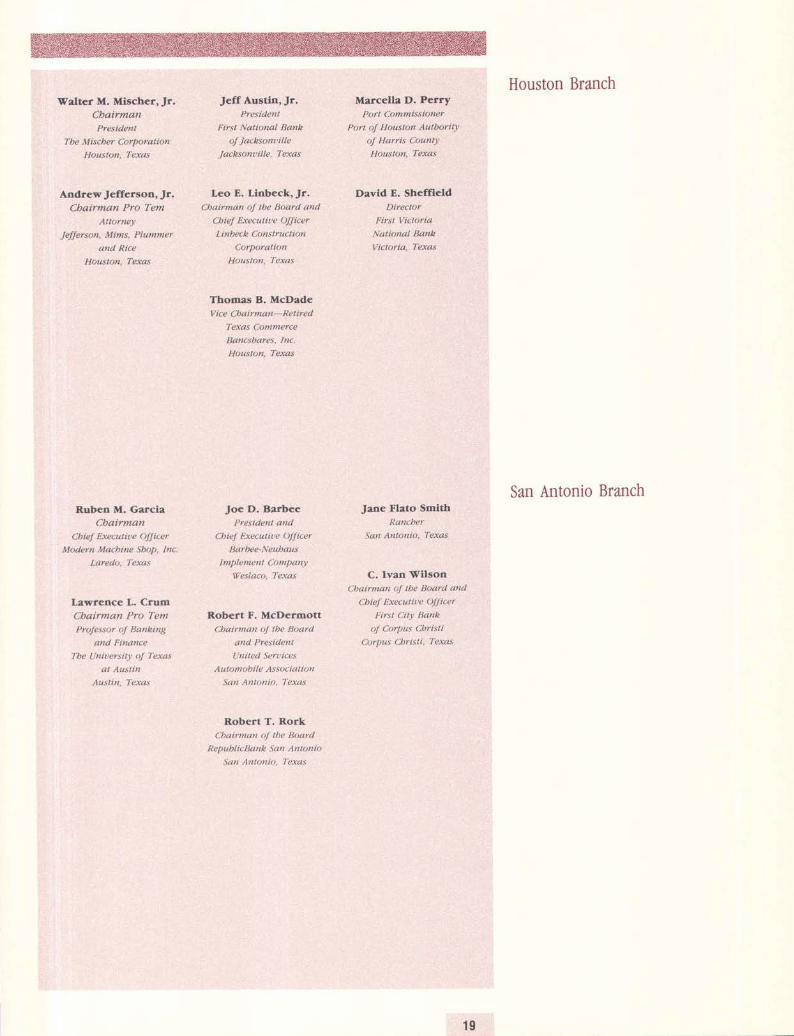
Walter M. Mlscher, Jr.ChairmanPresident
Tbe Miscber Cor?oration
Houston, Texas
AndrewJefferson, Jr.Cbairman Pro Tem
Attornej
Jeflerson, Mims, Plummer
and Rice
Houston, Texas
Ruben M. GarciaCbairman
C h ief Exec u t i u e OIfice r
Modern Machine Sbop, Inc
Laredo, Texas
Lawfence L. Crum
Cbairman Pro Tem
Protessor of Banking
and Finance
Tbe Uniuersit! of Texas
at Austtn
Austin, Texas
Jeff Austln, Jr.Presiclent
First National Bank
of Jacksonuille
Jacksonuille, I'exas
Leo E. Linbeck,Jr.
Cbairman oJ tbe Board and
CbieI Executiue Olficer
Linbeck Construction
CorPorati0n
Houston, Texas
Thomas B. McDade
Vice Cbairman-Retired
Texas Commerce
Bancsbares, Inc.
Houston, Texas
Jo€ D. BarbeePresident and
Chief Executil,e Olficer
Barbee-Neubaus
Implement Compary)
Veslaco, Texas
Robert F. McDermottCbairman of tbe Board
dnd President
United Ser|ices
Automobile Associal ion
San Antonio, Texas
Robert T. RorkCbairman of tbe Boarcl
Republic Bank San Antonio
San Antonio. Texas
Marcella D. PerryPorI Commissioner
Poft of Houston Autborit!
of Harris Count!
Houston, Texas
David E. SheffteldDirector
First VictoriaNational Bank
Victoria, Texas
Jan€ Flato Smith
Rancber
San Antonio, Texas
C. Ivan Vllson
Cbairman of fue Board and
Cbief Executiue Olficer
First Cit)) Bank
oJ Corqus Cbristi
Corpus Christi, Texas
Houston Branch
San Antonio Branch
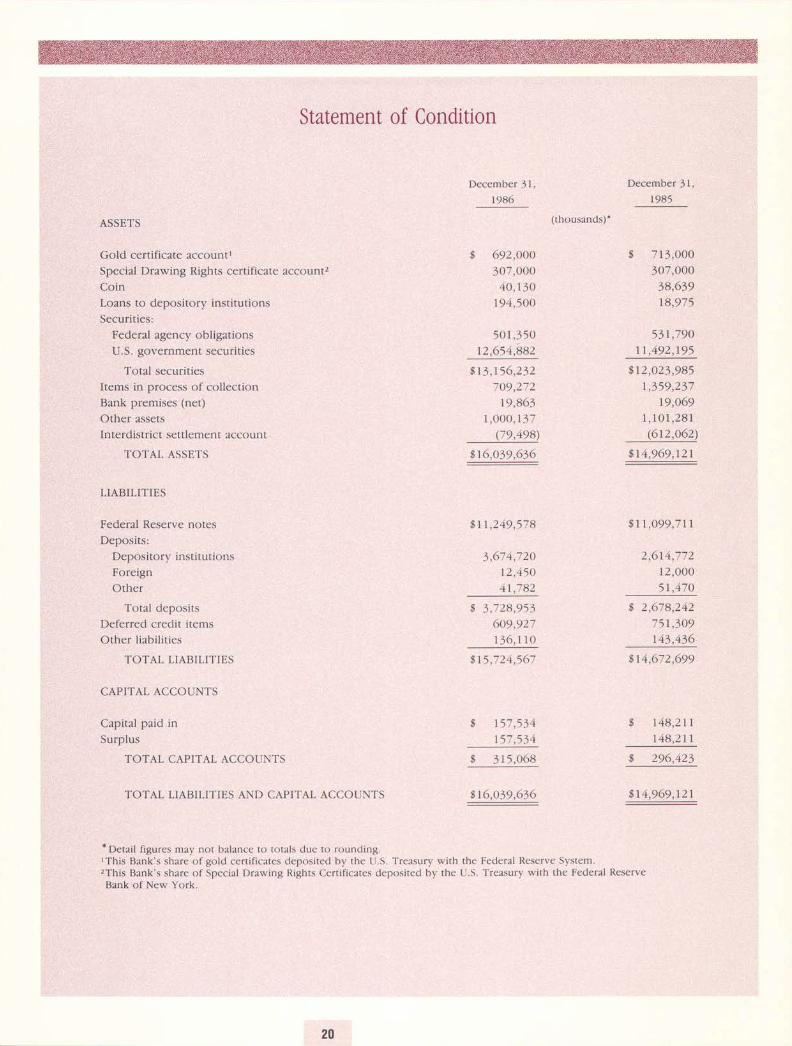
Statement of Condition
ASSETS
Gold certificate accountl
Special Drawing Rights certificate account2
Coin
Loans to depository institutions
Securities:
Federal agency obligations
U.S. government securities
Total securities
It€ms in process of collection
Bank premises (net)
Other assets
Interdistrict settlement account
TOTAL ASSETS
LIABILITIES
Federal Reserve notes
Deposits:
Depository institutions
Foreign
Other
Total deposits
Deferred credit items
Other liabilities
TOTAL LIABILITIES
CAPITAL ACCOUNTS
Capital paid in
Surplus
TOTAL CAPITAL ACCOUNTS
TOTAL LIABILITIES AND CAPITAL ACCOUNTS
December 31,
1985
$ 692,000307,000
40,r30194,5OO
5 0 1 , 3 5 012,654,b82
$13,156,232709,272
19,8631 , 0 0 0 , 1 3 7
(79,498)
w!]281e
f i11,249,578
3,671,72012,4504 r , 7 8 2
$ 3 ,728 ,95 )609,9271 3 6 , 1 1 0
$ r5 ,724 ,567
f i r57 ,534r 5 7 , 5 3 4
$ 315,068
616,o39,636
(thousands)-
December 31,
r985
$ 71 3 ,000307,000
38,63918,975
531,79011,492,195
$12,O23,9851,359,237
19,0691 , 1 0 1 , 2 8 1(612 ,062 )
614,969,121
$11 ,O99 ,711
2 ,614 ,77212 ,0005r,470
g 2,678,24275 r ,309143,436
$r4,672,699
$ 148,211
148,211
f i 296,423
Jl126e]31
* Detail figures may not balance to totals due to rounding.lThis Bank's share of gold certificates deposited by the U.S. Treasury with the Federal Reserve System.,This Bank's share of Special Drawing Rights Certificates deposited by the U.S. Treasury with the Federal ReserveBank of New York.
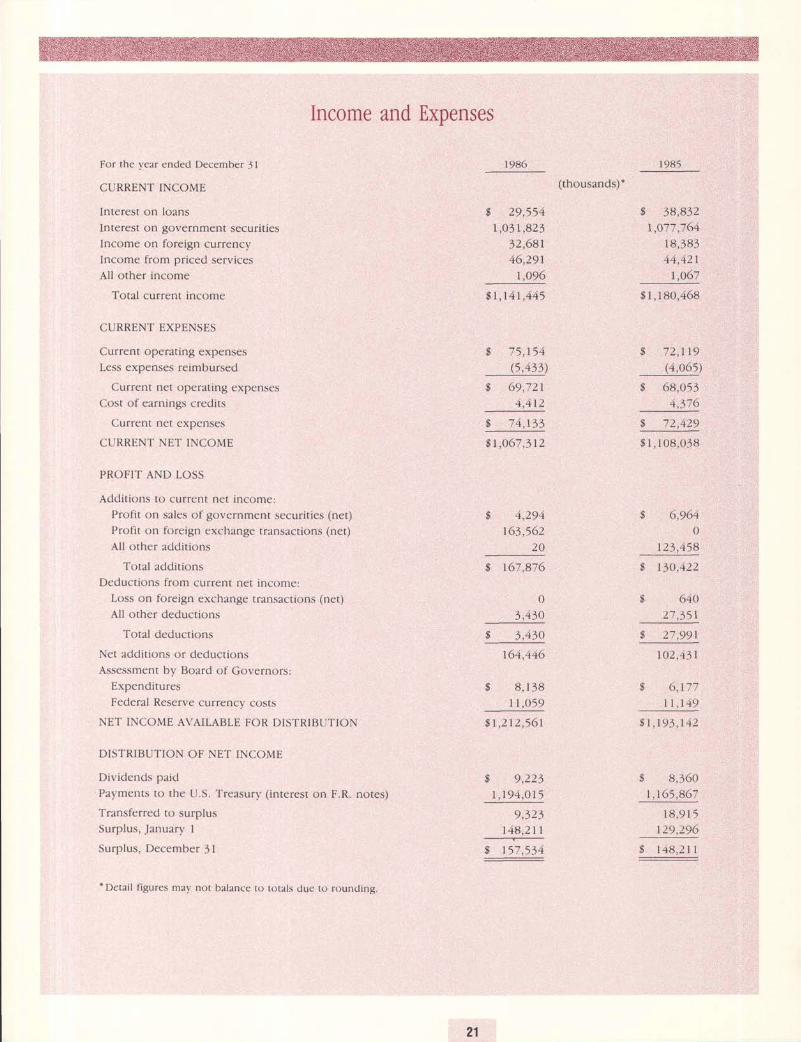
Income and Expenses
For the y'ear ended December J1
CURRENT INCOME
Interest on loans
Intercst on governmcnt securit ies
Income on foreign currency
lncome from priced scrvices
All other income
Total current income
CURRENT EXPENSES
Current operating expenses
Less expenses reimbursed
Current net operating expenses
Cost of earnings credits
Current net expenses
CURRENT NET INCOME
PROFIT AND LOSS
Adtl i t iorts to current ncr in( 'onle:Profi t on sales of government securit ies (net)Profit on foreign exchange rransactions (net)Al l other addit ions
Total addit ions
Deductions from current net inconte :Loss on foreign exchange transactions (net)
Al l other deductions
Total deductions
Net aclcl i t ions or deductions
Assessment by Board of Governors:Expenditures
Federal Reserve currency costs
NET INCOME AVA]LABLE FOR DISTRIBUTION
DISTRIBUTION OF NET INCOME
Dividencls paid
Payments to the U.S. Treasurl ' ( i r-rterest on F.R. notes)
Transferred to surplus
Surplus, Januarl ' I
Surplus, December 31
'Detai l f igures mav not balance to torals due to roundirrs
1986
f i 29,5541 0 4 1 R 2 1
32,68146,291
1,096
$ r , r 4 r , 445
6 7 5 , 1 5 4(5,135)
$ 69 ,7214 ,412
$ 7 4, r33
$1 ,067 ,3 r2
fi 4,294163 ,552
2 0
$ 167,876
0J,430
$ 3,430
161,446
$ 8 , 1 3 81 r ,o5g
$ r ,212 ,561
I L) ,223
r ,194 ,O15
o 1 ) t
r48,21r-Y-J:JfiI
(thousands) *1c)85
$ 38,8321,s77 ,764
I 8,38344 ,421
r ,067
$ 1 ,180 ,468
I 72 ,119(4,065)
fi 68,0534 , 5 / O
f i , r ,4r,
$ 1 , 108,038
fi 6,9640
123,158
fi r30,122
fi 640'27
.35r
f i 27,L)L) l
r 0 2 , 4 3 r
$ 6 , 1 7 7
_ r r , 119f i1, r93,142
$ 8,360\ , t 65 ,867
18 ,9 I 512.),296
fi 148,211
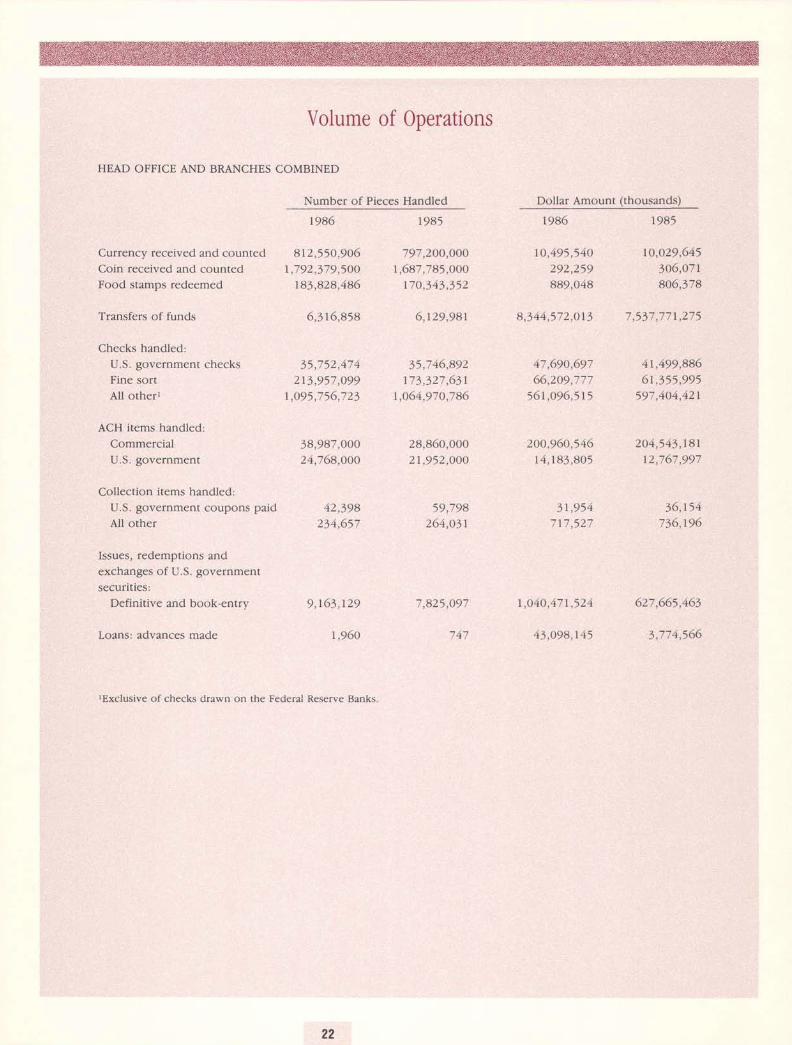
Volume of Operations
HEAD OFFICE AND BRANCHES COMBINED
Number of Pieces Handled
1985 1985
Currency received and counred 812,550,906 797,2OO,OOOCoin received and counted 1,792,379,5OO 1,687,785,000Food stamps redeemed 183,828,486 170,343,352
Transfers of funds 6,316,858 6,129,981
Checks handled:U.S. government checksFine sort
All otherl
ACH items handled:
Commercial
U.S. government
Collection items handled:
U.S. government coupons paid
All other
Issues, redemptions and
exchanges of U.S. government
securities:
Definitive and book-entry
Loans: advances made
Dollar Amount (thousands)
J r ,752 ,474213,957 ,099
r ,o95,756,723
38,987,00024,768,OOO
42,398234,657
9,163,129
1,960
35,746,892173,327 ,631
r,064,970,786
28,860,00021,952,000
59,798264,03r
7,825,097
747
1986
r0,495,540292,259889,048
47,690,69766,209,777
56r,096,515
200,960,54614,r83,805
31,954' 7 t ' 7 q ) ' 7
1 ,040 ,471 ,524
43,O98,145
1985
r0,o29,545305,07r806,378
4r,499,8866r,355,995
597,404,42r
2O4,543, r8 r12,767,997
36, r54735,196
527,665,463
5 , / / 4 ,>Oo
8,344,572,0r3 7 ,537,77r ,275
tExclusive of checks drawn on the Federal Reserve Banks
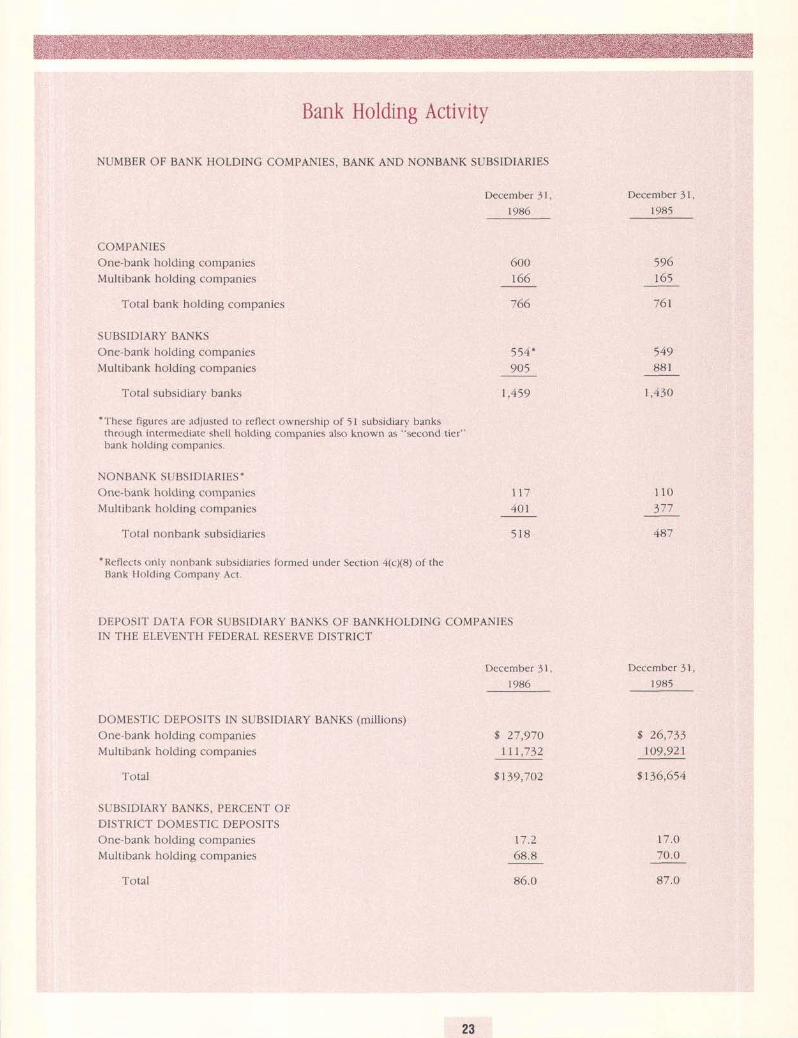
NUMBER OF BANK HOLDING COMPANIES, BANK AND NONBANK SUBSIDIARIES
Bank Holding Activity
COMPANIES
One-bank holding companies
Mult ibank holding companies
Total bank holding companies
SUBSIDIARY BANKS
One-bank holding companies
Multibank holding companies
Total subsidiary banks
*These figures are adjusted to reflect ownership of 51 subsidiary banksthrough inlermediate shell holding companies also known as "second tier"bank holding companies.
NONBANK SUBSIDIARIES-
One-bank holding companies
Mul t ibank ho ld ing compan ies
Total nonbank subsidiaries
DOMESTIC DEPOSITS IN SUBSIDIARY BANKS (mil l ions)
One-bank holding companies
Mul t ibank ho ld ing compan ies
Total
SUBSIDIARY BANKS, PERCENT OFDISTRICT DOMESTIC DEPOSITS
One-bank holding companies
Multibank holding companies
Total
December 31,1985
600
166
/ lJo
554"905
t , 4 5 9
December 31,1985
596I O )
*/ o l
549881
r ,430
1 1 0
377
487
December 31,
r985
$ 26,733109,921
f i136,654
17 .070.0
117
401
*Reflects only nonbank subsidiaries formed under Secrion 4(c)(8) of theBank Holding Company Act.
DEPOSIT DATA FOR SUBSIDIARY BANKS OF BANKHOLDING COMPANIESIN THE ELEVENTH FEDERAL RESERVE DISTRICT
5 1 8
December 31,
r986
f i 27,97011 r ,732
8139,702
T 7 . 268.8
86.0 8 7 . O

0fficers
Head Office
Robert H. BoykinPt esiclent
and alhie| E.recuti|e OlJicer
William H. WallaceFirst Vice President
an.l Cbie| ()peraling (l.ficer
George C. Cochran, IIISenior Vice Presidtnt
Jay K. MastSenior Vice Presicleill
Hafvey RosenblumSenior Vice Presidenl
and Direclor OJ Researclt
Neil B. Ryan
Seilior Vtce Presidelttand Senior Adrisor
TonyJ. SalvaggioSenior Vice Presiclenl
Robert Smith, UISeilior Vice President
anal Secretur!
James L. StullSentor Vice I'resideilt
Lyne H. Carterl,'iLe Presiclerlt
Jack A. ClymerVice Presideilt
BillyJ. Dusekl'icc President
Robert D. HankinsVice Presi.lent
Joel L. Koonce, Jr.Vice Presiclent
Robert F. LanglinaisVice President
at ld ( ;aneral Auditor
Rebecca W. Meinzerl.'ice President
James E. Pearcel'ice I'resideil| end
Associ0te I)irector (U Resutrcl)
LarryJ. Reckl'iLe President
Jesse D. Sandersl'i('e President
Larry M. SnellVice Prcsidcnt
Millard E. Sweatt, Jr.vice Presl.leilt.
(ietterctl Couttsel,an.l Assis tan t Secreldr.\'
W. Arthur TribbleI'ice Prasidcnt
Uzziah AndersonAssislant l' ice Presidcnt
Basi lJ . Asaro;.i.sr.s/.r/r/ l: i c e P rcs I d a n t
T. Guy Brown
Ass isla n t I'icc P res ide n t
Terry B. CampbellAssistant Vice Presi.lcn t
Bllly D. FullerAss is tat tt l' ice Pres i detl I
Joseph T. GholsonAss is tu tt t V ice Pres tden I
Jerry L. HedrickAss istail I lrce Pres icie I t I
Andrew \V. Hogwood,Jr.Assis tailt Vice Pres ideilt
Helen E. HolcombAss is I an t l'ice P res ideil t
Richard D, Ingram
/ - ! .sr-sldr l l ' /ce P res i de i l !
dnd Ass ist . t i l | Se( ' retdrJ '
AlbertJ. Jaramillo,-1s.sr.s//r/lI l' ice P rcs i dt I I I
Johnny L. JohnsonAsststai l l I ' ice Pr?sidet l !
Leroy O. Laney11s.\r .s ldlr1 \ ' i ce P r?s ider l t
ut tc l Sett iot f :c()noi l t is l
C. Lavor Lym
; .J.sA1a// / I ' ic? I ' res i d( t t I
James R. McCullinA s s i s l a i l | I i c e P r e s i ( l ( t t t
Dean A. Pankonien; -s.Jl-r la l /11 Ge trcr( I ( .o t t I tscl
John R. Phillipsi-rsi.r/.r/r/ l ' i& Pres i de tl t
Larry C. Ripley
,,1.\--tl.t1dr1 \' i( e I'res i det t I
Mary M. Rosasr ls.s i .s/ . l r l \ ' ice P res i det 1 |
RobertJ. Rossato!-s-sl-r/.rrl1 Ge | rcral A ud i | ( ) r
Thomas H. Rust, . ls.JA/rr l I ' ice P res i de t l I
Eugenie D. ShortAssistat l t l ' ic? I ' residei l l
and Set l lar I :c() t1() t i l ist
Philip R. SpearAssistant vice I'reside,It
Michael N. Turner, . - lJ.r is/d, / I ' iLa I ' res tden I
Steve M. Welch.'{ssl.J/ar?/ I'ica I'res i.la I t t
Robert L. WhitmanAs sisldt rt Vice Pres i den t
Emilie S. Vorthy
Ass is t an I l'ica Pres iclent
Richard BurdaI-:xq nt itl i ttg OJJ icer
Marvin C. Mccoy
Itr.0nitring OJJicer
El Paso Branch
Sammie C. ClayI'ice l'resident in Cltargc
Robert w. Schultzllss is ldil | I' i cc P res idet I I
Houston Branch
J. Z. RoweScilior I'i(:e Presidenl
in Charl1e
Vernon L. Baftee
!-r-ri.sldlr/ l' i ce P res i de I t t
Rene G. Gonzales
l-ssl.J/d/// l'ice Pres idcil |
Luther E. Richards
Ass is td I t t V ice Pres ideilt
San AntonioBranch
Thomas H. Robertsonl'ice Presi.lent in albqrge
John A. Bullock
Ass is tat t t Vice I'res ide nl
Thomas C. Colei.r.v.r/drrf l' i c e P res i de n t
Antonio G. Valencia, Jr.Ass is tu/t t Vice Pres ideil t
EJJectirc.lailuary l, 1987