Embed Size (px)
Citation preview

This Report and Implementation Plan are student work product completed to fulfill requirements of the Climate Solutions Living Lab, a 12-week course offered at Harvard Law School. This report and plan were researched and written under tight time constraints to answer specific questions posed to the students in their course assignment. Any opinions expressed in the report are those of the students and not of Harvard University or Harvard Law School. If you would like to learn more about Harvard Law School’s Climate Solutions Living Lab, please contact Professor Wendy Jacobs at [email protected].

Team III: Potent greenhouse gas reduction project Appendix: Screening and feasibility assessment on potential projects
1
TABLE OF CONTENTS
Initial screening................................................................................................................................1 In-depth feasibility assessment......................................................................................................12
1. Agricultural nitrous oxide............................................................................................12 2. Coalbed methane..........................................................................................................17 3. Landfill methane..........................................................................................................20
Project selection.............................................................................................................................22 Appendix........................................................................................................................................23
INITIAL SCREENING
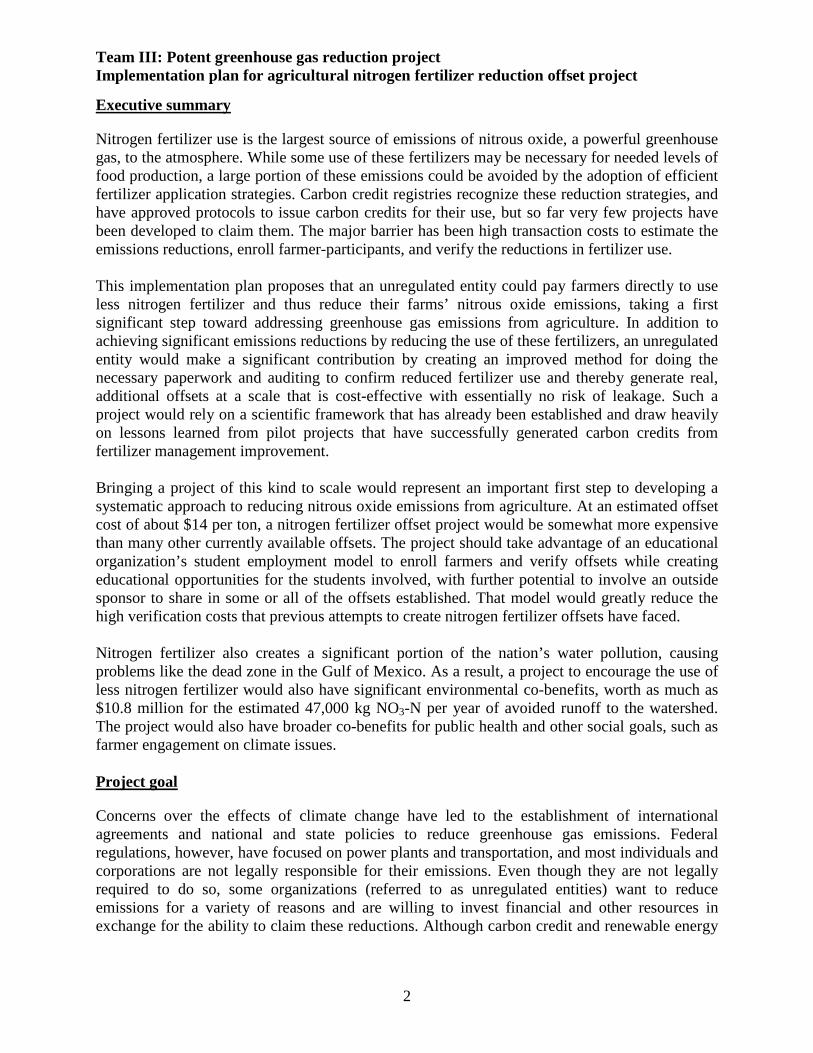
To reduce the universe of potential potent greenhouse gas reduction projects to a manageable number for our team to handle, we focused on three potent gases: HFCs, nitrous oxide, and methane. We applied several criteria to each project’s characteristics to determine which projects seemed like the best candidates for a more in-depth feasibility analysis. On the basis of that screening, we selected agricultural nitrous oxide, coalbed methane, and landfill methane to bring into the feasibility analysis because they appeared to combine the greatest benefits with the fewest likely roadblocks. Descriptions of each project area considered and brief explanations of our findings follow.
HFCs N2O CH4
supe
rmar
kets
publ
ic sc
hool
s
liquo
r st
ores
hosp
itals
dent
ists
agri
cultu
ral
coal
bed
coal
min
e
land
fills
oil a
nd g
as
agri
cultu
ral
Size of reduction opportunity 2 1 2 1 1 3 3 3 3 3 2 Ease of establishing additionality 1 1 2 2 3 3 2 2 2 2 3 Upfront costs 2 2 1 1 2 3 1 1 1 1 1 Ongoing costs 2 2 2 2 2 2 2 2 3 1 1 Team’s topical interest 2 2 2 2 2 3 3 2 3 1 2 Scalability 2 2 2 1 2 3 3 1 3 2 1 Public health co-benefits 1 1 1 1 1 2 2 2 2 2 2 Verifiability 3 3 3 2 2 2 3 3 3 3 3 Partnership opportunities 1 2 1 2 2 2 3 3 2 1 2 Average 1.78 1.89 1.78 1.56 1.89 2.56 2.44 2.00 2.44 1.78 1.89
Team III: Potent greenhouse gas reduction project Appendix: Screening and feasibility assessment on potential projects
2
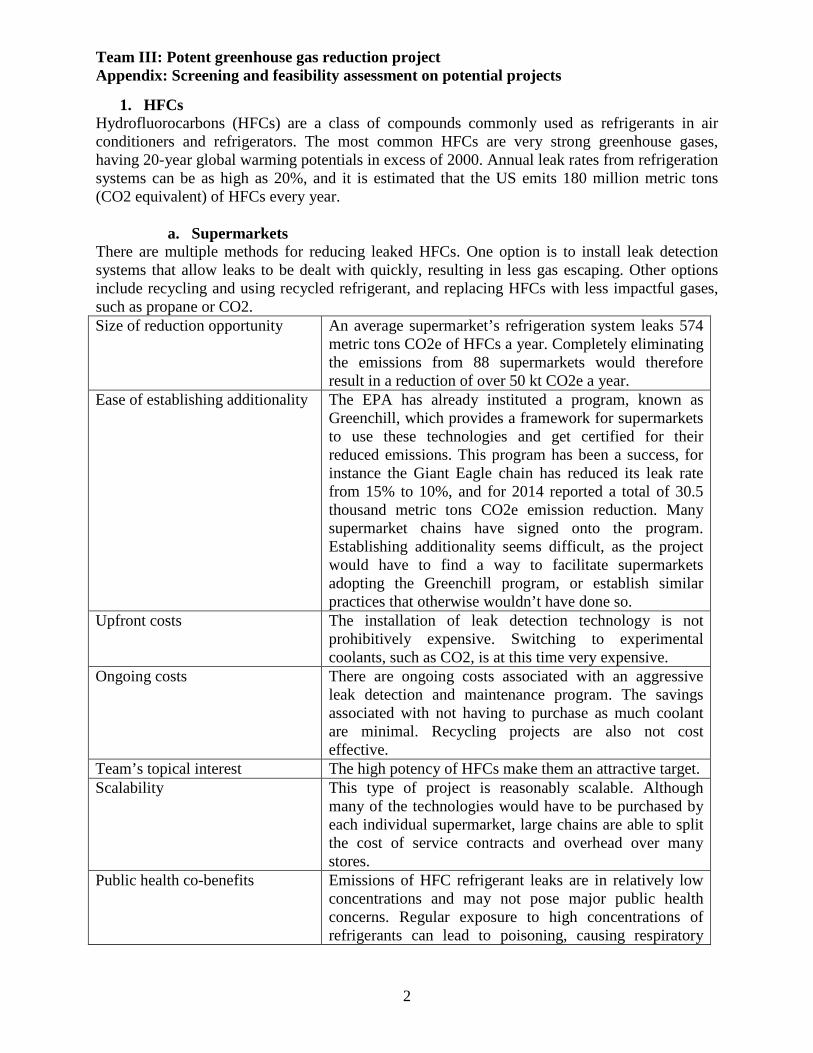
1. HFCs Hydrofluorocarbons (HFCs) are a class of compounds commonly used as refrigerants in air conditioners and refrigerators. The most common HFCs are very strong greenhouse gases, having 20-year global warming potentials in excess of 2000. Annual leak rates from refrigeration systems can be as high as 20%, and it is estimated that the US emits 180 million metric tons (CO2 equivalent) of HFCs every year.
a. Supermarkets There are multiple methods for reducing leaked HFCs. One option is to install leak detection systems that allow leaks to be dealt with quickly, resulting in less gas escaping. Other options include recycling and using recycled refrigerant, and replacing HFCs with less impactful gases, such as propane or CO2. Size of reduction opportunity An average supermarket’s refrigeration system leaks 574
metric tons CO2e of HFCs a year. Completely eliminating the emissions from 88 supermarkets would therefore result in a reduction of over 50 kt CO2e a year.
Ease of establishing additionality The EPA has already instituted a program, known as Greenchill, which provides a framework for supermarkets to use these technologies and get certified for their reduced emissions. This program has been a success, for instance the Giant Eagle chain has reduced its leak rate from 15% to 10%, and for 2014 reported a total of 30.5 thousand metric tons CO2e emission reduction. Many supermarket chains have signed onto the program. Establishing additionality seems difficult, as the project would have to find a way to facilitate supermarkets adopting the Greenchill program, or establish similar practices that otherwise wouldn’t have done so.
Upfront costs The installation of leak detection technology is not prohibitively expensive. Switching to experimental coolants, such as CO2, is at this time very expensive.
Ongoing costs There are ongoing costs associated with an aggressive leak detection and maintenance program. The savings associated with not having to purchase as much coolant are minimal. Recycling projects are also not cost effective.
Team’s topical interest The high potency of HFCs make them an attractive target. Scalability This type of project is reasonably scalable. Although
many of the technologies would have to be purchased by each individual supermarket, large chains are able to split the cost of service contracts and overhead over many stores.
Public health co-benefits Emissions of HFC refrigerant leaks are in relatively low concentrations and may not pose major public health concerns. Regular exposure to high concentrations of refrigerants can lead to poisoning, causing respiratory
Team III: Potent greenhouse gas reduction project Appendix: Screening and feasibility assessment on potential projects
3
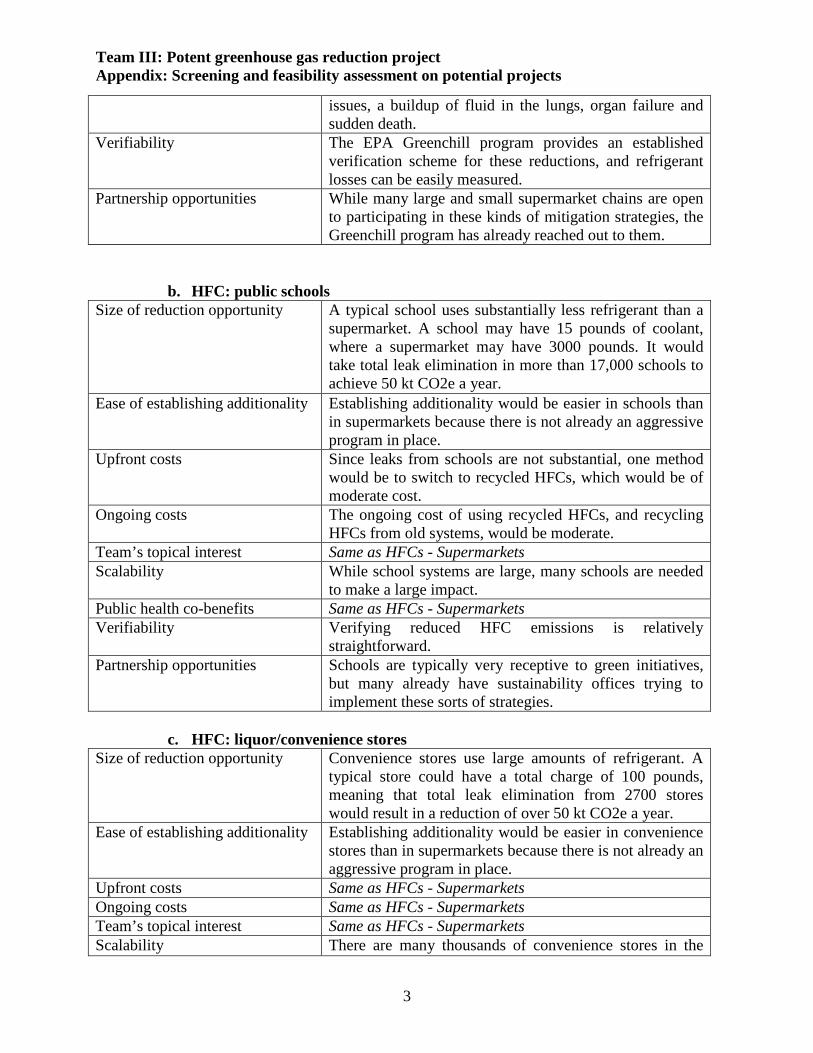
issues, a buildup of fluid in the lungs, organ failure and sudden death.
Verifiability The EPA Greenchill program provides an established verification scheme for these reductions, and refrigerant losses can be easily measured.
Partnership opportunities While many large and small supermarket chains are open to participating in these kinds of mitigation strategies, the Greenchill program has already reached out to them.
b. HFC: public schools Size of reduction opportunity A typical school uses substantially less refrigerant than a
supermarket. A school may have 15 pounds of coolant, where a supermarket may have 3000 pounds. It would take total leak elimination in more than 17,000 schools to achieve 50 kt CO2e a year.
Ease of establishing additionality Establishing additionality would be easier in schools than in supermarkets because there is not already an aggressive program in place.
Upfront costs Since leaks from schools are not substantial, one method would be to switch to recycled HFCs, which would be of moderate cost.
Ongoing costs The ongoing cost of using recycled HFCs, and recycling HFCs from old systems, would be moderate.
Team’s topical interest Same as HFCs - Supermarkets Scalability While school systems are large, many schools are needed
to make a large impact. Public health co-benefits Same as HFCs - Supermarkets Verifiability Verifying reduced HFC emissions is relatively
straightforward. Partnership opportunities Schools are typically very receptive to green initiatives,
but many already have sustainability offices trying to implement these sorts of strategies.
c. HFC: liquor/convenience stores
Size of reduction opportunity Convenience stores use large amounts of refrigerant. A typical store could have a total charge of 100 pounds, meaning that total leak elimination from 2700 stores would result in a reduction of over 50 kt CO2e a year.
Ease of establishing additionality Establishing additionality would be easier in convenience stores than in supermarkets because there is not already an aggressive program in place.
Upfront costs Same as HFCs - Supermarkets Ongoing costs Same as HFCs - Supermarkets Team’s topical interest Same as HFCs - Supermarkets Scalability There are many thousands of convenience stores in the

Team III: Potent greenhouse gas reduction project Appendix: Screening and feasibility assessment on potential projects
4
United States. For example, there are over 8,000 7-Eleven stores in the US alone. Moderate scalability across chains seems possible.
Public health co-benefits Same as HFCs - Supermarkets Verifiability Verifying reduced HFC emissions is relatively
straightforward. Partnership opportunities Many large chains operate franchise models, which would
mean having to work with individual franchise owners.
2. N2O: Medical Nitrous Oxide (N2O) is a commonly used anesthetic in both hospitals and dental clinics. With a 20-year global warming potential of 310, even the small amounts used in medical settings can have large effects. Most of the N2O used in medicine leaks into the atmosphere, even though technologies exist to capture the gas after use.
a. Hospitals Size of reduction opportunity Even though N2O is a potent greenhouse gas, the amount
used in any individual hospital is small. It would take a 100% reduction of N2O emissions from 20 large hospitals to achieve a reduction of over 50 kt CO2e a year.
Ease of establishing additionality Many hospitals are already doing something to mitigate the effects of their emissions, and have general sustainability initiatives in effect.
Upfront costs Outfitting hospitals with N2O capture equipment has been done, but is expensive and not many hospitals have adapted the technology.
Ongoing costs There is ongoing cost associated with sequestering or recycling the N2O.
Team’s topical interest The medical sector is of interest to the team. Scalability Most hospitals operate as separate entities, and scalability
is possible but could be difficult. Public health co-benefits N2O has been safely used in medical settings for a long
time, but there is some evidence that elevated N2O levels inside hospitals could be a public health concern.1
Verifiability Verification of N2O emission reduction could be difficult and expensive, as captured gas would have to be monitored.
Partnership opportunities Partnerships with hospitals or medical groups seems possible.
b. Dental Offices
Size of reduction opportunity While N2O use among dentists varies, it is likely that hundreds of dental offices would have to eliminate their emissions to achieve a reduction of over 50 kt CO2e a
1 Brodsky, Jay B., and Ellis N. Cohen. "Adverse effects of nitrous oxide." Medical toxicology 1.5 (1986): 362-374.
Team III: Potent greenhouse gas reduction project Appendix: Screening and feasibility assessment on potential projects
5
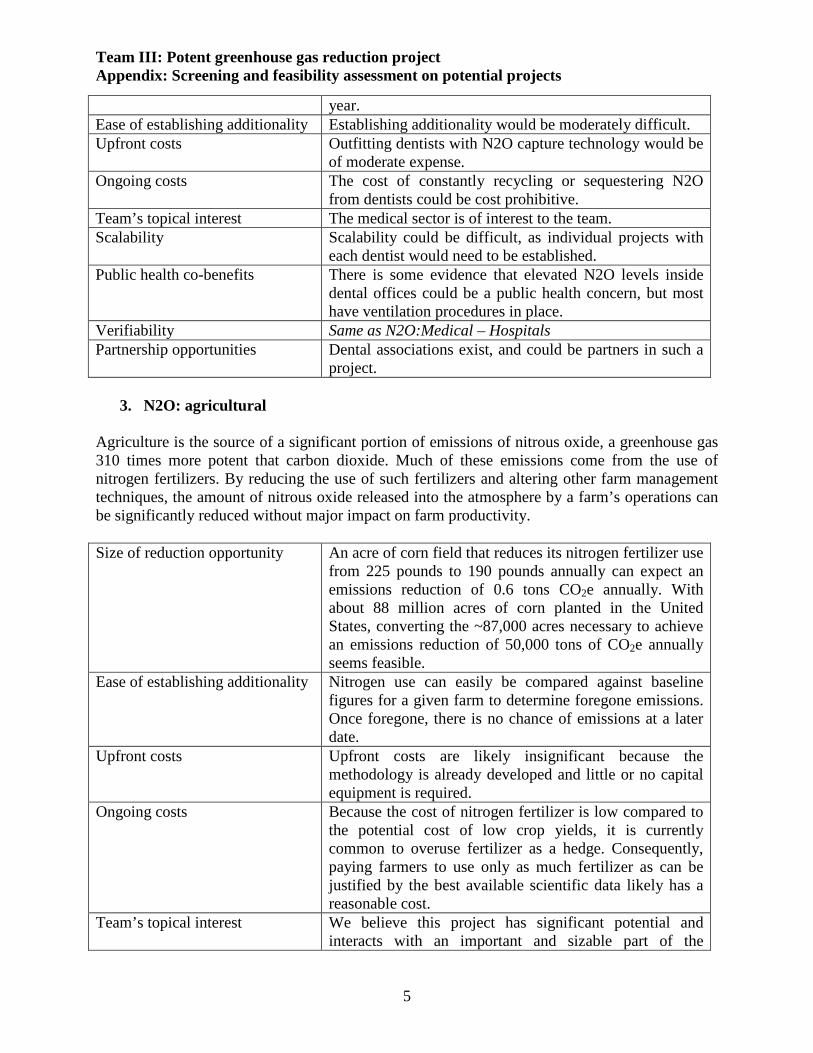
year. Ease of establishing additionality Establishing additionality would be moderately difficult. Upfront costs Outfitting dentists with N2O capture technology would be
of moderate expense. Ongoing costs The cost of constantly recycling or sequestering N2O
from dentists could be cost prohibitive. Team’s topical interest The medical sector is of interest to the team. Scalability Scalability could be difficult, as individual projects with
each dentist would need to be established. Public health co-benefits There is some evidence that elevated N2O levels inside
dental offices could be a public health concern, but most have ventilation procedures in place.
Verifiability Same as N2O:Medical – Hospitals Partnership opportunities Dental associations exist, and could be partners in such a
project.
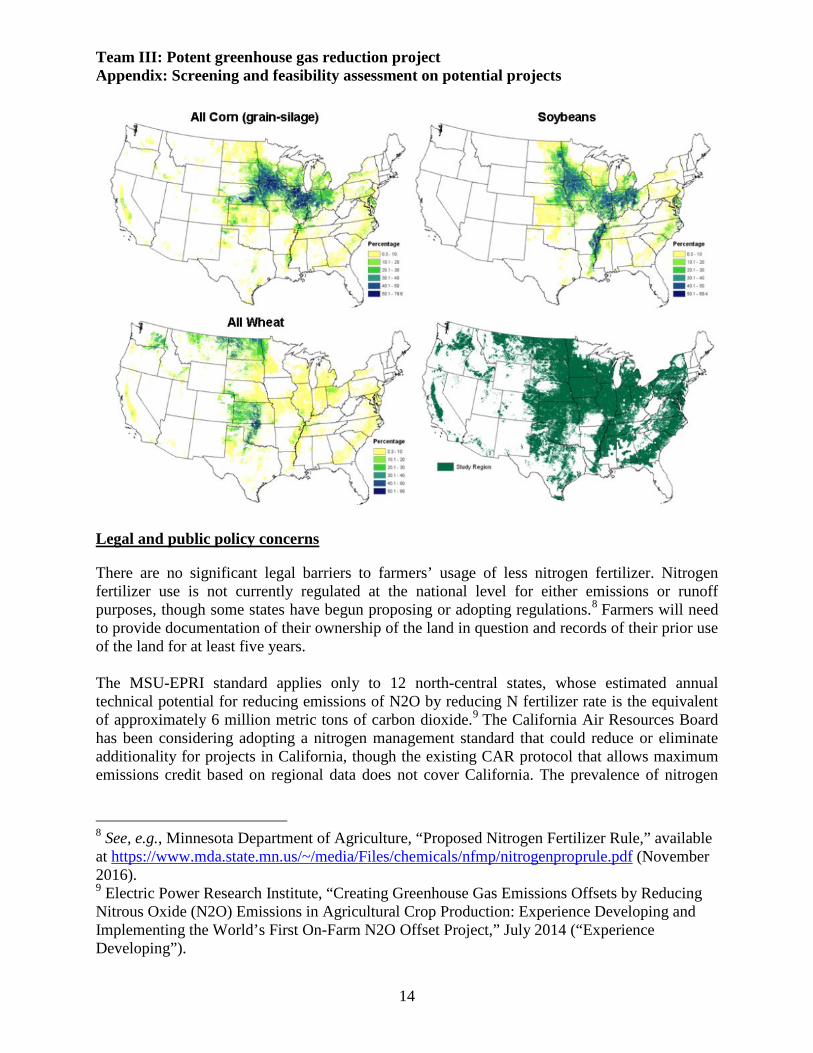
3. N2O: agricultural Agriculture is the source of a significant portion of emissions of nitrous oxide, a greenhouse gas 310 times more potent that carbon dioxide. Much of these emissions come from the use of nitrogen fertilizers. By reducing the use of such fertilizers and altering other farm management techniques, the amount of nitrous oxide released into the atmosphere by a farm’s operations can be significantly reduced without major impact on farm productivity. Size of reduction opportunity An acre of corn field that reduces its nitrogen fertilizer use
from 225 pounds to 190 pounds annually can expect an emissions reduction of 0.6 tons CO2e annually. With about 88 million acres of corn planted in the United States, converting the ~87,000 acres necessary to achieve an emissions reduction of 50,000 tons of CO2e annually seems feasible.
Ease of establishing additionality Nitrogen use can easily be compared against baseline figures for a given farm to determine foregone emissions. Once foregone, there is no chance of emissions at a later date.
Upfront costs Upfront costs are likely insignificant because the methodology is already developed and little or no capital equipment is required.
Ongoing costs Because the cost of nitrogen fertilizer is low compared to the potential cost of low crop yields, it is currently common to overuse fertilizer as a hedge. Consequently, paying farmers to use only as much fertilizer as can be justified by the best available scientific data likely has a reasonable cost.
Team’s topical interest We believe this project has significant potential and interacts with an important and sizable part of the

Team III: Potent greenhouse gas reduction project Appendix: Screening and feasibility assessment on potential projects
6
American economy. Scalability Because corn farming is so widespread and this project
requires little new equipment, it could be expanded across a significant range without new infrastructure.
Public health co-benefits These projects also reduce agricultural nitrogen runoff, resulting in environmental and health benefits from reduced nitrogen leaching.
Verifiability Validation procedures for agricultural nitrous oxide offsets have already been developed by the American Carbon Registry, the Climate Action Reserve, and the Verified Carbon Standard. These standards include meaningful monitoring standards to ensure that the intended results are achieved. Farmers in the upper Midwest are already eligible to receive offset credits through the Delta Institute’s Nitrogen Credit Program.
Partnership opportunities Farming groups and regional cooperatives could be good partners to help find individual farms interested in modifying their practices to become eligible for the credits this project would make available.
4. CH4: coalbed
Coalbed methane (CBM) is naturally found in coal seams, formed during the process where plant material is transformed into coal. This methane is naturally released even at sites where mining is not occurring, although at a lesser rate compared to methane releases associated with mining activities. Although coalbed methane is considered an unconventional source of natural gas, the methane resources from this source can be valuable and account for about 5% of total national natural gas production each year.2 Many potential coal mining sites are located on Native American land, and are areas of concern for environmental and social justice.
Size of reduction opportunity The amount of methane found in coal seams can be large.
In an example project in the Southern Ute Tribe in Colorado, a net 60,359 tons of carbon dioxide equivalent was captured and used in 2015. The environmental benefits to CBM projects may be similar to methane captured from landfills or agricultural/dairy offset projects.
Ease of establishing additionality In the example Southern Ute project, the established criteria included checking comparisons to baseline and ensuring that new instances being evaluated for “but-for” aspects additionality were only eligible when the price of natural gas was below $6.24 per thousand cubic feet.
Upfront costs While the upfront costs of a methane capture and energy recovery system can be relatively high for a large natural
2 Energy Information Administration, 2014.
Team III: Potent greenhouse gas reduction project Appendix: Screening and feasibility assessment on potential projects
7
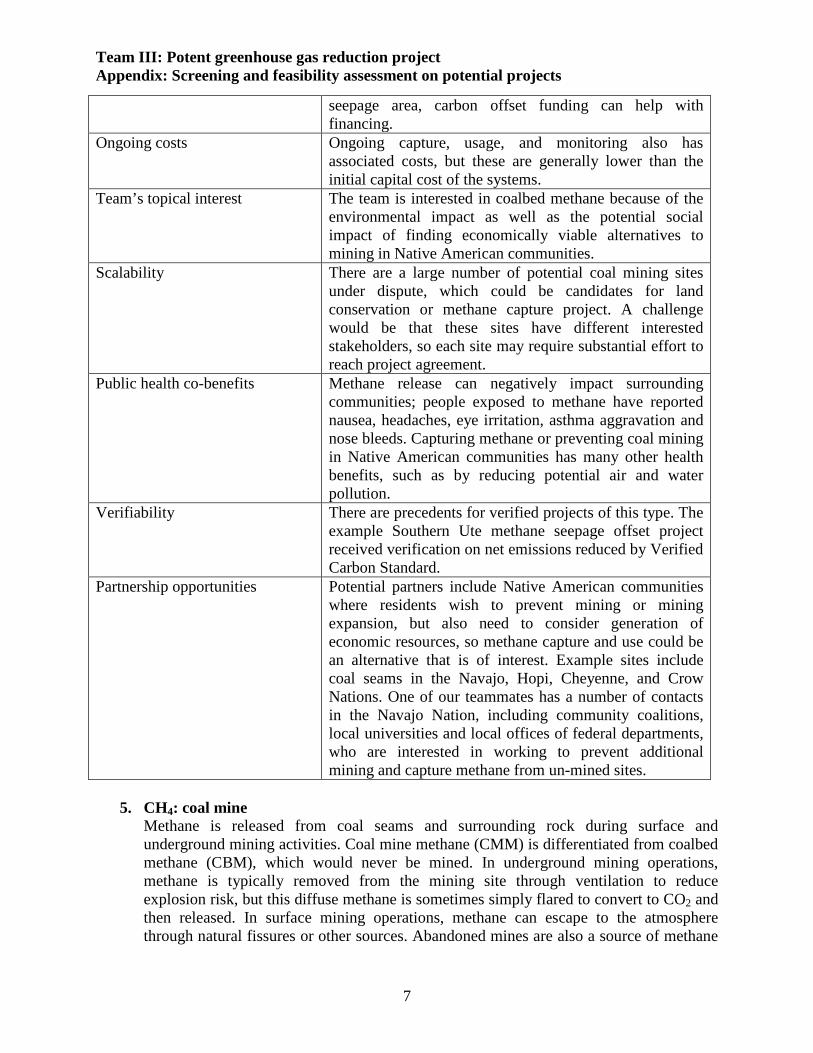
seepage area, carbon offset funding can help with financing.
Ongoing costs Ongoing capture, usage, and monitoring also has associated costs, but these are generally lower than the initial capital cost of the systems.
Team’s topical interest The team is interested in coalbed methane because of the environmental impact as well as the potential social impact of finding economically viable alternatives to mining in Native American communities.
Scalability There are a large number of potential coal mining sites under dispute, which could be candidates for land conservation or methane capture project. A challenge would be that these sites have different interested stakeholders, so each site may require substantial effort to reach project agreement.
Public health co-benefits Methane release can negatively impact surrounding communities; people exposed to methane have reported nausea, headaches, eye irritation, asthma aggravation and nose bleeds. Capturing methane or preventing coal mining in Native American communities has many other health benefits, such as by reducing potential air and water pollution.
Verifiability There are precedents for verified projects of this type. The example Southern Ute methane seepage offset project received verification on net emissions reduced by Verified Carbon Standard.
Partnership opportunities Potential partners include Native American communities where residents wish to prevent mining or mining expansion, but also need to consider generation of economic resources, so methane capture and use could be an alternative that is of interest. Example sites include coal seams in the Navajo, Hopi, Cheyenne, and Crow Nations. One of our teammates has a number of contacts in the Navajo Nation, including community coalitions, local universities and local offices of federal departments, who are interested in working to prevent additional mining and capture methane from un-mined sites.
5. CH4: coal mine
Methane is released from coal seams and surrounding rock during surface and underground mining activities. Coal mine methane (CMM) is differentiated from coalbed methane (CBM), which would never be mined. In underground mining operations, methane is typically removed from the mining site through ventilation to reduce explosion risk, but this diffuse methane is sometimes simply flared to convert to CO2 and then released. In surface mining operations, methane can escape to the atmosphere through natural fissures or other sources. Abandoned mines are also a source of methane

Team III: Potent greenhouse gas reduction project Appendix: Screening and feasibility assessment on potential projects
8
release. Many coal mines are located on Native American land, and are areas of concern for environmental and social justice.
Size of reduction opportunity The magnitude of methane emissions associated with coal
mines can be large. For example, in a back-of-the-envelope calculation, the methane released from a single pit out of the 3-pit Kayenta mine, which is just one mine in a site in the Navajo Nation, is estimated to be nearly 450 kt CO2eq.
Ease of establishing additionality The EPA considers some recovery and use of coal mine methane to be emissions avoidance, as the methane would otherwise be released into the atmosphere during mining activities. If methane is captured and used, the additionality depends in part on the electricity source mix that would have been used in the absence of the generation. That said, many electrical grids have at least one natural gas plant on them and could use natural gas as a fuel, and there are also multiple uses for natural gas.
Upfront costs Methane capture and use systems can be relatively expensive to install. Methane can be captured for energy generation pre-drainage, or before mining commences, which may reduce the cost of necessary ventilation during mining by half. There are sometimes financing sources such as low-interest loans and grants available to corporations for these systems.
Ongoing costs After installation, methane capture and use systems take money and energy to operate. During ongoing mining, ventilation air methane (VAM) units cost about $20-30 per standard cubic feet per minute, but the captured methane is more diffuse and more difficult for energy recovery. Methane can also be captured post-drainage, after mining activities are completed, for offsets.
Team’s topical interest The team is more interested in coal bed methane than methane release associated with coal mining.
Scalability There are a large number of coal mining projects that are not currently capturing methane, which could be candidates for a project. A challenge would be that these mines are often under different management and affect different stakeholders, so each site may require substantial effort to reach project agreement.
Public health co-benefits Methane is an occupational health hazard for underground coal mine workers, as it can lead to explosion risk. Ventilation is typically used, but unanticipated high amounts of methane emissions can lead to the ventilation controls being insufficient. Methane release can also negatively impact surrounding communities; people

Team III: Potent greenhouse gas reduction project Appendix: Screening and feasibility assessment on potential projects
9
exposed to methane have reported nausea, headaches, eye irritation, asthma aggravation and nose bleeds.
Verifiability Methane can be measured from existing mines and used as a baseline to determine future reductions, for certification by a third-party organization. There are existing protocols and previous examples for doing this, such as the Compliance Offset Protocol Mine Methane Capture (MMC) Projects, but measurement of methane across a large coal mine may be more challenging than measuring methane in a smaller landfill.
Partnership opportunities Potential partners include Native American communities where mines are located, motivated by a desire to reduce environmental impact and use the captured methane for economic benefit. Where rights have already been sold to mining corporations, it may be more difficult to partner with the stakeholder in power, since coal companies may be less likely to be interested in the current administrative environment. Example sites include Kayenta mine in Navajo Nation, Arch Coal West Elk mine in Colorado, Dos Republicas Coal projects at the Texas / Mexico border, coal mines in Northern Cheyenne and Crow Reservation.
6. CH4: landfills
Municipal solid waste (MSW) landfills are a significant source of methane emissions as their contents begin to decompose. Harvesting the energy contained in that methane both reduces the need for other energy sources and converts the methane to less harmful carbon dioxide. Unregulated entities could invest in landfill energy projects so that they become financially viable. Size of reduction opportunity Landfill projects exist in several locations and often
produce well over the 50,000 tons of CO2e required. Spreading the project concept to more landfills has significant potential, and EPA estimates that over 400 additional landfills could cost-effectively have their methane turned into an energy resource.
Ease of establishing additionality The most significant challenge to additionality is demonstrating that the landfill emissions would not have been avoided except for the involvement of the unregulated entity.
Upfront costs Each project requires significant upfront investments in the facilities needed to convert the landfill gas to energy, but the payback may be realistic.
Ongoing costs On an operating basis, the projects are likely profitable or nearly so, given the energy produced.
Team III: Potent greenhouse gas reduction project Appendix: Screening and feasibility assessment on potential projects
10
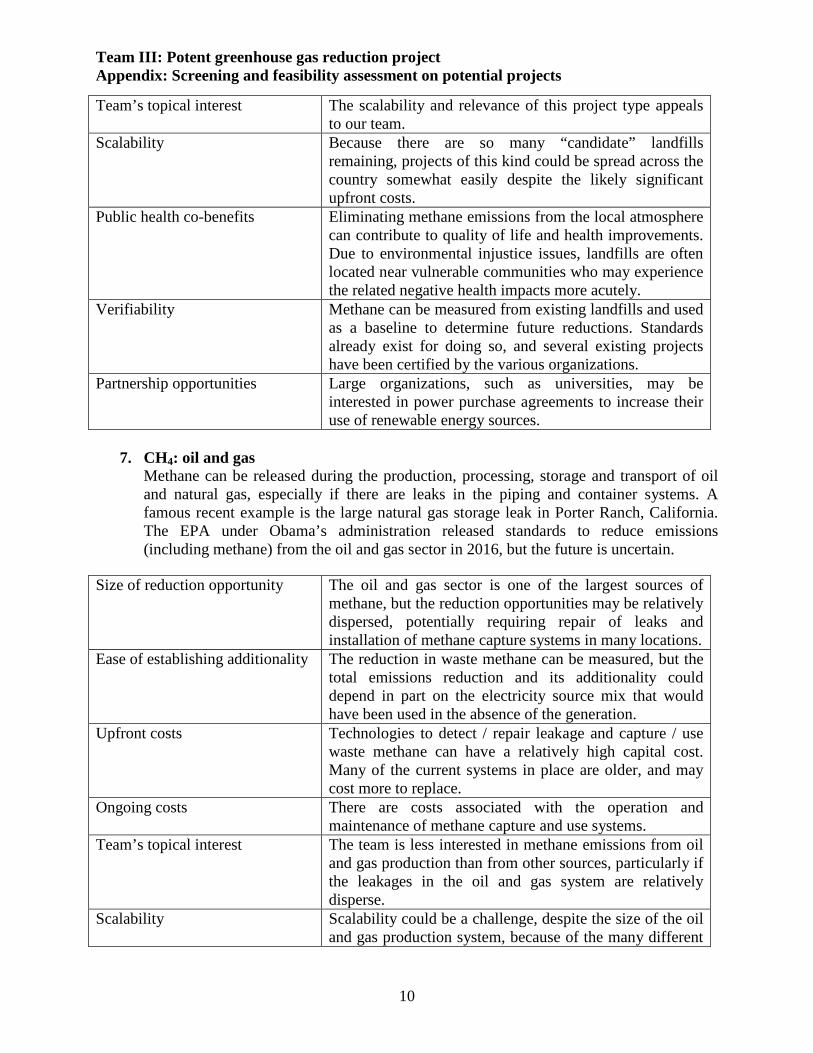
Team’s topical interest The scalability and relevance of this project type appeals to our team.
Scalability Because there are so many “candidate” landfills remaining, projects of this kind could be spread across the country somewhat easily despite the likely significant upfront costs.
Public health co-benefits Eliminating methane emissions from the local atmosphere can contribute to quality of life and health improvements. Due to environmental injustice issues, landfills are often located near vulnerable communities who may experience the related negative health impacts more acutely.
Verifiability Methane can be measured from existing landfills and used as a baseline to determine future reductions. Standards already exist for doing so, and several existing projects have been certified by the various organizations.
Partnership opportunities Large organizations, such as universities, may be interested in power purchase agreements to increase their use of renewable energy sources.
7. CH4: oil and gas
Methane can be released during the production, processing, storage and transport of oil and natural gas, especially if there are leaks in the piping and container systems. A famous recent example is the large natural gas storage leak in Porter Ranch, California. The EPA under Obama’s administration released standards to reduce emissions (including methane) from the oil and gas sector in 2016, but the future is uncertain.
Size of reduction opportunity The oil and gas sector is one of the largest sources of methane, but the reduction opportunities may be relatively dispersed, potentially requiring repair of leaks and installation of methane capture systems in many locations.
Ease of establishing additionality The reduction in waste methane can be measured, but the total emissions reduction and its additionality could depend in part on the electricity source mix that would have been used in the absence of the generation.
Upfront costs Technologies to detect / repair leakage and capture / use waste methane can have a relatively high capital cost. Many of the current systems in place are older, and may cost more to replace.
Ongoing costs There are costs associated with the operation and maintenance of methane capture and use systems.
Team’s topical interest The team is less interested in methane emissions from oil and gas production than from other sources, particularly if the leakages in the oil and gas system are relatively disperse.
Scalability Scalability could be a challenge, despite the size of the oil and gas production system, because of the many different

Team III: Potent greenhouse gas reduction project Appendix: Screening and feasibility assessment on potential projects
11
stakeholders and geographical regions involved in production.
Public health co-benefits Researchers at USC studying a major natural gas leak in Porter Ranch, California have reported concerns about respiratory, cardiovascular, and neurological impacts as well as stress. People exposed to methane in higher concentrations during leakage incidents have reported nausea, headaches, eye irritation, asthma aggravation and nose bleeds.
Verifiability There are some precedents for verified projects in this space. For example, the Alberta province in Canada has established a joint initiative to reduce and verify reductions in methane from the oil and gas sector.
Partnership opportunities Oil and gas companies may be less likely to be interested in partnerships during the current political and regulatory administrative environment.
8. CH4: agricultural
Installing anaerobic digesters at farms can harness the methane contained in manure, among other things, to produce energy that can then be used on the farm or sold onto the grid. To ensure efficient operation, the digester must be operated by an organization that has the correct skills and expertise. The digester reduces the methane that would be emitted by the manure, instead converting it into carbon dioxide while also reducing the need for electricity produced through other means. Size of reduction opportunity The reduction opportunity is significant at any one
anaerobic digester project, but each project requires significant new infrastructure. The Barstow’s Longview Farm installation in Hadley, Mass., offsets nearly 20,000 tons of CO2 emissions annually.
Ease of establishing additionality The eliminated emissions from the methane can be measured, but the total emissions reduction and its additionality depends in part on the electricity source mix that would have been used in the absence of the generation. Further, if Vanguard Renewables is already rolling the technology out across New England, it is not certain that another unregulated entity’s involvement would actually create significant additionality.
Upfront costs Constructing each project requires significant upfront investment in the necessary infrastructure.
Ongoing costs Maintaining each project requires ongoing costs, e.g. for management, and ongoing supervision of the use or sale of the electricity generated.
Team’s topical interest We believe this project interacts with an important and sizable part of the American economy.

Team III: Potent greenhouse gas reduction project Appendix: Screening and feasibility assessment on potential projects
12
Scalability Because each project requires new and likely unique arrangements, it cannot easily be brought to scale except by deploying one bespoke project after another, likely at significant cost.
Public health co-benefits Eliminating methane emissions from the local atmosphere can contribute to quality of life and health improvements. A project of this nature could have public health impacts by reducing direct exposure to particles, as well as by reducing methane as an ozone precursor.
Verifiability The manure tonnage provides a solid proxy for the emissions prevented.
Partnership opportunities Each project requires a strong partner in the form of a farm willing to radically change its manure management. It also requires a partner with experience in renewable energy who can manage the generation and transmission component.
IN-DEPTH FEASIBILITY ASSESSEMENT
Having selected agricultural nitrous oxide, coalbed methane, and landfill methane to bring into the feasibility analysis because they appeared from our screening analysis to have the most promising combination of benefits and potential drawbacks, our team then performed a feasibility analysis on each of those three project areas.
1. Agricultural nitrous oxide
Agriculture is the source of a significant portion of emissions of nitrous oxide, a greenhouse gas 310 times more potent that carbon dioxide. Much of these emissions comes from the use of nitrogen fertilizers. Agricultural nitrous oxide emissions, which have grown 3.4 percent since 1990, make up nearly 70 percent of total nitrous oxide emissions and just over 3 percent of total U.S. greenhouse gas emissions.3 By reducing the use of such fertilizers and altering other farm management techniques, the amount of nitrous oxide released into the atmosphere by a farm’s operations can be significantly reduced without major impact on farm productivity. Design and engineering
An acre of corn field that reduces its nitrogen fertilizer use from 225 pounds to 190 pounds annually can expect an emissions reduction of 0.6 tons CO2e annually.4 With about 88 million acres of corn planted in the United States, converting the ~87,000 acres necessary to achieve an emissions reduction of 50,000 tons of CO2e annually seems feasible. These figures depend on the development and application of a so-called Tier 2 standard that accounts for national and
3 Climate Action Reserve, “Nitrogen Management Project Protocol” (January 17, 2013). 4 Fact sheet about Millar et al. 2010. Nitrogen fertilizer management for nitrous oxide (N2O) mitigation in intensive corn (Maize) production: an emissions reduction protocol for US Midwest agriculture. Mitigation and Adaptation Strategies for Global Change, 15:185–204.

Team III: Potent greenhouse gas reduction project Appendix: Screening and feasibility assessment on potential projects
13
regional variations in soil and farming to produce accurate reduction estimates, particularly because corn in the American Midwest is a particularly heavy user of nitrogen fertilizer. Because American farmers have long used yield-goal estimates to derive nitrogen fertilizer application rates, reductions in fertilizer use below such estimates represent additionality above the business-as-usual scenario. Validation procedures for agricultural nitrous oxide offsets have already been developed by the American Carbon Registry, the Climate Action Reserve, and the Verified Carbon Standard. These standards include meaningful monitoring standards to ensure that the intended results are achieved. Farmers in the upper Midwest are already eligible to receive offset credits through the Delta Institute’s Nitrogen Credit Program. However, these multiple certification programs also have different specific requirements and thus may create perverse incentives for farmers and other actors to game the system to maximize claimed offsets. The project will need to establish which offset best serves its purposes and be certain to mandate contractually the use of that offset’s measurement standards. The most significant factor in predicting nitrous oxide emissions from agricultural fertilizer use appears to be fertilizer rate (i.e. the amount used), rather than source, timing, or placement.5 Consequently, the most effective way to reduce emissions is to reduce usage rates. Further, though some nitrous oxide emissions from agriculture are inevitable, there is significant potential for reduction.6 Nitrogen usage rates can easily be compared against baseline figures for a given farm to determine foregone emissions. Once foregone, there is no chance of emissions at a later date. The CAR protocol covers only 12 Midwestern states and uses region-specific data to increase the measurable amount of emissions foregone.7 Given this advantage, it may make sense to focus projects on those states, particularly given the abundance of agriculture and of nitrogen fertilizer use there in general.
5 Electric Power Research Institute, “Creating Nitrous Oxide (N2O) Emissions Offsets in Agricultural Crop Production in the United States: Background Paper for the EPRI Greenhouse Gas Emissions Offset Policy Dialogue Workshop #11” (November 2011). 6 Id. 7 Climate Action Reserve, “Nitrogen Management Project Protocol” (January 17, 2013).
Team III: Potent greenhouse gas reduction project Appendix: Screening and feasibility assessment on potential projects
14
Legal and public policy concerns
There are no significant legal barriers to farmers’ usage of less nitrogen fertilizer. Nitrogen fertilizer use is not currently regulated at the national level for either emissions or runoff purposes, though some states have begun proposing or adopting regulations.8 Farmers will need to provide documentation of their ownership of the land in question and records of their prior use of the land for at least five years. The MSU-EPRI standard applies only to 12 north-central states, whose estimated annual technical potential for reducing emissions of N2O by reducing N fertilizer rate is the equivalent of approximately 6 million metric tons of carbon dioxide.9 The California Air Resources Board has been considering adopting a nitrogen management standard that could reduce or eliminate additionality for projects in California, though the existing CAR protocol that allows maximum emissions credit based on regional data does not cover California. The prevalence of nitrogen
8 See, e.g., Minnesota Department of Agriculture, “Proposed Nitrogen Fertilizer Rule,” available at https://www.mda.state.mn.us/~/media/Files/chemicals/nfmp/nitrogenproprule.pdf (November 2016). 9 Electric Power Research Institute, “Creating Greenhouse Gas Emissions Offsets by Reducing Nitrous Oxide (N2O) Emissions in Agricultural Crop Production: Experience Developing and Implementing the World’s First On-Farm N2O Offset Project,” July 2014 (“Experience Developing”).
Team III: Potent greenhouse gas reduction project Appendix: Screening and feasibility assessment on potential projects
15
fertilizer use in those states and the absence of forthcoming regulation may make additionality most feasible in that area. Business
Upfront costs are likely insignificant because the methodology is already developed and little or no capital equipment is required. Because the cost of nitrogen fertilizer is low compared to the potential cost of low crop yields, it is currently common to overuse fertilizer as a hedge. Consequently, paying farmers to use only as much fertilizer as can be justified by the best available scientific data likely has a reasonable cost. Because corn farming is so widespread and this project requires little new equipment, it could be expanded across a significant range without new infrastructure. Farming groups and regional cooperatives could be good partners to help find individual farms interested in modifying their practices to become eligible for the credits this project would make available. Successful N fertilizer reduction projects likely also depend on strong relationships with the farmers chosen to participate in the offset program. Such farmers should be commercial long-term corn producers and have interest in taking part in new environmental initiatives.10 Ideally, farmers may even have taken part in similar programs before, to minimize the potential complexity of reporting and other requirements. EPRI’s report on the first pilot offset project involving nitrogen fertilizer reduction found that future projects should work to reduce verification cost and leverage greater scale. “The relatively high costs for validating/verifying new N2O mitigation and other N management-related offsets projects is a strong disincentive that can be expected to discourage crop producers from participating in these types of voluntary activities,” the report found. “Only offset projects located on large aggregated parcels of land are likely to be able to generate the considerable volume of offsets (i.e., on the order of thousands of tons) needed to make a proposed project economically viable, particularly if validation costs remain high and carbon offset values remain low. The direct cost to validate/verify the MSU-EPRI Offsets Project was approximately $10,000. This does not include the substantially greater cost in terms of MSU staff time and the producer’s time dedicated to developing, implementing and helping guide the project through registration, validation and verification. This figure also does not include any financial and other costs associated with developing the underlying MSU-EPRI N2O Offsets Methodology.”11 Consequently, projects developed to reduce nitrogen fertilizer emissions will need to develop standardized, lower-cost processes for accounting as well as strategies to find farmer partners who control large parcels of land, maximizing the potential economies of scale of rolling out one fertilizer methodology across a significant area, rather than having to repeat the process several times with several farmers who each control less land area. Earlier experience also suggested that a key problem with the earlier project was that it required an investment from at least one party that lacked any incentive to make such an investment other than altruism. If a project in this field could bring such interested parties to the table, that could make these projects more viable. 10 Electric Power Research Institute, “Experience Developing.” 11 Electric Power Research Institute, “Experience Developing.”
Team III: Potent greenhouse gas reduction project Appendix: Screening and feasibility assessment on potential projects
16
Public health
Nitrous oxide is not harmful to human health at normal concentrations found in the atmosphere, but inhalation of higher concentrations could limit oxygen and cause dizziness, nausea, or unconsciousness - particularly in enclosed spaces. Additionally, nitrous oxide emissions affect the ozone layer and decreased stratospheric protection can lead to higher exposure to UV rays, which cause skin cancers. The proposed projects would also reduce agricultural nitrogen runoff, resulting in environmental and health benefits from reduced nitrogen leaching. Summary Reducing nitrous oxide emissions from agriculture is a promising project area. Reducing the usage rates of fertilizers that contribute to emissions is feasible from a technical standpoint, and validation procedures for agricultural nitrous oxide offsets have already been established. Interventions are relatively inexpensive, and there are no significant legal barriers.

Team III: Potent greenhouse gas reduction project Appendix: Screening and feasibility assessment on potential projects
17
2. Coalbed methane
Methane is a potent greenhouse gas, with a global warming potential that is 56 times that of carbon dioxide over a 20-year time horizon.12 Coalbed methane (CBM) is naturally found in coal seams, formed during the process where plant material is transformed into coal. This methane is still naturally released in sites where mining is prevented, although at a lesser rate compared to methane releases associated with mining activities. Although coalbed methane is considered to be an unconventional source of natural gas, the methane resources from this source can be valuable and account for about 5% of total national natural gas production each year.13 Many coal seams are located on Native American land, and are sites where it is important consider issues of environmental and social justice.
Source: U.S. Geological Survey, 2013
12 Global Warming Potentials Table. 1995. United Nations Framework Convention on Climate Change. Accessed in March 2017 at http://unfccc.int/ghg_data/items/3825.php 13 Coalbed Methane Outreach Project. 2016. Environmental Protection Agency. Accessed in March 2017 at: https://www.epa.gov/cmop/faq.html

Team III: Potent greenhouse gas reduction project Appendix: Screening and feasibility assessment on potential projects
18
Design and engineering
The magnitude of methane found in coal seams can be large. For example, with a methane seepage offset project in the Southern Ute Tribe in Colorado, an estimated net 60,359 tons of carbon dioxide equivalent was captured and used in 2015, with an estimated net 288,180 tons of carbon dioxide equivalent reduced or removed in total over the 10-year project period.14 In a methane capture and utilization project, the quantity of the greenhouse gas that would have gone into the atmosphere can be more easily established. One of the major challenges with coalbed methane projects, however, is the cost of the infrastructure required to capture methane seepage from a large area and concentrate it for use. For example, a large active soil vapor extraction (SVE) unit could cost upwards of $80,000, and installing a positive pressure blower within a sealed space and sealing the space could cost $10,500 for 1,500 square feet.15 There is also a wide variance in how invasive as well as how proven are the technologies that are currently available. Validation procedures for methane seepage offsets have already been established by Verified Carbon Standard, which was used by Southern Ute project. American Carbon Registry is also able to register methane capture, flare and utilization projects. However, coal mine methane protocols are more common and unfortunately coalbed methane projects are often not eligible, which is the situation with Climate Action Reserve. These standards include meaningful monitoring standards to ensure that the intended results are achieved. The project will need to establish which offset best serves its purposes and be certain to mandate contractually the use of that offset’s measurement standards. Legal and business
Methane utilization can bring in revenue to contribute towards covering the costs of methane capture. Additional financing options include low-interest loans and grants. In addition to the large capital cost, the feasibility of coalbed methane projects from a legal and business standpoint depend greatly on the specifics of the site context. For this reason, given the length of time remaining in the semester and the lack of a concrete site partner, this project would be difficult for our student team to undertake at this time. There are a large number of potential coal mining sites under dispute, which could be candidates for land conservation or methane capture project. A challenge would be that these sites have different interested stakeholders, so each site may require substantial effort to reach project agreement. In general, participating communities need to provide documentation of their ownership of the land in question. For land owned by a federally-recognized tribe, the emissions are also owned by the tribe and could be sold by the tribe. In the Southern Ute project example, credits were only sold in the voluntary carbon market and not used for any compliance programs. Also important to note is that in the first year of operation, sufficient revenue was not brought in to 14 Mike Huisenga, WSP Environment & Energy. 2012. Southern Ute Indian Tribe Westside CBM Capture and Use Project. Version 10 Reissue. 15 LT Environmental, Inc. 2006. Preliminary Evaluation of Methane Seepage Mitigation Alternatives.

Team III: Potent greenhouse gas reduction project Appendix: Screening and feasibility assessment on potential projects
19
cover the expenses for contracted operations and maintenance. The gas price often needed to be relatively high, in order for the cash flow to be positive. If common infrastructure from established natural gas producers are used, as they have been in the Southern Ute project, additional permits would be needed to cover burning engine compressors, reboilers, and process heating equipment. To establish additionality in the Southern Ute project, VM0014 and the “Combined tool to identify the baseline scenario and demonstration of additionality” V 3.0 was used. The project was evaluated against tests for additionality to ensure that the project reduces anthropogenic GHG emissions to a level above and beyond what would have occurred in the absence of the project activity, or compared to the project baseline. In this project, the established criteria included ensuring that new instances being evaluated for regulatory additionality were only eligible when the price of natural gas was below $6.24 per thousand cubic feet.16 Public policy
No legislation currently exists that covers coalbed methane seepage, nor is likely to come to pass in the foreseeable future given the current political administration. Legislation that is passed in the future may also not be enforceable on tribal lands, so there may not be a requirement to address coalbed methane emissions. Public health
One primary concern with coalbeds methane migration into residential neighborhoods. Methane release can negatively impact surrounding communities; people exposed to high levels of methane have reported nausea, headaches, eye irritation, asthma aggravation and nose bleeds. Methane release may also create hazards when entering structures, including explosion risks that can endanger human welfare. Production of methane from coalbeds could help reduce emissions by removing methane that would otherwise be released to the atmosphere during coal mining.17 Preventing coal mining in Native American communities has other health benefits, such as by reducing potential air and water pollution. The safe disposal of water used in coal production is a major challenge, and a point of dispute in several communities located near coal production. Summary Although addressing methane seepage from coalbeds is an important issue, the legal and financial challenges associated with such projects are substantial. Given the high degree of variance between coal seam sites and the dependence on stakeholder engagement, it is more appropriate to explore a coalbed methane project after selecting a specific site and partner organizations.
16 Mike Huisenga, WSP Environment & Energy. 2012. Southern Ute Indian Tribe Westside CBM Capture and Use Project. Version 10 Reissue. 17 U.S. Geological Survey. Coalbed Methane: Potential and Concerns. Accessed at https://pubs.usgs.gov/fs/fs123-00/fs123-00.pdf
Team III: Potent greenhouse gas reduction project Appendix: Screening and feasibility assessment on potential projects
20
3. Landfill methane
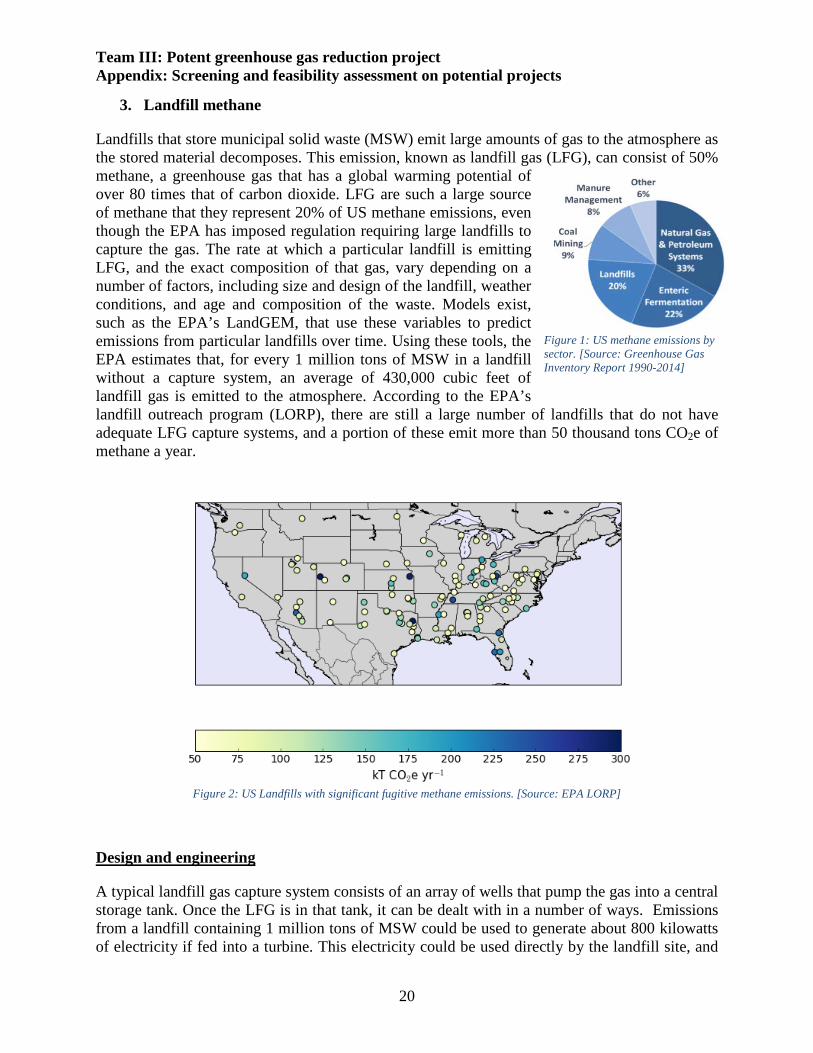
Landfills that store municipal solid waste (MSW) emit large amounts of gas to the atmosphere as the stored material decomposes. This emission, known as landfill gas (LFG), can consist of 50% methane, a greenhouse gas that has a global warming potential of over 80 times that of carbon dioxide. LFG are such a large source of methane that they represent 20% of US methane emissions, even though the EPA has imposed regulation requiring large landfills to capture the gas. The rate at which a particular landfill is emitting LFG, and the exact composition of that gas, vary depending on a number of factors, including size and design of the landfill, weather conditions, and age and composition of the waste. Models exist, such as the EPA’s LandGEM, that use these variables to predict emissions from particular landfills over time. Using these tools, the EPA estimates that, for every 1 million tons of MSW in a landfill without a capture system, an average of 430,000 cubic feet of landfill gas is emitted to the atmosphere. According to the EPA’s landfill outreach program (LORP), there are still a large number of landfills that do not have adequate LFG capture systems, and a portion of these emit more than 50 thousand tons CO2e of methane a year.
Figure 2: US Landfills with significant fugitive methane emissions. [Source: EPA LORP]
Design and engineering
A typical landfill gas capture system consists of an array of wells that pump the gas into a central storage tank. Once the LFG is in that tank, it can be dealt with in a number of ways. Emissions from a landfill containing 1 million tons of MSW could be used to generate about 800 kilowatts of electricity if fed into a turbine. This electricity could be used directly by the landfill site, and
Figure 1: US methane emissions by sector. [Source: Greenhouse Gas Inventory Report 1990-2014]

Team III: Potent greenhouse gas reduction project Appendix: Screening and feasibility assessment on potential projects
21
excess can be sold to the grid. There are additional possible uses for the captured LFC, as shown in Figure 3.
Figure 3: Schematic of possible uses of captured LFG
Direct-use projects utilizing LFG include heating; ethanol and vehicle fuel (LNG or CNG) production; and kilns for glassblowing, pottery, and blacksmithing operations. The difficulty in designing direct-use systems is that a specific type of operation (like an ethanol plant) needs to be located close to the landfill, making each of this projects unique and not scalable. Legal There is both state and national regulation pertaining to landfills. Pursuant to regulations promulgated by EPA under the Resource Conservation and Recovery Act, new landfills must be lined as part of their construction, and covered once they are decommissioned.18 This regulation is done under the Resource Conservation and Recovery Act. The EPA also regulates methane emissions from landfills under the Clean Air Act. As of August 2016, municipal solid waste (MSW) landfills that contain over 2.5 million cubic meters (or 2.5 million metric tons) of waste must install technology that captures methane. Once captured, the methane can either be flared or used in electricity or heat generation. Business The cost of installing methane capture systems depends on the size of the landfill and how the gas is used after capture. If there is no capture system on the landfill, the EPA estimates that the cost of installing the capture system and a 3 Megawatt turbine would be approximately $8.5 million. The electricity from the turbine could then be sold into the grid, however this won’t cover the high initial cost, and the system is projected to have a net loss of about $3.5 million by the end of its 15-year lifetime. This also generates offsets. The American Carbon Registry, the Climate Action Reserve, and the Verified Carbon Standard all have systems in place to generate offsets from LFG capture utilization. Heat generation systems and systems that directly use the methane for industrial purposes are cheaper than power generators, but the methane cannot be transported without pipelines or truck transport, which would be an increased cost.
18 See generally 40 C.F.R. § 258.

Team III: Potent greenhouse gas reduction project Appendix: Screening and feasibility assessment on potential projects
22
Installing electricity or heat generation on pre-existing capture systems is much less expensive, and can be profitable. However, although the generation of electricity or heat from this methane could offset greenhouse gas emissions, it does not result in less methane being emitted to the atmosphere, and is therefore not aligned with the goals of this project. Public policy
Because the EPA requires all landfills of a certain size to practice landfill gas capture, it is difficult to envision a project that reduces methane emissions by addressing landfills. The EPA also has a program, known as the Landfill Methane Outreach Program (LMOP) which promotes the adoption of technologies to use the captured gas for electricity generation and other purposes. Public health
Direct emissions of methane from landfills may be in low enough concentrations to not be a direct public health concern. However, there are other components of LFG that are harmful, and landfill gas capture systems have been shown to reduce levels of these pollutants. Electricity that is generated by LFC can be used to offset emissions by more toxic conventional power plants, such as coal. Summary Although fugitive emissions from landfills are a significant source of methane in the atmosphere (accounting for a third of US anthropogenic methane emissions), legislation and strong government outreach to address this problem already exists. It would be difficult and expensive, though not impossible, to devise a project that could reduce methane emissions from SMW landfills.
PROJECT SELECTION
The results of the feasibility analysis brought agricultural nitrous oxide to the forefront of challenges to tackle for our final project, based on the relatively lower cost of design and engineering interventions, more straightforward legal considerations, contacts with possible partner organizations and potential scalability across farms. We also believe that the nitrous oxide option has the potential to address a segment of greenhouse gas emissions that currently goes largely unaddressed, while also creating significant environmental and public health co-benefits. Our team will focus on reducing nitrous oxide emissions from agriculture, but recommend that future teams continue to screen projects around reducing methane from landfills or coalbeds.

Team III: Potent greenhouse gas reduction project Appendix: Screening and feasibility assessment on potential projects
23
Appendix Contacts for coalbed methane (CBM) projects Looking to the future, potential partners for coalbed methane projects include Native American communities where residents wish to prevent mining or mining expansion, but also need to consider generation of economic resources, so methane capture and use could be an alternative that is of interest. Example sites include coal seams in the Navajo, Hopi, Cheyenne, and Crow Nations. Our team has preliminary contacts in the Navajo Nation, including community coalitions, local universities and local offices of federal departments, who are interested in working to prevent additional mining and capture methane from un-mined sites. Navajo Technical University: http://www.navajotech.edu/ Black Mesa Water Coalition: http://www.blackmesawatercoalition.org/ Navajo Land Department: http://www.dinehbikeyah.org/ U.S. Department of the Interior Bureau of Indian Affairs Navajo Regional Office: https://www.indianaffairs.gov/WhoWeAre/RegionalOffices/Navajo/index.htm Another potential partner is Harvard’s Four Directions Summer Research Program, which brings Native American undergrads to Boston for the summer to explore careers in medicine and public health under the supervision of staff from HMS and Brigham & Women’s Hospital. Involving students from this program in analyzing the public health impacts of a coalbed methane project could be an innovative cross-campus partnership. We recommend that the next team leverages these and other contacts, such as from the Harvard University Native American Program led by Professor Dennis Norman, to select specific sites to screen the feasibility of potential coalbed methane projects.

Team III: Potent greenhouse gas reduction project Implementation plan: Agricultural nitrogen fertilizer reduction offset project Jessica Huang, Taylor Jones, Chaz Kelsh Table of contents Executive summary ......................................................................................................................... 2 Project goal ..................................................................................................................................... 2 Nitrous oxide in the atmosphere ..................................................................................................... 4 Nitrous oxide emissions from agriculture ....................................................................................... 4 Standardized and project-specific methodologies .......................................................................... 5 Quantification of emissions reductions ........................................................................................... 7 Uncertainty and variance of the emissions factor ........................................................................... 8 Legitimacy and credibility of the offsets ........................................................................................ 9 Magnitude of potential offset opportunities .................................................................................... 9 Regulatory concerns...................................................................................................................... 10 Cost estimates ............................................................................................................................... 11 Financing....................................................................................................................................... 14 Guarantees..................................................................................................................................... 15 Contracting .................................................................................................................................... 16 Co-benefits .................................................................................................................................... 17 Farmer engagement ....................................................................................................................... 23 Areas for additional research and development ............................................................................ 24 Appendix: Detailed financial model ............................................................................................. 25 Our screening and feasibility assessment on potential projects is attached as a separate appendix.
Team III: Potent greenhouse gas reduction project Implementation plan for agricultural nitrogen fertilizer reduction offset project
2
Executive summary
Nitrogen fertilizer use is the largest source of emissions of nitrous oxide, a powerful greenhouse gas, to the atmosphere. While some use of these fertilizers may be necessary for needed levels of food production, a large portion of these emissions could be avoided by the adoption of efficient fertilizer application strategies. Carbon credit registries recognize these reduction strategies, and have approved protocols to issue carbon credits for their use, but so far very few projects have been developed to claim them. The major barrier has been high transaction costs to estimate the emissions reductions, enroll farmer-participants, and verify the reductions in fertilizer use. This implementation plan proposes that an unregulated entity could pay farmers directly to use less nitrogen fertilizer and thus reduce their farms’ nitrous oxide emissions, taking a first significant step toward addressing greenhouse gas emissions from agriculture. In addition to achieving significant emissions reductions by reducing the use of these fertilizers, an unregulated entity would make a significant contribution by creating an improved method for doing the necessary paperwork and auditing to confirm reduced fertilizer use and thereby generate real, additional offsets at a scale that is cost-effective with essentially no risk of leakage. Such a project would rely on a scientific framework that has already been established and draw heavily on lessons learned from pilot projects that have successfully generated carbon credits from fertilizer management improvement. Bringing a project of this kind to scale would represent an important first step to developing a systematic approach to reducing nitrous oxide emissions from agriculture. At an estimated offset cost of about $14 per ton, a nitrogen fertilizer offset project would be somewhat more expensive than many other currently available offsets. The project should take advantage of an educational organization’s student employment model to enroll farmers and verify offsets while creating educational opportunities for the students involved, with further potential to involve an outside sponsor to share in some or all of the offsets established. That model would greatly reduce the high verification costs that previous attempts to create nitrogen fertilizer offsets have faced. Nitrogen fertilizer also creates a significant portion of the nation’s water pollution, causing problems like the dead zone in the Gulf of Mexico. As a result, a project to encourage the use of less nitrogen fertilizer would also have significant environmental co-benefits, worth as much as $10.8 million for the estimated 47,000 kg NO3-N per year of avoided runoff to the watershed. The project would also have broader co-benefits for public health and other social goals, such as farmer engagement on climate issues. Project goal
Concerns over the effects of climate change have led to the establishment of international agreements and national and state policies to reduce greenhouse gas emissions. Federal regulations, however, have focused on power plants and transportation, and most individuals and corporations are not legally responsible for their emissions. Even though they are not legally required to do so, some organizations (referred to as unregulated entities) want to reduce emissions for a variety of reasons and are willing to invest financial and other resources in exchange for the ability to claim these reductions. Although carbon credit and renewable energy
Team III: Potent greenhouse gas reduction project Implementation plan for agricultural nitrogen fertilizer reduction offset project
3
credit markets exist, there is room for innovation in the design and implementation of emissions reduction projects that appeal to unregulated entities. The goal of this implementation plan is to design a project that, through the mitigation of emission of gases other than carbon dioxide, results in an emissions reduction equivalent to 50,000 tons of CO2 a year. By participating in the project, an unregulated entity would be able to claim credit for these reductions, and feel confident that they are real and additional. While the resulting project could be attractive to a variety of unregulated entities, the project considers utilizing the unique resources of a research university. The most significant anthropogenic greenhouse gases other than carbon dioxide are methane (CH4), nitrous oxide (N2O), and hydro-fluorocarbons (HFCs). We considered a variety of projects, each addressing one or more of these gases, in the initial phase of this work. These included such diverse ideas as investing in a methane capture system for a landfill, replacing HFCs in refrigeration systems, and capturing used nitrous oxide from dental offices. These projects were analyzed base on criteria such as size of reduction, cost, and the ease of establishing additionality.
HFCs N20 CH4
supe
rmar
kets
publ
ic sc
hool
s
liquo
r st
ores
hosp
itals
dent
ists
agri
cultu
ral
coal
bed
coal
min
e
land
fills
oil a
nd g
as
agri
cultu
ral
Size of reduction opportunity 2 1 2 1 1 3 3 3 3 3 2 Ease of establishing additionality 1 1 2 2 3 3 2 2 2 2 3 Upfront costs 2 2 1 1 2 3 1 1 1 1 1 Ongoing costs 2 2 2 2 2 2 2 2 3 1 1 Team’s topical interest 2 2 2 2 2 3 3 2 3 1 2 Scalability 2 2 2 1 2 3 3 1 3 2 1 Public health co-benefits 1 1 1 1 1 2 2 2 2 2 2 Verifiability 3 3 3 2 2 2 3 3 3 3 3 Partnership opportunities 1 2 1 2 2 2 3 3 2 1 2 Average 1.78 1.89 1.78 1.56 1.89 2.56 2.44 2.00 2.44 1.78 1.89
Some projects, such as addressing landfill methane, had a large opportunity for reductions, but the upfront costs for purchasing and installing such a system were high. The most attractive idea to emerge during this screening exercise was the implementation of a nitrogen fertilizer reduction program. This implementation plan was developed to demonstrate how a nitrogen fertilizer offset program could be scaled to generate offsets equivalent to 50,000 tons of CO2 annually at a cost level that could make the project attractive to an unregulated entity.

Team III: Potent greenhouse gas reduction project Implementation plan for agricultural nitrogen fertilizer reduction offset project
4
Nitrous oxide in the atmosphere
Nitrous oxide (N2O) is naturally found in trace amounts in the atmosphere. Since 1750, N2O concentrations have increased 17 percent, and are now currently increasing at a rate of about 0.3 percent a year, with the primary component of this increase being emissions from agriculture.1 Currently, the average concentration of N2O is about 320 parts per billion (ppb). N2O is a powerful greenhouse gas, with a 100-year global warming potential of 298.2 This means that over a 100-year time frame, an emitted molecule of N2O will trap almost 300 times as much heat as a molecule of CO2. This is because the baseline concentration is so low, and because nitrous oxide is a stable molecule with a mean lifetime of over 100 years in the atmosphere. Because it has such a long lifetime, N2O emissions make their way to the stratosphere, where they can be oxidized to nitric oxide (NO) by atomic oxygen. The resulting NOx acts as a catalyst for the destruction of stratospheric ozone (O3). Since the implementation of the Montreal Protocol, which banned the production of CFCs, nitrous oxide is now considered the most significant manmade ozone-depleting substance.1 Nitrous oxide emissions from agriculture
Nitrogen is an essential nutrient for plants, and is naturally found in soils in compounds such as nitrate (NO3
-), ammonia (NH3), and ammonium (NH4
+). Special bacteria in soils are able to create these compounds from molecular nitrogen (N2) which comprises 78 percent of the earth’s atmosphere. This process is known as nitrogen fixation, and once nitrogen is fixed in soils it can be absorbed by the roots of plants. When plants die and decay, this nitrogen returns to the soil. Figure 2 shows the major processes involved in the natural nitrogen cycle. Agriculture disrupts the natural nitrogen cycle. Because crops are not left to decay in the fields, soils become depleted in nitrogen after years of farming. To compensate for this, farmers apply nitrogen fertilizers, such as ammonium nitrate (NH4NO3) and urea (CO(NH2)2) to farm soils. If a soil’s nitrogen is depleted, adding nitrogen to the soil will increase crop yield. However, not all
1 Jacob, Daniel, Introduction to Atmospheric Chemistry, Princeton University Press, (2011). 2 IPCC, 2014: Climate Change 2014: Synthesis Report. Contribution of Working Groups I, II and III to the Fifth Assessment Report of the Intergovernmental Panel on Climate Change [Core Writing Team, R.K. Pachauri and L.A. Meyer (eds.)]. IPCC, Geneva, Switzerland (2014): 151 pp.
Figure 2: The Nitrogen Cycle1
Figure 1: Prehistoric and Historic Atmospheric Nitrous Oxide Concentrations

Team III: Potent greenhouse gas reduction project Implementation plan for agricultural nitrogen fertilizer reduction offset project
5
of the nitrogen in applied fertilizers is absorbed by plants, as some will become runoff into waterways and some will be converted to N2O by microbes in several processes, such as nitrification and denitrification. This N2O is then emitted to the atmosphere. The rate of nitrous oxide emitted by an acre of farmland depends on a myriad of factors, such as the type and amount of fertilizer used, the timing of fertilizer application, the crop(s) planted, the soil type, and weather. The most important factor is the amount of N fertilizer used, and the more fertilizer applied, the more N2O is emitted. The IPCC estimates that 1 percent of nitrogen applied in fertilizer is converted to N2O,2 but experiments have shown that the true rate is typically much higher and that the relationship is non-linear.3 As more and more nitrogen is added, it has less incremental impact on yield, and at some point, stops having any measurable impact at all. This point is known as the agronomic optimal N rate (AONR). Any nitrogen application above the AONR will not be absorbed by the crops, and will not increase yield. The exact value of the AONR is dependent on a number of factors, but a typical value for a cornfield in the NCR is about 150 kg N ha-1 yr-1. If nitrogen fertilizer were inexpensive, it would be in the farmer’s best interest to fertilize at the AONR. However, since farmers’ fertilizer expenses can be significant, a different rate of application, known as the maximum return to nitrogen (MRTN) is optimal. At the MRTN, a dollar of additional fertilizer usage results in a dollar of additional crop yield. Therefore, applying nitrogen above the MRTN is not cost-effective. In times when the price of fertilizer is high relative to the price of corn, the MRTN is lower. The MRTN is always lower than the AONR.4 Standardized and project-specific methodologies
The American Carbon Registry (ACR), the Climate Action Reserve (CAR), and the Verified Carbon Standard (VCS) have all approved methodologies for issuing carbon credits for N2O mitigation by fertilizer management.5 For this project, we suggest not participating in any of these programs. Instead, we recommend implementing a similar program that is run by the unregulated entity. The cost savings of not having to participate in a third-party program are significant, and we are confident that the offsets generated, while not eligible for trade on any existing market, will still be representative of real, additional offsets. All of these methodologies rely on the same basic framework. When a farm applies for offsets, information about the farm and its historical practices is fed into a model that estimates how 3 Hoben, J. P. et al, Nonlinear nitrous oxide (N2O) response to Nitrogen Fertilizer in on-farm corn crops of the US Midwest. Global Change Biology, 17 (2011): pp. 1140-1152 4 Ribaudo, M. et al, Nitrogen Management on US Corn Acres 2001-10. USDA-ERS. Economic Brief #20 (November 2012). 5 Anderson, M. et al, Bringing Greenhouse Gas Benefits to Market: Nutrient Management for Nitrous Oxide Reduction. Delta Institute (October 2015).
Figure 3: Recent trends in nitrogen fertilizer prices, and the nitrogen to corn price ratio. These trends affect the MRTN and fertilizer application rates.

Team III: Potent greenhouse gas reduction project Implementation plan for agricultural nitrogen fertilizer reduction offset project
6
much N2O is emitted from that farm every year. This pre-mitigation emission rate is known as the “baseline” rate. The operator of the farm then agrees to a different set of fertilizer practices aimed at reducing emissions for a particular year. The parameters associated with the new scheme are fed into the model, which estimates the emissions for that year. This emission is subtracted from the baseline to calculate the emissions reduction, which is then converted to an equivalent CO2 reduction, and offsets for that amount are issued. The entire process is itemized in Table 1.
Table 1: Project Methodology
Different methodologies rely on different models, and we suggest starting with the ACR approved method developed by Michigan State University and the Electric Power Research Project known as MSU-EPRI Method 2. This method is classified as a “Tier 2” technique according to the IPCC, and is considered valid as long as the method is transparent and based on published, peer-reviewed data and analysis. The three tiers are given in Table 2. Tier 1 is the simplest to implement, but is less accurate than Tier 2 and 3 methods.
Table 2:The 3 tiers of N2O-N emissions estimation techniques supported by the IPCC6
Unlike some other methods, which use the Tier 1 emission factor of 1 percent suggested by the IPCC, MSU-EPRI Method 2 utilizes field data gathered in the North Central Region, which consists of 12 Midwestern states, to more accurately predict the effects of fertilizer practices in
6 IPCC. Revised 1996 IPCC Guidelines for National Greenhouse Inventories. Houghton J.T., Meira Filho L.G., Lim B., Tréanton K., Mamaty I., Bonduki Y., Griggs D.J. Callander B.A. (Eds). Intergovernmental Panel on Climate Change (IPCC), IPCC/OECD/IEA, Paris, France (1997).
Step Responsible Party 1 outreach/farm manager engagement NRE or hired consultant 2 submission of baseline data Farm Manager 3 analysis of baseline data NRE 4 suggested practices & ex ante offset potential NRE 5 contract agreement NRE & Farm Manager 6 implementation of suggested practices Farm Manager 7 submission of improved practice data Farm Manager 8 analysis of improved practice data NRE 9 determination of offsets achieved NRE 10 payment made to farm manager NRE 11 audit (optional) NRE or hired consultant 12 Contract Renewal (optional) NRE & Farm Manager
Tier 1 An emissions factor of 1 percent is used. Tier 2 An emissions rate is generated based on data from farms with similar
characteristics to the project farm. Tier 3 Emission rates are generated from a more comprehensive model that uses both
regional N2O observations and specific data about the project farm.

Team III: Potent greenhouse gas reduction project Implementation plan for agricultural nitrogen fertilizer reduction offset project
7
cornfields in that region.7 The resulting project- and year-specific emission factors are much higher, typically generating between two and five times more offsets. As part of our recommended methodology, we suggest investing in developing a Tier 3 method by creating an improved model that makes use of lessons learned as the project matures. Although there is a pathway to acceptance of Tier 3 methods by both the IPCC and ACR, the work would have to be peer-reviewed and published before implementation to ensure its legitimacy. If a research university is the unregulated entity pursuing the project, it is possible that they would be willing to do this work in-house, as it could align with their core research goals. Quantification of emissions reductions
The eligible offset of nitrous oxide, in tons of nitrogen in the form of N2O (denoted tN2O-N), is given by:
tN2O-N = ( 𝐸𝐵 − 𝐸𝑅) × 𝐴 × 𝑈 Where EB is the baseline emission rate, ER is the reduced emission rate, A is the project area, and U is an uncertainty reduction factor, which devalues the offset to compensate for uncertainties in the model. Depending on the size of the reduction, the MSU-EPRI Method 2 suggests uncertainty reduction factors between .83 and 1. In order to calculate the baseline emission rate, five years of data are needed from the farm manager to show that the practices implemented as part of this program will indeed be additional. Farm managers would provide these data in the form of receipt copies and signed statements, which would be subject to audit. Data required from the farm manager to establish the baseline include:
• Farm size • Farm location (GPS) • Crop type • Planting date • Harvest date • Fraction of leaves and stems left in field after harvest • Yield • Tillage events: number, dates, and depths • Fertilizer application events: number, dates, types, and amounts • Irrigation events: number, dates, types, and amounts
These criteria were chosen because of their significance in the MSU-EPRI Method 2 model.5 Additional parameters, such as soil type, meteorology, and carbon-nitrogen ratio of the yield, can be modeled without data from the farm manager. However, if it seems worthwhile, physical measurement of additional parameters can be included as part of an audit.
7 MSU-EPRI Methodology: Quantifying N2O Emission Reductions in US Agriculture Crops through N fertilizer rates reduction.

Team III: Potent greenhouse gas reduction project Implementation plan for agricultural nitrogen fertilizer reduction offset project
8
As farmers apply to participate in the offset program, their program will have to analyze each farmer’s baseline data to make recommendations to the farmer about the amount and type of fertilizer used. None of the suggested changes will require the purchase of equipment or any other large costs to either the farmer or the unregulated entity. Because farmers eligible to participate in the program will use less fertilizer than before joining the program, most will realize a cost savings in addition to revenue from the program. At the end of the project year, all of the above information must be submitted again, and the model run again to generate ER. To convert to tCO2e, the mass of the reduction (in tN2O-N) must be multiplied by the ratio of molar masses of the two-molecular nitrogen and CO2, and then by the molar GWP of N2O:
tCO2e = tN2O-N ×2844
× 298 + ∆CO2 The final term, ∆CO2, represents the change in actual CO2 emissions that have resulted from the change in fertilizer application. In theory, this term, which includes changed tilling patterns’ effect on fuel use by farm equipment, could be positive or negative. For farmers who comply with program requirements, we expect this term to be small and positive, the result of less fertilizer application and less frequent tilling operations. Uncertainty and variance of the emissions factor
There is a large difference in the number of offsets generated by the IPCC Tier 1 protocol and those possible under Tier 2 and Tier 3 methods. The 1 percent emissions factor used in Tier 1 calculations is based on a study in 1999 (see Figure 5.A) that compiled data from a variety of farm types around the world.8 A review done in 2014 (see Figure 5.B), which complied data from many studies specifically from cornfields in the United States, shows a much broader spectrum of emissions rates.9
8 Bouwman, A. F. "Direct Emission of Nitrous Oxide from Agricultural Soils." Nutrient Cycling in Agroecosystems 46.1 (1996): 53-70. 9 Decock, Charlotte. "Mitigating Nitrous Oxide Emissions from Corn Cropping Systems in the Midwestern U.S.: Potential and Data Gaps." Environmental Science & Technology 48.8 (2014): 4247-256.
Figure 4: An example MSU-EPRI emission rate curve. Note that at large application rates small decreases in application can have large emission reductions. The green curves show upper and lower uncertainty limits. Lower limits are used in offset generation.

Team III: Potent greenhouse gas reduction project Implementation plan for agricultural nitrogen fertilizer reduction offset project
9
Figure 5: Emissions rates based on A) Bouwman 1999 and B) Decock 2014. The solid black line in (A) represents an emissions factor of 1 percent, while the blue and green lines in (B) show linear and exponential fits, respectively. Dashed lines represent 95 percent confidence intervals.
These uncertainties can be reduced through more experimental and modeling research, and putting effort into these areas has the potential to greatly increase both the number of offsets generated and their accuracy. Even without the development of a Tier 3 framework, however, a project that utilizes the existing Tier 2 method (MSU-EPRI Method 2) still promises substantial emissions reduction credits that are credible and legitimate. Legitimacy and credibility of the offsets
The MSU-EPRI Method 2 methodology used above has been approved by both ACR and VCS as eligible protocols for generating tradable offsets. While the science of N2O emissions is complicated, we believe that the credits generated with this method are legitimate, particularly if the offset project uses conservative estimates and appropriate uncertainty reduction factors. Because the methodology requires proof of baseline practices, we are confident that the emissions credits generated are truly additional. There is a possibility for fraud in the representation of both baseline and project practices, but the current protocols do not consider this in their implementation literature. Leakage is also not a major concern for this project, because switching to optimized fertilizer management practices does not theoretically negatively impact the farmer or crop yields, and does not encourage additional fertilizer use elsewhere. The legitimacy of this project’s strong additionality claims and the absence of leakage make this particular project particularly attractive, as these can be difficult factors to account for in other types of greenhouse gas mitigation efforts. Magnitude of potential offset opportunities
MSU-EPRI Method 2 emissions factors generated in previous works suggest that 50,000 Mg CO2e of N2O reductions could be achieved by improved fertilizer management on 100,000 acres of corn. There are 13 million acres of corn farms in Iowa alone,10 indicating that a large impact could be achieved by engaging even a small percentage of eligible farmland. A recent census conducted by University of Illinois indicated that the average farm size in that state is between 100 and 200 acres.11 We therefore estimate that this project would be able to meet its emissions 10 USDA, (March 2016). 11 Kuethe, T. Highlights of the 2012 Census of Agriculture: Distribution of Farm Size. Farmdoc Daily (4):132, (2014).
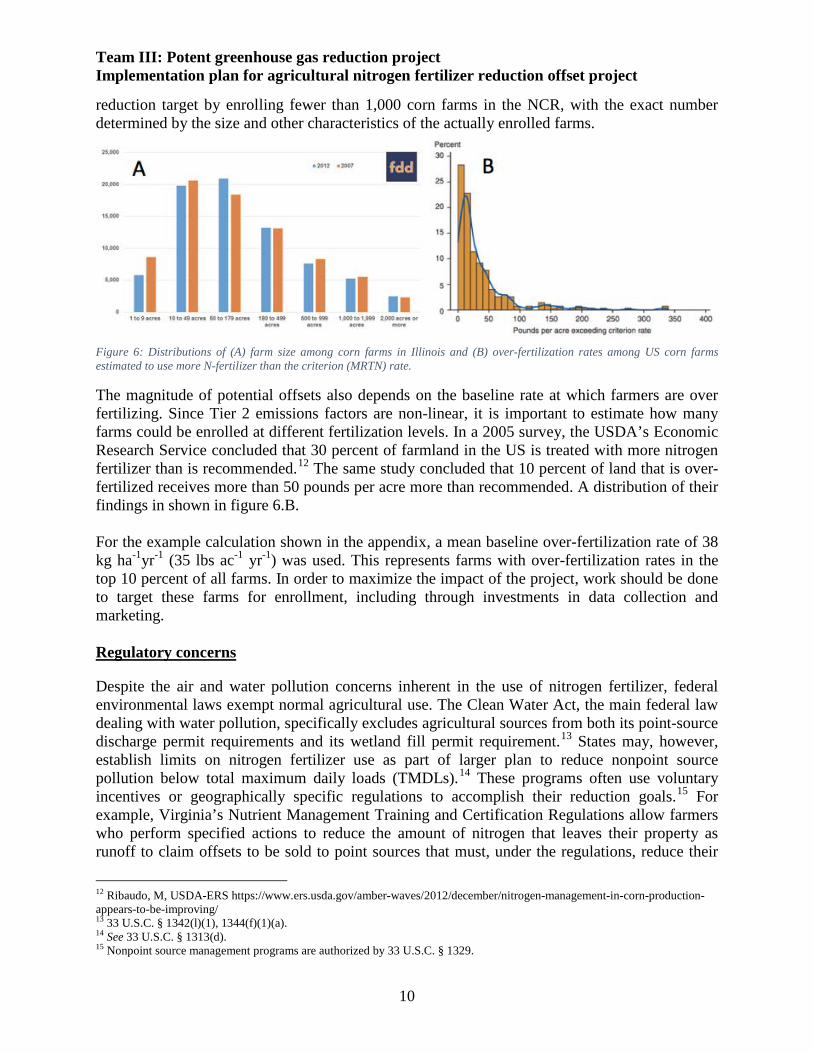
Team III: Potent greenhouse gas reduction project Implementation plan for agricultural nitrogen fertilizer reduction offset project
10
reduction target by enrolling fewer than 1,000 corn farms in the NCR, with the exact number determined by the size and other characteristics of the actually enrolled farms.
Figure 6: Distributions of (A) farm size among corn farms in Illinois and (B) over-fertilization rates among US corn farms estimated to use more N-fertilizer than the criterion (MRTN) rate.
The magnitude of potential offsets also depends on the baseline rate at which farmers are over fertilizing. Since Tier 2 emissions factors are non-linear, it is important to estimate how many farms could be enrolled at different fertilization levels. In a 2005 survey, the USDA’s Economic Research Service concluded that 30 percent of farmland in the US is treated with more nitrogen fertilizer than is recommended.12 The same study concluded that 10 percent of land that is over-fertilized receives more than 50 pounds per acre more than recommended. A distribution of their findings in shown in figure 6.B. For the example calculation shown in the appendix, a mean baseline over-fertilization rate of 38 kg ha-1yr-1 (35 lbs ac-1 yr-1) was used. This represents farms with over-fertilization rates in the top 10 percent of all farms. In order to maximize the impact of the project, work should be done to target these farms for enrollment, including through investments in data collection and marketing. Regulatory concerns
Despite the air and water pollution concerns inherent in the use of nitrogen fertilizer, federal environmental laws exempt normal agricultural use. The Clean Water Act, the main federal law dealing with water pollution, specifically excludes agricultural sources from both its point-source discharge permit requirements and its wetland fill permit requirement.13 States may, however, establish limits on nitrogen fertilizer use as part of larger plan to reduce nonpoint source pollution below total maximum daily loads (TMDLs).14 These programs often use voluntary incentives or geographically specific regulations to accomplish their reduction goals.15 For example, Virginia’s Nutrient Management Training and Certification Regulations allow farmers who perform specified actions to reduce the amount of nitrogen that leaves their property as runoff to claim offsets to be sold to point sources that must, under the regulations, reduce their
12 Ribaudo, M, USDA-ERS https://www.ers.usda.gov/amber-waves/2012/december/nitrogen-management-in-corn-production-appears-to-be-improving/ 13 33 U.S.C. § 1342(l)(1), 1344(f)(1)(a). 14 See 33 U.S.C. § 1313(d). 15 Nonpoint source management programs are authorized by 33 U.S.C. § 1329.

Team III: Potent greenhouse gas reduction project Implementation plan for agricultural nitrogen fertilizer reduction offset project
11
nitrogen runoff.16 These regulations are now part of Virginia’s efforts to comply with the Chesapeake Bay TMDL.17 Because these regulations and incentive programs produce the same kind of benefits as this proposed offset program, the two programs can conflict and create concerns about additionality. If regulations applicable to a certain farmer already cover nitrogen fertilizer use, or if a farmer has already voluntarily agreed to reduce nitrogen fertilizer use as part of an incentive program, that farmer should be excluded from an offset program of this kind because the potential for truly additional emissions reductions is so significantly reduced by their existing commitments. Given the need to minimize the project’s per-ton offset cost, the relatively fewer tons that could be counted as additional from a farmer that has already made any effort to reduce fertilizer use despite still incurring the same enrollment costs makes such a farmer a less desirable candidate. Because any existing fertilizer use regulations may vary significantly by locality, a legal analysis specific to each potential project site must be performed to check whether any such regulations apply and, if so, whether they cover nitrogen fertilizer use.18 To minimize the burden of this task, implementation of the offset project should focus on a single area (e.g. a single state or county) where the lack of current regulations has been verified. Outside of these frameworks, there are no other significant legal barriers to farmers’ usage of less nitrogen fertilizer. Nitrogen fertilizer use is not currently regulated at the national level for either emissions or runoff purposes, though some states have begun proposing or adopting regulations.19 For example, a proposed Minnesota rule, which may take effect in 2018, requires the use of defined best management practices that vary for each part of that state to reduce nitrogen emissions and runoff.20 The sponsoring organization should monitor proposed regulation in the area in which the project is developed and consider soliciting farmers only in areas that are expected to remain unregulated. If currently enrolled farmers become subject to regulation, the claimed emissions reductions may no longer be additional. Cost estimates
As an initial estimate, we believe that the project would have a run-rate cost of about $14 per ton of CO2e reduced based on an initial farmer compensation figure of $10 per enrolled acre. Though this is more expensive than some offset options, it nearly mirrors the California trading
16 See 4 VA. ADMIN. CODE 5-15-10 et seq. 17 See generally Virginia Department of Environmental Protection, “Trading Nutrient Reductions from Nonpoint Source Best Management Practices in the Chesapeake Bay Watershed: Guidance for Agricultural Landowners and Your Potential Trading Partners,” available at http://www.deq.virginia.gov/Portals/0/DEQ/Water/PollutionDischargeElimination/VANPSTradingManual_2-5-08.pdf; see also Environmental Protection Agency, “Trading and Offsets in the Chesapeake Bay Watershed,” available at https://www.epa.gov/chesapeake-bay-tmdl/trading-and-offsets-chesapeake-bay-watershed. 18 See American Carbon Registry, “Methodology for Quantifying Nitrous Oxide (N2O) Emissions Reductions from Reduced Use of Nitrogen Fertilizer on Agricultural Crops,” § 5.1, available at https://lter.kbs.msu.edu/docs/robertson/Millar_et_al_2012_ACR.pdf. 19 See, e.g., Minnesota Department of Agriculture, “Proposed Nitrogen Fertilizer Rule,” available at https://www.mda.state.mn.us/~/media/Files/chemicals/nfmp/nitrogenproprule.pdf (November 2016). 20 Id.

Team III: Potent greenhouse gas reduction project Implementation plan for agricultural nitrogen fertilizer reduction offset project
12
market price of about $14 per ton.21 Furthermore, the significant environmental and public health co-benefits and potential to unlock even greater emission reductions from the agricultural sector justify this project’s higher costs. Because this project would be one of the very first large-scale attempts to reduce emission from nitrogen fertilizer, the project sponsor’s higher price would reflect the first steps toward bridging the “commercial valley of death” that currently makes these projects uneconomical on the offset market. Further, the price per ton is well below the EPA’s social cost of carbon of $42 for 2020, assuming a 3 percent discount rate.22 A basic model of the costs of establishing the offset program is included in the appendix. The most significant project cost is farmer compensation. Because the emissions eliminated by the project depends on how many acres are enrolled in the project and the number of CO2e tons eliminated per acre, the project cost depends on the success of enrolling farmers and the latest science on emissions reductions per acre. Existing science suggests that the emissions reduced per acre varies with the average baseline fertilizer use per year. Cost projections shown here assume a median value for this figure that we believe represents a reasonable figure for many potential farms. When considering potential farmer-enrollees, the program should attempt to enroll farms with higher baseline fertilizer use to maximize offset value. To streamline project administration, we suggest compensating farmers per enrolled acre rather than per emissions ton reduced. Though this may, in some cases, reduce cost-effectiveness, such reductions can be minimized by enrolling only farmers whose crops generate sufficient emission reductions to justify the standard payment rate per enrolled acre. Future refinements to the project methodology could tailor the payment rate to the specific profile of each farmer’s crops, such that farmers whose land is estimated to produce less emission reduction — perhaps because that farmer already used a lower amount of nitrogen fertilizer than the project assumed as a baseline — would be paid less per acre. Such refinements could be informed by experience in initial farmer enrollments. The data from those enrollments could be used to inform improvements to the model used to calculate the estimated emission reduction per acre, which can vary widely based on existing fertilizer use and other characteristics. A future farmer compensation model could then better reward the most valuable farms to make the program more attractive to those farmers with whom it would also be most effective as an emissions reduction program. The rate of farmer compensation for program participation is the most significant driver of the total cost of the project, and should be informed by the latest science on forgone emissions per acre so that the desired price per ton of emissions reduced is achieved.23 The $10 per acre figure used in the financial model for this implementation plan represents a cost high enough to represent a moderate income stream for large farms while also reasonable enough to hold down program costs. As the project develops, the figure should be revised to reflect the latest science, provide sufficient farmer incentives, and account for potential differences between farms in the
21 California Carbon Allowance Future, Vintage 2017 trading price in March 2017, available at https://www.theice.com/marketdata/reports/142. 22 Environmental Protection Agency, “Technical Support Document: Technical Update of the Social Cost of Carbon for Regulatory Impact Analysis Under Executive Order 12866,” August 2016, available at https://www.epa.gov/sites/production/files/2016-12/documents/sc_co2_tsd_august_2016.pdf. 23 See, e.g., American Carbon Registry, supra note 18.
Team III: Potent greenhouse gas reduction project Implementation plan for agricultural nitrogen fertilizer reduction offset project
13
number of offsets generated. If this amount needs to be increased significantly, the cost per offset could also rise significantly. The second major project cost is the verification of the offsets. We recommend that the unregulated entity sponsoring the project establish an ongoing program office within itself to enroll farmers, verify fertilizer use reductions, and perform any needed ongoing support tasks (see more under “Financing”). To reduce costs further and leverage local connections, the program office could also be located at a land grant university closer to the enrolled farms, where the mission alignment between the program office and home university would be greater. Locating the program office at such a university could also take advantage of that school’s agricultural sciences programs to hire students for the program office who are differentially well-suited for the work. The program office would perform the following tasks in-house:
• Central administration: The program office should take advantage of an existing sustainability or environmental office to leverage 50 percent of a full-time employee dedicated to program administration. This FTE would be in addition to higher-level oversight of the program, for which we allocate no direct costs (e.g. the sustainability director responsible for selecting offset projects) and would have primary responsibility for overseeing farmer enrollment, program management, and labor oversight. Though we have used a reasonable FTE salary figure for this position, an implementing organization should use its own labor expense averages to determine a reasonable salary amount.
• Farmer enrollment: The program office would be responsible for responding to
interested farmers and enrolling farmers who meet the eligibility criteria. We estimate that each enrollment would require 10 hours of labor, given the need to calculate emission reduction potential of each farm, document each farmer’s past fertilizer use, and meet other applicable program requirements.
• Remote auditing: To reduce auditing costs, some audits should be performed remotely using documentation requested from a randomly selected subset of enrolled farmers. Audits will improve program compliance by helping to convince farmers that they must comply with the program requirements in order to receive payments. Though on-site audits would be more effective at ensuring farmer compliance than remote audits, using remote audits enables a much greater number of total audits completed because they can be accomplished at significantly less expense. Those farmers selected for audits would have to provide specified documentation beyond the normal streamlined documentation standards required for all farmers. Each remote audit is estimated at 10 hours of in-house labor.
• Annual reenrollment verification: For all enrolled farmers, the program office should
perform a basic reenrollment review of its documentation every year that the program is in operation to ensure ongoing compliance with basic program requirements. We estimate that each reenrollment will take 2 hours of in-house labor.
Team III: Potent greenhouse gas reduction project Implementation plan for agricultural nitrogen fertilizer reduction offset project
14
For the initial financial estimates, we have used 125 percent of the Massachusetts minimum wage as a basic assumption for the fully loaded cost of one hour of student labor. However, we do recommend that the unregulated entity outsource two key functions to ensure effectiveness and value for money:
• On-site verification: The unregulated entity should hire an outside contractor to perform a specified number of on-site verifications each year to ensure farmer compliance. The findings of the on-site auditor should inform the project’s assumptions for the rate at which reported emission reductions are actually realized. Such assumptions should be modified over time as the project learns more about how offsets are realized. The on-site verification, of course, should also inform possible farmer termination. We assume $4,000 per on-site audit, though this figure is not a significant driver of total project costs.
• Marketing to farmers: The unregulated entity should also hire an outside contractor to
market the project to potential farmer-enrollees. Though the organization may have such a capability internally, it likely makes more sense to take advantage of a marketing consultancy that specializes in nonprofit organizations and/or sustainability initiatives. We estimate a budget of $100 per target enrollee in a given year, though this figure is also not a significant driver of project costs. This total budget should be determined upfront and should be a primary driver of requests for proposals from potential consultancies. Note, however, that if the program office is hosted at a land grant university, this marketing expense could also be redirected to start a larger, more skills-based program within the program office that would have the capabilities necessary to do this marketing function in house.
Finally, we also recommend that a lump sum be made available to the program to cover other miscellaneous expenses where the expected return on such expenses is sufficient to make them worthwhile. Financing
Because previous attempts to create nitrogen fertilizer offsets have struggled with the high cost of enrolling farmers, building baseline information on their crop and fertilizer history, and calculating the amount of emissions that can be eliminated by reducing their fertilizer use, an unregulated entity implementing this offset project needs to invest in building an organization with low labor costs, a flexible hiring arrangement, and the capacity to ensure effective program management. This program office will be responsible for enrolling farmers, reviewing submitting documents, analyzing submitted information to calculate offsets generated, and reporting to the unregulated entity the number of offsets that can be legitimately claimed. These tasks will require a mix of skilled and unskilled labor, including some supervisory and management skills and some subject-area knowledge in the agricultural science involved.

Team III: Potent greenhouse gas reduction project Implementation plan for agricultural nitrogen fertilizer reduction offset project
15
This necessity makes this project a particularly good fit for an educational institution, which can make use of existing student employment programs and federal work-study funding24 to defray both the direct (i.e. the labor itself) and the indirect (i.e. hiring and other human resources) cost of monitoring. To further incentivize student employment without incurring additional salary expenses, an educational institution could also offer academic credit while also compensating with work-study funds,25 perhaps as part of an ongoing course on agriculture or climate science. In either case, the offset program is then a part not only of the school’s climate goals but also its educational mission. Taking advantage of student employment has the additional benefit of enabling easy scalability. Adding more student-employees is significantly easier than hiring on the public job market, and should the program’s labor needs decrease once it reaches full farmer enrollment, reductions in student employment can take advantage of the high natural attrition resulting from students’ graduation and changing schedules. Because such a student employment program will drive multiple positive outcomes — including but not limited to emission reduction, education, public health co-benefits, farmer engagement, and student financial support — the school administering the offset program could also build a coalition of other unregulated for-profit organizations that desire emission offsets but do not themselves have access to relatively inexpensive student labor or the expertise (e.g. scientific) needed to create such a program. Though the program office would be housed at an educational institution, a share of the offset credits — even though not verified by an outside organization — could be “sold” to the outside organization in exchange for direct support of a specified portion of ongoing operations costs. The outside organization would also be responsible for significant additional benefits to the educational institution and its students. Depending on the school’s location, the nature of the economy in its surrounding area, and the location of the farmers, a business with geographic ties to one of those areas might be particularly interested in becoming the flagship sponsor of the program. As discussed above, the program office could also be located at a land grant university that has an existing agricultural sciences program and is located closer to the target farms. Particularly if that route is pursued, the program office could also include a scientific component that would continue refining the existing protocol to develop more precision in offset calculation while minimizing the risk of fraud by enabling more frequent, more through audits. For example, a graduate student could be hired — potentially even using pre-existing funding — to apply the latest soil science in the creation of a new fertilizer offset protocol that produced more offsets while requiring less administrative overhead. This would also explicitly link the project’s educational goals with its need to reduce project costs. Guarantees
The unregulated entity should also consider offering farmers a yield guarantee, so that if reduced fertilizer use results in a decline in the farmer’s crop yield, the farmer would receive a payout from the unregulated entity. However, given the relatively light touch of the auditing process required to make the project cost-effective, it will be very difficult to verify the authenticity of such payout claims. In the best of cases, proving causality — i.e., that it was truly because of the
24 See generally 34 C.F.R. §§ 673, 675. 25 34 C.F.R. § 675.20.

Team III: Potent greenhouse gas reduction project Implementation plan for agricultural nitrogen fertilizer reduction offset project
16
reduced fertilization that yield fell — will be nearly impossible, given the myriad other factors that impact crops. As a result, estimating the potential expense to the unregulated entity of a crop yield guarantee for farmers would require a significant amount of data and modeling. Though we did not have sufficient data to include such modeling in this proposal, such collection and analysis could be made possible by the project’s verification and auditing procedures, creating the potential to add a farmer guarantee as the program develops further. A guarantee, in turn, could then improve the program’s ability to attract farmers. Similarly, farmers’ participation should also be contingent on their compliance with program terms, including fertilizer use reduction commitments and accurate reporting of required data. Farmers who do not comply with their commitments to the program should not receive their compensation payments and should be considered for termination from the program. Contracting
The primary contracting involved with the project will be between the unregulated entity and the farmer-enrollees. Contracts will need to specify the data required to achieve payout, including documentation of their ownership of the land in question and records of their prior use of the land for at least five years. The contracts will also need to specify payout amounts and timetable, ideally on at least a one-year delay (e.g. the first payment would be made about a year after the farmer enrolled and then only after submission of any documentation required up to that point). No payment should be made until the offsets are guaranteed to the extent required by the program. The farmer contract should last for at least five years to minimize enrollment costs, though it should also include terms allowing the farmer to leave if they report that, in their determination, the project is not economically effective for the farmer, including, but not limited to, because compliance with project documentation requirements is too burdensome, because of the impact on crop yield, or because of the effects of other project requirements (e.g. fertilizing at the lower amount is impractical for some other unforeseen reasons). Though such a term will allow farmers to leave the program relatively easily, the program lacks any effective mechanism to retain unwilling farmers in the program, given its light-touch approach to administration. As a result, the program should simply let farmers leave, so long as they report their motivation. Such a policy also minimizes bad publicity for the program from farmers upset about being stuck in what they view as a money-losing program. Other program employees, including the half-time FTE and the verification student-employees, should be at-will employees that are not under contract. The two organizations under contract, the marketing firm and the contractor for on-site audits, should use basic contractor agreements. The unregulated entity should not assume liability for those organizations’ actions. In particular, the contract should assign to the auditing organization liability for its employees’ actions during actions, including for any injuries that results to the auditor’s employees, farm employees, or others.

Team III: Potent greenhouse gas reduction project Implementation plan for agricultural nitrogen fertilizer reduction offset project
17
Figure 7: Contracting, employment, payment, and management arrangements
Co-benefits
Beyond the direct emission reductions of an offset project based on reducing nitrogen fertilizer use, significant co-benefits could make this project more attractive to unregulated entities interested in pursuing social goals in parallel with environmental ones. In particular, the project could significantly reduce water pollution from nitrogen runoff into watersheds, a significant environmental concern, resulting in social benefits of nearly $11 million. The following analysis of co-benefits and co-costs draws upon methods from conducting a health impact assessment (HIA), defined as “a means of assessing the health impacts of policies, plans and projects in diverse economic sectors using quantitative, qualitative and participatory techniques” by the World Health Organization (WHO).26 The HIA method involves six steps: screening, scoping, assessment, monitoring, recommendations, reporting, and monitoring and evaluation. Given the limitations of a semester-long project, only a preliminary assessment has been conducted, but a HIA may be recommended as this project progresses. A broader view was taken to include not only health impacts, but also potential social, economic, and educational impacts. Due to time constraints, the initial analysis identified plausible causal pathways to qualitatively describe potential co-benefits and co-costs associated with this project. Water Contamination The impacts of reduced water pollution are among the most important co-benefits that this project can offer. Minimizing contaminated irrigation runoff is important to protect against eutrophication of surface water,27 which disrupts aquatic life and broader ecosystem services. Nitrates are the end product of nitrogen-based fertilizers in groundwater, and can cause 26 World Health Organization (WHO). Health Impact Assessment (HIA), available at http://www.who.int/hia/en/ 27 Food and Agriculture Organization (FAO). Chapter 3: Fertilizers as water pollutants, Control of water pollution from agriculture, available at http://www.fao.org/docrep/w2598e/w2598e06.htm.

Team III: Potent greenhouse gas reduction project Implementation plan for agricultural nitrogen fertilizer reduction offset project
18
potentially fatal infant methemoglobinemia (also known as “blue baby syndrome”), reproductive disruptions (e.g. neural tube defects), diabetes, thyroid conditions, and cancers when high concentrations are consumed in drinking water.28,29,30 In a sample of wells surveyed by the U.S. Geological Survey from 1993 to 2000, 2 percent of public-supply and 9 percent of domestic wells in rural areas had nitrate concentrations above EPA’s maximum allowable level of 10 mg/L.31 Fertilizer reduction has been found to reduce nitrate leaching into soil and subsequently into groundwater in the California agriculture system,32 and could lead to lower concentrations of nitrates in irrigation run-off. Research suggests that nitrogen levels can build up in soils during dry years and be flushed out in larger than normal amounts in succeeding wet years, entering streams through agricultural drains, ground water discharge, and direct run-off.33 An integrative approach to reducing fertilizer application can also reduce water use, reducing the total amount of contaminated water produced.34 The impacts of reducing nitrogen in soil and water are far ranging. One study estimates that 8 percent of nitrogen applied in the U.S. corn belt reaches the Gulf of Mexico via the Mississippi River, where it has generated a “dead zone” of around 13,650 square kilometers and negatively impacted wildlife as well as commercial and recreational fisheries that generate $2.8 billion annually.35 The nitrogen discharged from streams draining Iowa and Illinois is estimated to account for roughly 35 percent of the nitrogen discharged to the Gulf of Mexico.36 Agriculture also accounts for around 50 percent of phosphate loadings into the Gulf of Mexico and into Chesapeake Bay.37 Beyond marine pollution, agriculture is estimated to account for around 60 percent of river pollution, 30 percent of lake pollution and 15 percent of estuarine pollution in terms of sediment loadings, bacterial contamination and chemical run-off, resulting in significantly environmental impacts and harm to human and animal health.38 Nitrogen pollution from agriculture has been found to cost Americans $157 billion per year in damages to human health and the environment, more than twice the $76.7 billion total value of corn produced for grain in the U.S. in 2011, when corn prices were relatively high.39 While this externality is almost never incorporated into the price of corn, the Des Moines Water Works utility sued three drainage districts in Iowa in 2015 because farm-related nitrogen pollution caused it to spend nearly $1 million to treat water.40 Nationally, freshwater eutrophication is
28 National Research Council, Nitrate and nitrite in drinking water, National Academy Press (1995). 29 Ward, M., Too Much of a Good Thing? Nitrate from Nitrogen Fertilizers and Cancer, Reviews on Environmental Health (2008). 30 Ward et al, Drinking-water nitrate and health--recent findings and research needs, Environmental Health Perspective, (2005). 31 EPA, National Primary Drinking Water Regulations, available at https://www.epa.gov/ground-water-and-drinking-water/national-primary-drinking-water-regulations 32 Yates et al, Using less fertilizer more often can reduce nitrate leaching, California Agriculture, University of California Agriculture and Natural Resources (1992). 33 Hocking, P. J., P. J. Randall, and D. DeMarco. The response of dryland canola to nitrogen fertilizer: partitioning and mobilization of dry matter and nitrogen, and nitrogen effects on yield components. Field Crops Research54.2 (1997): pp. 201-220 34 Evans, R. G., & Sadler, E. J., Methods and technologies to improve efficiency of water use. Water resources research, 44(7) (2008). 35 Good, A. and Peatty, B., Fertilizing Nature: A Tragedy of Excess in the Commons, PLOS Biology (2011). 36 Goolsby et al, Nitrogen input to the Gulf of Mexico. Journal of Environmental Quality, 30(2) (2001): pp. 329-336. 37 OECD, Agriculture and Water Quality: Monetary Costs and Benefits across OECD Countries (2012). 38 Id. 39 Sobota et al, Cost of reactive nitrogen release from human activities to the environment in the United States. Environmental Research Letters, 10(2), 025006 (2015). 40 Schechinger, A., Article in Ag Mag (2015).
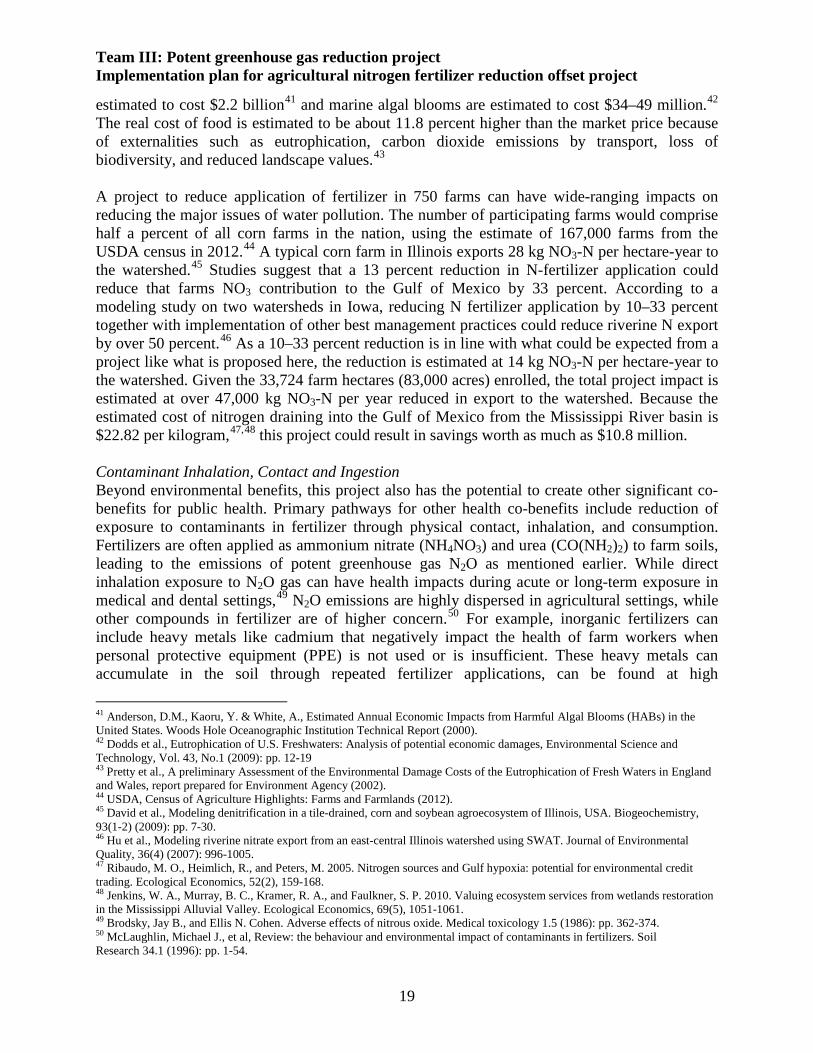
Team III: Potent greenhouse gas reduction project Implementation plan for agricultural nitrogen fertilizer reduction offset project
19
estimated to cost $2.2 billion41 and marine algal blooms are estimated to cost $34–49 million.42 The real cost of food is estimated to be about 11.8 percent higher than the market price because of externalities such as eutrophication, carbon dioxide emissions by transport, loss of biodiversity, and reduced landscape values.43 A project to reduce application of fertilizer in 750 farms can have wide-ranging impacts on reducing the major issues of water pollution. The number of participating farms would comprise half a percent of all corn farms in the nation, using the estimate of 167,000 farms from the USDA census in 2012.44 A typical corn farm in Illinois exports 28 kg NO3-N per hectare-year to the watershed.45 Studies suggest that a 13 percent reduction in N-fertilizer application could reduce that farms NO3 contribution to the Gulf of Mexico by 33 percent. According to a modeling study on two watersheds in Iowa, reducing N fertilizer application by 10–33 percent together with implementation of other best management practices could reduce riverine N export by over 50 percent.46 As a 10–33 percent reduction is in line with what could be expected from a project like what is proposed here, the reduction is estimated at 14 kg NO3-N per hectare-year to the watershed. Given the 33,724 farm hectares (83,000 acres) enrolled, the total project impact is estimated at over 47,000 kg NO3-N per year reduced in export to the watershed. Because the estimated cost of nitrogen draining into the Gulf of Mexico from the Mississippi River basin is $22.82 per kilogram,47,48 this project could result in savings worth as much as $10.8 million. Contaminant Inhalation, Contact and Ingestion Beyond environmental benefits, this project also has the potential to create other significant co-benefits for public health. Primary pathways for other health co-benefits include reduction of exposure to contaminants in fertilizer through physical contact, inhalation, and consumption. Fertilizers are often applied as ammonium nitrate (NH4NO3) and urea (CO(NH2)2) to farm soils, leading to the emissions of potent greenhouse gas N2O as mentioned earlier. While direct inhalation exposure to N2O gas can have health impacts during acute or long-term exposure in medical and dental settings,49 N2O emissions are highly dispersed in agricultural settings, while other compounds in fertilizer are of higher concern.50 For example, inorganic fertilizers can include heavy metals like cadmium that negatively impact the health of farm workers when personal protective equipment (PPE) is not used or is insufficient. These heavy metals can accumulate in the soil through repeated fertilizer applications, can be found at high
41 Anderson, D.M., Kaoru, Y. & White, A., Estimated Annual Economic Impacts from Harmful Algal Blooms (HABs) in the United States. Woods Hole Oceanographic Institution Technical Report (2000). 42 Dodds et al., Eutrophication of U.S. Freshwaters: Analysis of potential economic damages, Environmental Science and Technology, Vol. 43, No.1 (2009): pp. 12-19 43 Pretty et al., A preliminary Assessment of the Environmental Damage Costs of the Eutrophication of Fresh Waters in England and Wales, report prepared for Environment Agency (2002). 44 USDA, Census of Agriculture Highlights: Farms and Farmlands (2012). 45 David et al., Modeling denitrification in a tile-drained, corn and soybean agroecosystem of Illinois, USA. Biogeochemistry, 93(1-2) (2009): pp. 7-30. 46 Hu et al., Modeling riverine nitrate export from an east-central Illinois watershed using SWAT. Journal of Environmental Quality, 36(4) (2007): 996-1005. 47 Ribaudo, M. O., Heimlich, R., and Peters, M. 2005. Nitrogen sources and Gulf hypoxia: potential for environmental credit trading. Ecological Economics, 52(2), 159-168. 48 Jenkins, W. A., Murray, B. C., Kramer, R. A., and Faulkner, S. P. 2010. Valuing ecosystem services from wetlands restoration in the Mississippi Alluvial Valley. Ecological Economics, 69(5), 1051-1061. 49 Brodsky, Jay B., and Ellis N. Cohen. Adverse effects of nitrous oxide. Medical toxicology 1.5 (1986): pp. 362-374. 50 McLaughlin, Michael J., et al, Review: the behaviour and environmental impact of contaminants in fertilizers. Soil Research 34.1 (1996): pp. 1-54.

Team III: Potent greenhouse gas reduction project Implementation plan for agricultural nitrogen fertilizer reduction offset project
20
concentrations, and are often significant for particulate exposures.51 Occupational exposure among farmers has been linked to chronic respiratory conditions, cancers,52 and other serious health conditions.
Figure 8: Potential causal pathways by category
Contaminated particles can also be tracked into the homes of farmers through particles on their person, clothing and shoes, putting family members at risk. Some of the most vulnerable family members include infants or young children who crawl and play on the floor, and could accidentally consume contaminated particles through pica behavior, according to the Centers for Disease Control and Prevention (CDC).53 Traces of fertilizers may also be present on the food produced and reach consumers via touch or ingestion of unwashed food. In dry climates or during dry seasons, contaminated soil particles can become airborne to reach surrounding communities, and this issue with particulate matter exposure may be exacerbated by drought or climate change.54 Mechanisms have been found for transmission of pathogens through the windborne spread of farm dust, suggesting that longer-lasting chemical contaminants from fertilizer could be similarly spread.55
51 EPA, Agriculture: Nutrient Management and Fertilizer, available at https://www.epa.gov/agriculture/agriculture-nutrient-management-and-fertilizer 52 National Cancer Institute. Agricultural Health Study Fact Sheet (2011). 53 Centers for Disease Control and Prevention (CDC). Pica Behavior and Contaminated Soil, available at https://www.cdc.gov/healthcommunication/toolstemplates/entertainmented/tips/pica.html 54 Dias, Daniela, et al, Particulate matter and health risk under a changing climate: assessment for Portugal. The Scientific World Journal 2012 (2012). 55 Ssematimba et al, Modelling the Wind-Borne Spread of Highly Pathogenic Avian Influenza Virus between Farms, PLOS One (2012).
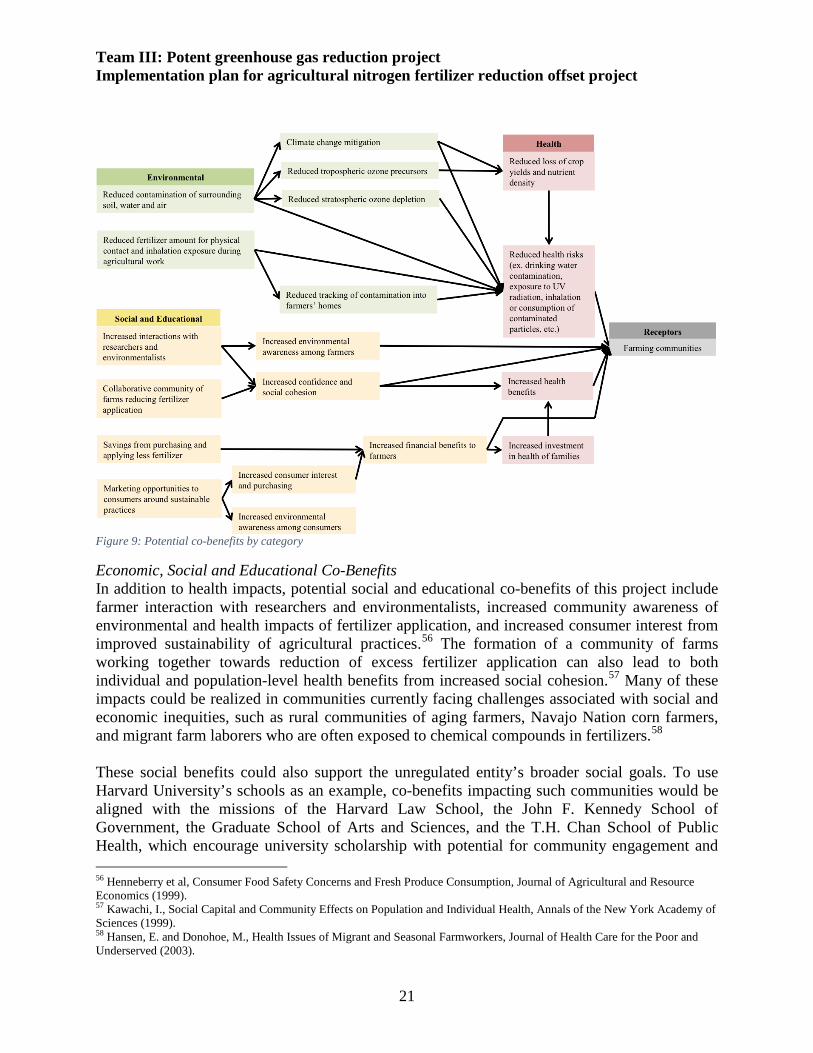
Team III: Potent greenhouse gas reduction project Implementation plan for agricultural nitrogen fertilizer reduction offset project
21
Figure 9: Potential co-benefits by category
Economic, Social and Educational Co-Benefits In addition to health impacts, potential social and educational co-benefits of this project include farmer interaction with researchers and environmentalists, increased community awareness of environmental and health impacts of fertilizer application, and increased consumer interest from improved sustainability of agricultural practices.56 The formation of a community of farms working together towards reduction of excess fertilizer application can also lead to both individual and population-level health benefits from increased social cohesion.57 Many of these impacts could be realized in communities currently facing challenges associated with social and economic inequities, such as rural communities of aging farmers, Navajo Nation corn farmers, and migrant farm laborers who are often exposed to chemical compounds in fertilizers.58 These social benefits could also support the unregulated entity’s broader social goals. To use Harvard University’s schools as an example, co-benefits impacting such communities would be aligned with the missions of the Harvard Law School, the John F. Kennedy School of Government, the Graduate School of Arts and Sciences, and the T.H. Chan School of Public Health, which encourage university scholarship with potential for community engagement and 56 Henneberry et al, Consumer Food Safety Concerns and Fresh Produce Consumption, Journal of Agricultural and Resource Economics (1999). 57 Kawachi, I., Social Capital and Community Effects on Population and Individual Health, Annals of the New York Academy of Sciences (1999). 58 Hansen, E. and Donohoe, M., Health Issues of Migrant and Seasonal Farmworkers, Journal of Health Care for the Poor and Underserved (2003).
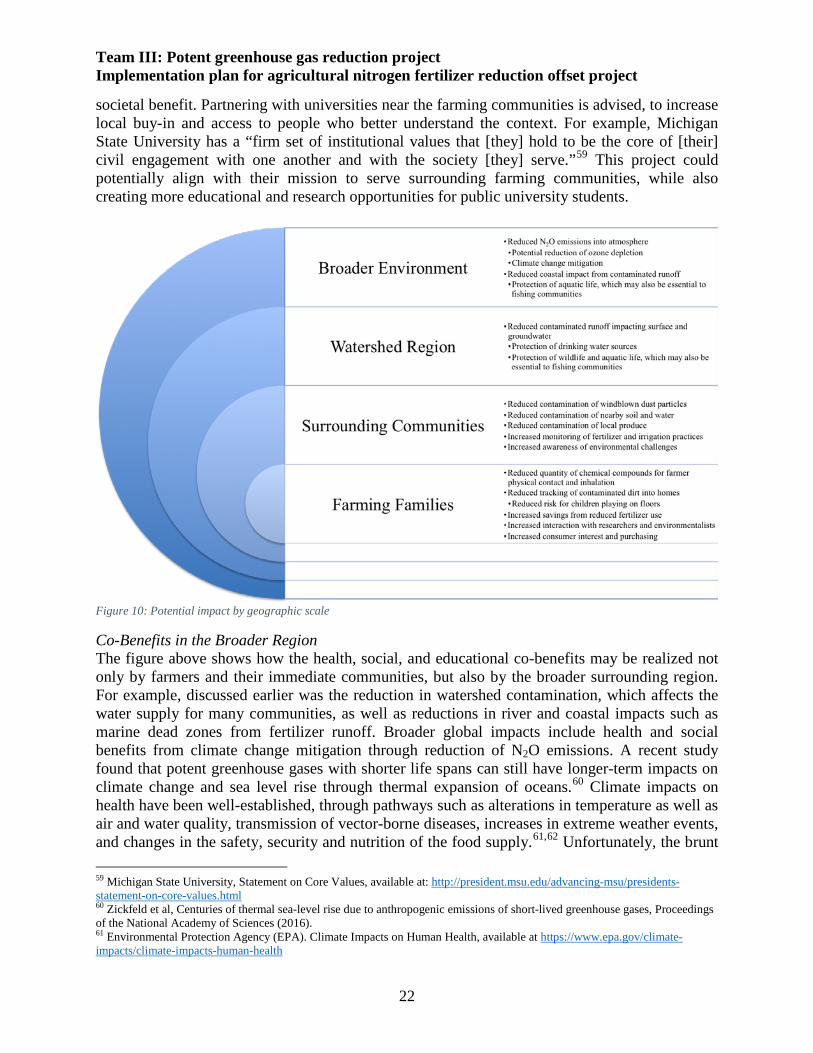
Team III: Potent greenhouse gas reduction project Implementation plan for agricultural nitrogen fertilizer reduction offset project
22
societal benefit. Partnering with universities near the farming communities is advised, to increase local buy-in and access to people who better understand the context. For example, Michigan State University has a “firm set of institutional values that [they] hold to be the core of [their] civil engagement with one another and with the society [they] serve.”59 This project could potentially align with their mission to serve surrounding farming communities, while also creating more educational and research opportunities for public university students.
Figure 10: Potential impact by geographic scale
Co-Benefits in the Broader Region The figure above shows how the health, social, and educational co-benefits may be realized not only by farmers and their immediate communities, but also by the broader surrounding region. For example, discussed earlier was the reduction in watershed contamination, which affects the water supply for many communities, as well as reductions in river and coastal impacts such as marine dead zones from fertilizer runoff. Broader global impacts include health and social benefits from climate change mitigation through reduction of N2O emissions. A recent study found that potent greenhouse gases with shorter life spans can still have longer-term impacts on climate change and sea level rise through thermal expansion of oceans.60 Climate impacts on health have been well-established, through pathways such as alterations in temperature as well as air and water quality, transmission of vector-borne diseases, increases in extreme weather events, and changes in the safety, security and nutrition of the food supply.61,62 Unfortunately, the brunt 59 Michigan State University, Statement on Core Values, available at: http://president.msu.edu/advancing-msu/presidents-statement-on-core-values.html 60 Zickfeld et al, Centuries of thermal sea-level rise due to anthropogenic emissions of short-lived greenhouse gases, Proceedings of the National Academy of Sciences (2016). 61 Environmental Protection Agency (EPA). Climate Impacts on Human Health, available at https://www.epa.gov/climate-impacts/climate-impacts-human-health

Team III: Potent greenhouse gas reduction project Implementation plan for agricultural nitrogen fertilizer reduction offset project
23
of the burden often falls on vulnerable communities with fewer resources for adaption and a higher likelihood of exposure to risks. Another major concern with nitrous oxide emissions is the depletion of protective stratospheric ozone, as research shows that N2O has become the dominant ozone-depleting substance and is expected to remain so throughout this century, increasing health risks such as skin cancers that are associated with exposure to harmful ultraviolet rays from the sun.63 Reduction of agricultural sources of nitrous oxide can contribute to mitigating some of these negative impacts. Co-Costs The project’s co-costs are not expected to be significant. Given the nature of focusing on reduction of excess fertilizer application beyond the AONR that crops can absorb, a major co-cost of concern would be accidentally decreasing crop yields by overcompensating reduction of fertilizer. With proper reduction levels, however, crop yields would ideally not be affected. Farmer engagement
An important next step is to develop strategies for farmer engagement, given the number of farms to recruit for participation. There is an opportunity to leverage existing associations of farms and farm workers, such as:
• the National Corn Growers Association (NCGA) and regional branches, • the National Young Farmers’ Coalition (NYFC) and Greenhorns, which promotes,
recruits and supports new farmers • and Farm Hack, a community for agricultural innovation.
One of the most important considerations for farmer engagement is how to be respectful, avoiding any judgment for current fertilizer applications in a sincere attempt to understand what barriers and benefits to fertilizer reduction matter farmers. In the absence of being able to talk with many farmers in Michigan before this course ends, we propose hiring people from farming communities and associations to develop the messaging to communicate with and recruit farms to participate. The unregulated entity can consider offering incentives for participating farmers to spread the word about this project to other farmers, and as mentioned earlier, the proposed guarantees may help address farmers’ concerns about risks associated with reducing fertilizer use. Local representatives and organizations can play a leading role in the development of the plan to engage interested farmers, and potentially explore the possibility of creating a collaborative community of farmers who can support on-going participation and continue conducting outreach to more farms. For inspiration, it may be interesting to learn from the New England Farmers Union (NEFU) about the grant they received to work with Winrock International in setting-up a “Buy Local” carbon credit program.64
62 Myers et al, Increasing CO2 threatens human nutrition, Nature (2014). 63 Ravishankara et al, Nitrous Oxide (N2O): The Dominant Ozone-Depleting Substance Emitted in the 21st Century, Science (2009). 64 New England Farmers Union (NEFU). NEFU Education Foundation (EF) Programs, available at http://www.newenglandfarmersunion.org/education/nefuef-programs/

Team III: Potent greenhouse gas reduction project Implementation plan for agricultural nitrogen fertilizer reduction offset project
24
Areas for additional research and development
An unregulated entity implementing this offset program should continue to refine the specifics of the program to ensure continuous improvement of both its science and its economics. In particular, the program office should develop a method to track farmer data so that the offset calculation model and financial models can be refined in tandem. For example, if it turns out to be easier than expected to enroll a significant number of large farms with high fertilizer reduction potential and thus a relatively large number of offsets per acre, the program office should place greater emphasis on targeting that kind of farm. In such a case, the program could likely also offer those farmers a higher payment per acre, given that the total number of acres that would need to be enrolled in the program to meet the total offset goal would be lower. Similarly, if it turns out to be more difficult than expected to enroll enough farmers or to meet the total number of offsets, the financial model should be revisited to ensure that the program remains within budget. Finally, regardless of program performance, it will be critical to ensure that the program continues to monitor the latest scientific data on nitrous oxide emissions from fertilizer to ensure the model’s ongoing accuracy. Unrelated to the science of the offsets, the program office should also focus on building and refining its understanding of farmers’ view of the program to investigate whether farmer payments are at a level sufficient to make the program sustainable from farmers’ perspective. The data gathered for this effort should also serve as the foundation for further analysis of whether it could be financially prudent to offer farmers a crop yield guarantee. This decision will need to be informed by initial experience with yield declines among farmers, including an assessment of whether those declines were in fact caused by the changes in the farmers’ fertilizer use, rather than by, for example, weather patterns. The program should also continue to build the credibility of its offset verification protocol to bolster its credibility and make the program more appealing to a wider range of unregulated entities and other sponsors. As the agricultural science involved continues to develop, the program should capitalize on the most recent developments to demonstrate that it represents a significant, legitimate opportunity to reduce emissions from a sector that is essentially unaffected by other emissions reduction programs.
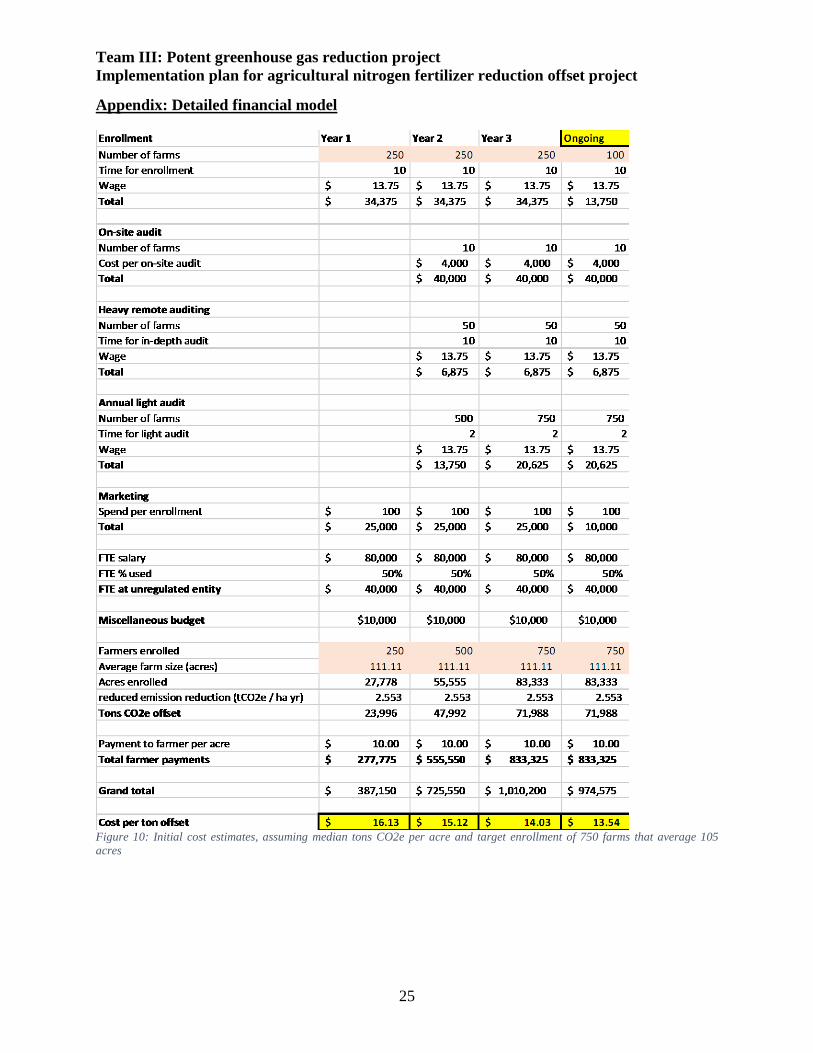
Team III: Potent greenhouse gas reduction project Implementation plan for agricultural nitrogen fertilizer reduction offset project
25
Appendix: Detailed financial model
Figure 10: Initial cost estimates, assuming median tons CO2e per acre and target enrollment of 750 farms that average 105 acres

Model 1 (high)Key inputs
Enrollment Year 1 Year 2 Year 3 OngoingNumber of farms 250 250 250 100Time for enrollment 10 10 10 10Wage 13.75$ 13.75$ 13.75$ 13.75$ Total 34,375$ 34,375$ 34,375$ 13,750$
On‐site auditNumber of farms 10 10 10Cost per on‐site audit 4,000$ 4,000$ 4,000$ Total 40,000$ 40,000$ 40,000$
Heavy remote auditingNumber of farms 50 50 50Time for in‐depth audit 10 10 10Wage 13.75$ 13.75$ 13.75$ Total 6,875$ 6,875$ 6,875$
Annual light auditNumber of farms 500 750 750Time for light audit 2 2 2Wage 13.75$ 13.75$ 13.75$ Total 13,750$ 20,625$ 20,625$
MarketingSpend per enrollment 100$ 100$ 100$ 100$ Total 25,000$ 25,000$ 25,000$ 10,000$
FTE salary 80,000$ 80,000$ 80,000$ 80,000$ FTE % used 50% 50% 50% 50%

FTE at unregulated entity 40,000$ 40,000$ 40,000$ 40,000$
Miscellaneous budget $10,000 $10,000 $10,000 $10,000
Farmers enrolled 250 500 750 750Average farm size 111.11 111.11 111.11 111.11Acres enrolled 27,778 55,555 83,333 83,333 Flux Model Parameters:baseline fertilzer usage ( kg N / ha yr) 200.000 200.000 200.000 200.000 a: GWP:baseline emissions factor ( kg N2O‐N / ha yr) 0.157 0.157 0.157 0.157 4.93 310baseline direct emissions (kg N2O / ha yr) 0.247 0.247 0.247 0.247baseline direct emissions (tCO2e / ha yr) 15.344 15.344 15.344 15.344 b: unc:baseline indirect emissions (tCO2e / ha yr) 0.084 0.084 0.084 0.084 0.01 0.164MRTN ( kg N / ha yr) 147.000 147.000 147.000 147.000project emissions factor (kg N2O‐N / ha yr) 0.112 0.112 0.112 0.112project direct emissions (kg N2O/ ha yr) 0.177 0.177 0.177 0.177project direct emissions (tCO2e / ha yr) 8.044 8.044 8.044 8.044project indirect emissions (tCO2e / ha yr) 0.072 0.072 0.072 0.072emission reduction (tCO2e / ha yr) 7.312 7.312 7.312 7.312reduced emission reduction (tCO2e / ha yr) 7.312 7.312 7.312 7.312Tons CO2e offset 68,721 137,443 206,164 206,164
Payment to farmer per acre 10.00$ 10.00$ 10.00$ 10.00$ Total farmer payments 277,775$ 555,550$ 833,325$ 833,325$
Grand total 387,150$ 725,550$ 1,010,200$ 974,575$
Cost per ton offset 5.63$ 5.28$ 4.90$ 4.73$

Model 2 (low)Key inputs
Enrollment Year 1 Year 2 Year 3 OngoingNumber of farms 250 250 250 100Time for enrollment 10 10 10 10Wage 13.75$ 13.75$ 13.75$ 13.75$ Total 34,375$ 34,375$ 34,375$ 13,750$
On‐site auditNumber of farms 10 10 10Cost per on‐site audit 4,000$ 4,000$ 4,000$ Total 40,000$ 40,000$ 40,000$
Heavy remote auditingNumber of farms 50 50 50Time for in‐depth audit 10 10 10Wage 13.75$ 13.75$ 13.75$ Total 6,875$ 6,875$ 6,875$
Annual light auditNumber of farms 500 750 750Time for light audit 2 2 2Wage 13.75$ 13.75$ 13.75$ Total 13,750$ 20,625$ 20,625$
MarketingSpend per enrollment 100$ 100$ 100$ 100$ Total 25,000$ 25,000$ 25,000$ 10,000$
FTE salary 80,000$ 80,000$ 80,000$ 80,000$ FTE % used 50% 50% 50% 50%

FTE at unregulated entity 40,000$ 40,000$ 40,000$ 40,000$
Miscellaneous budget $10,000 $10,000 $10,000 $10,000
Farmers enrolled 250 500 750 750Average farm size 111.11 111.11 111.11 111.11Acres enrolled 27,778 55,555 83,333 83,333 Flux Model Parameters:baseline fertilzer usage ( kg N / ha yr) 170.000 170.000 170.000 170.000 a: GWP:baseline emissions factor ( kg N2O‐N / ha yr) 0.005 0.005 0.005 0.005 0.316 310baseline direct emissions (kg N2O / ha yr) 0.008 0.008 0.008 0.008baseline direct emissions (tCO2e / ha yr) 0.446 0.446 0.446 0.446 b: unc:baseline indirect emissions (tCO2e / ha yr) 0.084 0.084 0.084 0.084 0.008 0.164MRTN ( kg N / ha yr) 147.000 147.000 147.000 147.000project emissions factor (kg N2O‐N / ha yr) 0.005 0.005 0.005 0.005project direct emissions (kg N2O/ ha yr) 0.008 0.008 0.008 0.008project direct emissions (tCO2e / ha yr) 0.345 0.345 0.345 0.345project indirect emissions (tCO2e / ha yr) 0.072 0.072 0.072 0.072emission reduction (tCO2e / ha yr) 0.113 0.113 0.113 0.113reduced emission reduction (tCO2e / ha yr) 0.113 0.113 0.113 0.113Tons CO2e offset 1,060 2,120 3,180 3,180
Payment to farmer per acre 10.00$ 10.00$ 10.00$ 10.00$ Total farmer payments 277,775$ 555,550$ 833,325$ 833,325$
Grand total 387,150$ 725,550$ 1,010,200$ 974,575$
Cost per ton offset 365.21$ 342.22$ 317.65$ 306.45$
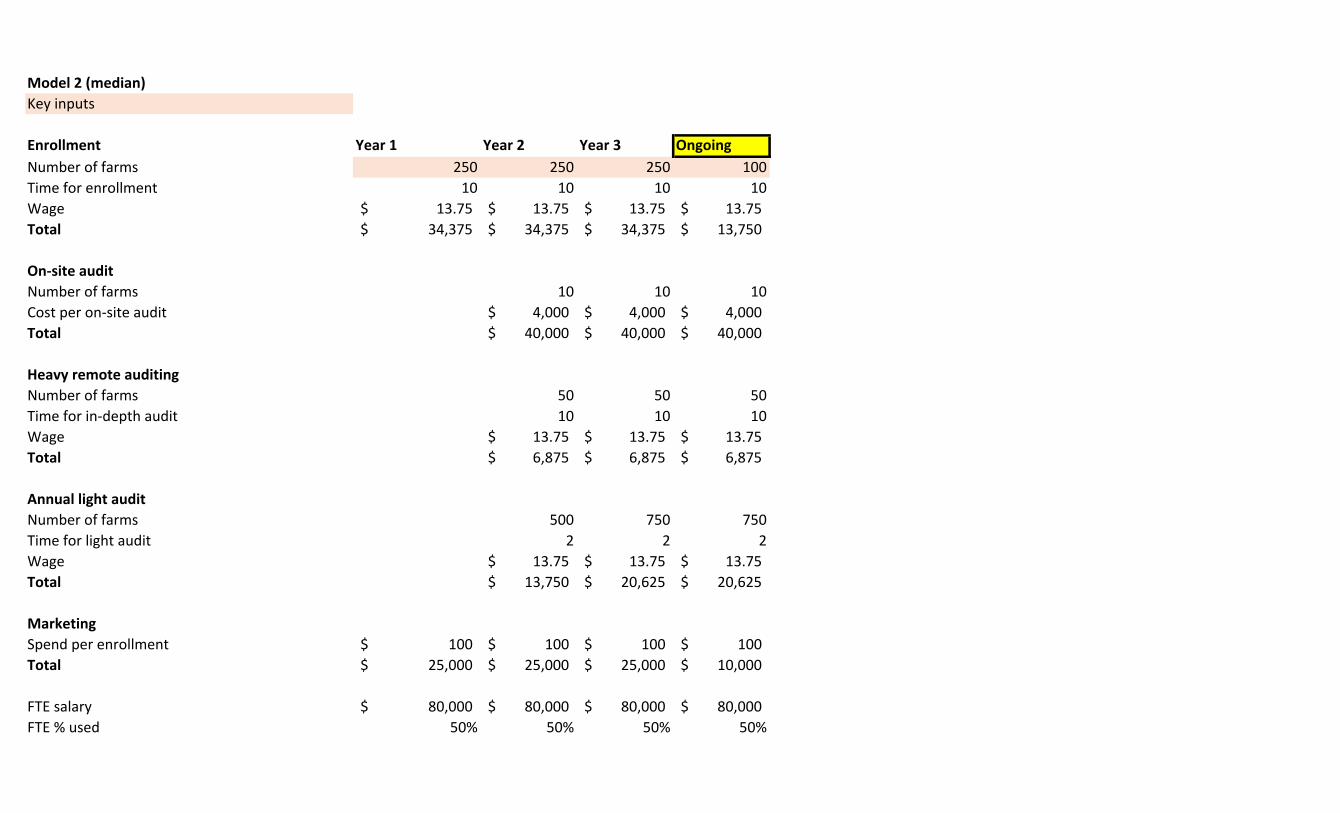
Model 2 (median)Key inputs
Enrollment Year 1 Year 2 Year 3 OngoingNumber of farms 250 250 250 100Time for enrollment 10 10 10 10Wage 13.75$ 13.75$ 13.75$ 13.75$ Total 34,375$ 34,375$ 34,375$ 13,750$
On‐site auditNumber of farms 10 10 10Cost per on‐site audit 4,000$ 4,000$ 4,000$ Total 40,000$ 40,000$ 40,000$
Heavy remote auditingNumber of farms 50 50 50Time for in‐depth audit 10 10 10Wage 13.75$ 13.75$ 13.75$ Total 6,875$ 6,875$ 6,875$
Annual light auditNumber of farms 500 750 750Time for light audit 2 2 2Wage 13.75$ 13.75$ 13.75$ Total 13,750$ 20,625$ 20,625$
MarketingSpend per enrollment 100$ 100$ 100$ 100$ Total 25,000$ 25,000$ 25,000$ 10,000$
FTE salary 80,000$ 80,000$ 80,000$ 80,000$ FTE % used 50% 50% 50% 50%

FTE at unregulated entity 40,000$ 40,000$ 40,000$ 40,000$
Miscellaneous budget $10,000 $10,000 $10,000 $10,000
Farmers enrolled 250 500 750 750Average farm size 111.11 111.11 111.11 111.11Acres enrolled 27,778 55,555 83,333 83,333 Model Parameters:baseline fertilzer usage ( kg N / ha yr) 185.000 185.000 185.000 185.000 a: GWP:baseline emissions factor ( kg N2O‐N / ha yr) 0.086 0.086 0.086 0.086 5.58 310baseline direct emissions (kg N2O / ha yr) 0.136 0.136 0.136 0.136baseline direct emissions (tCO2e / ha yr) 7.772 7.772 7.772 7.772 b: unc:baseline indirect emissions (tCO2e / ha yr) 0.084 0.084 0.084 0.084 0.0073 0.164MRTN ( kg N / ha yr) 147.000 147.000 147.000 147.000project emissions factor (kg N2O‐N / ha yr) 0.073 0.073 0.073 0.073project direct emissions (kg N2O/ ha yr) 0.115 0.115 0.115 0.115project direct emissions (tCO2e / ha yr) 5.231 5.231 5.231 5.231project indirect emissions (tCO2e / ha yr) 0.072 0.072 0.072 0.072emission reduction (tCO2e / ha yr) 2.553 2.553 2.553 2.553reduced emission reduction (tCO2e / ha yr) 2.553 2.553 2.553 2.553Tons CO2e offset 23,996 47,992 71,988 71,988
10.00$ 10.00$ 10.00$ 10.00$ Payment to farmer per acre 277,775$ 555,550$ 833,325$ 833,325$ Total farmer payments
387,150$ 725,550$ 1,010,200$ 974,575$ Grand total
16.13$ 15.12$ 14.03$ 13.54$ Cost per ton offset

Delta StudyFarmers enrolled 1.000Average farm size (ac) 39.620Acres enrolled 39.620 Flux Model Parameters:
baseline fertilzer usage ( kg N / ha yr) 172.000 a: GWP:baseline emissions factor ( kg N2O‐N / ha yr) 0.008 0.670 310.000baseline direct emissions (kg N2O / ha yr) 0.013baseline direct emissions (tCO2e / ha yr) 0.707baseline indirect emissions (tCO2e / ha yr) 0.084
MRTN ( kg N / ha yr) 147.000 b: unc:project emissions factor (kg N2O‐N / ha yr) 0.008 0.007 0.164project direct emissions (kg N2O/ ha yr) 0.012project direct emissions (tCO2e / ha yr) 0.548project indirect emissions (tCO2e / ha yr) 0.072emission reduction (tCO2e / ha yr) 0.171reduced emission reduction (tCO2e / ha yr) 0.143Tons CO2e offset 2.297