Embed Size (px)
Citation preview
STUDY REPORT No.124 (2004)
SEISMIC RESPONSE OF BUILDING PARTS
AND NON-STRUCTURAL COMPONENTS
R. H. Shelton
The work reported here was jointly funded by Building Research Levy, and the Foundation for Research, Science and Technology from the Research for Industry Fund.
© BRANZ 2004
ISSN: 0113-3675

Preface This report was prepared to record research undertaken to provide input to the revision of the earthquake section of the draft Australian/New Zealand Loading Standard. Acknowledgements The contribution of the project team members are acknowledged, namely the external contractors Compusoft Engineering, (Darrin Bell and Barry Davidson) for the modal analysis and building design, from the Institute of Geological and Nuclear Sciences (Graeme McVerry) for the selection of ground motion records, and BRANZ staff, (Andrew King and Stuart Park). The invaluable advice and direction given by the Project Advisory Group of Rob Jury, Trevor Kelly, Geoff Sidwell and David Spurr is also acknowledged. A particular thank-you to Stuart Thurston of BRANZ, for writing the software that made it possible to interrogate and extract the very large quantity of data generated during the inelastic analyses. Note This report is intended for structural engineers, researchers, and standards committee members.
i
SEISMIC RESPONSE OF BUILDING PARTS REFERENCE BRANZ Study Report SR 124 R. H. Shelton ABSTRACT A suite of building structures in both high and low seismicity regions of New Zealand was designed in accordance with the provisions of the draft joint Loadings Standard (DR00902-4). Earthquake ground motion records were selected, scaled, and applied to the structures using an inelastic time history analysis program. The output of these analyses provided a means for developing floor acceleration profiles, and floor response spectra for buildings as they respond to earthquakes both within and beyond their elastic range. Using this information, force based provisions were developed which form the basis of recommendations submitted to Standards New Zealand for inclusion in Part 4 of the draft joint Australian/New Zealand Loadings Standard (AS/NZS 1170).
ii
Contents Page No.
1. INTRODUCTION................................................................................................................... 1
1.1 The context ..................................................................................................................... 1 1.2 Summary of current practice........................................................................................... 1
1.2.1 NZS 4203 ........................................................................................................... 1 1.2.2 Other standards................................................................................................... 2 1.2.3 Standards issues for the designer........................................................................ 2
1.3 Overview of approach taken in project........................................................................... 3
2. BUILDING DESIGNS............................................................................................................ 4
2.1 Suite of buildings ............................................................................................................ 4 2.2 Design development ....................................................................................................... 6
2.2.1 Preliminary design.............................................................................................. 6 2.2.2 Detailed design ................................................................................................... 7 2.2.3 Modal analyses ................................................................................................... 8
2.3 Building descriptions ...................................................................................................... 9 2.3.1 Reinforced concrete buildings............................................................................ 9 2.3.2 Steel buildings .................................................................................................. 10
2.4 Issues arising during design.......................................................................................... 11 2.4.1 Hazard spectra .................................................................................................. 11 2.4.2 Response spectra base shear scaling................................................................. 11 2.4.3 Structural performance factor........................................................................... 11 2.4.4 Inter-storey drift limits ..................................................................................... 11
3. GROUND MOTION RECORDS ........................................................................................ 11
3.1 Overview....................................................................................................................... 11 3.2 Target spectra................................................................................................................ 12 3.3 Record selection............................................................................................................ 14 3.4 Scaling of records ......................................................................................................... 16
4. TIME HISTORY ANALYSES ............................................................................................ 18
4.1 Overview....................................................................................................................... 18 4.2 Structural modelling ..................................................................................................... 19
4.2.1 General ............................................................................................................. 19 4.2.2 Material properties............................................................................................ 19 4.2.3 Modelling ......................................................................................................... 20 4.2.4 Damping ........................................................................................................... 22 4.2.5 Loads ................................................................................................................ 22
4.3 Data reduction process.................................................................................................. 22
5. DEVELOPMENT OF PROVISIONS FOR PARTS IN THE DRAFT STANDARD..... 24
5.1 Background................................................................................................................... 24 5.2 Site hazard .................................................................................................................... 27 5.3 Building response ......................................................................................................... 27 5.4 Part response................................................................................................................. 30 5.5 Risk factor/consequences of failure .............................................................................. 34
6. CONCLUSIONS ................................................................................................................... 36
7. REFERENCES...................................................................................................................... 38
iii
Figures Figure 1: Target spectra used during the project. .............................................................................. 14 Figure 2. Record scale factor............................................................................................................. 17 Figure 3. Typical family scale factor, k2. .......................................................................................... 18 Figure 4. Modelling of EBF links. .................................................................................................... 22 Figure 5. Translation of accelerations to building edges.................................................................. 23 Figure 6 Representative floor acceleration plots. ............................................................................ 28 Figure 7 Recorded floor accelerations............................................................................................. 29 Figure 8. Floor acceleration coefficient Cf as proposed. .................................................................. 30 Figure 9. Floor acceleration response spectra. ................................................................................. 31 Figure 10.Floor spectra with variable damping................................................................................. 32 Figure 11..Performance of parts in Northridge earthquake. .............................................................. 33 Figure 12. Plot of part coefficient, (Cp). ............................................................................................ 34 Figure 13 (a).Nisqually earthquake, (b). Kobe earthquake. ............................................................ 35 Tables Table 1: Suite of buildings ................................................................................................................ 5 Table 2: Schedule of reinforced concrete buildings ........................................................................... 9 Table 3: Schedule of steel buildings................................................................................................. 10 Table 4: Provisions from other standards......................................................................................... 25 Appendices Appendix 1: Building details............................................................................................................ 41 Appendix 2: Pushover plots ............................................................................................................. 44 Appendix 3: Inter-storey drifts ......................................................................................................... 60 Appendix 4: Deflection profiles ....................................................................................................... 66 Appendix 5: Floor acceleration plots ............................................................................................... 68 Appendix 6: Floor response spectra ................................................................................................. 75 Appendix 7: Submission on parts to Standards New Zealand.......................................................... 91
iv
Notation
Ag = cross sectional area of the gross concrete section (mm2)
As = cross sectional area of reinforcing steel (mm2)
C(0) = site hazard coefficient with period T = 0
Cf = floor acceleration coefficient
Cfi = floor coefficient at level i
Cfn = floor coefficient at the level of the uppermost principal seismic weight
Cf0 = floor coefficient at and below the base of the building
Ch(T) = spectral shape factor defined in the draft loading standard
Ch(T1,1) = spectral shape function, as defined in NZS 4203, clause 4.12
Ch(T1,µ) = spectral shape function, as defined in NZS 4203, clause 4.12
Ch(T1,µo) = spectral shape function, as defined in NZS 4203, clause 4.12
Ch(Tpe,µp) = spectral shape function, as defined in NZS 4203, clause 4.12
Cp = part response coefficient
Cph = basic horizontal coefficient for a part, as defined in NZS 4203
Cpi = basic horizontal coefficient for a part at level i
d = effective depth of reinforcing steel (tension steel) (mm)
d’ = effective depth of reinforcing steel (compression steel) (mm)
f’c = characteristic strength of concrete (MPa)
Fi = equivalent static lateral force at level i (kN)
Fn = equivalent static force at the level of the uppermost principal seismic weight
Fph = horizontal seismic force on a part, as defined by NZS 4203 (kN)
Ec = modulus of elasticity of concrete, (MPa)
Es = modulus of elasticity of steel, (MPa)
fy = yield strength of reinforcing steel (MPa)
G = dead load (kN, kPa)
hi = height of level i above the base of the structure (m)
hn = height of the level of the uppermost principal seismic weight (m)
Ie = effective moment of inertia (mm4)
Ig = moment of inertia of the gross concrete section (mm4)
k1 = scale factor for individual earthquake record
k2 = scale factor for family of records
L = length
L = limit state factor, as defined by NZS 4203
Lp = length of plastic hinge region (m)
Lw = length of wall (m)
v
Mn = nominal moment capacity (kNm)
Mo = overstrength moment capacity (kNm)
N(T,D) = near fault factor
Qu = reduced live load (kN, kPa)
R = return period factor (Rs for serviceability, and Ru for ultimate limit state)
R = risk factor, as defined by NZS 4203
r = Ramberg Osgood factor
Rp = risk factor for the part
Sp = structural performance factor, as defined by NZS 4203
T = period of vibration of the structure (sec)
T1 = first mode period of vibration of the structure (sec)
Tpe = equivalent period of vibration of the part (sec)
Wi = seismic weight at level i (kN)
Wn = seismic weight at height hn (kN)
Wp = seismic weight of the part (kN)
x&& = acceleration in x direction
Z = seismic zone factor
α = Rayleigh damping parameter
β = Rayleigh damping parameter
φ = strength reduction factor, as defined in NZS 3101
µ = structural ductility factor
µp = ductility factor for the part
λe = expected strength factor
λo = overstrength factor
ξ (T1) = damping at fundamental period, T1
ξ (Ti) = damping at any period, Ti
vi

1. INTRODUCTION
1.1 The context
The principal objective of this investigation was to formulate design provisions for the behaviour of building parts when subjected to earthquake attack.
Seismic design of building parts in New Zealand is currently covered by clause 4.12 of NZS 4203:1992 (SNZ, 1992). At the time of writing, this standard is being superseded in stages by a new joint Australian/New Zealand loading standard, and this process provided the impetus for a fresh look at the requirements for the seismic design of parts. A draft revision of the earthquake section (Part 4) of the joint standard was circulated for public comment in November 2000 (SA/SNZ, 2000). As a result of the copious comments received, the review committee identified 12 major areas where significant study was needed. One of those areas was building parts, and this project was formulated in response to that need. In this report, building parts are defined as: All those non-structural items supported by the building structure, that are required for its successful function as a habitable building. This may include claddings, exterior appendages, internal partitions and finishes, building services, and building contents. For consistency in this report an “element” is specifically a structural item or member (beam, column, wall) required for the integrity of the building as a whole. In other countries parts are referred to as “non-structural components, or systems or elements”, or “functional and operational components (FOC’s)”. However the word “parts” is well understood by New Zealand structural engineers and is a convenient simple term to use in this report.
1.2 Summary of current practice
A number of design standards provide means for estimating seismic actions on parts. The most significant in the New Zealand context is NZS 4203:1992 (SNZ, 1992).
1.2.1 NZS 4203
The horizontal seismic force acting on a part, Fph, is defined in clause 4.12 of NZS 4203 as: Fph = Cph Wp Rp, Eqn. 1
where Wp is the seismic weight of the part, and Rp is the risk factor for the part. The risk factor takes values depending on the consequences of failure of the part. A table of values for Rp is provided. The basic horizontal coefficient, Cph, is a function of the spectral shape function for the part, and the floor acceleration at the level being considered, and is given at any level i, by:
Cpi = Ch(Tpe,µp).Cfi/0.4. Eqn. 2
The spectral shape function, Ch(Tpe,µp), assumes that the spectral shape for the part is the same as that for an intermediate soil site, in spite of the differences in frequency content between the ground motion and an upper floor of the structure. The equivalent period of the part, Tpe, is used to account for the expectation of resonance effects when the period of the part is close to the fundamental period of the building. The floor acceleration coefficient, Cfi, is a function of the level of the part within the building.
1

At the base it is called Cf0, approximating the maximum ground acceleration multiplied by the structural performance factor, Sp, and is given by:
Cf0 = 0.25 R.Z.L, Eqn. 3
where R is the risk factor for the building, Z is the zone factor, and L the limit state factor. At the level of the uppermost seismic weight it is called Cfn, estimating the maximum acceleration divided by g, and is given by:
Cfn = n
n
h
oh
WF
),T(C),T(C
×µµ
1
1 , Eqn. 4
where Fn is the inertial force at the level of the uppermost seismic weight, and Wn is the seismic weight at that level, thus the second term in the equation is effectively the floor acceleration. At intermediate levels Cfi is given by:
when using the equivalent static design method
Cfi = )hh(C)
hh(C
),T(C),T(C
n
ifn
n
if
h
oh +⎥⎦
⎤⎢⎣
⎡−×
µ 11 0
1
1 ; Eqn.5
or using the modal response spectrum design method −
Cfi = i
i
h
oh
WF
),T(C),T(C
×µµ
1
1 . Eqn. 6
The expression, ),T(C),T(C
h
oh
µµ
1
1 in equations 4, 5 and 6, is intended to account for the increased
acceleration of the floor caused by the over-strength of the main structure, and is quantified by µo, the ductility factor that would apply to the building calculated with over-strength. Because it is not clear how this is to be determined, the default option of µ = 1.0 is commonly used, leading effectively to a multiplier of typically 3 whichever design method is used.
1.2.2 Other standards
Building standards from Canada (NBC 1995 and draft), USA (NEHRP 1997, ASCE 7-98, IBC 2000), and Europe (EC8), although superficially different, all have a consistency of approach that can be broken down into four basic components: • influence of ground motion (usually a function of location and soil type), • influence of the building (generally only the height of the part within the building), • effect of the component (factors dependent on the flexibility or toughness of the part), • risk/hazard of the part (generally considering the required performance level of the
building).
A summary of the provisions for parts contained in these standards is shown in the Section 5 of this report.
1.2.3 Standards issues for the designer
The NZS 4203 provisions are far more complex and onerous for the building designer than those in standards of other comparable countries. They also demand detailed information about the primary
2
building structure which is generally only available to (or understood by) the project structural engineer. As a result, suppliers of building products and systems in New Zealand rely on the guidance of the project structural engineer to provide seismic design information, and this is project or building specific. This has disadvantages for manufacturers and suppliers of products which are in common use internationally and originate outside New Zealand. This is especially true for standard items like building services equipment, whose design is much more process-oriented. The requirement for detailed information about the building structure may also be a problem in the refurbishment of existing buildings where such information may not be readily available. It is clearly desirable to have a more simple, standardised approach, and with a wider applicability than is the case at present. This is discussed in more detail in Section 5.
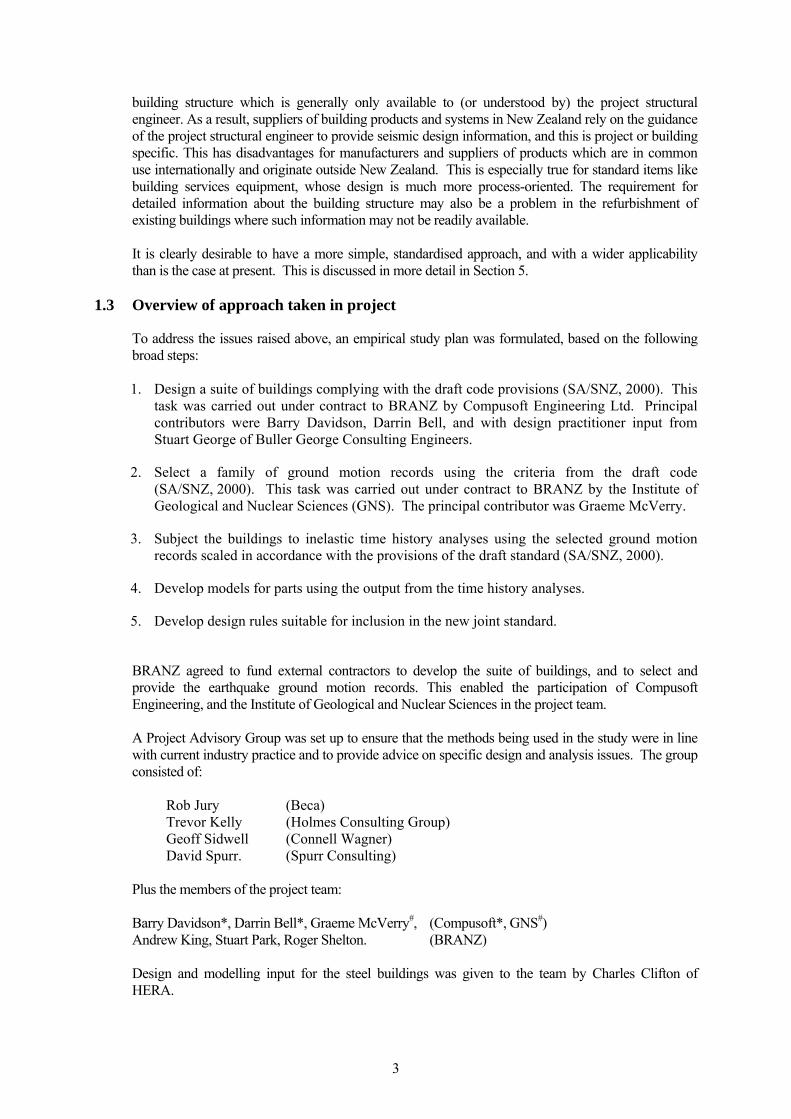
1.3 Overview of approach taken in project
To address the issues raised above, an empirical study plan was formulated, based on the following broad steps: 1. Design a suite of buildings complying with the draft code provisions (SA/SNZ, 2000). This
task was carried out under contract to BRANZ by Compusoft Engineering Ltd. Principal contributors were Barry Davidson, Darrin Bell, and with design practitioner input from Stuart George of Buller George Consulting Engineers.
2. Select a family of ground motion records using the criteria from the draft code (SA/SNZ, 2000). This task was carried out under contract to BRANZ by the Institute of Geological and Nuclear Sciences (GNS). The principal contributor was Graeme McVerry.
3. Subject the buildings to inelastic time history analyses using the selected ground motion records scaled in accordance with the provisions of the draft standard (SA/SNZ, 2000).
4. Develop models for parts using the output from the time history analyses.
5. Develop design rules suitable for inclusion in the new joint standard.
BRANZ agreed to fund external contractors to develop the suite of buildings, and to select and provide the earthquake ground motion records. This enabled the participation of Compusoft Engineering, and the Institute of Geological and Nuclear Sciences in the project team. A Project Advisory Group was set up to ensure that the methods being used in the study were in line with current industry practice and to provide advice on specific design and analysis issues. The group consisted of:
Rob Jury (Beca) Trevor Kelly (Holmes Consulting Group) Geoff Sidwell (Connell Wagner) David Spurr. (Spurr Consulting)
Plus the members of the project team:
Barry Davidson*, Darrin Bell*, Graeme McVerry#, (Compusoft*, GNS#) Andrew King, Stuart Park, Roger Shelton. (BRANZ)
Design and modelling input for the steel buildings was given to the team by Charles Clifton of HERA.
3

2. BUILDING DESIGNS
2.1 Suite of buildings
Because this was an empirical study, it was important to cover as wide a range of building designs as resources permitted. The critical design parameters were considered to be those which were likely to influence the behaviour of building parts, which is floor accelerations, and interstorey drifts. The designs of the buildings were required to comply with the draft joint earthquake loading standard (SA/SNZ, 2000), the appropriate materials standards (SNZ 3101), (SNZ 3404) and were to represent, as far as practicable, typical New Zealand design and construction practice. To cover a reasonable range of buildings of a type and size likely to contain the full complement of parts, three basic building heights were selected (3, 10 and 20 occupied floors) and two material types (steel and reinforced concrete). The steel buildings were to have moment resisting frames in one direction, and eccentrically braced frames (EBF) in the other. The reinforced concrete buildings were also to have moment resisting frames in one direction, and with shearwalls in the other. Floor heights were set at 4.50 m ground to first floor, and 3.65 m for all other floors, and each building had a roof structure 3.65 m above the upper floor. Wellington and Auckland were chosen as representative of localities at opposite extremes of seismicity in New Zealand where significant numbers of buildings would be expected. To obtain a range of soil types, the buildings were to be situated on sites conforming to Class C (shallow soil) and Class D (soft, or deep, soil). Recognising that although some building structures are regular in plan, irregular buildings are far more common, it was decided to introduce plan irregularity by altering the location of transverse lateral load resisting elements, within an otherwise constant building layout. Target ductility levels were set at µ = 3 (limited ductility) and µ = 6 (fully ductile), although this was not achieved in all the designs (see later comment). These parameters were given to the designers as the suite of building designs presented in Table 1. The building name shown in the first column of the table is that given for identification purposes and is used throughout this report.
4

Table 1: Suite of buildings
Name Structural material
Number of storeys
Plan regularity Location Soil class Ductility
RC3RWCL RC 3 R W C L RC3RWDL RC 3 R W D L RC3IWCL RC 3 I W C L RC3IWDL RC 3 I W D L RC10RWCL RC 10 R W C L RC10RWCD RC 10 R W C D RC10RWDL RC 10 R W D L RC10RWDD RC 10 R W D D RC10IWCL RC 10 I W C L RC10IWCD RC 10 I W C D RC10IWDL RC 10 I W D L RC10IWDD RC 10 I W D D RC20RWCL RC 20 R W C L RC20RWDL RC 20 R W D L RC20RWDD RC 20 R W D D RC20IWCL RC 20 I W C L RC20IWDL RC 20 I W D L RC20IWDD RC 20 I W D D ST3RWCL ST 3 R W C L ST3RWDL ST 3 R W D L ST3RWDD ST 3 R W D D ST3IWCL ST 3 I W C L ST3IWDL ST 3 I W D L ST3IWDD ST 3 I W D D ST3RACL ST 3 R A C L ST3IACL ST 3 I A C L ST10RWCL ST 10 R W C L ST10RWDL ST 10 R W D L ST10RWDD ST 10 R W D D ST10IWCL ST 10 I W C L ST10IWDL ST 10 I W D L ST10IWDD ST 10 I W D D
Notes to table:
RC = reinforced concrete ST = structural steel R = regular in plan I = irregular in pan W = Wellington A = Auckland L = limited ductility (µ = 3) D = fully ductile (µ = 6)
When formulating the project, it became apparent that significant benefit could be gained by making this suite of “standard” buildings more widely available to the New Zealand structural engineering community so as to test the implications of alternative solutions. Unfortunately the significant developments and changes that were made to the Loading Standard during the course of the project have resulted in the building designs being no longer compliant with the current code. This reduces their usefulness as “standard designs”.
5
2.2 Design development
2.2.1 Preliminary design
The structural schemes and initial sizing of members was carried out by an experienced structural engineer practitioner to ensure that account was taken of contemporary design office practice, including strategies for achieving economic solutions. The following guidelines were used for the building schemes. These were selected to best achieve the specified objectives, and where feasible, to incorporate suggestions forwarded at Project Advisory Group meetings. 1. Buildings rectangular in plan, with a standard grid used for all buildings of a particular
structural system:
a. Reinforced concrete buildings: Frame direction − 5 grids of 7.5 m,
Wall direction − 3 grids of 9.0 m.
b. Structural steel buildings: Frame direction − 5 grids of 6.0 m,
EBF direction − 4 grids of 8.5 m. 2. The number of bays of EBFs and the shearwall lengths were varied to achieve the required
ductility, stiffness and strength.
3. For both the concrete and steel buildings, the two exterior frames were seismic resisting frames, with the internal frames providing gravity support to the floors (secondary seismic structure).
a. Reinforced Concrete building: Moment resisting frames on grid lines. The floor system comprised proprietary, precast concrete hollow core floor units (Dycore 200) spanning between the main frames, with 65 mm thick cast in-situ concrete topping. Gravity frames were assumed to be detailed as continuous, and were therefore included in the analysis models.
b. Steel buildings. Steel frames on grid lines, supporting secondary beams at 2.5 m centres. The floor system was proprietary metal decking spanning between the secondary beams, with composite concrete topping (120 Hi-bond). Gravity frames were assumed to be designed for composite action, but with flexible support details, therefore the gravity frames were not modelled.
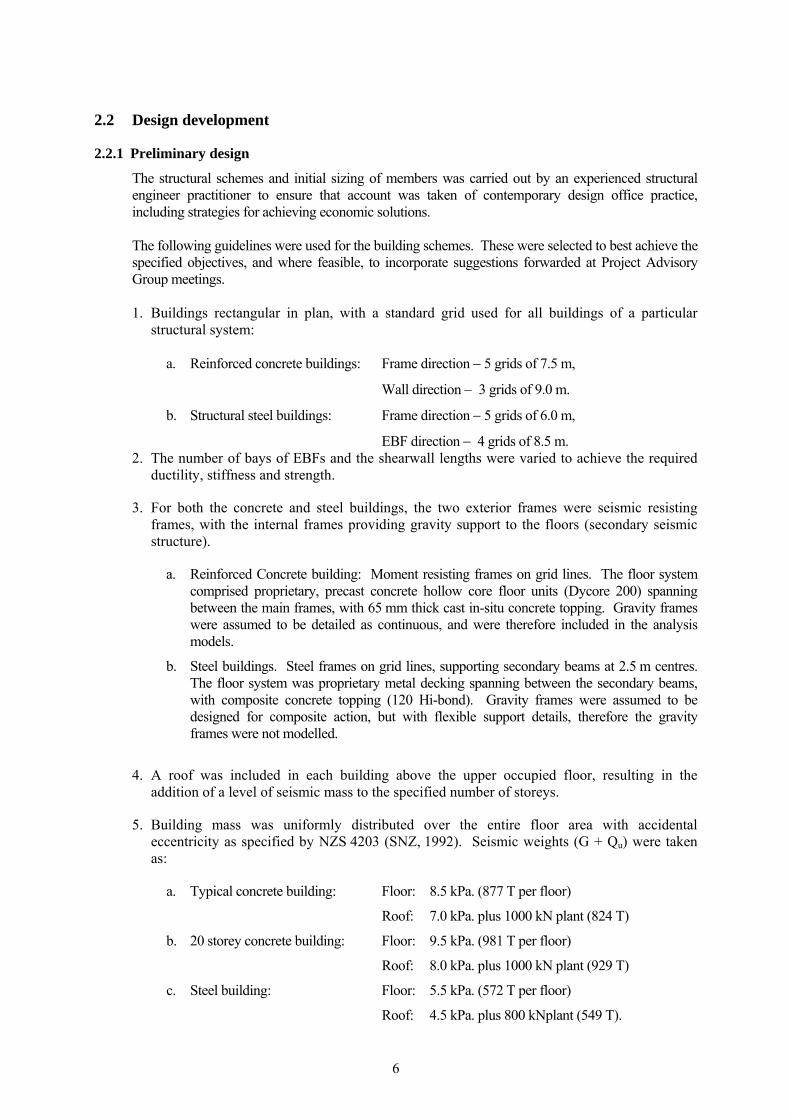
4. A roof was included in each building above the upper occupied floor, resulting in the
addition of a level of seismic mass to the specified number of storeys.
5. Building mass was uniformly distributed over the entire floor area with accidental eccentricity as specified by NZS 4203 (SNZ, 1992). Seismic weights (G + Qu) were taken as:
a. Typical concrete building: Floor: 8.5 kPa. (877 T per floor)
Roof: 7.0 kPa. plus 1000 kN plant (824 T)
b. 20 storey concrete building: Floor: 9.5 kPa. (981 T per floor)
Roof: 8.0 kPa. plus 1000 kN plant (929 T)
c. Steel building: Floor: 5.5 kPa. (572 T per floor)
Roof: 4.5 kPa. plus 800 kNplant (549 T).
6
6. Structural members were sized so that as far as practical the design strength was the minimum code compliant for the specified level of ductility. For the reinforced concrete structures, the minimum steel provisions prescribed by NZS 3101 (SNZ, 1995) were followed.
7. The seismic load resisting systems were sized so that the buildings complied with the displacement limits prescribed by the draft standard (SNZ, 2000).
8. The structural systems were also proportioned to provide (where feasible) a distinct difference in period between the two orthogonal systems. e.g. flexible frame, stiff brace/wall. Additionally, an endeavour was made that where practical, the fundamental period of the building was not greater than 3 seconds. For periods greater than 3 seconds the code design spectra gives constant displacement.
9. Beams varied in size over the height of the buildings to assist in matching design strength with demand. However, this variation was kept to a minimum for the concrete buildings, so as to reflect typical building practice.
2.2.2 Detailed design
The building structures were designed for gravity and seismic loads and load combinations, as prescribed by the draft Loadings Standard (SA/SNZ, 2000). Seismic analyses were carried out using the ETABS V7 finite element analysis program from Computers and Structures Inc, 1995 University Avenue, Berkeley, California, USA. Analysis and design were an interactive process, with member sizes and locations revised so as to achieve the target ductility demand while complying with displacement limits, gravity load demands, and minimum steel requirements. For all moment resisting frames, the members were proportioned so that column hinging was precluded except at base level, and no beam span hinging was allowed. Reinforced concrete buildings 1. Concrete members were designed and detailed in accordance with the Concrete Structures
Standard, NZS 3101 (SNZ, 1995).
2. Beam design strengths were calculated based on φMn = φ As.fy(d-d’). Slab mesh, along with any additional longitudinal bars required for stirrups, were neglected in calculations for design strength.
3. Beam over-strength moment capacities, Mo, were based on λo = 1.25 for main longitudinal steel. Allowance was made for contributions to beam flexural strength from the slab mesh, where λo=1.55, fy = 485 MPa.
4. Where beam hinging would occur away from the column faces due to gravity loading, specific curtailment of flexural reinforcement was undertaken, in order to force the beam hinges to occur at a distance of 1.5 x beam depth from the column face.
5. Column and wall combined actions interaction capacities were obtained from ETABS section designer.
Structural steel buildings 1. Steel members were designed and detailed in accordance with the Steel Structures Standard
NZS 3404 (SNZ, 1992a).
2. Steel designed following the procedures of HERA Report R4-76 Seismic Design Procedures for Steel Structures (HERA, 1995).
7

3. Steel beam flexural over-strength factors, �o, were taken as 1.15 for limited ductile (L), and 1.25 for ductile (D) frames
4. Steel link over-strength factors were taken as 1.30 for limited ductile (L), and 1.40 for ductile (D) buildings.
2.2.3 Modal analyses
Three dimensional finite element models of the buildings were generated using the ETABS V7 graphical user interface. Only the seismic structure was modelled, with the floors modelled as rigid diaphragms. Seismic masses were lumped at each of the floor levels, with code specified eccentricities accounted for by displacing the lumped floor masses by the specified eccentricities (0.1 times building width). Response spectrum analysis was used in all cases for the design of the structure. Modal results were combined using the Complete Quadratic Combination method (CQC). P-Delta actions and displacements were calculated following the procedure of NZS 4203 (SNZ, 1992). Modelling of reinforced concrete buildings 1. Beams and columns were modelled using frame members.
2. Beam and column rigid end offsets were put equal to half the beam-column joint length.
3. Seismic shear walls were modelled using super-isoparametric shell elements.
4. Columns adjacent to shear walls were modelled assuming full connection between the column and wall units. Columns therefore formed part of the shear wall system.
5. Walls were modelled with vertical spring supports beneath each wall column equivalent to 10 m long piles.
Modelling of structural steel buildings 1. Beams, columns, and braces were modelled with frame members.
2. Beam and column rigid end offsets were taken as equal to half the beam-column joint length, to account for panel zone flexibility.
3. A beam flexural stiffness modification factor of 1.2 was used to account for composite floor action.
4. EBFs were modelled with vertical spring supports beneath each column equivalent to 10 m long piles.
Seismic loads Seismic loading was evaluated in accordance with the draft Loadings Standard (SA/SNZ, 2000). Note the following interpretations or variations:
• a structural performance factor, Sp, factor of 0.67 was used for all buildings
• the return Period Factor, R, was taken as 1.0 for 3 and 10 storey buildings, and 1.3 for 20 storey buildings.
• no minimum seismic coefficient
• no base shear scaling for response spectrum analyses
8
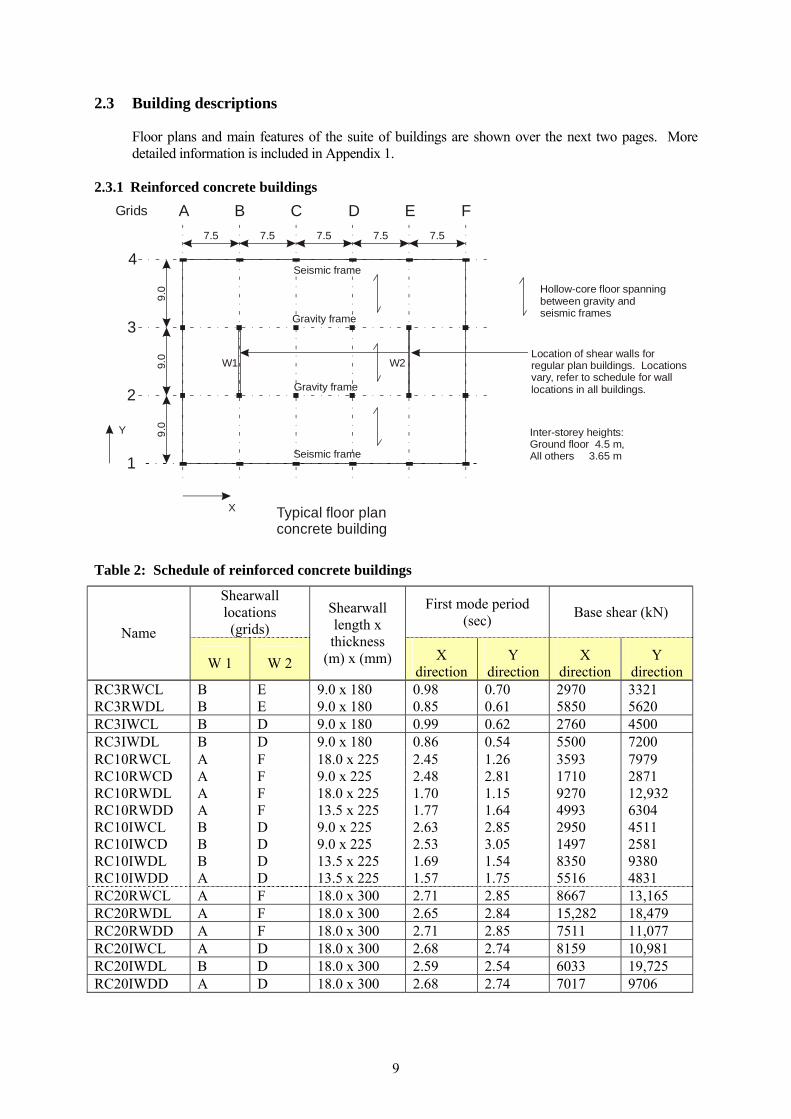
2.3 Building descriptions
Floor plans and main features of the suite of buildings are shown over the next two pages. More detailed information is included in Appendix 1.
2.3.1 Reinforced concrete buildings
A B C D E F
4
3
2
1
7.5 7.5 7.5 7.5 7.5
9.0
9.0
9.0
Seismic frame
Seismic frame
Gravity frame
Gravity frame
Hollow-core floor spanning between gravity and seismic frames
Typical floor planconcrete building
Location of shear walls forregular plan buildings. Locations vary, refer to schedule for wall locations in all buildings.
Grids
Inter-storey heights:Ground floor 4.5 m,All others 3.65 m
X
Y
W1 W2
Table 2: Schedule of reinforced concrete buildings
Shearwall locations (grids)
First mode period (sec) Base shear (kN)
Name
W 1 W 2
Shearwall length x thickness
(m) x (mm) X direction
Y direction
X direction
Y direction
RC3RWCL B E 9.0 x 180 0.98 0.70 2970 3321 RC3RWDL B E 9.0 x 180 0.85 0.61 5850 5620 RC3IWCL B D 9.0 x 180 0.99 0.62 2760 4500 RC3IWDL B D 9.0 x 180 0.86 0.54 5500 7200 RC10RWCL A F 18.0 x 225 2.45 1.26 3593 7979 RC10RWCD A F 9.0 x 225 2.48 2.81 1710 2871 RC10RWDL A F 18.0 x 225 1.70 1.15 9270 12,932 RC10RWDD A F 13.5 x 225 1.77 1.64 4993 6304 RC10IWCL B D 9.0 x 225 2.63 2.85 2950 4511 RC10IWCD B D 9.0 x 225 2.53 3.05 1497 2581 RC10IWDL B D 13.5 x 225 1.69 1.54 8350 9380 RC10IWDD A D 13.5 x 225 1.57 1.75 5516 4831 RC20RWCL A F 18.0 x 300 2.71 2.85 8667 13,165 RC20RWDL A F 18.0 x 300 2.65 2.84 15,282 18,479 RC20RWDD A F 18.0 x 300 2.71 2.85 7511 11,077 RC20IWCL A D 18.0 x 300 2.68 2.74 8159 10,981 RC20IWDL B D 18.0 x 300 2.59 2.54 6033 19,725 RC20IWDD A D 18.0 x 300 2.68 2.74 7017 9706
9
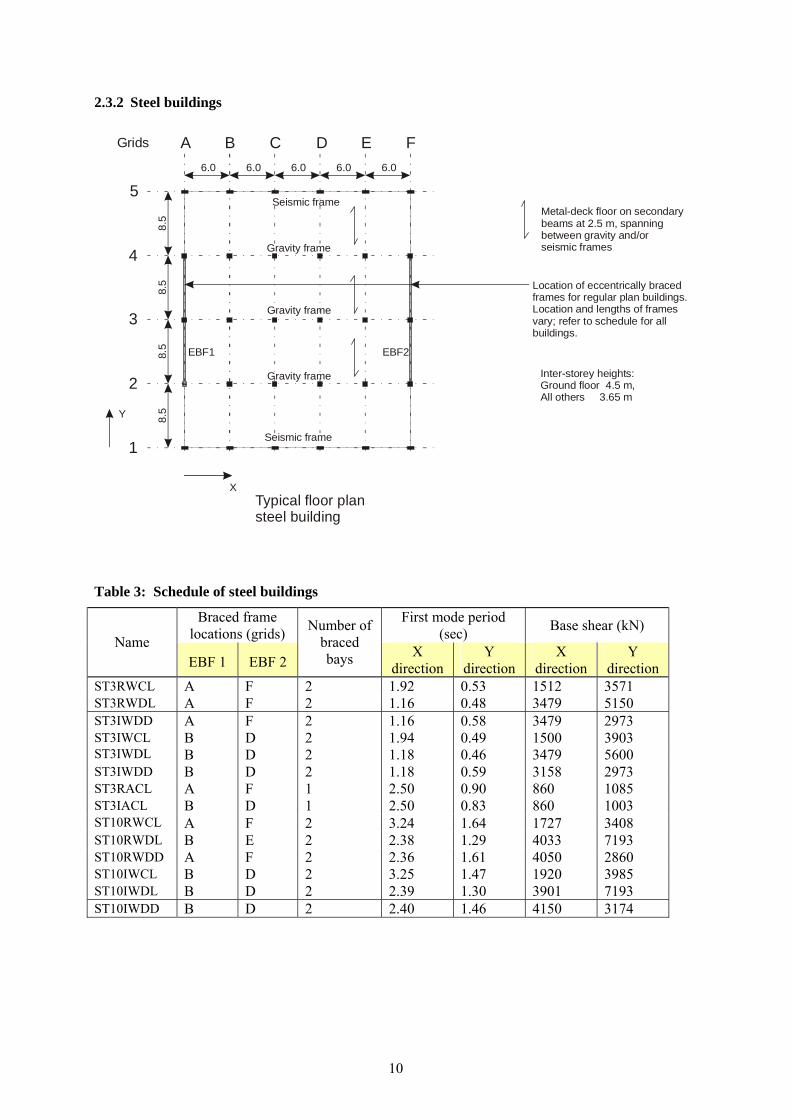
2.3.2 Steel buildings
A B C D E F
5
4
3
2
1
6.0 6.0 6.0 6.0 6.08.
58.
58.
58.
5
Seismic frame
Seismic frame
Gravity frame
Gravity frame
Gravity frame
Grids
Metal-deck floor on secondary beams at 2.5 m, spanning between gravity and/or seismic frames
Location of eccentrically braced frames for regular plan buildings.Location and lengths of frames vary; refer to schedule for allbuildings.
Typical floor plansteel building
Inter-storey heights:Ground floor 4.5 m,All others 3.65 m
X
Y
EBF2EBF1
Table 3: Schedule of steel buildings
Braced frame locations (grids)
First mode period (sec) Base shear (kN)
Name EBF 1 EBF 2
Number of braced bays X
direction Y
direction X
direction Y
direction ST3RWCL A F 2 1.92 0.53 1512 3571 ST3RWDL A F 2 1.16 0.48 3479 5150 ST3IWDD A F 2 1.16 0.58 3479 2973 ST3IWCL B D 2 1.94 0.49 1500 3903 ST3IWDL B D 2 1.18 0.46 3479 5600 ST3IWDD B D 2 1.18 0.59 3158 2973 ST3RACL A F 1 2.50 0.90 860 1085 ST3IACL B D 1 2.50 0.83 860 1003 ST10RWCL A F 2 3.24 1.64 1727 3408 ST10RWDL B E 2 2.38 1.29 4033 7193 ST10RWDD A F 2 2.36 1.61 4050 2860 ST10IWCL B D 2 3.25 1.47 1920 3985 ST10IWDL B D 2 2.39 1.30 3901 7193 ST10IWDD B D 2 2.40 1.46 4150 3174
10
2.4 Issues arising during design
The buildings were initially designed by a practitioner who was very familiar with the current Loading Standard (SNZ 1992). During the course of detailed design it became apparent that there were several differences between the current and draft standards, which would have significant effects on the designs. These are discussed in detail by Bell and Davidson (2002), but are summarised here for completeness.
2.4.1 Hazard spectra
There was an overall reduction in design load between NZS 4203, and the November draft resulting from the changed hazard spectra. This was especially true for the Auckland buildings, where reductions up to 60 to 70% were found. As a result many buildings were governed by drift limits or minimum reinforcing steel provisions. Structures which would have been designed as fully ductile would now become limited ductile designs. Although these comments are still generally applicable, subsequent changes to the design spectra have lessened the effects.
2.4.2 Response spectra base shear scaling
The changes in spectral shapes in the draft standard meant that higher modes were likely to become more dominant in a response spectra analysis than was the case with the current standard. Thus, base shear was no longer considered a reasonable parameter to use when comparing “response spectra” analyses results with an “equivalent static” analysis which is based on the first mode only. For this reason, base shear scaling was omitted from November draft. It was later reinstated and remains in the current draft, primarily as a reality check. However its omission did affect the building designs.
2.4.3 Structural performance factor
Use of the structural performance factor, Sp is clouded with controversy. Two options were provided in the November draft: • Assign Sp according to structural ductility only i.e. µ > 1.25, Sp = 0.67 • Assign Sp on the basis of ductility, redundancy and regularity.
2.4.4 Inter-storey drift limits
Drift limits controlled several of the building designs. The purpose of the limits is not clear. The limits were evaluated for moment resisting frames, so their relevance to shear walls and braced frames is doubtful, and different limits apply to these elements in other standards.
3. GROUND MOTION RECORDS
3.1 Overview
Issues relating to the procedures for selection and scaling of the ground motion records occupied a lot of the Project Advisory Group’s efforts. Key recommendations from the initial meetings were: 1. US practices (FEMA, 1997) and (ATC, 1996) should form the basis for the selection of
ground-motion records and the scaling procedures to be used for the study. (Not all US provisions can be carried across directly, because in New Zealand the code spectra are defined in terms of the stronger horizontal component, rather than the US practice of using the geometric mean of two orthogonal horizontal components.)
2. A minimum of three ground-motion records are required. Each record should have a similar
11

seismic signature (eg: magnitude, distance, slip characteristics, and soil class) to the significant events contributing to the design spectra at the target period, and for the return period associated with the limit state being considered.
3. Scaling procedures will be required to match the selected record spectra to the hazard spectra of the current Loadings Standard (SNZ, 1992). A quality-of-fit check was recommended to achieve a reasonable match.
4. As the main thrust of the project is the behaviour of building parts and components, the three-dimensional response of the building is of interest. Thus it was considered essential that the ground-motion records chosen must have at least two horizontal components. These components are interrelated, and this must be considered in the spectral matching technique used.
The relevant section from the NEHRP Recommendations (FEMA, 1997) is reproduced below:
2.6.2.2 Acceleration Time Histories Time-History Analysis shall be performed with no fewer than three data sets (two horizontal components or, if vertical motion is to be considered, two horizontal components and one vertical component) of appropriate ground motion time histories that shall be selected and scaled from no fewer than three recorded events. Appropriate time histories shall have magnitude, fault distances, and source mechanisms that are consistent with those that control the design earthquake ground motion. Where three appropriate recorded ground-motion time history data sets are not available, appropriate simulated time history data sets may be used to make up the total number required. For each data set, the square root of the sum of the squares (SRSS) of the 5% damped site-specific spectrum of the scaled horizontal components shall be constructed. The data sets shall be scaled such that the average value of the SRSS spectra does not fall below 1.4 times the 5%-damped spectrum for the design earthquake for periods between 0.2T seconds and 1.5T seconds (where T is the fundamental period of the building). Where three time history data sets are used in the analysis of a structure, the maximum value of each response parameter (e.g., force in a member, displacement at a specific level) shall be used to determine design acceptability. Where seven or more time history data sets are employed, the average value of each response parameter may be used to determine design acceptability.
Selection of the earthquake ground motions for this project, together with their record scale factors, was carried out under contract to BRANZ by the Institute of Geological and Nuclear Sciences (GNS). The team leader was Graeme McVerry.
3.2 Target spectra
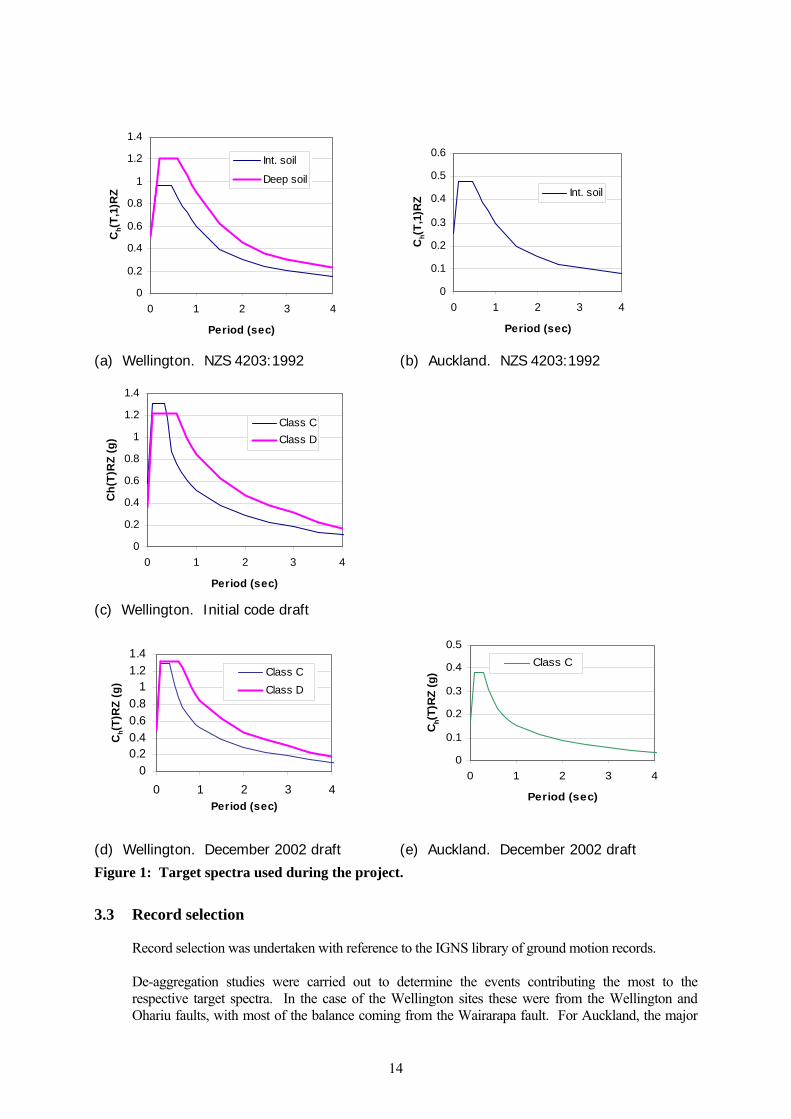
The target spectra used for the selection of the records were the design spectra from the current version of the Loadings Standard, as suggested by the Project Advisory Group. During the course of the project these spectra changed several times, resulting in considerable rework for both GNS and BRANZ. The initial spectra were taken from the November 2000 draft of the joint Australia/New Zealand Loading Standard (SA/SNZ, 2000). Later in the study, changes were made to the proposed spectra to give a more gradual fall-off with period, and to include near-fault effects. An additional provision
12

was introduced which required that one of every three records was to include a component with marked forward-directivity characteristics when sites are near to the most active major fault systems. Also, during this period a near fault factor, N(T,D), was introduced. Figure 1 shows the spectra in process of evolution at three significant stages in the project, for each of the soil sites studied. Ordinates of the plots are the product of the Spectral Shape Factor, Ch(T,1), the Zone Factor for the site, Z, the Return-Period Factor, R, and (where appropriate for the site) the Near-Fault Factor, N(T,D).
13
0
0.2
0.4
0.6
0.8
1
1.2
1.4
0 1 2 3 4
Period (sec)
Ch(
T,1)
RZ
Int. soil
Deep soil
0
0.1
0.2
0.3
0.4
0.5
0.6
0 1 2 3 4
Period (sec)
Ch(
T,1)
RZ Int. soil
(a) Wellington. NZS 4203:1992 (b) Auckland. NZS 4203:1992
0
0.2
0.4
0.6
0.8
1
1.2
1.4
0 1 2 3 4
Period (sec)
Ch(
T)R
Z (g
)
Class CClass D
(c) Wellington. Initial code draft
00.20.40.60.8
11.21.4
0 1 2 3 4Period (sec)
Ch(
T)R
Z (g
)
Class CClass D
0
0.1
0.2
0.3
0.4
0.5
0 1 2 3 4
Period (sec)
Ch(
T)R
Z (g
)
Class C
(d) Wellington. December 2002 draft (e) Auckland. December 2002 draft
Figure 1: Target spectra used during the project.
3.3 Record selection
Record selection was undertaken with reference to the IGNS library of ground motion records. De-aggregation studies were carried out to determine the events contributing the most to the respective target spectra. In the case of the Wellington sites these were from the Wellington and Ohariu faults, with most of the balance coming from the Wairarapa fault. For Auckland, the major
14

contributor is the arbitrary M6.5 earthquake at 20 km, which dominates the short period range, and the Wairoa North and Kerepehi North faults for the longer periods (>1.5 seconds). Records were selected to match the seismic signatures of these events. The selection procedure required the seismic signature of the record to match as far as practical, the events that make a significant contribution to the design spectra in the period range of interest. Issues which influence choice of the record include the magnitude of the event, the physical proximity of the event from the recording device, the slip characteristics of the event and the ground conditions upon which the recording device was located. The seismic signature varied with the limit state and the location being considered. Thus different ground-motion records were necessary for different limit states (i.e. different return periods). For serviceability limit state events in Wellington for example, the primary contribution is from more distant events than the ultimate limit state event noted above, with the contribution from the nearby Wellington and Wairarapa faults being minimal. The records chosen for the ultimate limit state Wellington shallow soil (Class C) site were: 1. Tabas, F78201Z2, magnitude 7.4 at a distance of 1.2 km from the rupture. This is a version
of the record held at GNS that had been filtered with a high-pass filter with a transition band of 0.15 to 0.25 Hz, effectively removing the long-period forward-directivity pulse that is a feature of this record. It provides an excellent match to the code spectrum, with a scaling of about 0.5 for the R=1 case for Wellington.
2. Tabas FD F78201Z1. This is a reprocessed version, with more low-frequency content so that the forward directivity pulse is retained. This is also a very good match to the code spectrum, except that the forward-directivity pulse causes the spectrum to be relatively strong at long periods compared to the code spectrum. However, such behaviour is realistic in the near-source zone, and exposes a deficiency of the code spectrum. It was considered important to include one record with forward directivity in the mix for long-period structures in Wellington. This record is an alternative to F78201Z2, especially for long-period structures.
3. La Union F85421Z1. From above the rupture zone of the 1985 Michoacan, Mexico earthquake of magnitude 8.1, at a distance of 16 km from the rupture zone. The scaling required for the R=1 case for Wellington is about 2 ( the near-source records from the Mexican earthquake tended to be weak for their magnitude and distance). It provides an excellent match to most of the code spectrum.
4. El Centro 1940 F40001U1 Magnitude 7.0 strike-slip event at 10 km This remains one of the best examples of constant spectral velocity over a wide period range. The scaling is typically 1.2 for the R=1 case for Wellington.
The records chosen for ULS Wellington deep soil (Class D) site were:
1. The El Centro record, which provides satisfactory fits in all period bands, although the
scaling varies with period.
2. Duzce record, F99604Z1, from the magnitude 7.7, Izmit (Turkey) earthquake of 1999. Forward-directivity
3. Caleta de Campos record, F85419Z1, from the near-source zone of the Michoacan (Mexico) earthquake of 1985. Caleta de Campos is a rock rather than deep soil site, but the soil is rather weathered so the record just fits the criteria.
15
The records chosen for Auckland shallow soil (Class C) site were:
1. Delta record F79407Z1 from the Imperial Valley earthquake of 1979, magnitude 6.5 at 33 km distance to represent the Wairoa North fault event. This event was strike-slip, but is included by Spudich et al. (1997) in their list of events in extensional tectonic regimes. The site conditions are unknown, other than being classified as soil by Spudich et al and with an average shear-wave velocity to 30m depth of 180m/s to 360m/s by Boore et al. (1997). This record provides an excellent match to the code spectrum in all spectral period bands.
2. Bovino record F80271Z1 from the Irpinia (Campano Lucano), Italy earthquake of 23 November 1980, magnitude 6.8 at 52 km to represent the Kerepehi North fault event. The magnitude and shortest distance to the rupture are taken from the European Strong-Motion Database containing the record, while Spudich et al (1997) give a magnitude of 6.9 and a Joyner-Boore distance of 43 km and Sabetta & Pugliese (1987) give a surface-wave magnitude of 6.8 and a Joyner-Boore distance of 55km. Sabetta & Pugliese list the site with a deep soil classification, corresponding to more than 20m of soil. However, they give a shear-wave velocity range of 400m/s to 800m/s for soil, so depending on the velocity, depths of between 60 m and 120 m could fit in the New Zealand shallow soil class. This record provides an excellent match to the code spectrum in all spectral period bands.
3. Matahina dam base record A87085D2 from the 1987 Edgecumbe earthquake, magnitude 6.53 at 11km distance (listed as magnitude 6.60 at 18.9 km by Spudich et al) to represent the deterministic minimum spectrum corresponding to a magnitude 6.5 earthquake at 20 km. The site fits the shallow soil category of the draft code. This record provides a poorer match than the other two, but is still acceptable.
3.4 Scaling of records
The intent of scaling ground motion records is so that, over the period range of interest, the frequency content of each record matches that of the target spectrum for the site and limit state, and that the energy content of at least one record in the family of three exceeds the target spectrum. The choice of a period range of interest must encompass the dynamic characteristics of the building, and needs to consider both its short-period response, and the potential for the structure to soften and move well beyond its assessed fundamental period. The range used in the study was 0.2T<T<1.5T (where T = the fundamental building period), which is consistent with the USA approach (FEMA, 1997). Subsequent changes to the draft standard have revised the range to 0.4T<T<1.25T, thereby overcoming the problem of large scale factors being required for individual records. After a number of iterations, the solution arrived at to achieve these criteria was that for each orthogonal direction of the building, with its fundamental period T (and the range of interest 0.2 T to 1.5 T), the accelerations in each record were scaled by two factors, k1 and k2.
A First, the record scale factor, k1, was used to adjust the individual record to match the target spectrum as closely as practical over the period range of interest. For each component of the record, the factor k1 was determined as follows:
where: k1 = Scale value which minimises (in a least mean square sense) the function log(k1SAcomponent/SAtarget) over the period range of interest (in each case the frequencies used to determine k1 were selected so that each frequency was within 10 % of the preceding one),
SAcomponent is the 5 % damped spectrum of each component of each ground motion record within the family of records being considered,
SAtarget is the target spectrum for the site, which is equal to the elastic site hazard spectrum, C(T).
16
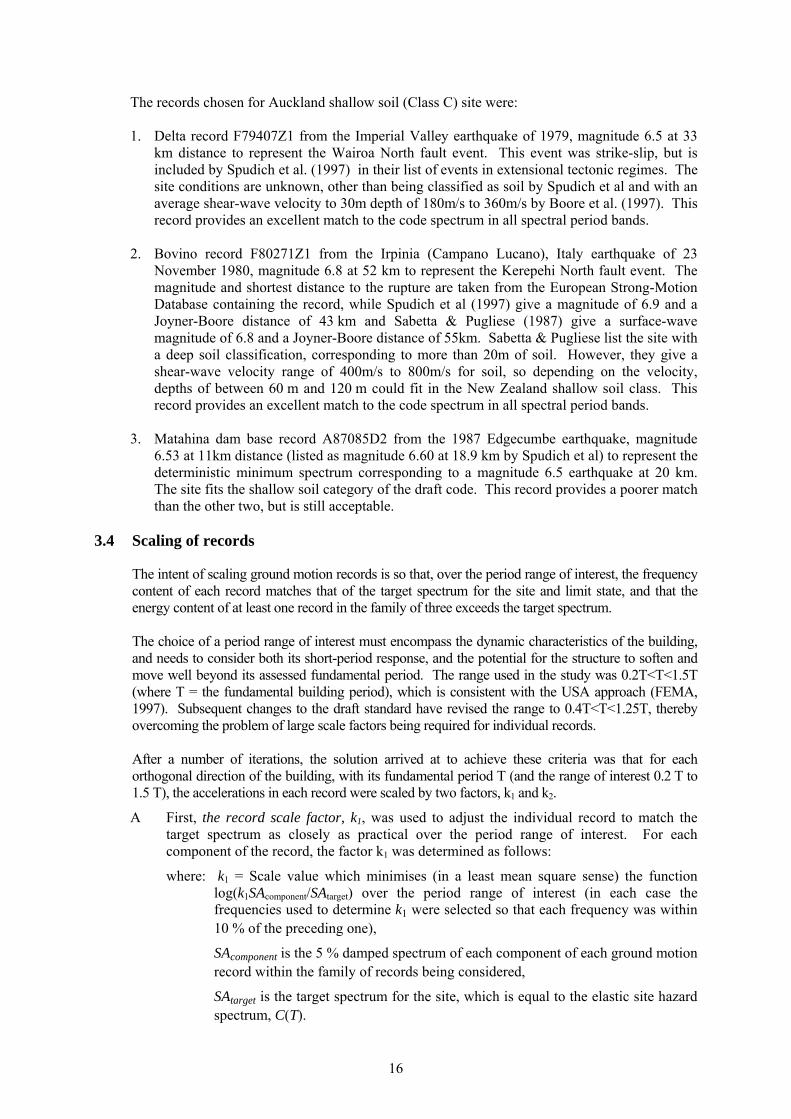
The component with the lowest record scale factor (k1) at each period was nominated as the principal component for that period, and the other as the secondary component. The presentational style produced by GNS resulted in a set of period-dependent record scale factors each of which identified the principal component of that record at each period. An example of the form presented is shown in Figure 2.
Figure 2. Record scale factor.
(El Centro Record − Wellington deep soil site)
The envelope approach is slightly different from that used in US practice where the average spectral ordinate of the set of records is required to exceed the target spectra. However since the most adverse response of a parameter to each member of the family controls acceptability, it was considered reasonable that only one record need exceed the target.
B Second, a family scale factor, k2, was applied to all the records in the family of three, so as
to ensure that at least one record exceeds the target spectrum at each point (SAPrincipal > SATarget) over the same period range of interest. In all cases k2 ≥ 1.0.
However, if k2 > 1.3 then either:
a) a different record was selected as one of the family so as to better cover the target spectrum and reassess k2, or
b) if the record scale factors of the components were within 20 % of each other at period T, the principal and secondary components were swapped, and k2 reassessed.
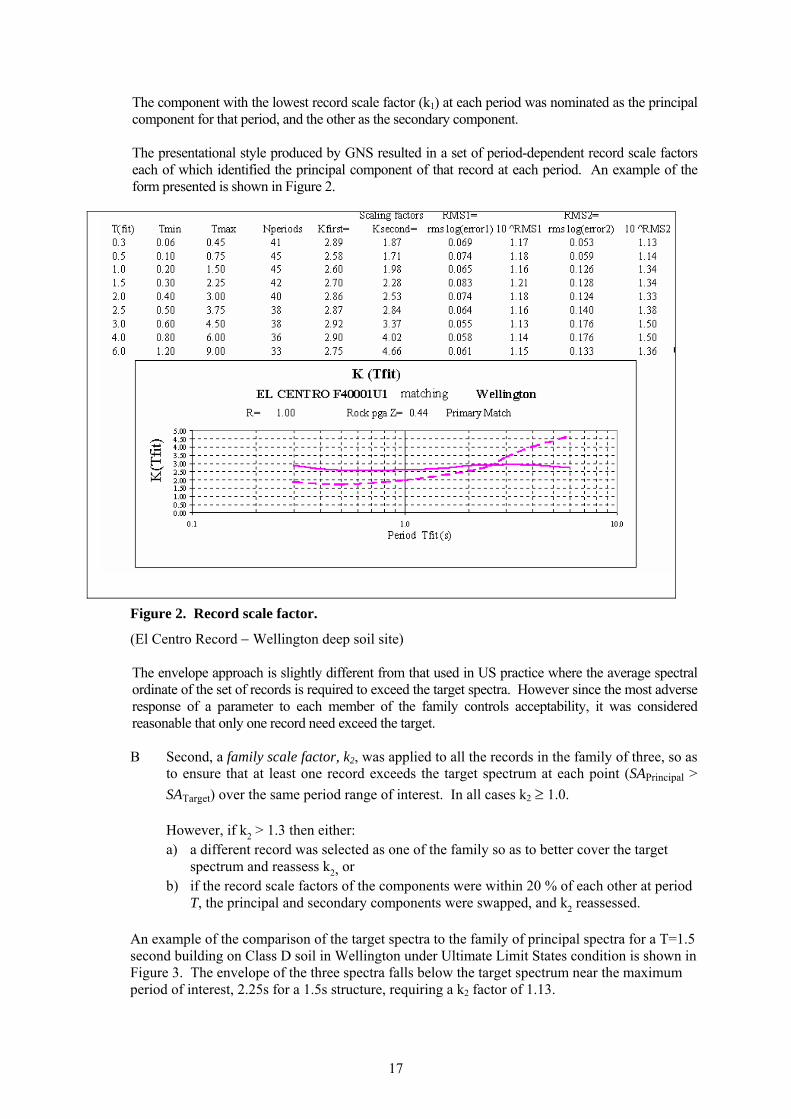
An example of the comparison of the target spectra to the family of principal spectra for a T=1.5 second building on Class D soil in Wellington under Ultimate Limit States condition is shown in Figure 3. The envelope of the three spectra falls below the target spectrum near the maximum period of interest, 2.25s for a 1.5s structure, requiring a k2 factor of 1.13.
17
Figure 3. Typical family scale factor, k2.
(for T=1.5, Wellington site, Class D soil, ULS)
The product of the two factors, (k1 x k2) was then used to scale the selected earthquake records in the subsequent time history analyses, as described in the next section. During the course of the project, the above procedures were subjected to review and also the proposed code spectra modified as the project progressed and unexpected issues arose. This resulted in considerable rework by both GNS selecting the records and record scale factor, and by BRANZ determining the family scale factors and applying them to the building models to ascertain the inelastic response parameters. The finally agreed procedure (as outlined above) was offered to the Standards Review Committee as the basis for the ground motion record scaling procedure described in Section 5.5 of the earthquake part of the Loading Standard, and is now incorporated in the current draft of the standard (SNZ, 2003).
4. TIME HISTORY ANALYSES
4.1 Overview
The Ruaumoko 3D analysis package (Carr, 2001) was selected for the integrated time history analyses (ITHA) because it was capable of three dimensional analysis, was commercially available at a reasonable price, and included a variety of suitable hysteretic models. It had the additional advantage that the author was readily available to the team to help with any advice or problems that may have arisen. Because of the large number of analyses that were required, and the large size of the building models, the ITHA were run using the batch file entry option, which proved a very efficient way of processing several building configurations sequentially. Typically each analysis run took between 5 minutes and 2 hours using 1 GHz and 1.7 GHz PC’s, frequently running overnight. The building designs were produced, with all the necessary ITHA input data, in the form of a spreadsheet, one for the steel buildings, and one for the reinforced concrete buildings. Individual worksheets within the spreadsheet contained all the basic building information, the geometric data for the nodes, material and property data for all the members, and all necessary loading, mass and damping parameters. Three worksheets (one for each of the 3, 10, or 20 storey building models) were set out in a suitable format for direct reading as input batch files by the Ruaumoko 3D programme. Options were presented for the analyst to choose:
18

• the building model • the analysis type (pushover/mode shape or time history)
input files containing the relevant component of the ground motion record
y create the input text file for each Ruaumoko batch run.
lyses using
uaumoko 3D, one with the action being imposed in the moment-resisting frame direction, and one
re then used to calculate the mily scaling factors (k2) for the selected ground motions as described in the previous section, and
n in the following steps:
ent-resisting frame direction, and the secondary component in the shearwall or EBF direction.
•
ix analyses
wit 4.2
dimensional models created for the non-linear time history analyses were based on the ed for the ETABS linear-elastic, modal analyses (see section 2.2.2). However, some
ngth and stiffness properties were used in place of the dependable roperties as used for the ETABS analyses, which would typically underestimate the actual floor
4.2.2
of the concrete, λec (f’c), was taken as being 50% higher than that specified, as A 306 (FEMA, 1997a), and ATC 40 (ATC, 1996). The expected stiffness of
• P-Delta option • earthquake direction and eccentricity • the names of the• scale factor for the record.
A macro was then used to directl
Each building model, created as described above, was first subjected to two pushover anaRin the transverse direction (shearwalls, or eccentrically braced frames). From these analyses the significant mode shapes and building periods in each direction were established. Plots of the roof displacement against base shear were then used to establish the structural ductility for each building. Examples of these plots (pushover plots) are included in Appendix 2. The fundamental building periods for each direction so established wefathe combined scale factor used to create time history input batch files. The inelastic time history analysis for each building was then undertake • the first record was applied to the model with the primary component in the mom
Both components were scaled by the record scale factor applicable to the principal component, and the family scale factor applicable for the fundamental period of the building in the orientation of application
the analysis was repeated with the primary component in the wall/EBF direction
• the same procedure was repeated for each of the other two records, thus making sfor each building at each limit state.
The analyses used the Newmark-constant average acceleration method (Clough and Penzien, 1993), h a time step of ∆t = 0.005 seconds.
Structural modelling
4.2.1 General
The threemodels uschanges were made to reflect the fact that one of the goals of the analyses was to establish realistic floor acceleration spectra. In particular, expected strepaccelerations. This was done to allow for the normally expected higher than specified strengths of the steel and concrete used, and also to allow for the increase in strength of the concrete over time. Thus the analysis results were considered to give expected upper bound estimates of the floor accelerations. Material properties
The expected strength recommended in FEMthe concrete, λe (Ec), was taken as being 30% higher than that assumed in the design. This is to account for the probable higher than specified concrete compression strength and the conservative
19

formulation of the code relationship, which tends to underestimate the average values obtained from cylinder tests (Paulay and Priestley, 1992). Reinforcing steel expected yield strengths, fye, were taken as being 15% higher than specified, as per standard practice. Allowance was made in the beam strengths for the contributions from the slab mesh. For the steel buildings, the expected yield strength, λes (fy), was taken as 1.17 times the specified
rength. Steel beam stiffness’s were increased by 20% to account for the increase in stiffness due to
member strengths and stiffness’s for the reinforced concrete buildings were based
on:
fy) = 1.15
• er strengths for the steel buildings were based on:
• y(d-d’). (Positive expected moment capacities at the column face were used where hinging occurs at a distance of 1.5h from the column face as assumed
• •
s were taken into account by the hysteretic models chosen.
4.2.3 mass (both translational and rotational mass) was lumped at each of the floor levels, and vertical series of reference nodes, one at each floor. The location of the reference nodes
l buildings. For all e buildings, frame columns were modelled as fixed at their bases. However shear wall bases
d as Giberson Beam frame members (Sharpe, 1974), and columns as Concrete r Steel beam-column frame members. Shear walls were modelled as Columns with equivalent
dings, the member stiffness’s were modified to represent concrete cracking,
generally as per the guidelines in the Commentary to NZS 3101 (SNZ, 1995). After discussions with
stcomposite action with the slab in the middle of the span. In summary:
• expected
λec (f’c) = 1.5 λes (λe (Ec) = 1.30 expected membλes (fy) = 1.17 λe (Es) = 1.20 Mnmax = λec.As.ffor any beams in the design) PC max = λec.α.f’c.(Ag – As) + λes.fy.As PT max = λes.fy.As
Strain hardening effect
Modelling
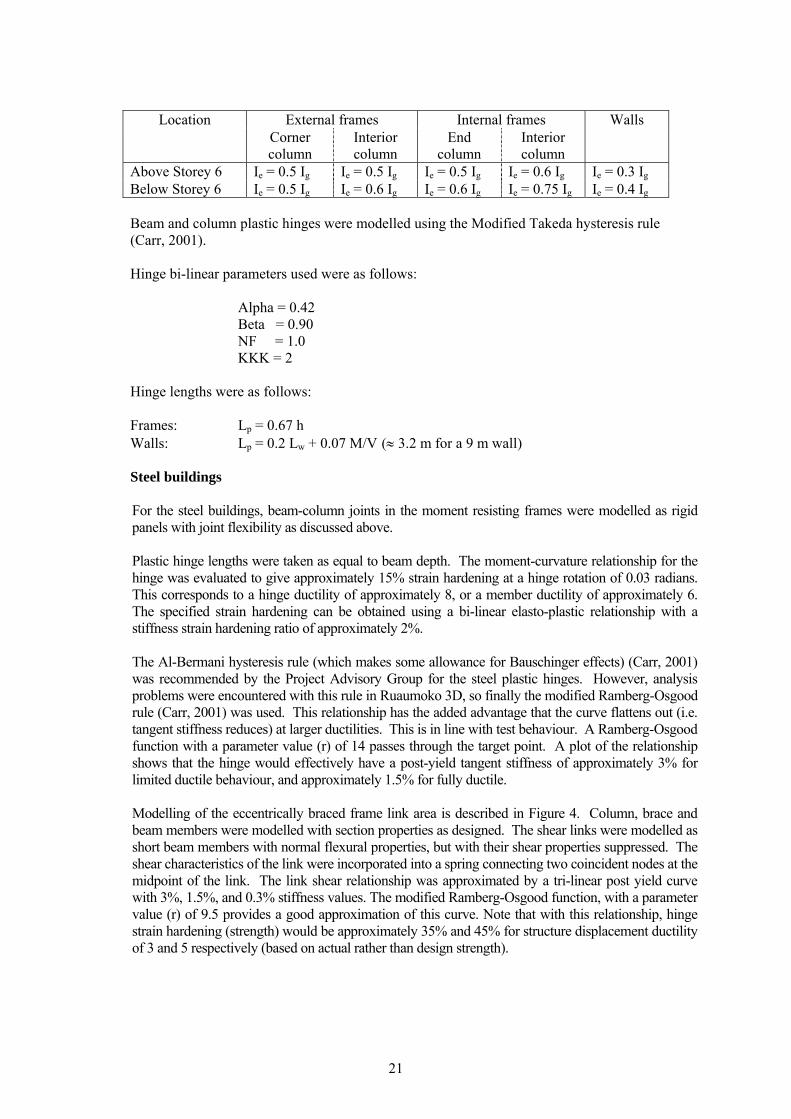
All seismic applied at a was altered as required to achieve a nominal accidental eccentricity of 0.1 times the building plan dimension, as is common practice in New Zealand (SNZ, 2000). For buildings with irregular plan layout, the reference node location was arbitrarily chosen as that with the greatest offset from the location of the centre of gravity of the shearwalls (or EBFs), so as to produce the greatest torsional effect on the structure. For all the buildings, the concrete floors were modelled as rigid diaphragms by slaving all nodes (rotation and translation) at that level to the reference nodes. Gravity frames were included in the concrete building models, but not in the steethincorporated flexural springs, and EBF columns vertical springs, to simulate the axial flexibility of 10 metre long piles. Beams were modelleostiffness and strength to the walls they represent. For both beams and columns, rigid end blocks (with joint flexibility) equal to half the beam-column joint length were used. Plastic hinges were included at the column faces at each end of all the beams, and at the bases of the ground floor columns. Concrete buildings
For the concrete buil
the Project Advisory Group, the following modifiers were applied to the gross section dimensions to give effective section properties:
20
al frames Internal frames ExternLocation
Corner co
Interior n
End col
Interior n
Walls
lumn colum umn columAbove Storey 6 Ie Ie Ie = Ie Ie = 0.3 Ig= 0.5 Ig = 0.5 Ig 0.5 Ig = 0.6 Ig
Below Storey 6 Ie Ie Ie Ie Ie = 0.4 Ig= 0.5 Ig = 0.6 Ig = 0.6 Ig = 0.75 Ig
n pl s we d u odif hy e
(Carr, 2001).
parameters used were as follows:
Beta = 0.90
alls: Lp = 0.2 L + 0.07 M/V (≈ 3.2 m for a 9 m wall)
dings, beam-column joints in the moment resisting frames were modelled as rigid
panels with joint flexibility as discussed above.
depth. The moment-curvature relationship for the inge was evaluated to give approximately 15% strain hardening at a hinge rotation of 0.03 radians.
as recommended by the Project Advisory Group for the steel plastic hinges. However, analysis
in Figure 4. Column, brace and eam members were modelled with section properties as designed. The shear links were modelled as
Beam and colum astic hinge re modelle sing the M ied Takeda steresis rul
Hinge bi-linear
Alpha = 0.42 NF = 1.0 KKK = 2
Hinge lengths were as follows: Frames: Lp = 0.67 h W w Steel buildings
For the steel buil
Plastic hinge lengths were taken as equal to beamhThis corresponds to a hinge ductility of approximately 8, or a member ductility of approximately 6. The specified strain hardening can be obtained using a bi-linear elasto-plastic relationship with a stiffness strain hardening ratio of approximately 2%. The Al-Bermani hysteresis rule (which makes some allowance for Bauschinger effects) (Carr, 2001) wproblems were encountered with this rule in Ruaumoko 3D, so finally the modified Ramberg-Osgood rule (Carr, 2001) was used. This relationship has the added advantage that the curve flattens out (i.e. tangent stiffness reduces) at larger ductilities. This is in line with test behaviour. A Ramberg-Osgood function with a parameter value (r) of 14 passes through the target point. A plot of the relationship shows that the hinge would effectively have a post-yield tangent stiffness of approximately 3% for limited ductile behaviour, and approximately 1.5% for fully ductile. Modelling of the eccentrically braced frame link area is described bshort beam members with normal flexural properties, but with their shear properties suppressed. The shear characteristics of the link were incorporated into a spring connecting two coincident nodes at the midpoint of the link. The link shear relationship was approximated by a tri-linear post yield curve with 3%, 1.5%, and 0.3% stiffness values. The modified Ramberg-Osgood function, with a parameter value (r) of 9.5 provides a good approximation of this curve. Note that with this relationship, hinge strain hardening (strength) would be approximately 35% and 45% for structure displacement ductility of 3 and 5 respectively (based on actual rather than design strength).
21

350mm350mm
Coincident nodesallowing spring to model shear in link
Beam members with flexural properties, shear suppressed
BeamBeam
Beam Beam
Col
umn
Col
umn
Brace Brace
Figure 4. Modelling of EBF links.
4.2.4 Damping
Rayleigh initial stiffness viscous damping (Carr, 2001) was incorporated in the model, using the expected properties of the structure at the fundamental period for the direction being considered. As discussed with the Project Advisory Group, the damping parameters were evaluated to give 5% damping in the fundamental elastic mode, and a minimum of 2% in any mode. The coefficients used were:
α = 0.3254 β = 0.00125 ξ(T1) = 5% ξ (Ti) ≥ 2%. 4.2.5 Loads
Gravity loads on beams were incorporated in the analysis through the application of equivalent fixed end moments to the beam ends. Column and wall axial loads from the ultimate gravity load cases were applied as a prestress force in the elements. P-Delta effects were accounted for by applying the gravity load on a pin ended column located at the reference nodes.
4.3 Data reduction process
Output files from the Ruaumoko integrated time history analyses (ITHA) were very large (typically ranging between 200 MB and 1 GB in total for the .RAS and .LIS files per analysis run). At an early stage the project team identified data processing as a significant and critical part of the project, and developed Visual Basic (VB) software, written in-house specially for the task. The suite of extraction programs included:
• “Modeshape.exe” − extracted the mode shapes and periods at the master nodes
• “Pushover.exe” − extracted a time history of deflection at a selected node, and reactions at bases of columns, walls and braces
• “Stackofdrifts.exe” − interrogated the deflection data in the output files, and extracted the peak inter-storey drifts during the period of excitation (in x and z translational directions), for each level at the corner nodes. It also extracted instantaneous deflection profiles at the master nodes at various timesteps.
22
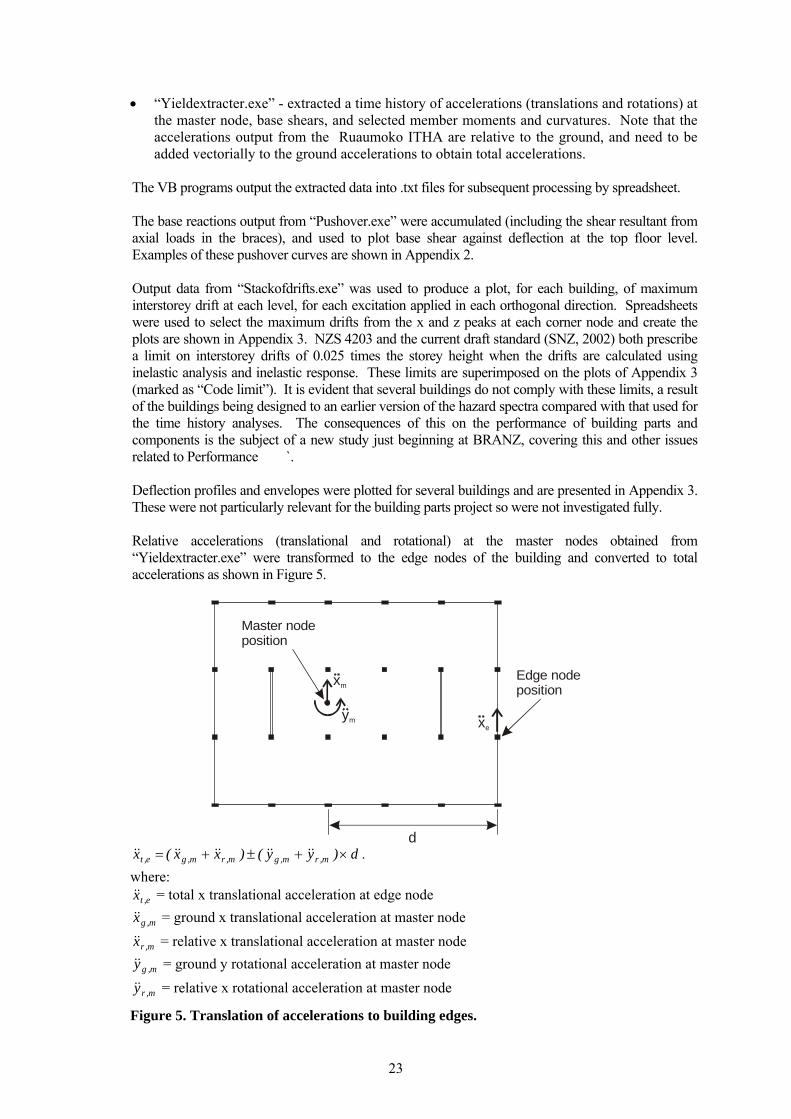
• “Yieldextracter.exe” - extracted a time history of accelerations (translations and rotations) at the master node, base shears, and selected member moments and curvatures. Note that the accelerations output from the Ruaumoko ITHA are relative to the ground, and need to be added vectorially to the ground accelerations to obtain total accelerations.
The VB programs output the extracted data into .txt files for subsequent processing by spreadsheet. The base reactions output from “Pushover.exe” were accumulated (including the shear resultant from axial loads in the braces), and used to plot base shear against deflection at the top floor level. Examples of these pushover curves are shown in Appendix 2. Output data from “Stackofdrifts.exe” was used to produce a plot, for each building, of maximum interstorey drift at each level, for each excitation applied in each orthogonal direction. Spreadsheets were used to select the maximum drifts from the x and z peaks at each corner node and create the plots are shown in Appendix 3. NZS 4203 and the current draft standard (SNZ, 2002) both prescribe a limit on interstorey drifts of 0.025 times the storey height when the drifts are calculated using inelastic analysis and inelastic response. These limits are superimposed on the plots of Appendix 3 (marked as “Code limit”). It is evident that several buildings do not comply with these limits, a result of the buildings being designed to an earlier version of the hazard spectra compared with that used for the time history analyses. The consequences of this on the performance of building parts and components is the subject of a new study just beginning at BRANZ, covering this and other issues related to Performance `. Deflection profiles and envelopes were plotted for several buildings and are presented in Appendix 3. These were not particularly relevant for the building parts project so were not investigated fully. Relative accelerations (translational and rotational) at the master nodes obtained from “Yieldextracter.exe” were transformed to the edge nodes of the building and converted to total accelerations as shown in Figure 5.
xm
xeym
d
Master node position
Edge node position
d)yy()xx(x m,rm,gm,rm,ge,t ×+±+= &&&&&&&&&& .
where: e,tx&& = total x translational acceleration at edge node
m,gx&& = ground x translational acceleration at master node
m,rx&& = relative x translational acceleration at master node
m,gy&& = ground y rotational acceleration at master node
m,ry&& = relative x rotational acceleration at master node
Figure 5. Translation of accelerations to building edges.
23

The maximum acceleration value for each floor, under each excitation applied in each orthogonal direction, were then plotted to give a profile of the maximum floor accelerations up the building. Examples are shown in Appendix 4. To provide a site-independent reference point, the plots were normalised to C(0) (effectively the peak ground acceleration), where C(0) is defined (SNZ, 2000) as:
C(0) = Ch(T=0).Z.R.N(T,D).
The acceleration time histories obtained from “Yieldextracter.exe” were used as the input record to generate floor response spectra for each ground motion record at selected levels up the building. Plots of these (generally using 5% damping) are included in Appendix 6.
5. DEVELOPMENT OF PROVISIONS FOR PARTS IN THE DRAFT
STANDARD
5.1 Background
A study of the parts provisions contained in several significant overseas standards (Table 4) shows that they all calculate a force coefficient for the part by means of a multifactor equation. Generally such equations contain terms quantifying the ground motion for the site, the influence of the building’s response (depending on period), the effect of the part itself (depending on flexibility or ductility), and a risk or importance factor for the part. The coefficient (which effectively is acceleration) is then multiplied by the operating weight of the part to give the force that the part must be designed to resist. All of the standards studied adopt a conventional force-based procedure to determine earthquake design actions on parts. There is concern that such an approach is not be a good predictor of damage to building parts, essentially a mismatch between calculated/predicted, and observed/measured behaviour. The anomaly may be caused by high floor acceleration pulses of very short duration and with very small displacements, often caused by building response in the higher modes. As well as being found in both elastic and inelastic analyses, such phenomena have been observed in real floor response records (eg Naeim, 1996), but do not necessarily result in actual damage to building parts. There is a perception that the parts provisions of the current version of NZS 4203 (SNZ, 1992) are difficult to apply, particularly since they require detailed information from the seismic design of each specific building. This is a major impediment to the designer or manufacturer of the “off-the-shelf” items that account for a significant portion of parts and components that are installed in new buildings. Also, the treatment of floor accelerations where the building has been designed for overstrength is not clear. The default value of µ = 1.0 used in the equation of floor acceleration to account for overstrength, which is almost universally used by designers, can be shown (Kelly, 2001) to result in an overestimation of floor accelerations by a factor of up to 3. The response to the issues raised above is a simple multifactor equation to determine the horizontal force on the part. It may take the form:
pppfph WRCCCF )0(= ,
where: C(0) is the site hazard coefficient, with period T = 0, Cf is the floor acceleration coefficient, Cp is the part response coefficient, Rp is the part risk factor, Wp is the weight of the part.
The factors making up the equation are described in the next few sections.
24
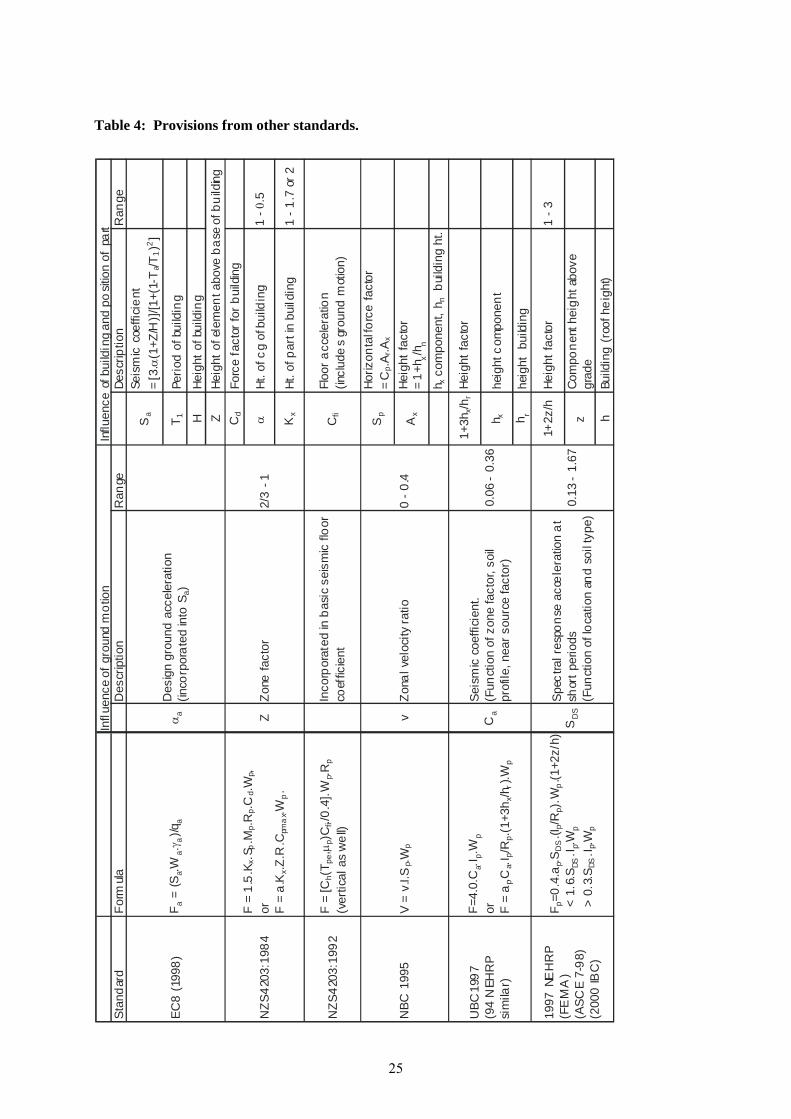
Table 4: Provisions from other standards.
Stan
dard
Form
ulaD
escr
iptio
nR
ange
Desc
riptio
nR
ange
Sa
Seis
mic
coe
ffici
ent
= [3
.α(1
+Z/H
)]/[1
+(1-
Ta/T
1)2
]
T 1Pe
riod
of b
uild
ing
HHe
ight
of b
uild
ing
ZHe
ight
of e
lem
ent a
bove
bas
e of
bui
lding
Cd
Forc
e fa
ctor
for b
uild
ing
αHt
. of c
g of
bui
ldin
g1
- 0.5
Kx
Ht. o
f par
t in
build
ing
1 - 1
.7 o
r 2
NZS
4203
:199
2F
= [C
h(T p
e,µp)
Cfi./
0.4]
.Wp.R
p
(ver
tical
as
wel
l)In
corp
orat
ed in
bas
ic s
eism
ic fl
oor
coef
ficie
ntC
fi
Floo
r acc
eler
atio
n(in
clud
es
grou
nd m
otio
n)
Sp
Horiz
onta
l forc
e fa
ctor
=
Cp.A
r.Ax
Ax
Heig
ht fa
ctor
= 1+
h x/h n
h x c
ompo
nent
, hn
build
ing
ht.
1+3h
x/hr
Heig
ht fa
ctor
h xhe
ight
com
pone
nt
h rhe
ight
bui
lding
1+2z
/hHe
ight
fact
or1
- 3
zCo
mpo
nent
hei
ght a
bove
gr
ade
hBu
ildin
g (r
oof h
eigh
t)
0 - 0
.4
EC8
(199
8)α
aD
esig
n gr
ound
acc
eler
atio
n (in
corp
orat
ed in
to S
a)
NBC
199
5v
Zona
l vel
ocity
ratio
V =
v.I.S
p.Wp
F a =
(Sa.W
a.γa)/q
a
Zone
fact
or2/
3 - 1
Influ
ence
of g
roun
d m
otio
nIn
fluen
ce o
f bui
ldin
g an
d po
sitio
n of
par
t
Z Ca
Seis
mic
coe
ffici
ent.
(F
unct
ion
of z
one
fact
or, s
oil
prof
ile, n
ear s
ourc
e fa
ctor
)
F =
1.5.
K x.S
p.M
p.Rp.C
d.Wp,
or
F =
a.K
x.Z.R
.Cpm
ax.W
p.
1997
NE
HR
P
(FE
MA
)(A
SCE
7-98
)(2
000
IBC
)
F p=0
.4.a
p.SD
S.(I
p/Rp)
.Wp.(1
+2z/
h) <
1.6
.SDS
.I p.W
p
> 0
.3.S
DS.I p
.Wp
F=4.
0.C
a.Ip.W
por
F
= a
p.Ca.I
p/Rp.(
1+3h
x/hr)
.Wp
UBC
1997
(94
NEH
RP
sim
ilar)
NZS
4203
:198
4
Spec
tral r
espo
nse
acce
lera
tion
at
shor
t per
iods
(F
unct
ion
of lo
catio
n an
d so
il ty
pe)
SD
S
0.06
- 0.
36
0.13
- 1.
67
25
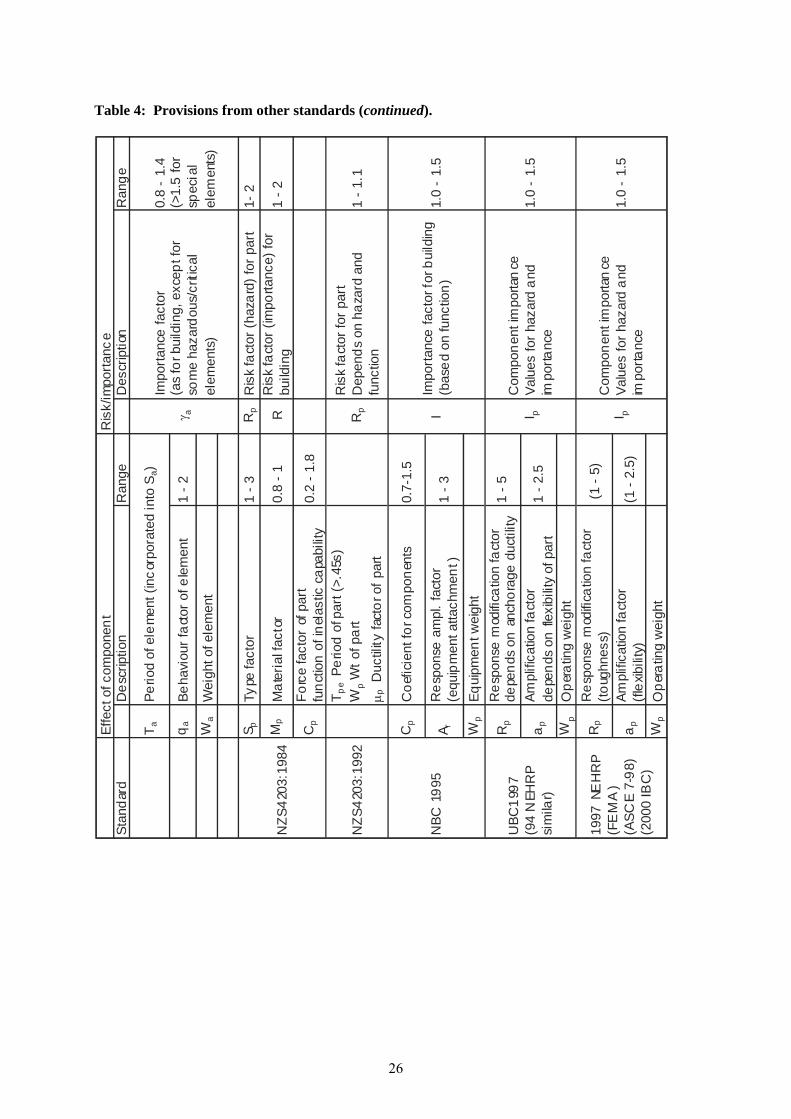
Table 4: Provisions from other standards (continued).
Stan
dard
Des
crip
tion
Ran
geD
escr
iptio
nR
ange
T aPe
riod
of e
lem
ent (
inco
rpor
ated
into
Sa)
q aBe
havi
our f
acto
r of e
lem
ent
1 - 2
Wa
Wei
ght o
f ele
men
t
S pTy
pe fa
ctor
1 - 3
Rp
Ris
k fa
ctor
(haz
ard)
for p
art
1- 2
Mp
Mat
eria
l fac
tor
0.8
- 1R
Ris
k fa
ctor
(im
porta
nce)
for
build
ing
1 - 2
Cp
Forc
e fa
ctor
of p
art
func
tion
of in
elas
tic c
apab
ility
0.2
- 1.8
NZS
4203
:199
2T p
e Pe
riod
of p
art (
>.45
s)W
p W
t of p
art
µ p D
uctil
ity fa
ctor
of p
art
Rp
Ris
k fa
ctor
for p
art
Dep
ends
on
haza
rd a
nd
func
tion
1 - 1
.1
Cp
Coe
ficie
nt fo
r com
pone
nts
0.7-
1.5
A rR
espo
nse
ampl
. fac
tor
(equ
ipm
ent a
ttach
men
t )1
- 3
Wp
Equi
pmen
t wei
ght
Rp
Res
pons
e m
odifi
catio
n fa
ctor
depe
nds
on a
ncho
rage
duc
tility
1 - 5
a pAm
plifi
catio
n fa
ctor
de
pend
s on
flex
ibili
ty o
f par
t1
- 2.5
Wp
Ope
ratin
g w
eigh
t
Rp
Res
pons
e m
odifi
catio
n fa
ctor
(toug
hnes
s) (1
- 5)
a pAm
plifi
catio
n fa
ctor
(flex
ibili
ty)
(1 -
2.5)
Wp
Ope
ratin
g w
eigh
t
0.8
- 1.
4(>
1.5
for
spec
ial
elem
ents
)
I Im
porta
nce
fact
or fo
r bui
ldin
g(b
ased
on
func
tion)
1.0
- 1.
5
NZS
4203
:198
4
NBC
199
5
Ris
k/im
porta
nce
Effe
ct o
f com
pone
nt
γ a
Impo
rtanc
e fa
ctor
(as
for b
uild
ing,
exc
ept f
or
som
e ha
zard
ous/
critic
al
elem
ents
)
I pC
ompo
nent
impo
rtan
ceVa
lues
for h
azar
d an
d im
porta
nce
1.0
- 1.
5
1.0
- 1.
5I p
Com
pone
nt im
porta
nce
Valu
es fo
r haz
ard
and
impo
rtanc
e
UBC
1997
(94
NEH
RP
sim
ilar)
1997
NE
HR
P
(FE
MA
)(A
SCE
7-98
)(2
000
IBC
)
26

5.2 Site hazard
It is necessary to have a suitable reference point for the calculation of the forces on a part. The maximum value of the input ground motion record (effectively the peak ground acceleration) is one possible parameter, and was used by Rodriguez et al (2000) in a study of floor accelerations. However, this is a variable quantity depending on the record chosen as input to a time history analysis. A well defined value, readily available to the designer, is the level of earthquake hazard at the site, defined by the draft Loading Standard (SNZ, 2000) as the elastic site hazard coefficient at zero period, C(0) for the appropriate return period. This is determined from equation 3.1 in Section 3 of the draft standard as:
C(T) = Ch(T) Z R N(T,D), (Eq. 3.1)
where, Ch(T) is the spectral shape factor (Ch(0) for zero period), Z is the hazard factor, R is the return period factor Rs or Ru for the appropriate limit state, N (T, D) is the near-fault factor (equal to 1.0 for zero period).
To provide this reference point independent of site conditions, C(0) was used to normalise the floor accelerations as described above.
5.3 Building response
The influence of the building response is described by the floor acceleration coefficient, Cf. Plots of floor accelerations obtained during the project, derived as described in Section 4 above, are included as Appendix 5. Three representative examples are reproduced in Figure 6. The six lines on each plot represent response to three earthquake records, each with its principal component applied to the building in the two orthogonal directions. To obtain the floor acceleration independently of the input ground motion, the values were normalised against the elastic site hazard coefficient, C(0) thus the plots depict directly the amplification by the building structure.
27

0123456789
101112131415161718192021
0 1 2 3 4 5 6
Acceleration (x C(0))
Hei
ght (
stor
ies)
0
1
2
3
4
5
6
7
8
9
10
11
0 1 2 3 4
Acceleration (x C(0))H
eigh
t (st
orie
s)
20 storey reinforced concrete building,
µ = 3, Wellington, Class C soil.
10 storey reinforced concrete building,
µ = 6, Wellington, Class C soil.
0
1
2
3
4
0 1 2 3Acceleration (x C(0))
Hei
ght (
stor
ies)
3 storey reinforced concrete building,
µ = 3, Wellington, Class C soil.
Figure 6 Representative floor acceleration plots.
The plots of Figure 6 may be compared with the data shown on Figure 7 which has been reproduced from Drake and Bachman (1995). Each dot represents the peak floor acceleration recorded in one of 150 Californian buildings subjected to peak ground accelerations greater than 0.25g in one of 16 earthquake events between the 1971 San Fernando Earthquake, and the 1994 Northridge
28
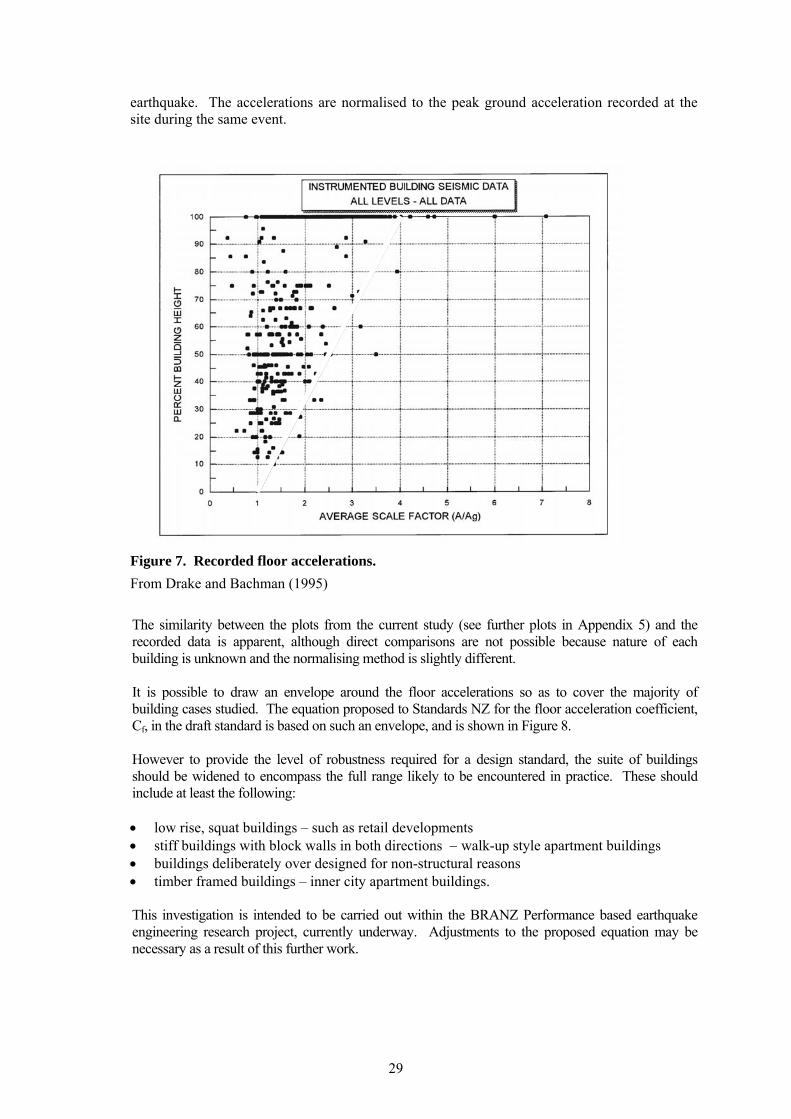
earthquake. The accelerations are normalised to the peak ground acceleration recorded at the site during the same event.
Figure 7. Recorded floor accelerations. From Drake and Bachman (1995)
The similarity between the plots from the current study (see further plots in Appendix 5) and the recorded data is apparent, although direct comparisons are not possible because nature of each building is unknown and the normalising method is slightly different. It is possible to draw an envelope around the floor accelerations so as to cover the majority of building cases studied. The equation proposed to Standards NZ for the floor acceleration coefficient, Cf, in the draft standard is based on such an envelope, and is shown in Figure 8. However to provide the level of robustness required for a design standard, the suite of buildings should be widened to encompass the full range likely to be encountered in practice. These should include at least the following: • low rise, squat buildings – such as retail developments • stiff buildings with block walls in both directions − walk-up style apartment buildings • buildings deliberately over designed for non-structural reasons • timber framed buildings – inner city apartment buildings.
This investigation is intended to be carried out within the BRANZ Performance based earthquake engineering research project, currently underway. Adjustments to the proposed equation may be necessary as a result of this further work.
29
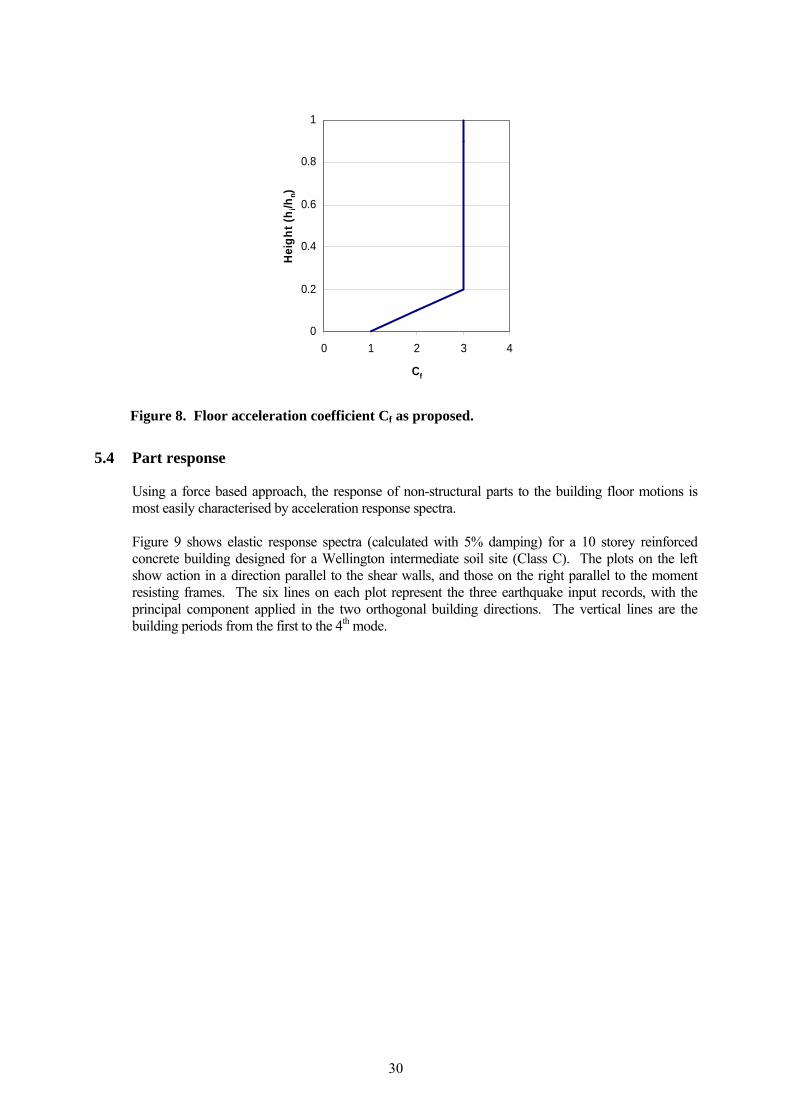
0
0.2
0.4
0.6
0.8
1
0 1 2 3 4
Cf
Hei
ght (
h i/h
n)
Figure 8. Floor acceleration coefficient Cf as proposed.
5.4 Part response
Using a force based approach, the response of non-structural parts to the building floor motions is most easily characterised by acceleration response spectra. Figure 9 shows elastic response spectra (calculated with 5% damping) for a 10 storey reinforced concrete building designed for a Wellington intermediate soil site (Class C). The plots on the left show action in a direction parallel to the shear walls, and those on the right parallel to the moment resisting frames. The six lines on each plot represent the three earthquake input records, with the principal component applied in the two orthogonal building directions. The vertical lines are the building periods from the first to the 4th mode.
30

Figure 9. Floor acceleration response spectra.
Floor acceleration spectra are very sensitive to the level of damping used in their derivation. As an example, Figure 10 shows the results of a comparison between various levels of damping for one of the 3 storey concrete buildings. For the purpose of this study 5% damping was used, as has been used for other similar studies. However, further studies would be required to confirm the appropriate damping level for use with the design of non-structural parts. It may be appropriate to use different spectra for different types of parts. The spectra in Appendix 6 were all produced using 5% damping.
31

(RC3icwlxpthpdlu. Parallel to frames)
0
1
2
3
4
5
6
0 1 2 3 4Period (sec)
Acc
eler
atio
n (g
)
7% damped5%damped2% damped1st mode period
(RC3 iwclxpthpdlu. Perpendicular to frames)
0
1
2
3
4
5
6
0 1 2 3 4Period (sec)
Acc
eler
atio
n (g
)
7% damping5%damping2% damping1st mode period
Figure 10. Floor spectra with variable damping.
The plots of Figure 9 may be compared with the spectra of Figure 11, reproduced from Naeim (1996). These spectra were computed (at 5% damping) from floor accelerations measured at different levels in a range of instrumented buildings during the 1994 Northridge earthquake. The report was obtained from the Strong Motion Instrumentation Program (SMIP) run by the State of California, Department of Conservation, Division of Mines and Geology.
32

Roof (14th Floor)
8th Floor
2nd Floor
Basement level Acceleration response spectra
• Built in 1965 with the first floor spandrel girders modified by post-tensioning after the 1971 San Fernando earthquake.
• Moment resisting concrete frames in both directions.
• The geology of the site is alluvium.
• The building is situated 9 km from the epicentre.
• Plan dimensions of 209 ft x 125 ft.
• Structural members (beams, columns, walls and floor diaphragms) experienced moderate damage in the form of cracking.
• Damage was repaired by epoxy grouting.
• No damage to non-structural elements such as pipes, HVAC, air conditioning.
• The natural period of the structure in the direction described by the graphs opposite is about 2.6 seconds.
Figure 11. Performance of parts in Northridge earthquake.
(from Naeim, 1996)
The same trend is evident in the two figures, although the Northridge examples have lower accelerations because the ground motions were less intense than the actions used for the current study. In particular, the lack of “resonance” at the building first mode period is absent from both sets of spectra. This is an example of how the yielding of the building structure, particularly in the frame
33
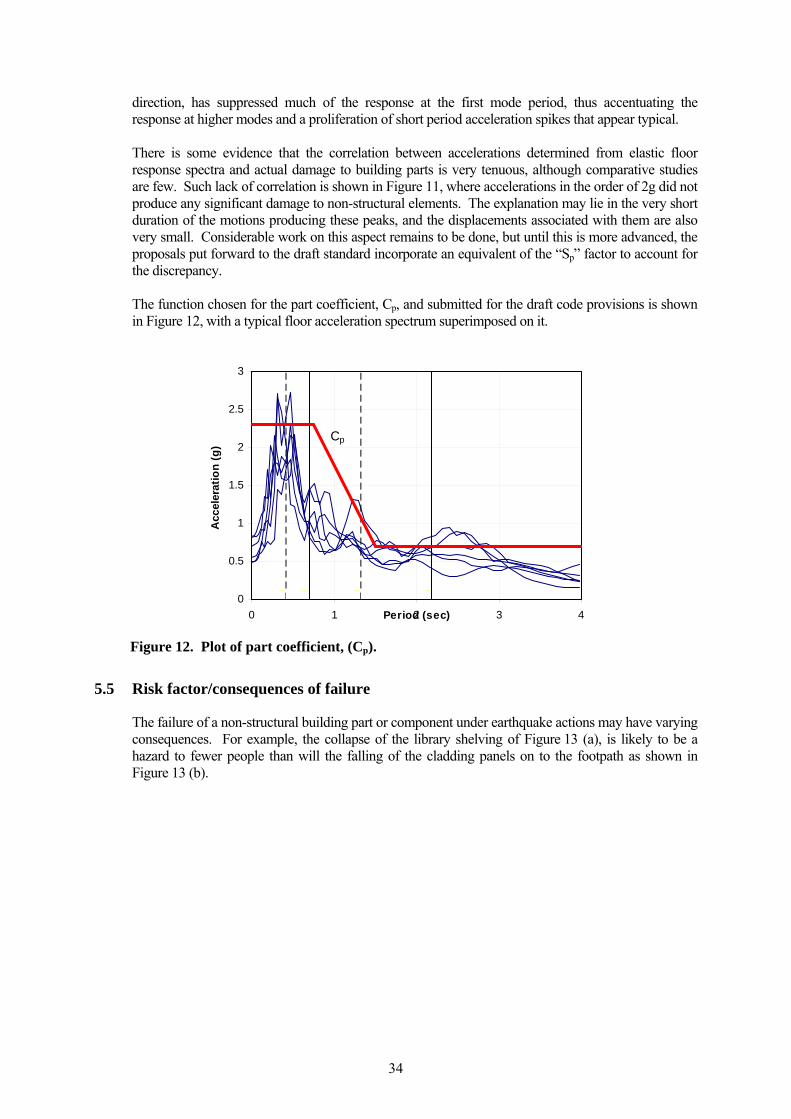
direction, has suppressed much of the response at the first mode period, thus accentuating the response at higher modes and a proliferation of short period acceleration spikes that appear typical.
There is some evidence that the correlation between accelerations determined from elastic floor response spectra and actual damage to building parts is very tenuous, although comparative studies are few. Such lack of correlation is shown in Figure 11, where accelerations in the order of 2g did not produce any significant damage to non-structural elements. The explanation may lie in the very short duration of the motions producing these peaks, and the displacements associated with them are also very small. Considerable work on this aspect remains to be done, but until this is more advanced, the proposals put forward to the draft standard incorporate an equivalent of the “Sp” factor to account for the discrepancy. The function chosen for the part coefficient, Cp, and submitted for the draft code provisions is shown in Figure 12, with a typical floor acceleration spectrum superimposed on it.
0
0.5
1
1.5
2
2.5
3
0 1 2 3Period (sec)
Acc
eler
atio
n (g
)
4
TTTT
Cp
Figure 12. Plot of part coefficient, (Cp).
5.5 Risk factor/consequences of failure
The failure of a non-structural building part or component under earthquake actions may have varying consequences. For example, the collapse of the library shelving of Figure 13 (a), is likely to be a hazard to fewer people than will the falling of the cladding panels on to the footpath as shown in Figure 13 (b).
34
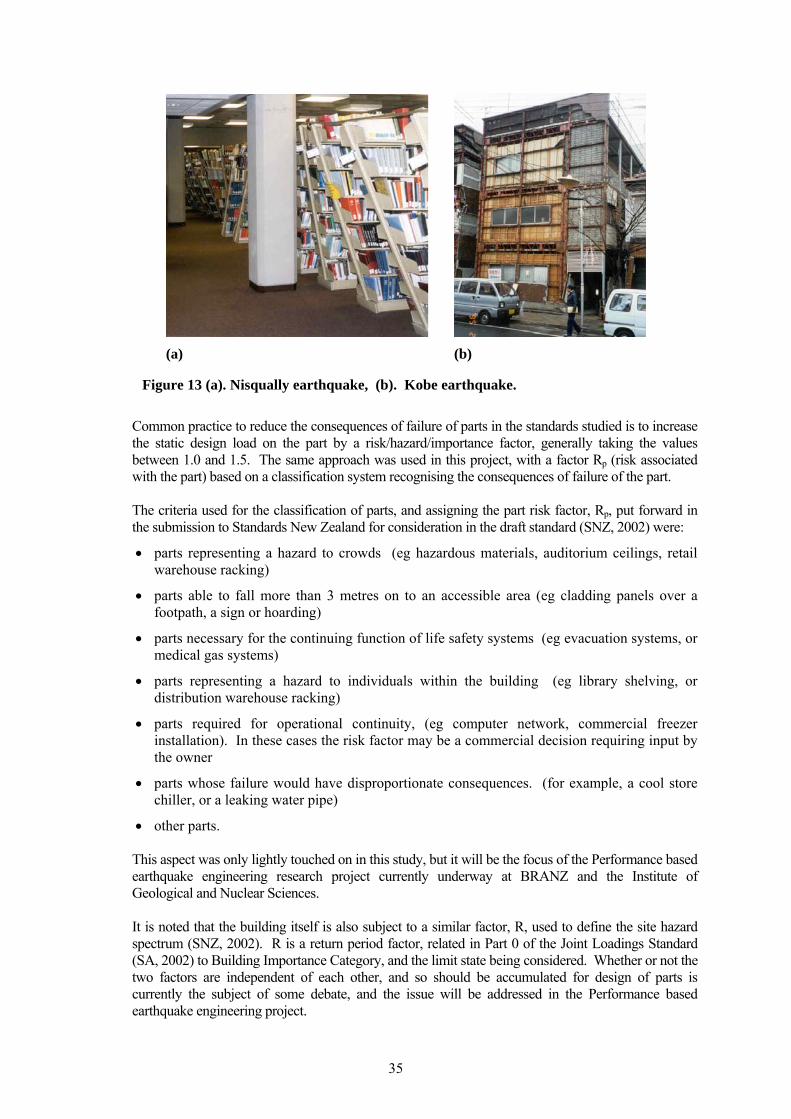
(a) (b)
Figure 13 (a). Nisqually earthquake, (b). Kobe earthquake.
Common practice to reduce the consequences of failure of parts in the standards studied is to increase the static design load on the part by a risk/hazard/importance factor, generally taking the values between 1.0 and 1.5. The same approach was used in this project, with a factor Rp (risk associated with the part) based on a classification system recognising the consequences of failure of the part. The criteria used for the classification of parts, and assigning the part risk factor, Rp, put forward in the submission to Standards New Zealand for consideration in the draft standard (SNZ, 2002) were:
• parts representing a hazard to crowds (eg hazardous materials, auditorium ceilings, retail warehouse racking)
• parts able to fall more than 3 metres on to an accessible area (eg cladding panels over a footpath, a sign or hoarding)
• parts necessary for the continuing function of life safety systems (eg evacuation systems, or medical gas systems)
• parts representing a hazard to individuals within the building (eg library shelving, or distribution warehouse racking)
• parts required for operational continuity, (eg computer network, commercial freezer installation). In these cases the risk factor may be a commercial decision requiring input by the owner
• parts whose failure would have disproportionate consequences. (for example, a cool store chiller, or a leaking water pipe)
• other parts.
This aspect was only lightly touched on in this study, but it will be the focus of the Performance based earthquake engineering research project currently underway at BRANZ and the Institute of Geological and Nuclear Sciences. It is noted that the building itself is also subject to a similar factor, R, used to define the site hazard spectrum (SNZ, 2002). R is a return period factor, related in Part 0 of the Joint Loadings Standard (SA, 2002) to Building Importance Category, and the limit state being considered. Whether or not the two factors are independent of each other, and so should be accumulated for design of parts is currently the subject of some debate, and the issue will be addressed in the Performance based earthquake engineering project.
35

The submission to Standards New Zealand is reproduced in full in Appendix 7. This has since been modified by the committee, but remains the essence of the latest draft.
6. CONCLUSIONS
During the course of this study, the whole project team gained a high level of understanding and knowledge of the time history analysis of buildings responding inelastically to earthquake ground motions, and the resulting force and displacement induced actions on building parts. This was greatly facilitated by the exchanges of views both at Project Advisory Group meetings, and the copious email discussions that followed. Much of this knowledge has been channelled into the revisions to the new Joint Loading Standard, AS/NZS 1170.4. As a result of the study, the team was able to formulate recommendations to Standards New Zealand on procedures for Integrated Time History Analysis of building structures, and provisions for the design of building parts, both of which have been incorporated into the latest draft of the earthquake part of the Loading Standard (see Appendix 7). The draft Standard has been circulated for comment, and these comments are being considered by the drafting committee as the report goes to print. The literature review found that most international loading standards have adopted a force-based procedure to determine earthquake design actions on building parts and non-structural components. The important parameters common to most of the standards reviewed are: • the ground motion of the site • the influence of the building’s response (depending on the period and/or ductility of the
structure) • the effect of the part itself (depending on its flexibility or ductility) • and a risk or importance factor for the part (or consequences of failure).
The resulting coefficient (which effectively is an acceleration) is then multiplied by the operating weight of the part to give the force that the part must be designed to resist. An empirical study was formulated to quantify those parameters in a simple manner, suitable for use in a routine design situation. To provide a vehicle for the study, a suite of code compliant buildings was designed for Auckland and Wellington sites on two different types of soil. The buildings consisted of steel and concrete structures, of 3, 10, and 20 stories, with moment-resisting frames in one direction, and shearwalls or braced frames in the other, and of regular and irregular plan layouts. These buildings are now available in electronic format for use with further studies under this or unrelated projects, and have already been used by a post-graduate student at Auckland University. The next steps used in the study were:
• earthquake ground motion records were selected, scaled and applied to the structures using an integrated time history analysis program
• the output of these analyses provided a means for developing floor acceleration profiles, and floor response spectra
• this information was used to develop force based provisions for determining earthquake loading on building parts.
A minimum of three ground-motion records are required to adequately represent the building’s response to the earthquake hazard for the site. Each record should have a similar seismic signature (eg: magnitude, distance, slip characteristics and soil class) to the significant events contributing to the design spectra at the target period, and for the return period associated with the limit state being considered. Each record requires scaling to match the target hazard spectra as defined by the loading
36
standard. The scaling process evolved into an adjustment to each record to match the frequency content of the target spectra, followed by an adjustment to the family of 3 records to ensure that at least one record exceeded the target over the period range of interest. For the purpose of estimating floor accelerations and the resulting inertial forces on buildings parts, analysis models should be based on actual material properties, rather than the ideal properties normally used in normal structural analysis. This was done to give an upper bound to the forces on the parts. Also, account should be taken of the likely amount of concrete cracking, and its effect on structural stiffness, and dynamic response. This will give an upper bound on interstorey drifts, which are particularly relevant for parts connected to the structure at two different levels. It was also found that a three-dimensional analysis is required to adequately simulate the torsional response of irregular building structures. For the suite of buildings studied, the floor accelerations all showed a similar pattern, with maximum values over the lower third to half height of the building, and another peak at the top. This pattern can be simply but approximately “enveloped” by a function with a value of one (times the ground acceleration) at the base of the building, increasing to a value of three at a fifth of the building height, and then constant to the top. Similarly, the floor response spectra all showed peak values at short periods of less than half a second, which is typically the period of most building parts. This period is in most cases a lot less than the fundamental period of the supporting building structure, and importantly, the expected “resonance” at the first mode period of the building, which is a feature of some existing standards, was not found. However, both of these conclusions need to be further tested using a wider range of building and part dynamic parameters to achieve the level of robustness required of a formal design standard. Thus, much work remains to complete the project and achieve the required level of robustness. In particular the issues to be further investigated are:
• widening the range of buildings studied to include over-designed buildings, squat stiff
buildings, and buildings with differing foundation levels • more rigorously quantifying the effects of parts damping and ductility, and investigating
parts with very different dynamic characteristics such as water tanks with “sloshing” contents
• rationalising the risk and consequences of failure of parts.
These outstanding issues have been taken up and are being addressed by the Performance based earthquake engineering project.
37

7. REFERENCES
American Society of Civil Engineers. 1998. Minimum design loads for buildings and other structures. ASCE 7-98. American Society of Civil Engineers, Virginia, USA.
ATC 1996, Seismic Evaluation and Retrofit of Concrete Buildings, ATC 40. Applied Technology Council, Redwood City, CA
Bell D., Davidson, B.J. 2002. Issues arising from designs using the 2001 draft NZ/Australia Earthquake Loading Standard. Proceedings, NZ Society for Earthquake Engineering Annual Conference, Napier, 15 - 17 March 2002, Paper 3.4.
Boore, D.M., Joyner, W.B. and Fumal, T.E. (1997). Equations for Estimating Horizontal Response Spectra and Peak Acceleration from Western North American Earthquakes: A Summary of Recent Work. Seismological Research Letters, 68(1), pp.128-153.
British Standards Institute (BSI), 1996. Eurocode 8: Design provisions for earthquake resistance of structures. General rules. Seismic actions and general requirements for structures DD ENV 1998-1-1:1996. British Standards Institute, London, UK.
Canadian Commission on Building and Fire Codes (CCB) 1995. The National Building Code of Canada. NBC 1995. Canadian Commission on Building and Fire Codes, Ottawa, Canada.
Carr A.J. 2001. Ruaumoko Three Dimensional Time History Analysis Program. University of Canterbury, Christchurch, New Zealand.
Clough, R.W., and Penzien, J. 1993. Dynamics of structures. 2nd edition. McGraw-Hill, New York, USA.
Drake, RM, Bachman, RE. 1995. Interpretation of instrumented building seismic data and implications for building codes. Proceedings, Structural Engineers Association of California Annual Convention, USA.
FEMA 1997. NEHRP Guidelines for the Seismic Rehabilitation of Buildings, FEMA-273. Applied Technology Council (ATC), Redwood City, California, Building Seismic Safety Council (BSSC), Washington DC, and Federal Emergency Management Agency (FEMA), Washington, DC, USA.
FEMA 1997a. NEHRP Recommended provisions for the development of seismic regulations for new buildings and other structures. FEMA Report 302. Applied Technology Council (ATC), Redwood City, California, and Federal Emergency Management Agency (FEMA), Washington DC, USA.
HERA, 1995. Seismic design procedures for steel structures. Report R4-76. NZ Heavy Engineering Research Association, Manukau City.
International Code Council (ICC). 2000. 2000 International Building Code. The International Code Council, Falls Church, Virginia, USA.
Kelly, T.E. 2001. Personal communication.
King, A.B., Davidson, B.J., McVerry, G.M. 2002. Inelastic response of buildings subject to revised code ground motion. Proceedings, NZ Society for Earthquake Engineering Annual Conference, Napier, 15 - 17 March 2002, Paper 3.3.
Naeim, F. 1996. Performance of extensively instrumented buildings during the January 17, 1994
38

Northridge Earthquake. John A Martin and Associates Inc, 1212 S Flower Street, Los Angeles, USA.
New Zealand Government, 1992. The Building Regulations. First schedule, The Building Code. Government Printing Office, Wellington, New Zealand.
Paulay, T, and Priestley, M.J.N. 1992. Seismic Design of Reinforced Concrete and Masonry Buildings. John Wiley & Sons, Inc., New York, USA.
Rodriguez, M, Restrepo, J.I., Carr, A.J. 2000. Earthquake resistant precast concrete buildings: Floor accelerations in buildings. Department of Civil Engineering, University of Canterbury, Research Report 2000-6, Christchurch, New Zealand.
Sabetta, F. and Pugliese, A. 1987. Attenuation from Peak Horizontal Acceleration and Velocity from Italian Strong-Motion Records. Bulletin of the Seismological Society of America, vol. 77, pp. 1491-1513.
Sharpe, R.D. 1974. The seismic response of inelastic structures. PhD thesis. University of Canterbury, Christchurch, New Zealand.
Shelton R.H., Park S.G., King A.B., 2002. Earthquake Response of Building Parts. Proceedings, New Zealand Society for Earthquake Engineering Annual Conference, Napier, 15 - 17 March 2002, Paper 5.3.
Spudich, P., Fletcher, J.B., Hellweg, M., Boatwright, J., Sullivan, C., Joyner, W.B., Hanks, T.C., Boore, D.M., McGarr, A., Baker, L.M., and Lindh, A.G. 1997. SEA96 – A New Predictive Relation for Earthquake Ground Motions in Extensional Tectonic Regimes. Seismological Research Letters, 68(1), pp.190-198.
Standards Association of New Zealand, (SANZ) 1984. Code of practice for general design and design loading for buildings. NZS 4303. Standards Association of New Zealand. Wellington.
Standards New Zealand (SNZ) 1992. General Structural Design and Design Loadings for Buildings (The Loadings Standard). NZS 4203. Standards New Zealand, Wellington.
Standards New Zealand (SNZ) 1992a. Steel structures standard. NZS 3404. Standards New Zealand, Wellington.
Standards New Zealand (SNZ) 1995. Concrete structures standard Part 1 – The design of concrete structures. NZS 3101. Standards New Zealand, Wellington.
Standards New Zealand (SNZ) 2002. Structural design actions Part 4 Earthquake Actions. Draft DR 1170.4/PPC2. Post Public Comments Draft 2. Standards New Zealand, Wellington.
Standards New Zealand (SNZ) 2003. Structural design actions Part 4 Earthquake Actions. Draft DR PPCD 10.2. Post Public Comments Draft 10. Standards New Zealand, Wellington.
Standards Australia/Standards New Zealand, 2000. Structural design – General requirements and design actions. Part 4: Earthquake actions. DR00902-4 (Issue for comment, 17/11/00). Standards Australia, Homebush, Australia.
Standards Australia (SA), 2002. Structural design actions. Part 0: General principles AS/NZS 1170.0. Standards Australia, Homebush, Australia.
39

APPENDICES Appendix 1: Building details ..................................................................................................41 Appendix 2: Pushover plots.................................................................................................... 44 Appendix 3: Inter-storey drifts ............................................................................................... 60 Appendix 4: Deflection profiles ............................................................................................. 66 Appendix 5: Floor acceleration plots...................................................................................... 68 Appendix 6: Floor response spectra ....................................................................................... 75 Appendix 7: Submission on parts to Standards New Zealand................................................ 91
40
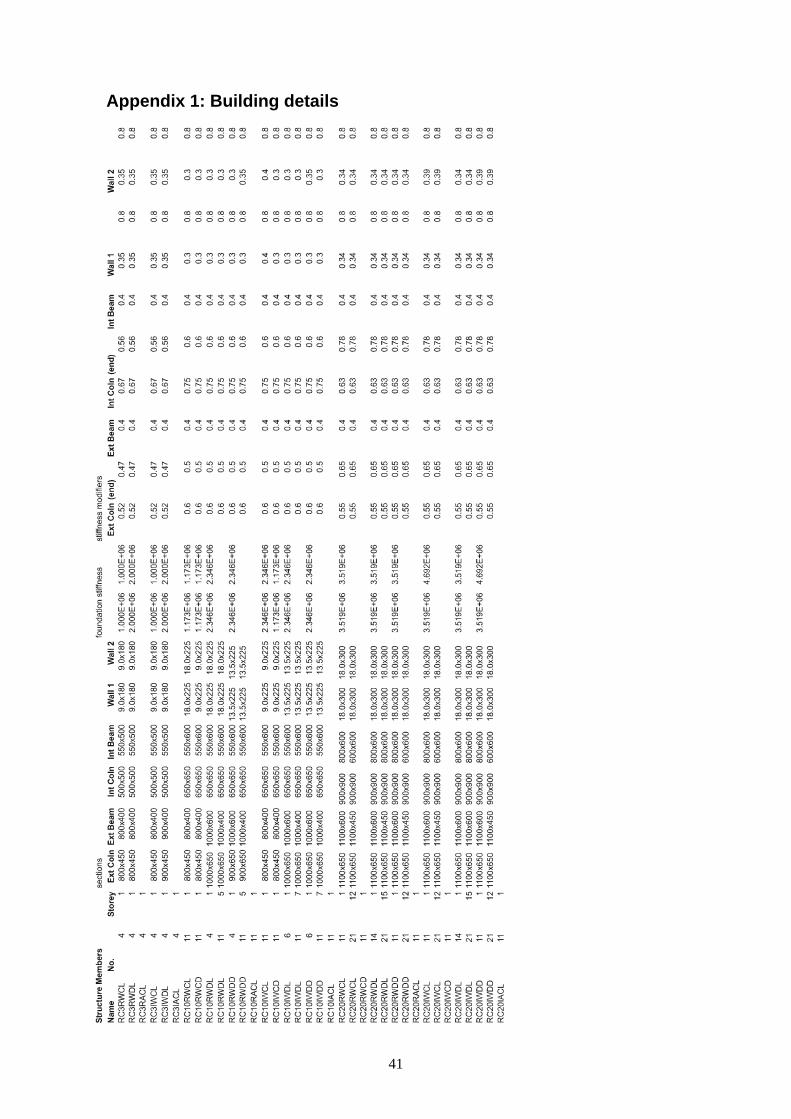
Appendix 1: Building details
41
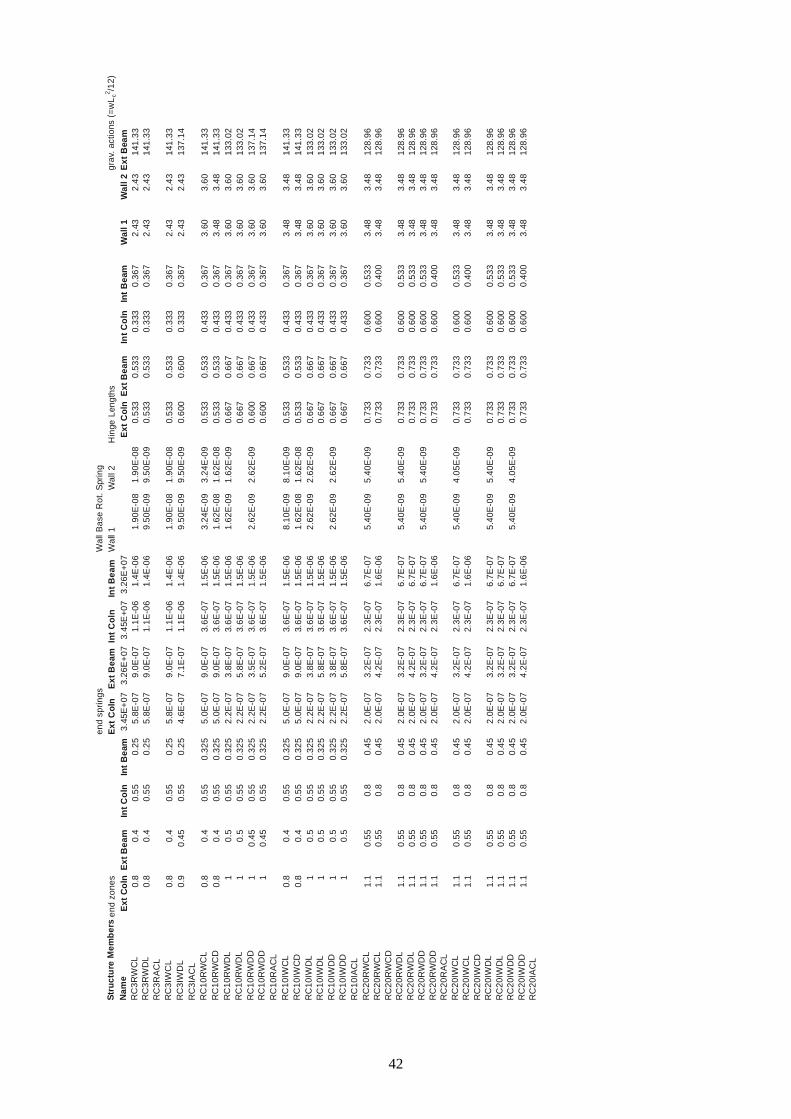
end
sprin
gsW
all B
ase
Rot
. Spr
ing
end
zone
sEx
t Col
nEx
t Bea
mIn
t Col
nIn
t Bea
mW
all 1
Wal
l 2H
inge
Len
gths
grav
. act
ions
(=w
L c2 /1
2)Ex
t Col
nEx
t Bea
mIn
t Col
nIn
t Bea
m3.
45E+
073.
26E+
073.
45E
+07
3.26
E+0
7Ex
t Col
nEx
t Bea
mIn
t Col
nIn
t Bea
mW
all 1
Wal
l 2Ex
t Bea
m0.
80.
40.
550.
255.
8E-0
79.
0E-0
71.
1E-0
61.
4E-0
61.
90E
-08
1.90
E-0
80.
533
0.53
30.
333
0.36
72.
432.
4314
1.33
0.8
0.4
0.55
0.25
5.8E
-07
9.0E
-07
1.1E
-06
1.4E
-06
9.50
E-0
99.
50E
-09
0.53
30.
533
0.33
30.
367
2.43
2.43
141.
33
0.8
0.4
0.55
0.25
5.8E
-07
9.0E
-07
1.1E
-06
1.4E
-06
1.90
E-0
81.
90E
-08
0.53
30.
533
0.33
30.
367
2.43
2.43
141.
330.
90.
450.
550.
254.
6E-0
77.
1E-0
71.
1E-0
61.
4E-0
69.
50E
-09
9.50
E-0
90.
600
0.60
00.
333
0.36
72.
432.
4313
7.14
0.8
0.4
0.55
0.32
55.
0E-0
79.
0E-0
73.
6E-0
71.
5E-0
63.
24E
-09
3.24
E-0
90.
533
0.53
30.
433
0.36
73.
603.
6014
1.33
0.8
0.4
0.55
0.32
55.
0E-0
79.
0E-0
73.
6E-0
71.
5E-0
61.
62E
-08
1.62
E-0
80.
533
0.53
30.
433
0.36
73.
483.
4814
1.33
10.
50.
550.
325
2.2E
-07
3.8E
-07
3.6E
-07
1.5E
-06
1.62
E-0
91.
62E
-09
0.66
70.
667
0.43
30.
367
3.60
3.60
133.
021
0.5
0.55
0.32
52.
2E-0
75.
8E-0
73.
6E-0
71.
5E-0
60.
667
0.66
70.
433
0.36
73.
603.
6013
3.02
10.
450.
550.
325
2.2E
-07
3.5E
-07
3.6E
-07
1.5E
-06
2.62
E-0
92.
62E
-09
0.60
00.
667
0.43
30.
367
3.60
3.60
137.
141
0.45
0.55
0.32
52.
2E-0
75.
2E-0
73.
6E-0
71.
5E-0
60.
600
0.66
70.
433
0.36
73.
603.
6013
7.14
0.8
0.4
0.55
0.32
55.
0E-0
79.
0E-0
73.
6E-0
71.
5E-0
68.
10E
-09
8.10
E-0
90.
533
0.53
30.
433
0.36
73.
483.
4814
1.33
0.8
0.4
0.55
0.32
55.
0E-0
79.
0E-0
73.
6E-0
71.
5E-0
61.
62E
-08
1.62
E-0
80.
533
0.53
30.
433
0.36
73.
483.
4814
1.33
10.
50.
550.
325
2.2E
-07
3.8E
-07
3.6E
-07
1.5E
-06
2.62
E-0
92.
62E
-09
0.66
70.
667
0.43
30.
367
3.60
3.60
133.
021
0.5
0.55
0.32
52.
2E-0
75.
8E-0
73.
6E-0
71.
5E-0
60.
667
0.66
70.
433
0.36
73.
603.
6013
3.02
10.
50.
550.
325
2.2E
-07
3.8E
-07
3.6E
-07
1.5E
-06
2.62
E-0
92.
62E
-09
0.66
70.
667
0.43
30.
367
3.60
3.60
133.
021
0.5
0.55
0.32
52.
2E-0
75.
8E-0
73.
6E-0
71.
5E-0
60.
667
0.66
70.
433
0.36
73.
603.
6013
3.02
1.1
0.55
0.8
0.45
2.0E
-07
3.2E
-07
2.3E
-07
6.7E
-07
5.40
E-0
95.
40E
-09
0.73
30.
733
0.60
00.
533
3.48
3.48
128.
961.
10.
550.
80.
452.
0E-0
74.
2E-0
72.
3E-0
71.
6E-0
60.
733
0.73
30.
600
0.40
03.
483.
4812
8.96
1.1
0.55
0.8
0.45
2.0E
-07
3.2E
-07
2.3E
-07
6.7E
-07
5.40
E-0
95.
40E
-09
0.73
30.
733
0.60
00.
533
3.48
3.48
128.
961.
10.
550.
80.
452.
0E-0
74.
2E-0
72.
3E-0
76.
7E-0
70.
733
0.73
30.
600
0.53
33.
483.
4812
8.96
1.1
0.55
0.8
0.45
2.0E
-07
3.2E
-07
2.3E
-07
6.7E
-07
5.40
E-0
95.
40E
-09
0.73
30.
733
0.60
00.
533
3.48
3.48
128.
961.
10.
550.
80.
452.
0E-0
74.
2E-0
72.
3E-0
71.
6E-0
60.
733
0.73
30.
600
0.40
03.
483.
4812
8.96
1.1
0.55
0.8
0.45
2.0E
-07
3.2E
-07
2.3E
-07
6.7E
-07
5.40
E-0
94.
05E
-09
0.73
30.
733
0.60
00.
533
3.48
3.48
128.
961.
10.
550.
80.
452.
0E-0
74.
2E-0
72.
3E-0
71.
6E-0
60.
733
0.73
30.
600
0.40
03.
483.
4812
8.96
1.1
0.55
0.8
0.45
2.0E
-07
3.2E
-07
2.3E
-07
6.7E
-07
5.40
E-0
95.
40E
-09
0.73
30.
733
0.60
00.
533
3.48
3.48
128.
961.
10.
550.
80.
452.
0E-0
73.
2E-0
72.
3E-0
76.
7E-0
70.
733
0.73
30.
600
0.53
33.
483.
4812
8.96
1.1
0.55
0.8
0.45
2.0E
-07
3.2E
-07
2.3E
-07
6.7E
-07
5.40
E-0
94.
05E
-09
0.73
30.
733
0.60
00.
533
3.48
3.48
128.
961.
10.
550.
80.
452.
0E-0
74.
2E-0
72.
3E-0
71.
6E-0
60.
733
0.73
30.
600
0.40
03.
483.
4812
8.96
Stru
ctur
e M
embe
rsN
ame
RC
3RW
CL
RC
3RW
DL
RC
3RAC
LR
C3I
WC
LR
C3I
WD
LR
C3I
ACL
RC
10R
WC
LR
C10
RW
CD
RC
10R
WD
LR
C10
RW
DL
RC
10R
WD
DR
C10
RW
DD
RC
10R
AC
LR
C10
IWC
LR
C10
IWC
DR
C10
IWD
LR
C10
IWD
LR
C10
IWD
DR
C10
IWD
DR
C10
IAC
LR
C20
RW
CL
RC
20R
WC
LR
C20
RW
CD
RC
20R
WD
LR
C20
RW
DL
RC
20R
WD
DR
C20
RW
DD
RC
20R
AC
LR
C20
IWC
LR
C20
IWC
LR
C20
IWC
DR
C20
IWD
LR
C20
IWD
LR
C20
IWD
DR
C20
IWD
DR
C20
IAC
L
42

Col
umn
Gra
vSt
ruct
ure
Mem
bers
Fram
eEB
F1EB
F2Fr
ame
EBF1
EBF2
Nam
eSt
orey
Typ
Coln
End
Coln
Beam
End
Col
nIn
t col
nBe
amLi
nkB
race
Fdn
End
Col
nIn
t Col
nB
eam
Link
Bra
ceFd
nTy
pEn
dEn
dEn
dS
T3R
WC
L2
146
0UB7
4.6
460U
B74.
641
0UB
53.7
310U
C11
831
0UC
96.8
460U
B67
.10.
625
0UC
89.5
1173
000
310U
C11
831
0UC
96.8
460U
B67
.10.
625
0UC
89.5
1173
000
564
287
564
564
43
460U
B74.
646
0UB7
4.6
310U
B40
.431
0UC
96.8
310U
C96
.836
0UB
44.7
0.6
250U
C72
.931
0UC
96.8
310U
C96
.836
0UB
44.7
0.6
250U
C72
.9
ST3
RW
DL
21
610U
B125
610U
B125
530U
B92
.431
0UC
137
310U
C96
.853
0UB
92.4
0.6
310U
C96
.811
7300
031
0UC
137
310U
C96
.853
0UB
92.4
0.6
310U
C96
.811
7300
056
428
756
456
44
361
0UB1
0161
0UB1
0141
0UB
53.7
310U
C96
.831
0UC
96.8
410U
B59
.70.
625
0UC
72.9
310U
C96
.831
0UC
96.8
410U
B59
.70.
625
0UC
72.9
ST3
RW
DD
21
610U
B125
610U
B125
530U
B92
.431
0UC
118
310U
C96
.841
0UB
59.7
0.6
250U
C72
.911
7300
031
0UC
96.8
310U
C96
.841
0UB
59.7
0.6
250U
C72
.911
7300
056
428
756
456
44
361
0UB1
0161
0UB1
0141
0UB
53.7
310U
C11
831
0UC
96.8
310U
B40
.40.
620
0UC
59.3
310U
C96
.831
0UC
96.8
310U
B40
.40.
620
0UC
59.3
ST3
IWC
L2
146
0UB7
4.6
460U
B74.
641
0UB
53.7
310U
C13
731
0UC
96.8
460U
B67
.10.
625
0UC
89.5
1173
000
310U
C13
731
0UC
96.8
460U
B67
.10.
625
0UC
89.5
1173
000
564
287
1115
1115
43
460U
B74.
646
0UB7
4.6
310U
B40
.431
0UC
96.8
310U
C96
.831
0UB
46.2
0.6
250U
C72
.931
0UC
96.8
310U
C96
.831
0UB
46.2
0.6
250U
C72
.9
ST3
IWD
L2
161
0UB1
2561
0UB1
2553
0UB
92.4
310U
C15
831
0UC
96.8
530U
B82
.00.
631
0UC
96.8
1173
000
310U
C15
831
0UC
96.8
530U
B82
.00.
631
0UC
96.8
1173
000
564
287
1115
1115
43
610U
B101
610U
B101
410U
B53
.731
0UC
96.8
310U
C96
.841
0UB
53.7
0.6
250U
C72
.931
0UC
96.8
310U
C96
.841
0UB
53.7
0.6
250U
C72
.9
ST3
IWD
D2
170
0WB
130
700W
B130
530U
B92
.431
0UC
118
310U
C96
.836
0UB
56.7
0.6
250U
C72
.911
7300
031
0UC
118
310U
C96
.836
0UB
56.7
0.6
250U
C72
.911
7300
056
428
711
1511
154
370
0WB
130
700W
B130
410U
B53
.731
0UC
118
310U
C96
.831
0UB
40.4
0.6
200U
C59
.331
0UC
118
310U
C96
.831
0UB
40.4
0.6
200U
C59
.3
ST3
RA
CL
21
410U
B59.
741
0UB5
9.7
310U
B46
.225
0UC
89.5
360U
B50
.70.
525
0UC
72.9
1173
000
250U
C89
.536
0UB
50.7
0.5
250U
C72
.911
7300
056
428
756
456
44
341
0UB5
9.7
410U
B59.
731
0UB
40.4
250U
C89
.531
0UB
40.4
0.5
200U
C59
.325
0UC
89.5
310U
B32
.00.
520
0UC
59.3
ST3
IAC
L2
141
0UB5
9.7
410U
B59.
731
0UB
46.2
310U
C96
.831
0UB
46.2
0.5
250U
C72
.911
7300
031
0UC
96.8
310U
B46
.20.
525
0UC
72.9
1173
000
564
287
1115
1115
43
410U
B59.
741
0UB5
9.7
310U
B40
.431
0UC
96.8
310U
B40
.40.
520
0UC
59.3
310U
C96
.831
0UB
32.0
0.5
200U
C59
.3
ST1
0RW
CL
31
700W
B15
031
0UC
158
530U
B82
.035
0WC
280
310U
C96
.846
0UB
67.1
0.6
250U
C89
.511
7300
040
0WC
328
310U
C96
.846
0UB
67.1
0.6
250U
C89
.511
7300
015
4878
315
4815
486
470
0WB
115
310U
C11
846
0UB
82.1
350W
C19
731
0UC
96.8
360U
B50
.70.
625
0UC
72.9
400W
C21
231
0UC
96.8
360U
B50
.70.
625
0UC
72.9
87
700W
B11
531
0UC
118
460U
B67
.131
0UC
118
310U
C96
.831
0UB
40.4
0.6
200U
C52
.240
0WC
144
310U
C96
.831
0UB
40.4
0.6
200U
C52
.211
970
0WB
115
310U
C11
841
0UB
53.7
310U
C11
831
0UC
96.8
310U
B40
.40.
620
0UC
52.2
400W
C14
431
0UC
96.8
310U
B40
.40.
620
0UC
52.2
ST1
0RW
DL
11
800W
B19
240
0WC
270
610U
B12
550
0WC
414
310U
C96
.861
0UB
101
0.7
310U
C11
823
4600
050
0WC
414
310U
C96
.861
0UB
101
0.6
310U
C11
823
4600
015
4878
330
7030
703
280
0WB
192
400W
C27
061
0UB
125
500W
C41
431
0UC
96.8
530U
B82
.00.
631
0UC
96.8
500W
C41
431
0UC
96.8
530U
B82
.00.
631
0UC
96.8
64
800W
B16
840
0WC
212
610U
B10
150
0WC
267
310U
C96
.846
0UB
74.6
0.6
250U
C89
.550
0WC
267
310U
C96
.846
0UB
74.6
0.6
250U
C89
.58
780
0WB
168
400W
C21
253
0UB
82.0
500W
C22
831
0UC
96.8
460U
B74
.60.
625
0UC
89.5
500W
C22
831
0UC
96.8
460U
B74
.60.
625
0UC
89.5
119
800W
B16
840
0WC
212
460U
B67
.150
0WC
228
310U
C96
.836
0UB
56.7
0.6
250U
C72
.950
0WC
228
310U
C96
.836
0UB
56.7
0.6
250U
C72
.9S
T10R
WD
D1
180
0WB
192
400W
C27
061
0UB
125
400W
C32
831
0UC
96.8
460U
B67
.10.
625
0UC
89.5
1173
000
400W
C32
831
0UC
96.8
460U
B67
.10.
625
0UC
89.5
1173
000
1548
783
1548
1548
32
800W
B19
240
0WC
270
610U
B12
540
0WC
328
310U
C96
.836
0UB
56.7
0.6
250U
C72
.940
0WC
328
310U
C96
.836
0UB
56.7
0.6
250U
C72
.96
480
0WB
168
400W
C21
261
0UB
101
400W
C21
231
0UC
96.8
360U
B56
.70.
625
0UC
72.9
400W
C21
231
0UC
96.8
360U
B56
.70.
625
0UC
72.9
87
800W
B16
840
0WC
212
530U
B82
.040
0WC
212
310U
C96
.831
0UB
40.4
0.6
200U
C59
.340
0WC
144
310U
C96
.831
0UB
40.4
0.6
200U
C59
.311
980
0WB
168
400W
C21
246
0UB
67.1
400W
C21
231
0UC
96.8
310U
B40
.40.
620
0UC
59.3
400W
C14
431
0UC
96.8
310U
B40
.40.
620
0UC
59.3
ST1
0IW
CL
31
700W
B15
031
0UC
158
530U
B82
.040
0WC
328
310U
C96
.846
0UB
67.1
0.6
250U
C89
.523
4600
040
0WC
328
310U
C96
.846
0UB
67.1
0.6
250U
C89
.523
4600
015
4878
330
7030
706
470
0WB
115
310U
C11
846
0UB
82.1
400W
C21
231
0UC
96.8
360U
B56
.70.
625
0UC
72.9
400W
C21
231
0UC
96.8
360U
B56
.70.
625
0UC
72.9
87
700W
B11
531
0UC
118
460U
B67
.140
0WC
212
310U
C96
.831
0UB
40.4
0.6
200U
C52
.240
0WC
144
310U
C96
.831
0UB
40.4
0.6
200U
C52
.211
970
0WB
115
310U
C11
841
0UB
53.7
400W
C21
231
0UC
96.8
310U
B40
.40.
620
0UC
52.2
400W
C14
431
0UC
96.8
310U
B40
.40.
620
0UC
52.2
ST1
0IW
DL
11
800W
B19
240
0WC
270
610U
B12
550
0WC
414
310U
C96
.861
0UB
101
0.7
310U
C11
823
4600
050
0WC
414
310U
C96
.861
0UB
101
0.6
310U
C11
823
4600
015
4878
330
7030
703
280
0WB
192
400W
C27
061
0UB
125
500W
C41
431
0UC
96.8
530U
B82
.00.
631
0UC
96.8
500W
C41
431
0UC
96.8
530U
B82
.00.
631
0UC
96.8
64
800W
B16
840
0WC
212
610U
B10
150
0WC
267
310U
C96
.846
0UB
74.6
0.6
250U
C89
.550
0WC
267
310U
C96
.846
0UB
74.6
0.6
250U
C89
.58
780
0WB
168
400W
C21
253
0UB
82.0
500W
C22
831
0UC
96.8
460U
B74
.60.
625
0UC
89.5
500W
C22
831
0UC
96.8
460U
B74
.60.
625
0UC
89.5
119
800W
B16
840
0WC
212
460U
B67
.150
0WC
228
310U
C96
.836
0UB
56.7
0.6
250U
C72
.950
0WC
228
310U
C96
.836
0UB
56.7
0.6
250U
C72
.9S
T10I
WD
D1
180
0WB
192
400W
C27
061
0UB
125
400W
C32
831
0UC
96.8
460U
B67
.10.
531
0UC
96.8
2346
000
400W
C32
831
0UC
96.8
460U
B67
.10.
531
0UC
96.8
2346
000
1548
783
3070
3070
32
800W
B19
240
0WC
270
610U
B12
540
0WC
328
310U
C96
.836
0UB
56.7
0.5
250U
C72
.940
0WC
328
310U
C96
.836
0UB
56.7
0.5
250U
C72
.96
480
0WB
168
400W
C21
261
0UB
101
400W
C21
231
0UC
96.8
360U
B56
.70.
525
0UC
72.9
400W
C21
231
0UC
96.8
360U
B56
.70.
525
0UC
72.9
87
800W
B16
840
0WC
212
530U
B82
.040
0WC
212
310U
C96
.831
0UB
40.4
0.5
200U
C59
.340
0WC
144
310U
C96
.831
0UB
40.4
0.5
200U
C59
.311
980
0WB
168
400W
C21
246
0UB
67.1
400W
C21
231
0UC
96.8
310U
B40
.40.
520
0UC
59.3
400W
C14
431
0UC
96.8
310U
B40
.40.
520
0UC
59.3
43

Appendix 2: Pushover plots
RC3RWCLxc Push Over
0
1,000
2,000
3,000
4,000
5,000
6,000
7,000
8,000
0.00 0.02 0.04 0.06 0.08 0.10 0.12 0.14 0.16 0.18 0.20
Top Node Displacement (m)
Bas
e Sh
ear (
kN)
RC3RWCL
RC3RWDLxc Push Over
0
2,000
4,000
6,000
8,000
10,000
12,000
14,000
0.00 0.05 0.10 0.15 0.20 0.25 0.30 0.35
Top Node Displacement (m)
Bas
e Sh
ear (
kN)
RC3RWDL
44
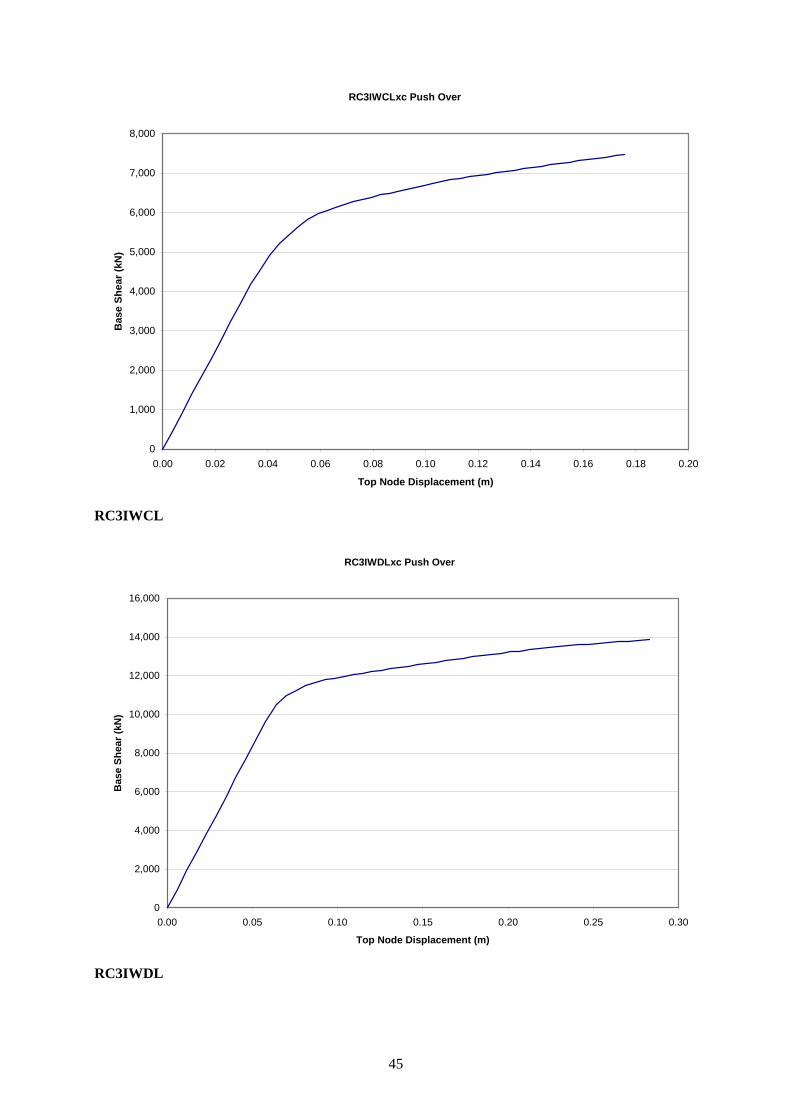
RC3IWCLxc Push Over
0
1,000
2,000
3,000
4,000
5,000
6,000
7,000
8,000
0.00 0.02 0.04 0.06 0.08 0.10 0.12 0.14 0.16 0.18 0.20
Top Node Displacement (m)
Bas
e Sh
ear (
kN)
RC3IWCL
RC3IWDLxc Push Over
0
2,000
4,000
6,000
8,000
10,000
12,000
14,000
16,000
0.00 0.05 0.10 0.15 0.20 0.25 0.30
Top Node Displacement (m)
Bas
e Sh
ear (
kN)
RC3IWDL
45
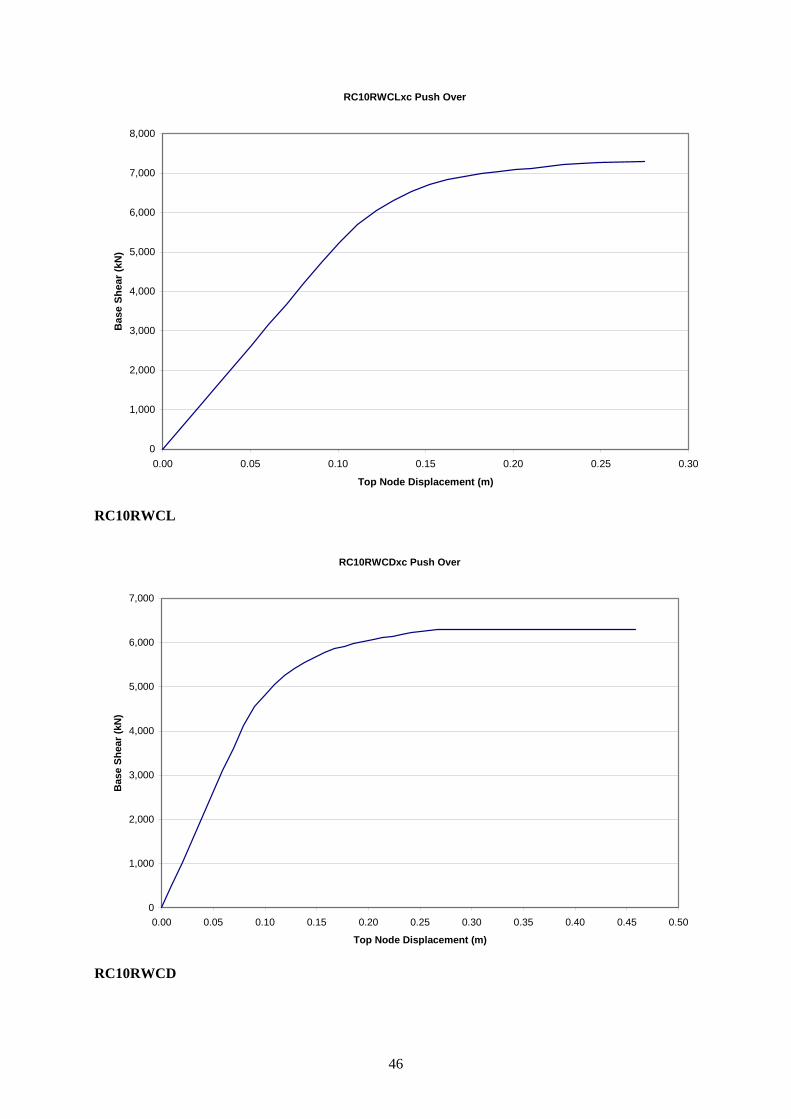
RC10RWCLxc Push Over
0
1,000
2,000
3,000
4,000
5,000
6,000
7,000
8,000
0.00 0.05 0.10 0.15 0.20 0.25 0.30
Top Node Displacement (m)
Bas
e Sh
ear (
kN)
RC10RWCL
RC10RWCDxc Push Over
0
1,000
2,000
3,000
4,000
5,000
6,000
7,000
0.00 0.05 0.10 0.15 0.20 0.25 0.30 0.35 0.40 0.45 0.50
Top Node Displacement (m)
Bas
e Sh
ear (
kN)
RC10RWCD
46
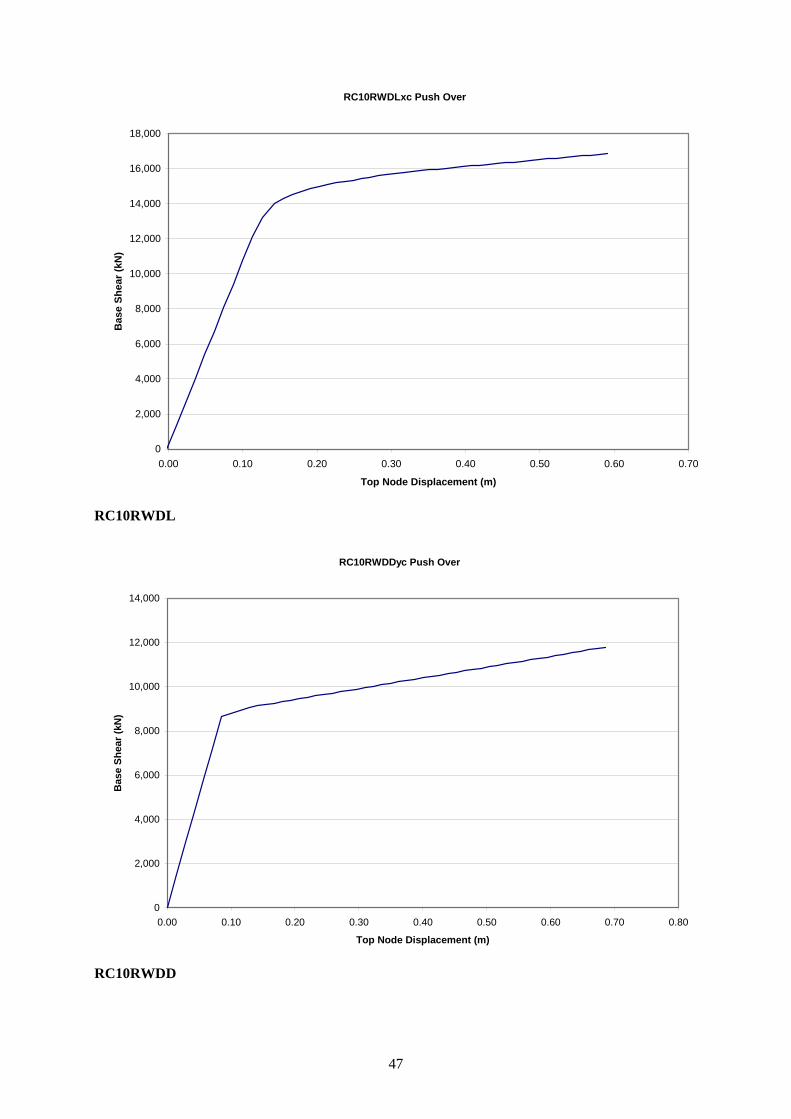
RC10RWDLxc Push Over
0
2,000
4,000
6,000
8,000
10,000
12,000
14,000
16,000
18,000
0.00 0.10 0.20 0.30 0.40 0.50 0.60 0.70
Top Node Displacement (m)
Bas
e Sh
ear (
kN)
RC10RWDL
RC10RWDDyc Push Over
0
2,000
4,000
6,000
8,000
10,000
12,000
14,000
0.00 0.10 0.20 0.30 0.40 0.50 0.60 0.70 0.80
Top Node Displacement (m)
Bas
e Sh
ear (
kN)
RC10RWDD
47
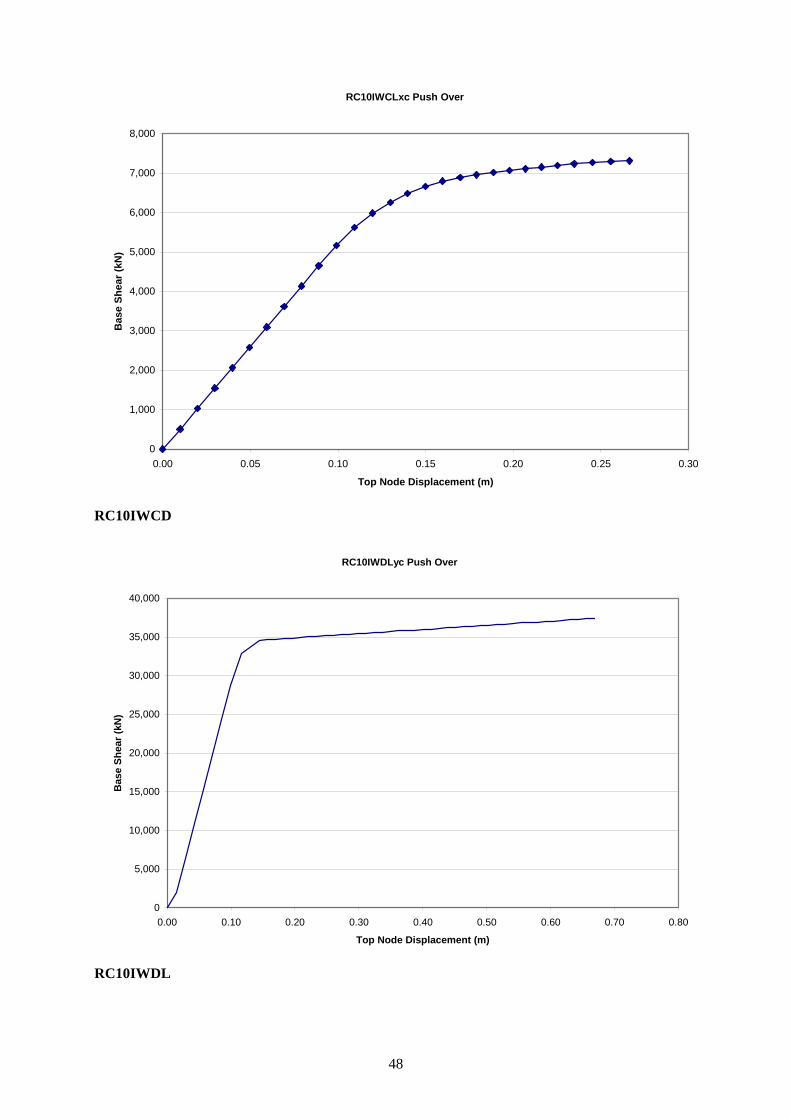
RC10IWCLxc Push Over
0
1,000
2,000
3,000
4,000
5,000
6,000
7,000
8,000
0.00 0.05 0.10 0.15 0.20 0.25 0.30
Top Node Displacement (m)
Bas
e Sh
ear (
kN)
RC10IWCD
RC10IWDLyc Push Over
0
5,000
10,000
15,000
20,000
25,000
30,000
35,000
40,000
0.00 0.10 0.20 0.30 0.40 0.50 0.60 0.70 0.80
Top Node Displacement (m)
Bas
e Sh
ear (
kN)
RC10IWDL
48

RC10IWDDxc Push Over
0
2,000
4,000
6,000
8,000
10,000
12,000
14,000
0.00 0.10 0.20 0.30 0.40 0.50 0.60 0.70
Top Node Displacement (m)
Bas
e Sh
ear (
kN)
RC10IWDD
RC20RWCLxc Push Over
0
2,000
4,000
6,000
8,000
10,000
12,000
14,000
16,000
18,000
20,000
0.00 0.10 0.20 0.30 0.40 0.50 0.60 0.70
Top Node Displacement (m)
Bas
e Sh
ear (
kN)
RC20RWCL
49

RC20RWDLxc Push Over
0
5,000
10,000
15,000
20,000
25,000
30,000
0.00 0.10 0.20 0.30 0.40 0.50 0.60
Top Node Displacement (m)
Bas
e Sh
ear (
kN)
RC20RWDL
RC20RWDDxc Push Over
0
2,000
4,000
6,000
8,000
10,000
12,000
14,000
16,000
18,000
20,000
0.00 0.10 0.20 0.30 0.40 0.50 0.60
Top Node Displacement (m)
Bas
e Sh
ear (
kN)
RC20RWDD
50
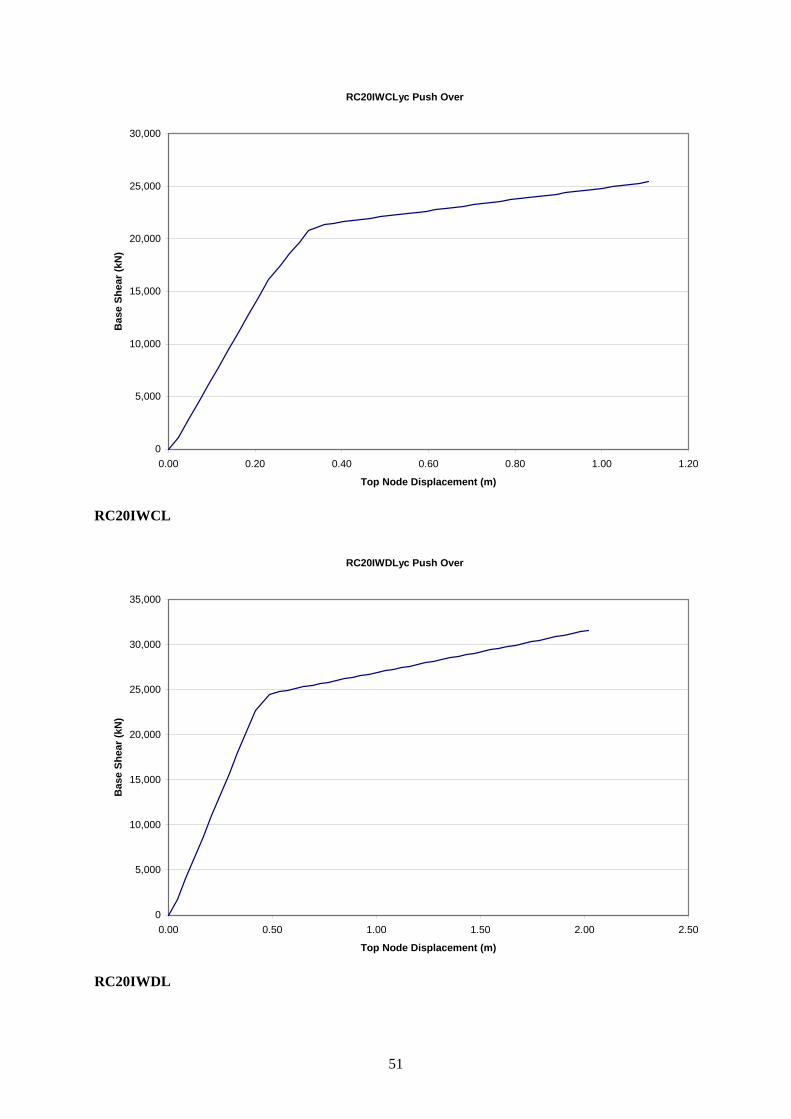
RC20IWCLyc Push Over
0
5,000
10,000
15,000
20,000
25,000
30,000
0.00 0.20 0.40 0.60 0.80 1.00 1.20
Top Node Displacement (m)
Bas
e Sh
ear (
kN)
RC20IWCL
RC20IWDLyc Push Over
0
5,000
10,000
15,000
20,000
25,000
30,000
35,000
0.00 0.50 1.00 1.50 2.00 2.50
Top Node Displacement (m)
Bas
e Sh
ear (
kN)
RC20IWDL
51
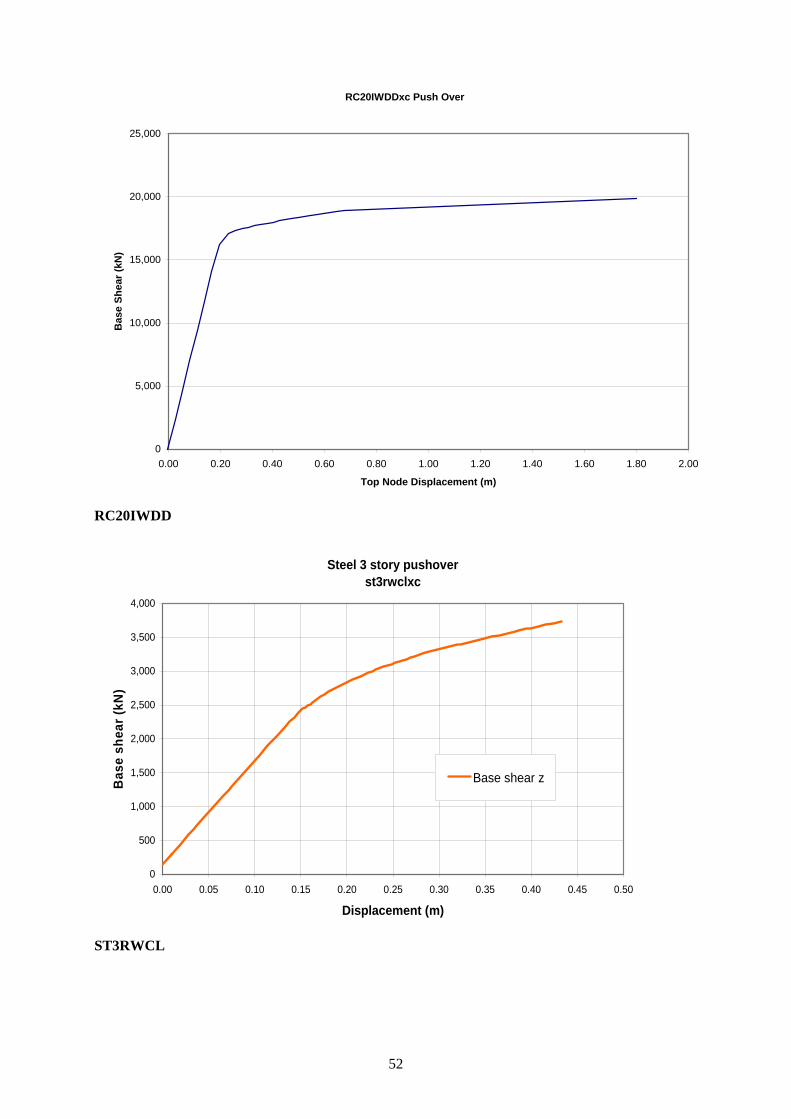
RC20IWDDxc Push Over
0
5,000
10,000
15,000
20,000
25,000
0.00 0.20 0.40 0.60 0.80 1.00 1.20 1.40 1.60 1.80 2.00
Top Node Displacement (m)
Bas
e Sh
ear (
kN)
RC20IWDD
Steel 3 story pushoverst3rwclxc
0
500
1,000
1,500
2,000
2,500
3,000
3,500
4,000
0.00 0.05 0.10 0.15 0.20 0.25 0.30 0.35 0.40 0.45 0.50
Displacement (m)
Bas
e sh
ear (
kN)
Base shear z
ST3RWCL
52
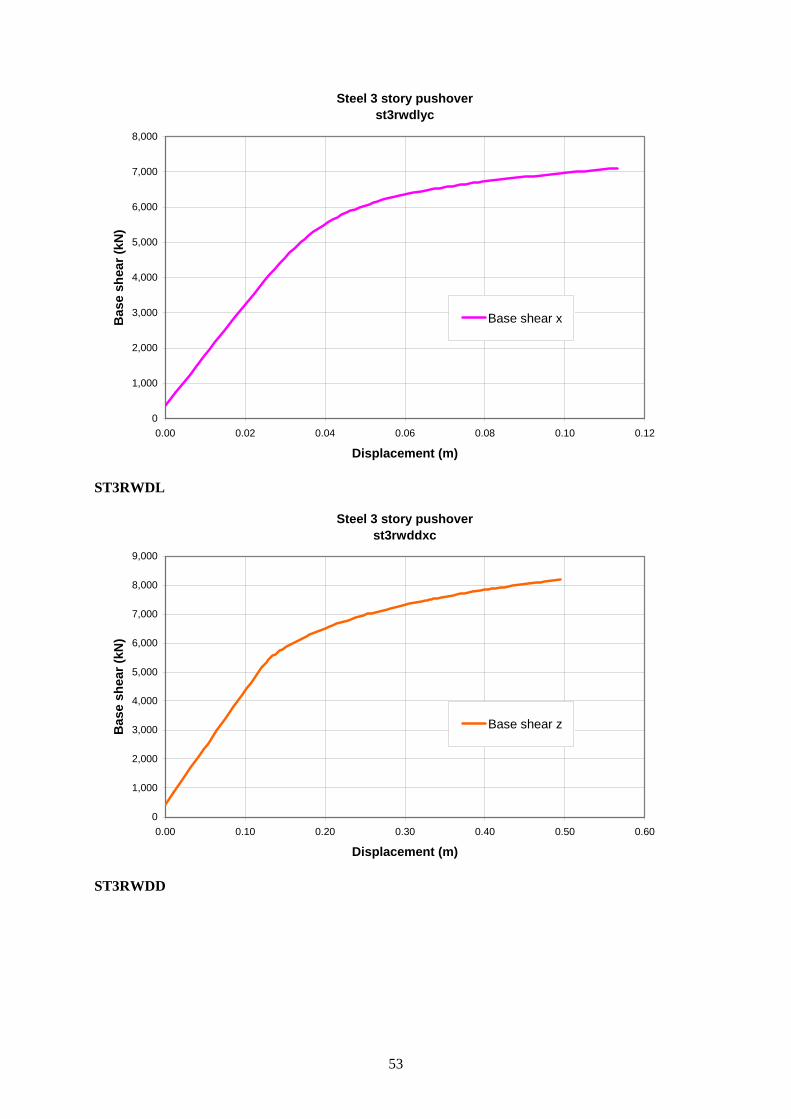
Steel 3 story pushoverst3rwdlyc
0
1,000
2,000
3,000
4,000
5,000
6,000
7,000
8,000
0.00 0.02 0.04 0.06 0.08 0.10 0.12
Displacement (m)
Bas
e sh
ear (
kN)
Base shear x
ST3RWDL
Steel 3 story pushoverst3rwddxc
0
1,000
2,000
3,000
4,000
5,000
6,000
7,000
8,000
9,000
0.00 0.10 0.20 0.30 0.40 0.50 0.60
Displacement (m)
Bas
e sh
ear (
kN)
Base shear z
ST3RWDD
53

Steel 3 story pushoverst3iwclxc
0
500
1,000
1,500
2,000
2,500
3,000
3,500
4,000
0.00 0.05 0.10 0.15 0.20 0.25 0.30 0.35 0.40 0.45
Displacement (m)
Bas
e sh
ear (
kN)
Base shear z
ST3IWCL
Steel 3 story pushoverst3iwdlxc
0
1,000
2,000
3,000
4,000
5,000
6,000
7,000
8,000
9,000
0.00 0.10 0.20 0.30 0.40 0.50 0.60
Displacement (m)
Bas
e sh
ear (
kN)
Base shear z
ST3IWDL
54
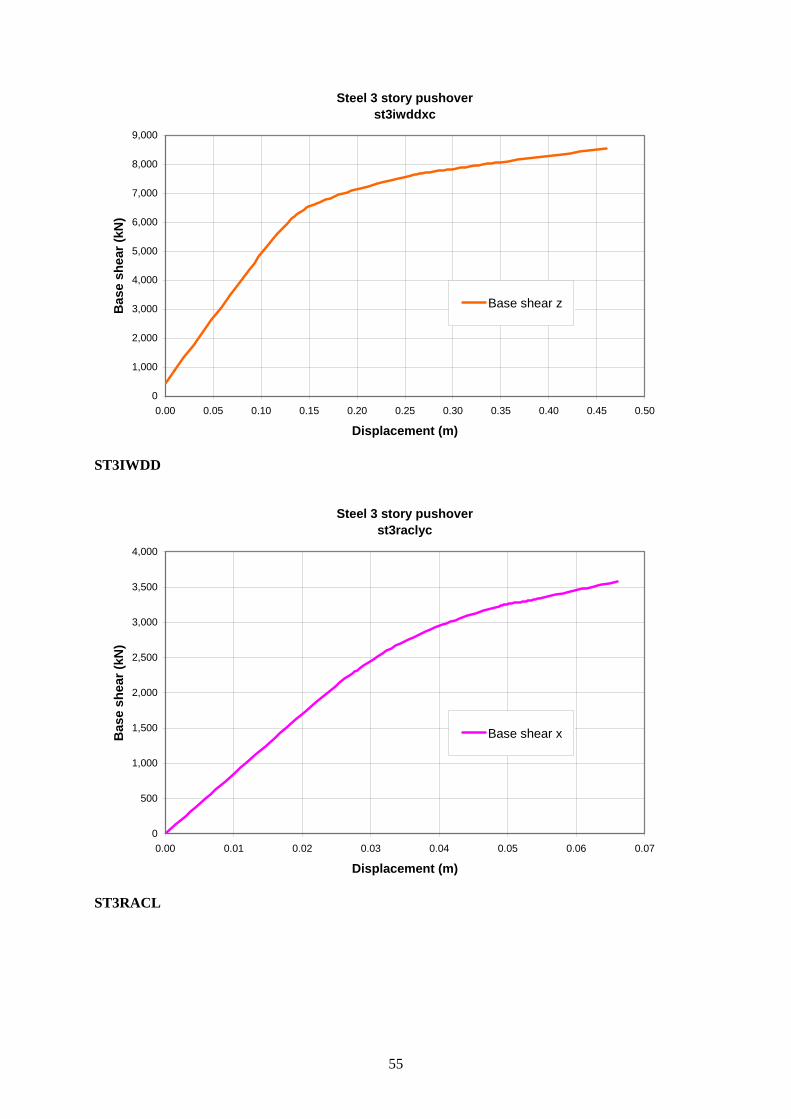
Steel 3 story pushoverst3iwddxc
0
1,000
2,000
3,000
4,000
5,000
6,000
7,000
8,000
9,000
0.00 0.05 0.10 0.15 0.20 0.25 0.30 0.35 0.40 0.45 0.50
Displacement (m)
Bas
e sh
ear (
kN)
Base shear z
ST3IWDD
Steel 3 story pushoverst3raclyc
0
500
1,000
1,500
2,000
2,500
3,000
3,500
4,000
0.00 0.01 0.02 0.03 0.04 0.05 0.06 0.07
Displacement (m)
Bas
e sh
ear (
kN)
Base shear x
ST3RACL
55
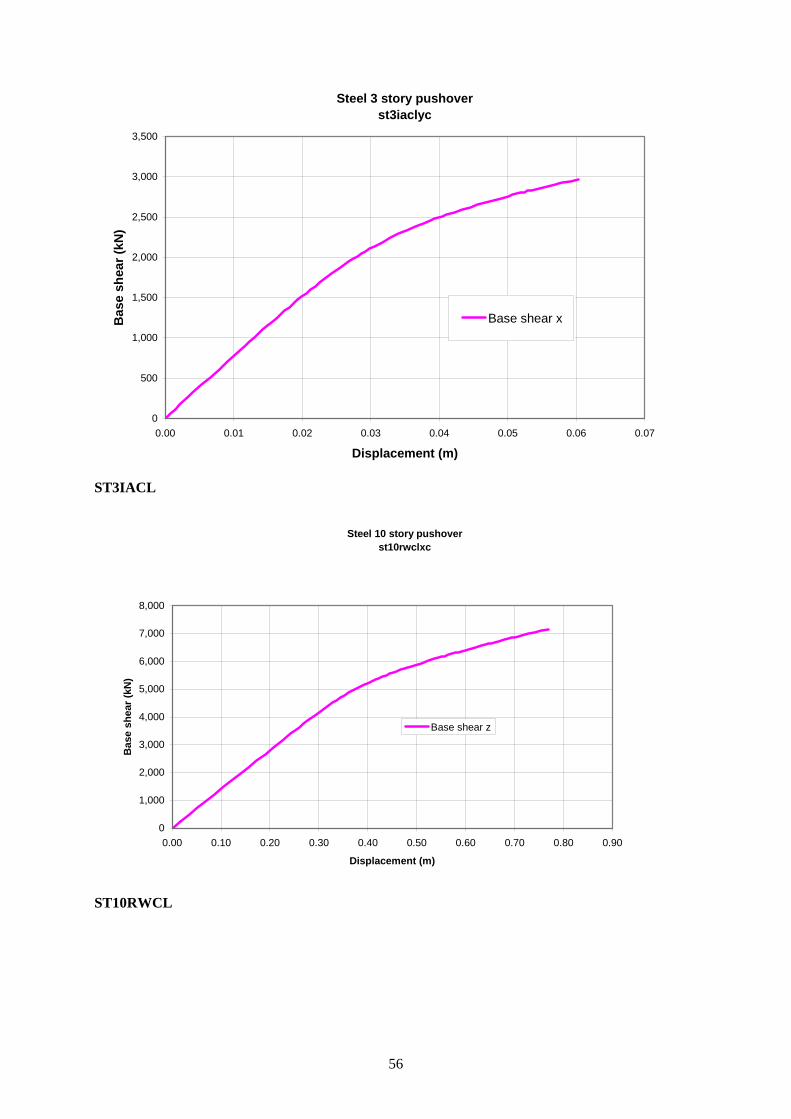
Steel 3 story pushoverst3iaclyc
0
500
1,000
1,500
2,000
2,500
3,000
3,500
0.00 0.01 0.02 0.03 0.04 0.05 0.06 0.07
Displacement (m)
Bas
e sh
ear (
kN)
Base shear x
ST3IACL
Steel 10 story pushoverst10rwclxc
0
1,000
2,000
3,000
4,000
5,000
6,000
7,000
8,000
0.00 0.10 0.20 0.30 0.40 0.50 0.60 0.70 0.80 0.90
Displacement (m)
Bas
e sh
ear (
kN)
Base shear z
ST10RWCL
56

Steel 10 story pushoverst10rwdlxc
0
2,000
4,000
6,000
8,000
10,000
12,000
14,000
0.00 0.20 0.40 0.60 0.80 1.00 1.20
Displacement (m)
Bas
e sh
ear (
kN)
Base shear z
ST10RWDL
Steel 10 story pushoverst10rwddyc
0
1,000
2,000
3,000
4,000
5,000
6,000
7,000
8,000
0.00 0.05 0.10 0.15 0.20 0.25 0.30 0.35 0.40 0.45
Displacement (m)
Bas
e sh
ear (
kN)
Base shear x
ST10RWDD
57
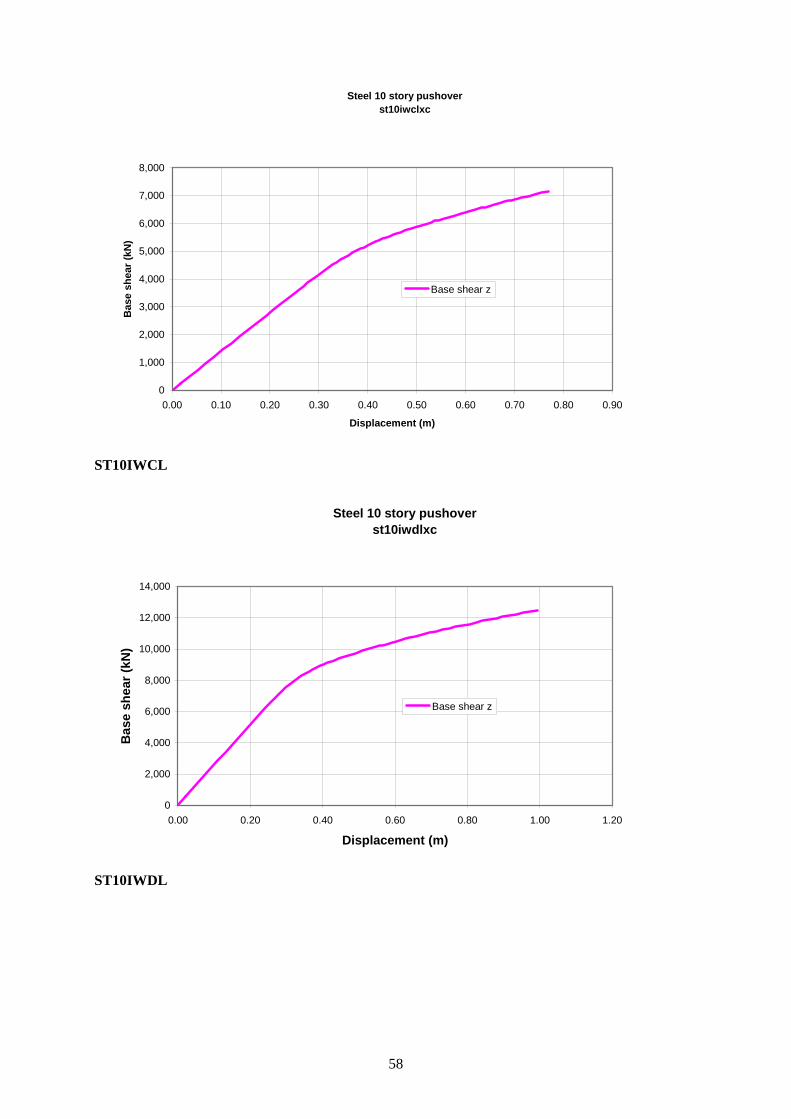
Steel 10 story pushoverst10iwclxc
0
1,000
2,000
3,000
4,000
5,000
6,000
7,000
8,000
0.00 0.10 0.20 0.30 0.40 0.50 0.60 0.70 0.80 0.90
Displacement (m)
Bas
e sh
ear (
kN)
Base shear z
ST10IWCL
Steel 10 story pushoverst10iwdlxc
0
2,000
4,000
6,000
8,000
10,000
12,000
14,000
0.00 0.20 0.40 0.60 0.80 1.00 1.20
Displacement (m)
Bas
e sh
ear (
kN)
Base shear z
ST10IWDL
58
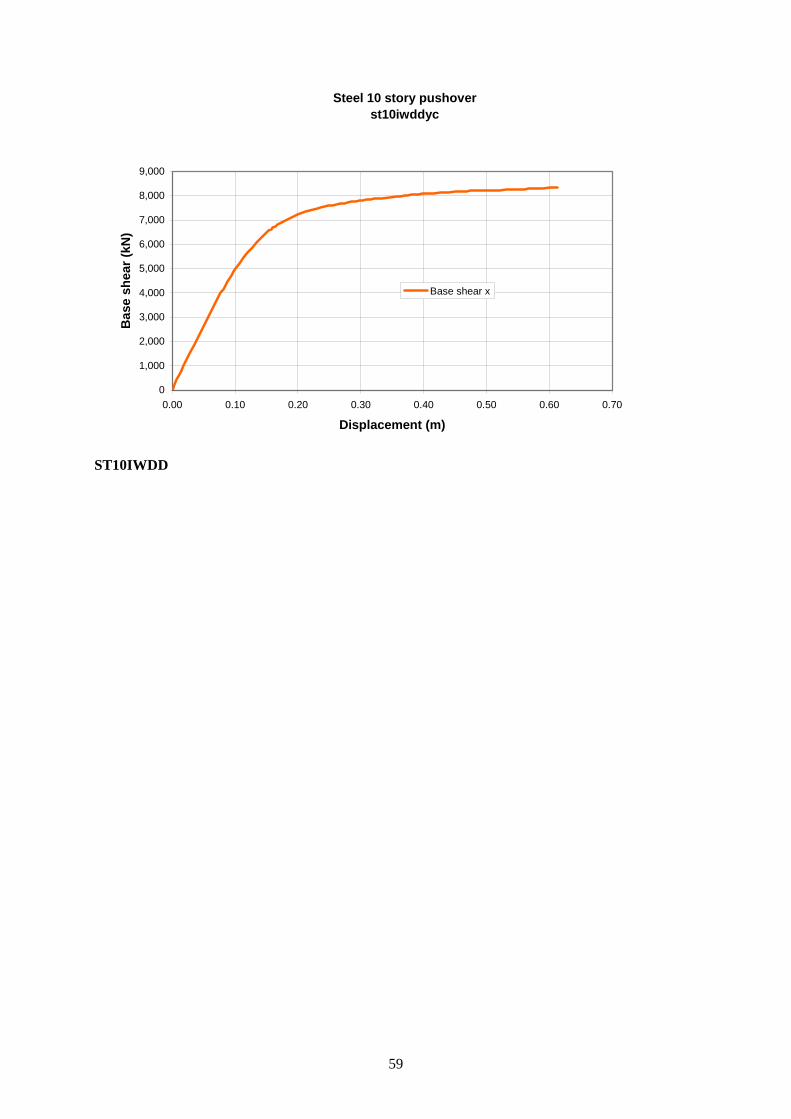
Steel 10 story pushoverst10iwddyc
0
1,000
2,000
3,000
4,000
5,000
6,000
7,000
8,000
9,000
0.00 0.10 0.20 0.30 0.40 0.50 0.60 0.70
Displacement (m)
Bas
e sh
ear (
kN)
Base shear x
ST10IWDD
59
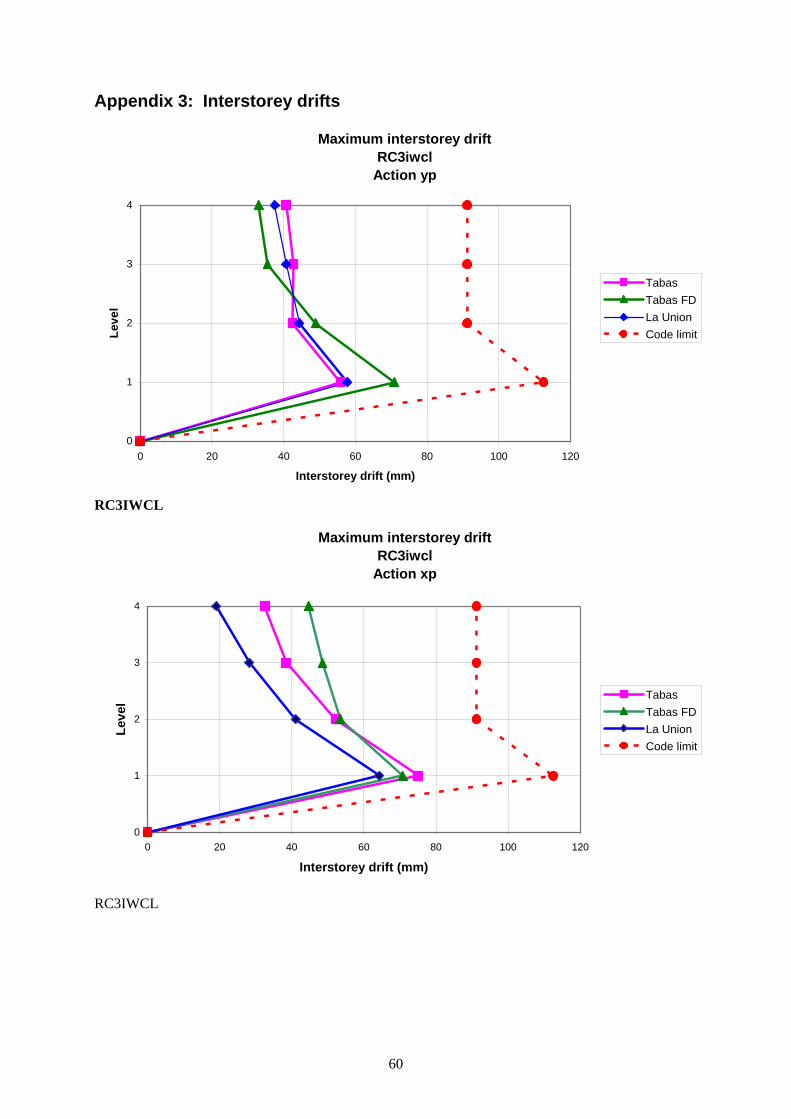
Appendix 3: Interstorey drifts
Maximum interstorey driftRC3iwcl
Action yp
0
1
2
3
4
0 20 40 60 80 100 120
Interstorey drift (mm)
Leve
l
TabasTabas FDLa UnionCode limit
RC3IWCL
Maximum interstorey driftRC3iwcl
Action xp
0
1
2
3
4
0 20 40 60 80 100 120
Interstorey drift (mm)
Leve
l TabasTabas FDLa UnionCode limit
RC3IWCL
60

Maximum interstorey driftRC10IWCD. Action xp
0
1
2
3
4
5
6
7
8
9
10
11
12
0 50 100 150 200 250
Interstorey drift (mm)
Leve
l
TabasLa UnionTabas FDCode limit
RC10IWCD
Maximum interstorey driftRC10IWCD. Action yp
0
1
2
3
4
5
6
7
8
9
10
11
12
0 50 100 150 200 250Interstorey drift (mm)
Leve
l
TabasTabas FDLa UnionCode limit
RC10IWCD
61

Maximum Interstorey DriftsRC20IWCLxpTHPDELU
0
1
2
3
4
5
6
7
8
9
10
11
12
13
14
15
16
17
18
19
20
21
0 20 40 60 80 100 120
Inter-Storey Drift (mm)
Bot
tom
Sto
rey
Leve
l
X-Direction Z-Direction Vector Code Limit
Maximum Interstorey DriftsRC20IWCLypTHPDELU
0
1
2
3
4
5
6
7
8
9
10
11
12
13
14
15
16
17
18
19
20
21
0 20 40 60 80 100 120
Inter-Storey Drift (mm)
Bot
tom
Sto
rey
Leve
l
X-Direction Z-Direction Vector Code Limit
62
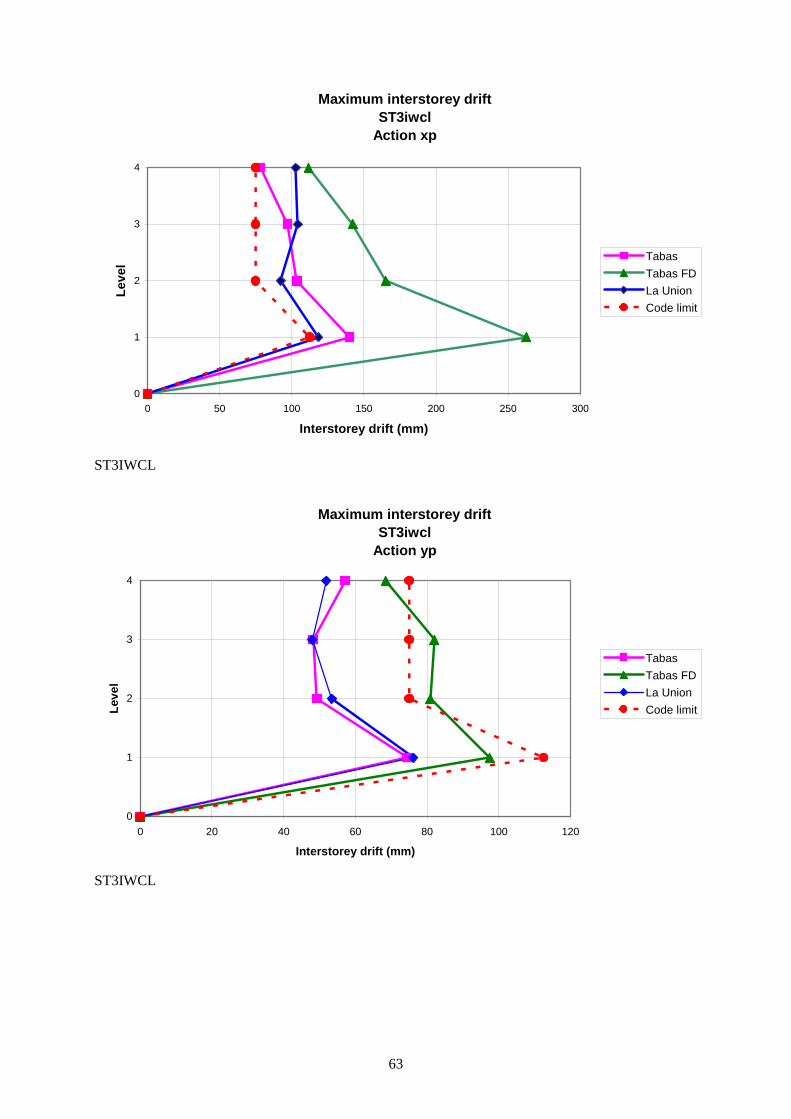
Maximum interstorey driftST3iwcl
Action xp
0
1
2
3
4
0 50 100 150 200 250 300
Interstorey drift (mm)
Leve
l TabasTabas FDLa UnionCode limit
ST3IWCL
Maximum interstorey driftST3iwcl
Action yp
0
1
2
3
4
0 20 40 60 80 100 120
Interstorey drift (mm)
Leve
l
TabasTabas FDLa UnionCode limit
ST3IWCL
63

Maximum interstorey driftST3iwdl
Action xp
0
1
2
3
4
0 20 40 60 80 100 120 140 160 180 200
Interstorey drift (mm)
Leve
l El CentroDuzceCaleta dCCode limit
ST3IWDL
Maximum interstorey driftST3iwdl
Action yp
0
1
2
3
4
0 20 40 60 80 100 120
Interstorey drift (mm)
Leve
l
El CentroDuzceCaleta dCCode limit
ST3IWDL
64
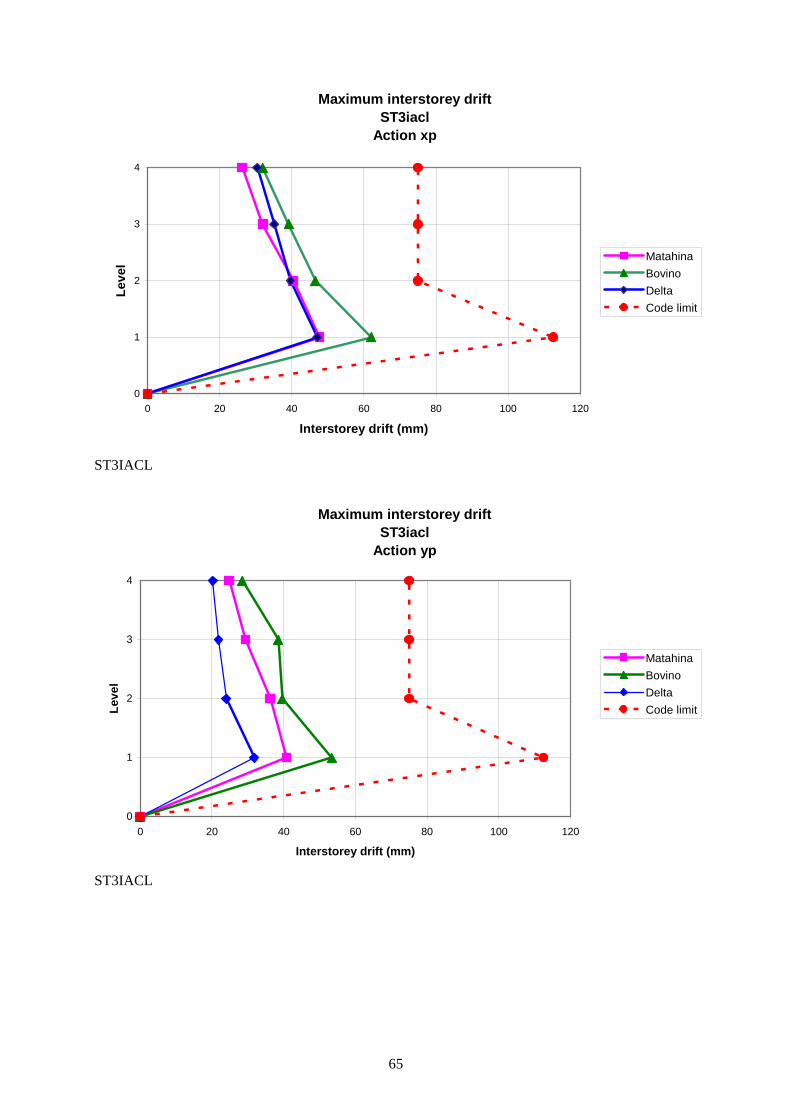
Maximum interstorey driftST3iacl
Action xp
0
1
2
3
4
0 20 40 60 80 100 120
Interstorey drift (mm)
Leve
l MatahinaBovinoDeltaCode limit
ST3IACL
Maximum interstorey driftST3iacl
Action yp
0
1
2
3
4
0 20 40 60 80 100 120
Interstorey drift (mm)
Leve
l
MatahinaBovinoDeltaCode limit
ST3IACL
65
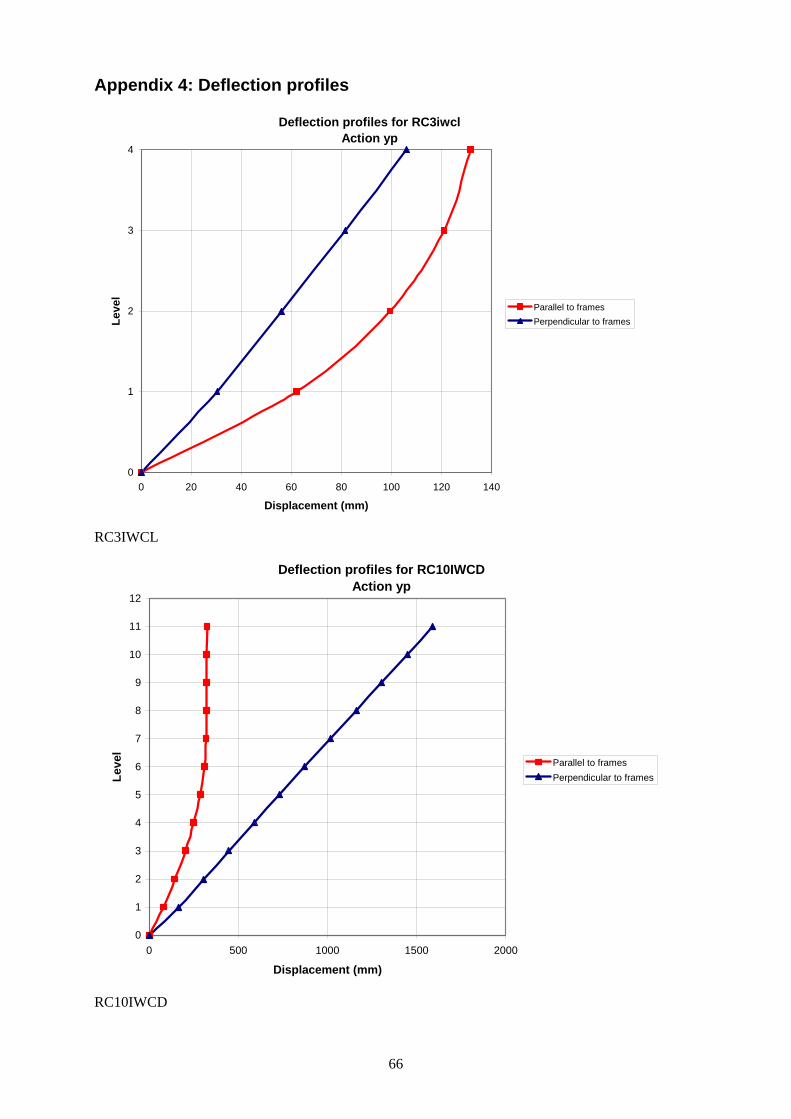
Appendix 4: Deflection profiles
Deflection profiles for RC3iwclAction yp
0
1
2
3
4
0 20 40 60 80 100 120 140
Displacement (mm)
Leve
l
Parallel to framesPerpendicular to frames
RC3IWCL
Deflection profiles for RC10IWCDAction yp
0
1
2
3
4
5
6
7
8
9
10
11
12
0 500 1000 1500 2000
Displacement (mm)
Leve
l
Parallel to framesPerpendicular to frames
RC10IWCD
66
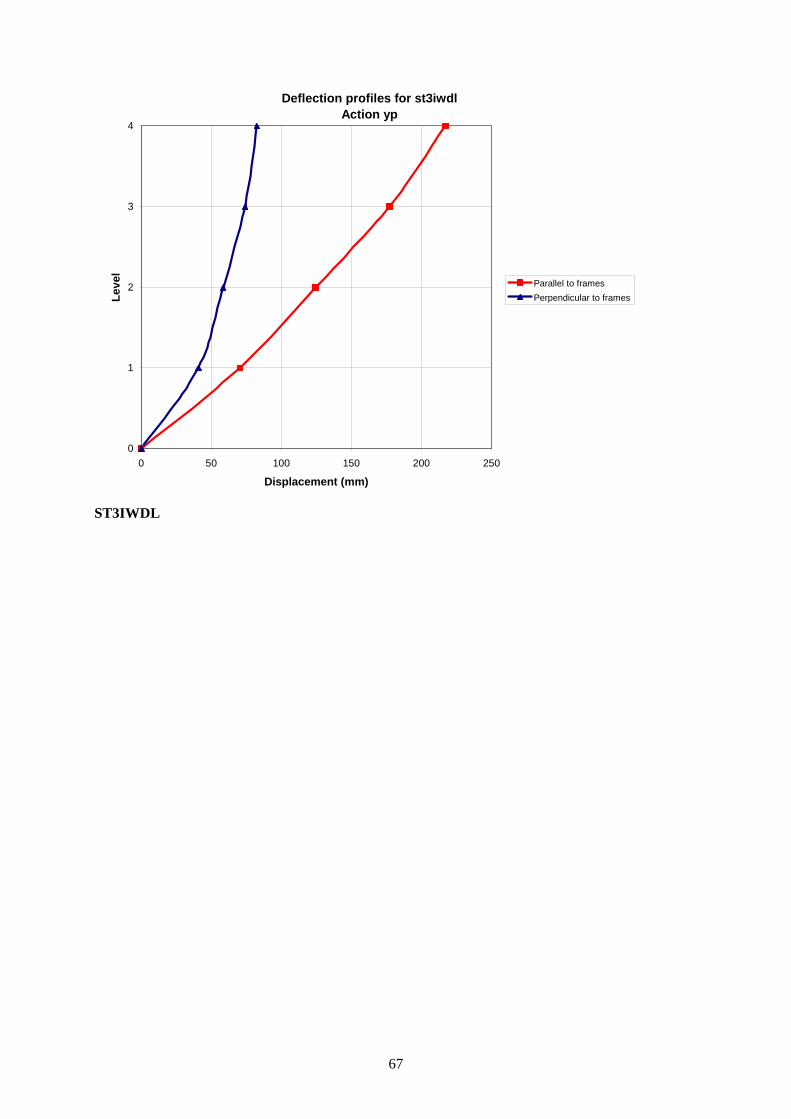
Deflection profiles for st3iwdlAction yp
0
1
2
3
4
0 50 100 150 200 250
Displacement (mm)
Leve
l
Parallel to framesPerpendicular to frames
ST3IWDL
67
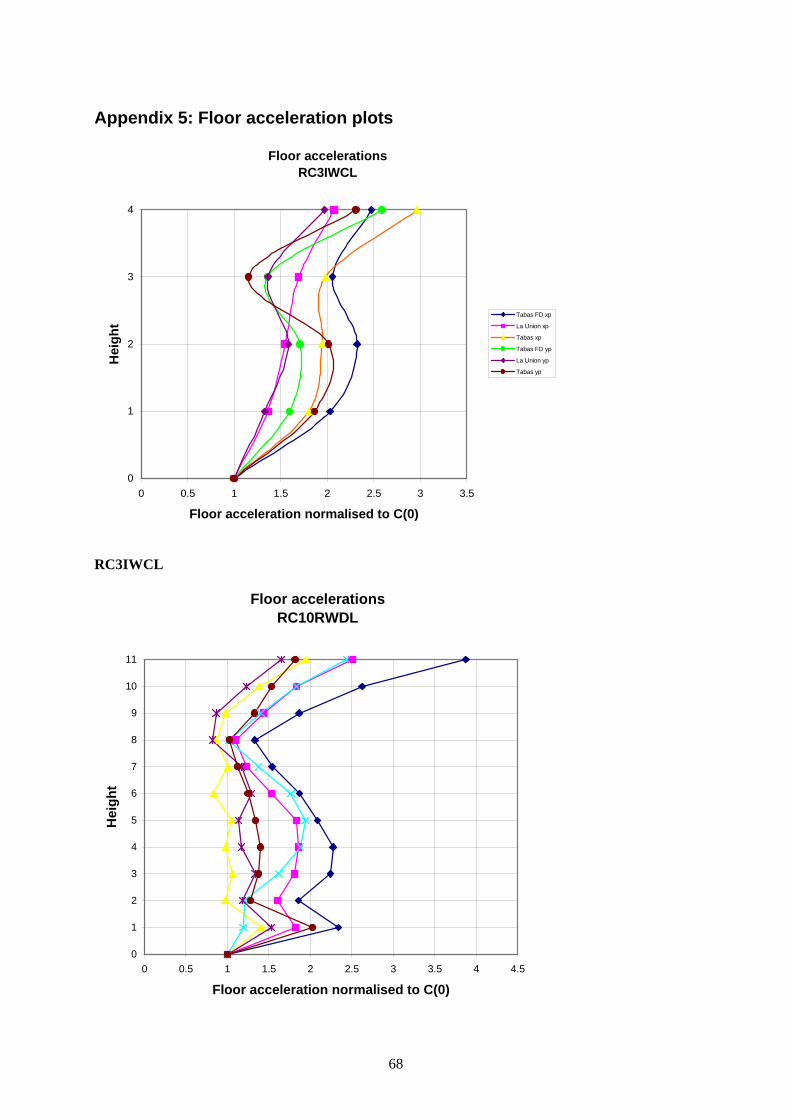
Appendix 5: Floor acceleration plots
Floor accelerations RC3IWCL
0
1
2
3
4
0 0.5 1 1.5 2 2.5 3 3.5
Floor acceleration normalised to C(0)
Hei
ght
Tabas FD xp
La Union xp
Tabas xp
Tabas FD yp
La Union yp
Tabas yp
RC3IWCL
Floor accelerationsRC10RWDL
0
1
2
3
4
5
6
7
8
9
10
11
0 0.5 1 1.5 2 2.5 3 3.5 4 4.5
Floor acceleration normalised to C(0)
Hei
ght
68

RC10RWDL
Floor accelerationsRC10RWDD
0
1
2
3
4
5
6
7
8
9
10
11
0 1 2 3 4 5
Floor acceleration normalised to C(0)
Hei
ght
6
RC10RWDD
Floor accelerations at corner nodes
0
1
2
3
4
5
6
7
8
9
10
11
0 1 2 3 4 5 6
Floor acceleration normalised to C(0)
Hei
ght
RC10IWCL
RC10IWCL
69
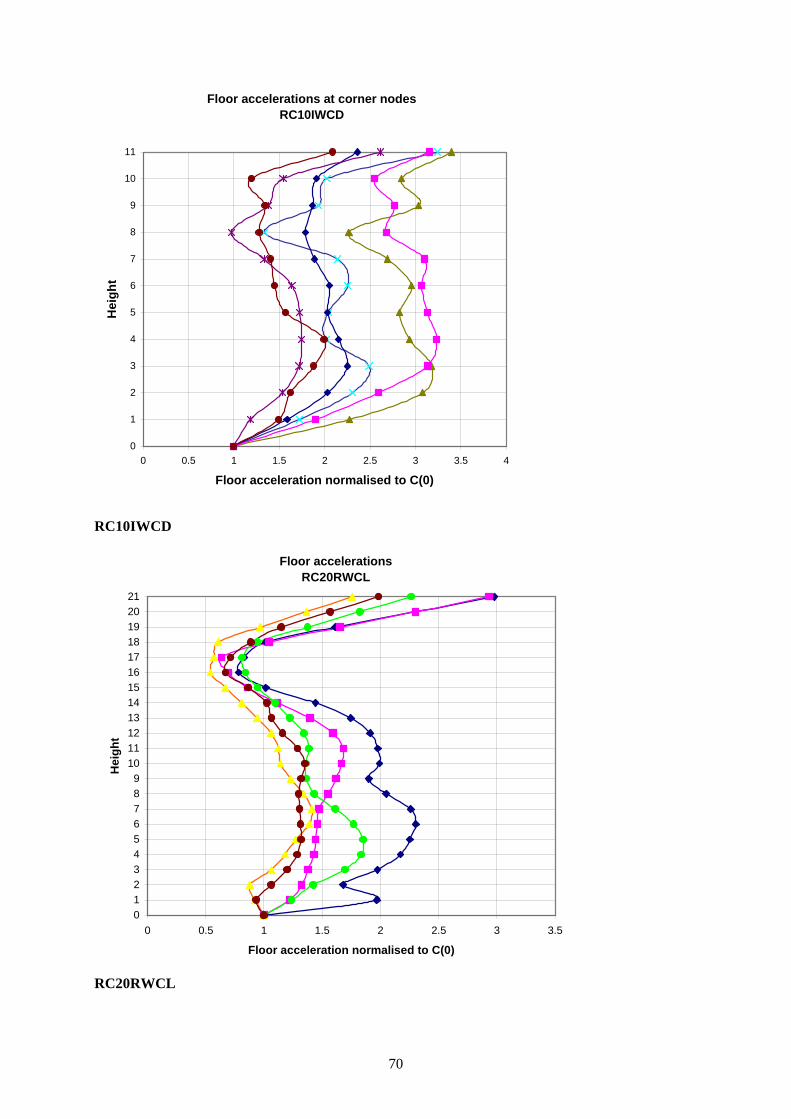
Floor accelerations at corner nodesRC10IWCD
0
1
2
3
4
5
6
7
8
9
10
11
0 0.5 1 1.5 2 2.5 3 3.5 4
Floor acceleration normalised to C(0)
Hei
ght
RC10IWCD
Floor accelerations RC20RWCL
0123456789
101112131415161718192021
0 0.5 1 1.5 2 2.5 3 3.5
Floor acceleration normalised to C(0)
Hei
ght
RC20RWCL
70
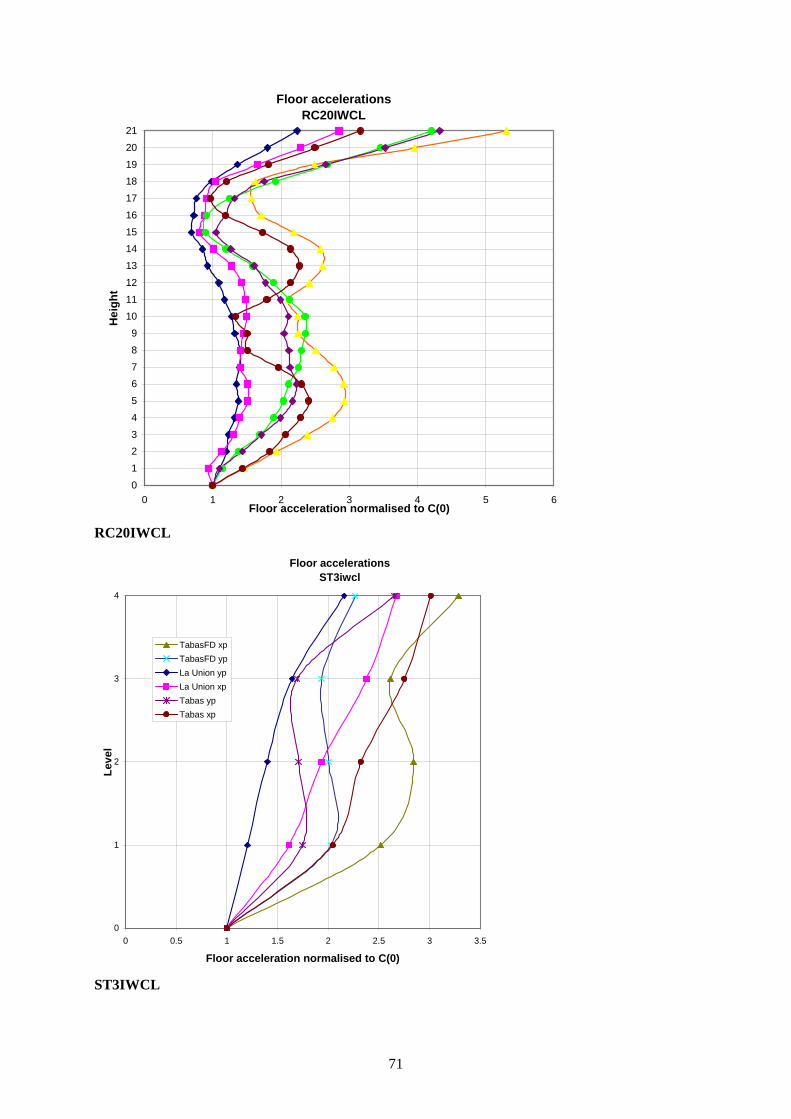
Floor accelerations RC20IWCL
0
1
23
4
5
67
8
9
1011
12
13
1415
16
17
1819
20
21
0 1 2 3 4 5Floor acceleration normalised to C(0)
Hei
ght
6
RC20IWCL
Floor accelerations ST3iwcl
0
1
2
3
4
0 0.5 1 1.5 2 2.5 3 3.5
Floor acceleration normalised to C(0)
Leve
l
TabasFD xpTabasFD ypLa Union ypLa Union xpTabas ypTabas xp
ST3IWCL
71

Floor accelerations ST3iwdl
0
1
2
3
4
0.0 1.0 2.0 3.0 4.0 5.0
Floor acceleration normalised to C(0)
Leve
l
ST3IWDL
Floor accelerations at corner nodesST3iacl
0
1
2
3
4
0 1 2 3 4 5Floor acceleration normalised to C(0)
Leve
l
Bovino yp
Bovino xp
Matahina yp
Matahina xp
Delta yp
Delta xp
ST3IACL
72
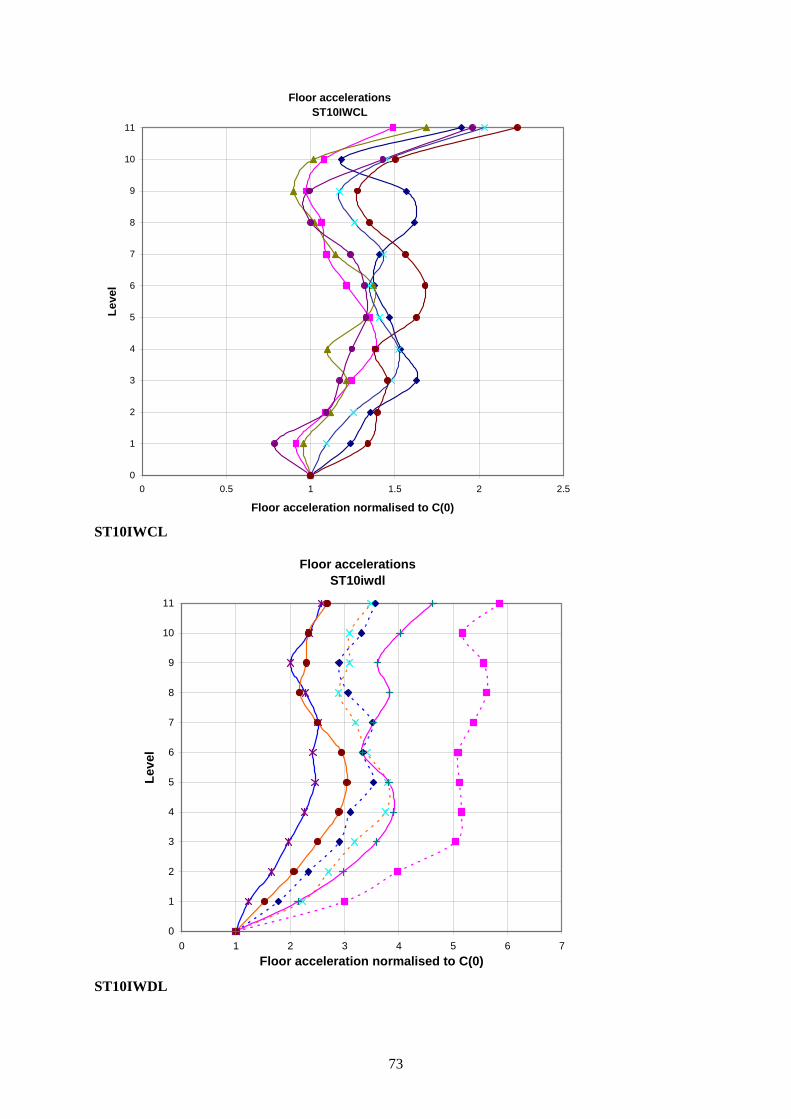
Floor accelerationsST10IWCL
0
1
2
3
4
5
6
7
8
9
10
11
0 0.5 1 1.5 2 2
Floor acceleration normalised to C(0)
Leve
l
.5
ST10IWCL
Floor accelerations ST10iwdl
0
1
2
3
4
5
6
7
8
9
10
11
0 1 2 3 4 5 6 7Floor acceleration normalised to C(0)
Leve
l
ST10IWDL
73
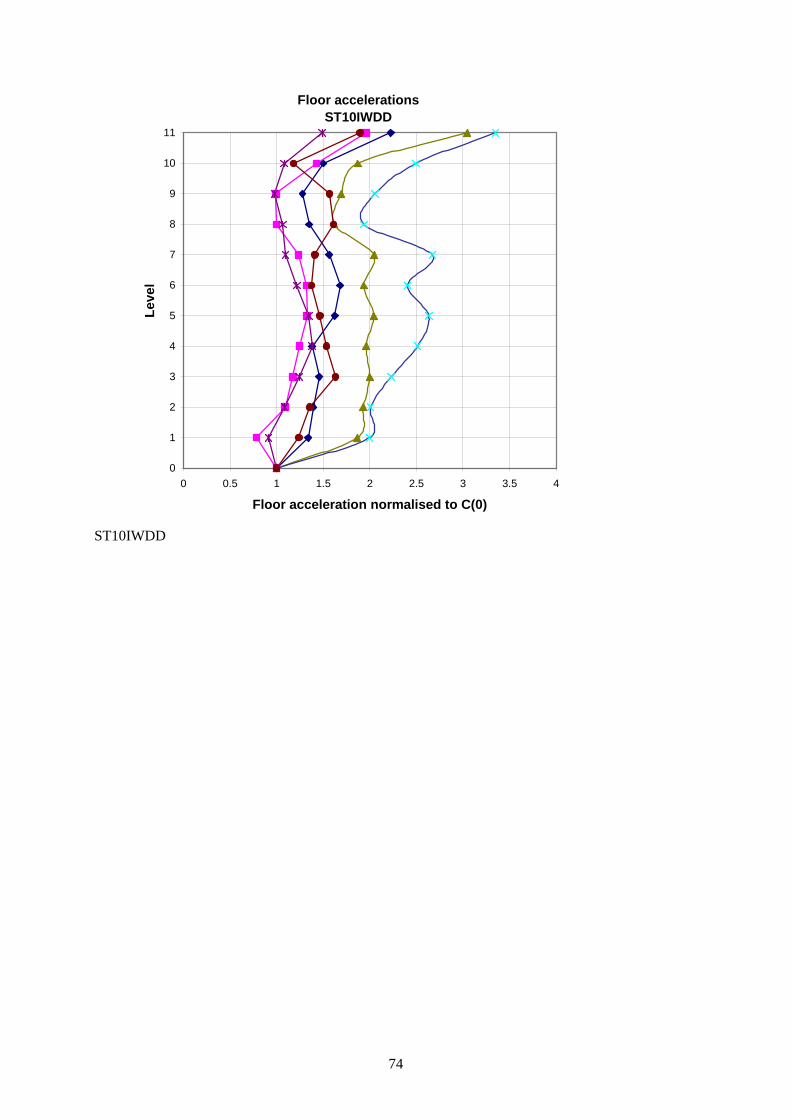
Floor accelerations ST10IWDD
0
1
2
3
4
5
6
7
8
9
10
11
0 0.5 1 1.5 2 2.5 3 3.5 4
Floor acceleration normalised to C(0)
Leve
l
ST10IWDD
74

Appendix 6: Floor response spectra
Earthquake Response Spectra RC3rwcl
1st f
loor
3rd
floor
leve
l
Perpendicular to Frames Parallel to Frames
2nd
floor
0
0.5
1
1.5
2
2.5
3
3.5
0 0.5 1 1.5 2 2.5 3 3.5 4
Period (sec)
Acc
eler
atio
n (g
)
0
0.5
1
1.5
2
2.5
3
3.5
4
4.5
5
0 0.5 1 1.5 2 2.5 3 3.5 4
Period (sec)
Acc
eler
atio
n (g
)
0
0.5
1
1.5
2
2.5
3
0 0.5 1 1.5 2 2.5 3 3.5 4
Period (sec)
Acc
eler
atio
n (g
)
0
0.5
1
1.5
2
2.5
3
3.5
0 0.5 1 1.5 2 2.5 3 3.5 4
Period (sec)
Acc
eler
atio
n (g
)
0
0.5
1
1.5
2
2.5
3
3.5
0 0.5 1 1.5 2 2.5 3 3.5 4
Period (sec)
Acc
eler
atio
n (g
)
0
0.5
1
1.5
2
2.5
3
0 0.5 1 1.5 2 2.5 3 3.5 4
Period (sec)
Acc
eler
atio
n (g
)
0
0.5
1
1.5
2
2.5
3
3.5
0 0.5 1 1.5 2 2.5 3 3.5 4
Period (sec)
Acc
eler
atio
n (g
)
75

Earthquake Response Spectra RC3iwcl
3rd
floor
leve
lPerpendicular to Frames Parallel to Frames
0
0.5
1
1.5
2
2.5
3
3.5
4
4.5
5
0 0.5 1 1.5 2 2.5 3 3.5 4
Period (sec)
Acc
eler
atio
n (g
)
0
0.5
1
1.5
2
2.5
3
3.5
4
4.5
5
0 0.5 1 1.5 2 2.5 3 3.5 4
Period (sec)
Acc
eler
atio
n (g
)
Earthquake Response Spectra RC10RWCL
10th
Flo
or L
evel
7th
Floo
r Lev
el4t
h Fl
oor L
evel
Perpendicular to Frames Parallel to Frames
0
0.5
1
1.5
2
2.5
3
0 0.5 1 1.5 2 2.5 3 3.5 40
0.5
1
1.5
2
2.5
3
0 0.5 1 1.5 2 2.5 3 3.5 4
0
0.5
1
1.5
2
2.5
3
0 0.5 1 1.5 2 2.5 3 3.5 40
0.5
1
1.5
2
2.5
3
0 0.5 1 1.5 2 2.5 3 3.5 4
0
0.5
1
1.5
2
2.5
3
0 0.5 1 1.5 2 2.5 3 3.5 40
0.5
1
1.5
2
2.5
3
0 0.5 1 1.5 2 2.5 3 3.5 4
76
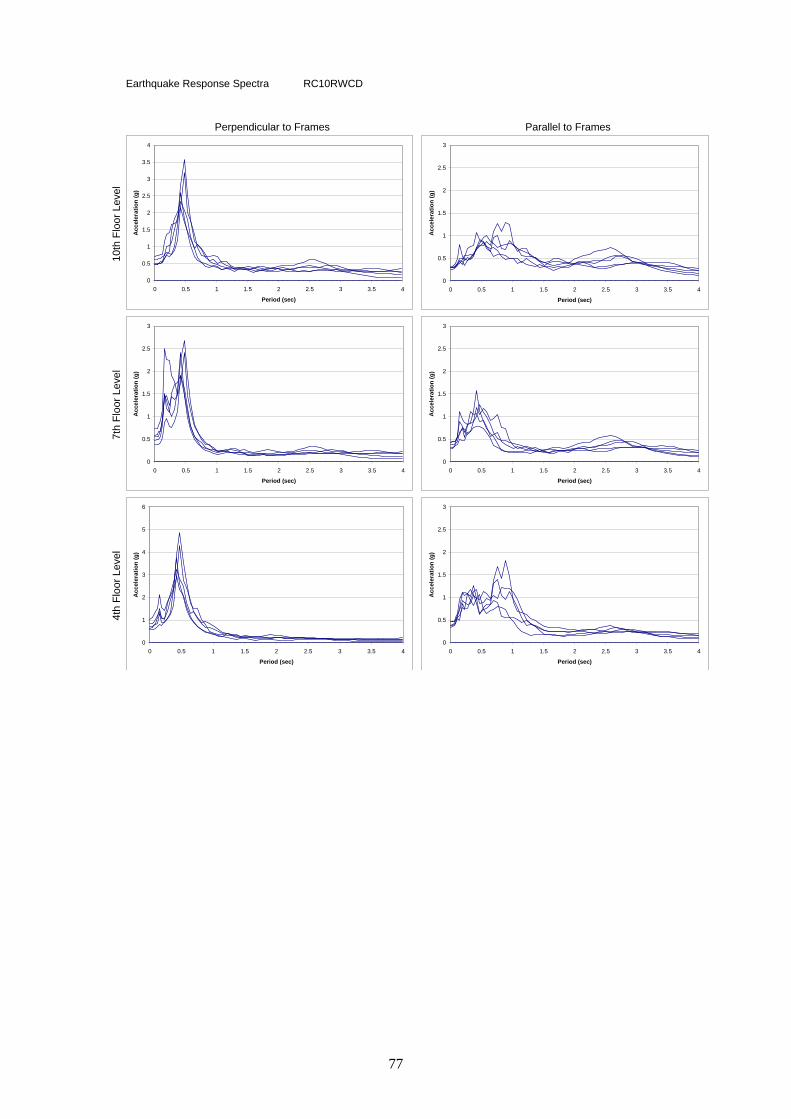
Earthquake Response Spectra RC10RWCD
Parallel to Frames10
th F
loor
Lev
el7t
h Fl
oor L
evel
4th
Floo
r Lev
elPerpendicular to Frames
0
0.5
1
1.5
2
2.5
3
3.5
4
0 0.5 1 1.5 2 2.5 3 3.5 4
Period (sec)
Acc
eler
atio
n (g
)
0
0.5
1
1.5
2
2.5
3
0 0.5 1 1.5 2 2.5 3 3.5 4
Period (sec)
Acc
eler
atio
n (g
)
0
0.5
1
1.5
2
2.5
3
0 0.5 1 1.5 2 2.5 3 3.5 4
Period (sec)
Acc
eler
atio
n (g
)
0
0.5
1
1.5
2
2.5
3
0 0.5 1 1.5 2 2.5 3 3.5 4
Period (sec)
Acc
eler
atio
n (g
)
0
1
2
3
4
5
6
0 0.5 1 1.5 2 2.5 3 3.5 4
Period (sec)
Acc
eler
atio
n (g
)
0
0.5
1
1.5
2
2.5
3
0 0.5 1 1.5 2 2.5 3 3.5 4
Period (sec)
Acc
eler
atio
n (g
)
77
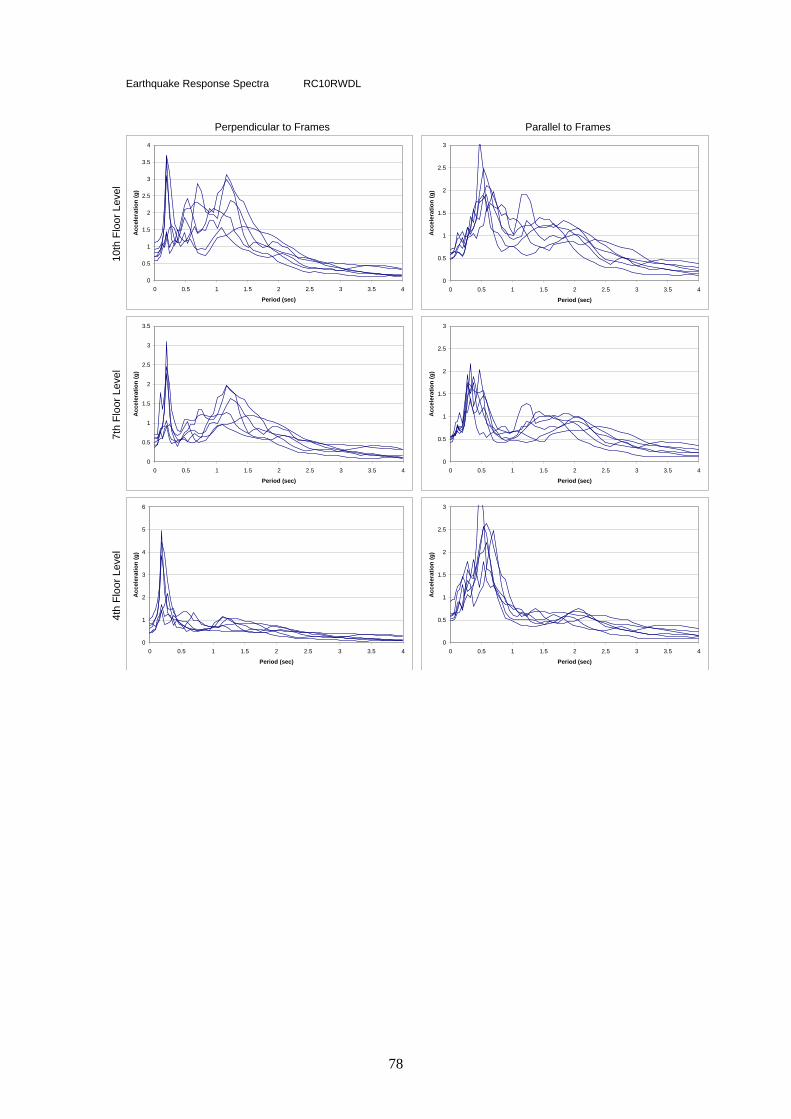
Earthquake Response Spectra RC10RWDL
Parallel to Frames10
th F
loor
Lev
el7t
h Fl
oor L
evel
4th
Floo
r Lev
elPerpendicular to Frames
0
0.5
1
1.5
2
2.5
3
3.5
4
0 0.5 1 1.5 2 2.5 3 3.5 4
Period (sec)
Acc
eler
atio
n (g
)
0
0.5
1
1.5
2
2.5
3
0 0.5 1 1.5 2 2.5 3 3.5 4
Period (sec)
Acc
eler
atio
n (g
)
0
0.5
1
1.5
2
2.5
3
3.5
0 0.5 1 1.5 2 2.5 3 3.5 4
Period (sec)
Acc
eler
atio
n (g
)
0
0.5
1
1.5
2
2.5
3
0 0.5 1 1.5 2 2.5 3 3.5 4
Period (sec)
Acc
eler
atio
n (g
)
0
1
2
3
4
5
6
0 0.5 1 1.5 2 2.5 3 3.5 4
Period (sec)
Acc
eler
atio
n (g
)
0
0.5
1
1.5
2
2.5
3
0 0.5 1 1.5 2 2.5 3 3.5 4
Period (sec)
Acc
eler
atio
n (g
)
78
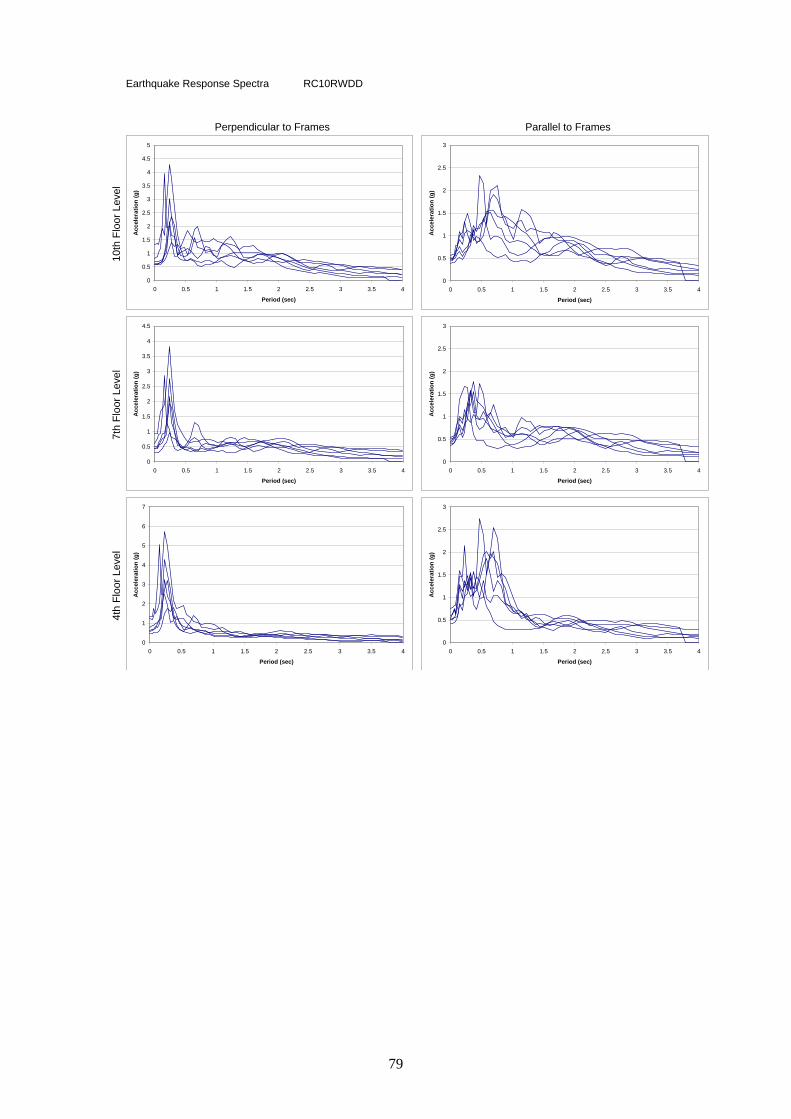
Earthquake Response Spectra RC10RWDD
Parallel to Frames10
th F
loor
Lev
el7t
h Fl
oor L
evel
4th
Floo
r Lev
elPerpendicular to Frames
0
0.5
1
1.5
2
2.5
3
3.5
4
4.5
5
0 0.5 1 1.5 2 2.5 3 3.5 4
Period (sec)
Acc
eler
atio
n (g
)
0
0.5
1
1.5
2
2.5
3
0 0.5 1 1.5 2 2.5 3 3.5 4
Period (sec)
Acc
eler
atio
n (g
)
0
0.5
1
1.5
2
2.5
3
3.5
4
4.5
0 0.5 1 1.5 2 2.5 3 3.5 4
Period (sec)
Acc
eler
atio
n (g
)
0
0.5
1
1.5
2
2.5
3
0 0.5 1 1.5 2 2.5 3 3.5 4
Period (sec)
Acc
eler
atio
n (g
)
0
1
2
3
4
5
6
7
0 0.5 1 1.5 2 2.5 3 3.5 4
Period (sec)
Acc
eler
atio
n (g
)
0
0.5
1
1.5
2
2.5
3
0 0.5 1 1.5 2 2.5 3 3.5 4
Period (sec)
Acc
eler
atio
n (g
)
79
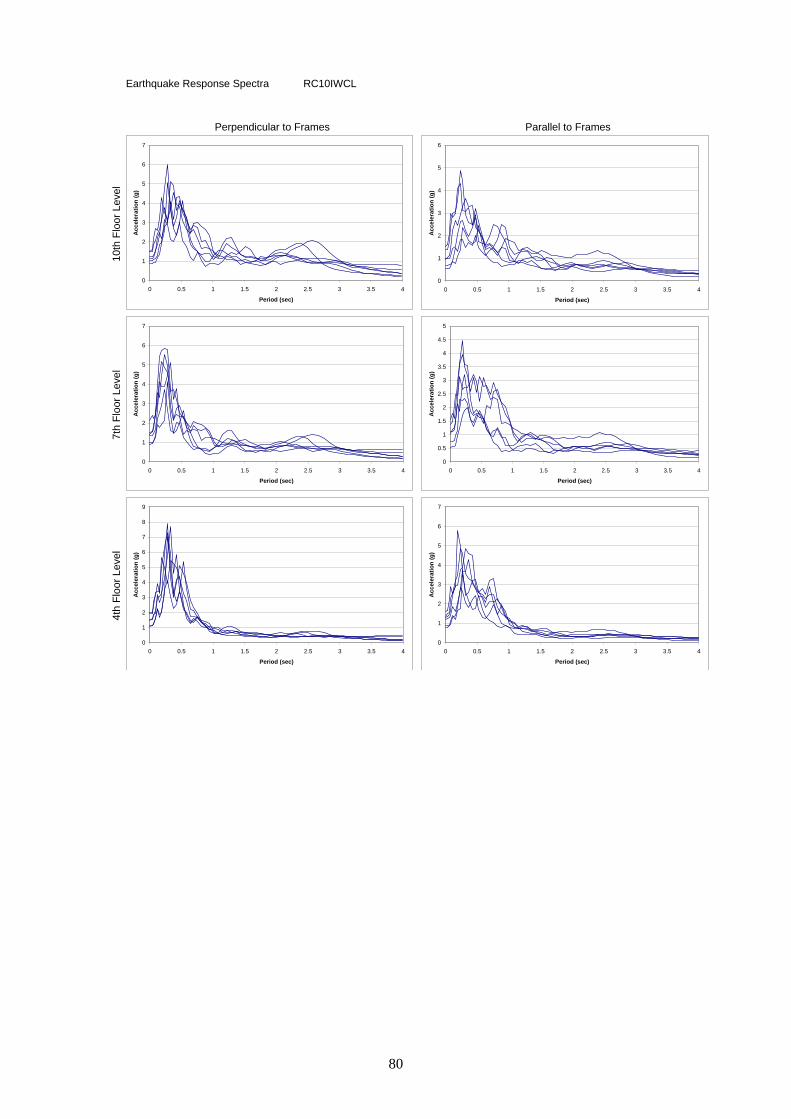
Earthquake Response Spectra RC10IWCL
Parallel to Frames10
th F
loor
Lev
el7t
h Fl
oor L
evel
4th
Floo
r Lev
elPerpendicular to Frames
0
1
2
3
4
5
6
7
0 0.5 1 1.5 2 2.5 3 3.5 4
Period (sec)
Acc
eler
atio
n (g
)
0
1
2
3
4
5
6
0 0.5 1 1.5 2 2.5 3 3.5 4
Period (sec)
Acc
eler
atio
n (g
)
0
1
2
3
4
5
6
7
0 0.5 1 1.5 2 2.5 3 3.5 4
Period (sec)
Acc
eler
atio
n (g
)
0
0.5
1
1.5
2
2.5
3
3.5
4
4.5
5
0 0.5 1 1.5 2 2.5 3 3.5 4
Period (sec)
Acc
eler
atio
n (g
)
0
1
2
3
4
5
6
7
8
9
0 0.5 1 1.5 2 2.5 3 3.5 4
Period (sec)
Acc
eler
atio
n (g
)
0
1
2
3
4
5
6
7
0 0.5 1 1.5 2 2.5 3 3.5 4
Period (sec)
Acc
eler
atio
n (g
)
80
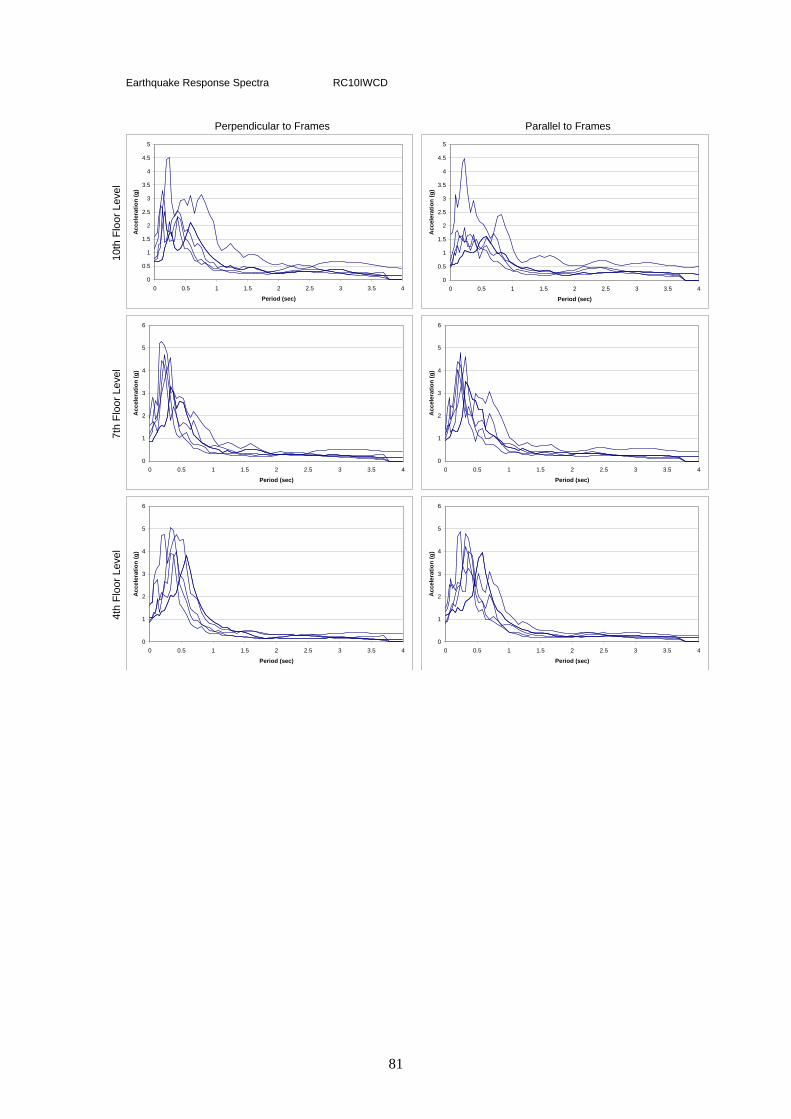
Earthquake Response Spectra RC10IWCD
Parallel to Frames10
th F
loor
Lev
el7t
h Fl
oor L
evel
4th
Floo
r Lev
elPerpendicular to Frames
0
0.5
1
1.5
2
2.5
3
3.5
4
4.5
5
0 0.5 1 1.5 2 2.5 3 3.5 4
Period (sec)
Acc
eler
atio
n (g
)
0
0.5
1
1.5
2
2.5
3
3.5
4
4.5
5
0 0.5 1 1.5 2 2.5 3 3.5 4
Period (sec)
Acc
eler
atio
n (g
)
0
1
2
3
4
5
6
0 0.5 1 1.5 2 2.5 3 3.5 4
Period (sec)
Acc
eler
atio
n (g
)
0
1
2
3
4
5
6
0 0.5 1 1.5 2 2.5 3 3.5 4
Period (sec)
Acc
eler
atio
n (g
)
0
1
2
3
4
5
6
0 0.5 1 1.5 2 2.5 3 3.5 4
Period (sec)
Acc
eler
atio
n (g
)
0
1
2
3
4
5
6
0 0.5 1 1.5 2 2.5 3 3.5 4
Period (sec)
Acc
eler
atio
n (g
)
81
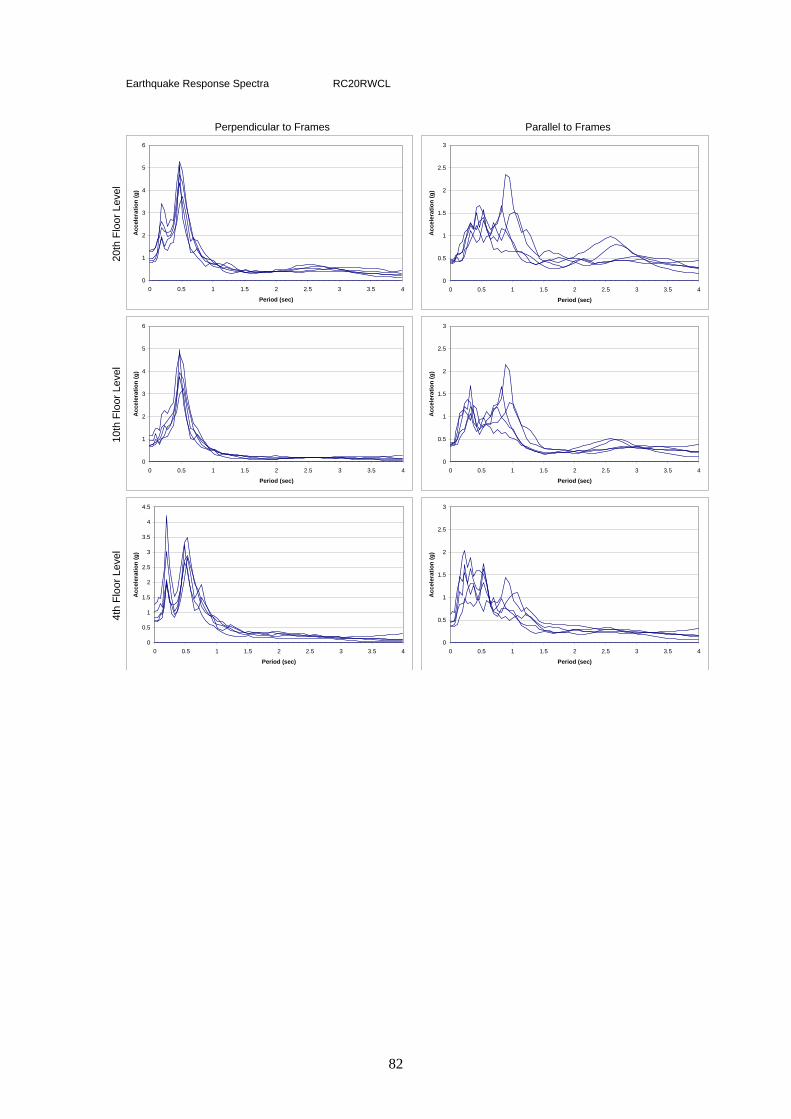
Earthquake Response Spectra RC20RWCL
Parallel to Frames20
th F
loor
Lev
el10
th F
loor
Lev
el4t
h Fl
oor L
evel
Perpendicular to Frames
0
1
2
3
4
5
6
0 0.5 1 1.5 2 2.5 3 3.5 4
Period (sec)
Acc
eler
atio
n (g
)
0
0.5
1
1.5
2
2.5
3
0 0.5 1 1.5 2 2.5 3 3.5 4
Period (sec)
Acc
eler
atio
n (g
)
0
1
2
3
4
5
6
0 0.5 1 1.5 2 2.5 3 3.5 4
Period (sec)
Acc
eler
atio
n (g
)
0
0.5
1
1.5
2
2.5
3
0 0.5 1 1.5 2 2.5 3 3.5 4
Period (sec)
Acc
eler
atio
n (g
)
0
0.5
1
1.5
2
2.5
3
3.5
4
4.5
0 0.5 1 1.5 2 2.5 3 3.5 4
Period (sec)
Acc
eler
atio
n (g
)
0
0.5
1
1.5
2
2.5
3
0 0.5 1 1.5 2 2.5 3 3.5 4
Period (sec)
Acc
eler
atio
n (g
)
82
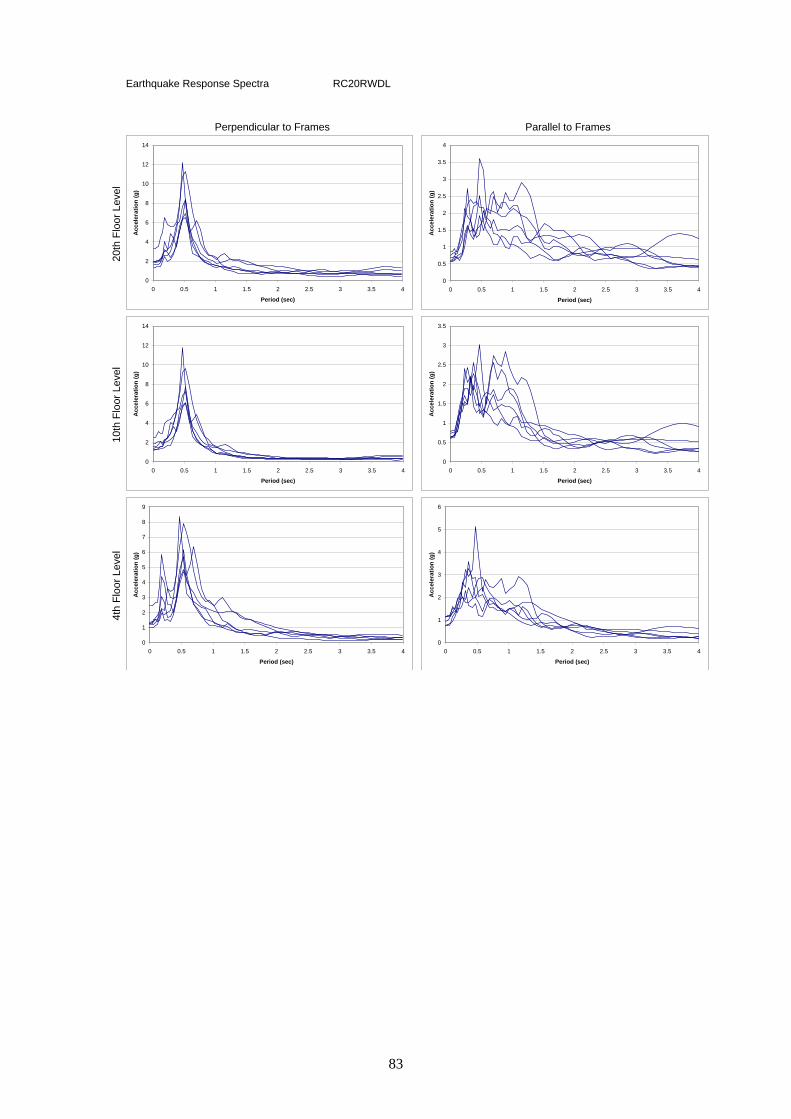
Earthquake Response Spectra RC20RWDL
Parallel to Frames20
th F
loor
Lev
el10
th F
loor
Lev
el4t
h Fl
oor L
evel
Perpendicular to Frames
0
2
4
6
8
10
12
14
0 0.5 1 1.5 2 2.5 3 3.5 4
Period (sec)
Acc
eler
atio
n (g
)
0
0.5
1
1.5
2
2.5
3
3.5
4
0 0.5 1 1.5 2 2.5 3 3.5 4
Period (sec)
Acc
eler
atio
n (g
)
0
2
4
6
8
10
12
14
0 0.5 1 1.5 2 2.5 3 3.5 4
Period (sec)
Acc
eler
atio
n (g
)
0
0.5
1
1.5
2
2.5
3
3.5
0 0.5 1 1.5 2 2.5 3 3.5 4
Period (sec)
Acc
eler
atio
n (g
)
0
1
2
3
4
5
6
7
8
9
0 0.5 1 1.5 2 2.5 3 3.5 4
Period (sec)
Acc
eler
atio
n (g
)
0
1
2
3
4
5
6
0 0.5 1 1.5 2 2.5 3 3.5 4
Period (sec)
Acc
eler
atio
n (g
)
83
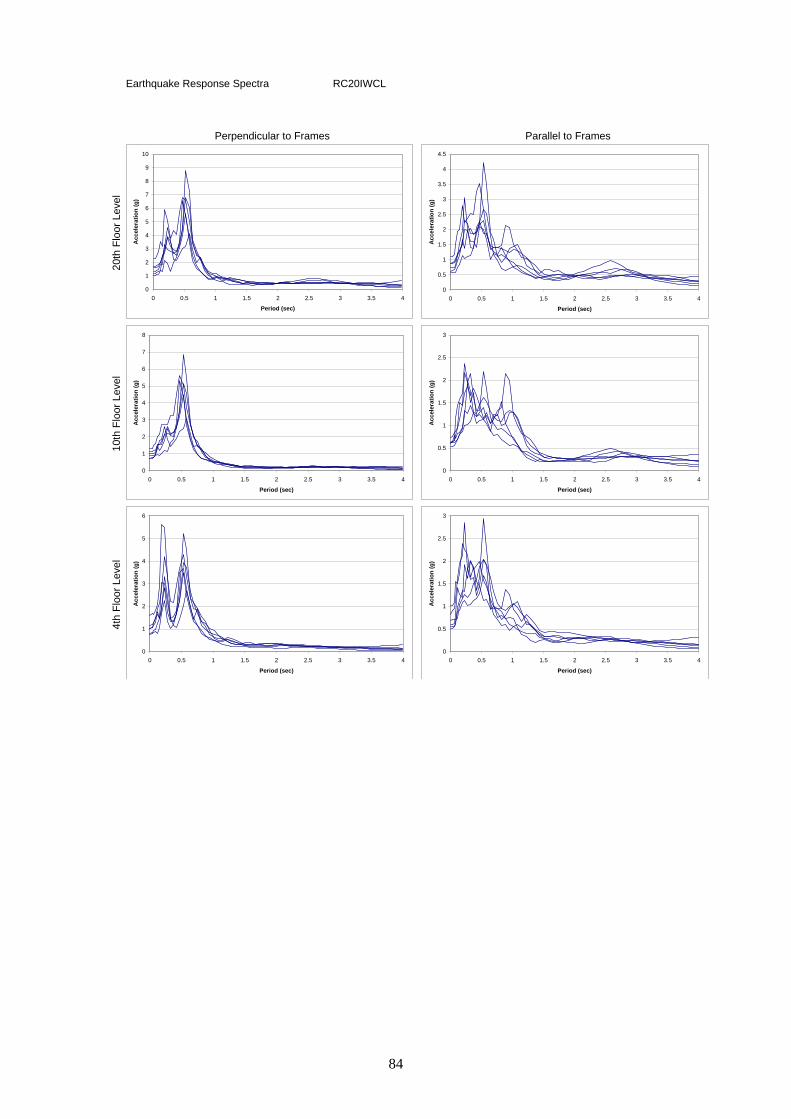
Earthquake Response Spectra RC20IWCL
Parallel to Frames
20th
Flo
or L
evel
10th
Flo
or L
evel
4th
Floo
r Lev
el
Perpendicular to Frames
0
1
2
3
4
5
6
7
8
9
10
0 0.5 1 1.5 2 2.5 3 3.5 4
Period (sec)
Acc
eler
atio
n (g
)
0
0.5
1
1.5
2
2.5
3
3.5
4
4.5
0 0.5 1 1.5 2 2.5 3 3.5 4
Period (sec)
Acc
eler
atio
n (g
)
0
1
2
3
4
5
6
7
8
0 0.5 1 1.5 2 2.5 3 3.5 4
Period (sec)
Acc
eler
atio
n (g
)
0
0.5
1
1.5
2
2.5
3
0 0.5 1 1.5 2 2.5 3 3.5 4
Period (sec)
Acc
eler
atio
n (g
)
0
1
2
3
4
5
6
0 0.5 1 1.5 2 2.5 3 3.5 4
Period (sec)
Acc
eler
atio
n (g
)
0
0.5
1
1.5
2
2.5
3
0 0.5 1 1.5 2 2.5 3 3.5 4
Period (sec)
Acc
eler
atio
n (g
)
84

Earthquake Response Spectra
Parallel to Frames
ST3IWCL
1st f
loor
Lev
el3r
d flo
or le
vel
2nd
floor
Lev
elPerpendicular to Frames
0
1
2
3
4
5
6
0 0.5 1 1.5 2 2.5 3 3.5 4
Period (sec)
Acc
eler
atio
n (g
)
0
1
2
3
4
5
6
0 0.5 1 1.5 2 2.5 3 3.5 4
Period (sec)
Acc
eler
atio
n (g
)
0
1
2
3
4
5
6
7
0 0.5 1 1.5 2 2.5 3 3.5 4
Period (sec)
Acc
eler
atio
n (g
)
0
1
2
3
4
5
6
0 0.5 1 1.5 2 2.5 3 3.5 4
Period (sec)
Acc
eler
atio
n (g
)
0
1
2
3
4
5
6
0 0.5 1 1.5 2 2.5 3 3.5 4
Period (sec)
Acc
eler
atio
n (g
)
0
1
2
3
4
5
6
0 0.5 1 1.5 2 2.5 3 3.5 4
Period (sec)
Acc
eler
atio
n (g
)
85

Earthquake Response Spectra st3iwdl
Roo
f lev
el2n
d flo
or L
evel
Perpendicular to Frames Parallel to Frames
0
1
2
3
4
5
6
7
8
9
0 0.5 1 1.5 2 2.5 3 3.5 4
Period (sec)
Acc
eler
atio
n (g
)
0
1
2
3
4
5
6
7
8
0 0.5 1 1.5 2 2.5 3 3.5 4
Period (sec)
Acc
eler
atio
n (g
)
0
1
2
3
4
5
6
0 0.5 1 1.5 2 2.5 3 3.5 4
Period (sec)
Acc
eler
atio
n (g
)
0
1
2
3
4
5
6
0 0.5 1 1.5 2 2.5 3 3.5 4
Period (sec)
Acc
eler
atio
n (g
)
86

Earthquake Response Spectra
Parallel to Frames
ST3IACL
1st f
loor
Lev
el3r
d flo
or le
vel
2nd
floor
Lev
elPerpendicular to Frames
0
0.5
1
1.5
2
2.5
0 0.5 1 1.5 2 2.5 3 3.5 4
Period (sec)
Acc
eler
atio
n (g
)
0
0.5
1
1.5
2
2.5
0 0.5 1 1.5 2 2.5 3 3.5 4
Period (sec)
Acc
eler
atio
n (g
)
0
0.2
0.4
0.6
0.8
1
1.2
1.4
1.6
1.8
2
0 0.5 1 1.5 2 2.5 3 3.5 4
Period (sec)
Acc
eler
atio
n (g
)
0
0.2
0.4
0.6
0.8
1
1.2
1.4
1.6
1.8
2
0 0.5 1 1.5 2 2.5 3 3.5 4
Period (sec)
Acc
eler
atio
n (g
)
0
0.2
0.4
0.6
0.8
1
1.2
1.4
1.6
1.8
2
0 0.5 1 1.5 2 2.5 3 3.5 4
Period (sec)
Acc
eler
atio
n (g
)
0
0.5
1
1.5
2
2.5
0 0.5 1 1.5 2 2.5 3 3.5 4
Period (sec)
Acc
eler
atio
n (g
)
87
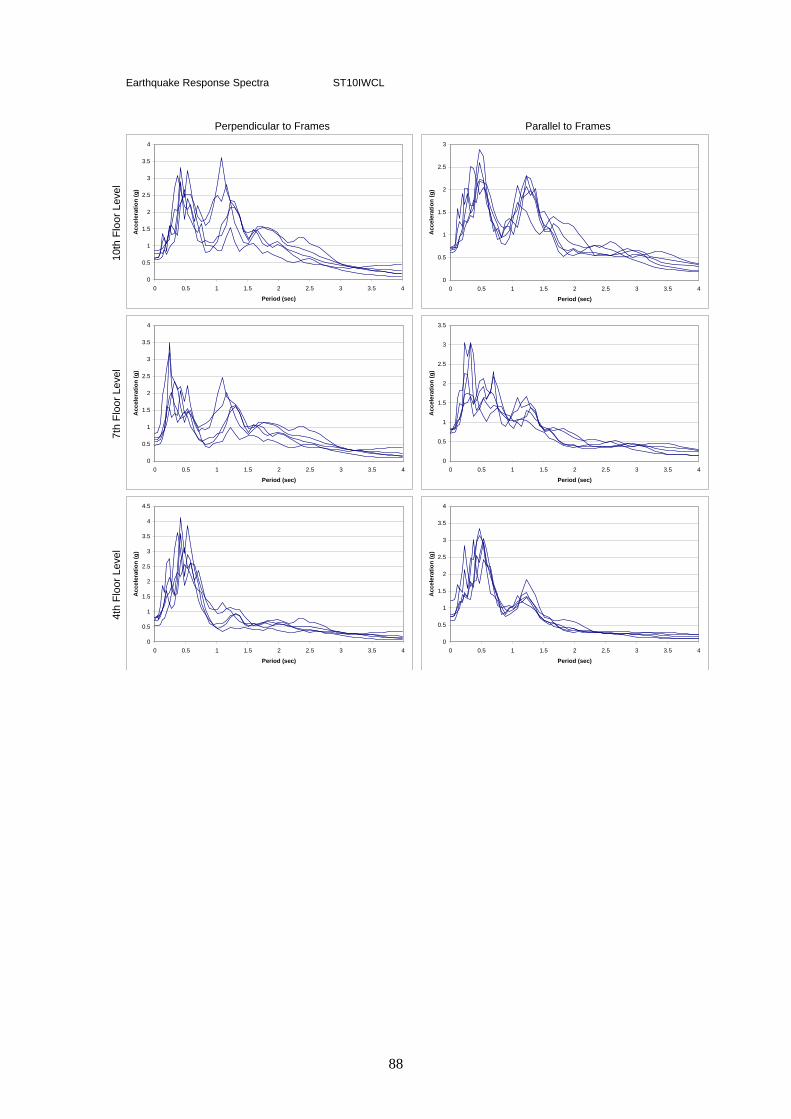
Earthquake Response Spectra ST10IWCL
Parallel to Frames10
th F
loor
Lev
el7t
h Fl
oor L
evel
4th
Floo
r Lev
elPerpendicular to Frames
0
0.5
1
1.5
2
2.5
3
3.5
4
0 0.5 1 1.5 2 2.5 3 3.5 4
Period (sec)
Acc
eler
atio
n (g
)
0
0.5
1
1.5
2
2.5
3
0 0.5 1 1.5 2 2.5 3 3.5 4
Period (sec)
Acc
eler
atio
n (g
)
0
0.5
1
1.5
2
2.5
3
3.5
4
0 0.5 1 1.5 2 2.5 3 3.5 4
Period (sec)
Acc
eler
atio
n (g
)
0
0.5
1
1.5
2
2.5
3
3.5
0 0.5 1 1.5 2 2.5 3 3.5 4
Period (sec)
Acc
eler
atio
n (g
)
0
0.5
1
1.5
2
2.5
3
3.5
4
4.5
0 0.5 1 1.5 2 2.5 3 3.5 4
Period (sec)
Acc
eler
atio
n (g
)
0
0.5
1
1.5
2
2.5
3
3.5
4
0 0.5 1 1.5 2 2.5 3 3.5 4
Period (sec)
Acc
eler
atio
n (g
)
88
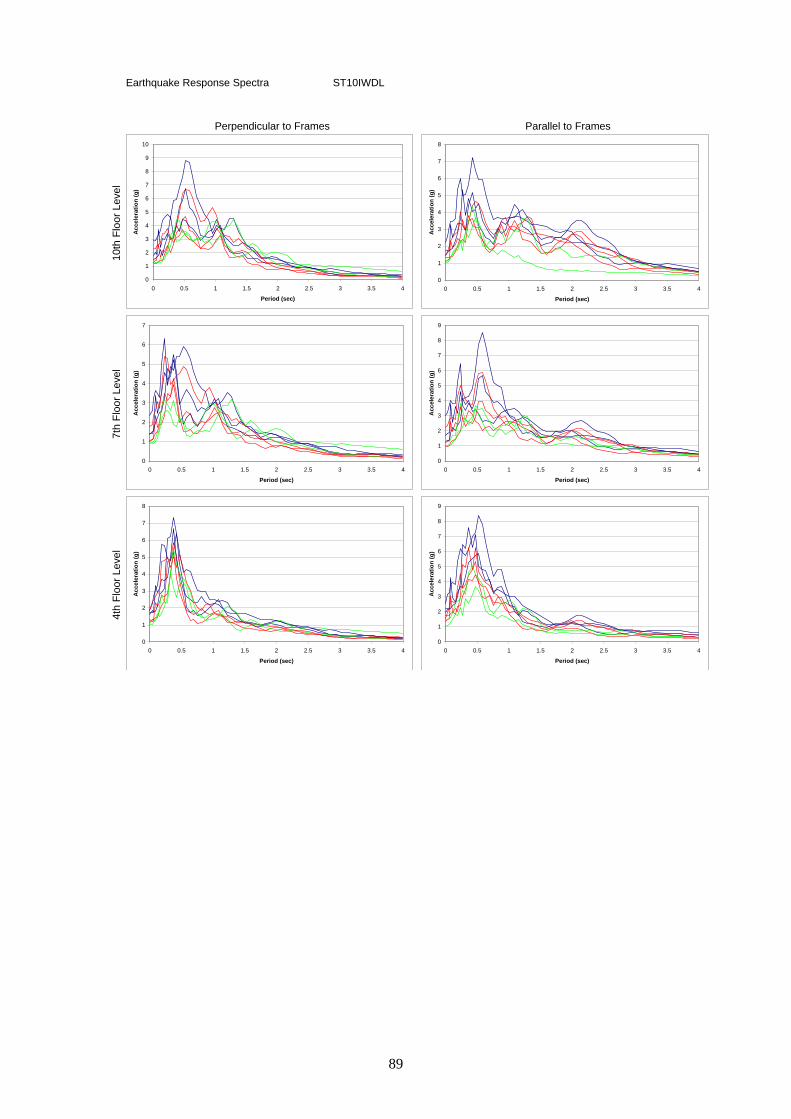
Earthquake Response Spectra ST10IWDL
Parallel to Frames10
th F
loor
Lev
el7t
h Fl
oor L
evel
4th
Floo
r Lev
elPerpendicular to Frames
0
1
2
3
4
5
6
7
8
9
10
0 0.5 1 1.5 2 2.5 3 3.5 4
Period (sec)
Acc
eler
atio
n (g
)
0
1
2
3
4
5
6
7
8
0 0.5 1 1.5 2 2.5 3 3.5 4
Period (sec)
Acc
eler
atio
n (g
)
0
1
2
3
4
5
6
7
0 0.5 1 1.5 2 2.5 3 3.5 4
Period (sec)
Acc
eler
atio
n (g
)
0
1
2
3
4
5
6
7
8
9
0 0.5 1 1.5 2 2.5 3 3.5 4
Period (sec)
Acc
eler
atio
n (g
)
0
1
2
3
4
5
6
7
8
0 0.5 1 1.5 2 2.5 3 3.5 4
Period (sec)
Acc
eler
atio
n (g
)
0
1
2
3
4
5
6
7
8
9
0 0.5 1 1.5 2 2.5 3 3.5 4
Period (sec)
Acc
eler
atio
n (g
)
89
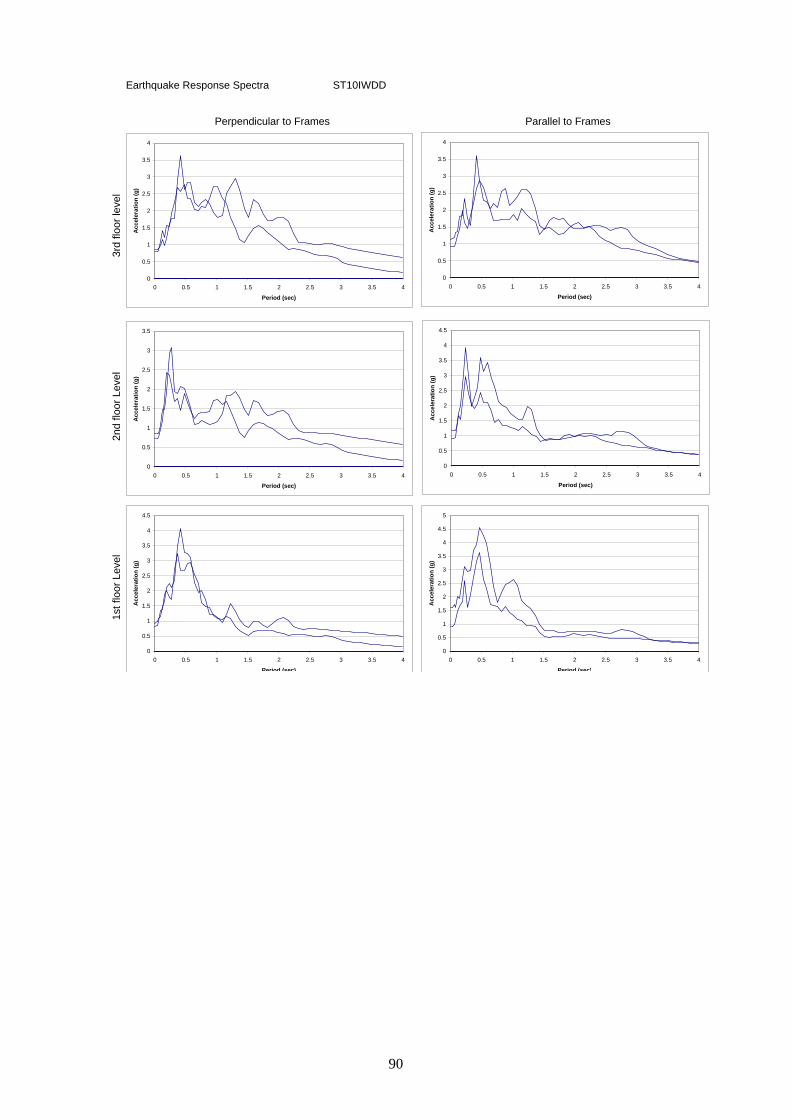
Earthquake Response Spectra ST10IWDD
Parallel to Frames1s
t flo
or L
evel
3rd
floor
leve
l2n
d flo
or L
evel
Perpendicular to Frames
0
0.5
1
1.5
2
2.5
3
3.5
0 0.5 1 1.5 2 2.5 3 3.5 4
Period (sec)
Acc
eler
atio
n (g
)
0
0.5
1
1.5
2
2.5
3
3.5
4
4.5
0 0.5 1 1.5 2 2.5 3 3.5 4
Period (sec)
Acc
eler
atio
n (g
)
0
0.5
1
1.5
2
2.5
3
3.5
4
0 0.5 1 1.5 2 2.5 3 3.5 4
Period (sec)
Acc
eler
atio
n (g
)
0
0.5
1
1.5
2
2.5
3
3.5
4
0 0.5 1 1.5 2 2.5 3 3.5 4
Period (sec)
Acc
eler
atio
n (g
)
0
0.5
1
1.5
2
2.5
3
3.5
4
4.5
0 0.5 1 1.5 2 2.5 3 3.5 4
Period (sec)
Acc
eler
atio
n (g
)
0
0.5
1
1.5
2
2.5
3
3.5
4
4.5
5
0 0.5 1 1.5 2 2.5 3 3.5 4
Period (sec)
Acc
eler
atio
n (g
)
90

Appendix 7: Submission on parts to Standards New Zealand. DRAFT PARTS, SECTION 9. A7: 1. General A7: 1.1 Scope
Where required by Section 2, all parts of structures, including permanent, non-structural components and their connections, and permanent services and equipment supported by structures, shall be designed for the earthquake actions specified in this section. Where the mass of the part is in excess of 20% of the combined mass of the part and the primary structure and its period is greater than 0.2 seconds, a special study shall be carried out in accordance with 9.7.
A7: 1.2 Classification of parts
Parts shall be classified into the categories shown in Table 9.1. Table A7.1: Classification of parts
Category Criteria Rp
P.1 Part representing a hazard to life outside the building. * 0.9
P.2 Part representing a hazard to a crowd of greater than 100 people within the building. *
0.9
P.3 Part representing a hazard to individual life within the building. *
0.8
P.4 Part necessary for the continuing function of life safety systems within the building
0.9
P.5 Part required for operational continuity of the building. 1.0
P.6 Part for which the consequential damage caused by its failure are disproportionately great.
TBDD, but > 1.1
P.7 All other parts. 1.0
* To be considered in this category, the part must weigh more than 10 kg, and be able to fall more than 3 metres onto a publicly accessible area.
Notes:
NR = Not required to be considered. TBDD = To be determined by the designer.
91

A7: 2. Design actions A7: 2.1 Horizontal force
The horizontal design earthquake force on a part, Fph, shall be determined from equation 1:
pppfph WRCCCF )0(= , Eq 1
where:
C(0) is the site hazard coefficient with T = 0, determined from 3.1, using the values for the modal response spectra/non-linear time history methods,
Cf is the floor acceleration coefficient determined from 9.3, Cp is the part response coefficient determined from 9.4, Rp is the part risk factor as given by Table 9.1, Wp is the weight of the part.
Vertical force Parts which are sensitive to vertical acceleration amplification shall be designed for vertical earthquake actions. Unless determined by a special study in accordance with 9.7, the vertical earthquake force on a part, Fpv, shall be calculated by equation 2:
pppv RWCF vd= , Eq 2 where:
Cvd is the vertical design action coefficient determined from 5.4, Wp is the weight of the part, including the live load tributary to it, Rp is the risk factor as given by Table 9.1.
A7: 2.2 Deflection induced force
Where the part is connected to the primary structure on more than one level, the deflections of the primary structure at the connection points shall be calculated in accordance with clause 8.3. The forces induced on the part (including the fixings) by the relative deflections between the connection points shall be considered in addition to the inertial forces determined from 9.2.1, and 9.2.2.
A7: 3. Floor coefficient
The floor acceleration coefficient, Cf, shall be calculated by equations 3a and 3b:
Cf = (1 + 10 hx
) for x < 0.2h, Eq 3a
Cf = 3.0 for x => 0.2h, Eq 3b where: x = height of the attachment of the part h = height of the top structural level.
Cf for levels below ground floor level shall be taken as the same as at ground floor level.
92

A7: 4. Part coefficient
The part coefficient, Cp, shall be calculated from equations 4a and b:
Cp = 2.0M�p for Tp < 0.75 sec, Eq 4a Cp = 0.50M�p for Tp => 1.5 sec, Eq 4b
where: Tp is the period of the part Mµp is the part response factor as given by Table 9.2.
For Tp between 0.75 sec and 1.0 sec, use linear interpolation.
Table A7.2 − Part Response Factor, M�P
Ductility of the part, µp
Mµp
1.0 0.67 1.25 0.67 2.0 0.54 3.0 0.4 4.0 or greater 0.35
Unless the level of floor acceleration is such as to bring about yielding of the part, then �p shall be taken as 1.0.
A7: 5. Diaphragms
All diaphragms shall be designed for inertial forces calculated using equation 1, with Cp = 1.0. Diaphragms which transfer forces into the primary structure, or which transfer forces from one structural system to another shall be designed as part of the primary force resisting system, and the forces calculated by equation 1 shall be additional to the forces induced by the transfer action.
A7: 6. Connections
Non-ductile connections for parts shall be designed for seismic actions corresponding to a ductility factor of the part of �p = 1.25. Non-ductile connections include, but are not limited to, expansion anchors, shallow chemical anchors or shallow (non-ductile) cast-in-place anchors in tension not engaged with the main reinforcement. Other connections may be designed for a greater value of �p where the specific detailing can be verified to sustain not less than 90% of their design loads at displacement greater than twice their yield displacement under reversed cyclic loading.
A7: 7. Special studies
As an alternative to any of the techniques of assessment of forces on parts described in the preceding sections forces may be determined by Special Study. Such studies are outside the scope of this standard as a means of verification for the New Zealand Building Code and as a deemed to comply method for the Australian Building Code.
93