Embed Size (px)
Citation preview
Pr Frederick GRINEPr Bruno MAUREILLEPr Frédéric VAYSSE
12/09/2016

1
Acknowledgement
I would like to express my deepest appreciation to the supervisor of my doctoral studies, Professor José Braga, at the Laboratoire d’Anthropologie Moléculaire et Imagerie de Synthèse, not only for accepting me as a PhD student three years ago, but for his continuous support throughout my doctoral study. He kindly provided me with many opportunities to participate in research projects, fieldwork and collaborations. His enthusiasm, persistance and dedication in research have a deep influence on me and my future academic career. Jean Dumoncel, our engineer and technician, particularly assisted me during my doctoral studies, he helped me with the geometric morphometric analyses I employed in this thesis. He kindly taught me how to use the programs he developed, patiently helped me when I encountered difficulties with the statistical analyses. I would like to thank Clément Zanolli, for including me in his research projects, for providing micro-CT data of modern humans and Neanderthals, Clément and I also had many fruitful discussions on the study sample, the interpretations of the results, and on my career choice. I thank Amélie Beaudet for helping me with principals of enamel thickness measurements and geometric morphometrics, and she was always there when I had difficulties with the French language and administrations. I would like to express my gratitude to these colleagues and instututions which helped with the micro-CT scans and data collection: Firkkie de Beer and Jakobus Hoffman (South African Nuclear Energy Corporation), Benjamin Duployer and Christophe Tenailleau (UMR 5085 CNRS), Song Xing (IVPP); for the permissions and assistance to study the materials, I thank Francis Thackeray (Wits University), Stephany Potze (Ditsong National Museum of Natural History), Anna Oettlé (University of Pretoria) and Catherine Thèves (UMR 5288 CNRS). Also, I would like to especially thank Francis for his kind support when I tried to apply for a post-doc position. During my doctoral studies I was fortunate to receive valuable support from many senior scholars, I thank Roberto Macchiarelli for his insights on the Neanderthal taxonomy and chronology; Maria Martinón-Torres for her kind acceptance of collaboration; Wu Liu and Xiujie Wu for information on Chinese fossil hominins and for their advice on pursuing a career; Laurent Bruxelles for his interpretation of the Kromdraai stratigraphy and Sterkfontein cave systems. I deeply appreciate the reviewers of my doctoral dissertation for their efforts to improve the quality of the manuscript, I will benefit from their valuable comments and suggestions during my future academic career. Portions of the research presented here were supported by the Centre National de la Recherche Scientifique, the French Ministry of Foreign Affairs, the French Embassy in South Africa through the Cultural and Cooperation Services, and my doctoral studies were supported by the China Scholarship Council. Last but not least, I would like to thank my family for their unconditional support and understanding. I also thank my friends Jing Lu and Youan Zhu, for their help with basics of vertebrate comparative anatomy and many other things, I am indebted for their unending friendship and encouragement.
2
The earliest members of the genus Homo in South Africa:
Evidence from inner structure of lower postcanine dentition
ABSTRACT
This thesis consists of two individual projects and six chapters, which are based on the examination
of dental inner structure of lower postcanine dentition in a number of fossil and modern specimens,
through which a comprehensive study has been done using micro-computed tomography and computer-
assisted paleonanthropology tools. We first documented and assessed the taxonomical value of enamel
thickness and 3D whole-crown enamel thickness distribution patterns in a number of earliest members
of the genus Homo in South Africa, and looked into the taxonomic relavence of EDJ morphology along
postcanine dentition, and discussed the possible adaptive/developmental factors that account for the
variation of EDJ morphology we observed here.
The first three chapters (Introduction, Materials and Methods) provide an overview of the objectives
of this thesis, and review previous studies. Also, they provide a detailed introduction of fossil materials,
sites and a background of computer-aided method (micro-XCT) to analyze the dental inner structure. The
Results chapter comprises of two independent research papers, in different stages of submission and
publication. The Results and Discussion chapters offer an extensive summary of enamel thickness, EDJ
geometric morphometrics and 3D-EDJ metameric variation between species, and compare the results
with a number of morphological and developmental studies, and provide an outlook of future study. The
last chapter reaches the conclusive points of this thesis, it highlights the taxonomical value of premolar
EDJ, and emphasizes the mosaic features of the dentition of South African early Homo.
3
TABLE OF CONTENTS
Acknowledgement ............................................................................................................................ 1
ABSTRACT ...................................................................................................................................... 2
LIST OF TABLES AND FIGURES ................................................................................................. 5
List of tables .............................................................................................................................. 5
List of figures ............................................................................................................................ 6
1. INTRODUCTION ........................................................................................................................ 8
2. MATERIALS .............................................................................................................................. 14
2.1 Comparative materials ...................................................................................................... 14
2.2 Stratigraphy of paleontological sites ................................................................................. 16
2.2.1 Swartkrans ............................................................................................................. 16
2.2.2 Kromdraai B ........................................................................................................... 18
2.2.3 Sterkfontein Member 4 ........................................................................................... 21
2.3 Early Homo materials ........................................................................................................ 22
3. METHODS ................................................................................................................................. 28
3.1 Micro-computed tomography ............................................................................................ 28
3.2 Tissue segmentation and surface generation ..................................................................... 29
3.3 Three-dimensional enamel thickness and whole-crown enamel thickness distribution .... 31
3.4 Geometric morphometrical analyses ................................................................................. 33
3.4.1 Study A: EDJ shape variation between groups of a given tooth position ............... 36
3.4.2 Study B: intra- and inter-individual metameric variation of EDJ shape, and degrees of metameric variation between groups .......................................................................... 37
4. RESULTS .................................................................................................................................... 40
4.1 Three-dimensional enamel thickness ................................................................................ 40
4.2 Whole-crown enamel thickness distribution ..................................................................... 44
4.3 Geometric morphometric analyses on EDJ shape ............................................................. 49
4.3.1 EDJ shape variation between groups of a given tooth position ............................. 49
Pan, L., Dumoncel, J., de Beer, F., Hoffman, J., Thackeray, J. F., Duployer, B., Tenailleau, C., Braga, J., 2016. Further morphological evidence on South African earliest Homo lower postcanine dentition: enamel thickness and enamel dentine junction. J. Hum. Evol. 96, 82–96. ............................................................................... 57
4.3.2 Intra- and inter-individual metameric variation of EDJ shape .............................. 58
Pan, L., Thackeray, J., Dumoncel, J., Zanolli, C., Oettlé, A., De Beer, F., Hoffman, J., Duployer, B., Tenailleau, C., Braga, J., 2016. Intra-individual metameric variation expressed at the enamel-dentine junction of lower post-canine dentition of South African fossil hominins and modern humans. Am. J. Phys. Anthropol. (Sumbitted). ................................................................................................................... 63
5. DISCUSSION ............................................................................................................................. 64
5.1 The taxonomical/adaptive values of enamel thickness ..................................................... 66
5.2 What does 3D-EDJ shape tell us? ..................................................................................... 69
5.3 Perspectives ....................................................................................................................... 74
6. CONCLUSION ........................................................................................................................... 76
LITERATURE CITED .................................................................................................................... 79

4
Appendix A. 3D enamel thickness data for each mandibular specimen. Values are measured in mm, mm2 or mm3. The crown and roots were separated by cervical line according to Benazzi et al. (2014). ........................................................................................................................................................ 89
Appendix B. Connover’s post hoc pairwise comparisons of 3D AET and RET after Kruskal-Wallis test statistics are reported below the table ....................................................................................... 92

5
LIST OF TABLES AND FIGURES
List of tables
Table 2.1 Composition of the study sample. ................................................................................... 15
Table 2.2 Craniodental specimens from the South African sites of Sterkfontein, Swartkrans and Drimolen attributable to the genus Homo (modified from Grine et al., 2009). ............................... 24
Table 3.1 Composition of samples used in the enamel thickness analyses ..................................... 33
Table 3.2 Specimens included in the bgPCA for the study of EDJ shape variation between groups of a given dental position ................................................................................................................ 37
Table 3.3 Specimens used in the study of metameric variation of EDJ shapes. .............................. 39
Table 4.1 Average (in mm) and relative enamel thickness (3D AET and 3D RET) values in each taxon ................................................................................................................................................ 41
Table 5.1 Summary of the features observed from the analyses according to each taxon .............. 65

6
List of figures
Figure 2.1“Cradle of Humankind” World Heritage and Swartkrans site after Gibbon et al. (2014). (A) Political map of southern Africa (left), with the “Cradle of Humankind” World Heritage area in detail (right). (B) Plan view of Swartkrans. (C) Schematic section, designated on the plan in (B), running north-south through the filling of the outer portion of Swartkrans Cave. Member 2 is not shown in order to clarify the underlying deposits of Member 1. .................................................... 17
Figure 2.2 East-West section of Kromdraai B, according to Vrba (1981) ....................................... 19
Figure 2.3 Geological map of Sterkfontein deposits showing the Member 4 and 5 sediments and the positions of the five boreholes, after Pickering and Kramers (2010) and Partridge and Watt (1991) ........................................................................................................................................................ 21
Figure 2.4 The occlusal (A, D), buccal (B, E) and lingual (C, F) view of SKX 21204 P3 (A–C) and P4 (D–F), with special reference to the EDJ morphology. Note that the dental size is not to scale.25
Figure 2.5 The occlusal (A), buccal (B) and lingual (C) view of SKX 257, with special reference to the EDJ morphology. Note that the dental size is not to scale. ....................................................... 26
Figure 2.6 The occlusal (A), buccal (B) and lingual (C) view of SK 15 RM2 and M3, with special reference to the EDJ morphology. Note that the dental size is not to scale..................................... 26
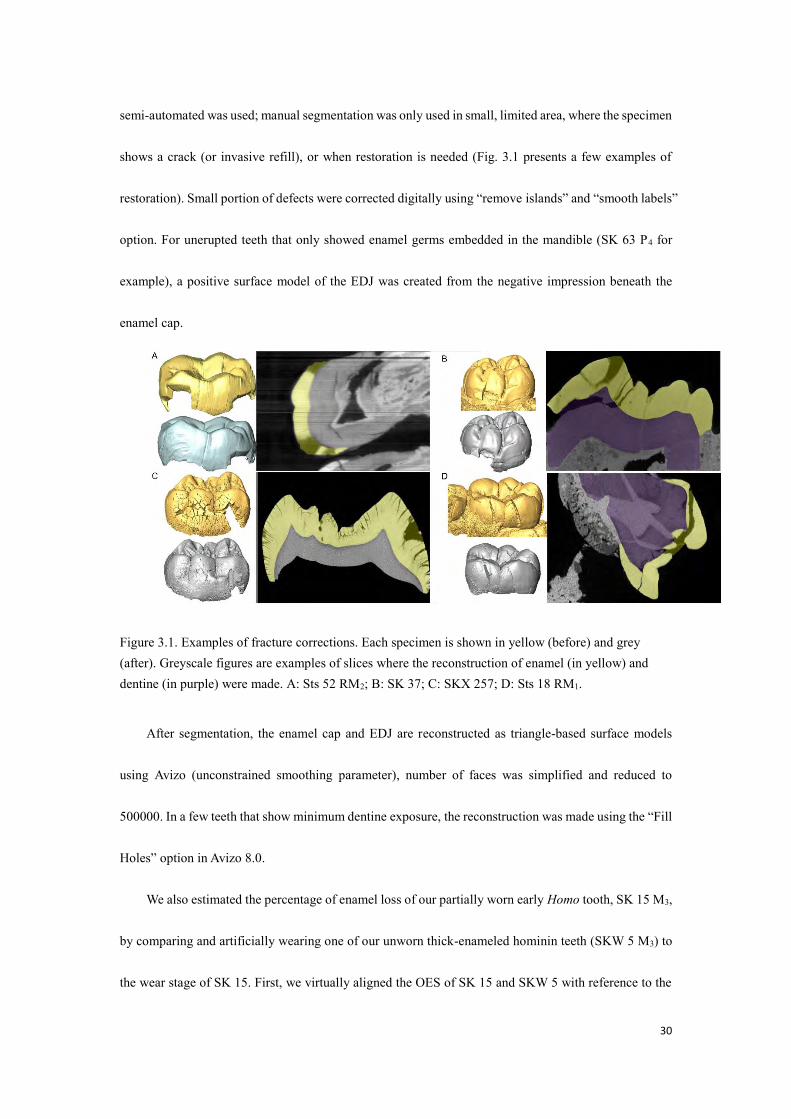
Figure 3.1. Examples of fracture corrections.. ................................................................................ 30
Figure 3.2 Estimation of worn enamel in SK 15. ............................................................................ 31
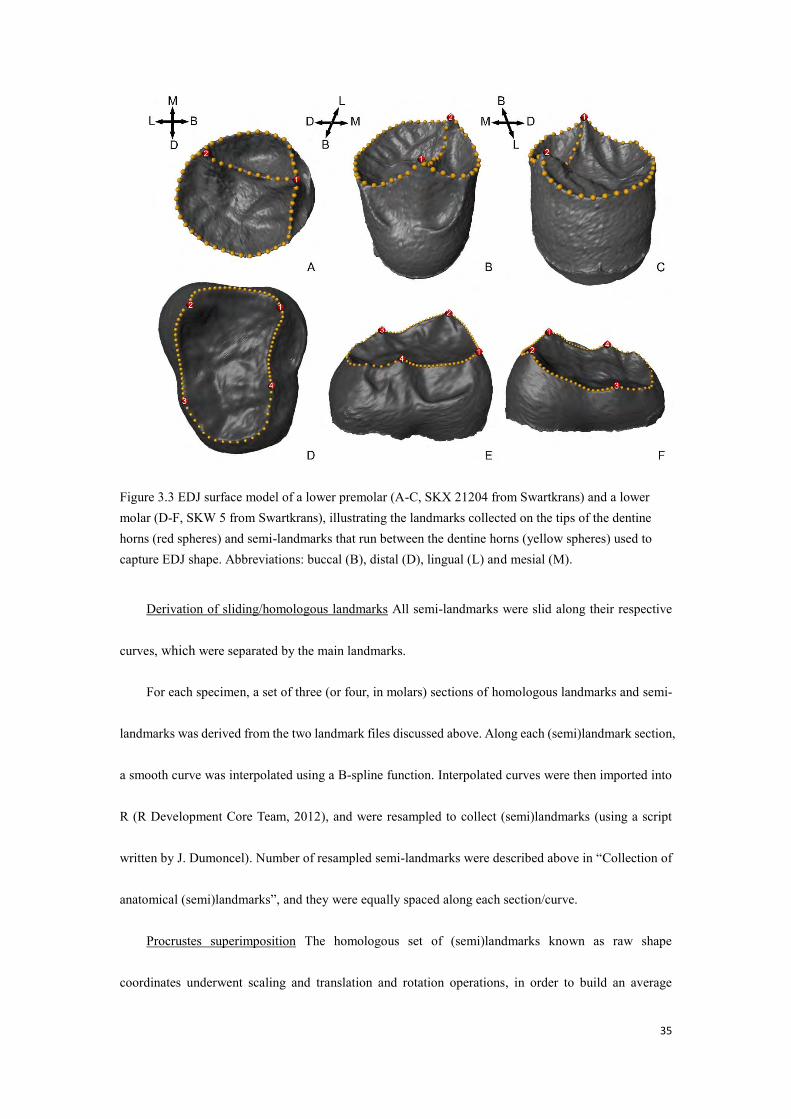
Figure 3.3 EDJ surface model of a lower premolar (A-C, SKX 21204 from Swartkrans) and a lower molar (D-F, SKW 5 from Swartkrans), illustrating the landmarks collected on the tips of the dentine horns (red spheres) and semi-landmarks that run between the dentine horns (yellow spheres) used to capture EDJ shape.. ..................................................................................................................... 35
Figure 4.1 Average (in mm) and relative enamel thickness (3D AET and 3D RET) values in each taxon.. .............................................................................................................................................. 42
Figure 4.2 Enamel thickness distribution in premolars. The color scale of enamel thickness is relative to each tooth. Bar=5 mm. ................................................................................................... 45
Figure 4.3 Enamel thickness distribution in M1s. The color scale of enamel thickness is relative to each tooth. Bar=5 mm. .................................................................................................................... 46
Figure 4.4 Enamel thickness distribution in M2s. The color scale of enamel thickness is relative to each tooth. Bar=5 mm. .................................................................................................................... 47
Figure 4.5 Enamel thickness distribution in M3s. The color scale of enamel thickness is relative to each tooth. Bar=5 mm. .................................................................................................................... 49
Figure 4.6 A–B: Results of bgPCAs of the semi-landmark configurations of P3 and P4, respectively. ........................................................................................................................................................ 51
Figure 4.7 A–C: Results of bgPCAs of the semi-landmark configurations of M1–M3, respectively ........................................................................................................................................................ 53
Figure 4.8 Landmark series of EDJ after Procrustes superimposition and bgPCA. Arrows locate corresponding features described in the text ................................................................................... 54
Figure 4.9 A–C: Results of bgPCA of the semi-landmark configurations, including Neanderthals.. ........................................................................................................................................................ 56

7
Figure 4.10 Metameric EDJ shape variation in fossil and extant taxa. ........................................... 60
Figure 4.11 Dendrograms of metameric variation in EDJ shape. ................................................... 62

8
1. INTRODUCTION
Teeth are unique among vertebrate animals, they are generally thought to have arisen
phylogenetically from the bony armor of primitive fishes, and neural crest cells contribute to parts of the
forming tooth. Because tooth enamel represents the hardest substance in the body and forms the surface
of the crown, teeth are often well-preserved during degradation events and thus comprise one of the most
informative materials in hominin evolution studies (Bailey and Hublin, 2007). Analysis on general
morphology of the outer enamel could reconstruct taxonomy and phylogeny among hominin taxa
(Robinson, 1956; Suwa et al., 1994, 1996; Bailey et al., 2011, 2014), track temporal variations along a
lineage (Lockwood et al., 2000), explore dietary adaptations (Kay, 1985; Lucas et al., 1985, 2008;
Berthaume, 2014; Kaiser et al., 2015).
Molar enamel thickness has provided information about hominin taxonomy, functional morphology
and dietary ecology (Kay, 1981, 1985; Martin, 1985; Ungar et al., 2006; Kono and Suwa, 2008;
Olejniczak et al., 2008c; Smith et al., 2008). With the exception of studies on the 2D and 3D relative
enamel thickness reveal that relative enamel thickness could effectively distinguish Neanderthals from
modern human (Olejniczak et al., 2008a; Bailey et al., 2014; Benazzi et al., 2015), enamel thickness has
been shown to be homoplastic (Schwartz, 2000; Smith et al., 2003; Olejniczak et al., 2008b; Skinner et
al., 2015). For instance, it is believed that relatively thick molar enamel in humans was attained through
a different developmental mechanism than in early thick-enameled hominins (including australopiths and
H. erectus) (Dean et al., 2001; Lacruz et al., 2008), indeed, thick molar enamel in humans was achieved
through a differential loss of the dental component over the enamel component, and was related to
distalward molar crown size reduction (Grine, 2005b; Evans et al., 2016).
Whole crown three dimensional (3D) distribution of molar enamel has been investigated in
9
Australopithecus africanus, Paranthropus robustus and modern human with the use of micro-computed
tomography (micro-CT) (Kono et al., 2002; Kono and Suwa, 2008; Olejniczak et al., 2008b,c; Suwa et
al., 2009). These studies have suggested distinct patterns among some fossil hominin species, but data
on Early-Middle Pleistocene fossil hominins’ whole-crown enamel distributions have been restricted to
Ardipithecus (Suwa et al., 2009), Au. africanus, P. robustus (Olejniczak et al., 2008a,b) and Homo erectus
(Zanolli, 2015). Olejniczak et al. (2008b) argued that P. robustus enamel was not hyper-thick, and that A.
africanus enamel was relatively thinner than that of modern humans. The 3D enamel distribution maps
showed that australopith molar enamel was thickest over cusp tips, while recent humans had thicker
enamel surrounding the cusp base, thick cuspal enamel and short dentine horns in australopiths results in
a tabular occlusal surface, which serves as a means to prolong functional crown life by preventing cusp
fracture and increasing the attritional longevity (Lucas et al., 2008; Olejniczak et al., 2008b). It was also
suggested that simple cross-sectional measurements did not reliably predict the observed 3D patterns
(Olejniczak et al., 2008b). As yet, enamel thickness in specimens transitional to Homo (here referred to
as early Homo) or attributed to premodern Homo (Homo erectus or Homo ergaster) has been measured
largely from naturally fractured teeth (Beynon and Wood, 1986; White et al., 1994) or virtual two
dimensional (2D) measurements based on medical CT (Schwartz, 1997) and micro-CT imaging (Smith
et al., 2012; Skinner et al., 2015). Enamel thickness has been reported as being significantly thinner in
early Homo than in Paranthropus (Beynon and Wood, 1986, 1987; Rozzi, 1998). More recently, virtual
2D measurements based on micro-CTs indicated that values obtained in three early Homo molars from
South Africa exceeded modern human ranges and were closer to the “hyper thick ” Paranthropus
condition (Smith et al., 2012). Also, 2D and 3D measurements both recognized thinner enamel relative
to dentine proportion in Neanderthal deciduous and permanent teeth, compared with modern humans
10
(Olejniczak et al., 2008a; Fornai et al., 2014; Benazzi et al., 2015). It was therefore concluded that molar
enamel thickness was highly variable within the genus Homo (Smith et al., 2012).
Many studies have been accomplished to investigate developmental processes controlling tooth
morphogenesis, dental variation and the origination of dental novelties. The enamel-dentine junction
(EDJ) constitutes a precursor for the morphology of the outer enamel surface through growth of the
enamel cap which may go along with the addition of original features. Previous studies found that EDJ
carries most of the occlusal morphology of the tooth, significant correlation is observed for elevation,
orientation, inclination, curvature and occlusal complexity between the OES and the EDJ, but small
features at the EDJ can be masked by thick enamel (Bailey et al., 2011; Guy et al., 2015). Observation
on the morphology at the enamel dentine junction of the postcanine dentition (Corruccini, 1987;
Olejniczak et al., 2004, 2007; Skinner et al., 2009, 2010; Braga et al., 2010) have supplemented
investigations made separately on enamel thickness distribution. Indeed, primate postcanine EDJ
morphology carries useful taxonomic and phylogenetic information (Butler, 1956; Olejniczak et al., 2004,
2007; Skinner et al., 2008a,b), and can successfully discriminate between species and subspecies of
chimpanzee (Skinner, 2008). Dentine horn height, crown height, cervix shape and protostylid expression
all preserve taxonomically relevant shape information in Au. africanus and P. robustus. These two taxa
show similar 3D EDJ shape inter-individual metameric trends along the molar dentition, but P. robustus
preserves a marked reduction in the buccolingual breadth of the distal crown between M2 and M3, and a
marked interradicular extension of the enamel cap in M1 and M2 (Skinner et al., 2008b). When compared
with extant humans, the degree of intra-individual metameric variation is small in Au. africanus as in
Pan specimens (Hlusko, 2002; Braga et al., 2010). Moreover, in Au. africanus the EDJ the protostylid
crest extends mesially around the base of the protoconid dentine horn, whereas in P. robustus the crest

11
tends to be located between the dentine horns of the protoconid and hypoconid (Skinner et al., 2009). 3D
geometric morphometric (GM) studies indicated that enamel crown and cervical outlines are less
taxonomically informative than outer and inner crown surfaces, by analyzing M2 shape variation in
australopiths, South African early Homo, modern humans and Neanderthals (Fornai et al., 2015).
The dental metameric variation has also been explained in the framework of development, but the
exact mechanisms that are responsible for such variation along the tooth row are still unclear. During the
20th century, the accumulation of paleontological evidence, combined with data on tooth development in
living taxa, showed that dentitions of higher vertebrates were heterodont (i.e., composed of different
tooth types) and organized into morphogenetic fields (e.g., Butler, 1956; Smith et al., 1997). This concept
was then adapted to the human dentition, with four identified morphogenetic fields (incisor, canine,
premolar and molar; Dahlberg, 1945) and a gradient of tooth size, complexity and shape going distalward
from the polar tooth in each field (Van Valen, 1970). Subsequently, Osborn (1978) elaborated the Clone
Theory, in which he hypothesized that there are separate clone cells in each tooth class, arising from
differentially programmed stem progenitors . These models are not sufficient to separately explain tooth
morphogenesis and recent findings in molecular biology and genetics suggest that both Field and Clone
theories are complementary to each other (Townsend et al., 2009).
Another possible evolutionary implication of EDJ morphology lies in the dietary adaptation. A
substantial expression of protostylid on the EDJ level could possibly add to the occlusal area of a molar
and reinforce the crown (Schwartz, 2000; Skinner et al., 2009). Another untested hypothesis also suggests
that the EDJ topology is related to dietary adaptations, for example, a flat EDJ topology with higher
enamel crown could indicate a hard/abrasive food adaptation (Suwa et al., 2007), this is in line with thin
enamel and complex EDJ topology in Neanderthals, as northern and central Europe populations

12
incorporated a high proportion of meat in their diets (El Zaatari et al., 2011; Ben‐Dor et al., 2016).
However, few biomechanical work has been done to test the functional implication of the EDJ topology.
Benazzi et al. (2011) suggested that the grooves, fissures and crests might act to increase the structural
stiffness of the tooth, as they are the stress-bearing features.
A series of discoveries in recent decades greatly enrich the amount of diversity in fossil morphology
(Brown et al., 2004; Lordkipanidze et al., 2013; Berger et al., 2015; Villmoare et al., 2015). Much
controversy arises from conflicting views of the number of valid species subsumed within “early Homo”
given unspecified definitions of species and genera (Antón, 2012; Galway-Witham, 2016). Now it is well
acknowledged, a number of anatomical features could distinguish fossil members of the genus Homo
from those of Australopithecus and Paranthropus, including reduction in tooth and jaw size,
reorganization of craniofacial morphology, and perhaps changes in body shape and size (Kimbel, 2009;
Rightmire and Lordkipanidze, 2009). And these physical differences have been taken to suggest
underlying adaptive shifts at the origin of the genus Homo. Despite of the term “early Homo”, the
systematics of the southern African early Homo fossils is also controversial. For some authors, only a
single species (H. ergaster) is present in Swartkrans (Clarke, 1985a), some others have suggested that
the southern African Plio-Pleistocene record samples only H. habilis or a closely related taxon (H.
gautengensis) (Curnoe and Tobias, 2006; Curnoe, 2010), via metrical studies including molar crown size
and shape, and cusp morphology, with an age spanning from ~2.0 to 1.26–0.82 Ma. Instead of alpha
taxonomy and cladistic investigation, this thesis is mainly focused on the morphological diversity of
South African early Homo species.
Until now, the 3D aspects of dental inner structure in early members of the genus Homo is still
unclear. A part of this thesis used similar GM methods and sample groups to the study by Fornai et al.
13
(2015). However, Fornai et al. (2015) looked into the OES and EDJ morphology of upper molars of
South African fossil hominins, in order to test if there were two contemporary species of Australopithecus
lived at Sterkfontein Member 4 and Makapansgnat. Through a series of comparative anatomic studies,
this thesis investigated the inner structure of lower postcanine dentitions assigned to early Pleistocene
Homo specimens from South Africa, attributed either to hominins transitional to Homo (e.g. H. habilis)
or unambiguously considered as premodern Homo (e.g. H. erectus) (Wood, 2010). With relatively large
number of comparative sample, including South African fossil hominins attributed to Paranthropus and
Australopithecus, Eurasian and African extant modern humans, and European Neanderthals, this thesis
aims at documenting the inner structure of South African early Homo postcanine dentition, extract
distinctive features of early Homo, and investigate the taxonomical/evolutionary value of these features.
14
2. MATERIALS
2.1 Comparative materials
The comparative sample includes much older South African fossil hominins, and Middle-Late
Pleistocene Neanderthals/extant modern humans. In all instances, when antimeres were available, only
the better-preserved side or the right side (when antimeres were equally preserved) was selected.
Together with early Homo materials, the labels, dental positions, provenance and wear stages (estimated
according to Molnar, 1971) of comparative materials are listed in Table 2.1.
The extant modern human sample has different origins, it includes European, East Asian and
African populations. The European population includes collections from the Faculty of Medicine in
Strasbourg (labeled Embr) (Rampont, 1994), the National Museum of Natural History (MNHN) in Paris
(labeled EH), and the Laboratory of Molecular Anthropology and Image Synthesis (AMIS) in Toulouse
(labeled SP). The East Asian population are all unpublished data, housed in the Institute of Archeology
and Cultural Relics of Hubei Province (labeled ML, MTS and YYM), they were sourced from a series
of archeological sites in Henan and Hubei Province, Central China, with an archaeological time span
from Neolithic to Song dynasty (2 Ka~1 Ka BP). The South African population (labeled B) is housed in
the University of Pretoria (UP).
The Neanderthal specimens are lower molars from Montmaurin (Billy and Vallois, 1977a, b) dated
to OIS 11 (Girard, 1973), La Chaise-de-Vouthon (France) (Debénath, 1977), and Krapina (Croatia)
(Brace, 1979; Radovčić et al., 1988; Rink et al., 1995) dated to OIS 6 (Macchiarelli et al., 2006) and OIS
5e (Rink et al., 1995) respectively.
This thesis investigated a total of 14 South African fossil specimens (31 teeth) as comparative
sample. They were recovered from three sites in The Cradle of Humankind. Poor preservation of some
15
specimens prevents the application of certain methods1, and certain study has particular requirements for
the sample2, therefore the samples actually involved are listed with the description of respective methods.
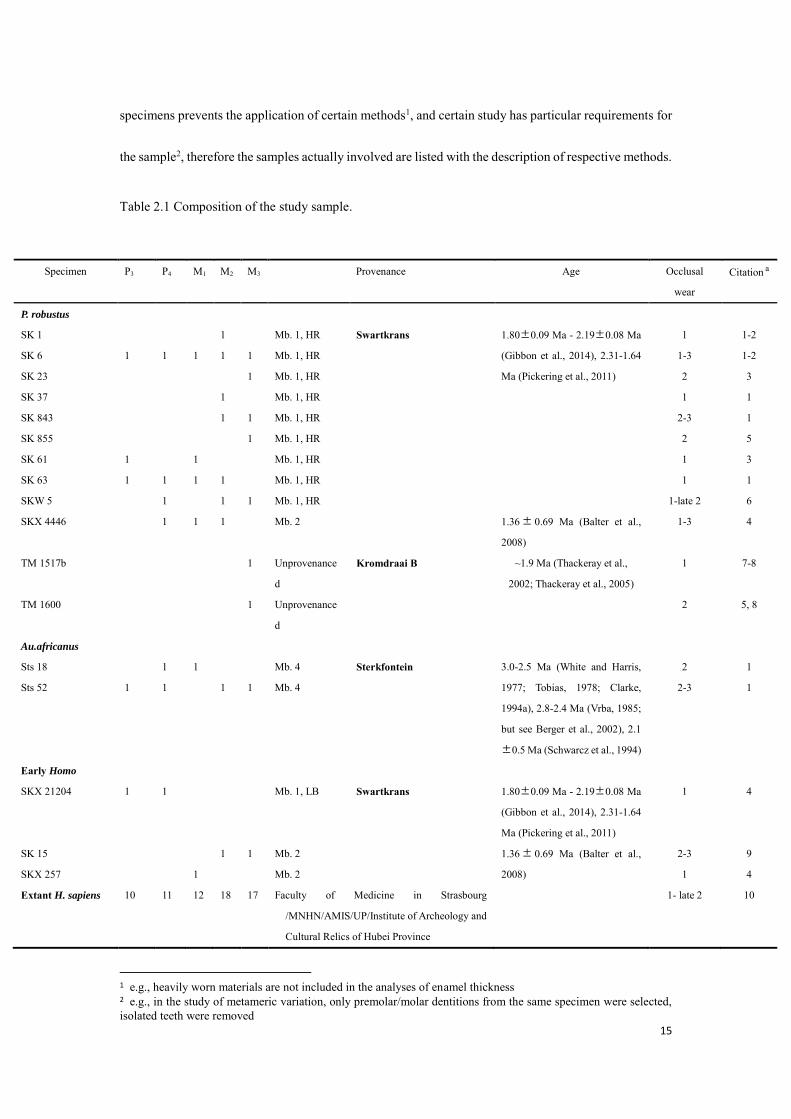
Table 2.1 Composition of the study sample.
1 e.g., heavily worn materials are not included in the analyses of enamel thickness 2 e.g., in the study of metameric variation, only premolar/molar dentitions from the same specimen were selected, isolated teeth were removed
Specimen P3 P4 M1 M2 M3 Provenance Age Occlusal
wear
Citation a
P. robustus
SK 1 1 Mb. 1, HR Swartkrans 1.80±0.09 Ma - 2.19±0.08 Ma
(Gibbon et al., 2014), 2.31-1.64
Ma (Pickering et al., 2011)
1 1-2
SK 6 1 1 1 1 1 Mb. 1, HR 1-3 1-2
SK 23 1 Mb. 1, HR 2 3
SK 37 1 Mb. 1, HR 1 1
SK 843 1 1 Mb. 1, HR 2-3 1
SK 855 1 Mb. 1, HR 2 5
SK 61 1 1 Mb. 1, HR 1 3
SK 63 1 1 1 1 Mb. 1, HR 1 1
SKW 5 1 1 1 Mb. 1, HR 1-late 2 6
SKX 4446 1 1 1 Mb. 2 1.36± 0.69 Ma (Balter et al.,
2008)
1-3 4
TM 1517b 1 Unprovenance
d
Kromdraai B ~1.9 Ma (Thackeray et al.,
2002; Thackeray et al., 2005)
1 7-8
TM 1600 1 Unprovenance
d
2 5, 8
Au.africanus
Sts 18 1 1 Mb. 4 Sterkfontein 3.0-2.5 Ma (White and Harris,
1977; Tobias, 1978; Clarke,
1994a), 2.8-2.4 Ma (Vrba, 1985;
but see Berger et al., 2002), 2.1
±0.5 Ma (Schwarcz et al., 1994)
2 1
Sts 52 1 1 1 1 Mb. 4 2-3 1
Early Homo
SKX 21204 1 1 Mb. 1, LB Swartkrans 1.80±0.09 Ma - 2.19±0.08 Ma
(Gibbon et al., 2014), 2.31-1.64
Ma (Pickering et al., 2011)
1 4
SK 15 1 1 Mb. 2 1.36± 0.69 Ma (Balter et al.,
2008)
2-3 9
SKX 257 1 Mb. 2 1 4
Extant H. sapiens 10 11 12 18 17 Faculty of Medicine in Strasbourg /MNHN/AMIS/UP/Institute of Archeology and
Cultural Relics of Hubei Province
1- late 2 10

16
a) Citation: (1) Robinson (1956); (2) Broom (1949); (3) Broom and Robinson (1952); (4) Grine (1989); (5) Brain (1981); (6) Grine and Daeglin (1993); (7) Broom (1938); (8) Thackeray et al. (2001); (9) Broom and Robinson (1949); (10) Rampont (1994); (11) Billy and Vallois (1977a); (12) Billy and Vallois (1977b); (13) Debénath (1977); (14) Macchiarelli et al. (2006); (15) Radovčić et al. (1988); (16) NESPOS database (2015)
2.2 Stratigraphy of paleontological sites
2.2.1 Swartkrans
The Swartkrans site, located about 40 km northwest of Johannesburg, is the first site where the
Paranthropus and Homo were found in stratigraphic association (Broom and Robinson, 1949, 1950, 1952;
Clarke et al., 1970; Grine, 1988, 1989; Grine and Daeglin, 1993; Grine et al., 1993; Sutton, 2012)
including the partial skull SK 847 (Clarke and Howell, 1972), and wherein the first evidence of bone
culture as well as the control of fire have been identified (Brain, 1993). Following the Member system
used by Partridge (1978) for Sterkfontein and Makapansgat, the current stratigraphic sequence is divided
into six depositional units. Oldest to youngest, these units are the Lower Bank (LB) of Member 1, the
Hanging Remnant (HR) of Member 1 (the “pink breccia”), and then Members 2 (the “brown breccia”)
Neanderthals
Mandible 1 1 Montmaurin ~400 Ka (Girard, 1973) 1 11-12
S 5 1 Abri Suard La Chaise OIS 6 (Macchiarelli et al., 2006) Early 2 13
S 14-7 1 Abri Suard Early 2 13
S 49 1 Abri Suard Early 2 13
BDJ4C9 1 Abri Bourgeois OIS 5e (Macchiarelli et al.,
2006)
Late 2 13-14
D1 1 Level 8 Krapina OIS 5e (Rink et al., 1995) Early 3 15-16
D6 1 Level 8 1-early 2 15-16
D7 1 Level 8 1-early 2 15-16
D10 1 Level 8 1-early 2 15-16
D80 1 Level 8 1-early 2 15-16
D85 1 Level 8 1-early 2 15-16
D86 1 Level 8 1-early 2 15-16
D105 1 Level 8 1-early 2 15-16
D106 1 Level 8 1-early 2 15-16
D107 1 Level 8 1-early 2 15-16
D108 1 Level 8 1-early 2 15-16

17
to 5. Members 1-3 occupy the main excavated area of the site and have yielded a large faunal assemblage
as well as hominin fossils of both P. robustus and early Homo. Homo remains make up about 5% of the
hominins in Member 1, and some 20% of the hominins in Member 2. In addition to SK 15, these
presumed Homo fossils include the composite cranium, SK 847, the mandible fragment, SK 45, and
several isolated teeth (Wood, 2011).
Figure 2.1“Cradle of Humankind” World Heritage and Swartkrans site after Gibbon et al. (2014). (A) Political map of southern Africa (left), with the “Cradle of Humankind” World Heritage area in detail (right). (B) Plan view of Swartkrans. (C) Schematic section, designated on the plan in (B), running north-south through the filling of the outer portion of Swartkrans Cave. Member 2 is not shown in order to clarify the underlying deposits of Member 1.
18
The comparative sample studied in Swartkrans is derived from Member 1 and 2. Biostratigraphic
evidence assigned Member 1 to 1.7 Ma, Member 2 to 1.5 Ma (Vrba, 1975, 1985). Cosmogenic nuclide
burial dating (Gibbon et al., 2014) suggested Swartkrans Member 1 has a geological age ranging from
1.80±0.09 Ma to 2.19±0.08 Ma, while U-Pb dating of flowstone estimated an age of 2.31–1.64 Ma
(Pickering et al., 2011). U-Pb dating of fossil enamel suggested a geological age of 1.36±0.69 Ma for
Member 2 (Balter et al., 2008).
2.2.2 Kromdraai B
Kromdraai is a complex of breccia-filled caves in Precambrian dolomite a mile or so east of
Sterkfontein in the Blaauwbank valley in Gauteng Province, South Africa. There are two fossiliferous
localities within 30 m of each other: Kromdraai A (the ‘‘faunal site’’ or ‘‘KA’’) and Kromdraai B (the
‘‘hominid site’’ or ‘‘KB’’). After the discovery of the holotype of Paranthropus (TM 1517), in 1938, R.
Broom led the first excavations in KB, followed by C. K. Brain in 1955 and then by E. Vrba in 1977, and
the excavation is still going on today (Directed by J. Braga).
Brain (1958) divided the deposits of Kromdraai B into two units, the stony breccia and fine-grained
breccia. Partridge (1982) recognized two sequences: Kromdraai B East and Kromdraai B West and a set
of 5 members in total (Fig. 2.2). However, only a minority of the KB hominins could be tied to the
relatively homogenous period represented by the calcified Member 3 deposits (Brain, 1981), the majority
of the KB faunal sample (including TM 1600) were found during Brain’s excavation (1955-1956), mainly
from decalcified deposits (Brain, 1975, 1981), it contains probable mixing of specimens from Members
1–4 (Vrba, 1981; Vrba and Panagos, 1982). Therefore, the two KB P. robustus specimens in our sample
(TM 1517 and TM 1600), are of unknown stratigraphic origin (Brain, 1975; Braga et al., 2013). However,
19
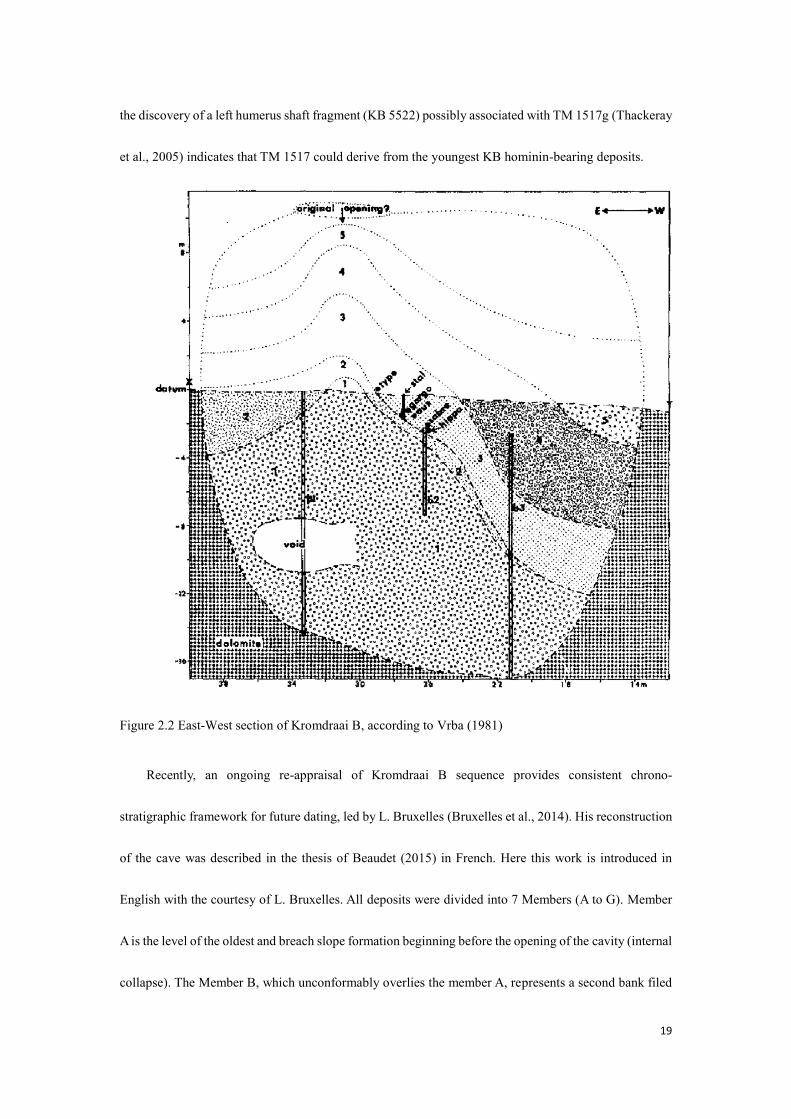
the discovery of a left humerus shaft fragment (KB 5522) possibly associated with TM 1517g (Thackeray
et al., 2005) indicates that TM 1517 could derive from the youngest KB hominin-bearing deposits.
Figure 2.2 East-West section of Kromdraai B, according to Vrba (1981)
Recently, an ongoing re-appraisal of Kromdraai B sequence provides consistent chrono-
stratigraphic framework for future dating, led by L. Bruxelles (Bruxelles et al., 2014). His reconstruction
of the cave was described in the thesis of Beaudet (2015) in French. Here this work is introduced in
English with the courtesy of L. Bruxelles. All deposits were divided into 7 Members (A to G). Member
A is the level of the oldest and breach slope formation beginning before the opening of the cavity (internal
collapse). The Member B, which unconformably overlies the member A, represents a second bank filed

20
after decalcification and erosion of Member A. Similarly, a significant amount of time elapsed between
the members B and C, with a new phase of erosion at the origin of the visible discrepancy between the
two units. The Member D, based again on lower levels include micro- and macro- fauna assemblages
identified by excavations, was referred as the Member 3 by Partridge (1982). The sandstone member E
was deposited in a crack and appear plating against the wall. The Member F was formed by filling in the
eroded areas of Member E. Finally, Member G fills the last empty spaces in the gallery between the old
bank and the vault (Beaudet, 2015).
The reconstruction of the history of the cave by L. Bruxelles assigns Member A to the early stage
of its formation, with an indirect connection to the surface and then, after a long period of time, an
important event (linked to the opening of an entry in line with the current site) resulted in the
accumulation of soil, colluvium and bones in the slopes. This filling constitutes the members B, C and
D. Members E and F were formed by the intrusion flows mud from the surface and caused the colluviums
indicating the introducing of outer resources, in large part clogged. Finally, the Member G marks the
final episode of clogging the residual voids by runoff from surface and the inhabitation of the carnivores,
which are responsible for the fossil remains of large mammals (Beaudet, 2015).
Both the P. robustus dental and cranial specimens from Kromdraai B (KB) present a less derived
morphology than other conspecifics sampled thus far in other sites and may represent the oldest
occurrence of Paranthropus in South Africa (Grine, 1988; Braga et al., 2013). Recent excavations
explored the earliest known infilling of the Kromdraai cave system and suggest variation seen among the
fossil-bearing deposits, faunal and hominin samples at this site stretch a longer timeline of human
evolution than previously thought (Braga et al., 2016). Vrba (1981) estimated the KB Member 3 (called
Member D in the new stratigraphic scheme) formed just before Swartkrans Member 1, therefore, KB
21
Member 3 could be earlier than 2.3–1.7 Ma (Vrba, 1975, 1985; Pickering et al., 2011; Sutton, 2012;
Gibbon et al., 2014). Other biological dating (Delson, 1984, 1988) also proposed an age of 1.9–1.65 Ma
for KB.
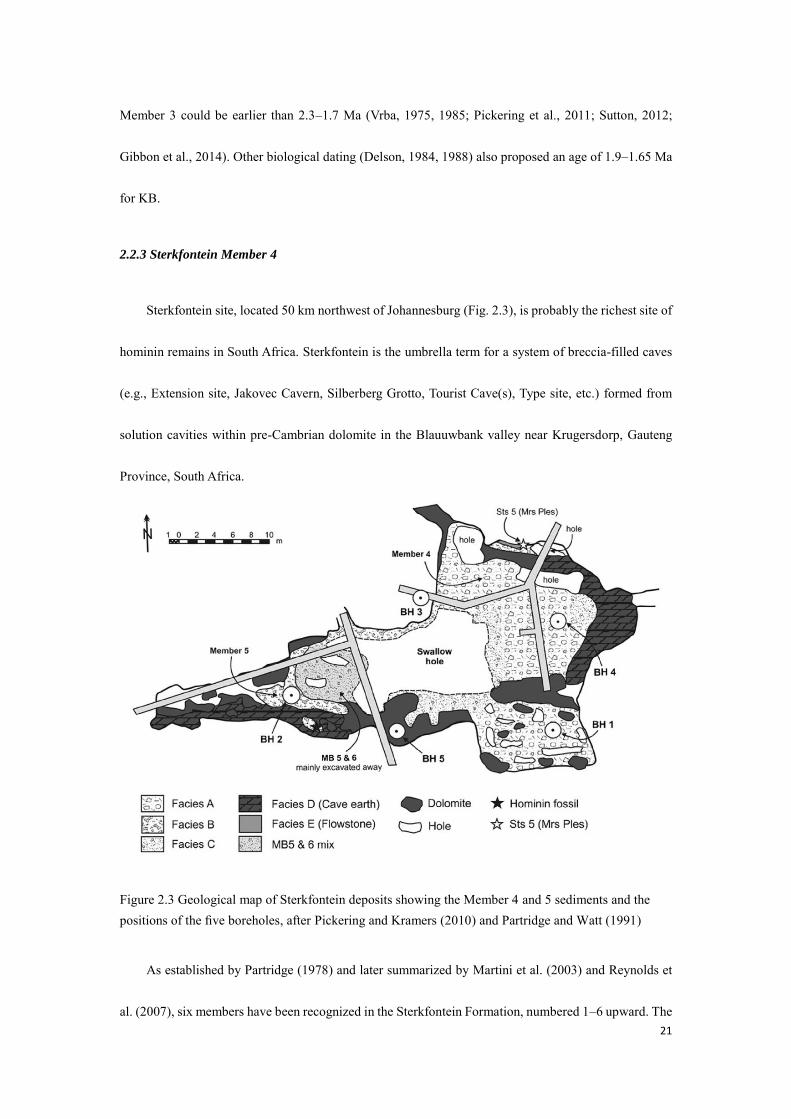
2.2.3 Sterkfontein Member 4
Sterkfontein site, located 50 km northwest of Johannesburg (Fig. 2.3), is probably the richest site of
hominin remains in South Africa. Sterkfontein is the umbrella term for a system of breccia-filled caves
(e.g., Extension site, Jakovec Cavern, Silberberg Grotto, Tourist Cave(s), Type site, etc.) formed from
solution cavities within pre-Cambrian dolomite in the Blauuwbank valley near Krugersdorp, Gauteng
Province, South Africa.
Figure 2.3 Geological map of Sterkfontein deposits showing the Member 4 and 5 sediments and the positions of the five boreholes, after Pickering and Kramers (2010) and Partridge and Watt (1991)
As established by Partridge (1978) and later summarized by Martini et al. (2003) and Reynolds et
al. (2007), six members have been recognized in the Sterkfontein Formation, numbered 1–6 upward. The
22
breccia that contains most of the Australopithecus africanus fossils, and which was referred to as the
Lower Breccia by Robinson (1962), was termed Member 4, Robinson’s stone tool-bearing Middle
Breccia became Member 5, and his Upper Breccia became Member 6. Members 1, 2, and 3 (Members 2
and 3 are fossiliferous) have been identified in the Silberberg Grotto, which is connected to the Tourist
Cave.
Based on faunal evidence, the paleontological age range of Sterkfontein Member 4 seems to be
around 3.0–2.5 Ma (White and Harris, 1977; Tobias, 1978; Clarke, 1994a), or 2.8–2.4 Ma (Vrba, 1985;
but see Berger et al., 2002), while stratigraphical interpretations suggested an age of 2.8–2.6 Ma (Kuman
and Clarke, 2000). ESR dating from tooth enamel samples estimated a much younger average age of 2.1
±0.5 Ma (Schwarcz et al., 1994). Cosmogenic burial age of 2.18±0.21 Ma for Sterkfontein Member 5
Oldowan Infill indicates that Member 4 could not be younger than this age, and that Oldowan at
Sterkfontein has an age that is close to Lower Bank of Member 1 at Swartkrans (Gibbon et al., 2014;
Granger et al., 2015).
2.3 Early Homo materials
Fossil materials of early Homo in South Africa consist largely of craniodental remains. In the
meantime, (probably) more than 14 specimens from Sterkfontein are assigned to Homo, either to H.
habilis (Clarke, 1985b) or Homo aff. H. sapiens (Curnoe and Tobias, 2006). Most of these consist of
isolated teeth and small jaw fragments (Moggi-Cecchi et al., 2006). Sixteen specimens from Swartkrans
Members 1 and 2 have been assigned to Homo (Grine, 1989, 2005a), apart from two mandibles (SK 15
and SK 45) and two fragmentary crania (SK 27 and SK 847), these specimens comprise isolated teeth or
tiny fragments of jaws with teeth (Grine et al., 2009). Eight specimens (all isolated teeth) from Drimolen
23
have been assigned to Homo (Keyser et al., 2000). Because of accessibility, this thesis investigated a total
of five permanent lower postcanine teeth representing three individuals here regarded as early Pleistocene
Homo specimens from South Africa, they were all derived from Swartkrans. Table 2.2 shows a list of
craniodental specimens that are attributed to genus Homo from the South African sites of Sterkfontein,
Swartkrans and Drimolen, in which the specimens involved in our study are marked.
24
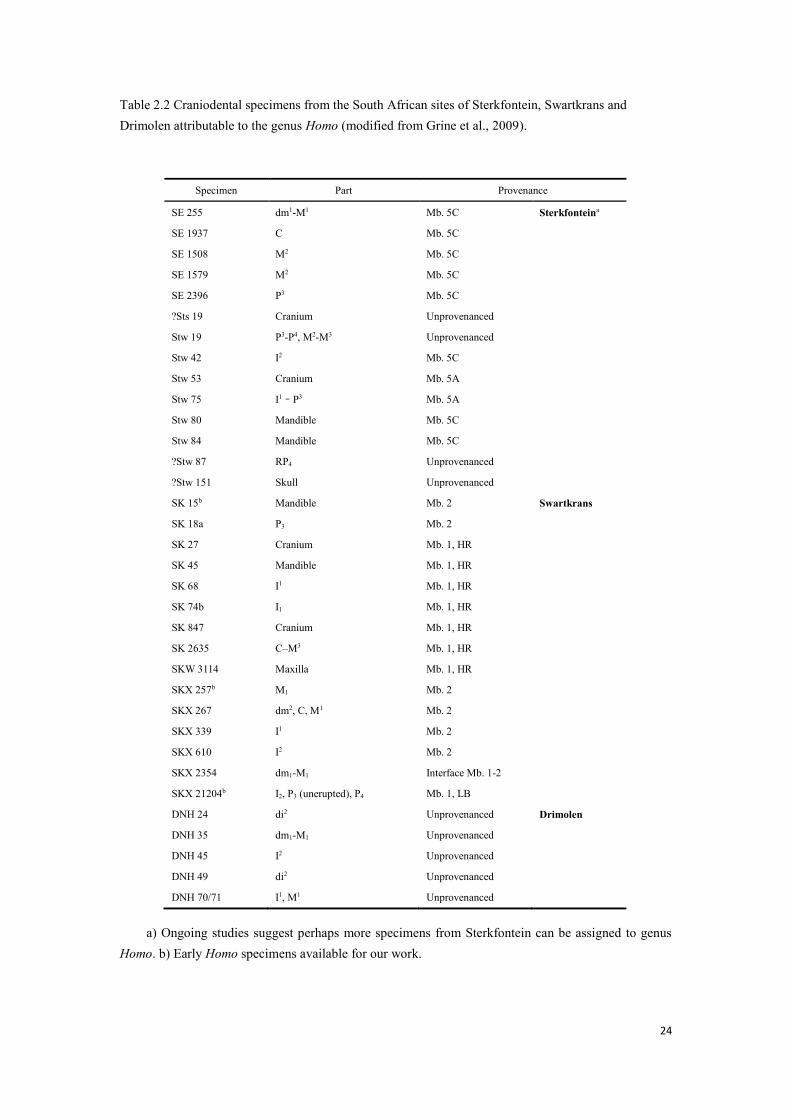
Table 2.2 Craniodental specimens from the South African sites of Sterkfontein, Swartkrans and Drimolen attributable to the genus Homo (modified from Grine et al., 2009).
a) Ongoing studies suggest perhaps more specimens from Sterkfontein can be assigned to genus
Homo. b) Early Homo specimens available for our work.
Specimen Part Provenance
SE 255 dm1-M1 Mb. 5C Sterkfonteina
SE 1937 C Mb. 5C
SE 1508 M2 Mb. 5C
SE 1579 M2 Mb. 5C
SE 2396 P3 Mb. 5C
?Sts 19 Cranium Unprovenanced
Stw 19 P3-P4, M2-M3 Unprovenanced
Stw 42 I2 Mb. 5C
Stw 53 Cranium Mb. 5A
Stw 75 I1–P3 Mb. 5A
Stw 80 Mandible Mb. 5C
Stw 84 Mandible Mb. 5C
?Stw 87 RP4 Unprovenanced
?Stw 151 Skull Unprovenanced
SK 15b Mandible Mb. 2 Swartkrans
SK 18a P3 Mb. 2
SK 27 Cranium Mb. 1, HR
SK 45 Mandible Mb. 1, HR
SK 68 I1 Mb. 1, HR
SK 74b I1 Mb. 1, HR
SK 847 Cranium Mb. 1, HR
SK 2635 C–M3 Mb. 1, HR
SKW 3114 Maxilla Mb. 1, HR
SKX 257b M1 Mb. 2
SKX 267 dm2, C, M1 Mb. 2
SKX 339 I1 Mb. 2
SKX 610 I2 Mb. 2
SKX 2354 dm1-M1 Interface Mb. 1-2
SKX 21204b I2, P3 (unerupted), P4 Mb. 1, LB
DNH 24 di2 Unprovenanced Drimolen
DNH 35 dm1-M1 Unprovenanced
DNH 45 I2 Unprovenanced
DNH 49 di2 Unprovenanced
DNH 70/71 I1, M1 Unprovenanced

25
SKX 21204: This is a right mandibular corpus of a juvenile with the erupting I2 and developing P4
crown exposed (micro-CT investigation revealed the developing P3 embedded in the lower jaw),
recovered from 1979–86 excavation (Grine, 1989) in Member 1 Lower Bank. It is assigned to Homo on
the basis of its small, slender corpus, and the very weak development of the inferior transverse torus in
comparison to that of juvenile Paranthropus specimens (e.g. SK 61, SK 62, SK 63). In addition, this
specimen was noted to have a weakly developed P4 distal marginal ridge, and an I2 with a large MD
diameter and a strongly bevelled disto-incisal corner (Grine, 1989, 2005a).
Figure 2.4 The occlusal (A, D), buccal (B, E) and lingual (C, F) view of SKX 21204 P3 (A–C) and P4 (D–F), with special reference to the EDJ morphology. Note that the dental size is not to scale.
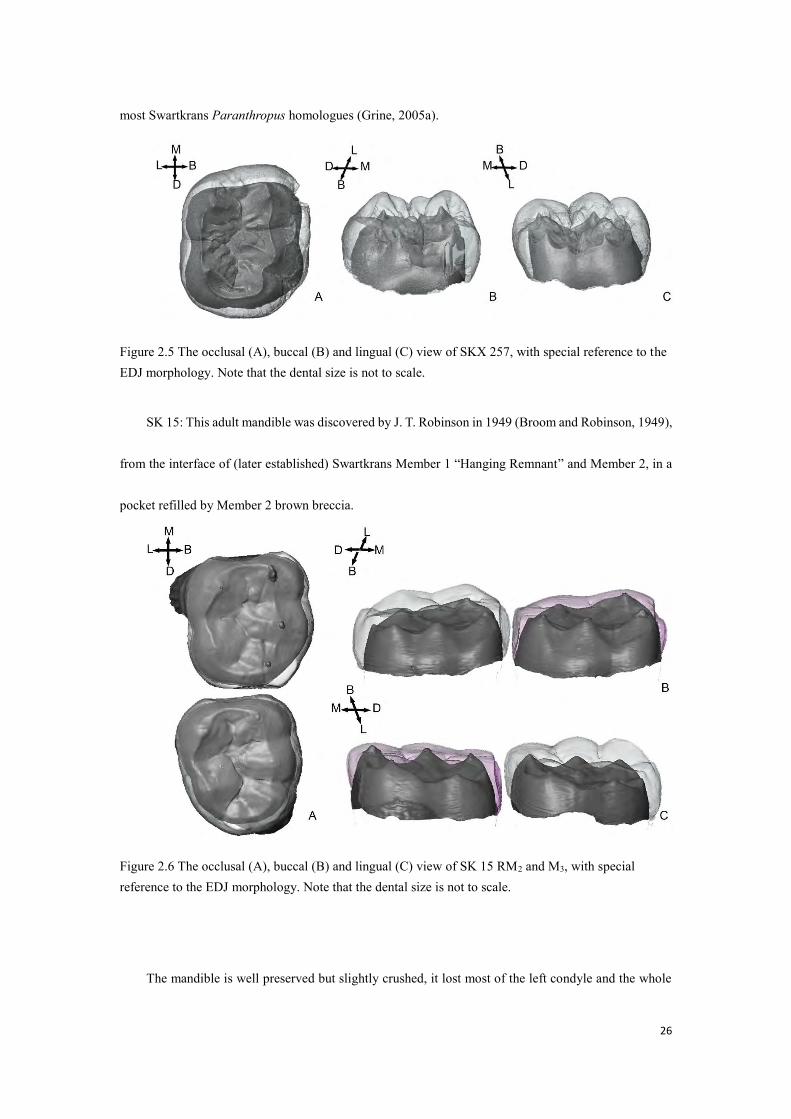
SKX 257: Developing RM1 crown recovered from the 1979–86 excavation, in Member 2 (Grine,
1989). It has a less-preserved antimere: SKX 258. They were assigned to genus Homo, on the basis of
their size and relative narrowness, as well as the presence of a moderate postmetaconulid (incipient
tuberculum intermedium) and the absence of a tuberculum sextum, which contrasts with the condition of
26
most Swartkrans Paranthropus homologues (Grine, 2005a).
Figure 2.5 The occlusal (A), buccal (B) and lingual (C) view of SKX 257, with special reference to the EDJ morphology. Note that the dental size is not to scale.
SK 15: This adult mandible was discovered by J. T. Robinson in 1949 (Broom and Robinson, 1949),
from the interface of (later established) Swartkrans Member 1 “Hanging Remnant” and Member 2, in a
pocket refilled by Member 2 brown breccia.
Figure 2.6 The occlusal (A), buccal (B) and lingual (C) view of SK 15 RM2 and M3, with special reference to the EDJ morphology. Note that the dental size is not to scale.
The mandible is well preserved but slightly crushed, it lost most of the left condyle and the whole

27
of the right. It contains left M1-3 and right M2-3 (M1s and M2s are quite worn), and alveoli of other teeth.
The morphology and taxonomy of SK 15 have been studied extensively (Broom and Robinson, 1949,
1952; Robinson, 1953; Clarke, 1994b; Curnoe, 2001; Grine, 2005a; Curnoe, 2006, 2008, 2010). Its
gracile corpus and small molars, and also the cusp areas (Curnoe, 2001, 2006) all support a closer
association to genus Homo (probably H. hablis), rather than Paranthropus.
28
3. METHODS
Many methods were employed in multiple analyses, for instance, the measurement of enamel
thickness, the landmark-based geometric morphometrics. But prior to the above-mentioned analyses, it
is essential to perform 1) micro-computed tomography, 2) tissue segmentation and surface generation.
3.1 Micro-computed tomography
As in recent decades, the use of neutron microtomography (n-µCT) has also contributed to the study
of paleontology (e.g., Beaudet et al., 2015; Tremsin et al., 2015), we specify that in this thesis, the “micro-
computed tomography” is solely referred to microfocus X-ray computed tomography.
Micro-computed tomography of dental specimens was completed using four tomographic scanners.
Those fossil materials housed in Distong National Museum of Natural History in Pretoria (except for Sts
52), and extant human materials housed in University of Pretoria, were scanned in the South African
Nuclear Energy Corporation (Necsa) tomography center, using the Nikon X-Tek (Metris) H 225L
industrial micro-xCT, associated with a capacity of 225 kV, and the detector has an area of 400×400 mm2
(Hoffman and de Beer, 2012). They were scanned by F. de Beer, J. Braga, J. Hoffman and C. Zanolli.
Isotropic resolution ranges from 10~70μm.
The extant human materials housed in the Faculty of Medicine in Strasbourg, as well as the Au.
africanus specimen Sts 52, along with the Montmaurin Neanderthal mandible, were scanned by J. Braga,
at the Institute for Space Medicine and Physiology (MEDES) of Toulouse with a Scanco Medical X-
Treme micro-CT scanner by using the following parameters: 60 kV, 1 mA, 41 μm isotropic resolution.
Image data was interpolated to form isometric voxels (Braga et al., 2010; Carayon et al., 2015). The
extant human materials housed in the Laboratory of Molecular Anthropology and Image Synthesis in
Toulouse, were scanned by B. Duployer, at the Inter-university Material Research and Engineering
29
Centre in the Université de Toulouse, by using the Phoenix Nanotom 180 scanner from the FERMAT
Federation, with the following parameters: 180kV, 17-27 μm isotropic resolution. Specimens housed in
the Institute of Archeology and Cultural Relics of Hubei Province were scanned using a 225 kV-µXCT
scanner housed at the Institute of Vertebrate Paleontology and Paleoanthropology (IVPP, Chinese
Academy of Sciences) by Dr. S. Xing.
The Neanderthals from La Chaise and Krapina were scanned by A. Mazurier at the Centre de
Microtomographie of the Université de Poitiers (equipment X8050-16 Viscom AG; camera 1004×
1004).
3.2 Tissue segmentation and surface generation
Segmentation of all KB and Sterkfontein materials, and some of the Strasbourg modern human
specimens were done by J. Braga, Neanderthals from La Chaise and Krapina were segmented and
uploaded to NESPOS database (2015) by C. Zanolli.
To enhance the image quality and to better-facilitate tissue segmentation, the complete image stack
for certain fossil specimens was filtered using “Median Filter” or “Gaussian Filter”. The modules “Edge-
Preserving Smoothing” and “Sobel Filter” were used to accentuate the contours and resulted in more
homogenous tissue classes.
Image stacks were imported into Avizo package (v8.0, www.fei.com/software/avizo3d/), for
automated (“watershed”), semi-automated (“magic wand” and “threshold”), or manual segmentations.
In specimens which the enamel and dentine differ substantially in their degree of mineralization,
automated method was used; in other cases, diagenetic alteration (e.g., dentine remineralisation) may
result in similar tissue densities and thus leading to incomplete separation between enamel and dentine,
30
semi-automated was used; manual segmentation was only used in small, limited area, where the specimen
shows a crack (or invasive refill), or when restoration is needed (Fig. 3.1 presents a few examples of
restoration). Small portion of defects were corrected digitally using “remove islands” and “smooth labels”
option. For unerupted teeth that only showed enamel germs embedded in the mandible (SK 63 P4 for
example), a positive surface model of the EDJ was created from the negative impression beneath the
enamel cap.
Figure 3.1. Examples of fracture corrections. Each specimen is shown in yellow (before) and grey (after). Greyscale figures are examples of slices where the reconstruction of enamel (in yellow) and dentine (in purple) were made. A: Sts 52 RM2; B: SK 37; C: SKX 257; D: Sts 18 RM1.
After segmentation, the enamel cap and EDJ are reconstructed as triangle-based surface models
using Avizo (unconstrained smoothing parameter), number of faces was simplified and reduced to
500000. In a few teeth that show minimum dentine exposure, the reconstruction was made using the “Fill
Holes” option in Avizo 8.0.
We also estimated the percentage of enamel loss of our partially worn early Homo tooth, SK 15 M3,
by comparing and artificially wearing one of our unworn thick-enameled hominin teeth (SKW 5 M3) to
the wear stage of SK 15. First, we virtually aligned the OES of SK 15 and SKW 5 with reference to the

31
cervical plane (by using “align surfaces” module in Avizo 8.0), then the enamel of SKW 5 is artificially
removed until the wear facets reach the OES of SK 15. The percentage of the “worn” enamel volume of
SKW 5 was then calculated. This attempt, although cannot facilitate a restore of worn SK 15 OES, could
help to investigate the approximate enamel loss and the original enamel thickness of SK 15 M3. The
estimation of lost enamel volume in SK 15 is presented in the Result chapter.
Figure 3.2 Estimation of worn enamel in SK 15. The unworn crown of SKW 5 (A) was artificially worn (B) with reference to SK 15 (C), to remove a portion of enamel, resulting the wear stage that is close or equal to SK 15. The comparison of original enamel and worn enamel of SKW 5 is presented in D, the comparison of original enamel and the enamel cap of SK 15 is presented in E.
3.3 Three-dimensional enamel thickness and whole-crown enamel thickness distribution
The composition of sample used in the study of enamel thickness is presented in Table 3.1. A variety
of protocols have been proposed to measure enamel thickness in its full three-dimensional form, they
differ mainly in the way to identifying sections between crown and roots. Tafforeau (2004) suggested a
separation by defining a best-fit plane of the cervical line. Olejniczak et al. (2008c) however, defined
32
another protocol to measure 3D enamel thickness in molars: first, locate the most apical plane (plane A)
of section through the cervix that shows a continuous ring of enamel. This plane was defined by selecting
3 landmarks located along the cervical line, with farthest distances to the root; next, plane A was
gradually moved toward the roots until the most apical plane of section still containing enamel was
located (plane B). The plane exactly halfway between plane A and B was taken as the cervical plane,
above which coronal measurements were recorded. Benazzi et al. (2014) suggested separating the crown
from the root using the curve digitized along the cervical line itself, instead of its best-fit plane. Finally,
this curve was interpolated with a smooth surface to seal the bottom of the dentine core. In this thesis we
use protocol by Benazzi et al. (2014) because it is anatomically sound and could be applied to both
premolars and molars. In our practice, the curve of the cervical line is sealed, and a smooth surface is
created at the bottom of the coronal dentine, using “Fill Hole” option in Avizo 8.0.
Three variables were measured for each specimen: the volume of the enamel cap (Ve, mm3), the
volume of the coronal dentine that includes the volume of the coronal pulp (Vcdp, mm3), and the surface
area of the enamel-dentine junction (SEDJ, mm2). We then calculated two indices of enamel thickness:
3D AET (Ve/SEDJ), the 3D average enamel thickness (mm), and 3D RET {100×3D AET/(Vcdp1/3)},
the scale-free 3D relative enamel thickness (Kono, 2004; Olejniczak et al., 2008a).
Differences in distribution of 3D AET and RET between groups were tested by rank-based Kruskal-
Wallis test with Conover’s post hoc comparisons, using statistical software BrightStat (Stricker, 2008).
To visualize the topologic variation in whole-crown enamel thickness distribution, we generated
maps calculating the minimum distances from the points on the OES, to the points on the EDJ (Kono et
al., 2002; Olejniczak et al., 2008b; Zanolli et al., 2014; Zanolli, 2015). OES and EDJ surfaces were
imported separately, in Avizo 8.0, and distances were measured using “Surface Distance” tool. The

33
enamel thickness distribution is illustrated by a color scale from blue (thinner) to red (thicker). The
reproducibility of this protocol was tested by previous studies and the estimated error is less than 5%
(Kono, 2004; Suwa and Kono, 2005; Zanolli, 2015).
Table 3.1 Composition of samples used in the enamel thickness analyses
3.4 Geometric morphometrical analyses
The GM analysis of EDJ shape involves a number of steps that are outlined in detail below. It
comprises two independent studies: A) EDJ shape variation between groups of a single tooth position,
and B) inter- and intra-individual metameric variation of EDJ shape. In all, two multivariate analyses
Specimen P3 P4 M1 M2 M3
P. robustus
SK 1 1
SK 6 1 1 1
SK 23 1
SK 37 1
SK 843 1
SK 855 1
SK 61 1 1
SK 63 1 1 1 1
SKW 5 1 1
SKX 4446 1 1
TM 1517b 1
TM 1600 1
Au.africanus
Sts 18 1
Sts 52 1 1
Early Homo
SKX 21204 1 1
SK 15 1
SKX 257 1
Extant H. sapiens 10 11 9 14 14
Neanderthals 5 4 5
34
were performed: between-group PCA (bgPCA) and hierarchical clustering on principal components
(HCPC). Four steps were taken prior to the multivariate analyses: 1) flipping surfaces, 2) the collection
of anatomical landmarks, 3) the derivation of sliding landmarks for each specimen, and 4) Procrustes
superimposition of the landmarks.
However, it should be noted that the above-mentioned two independent studies were conducted
using different sample. The sample used in study B is actually a subset of study A. In study B, only
premolar/molar dentitions derived from the same specimen were selected (i.e., isolated teeth were
removed).
Flipping surfaces Antimeres were excluded from the analyses, and in some cases, especially in fossil
materials, only the teeth from one side is preserved. Therefore, any image data from the left-side were
flipped to obtain a homogeneous right-sided sample.
Collection of anatomical (semi) landmarks EDJ surface models were imported into Avizo 8.0 for
the collection of Cartesian coordinates (by creating “B spline”) of landmark sets along marginal ridges.
We defined two sets of anatomical (semi)-landmarks along the marginal ridge between the main dentine
horns (DHs), as an approximation of the marginal ridge (Fig. 3.3). For premolars, the landmarks were
placed on the tips of the DHs (i.e. 1. protoconid, 2. metaconid), with 55 semi-landmarks (30 and 15 along
the distal and mesial marginal ridges, respectively, and 10 on the transverse crest that connects the two
DHs). The molar landmark set included four landmarks on the tips of the DHs (i.e. 1. protoconid, 2.
metaconid, 3. entoconid, 4. hypoconid), with 60 semi-landmarks (15 along each ridge) forming a
continuous line beginning at the tip of the protoconid, and moving in a clockwise direction.
35
Figure 3.3 EDJ surface model of a lower premolar (A-C, SKX 21204 from Swartkrans) and a lower molar (D-F, SKW 5 from Swartkrans), illustrating the landmarks collected on the tips of the dentine horns (red spheres) and semi-landmarks that run between the dentine horns (yellow spheres) used to capture EDJ shape. Abbreviations: buccal (B), distal (D), lingual (L) and mesial (M).
Derivation of sliding/homologous landmarks All semi-landmarks were slid along their respective
curves, which were separated by the main landmarks.
For each specimen, a set of three (or four, in molars) sections of homologous landmarks and semi-
landmarks was derived from the two landmark files discussed above. Along each (semi)landmark section,
a smooth curve was interpolated using a B-spline function. Interpolated curves were then imported into
R (R Development Core Team, 2012), and were resampled to collect (semi)landmarks (using a script
written by J. Dumoncel). Number of resampled semi-landmarks were described above in “Collection of
anatomical (semi)landmarks”, and they were equally spaced along each section/curve.
Procrustes superimposition The homologous set of (semi)landmarks known as raw shape
coordinates underwent scaling and translation and rotation operations, in order to build an average
36
conformation to the Procrustes analysis.
3.4.1 Study A: EDJ shape variation between groups of a given tooth position
BgPCA We applied between-group PCA (bgPCA) to investigate EDJ shape variation between
groups. It projects data onto the principal components of the group means, allowing to accentuate the
difference between groups in the ordination of Euclidean distances. In contrast to CVA (canonical variate
analysis), these axes are orthogonal and can be computed even when the data are not of full rank, such
as for Procrustes shape coordinates (Mitteroecker and Bookstein, 2011). In contrast to conventional PCA,
it defines groups a priori (i.e., individuals must be assigned to certain groups before the analysis).
However, from the distribution of known comparative groups, unidentified individuals can be added
retrospectively (projection) and their affinities with predefined groups could be seen (Braga et al., 2013).
The R script of GPA and bgPCA were written by J. Dumoncel.
Visualization of EDJ shape variation Differences in EDJ shape can be visualized in 3D using the
quantitative results of the statistical analyses. A set of (semi)landmarks along EDJ ridge curves can be
deformed to visualize shape differences along PC axes that separate groups. The coordinates of the
extremes of each bgPC were first generated as arrays, and were then visualized as sphere sets,
representing ridge curves. Sphere sets located at the extremes of bgPC axes could be aligned with respect
to the main landmarks, therefore offer a direct view of shape variation. This R script was written by J.
Dumoncel.

37
Table 3.2 Specimens included in the bgPCA for the study of EDJ shape variation between groups of a given dental position
3.4.2 Study B: intra- and inter-individual metameric variation of EDJ shape, and degrees of
metameric variation between groups
Most mammalian teeth vary in shape and can be grouped into three families: incisiform, caniniform,
and molariform. Dental rows of each tooth type, however, exhibit notable shape differences rather than
repetition of identical elements. The differences in serially repeated morphology within an organism are
called metameric variation and are thought to be a result of slight alterations in the developmental process
(Weiss, 1990). Morphological variation within a tooth row is a type of metameric variation.
Specimen P3 P4 M1 M2 M3
P. robustus
SK 1 1
SK 6 1 1 1 1 1
SK 23 1
SK 37 1
SK 843 1 1
SK 855 1
SK 61 1 1
SK 63 1 1 1 1
SKW 5 1 1 1
SKX 4446 1 1 1
TM 1517b 1
TM 1600 1
Au.africanus
Sts 18 1 1
Sts 52 1 1 1 1
Early Homo
SKX 21204 1 1
SK 15 1 1
SKX 257 1
Extant H. sapiens 10 11 12 18 17
Neanderthals 6 5 5

38
Until now, few studies have been conducted to address the metamerism with regard to an assessment
of within- and between-individual variation, but are mainly based on tooth specimens representing
different sets of individuals (Hlusko, 2002; Skinner et al., 2008b). In order to investigate intra-group
metameric variation, only premolar/molar dentitions representing the same individuals were selected
(Table 3.3). The samples were grouped into three pairs, according to tooth position (P3-P4, M1-M2, M2-
M3), and multivariate comparisons were performed within each pair.
First, bgPCA was conducted, the protocol has been described in previous paragraphs.
As a second method of assessing phonetic similitude between individuals, the hierarchical
classification of principal components (HCPC) was applied. HCPC provides classification with or
without prior knowledge of the classes of specimens. Raw shape coordinates were imported in R to
perform a conventional PCA, yielding a number of principal components and respective scores, then,
hierarchical clustering was performed using all PC scores. We applied Ward’s method and squared
Euclidean distance, using statistical software PAST (Hammer et al., 2001). Ward's minimum variance
method aims at finding compact, spherical clusters, individuals are grouped so as to minimize the
increase of intra-group inertia at each step of the algorithm. A dendrogram was created in order to
visualize the clustering results.
39
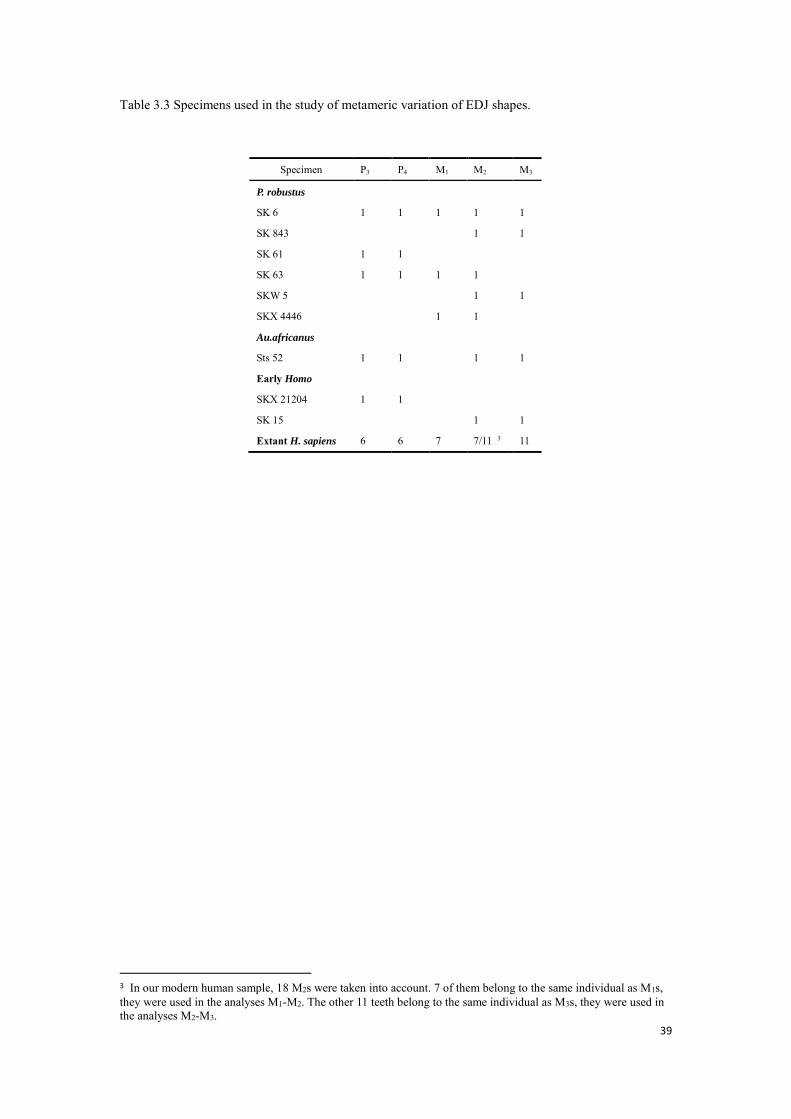
Table 3.3 Specimens used in the study of metameric variation of EDJ shapes.
3 In our modern human sample, 18 M2s were taken into account. 7 of them belong to the same individual as M1s, they were used in the analyses M1-M2. The other 11 teeth belong to the same individual as M3s, they were used in the analyses M2-M3.
Specimen P3 P4 M1 M2 M3
P. robustus
SK 6 1 1 1 1 1
SK 843 1 1
SK 61 1 1
SK 63 1 1 1 1
SKW 5 1 1
SKX 4446 1 1
Au.africanus
Sts 52 1 1 1 1
Early Homo
SKX 21204 1 1
SK 15 1 1
Extant H. sapiens 6 6 7 7/11 3 11
40
4. RESULTS
Through a non-invasive exploration of dental inner structure, in this chapter we describe the results
from comparative analyses of enamel thickness, whole-crown enamel thickness distribution, and EDJ
shape. The results were yielded from 31 South African fossil hominin specimens, 68 modern humans,
and 16 Neanderthals. First, we document and compare the 3D enamel thickness between groups, and
then, we describe the qualitative results of enamel thickness distribution colormap, finally, we
extensively describe the results from GM analyses: we compared the EDJ shape between groups of a
given dental position, and we discussed the (different) degrees of metameric variation in South African
australopiths, early Homo, and modern humans.
4.1 Three-dimensional enamel thickness
Our observed results of 3D enamel thickness is shown with respect to tooth positions and groups.
A summary of 3D AET and RET is shown in Table 4.1, the tooth-specific results, as well as the
measurements of three variables (Ve, Vcdp and SEDJ) are shown as Appendix A, at the end of this thesis.
Results of nonparametric tests as well as post hoc comparisons are shown in Appendix B. We used
boxplots to visualize the distribution of enamel thickness between groups (Fig. 4.1).
41
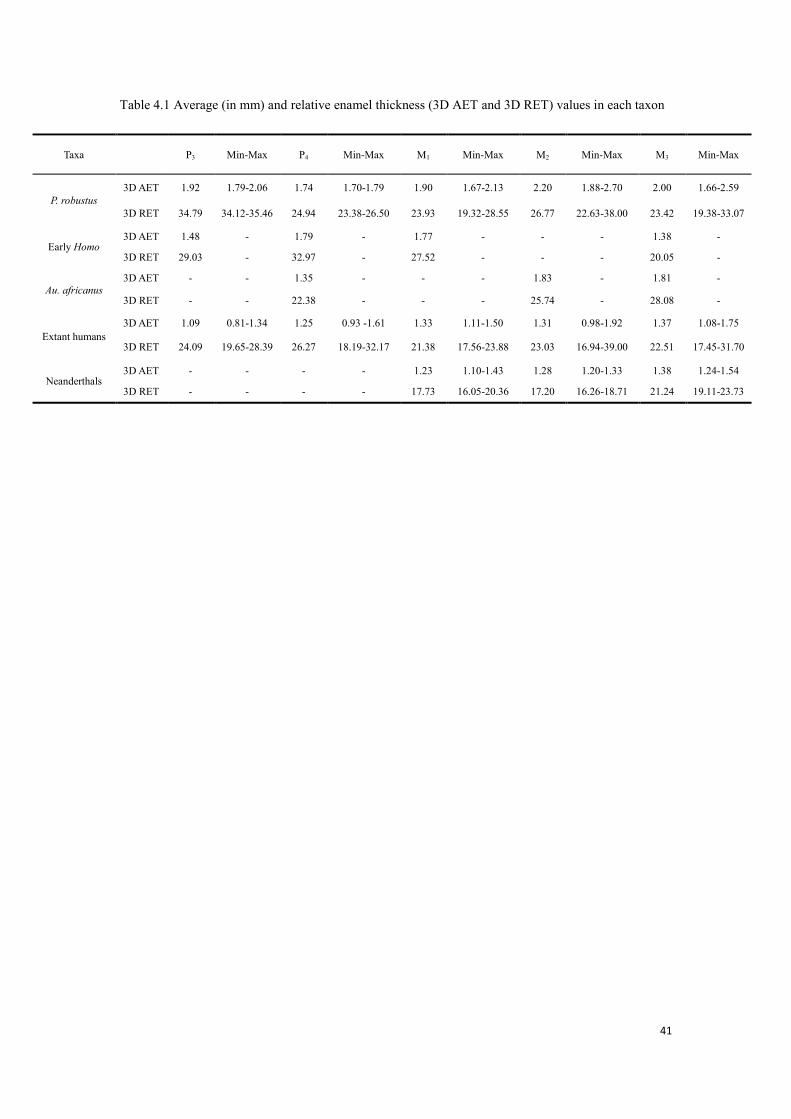
Table 4.1 Average (in mm) and relative enamel thickness (3D AET and 3D RET) values in each taxon
Taxa P3 Min-Max P4 Min-Max M1 Min-Max M2 Min-Max M3 Min-Max
P. robustus 3D AET 1.92 1.79-2.06 1.74 1.70-1.79 1.90 1.67-2.13 2.20 1.88-2.70 2.00 1.66-2.59
3D RET 34.79 34.12-35.46 24.94 23.38-26.50 23.93 19.32-28.55 26.77 22.63-38.00 23.42 19.38-33.07
Early Homo 3D AET 1.48 - 1.79 - 1.77 - - - 1.38 -
3D RET 29.03 - 32.97 - 27.52 - - - 20.05 -
Au. africanus 3D AET - - 1.35 - - - 1.83 - 1.81 -
3D RET - - 22.38 - - - 25.74 - 28.08 -
Extant humans 3D AET 1.09 0.81-1.34 1.25 0.93 -1.61 1.33 1.11-1.50 1.31 0.98-1.92 1.37 1.08-1.75
3D RET 24.09 19.65-28.39 26.27 18.19-32.17 21.38 17.56-23.88 23.03 16.94-39.00 22.51 17.45-31.70
Neanderthals 3D AET - - - - 1.23 1.10-1.43 1.28 1.20-1.33 1.38 1.24-1.54
3D RET - - - - 17.73 16.05-20.36 17.20 16.26-18.71 21.24 19.11-23.73
42
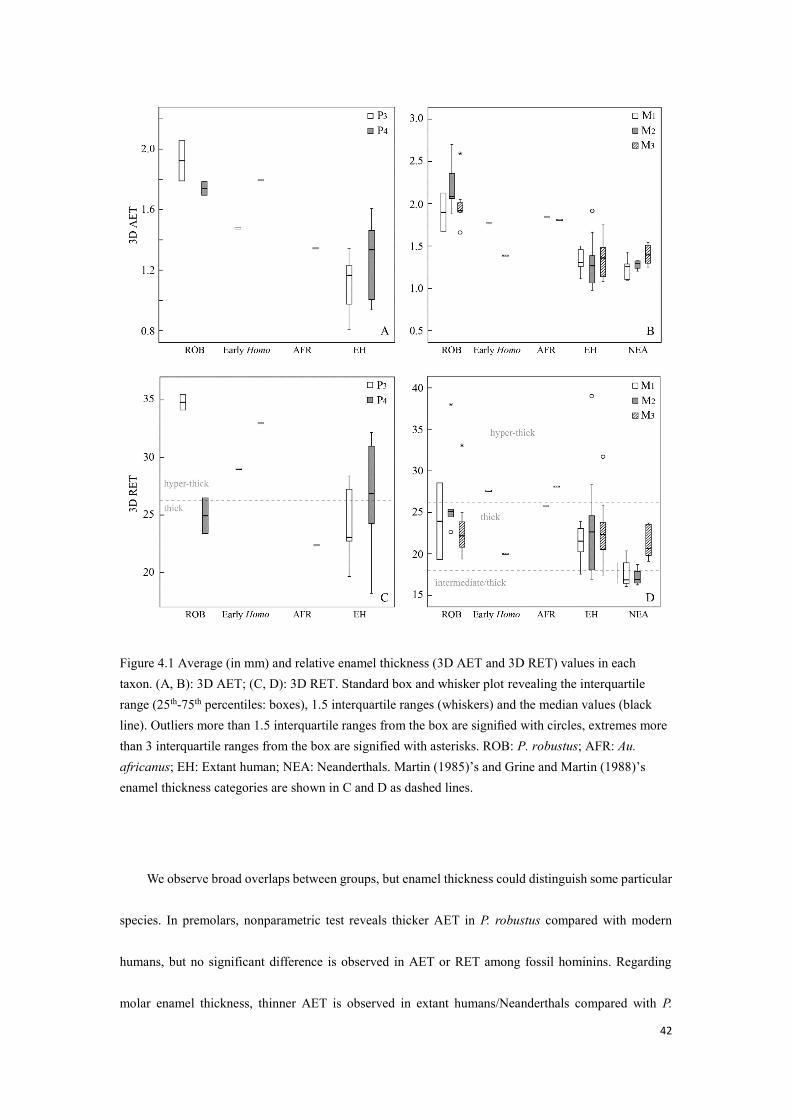
Figure 4.1 Average (in mm) and relative enamel thickness (3D AET and 3D RET) values in each taxon. (A, B): 3D AET; (C, D): 3D RET. Standard box and whisker plot revealing the interquartile range (25th-75th percentiles: boxes), 1.5 interquartile ranges (whiskers) and the median values (black line). Outliers more than 1.5 interquartile ranges from the box are signified with circles, extremes more than 3 interquartile ranges from the box are signified with asterisks. ROB: P. robustus; AFR: Au. africanus; EH: Extant human; NEA: Neanderthals. Martin (1985)’s and Grine and Martin (1988)’s enamel thickness categories are shown in C and D as dashed lines.
We observe broad overlaps between groups, but enamel thickness could distinguish some particular
species. In premolars, nonparametric test reveals thicker AET in P. robustus compared with modern
humans, but no significant difference is observed in AET or RET among fossil hominins. Regarding
molar enamel thickness, thinner AET is observed in extant humans/Neanderthals compared with P.
43
robustus, thinner RET is observed in Neanderthals, compared with australopiths and modern humans.
Martin (1985) and Grine and Martin (1988) established categories of relative enamel thickness as: thin
enamel (species mean values 8.90–11.30), intermediate/thin enamel (11.31–14.64), intermediate/thick
enamel (14.65–17.49), thick enamel (17.50–26.20) and hyper-thick enamel (>26.20), our Neanderthals
show thick or intermediate thick molar RET, which is significantly thinner than modern humans and
australopiths (Appendix B), other groups show thick to hyper-thick molar enamel. We also document
premolar enamel thickness in South African fossil hominins and modern humans: our P. robustus as well
as early Homo have thick to hyper-thick enamel, the Au. africanus specimen (Sts 52) show relatively
thick P4, and modern humans exhibit substantial variation, from thick to hyper-thick. In all, the
taxonomical value of 3D enamel thickness is relatively weak.
The enamel thickness of unworn dentition in early Homo represents the extreme of genus Homo,
with respect to dental position. Enamel thickness values of SKX 21204 P3 fall much lower than P.
robustus, but beyond the modern human ranges. In contrast, enamel thickness values of its P4 reach the
extreme of all groups. Early Homo M1 (SKX 257) shows enamel thickness values comparable to P.
robustus, but the M3 (SK 15) shows thinner enamel than P. robustus, falls within modern human range.
However, it should be noted that SK 15 presents appreciable occlusal wear, its enamel thickness is the
minimum estimation. It is surprising that the enamel thickness values of Au. africanus (Sts 52) P4 fall at
the low end of South African fossil hominins (categorized as “thick”), considering the enamel thickness
of its M2 and M3 are comparable to P. robustus hyper-thick condition.
Although early Homo and modern humans display thicker enamel in P4 than in P3, according to the
boxplot (Fig. 4.1, A, C), and P. robustus premolars show the opposite, statistical analysis shows no
evidence of correlation between tooth position and enamel thickness in these taxa, only a thicker RET is

44
found in Neanderthal M3 than in M2.
As previously described, the enamel loss of SK 15 M3 was estimated by comparing and manually
wearing our unworn thick-enameled fossil (SKW 5 M3) (Fig. 3.2). Manual wear removed 13% of the
total enamel, indicating the 3D AET of SK 15 M3 could be around 1.59 cm, approximating the lower
extreme of P. robustus molar AET (1.66 cm, Table 4.1), and the according 3D RET could be 23.
4.2 Whole-crown enamel thickness distribution
Given that in humans, tooth position is one of the key factors in enamel thickness (Smith et al.,
2005, 2008), although less evident in australopiths (Olejniczak et al., 2008b). Figs. 4.2–4.5 present the
enamel thickness distribution color maps of postcanine dentition of early Homo, australopiths, extant
humans and the molar dentition of Neanderthals. We presented only a subset of our study sample, under
the consideration of limited space, and these specimens are better-preserved and therefore could represent
the enamel thickness distribution pattern of their own taxa. This method could provide a qualitative view
of relative enamel thickness within single tooth, to compare enamel thickness distributing patterns
between groups.
In a single taxon, enamel thickness distributing patterns in premolars and molars are very similar.
In general, the australopith lower post-canines have thicker enamel over the top or on the apex of the
cusp (e.g. Figs. 4.2A, B; 4.3A). Early Homo show features similar to extant humans and Neanderthals,
with thicker enamel on the lateral aspects of the crown (e.g. Fig. 4.2C–E).
45
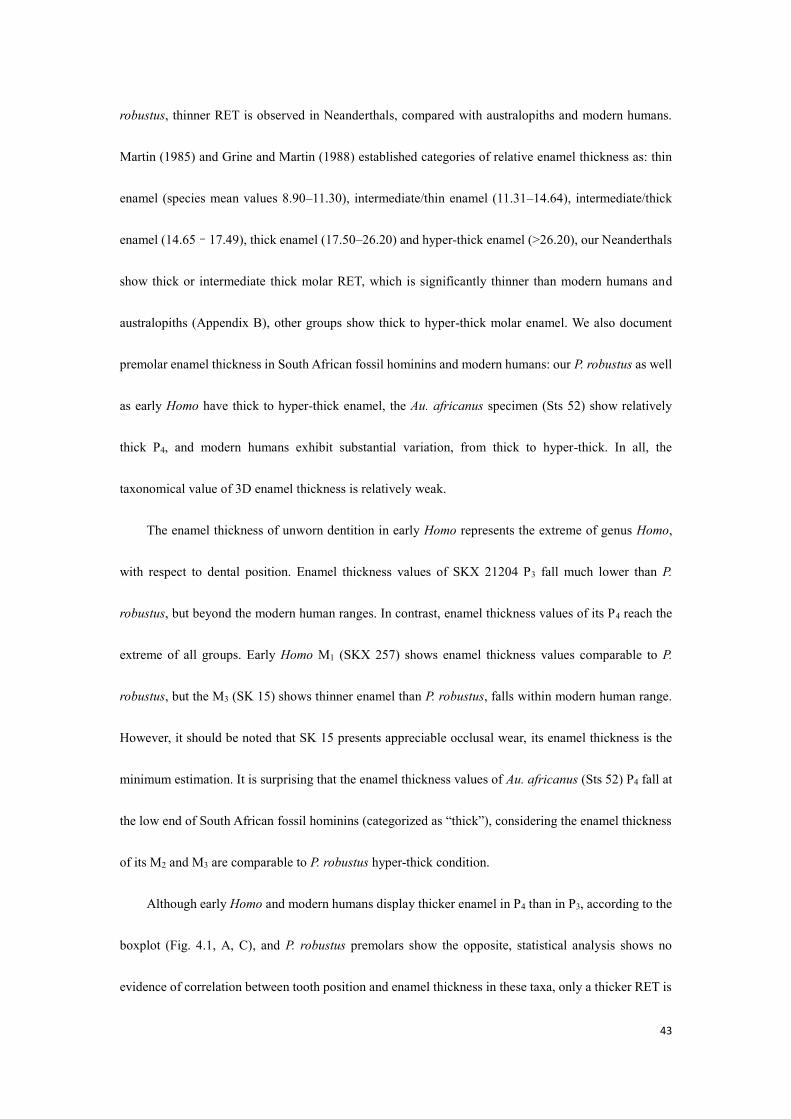
Figure 4.2 Enamel thickness distribution in premolars. The color scale of enamel thickness is relative to each tooth. Bar=5 mm.
In P. robustus, the thickest part of the crown is on the apices of the cusp tips (Figs. 4.2A, B and 4.3A
and 4.5A). Thicker enamel is largely seen on the buccal and distal cusp tips rather than on the lingual
cusps. Occasionally, thicker enamel is also observed on the molar occlusal basin, where accessory
cuspulids are located (Figs. 4.3A, B and 4.4A).
46
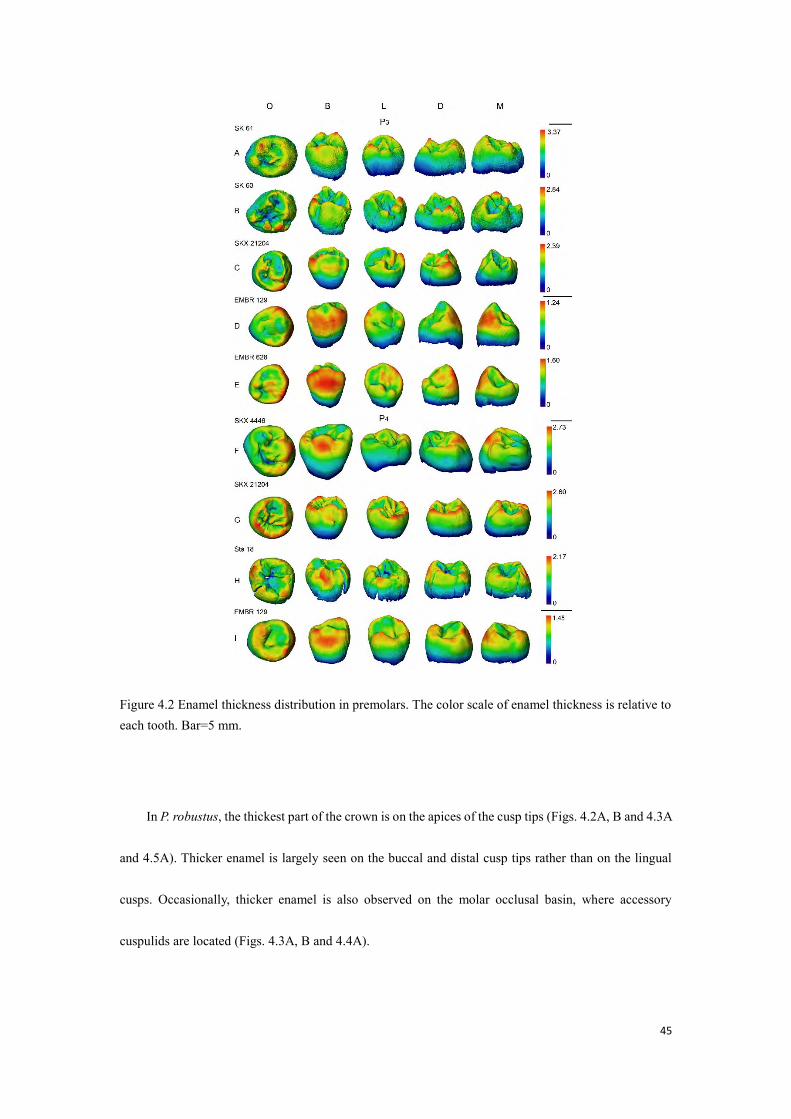
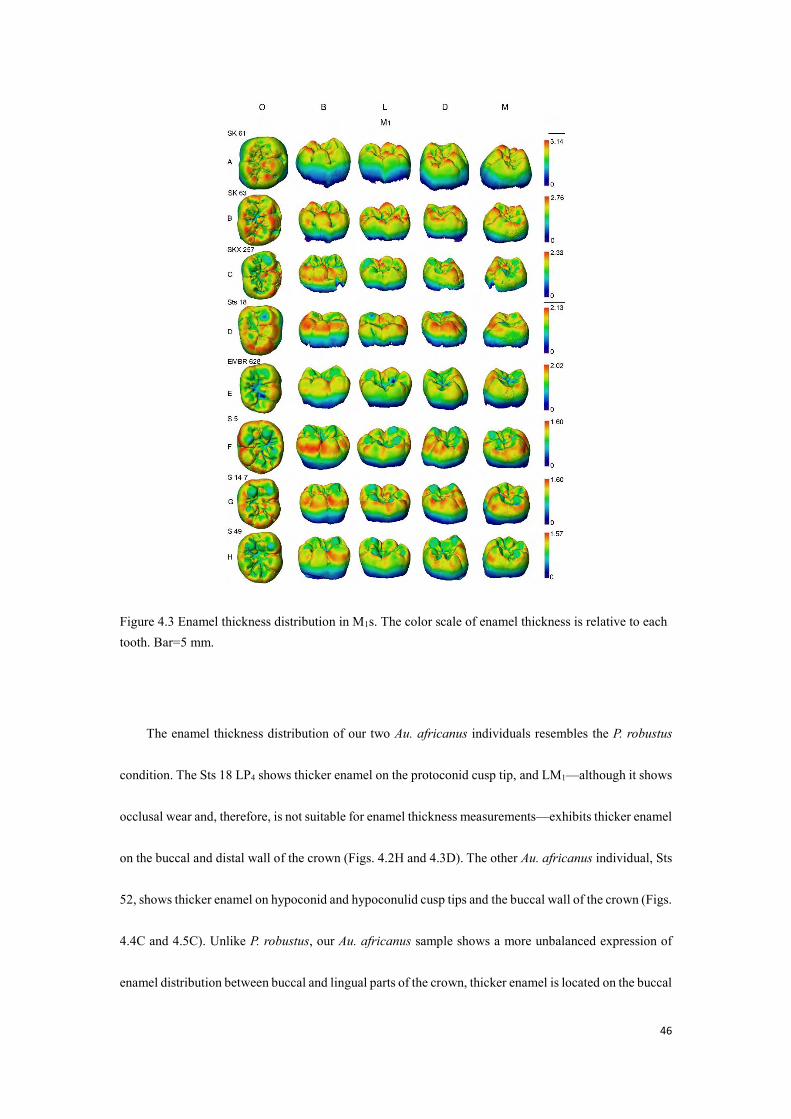
Figure 4.3 Enamel thickness distribution in M1s. The color scale of enamel thickness is relative to each tooth. Bar=5 mm.
The enamel thickness distribution of our two Au. africanus individuals resembles the P. robustus
condition. The Sts 18 LP4 shows thicker enamel on the protoconid cusp tip, and LM1—although it shows
occlusal wear and, therefore, is not suitable for enamel thickness measurements—exhibits thicker enamel
on the buccal and distal wall of the crown (Figs. 4.2H and 4.3D). The other Au. africanus individual, Sts
52, shows thicker enamel on hypoconid and hypoconulid cusp tips and the buccal wall of the crown (Figs.
4.4C and 4.5C). Unlike P. robustus, our Au. africanus sample shows a more unbalanced expression of
enamel distribution between buccal and lingual parts of the crown, thicker enamel is located on the buccal
47
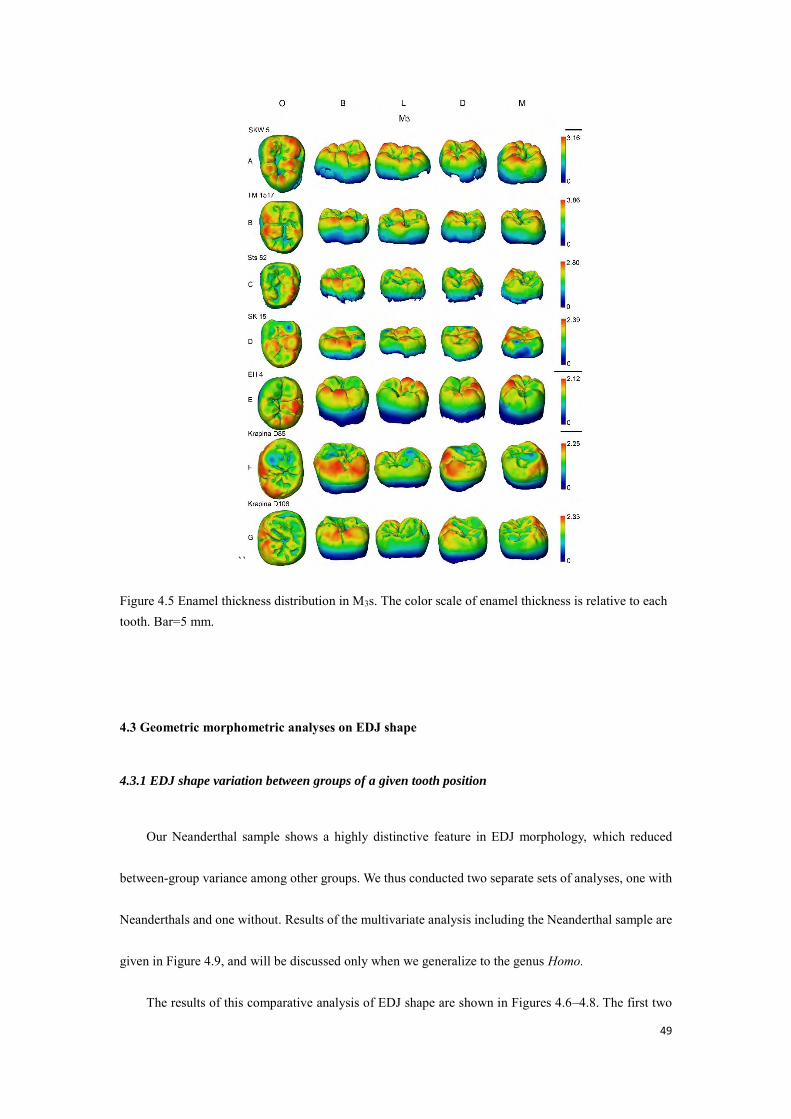
aspects, comparable to only a few P. robustus specimens such as TM 1517 (Fig. 4.5B). It is worth noting
that the remains of a cingulum are well observed on the protoconid of Sts 52 M3, forming a bridge that
runs vertically on the buccal surface of the protoconid with thicker enamel on the top (Fig. 4.5C).
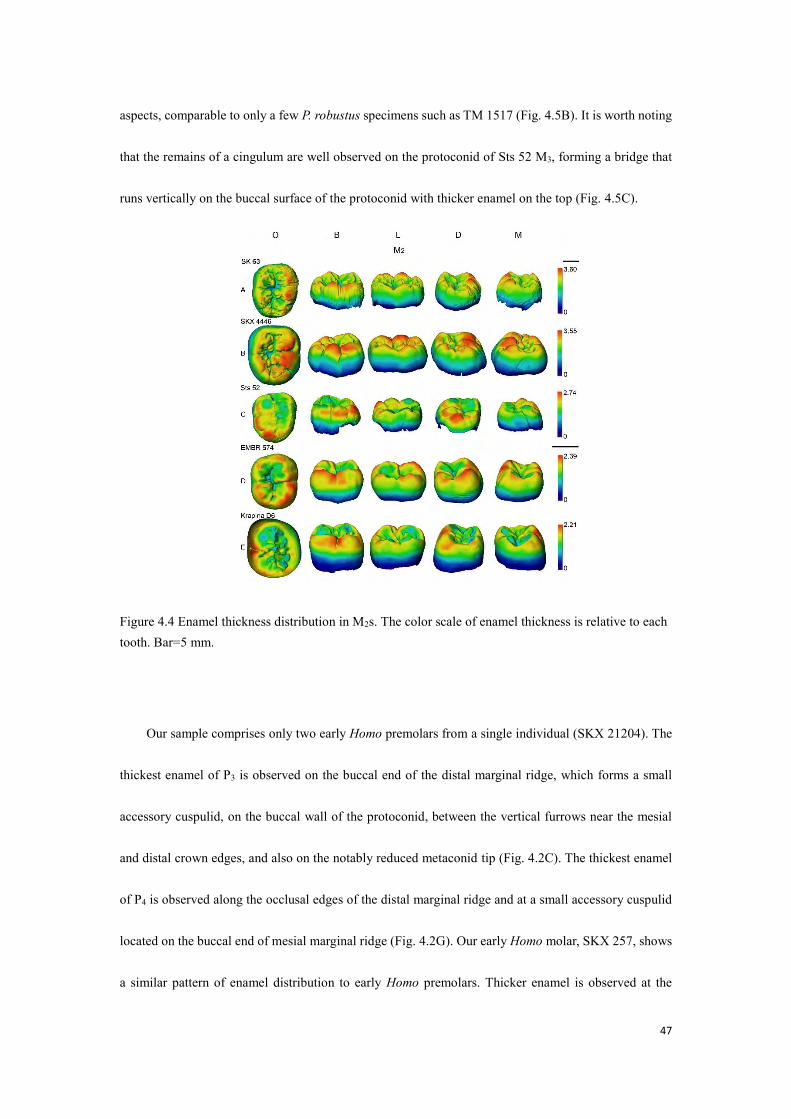
Figure 4.4 Enamel thickness distribution in M2s. The color scale of enamel thickness is relative to each tooth. Bar=5 mm.
Our sample comprises only two early Homo premolars from a single individual (SKX 21204). The
thickest enamel of P3 is observed on the buccal end of the distal marginal ridge, which forms a small
accessory cuspulid, on the buccal wall of the protoconid, between the vertical furrows near the mesial
and distal crown edges, and also on the notably reduced metaconid tip (Fig. 4.2C). The thickest enamel
of P4 is observed along the occlusal edges of the distal marginal ridge and at a small accessory cuspulid
located on the buccal end of mesial marginal ridge (Fig. 4.2G). Our early Homo molar, SKX 257, shows
a similar pattern of enamel distribution to early Homo premolars. Thicker enamel is observed at the

48
middle of the buccal wall, at a moderate distal ridge of the protoconid and the hypoconulid cusp tip (Fig.
4.3C). Thicker enamel is also seen at the tip of a pseudocentroconid located on the occlusal basin, as
shown in some P. robustus, modern humans and Neanderthals (Figs. 4.3A, B, F, G). In another early
Homo specimen, SK 15 M3, the cusps are almost worn flat retaining little information of enamel
distribution, but the lateral aspect is well-preserved, the buccal wall shows much thicker enamel than the
lingual wall (Fig. 4.5D).
The enamel thickness distribution in our extant human and Neanderthal sample shows closer affinity
to early Homo. Thicker enamel on extant human premolars is found at the buccal wall of the protoconid
(Fig. 4.2E, I) and also along the occlusal edges of protoconid (Fig. 4.2E, I). In molars, thicker enamel is
commonly found on the lateral aspects of buccal cusps (Fig. 4.3F–H), also on the occlusal edges of buccal
and distal cusps (Figs. 4.3E, 4.4D).
49
``
Figure 4.5 Enamel thickness distribution in M3s. The color scale of enamel thickness is relative to each tooth. Bar=5 mm.
4.3 Geometric morphometric analyses on EDJ shape
4.3.1 EDJ shape variation between groups of a given tooth position
Our Neanderthal sample shows a highly distinctive feature in EDJ morphology, which reduced
between-group variance among other groups. We thus conducted two separate sets of analyses, one with
Neanderthals and one without. Results of the multivariate analysis including the Neanderthal sample are
given in Figure 4.9, and will be discussed only when we generalize to the genus Homo.
The results of this comparative analysis of EDJ shape are shown in Figures 4.6–4.8. The first two
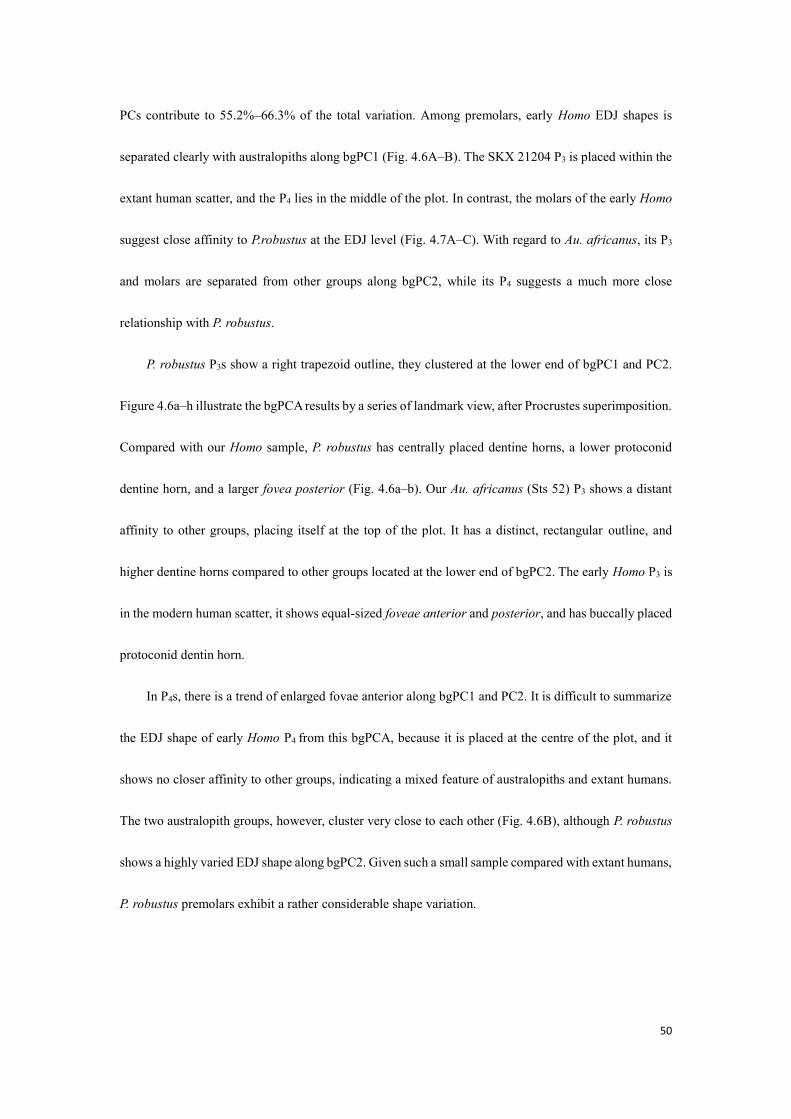
50
PCs contribute to 55.2%–66.3% of the total variation. Among premolars, early Homo EDJ shapes is
separated clearly with australopiths along bgPC1 (Fig. 4.6A–B). The SKX 21204 P3 is placed within the
extant human scatter, and the P4 lies in the middle of the plot. In contrast, the molars of the early Homo
suggest close affinity to P.robustus at the EDJ level (Fig. 4.7A–C). With regard to Au. africanus, its P3
and molars are separated from other groups along bgPC2, while its P4 suggests a much more close
relationship with P. robustus.
P. robustus P3s show a right trapezoid outline, they clustered at the lower end of bgPC1 and PC2.
Figure 4.6a–h illustrate the bgPCA results by a series of landmark view, after Procrustes superimposition.
Compared with our Homo sample, P. robustus has centrally placed dentine horns, a lower protoconid
dentine horn, and a larger fovea posterior (Fig. 4.6a–b). Our Au. africanus (Sts 52) P3 shows a distant
affinity to other groups, placing itself at the top of the plot. It has a distinct, rectangular outline, and
higher dentine horns compared to other groups located at the lower end of bgPC2. The early Homo P3 is
in the modern human scatter, it shows equal-sized foveae anterior and posterior, and has buccally placed
protoconid dentin horn.
In P4s, there is a trend of enlarged fovae anterior along bgPC1 and PC2. It is difficult to summarize
the EDJ shape of early Homo P4 from this bgPCA, because it is placed at the centre of the plot, and it
shows no closer affinity to other groups, indicating a mixed feature of australopiths and extant humans.
The two australopith groups, however, cluster very close to each other (Fig. 4.6B), although P. robustus
shows a highly varied EDJ shape along bgPC2. Given such a small sample compared with extant humans,
P. robustus premolars exhibit a rather considerable shape variation.

51
Figure 4.6 A–B: Results of bgPCAs of the semi-landmark configurations of P3 and P4, respectively. BgPC1 and bgPC2 represent components of the shape variation, the 95% confident ellipses are presented, ridge curves shown at the end of each axis illustrate the conformation trends of shape along each PC. C: Eigenvalues of each landmark involved in bgPCAs. The range of the eigenvalues is from -1 to 1. The bar denotes absolute values of the eigenvalues. a–h: Landmark series of EDJ after Procrustes superimposition and bgPCA. Arrows locate corresponding features described in the text.
The early Homo molars show closer affinity to P. robustus along both bgPCs (Fig. 4.7A–C). From
M1 to M3, early Homo shows a stable, slender and oval-rectangular outline, centrally placed dentine horns,
and a flat EDJ topology (Fig. 4.8A–B, E–F, I–J). Compared with extant humans, early Homo and P.
robustus are characterized by lower protoconid dentine horn, and a distally extended marginal ridge (Fig.
4.8B, F, J) indicates the presence of distal cusps. Indeed, the hypoconulid dentine horns are barely visible
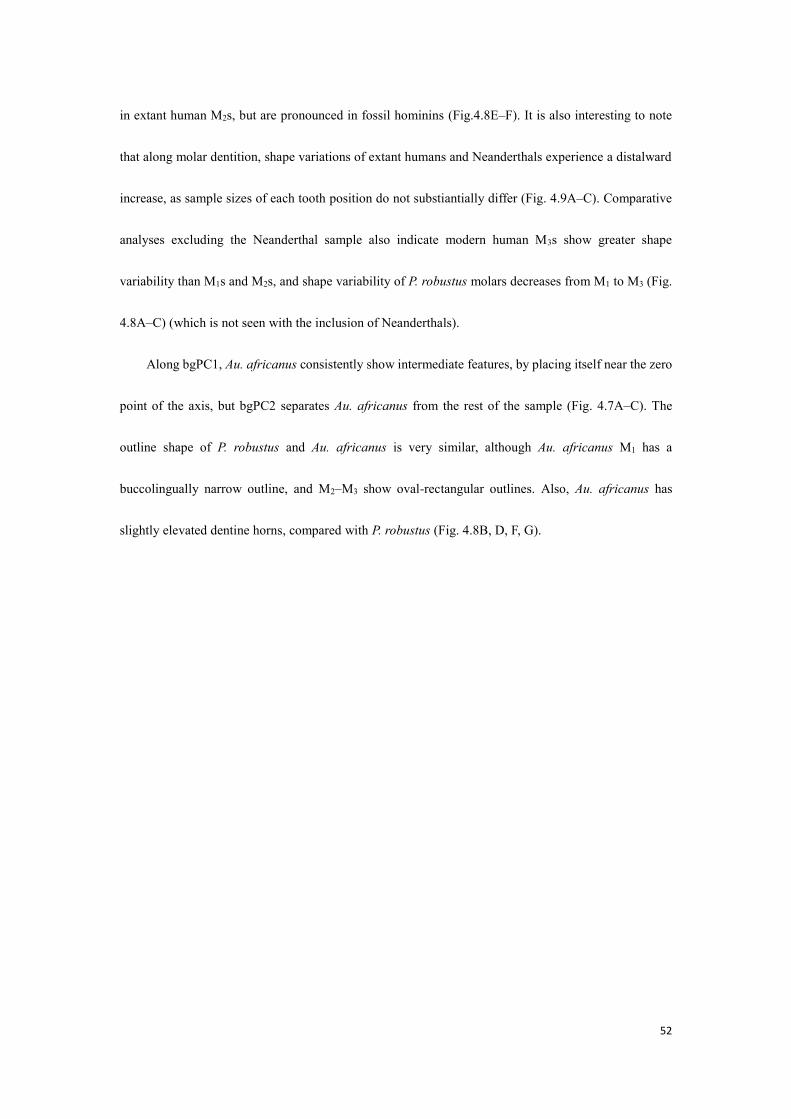
52
in extant human M2s, but are pronounced in fossil hominins (Fig.4.8E–F). It is also interesting to note
that along molar dentition, shape variations of extant humans and Neanderthals experience a distalward
increase, as sample sizes of each tooth position do not substiantially differ (Fig. 4.9A–C). Comparative
analyses excluding the Neanderthal sample also indicate modern human M3s show greater shape
variability than M1s and M2s, and shape variability of P. robustus molars decreases from M1 to M3 (Fig.
4.8A–C) (which is not seen with the inclusion of Neanderthals).
Along bgPC1, Au. africanus consistently show intermediate features, by placing itself near the zero
point of the axis, but bgPC2 separates Au. africanus from the rest of the sample (Fig. 4.7A–C). The
outline shape of P. robustus and Au. africanus is very similar, although Au. africanus M1 has a
buccolingually narrow outline, and M2–M3 show oval-rectangular outlines. Also, Au. africanus has
slightly elevated dentine horns, compared with P. robustus (Fig. 4.8B, D, F, G).
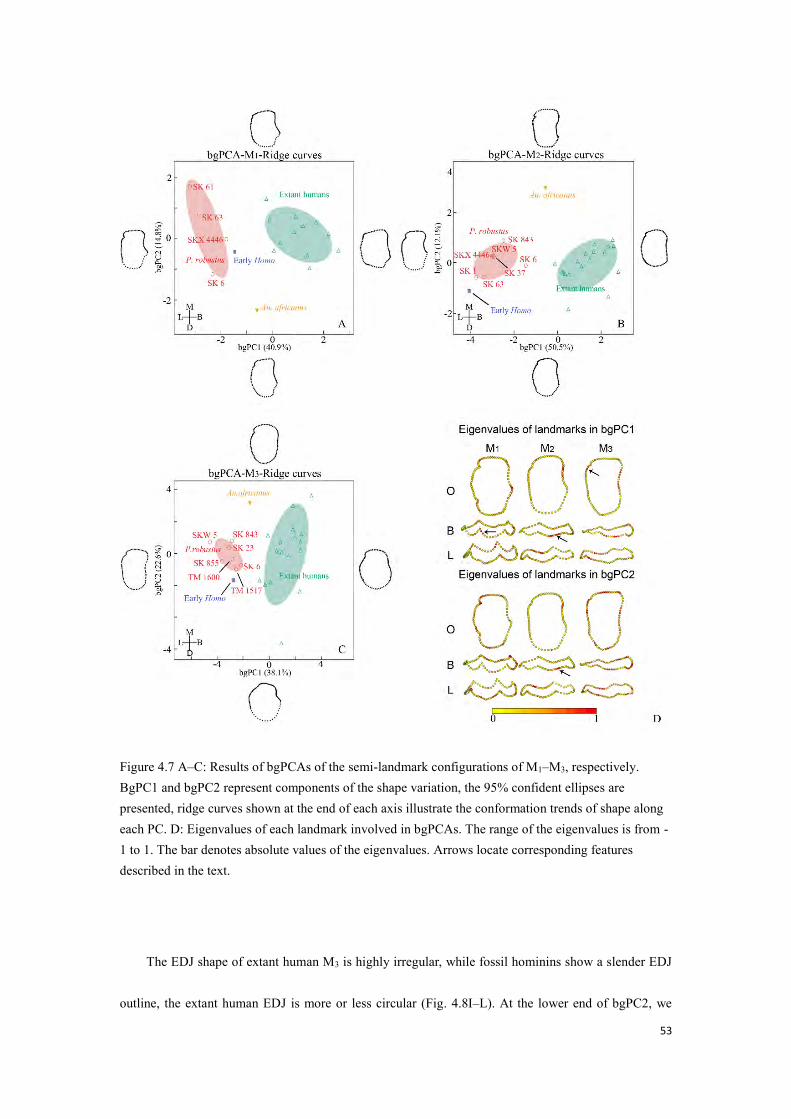
53
Figure 4.7 A–C: Results of bgPCAs of the semi-landmark configurations of M1–M3, respectively. BgPC1 and bgPC2 represent components of the shape variation, the 95% confident ellipses are presented, ridge curves shown at the end of each axis illustrate the conformation trends of shape along each PC. D: Eigenvalues of each landmark involved in bgPCAs. The range of the eigenvalues is from -1 to 1. The bar denotes absolute values of the eigenvalues. Arrows locate corresponding features described in the text.
The EDJ shape of extant human M3 is highly irregular, while fossil hominins show a slender EDJ
outline, the extant human EDJ is more or less circular (Fig. 4.8I–L). At the lower end of bgPC2, we

54
observe an elevated distal marginal ridge—but no clear evidence of accecory cusps (Fig. 4.8K–L).
Eigenvalues of landmarks are shown in Figure 4.6C and Figure 4.7D. Landmarks with highest
eigenvalues are commonly found at either side of dentine horn tips, suggesting the area around dentine
horn tips contributes most to the shape variation, this suggests the position of dentine horn tips alone is
a relatively weak indicator to shape variation.
Figure 4.8 Landmark series of EDJ after Procrustes superimposition and bgPCA. Arrows locate corresponding features described in the text
Figure 4.9 presents bgPCA results with Neanderthal sample, the first two bgPCs contribute to
57.2%–78.5% of the total variance. When introducing Neanderthal sample into the bgPCA, shape
variation among fossil hoinins and modern humans is compressed, probably because Neanderthals show

55
distant affinity to other groups (e.g., Fig. 4.9A), although in M2s, bgPC1 sets Neanderthals and extant
humans together (Fig. 4.9B) (because they do not present hypoconulid dentine horns). A slight degree of
overlap is only observed in M3s, and Neanderthals have a relatively large intra-group variation, especially
in M3s (Fig. 4.9C). From M1 to M3, shape variation in Neanderthal molars is increasing, as well as in
modern humans. Procrustes and conformation suggest Neanderthal molars show excessively centrally
placed lingual cusps (Fig. 4.9a, c, g, i), and distinctively high protoconid dentine horn, comparable to Au.
africanus (Fig. 4.9b, f, j, l). Neanderthal M3s placing at the positive end of bgPC1 show a mesially
extended marginal ridge (Fig. 4.9i). The shape differences among other species are unclear in the plot,
for there is a significant intra-group distinction in Neanderthals, although the sample size is small.
However, it is clear that early Homo molars have a closer relationship with P. robustus than with later
members of the genus Homo. It is worth noting that in M1 and M2, Au. africanus shows a closer affinity
to modern humans, while early Homo is clustered with P. robustus.

56
Figure 4.9 A–C: Results of bgPCA of the semi-landmark configurations, including Neanderthals. BgPC1 and bgPC2 represent functions of the shape variation, the 95% confident ellipses are presented, and ridge curves shown at the end of each axis illustrate the conformation trends of shape along each PC. a–l: Landmark series of EDJ after Procrustes superimposition and bgPCA. Arrows locate corresponding features described in the text.

57
Pan, L., Dumoncel, J., de Beer, F., Hoffman, J., Thackeray, J. F., Duployer, B., Tenailleau, C., Braga, J.,
2016. Further morphological evidence on South African earliest Homo lower postcanine dentition:
enamel thickness and enamel dentine junction. J. Hum. Evol. 96, 82–96.
lable at ScienceDirect
Journal of Human Evolution 96 (2016) 82e96
Contents lists avai
Journal of Human Evolution
journal homepage: www.elsevier .com/locate/ jhevol
Further morphological evidence on South African earliest Homo lowerpostcanine dentition: Enamel thickness and enamel dentine junction
Lei Pan a, b, *, Jean Dumoncel a, Frikkie de Beer c, Jakobus Hoffman c,John Francis Thackeray d, Benjamin Duployer e, Christophe Tenailleau e, Jos�e Braga a, d
a Computer-Assisted Palaeoanthropology Team, UMR 5288 CNRS-Universit�e de Toulouse (Paul Sabatier), 37 All�ees Jules Guesde, 31000 Toulouse, Franceb Key Laboratory of Vertebrate Evolution and Human Origins of Chinese Academy of Sciences, Institute of Vertebrate Paleontology and Paleoanthropology,Chinese Academy of Sciences, 100044 Beijing, Chinac South African Nuclear Energy Corporation, Pelindaba, North West Province, South Africad Evolutionary Studies Institute, University of the Witwatersrand, PO WITS, Johannesburg 2050, South Africae Centre Inter-universitaire de Recherche et d’Ing�enierie des Mat�eriaux, UMR 5085 CNRS-Universit�e de Toulouse (Paul Sabatier), 118 route de Narbonne,31062 Toulouse Cedex 9, France
a r t i c l e i n f o
Article history:Received 25 September 2015Accepted 4 May 2016
Keywords:AustralopithsGeometric morphometricTaxonomic discriminationDental evolutionDietary adaptation
* Corresponding author.E-mail address: [email protected] (L. Pan).
http://dx.doi.org/10.1016/j.jhevol.2016.05.0030047-2484/© 2016 Elsevier Ltd. All rights reserved.
a b s t r a c t
The appearance of the earliest members of the genus Homo in South Africa represents a key event inhuman evolution. Although enamel thickness and enamel dentine junction (EDJ) morphology preserveimportant information about hominin systematics and dietary adaptation, these features have not beensufficiently studied with regard to early Homo. We used micro-CT to compare enamel thickness and EDJmorphology among the mandibular postcanine dentitions of South African early hominins (N ¼ 30) andextant Homo sapiens (N ¼ 26), with special reference to early members of the genus Homo. We foundthat South African early Homo shows a similar enamel thickness distribution pattern to modern humans,although three-dimensional average and relative enamel thicknesses do not distinguish australopiths,early Homo, and modern humans particularly well. Based on enamel thickness distributions, our studysuggests that a dietary shift occurred between australopiths and the origin of the Homo lineage. We alsoobserved that South African early Homo postcanine EDJ combined primitive traits seen in australopithmolars with derived features observed in modern human premolars. Our results confirm that somedental morphological patterns in later Homo actually occurred early in the Homo lineage, and highlightthe taxonomic value of premolar EDJ morphology in hominin species.
© 2016 Elsevier Ltd. All rights reserved.
1. Introduction
Molar enamel thickness has provided information abouthominin taxonomy, functional morphology, and dietary ecology(Kay, 1981, 1985; Martin, 1985; Ungar et al., 2006; Kono and Suwa,2008; Smith et al., 2008; Olejniczak et al., 2008c). Although two-dimensional (2D) and three-dimensional (3D) studies of relativeenamel thickness effectively distinguish between Neanderthalsand modern humans (Olejniczak et al., 2008a; Bailey et al., 2014;Benazzi et al., 2015), enamel thickness has been shown to be ho-moplastic and does not consistently provide taxonomical infor-mation (Smith et al., 2003; Olejniczak et al., 2008b; Skinner et al.,
2015). The utility of dental tissue proportion for the taxonomy offossil hominins from 4 million years ago (Myr) to recent times islimited due to an insufficient number of detailed analyses and apoorly contextualized fossil record. It was also suggested thatsimple cross-sectional measurements did not reliably predictobserved 3D patterns (Olejniczak et al., 2008b). To date, enamelthickness in specimens transitional to Homo (here referred to asearly Homo) or attributed to premodern Homo (H. erectus orH. ergaster) has been measured largely from naturally fracturedteeth (Beynon and Wood, 1986; White et al., 1994) or virtual 2Dmeasurements based on medical computed tomography (CT;Schwartz, 1997) and micro-CT imaging (Smith et al., 2012; Skinneret al., 2015). Enamel thickness has been reported as being signif-icantly thinner in early Homo than in Paranthropus (Beynon andWood, 1986, 1987; Rozzi, 1998). More recently, virtual 2D mea-surements based on micro-CTs indicated that values obtained in
L. Pan et al. / Journal of Human Evolution 96 (2016) 82e96 83
three early Homo molars from South Africa exceeded modernhuman ranges and were closer to the “hyper thick” Paranthropuscondition (Smith et al., 2012). Also, 2D and 3Dmeasurements bothidentified thinner enamel relative to dentine proportions inNeanderthal deciduous and permanent teeth, compared withmodern humans (Olejniczak et al., 2008a; Fornai et al., 2014;Benazzi et al., 2015). It has therefore been concluded that molarenamel thickness is highly variable within the genus Homo (Smithet al., 2012).
Whole crown 3D distribution of molar enamel has beeninvestigated in Australopithecus africanus, Paranthropus robustus,and modern humans with the use of micro-CT (Kono et al., 2002;Kono and Suwa, 2008; Olejniczak et al., 2008b, c; Suwa et al.,2009). These studies have suggested distinct patterns amongsome fossil hominin species, but data on whole-crown enameldistributions from Early to Middle Pleistocene fossil homininscome only from Ardipithecus (Suwa et al., 2009), Au. africanus,P. robustus (Olejniczak et al., 2008a, b), and H. erectus (Zanolli,2015). Three-dimensional molar enamel distribution in austral-opiths is thickest over cusp tips, in contrast to recent humans, whohave thicker enamel surrounding the cusp base (Olejniczak et al.,2008b).
Observations on the morphology at the enamel dentine junc-tion (EDJ) of the postcanine dentition (Corruccini, 1987; Olejniczaket al., 2004, 2007; Skinner et al., 2009, 2010; Braga et al., 2010)have supplemented investigations made separately on enamelthickness distribution. Indeed, primate postcanine EDJmorphology carries useful taxonomic and phylogenetic informa-tion (Butler, 1956; Olejniczak et al., 2004, 2007; Skinner et al.,2008a, b), and can successfully discriminate between species andsubspecies of chimpanzee (Skinner, 2008). Dentine horn height,crown height, cervix shape, and protostylid expression all preservetaxonomically relevant shape information in Au. africanus andP. robustus. These two taxa show similar 3D EDJ shape and inter-individual metameric trends along the molar dentition, butP. robustus preserves a marked reduction in the buccolingualbreadth of the distal crown between M2 and M3, and a markedinterradicular extension of the enamel cap in M1 and M2 (Skinneret al., 2008b). When compared to extant humans, the degree ofintra-individual metameric variation is small in Au. africanus, as itis in Pan specimens (Hlusko, 2002; Braga et al., 2010). Moreover, inthe Au. africanus EDJ, the protostylid crest extends mesially aroundthe base of the protoconid dentine horn, whereas in P. robustus thecrest seems to be located between the dentine horns of the pro-toconid and hypoconid (Skinner et al., 2009). Analysis of M2 shapevariation in australopiths, South African early Homo, modernhumans, and Neanderthals using 3D geometric morphometric(GM) studies has indicated that enamel crown and cervical out-lines are less taxonomically informative than outer and innercrown surfaces (Fornai et al., 2015).
The present work aims to investigate 3D aspects of EDJ shapevariation and enamel distribution in mandibular postcaninedentition among South African early Pleistocene hominins andmodern humans, with special reference to South African earlyHomo, to test their taxonomic value and to investigatetaxonomically-sensitive features in early Homo. Our study is basedon micro-CT data, GM analysis, and a comparative sample ofP. robustus, Au. africanus, Neanderthals, and extant H. sapiens.
2. Materials and methods
2.1. Study sample
The focus of our analysis was mandibular postcanine dentalmaterial from three South African hominins, SKX 21204, SK 15, and
SKX 257, that we regard to be early Pleistocene Homo specimens,attributed either to hominins transitional to Homo (e.g., Homohabilis) or unambiguously considered as premodern Homo (e.g.,H. erectus; Wood, 2010). Currently, the older, East African H. erectusandH. habilismaterials are not available for study by the authors, sothis paper focuses only on South African early Homo, but it wouldbe very worthwhile to enlarge the sample to include East Africanmaterials. We compared the early Homo sample with South Africanaustralopith permanent lower postcanines (N ¼ 41) assigned toeither P. robustus or Au. africanus, extant H. sapiens (N ¼ 45), andEuropean Neanderthals (N ¼ 16). Our sample contained a numberof antimeres, so analyses and interpretation were based on thesample shown in Table 1: when antimeres were available, thebetter-preserved side was used or, when antimeres were equallywell-preserved, the right side was selected (i.e., antimeres were notaveraged). Tooth-by-tooth enamel thickness data including anti-meres are reported in the Supplementary Online Material (SOM)Table 1.
2.2. Micro-computed tomography
All South African hominin specimens (except for Sts 52) werescanned using the X-Tek (Metris) XT H225L industrial micro-XCTsystem at the South African Nuclear Energy Corporation (Necsa;Hoffman and de Beer, 2012). Most of the extant H. sapiens speci-mens (except for all the M3s), along with the MontmaurinNeanderthal and one Au. africanus specimen (Sts 52) were scannedat the Institute for Space Medicine and Physiology (MEDES) ofToulouse with a Scanco Medical X-Treme micro-CT scanner. Theextant human M3s and Neanderthals from La Chaise were scannedby Arnaud Mazurier at the Centre de Microtomographie of theUniversit�e de Poitiers (equipment X8050-16 Viscom AG; camera1004 � 1004). Micro-CT data of the Krapina Neanderthals weredownloaded from the NESPOS Database (NESPOS database, 2015).Isometric voxel size ranged from 10 to 70 mm. Each specimen wassegmented and measured in Avizo 8.0 (Visualization SciencesGroup, www.vsg3d.com). Statistical analyses were conducted us-ing R (R Development Core Team, 2012), except for the Krus-kaleWallis test with Connover's post hoc comparison, which wasundertaken using BrightStat (Stricker, 2008).
2.3. 3D surface reconstruction
Micro-CT image stacks were imported for semi-automated(modules “magic wand” and “Threshold”) and automated (mod-ule “Watershed”) segmentations, surface reconstructions, and vi-sualizations (“Colormap” option) of whole-crown enamel thicknessdistributions. The 3D outer enamel surfaces and EDJ surfaces(simplified to 100,000 faces) were calculated using the “uncon-strained smoothing” parameter.
Most of our sample contains crowns with no or only slight signsof attrition; 13 teeth showing wear facets reaching the later phaseof stage 2 according to Molnar (1971) were excluded from theanalysis of enamel thickness. The degree of wear for each fossilspecimen is listed in Table 1. On account of fractures, very smallreconstructions were made prior to measurement. In the majorityof cases, this involved only very minor additions of dental tissue. Itis worth noting that the left dentition of Sts 18 showed a degree ofdistortion, but we managed to digitally reconstruct the enamel anddentine tissue in good order.2.3.1. 3D map of whole-crown enamel distribution To investigatethe 3D distribution of enamel, we applied the “colormap” option tovisualize whole-crown enamel thickness (Kono et al., 2002). First,we computed the minimal distance from the occlusal to the EDJsurfaces through the “Surface distance” module on Avizo v8.0.
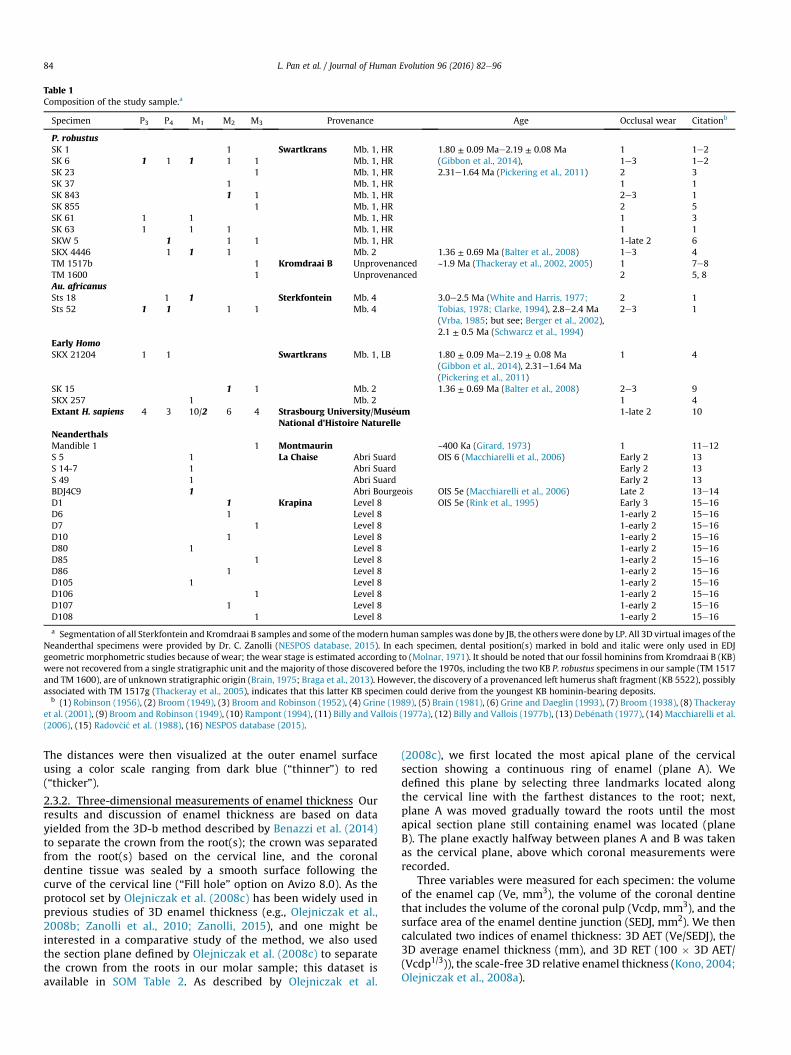
Table 1Composition of the study sample.a
Specimen P3 P4 M1 M2 M3 Provenance Age Occlusal wear Citationb
P. robustusSK 1 1 Swartkrans Mb. 1, HR 1.80 ± 0.09 Mae2.19 ± 0.08 Ma
(Gibbon et al., 2014),2.31e1.64 Ma (Pickering et al., 2011)
1 1e2SK 6 1 1 1 1 1 Mb. 1, HR 1e3 1e2SK 23 1 Mb. 1, HR 2 3SK 37 1 Mb. 1, HR 1 1SK 843 1 1 Mb. 1, HR 2e3 1SK 855 1 Mb. 1, HR 2 5SK 61 1 1 Mb. 1, HR 1 3SK 63 1 1 1 Mb. 1, HR 1 1SKW 5 1 1 1 Mb. 1, HR 1-late 2 6SKX 4446 1 1 1 Mb. 2 1.36 ± 0.69 Ma (Balter et al., 2008) 1e3 4TM 1517b 1 Kromdraai B Unprovenanced ~1.9 Ma (Thackeray et al., 2002, 2005) 1 7e8TM 1600 1 Unprovenanced 2 5, 8Au. africanusSts 18 1 1 Sterkfontein Mb. 4 3.0e2.5 Ma (White and Harris, 1977;
Tobias, 1978; Clarke, 1994), 2.8e2.4 Ma(Vrba, 1985; but see; Berger et al., 2002),2.1 ± 0.5 Ma (Schwarcz et al., 1994)
2 1Sts 52 1 1 1 1 Mb. 4 2e3 1
Early HomoSKX 21204 1 1 Swartkrans Mb. 1, LB 1.80 ± 0.09 Mae2.19 ± 0.08 Ma
(Gibbon et al., 2014), 2.31e1.64 Ma(Pickering et al., 2011)
1 4
SK 15 1 1 Mb. 2 1.36 ± 0.69 Ma (Balter et al., 2008) 2e3 9SKX 257 1 Mb. 2 1 4Extant H. sapiens 4 3 10/2 6 4 Strasbourg University/Mus�eum
National d'Histoire Naturelle1-late 2 10
NeanderthalsMandible 1 1 Montmaurin ~400 Ka (Girard, 1973) 1 11e12S 5 1 La Chaise Abri Suard OIS 6 (Macchiarelli et al., 2006) Early 2 13S 14-7 1 Abri Suard Early 2 13S 49 1 Abri Suard Early 2 13BDJ4C9 1 Abri Bourgeois OIS 5e (Macchiarelli et al., 2006) Late 2 13e14D1 1 Krapina Level 8 OIS 5e (Rink et al., 1995) Early 3 15e16D6 1 Level 8 1-early 2 15e16D7 1 Level 8 1-early 2 15e16D10 1 Level 8 1-early 2 15e16D80 1 Level 8 1-early 2 15e16D85 1 Level 8 1-early 2 15e16D86 1 Level 8 1-early 2 15e16D105 1 Level 8 1-early 2 15e16D106 1 Level 8 1-early 2 15e16D107 1 Level 8 1-early 2 15e16D108 1 Level 8 1-early 2 15e16
a Segmentation of all Sterkfontein and Kromdraai B samples and some of themodern human samples was done by JB, the others were done by LP. All 3D virtual images of theNeanderthal specimens were provided by Dr. C. Zanolli (NESPOS database, 2015). In each specimen, dental position(s) marked in bold and italic were only used in EDJgeometric morphometric studies because of wear; the wear stage is estimated according to (Molnar, 1971). It should be noted that our fossil hominins from Kromdraai B (KB)were not recovered from a single stratigraphic unit and the majority of those discovered before the 1970s, including the two KB P. robustus specimens in our sample (TM 1517and TM 1600), are of unknown stratigraphic origin (Brain, 1975; Braga et al., 2013). However, the discovery of a provenanced left humerus shaft fragment (KB 5522), possiblyassociated with TM 1517g (Thackeray et al., 2005), indicates that this latter KB specimen could derive from the youngest KB hominin-bearing deposits.
b (1) Robinson (1956), (2) Broom (1949), (3) Broom and Robinson (1952), (4) Grine (1989), (5) Brain (1981), (6) Grine and Daeglin (1993), (7) Broom (1938), (8) Thackerayet al. (2001), (9) Broom and Robinson (1949), (10) Rampont (1994), (11) Billy and Vallois (1977a), (12) Billy and Vallois (1977b), (13) Deb�enath (1977), (14) Macchiarelli et al.(2006), (15) Radov�ci�c et al. (1988), (16) NESPOS database (2015).
L. Pan et al. / Journal of Human Evolution 96 (2016) 82e9684
The distances were then visualized at the outer enamel surfaceusing a color scale ranging from dark blue (“thinner”) to red(“thicker”).
2.3.2. Three-dimensional measurements of enamel thickness Ourresults and discussion of enamel thickness are based on datayielded from the 3D-b method described by Benazzi et al. (2014)to separate the crown from the root(s); the crown was separatedfrom the root(s) based on the cervical line, and the coronaldentine tissue was sealed by a smooth surface following thecurve of the cervical line (“Fill hole” option on Avizo 8.0). As theprotocol set by Olejniczak et al. (2008c) has been widely used inprevious studies of 3D enamel thickness (e.g., Olejniczak et al.,2008b; Zanolli et al., 2010; Zanolli, 2015), and one might beinterested in a comparative study of the method, we also usedthe section plane defined by Olejniczak et al. (2008c) to separatethe crown from the roots in our molar sample; this dataset isavailable in SOM Table 2. As described by Olejniczak et al.
(2008c), we first located the most apical plane of the cervicalsection showing a continuous ring of enamel (plane A). Wedefined this plane by selecting three landmarks located alongthe cervical line with the farthest distances to the root; next,plane A was moved gradually toward the roots until the mostapical section plane still containing enamel was located (planeB). The plane exactly halfway between planes A and B was takenas the cervical plane, above which coronal measurements wererecorded.
Three variables were measured for each specimen: the volumeof the enamel cap (Ve, mm3), the volume of the coronal dentinethat includes the volume of the coronal pulp (Vcdp, mm3), and thesurface area of the enamel dentine junction (SEDJ, mm2). We thencalculated two indices of enamel thickness: 3D AET (Ve/SEDJ), the3D average enamel thickness (mm), and 3D RET (100 � 3D AET/(Vcdp1/3)), the scale-free 3D relative enamel thickness (Kono, 2004;Olejniczak et al., 2008a).
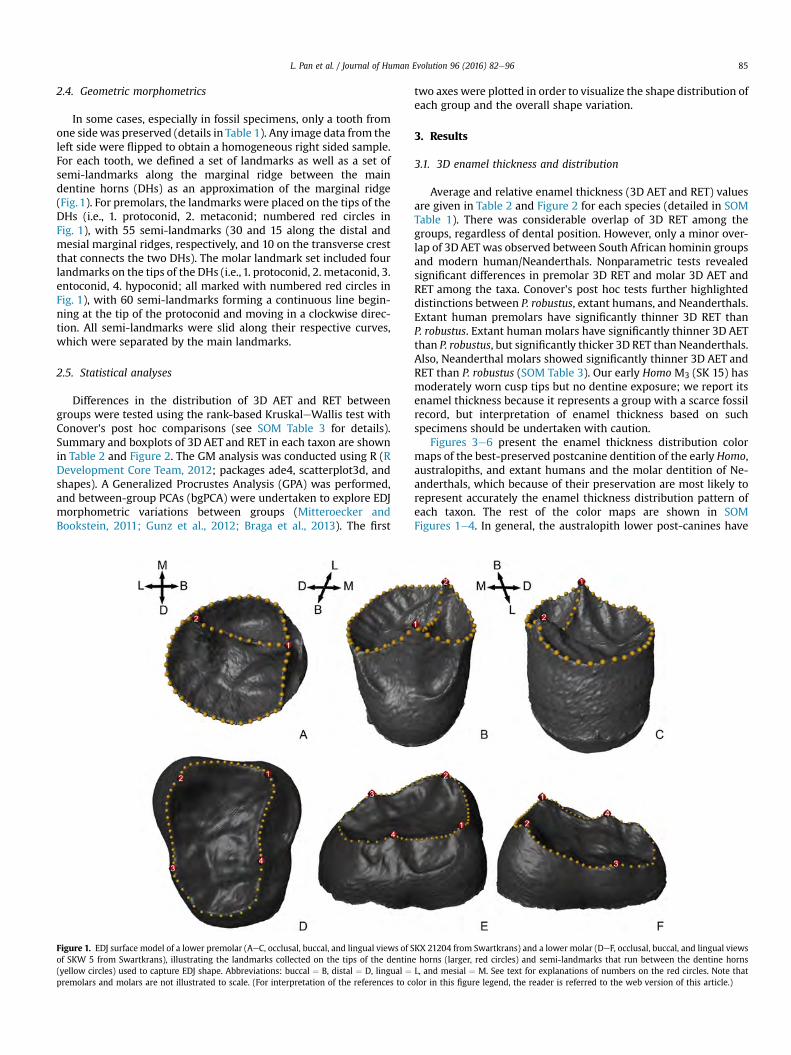
L. Pan et al. / Journal of Human Evolution 96 (2016) 82e96 85
2.4. Geometric morphometrics
In some cases, especially in fossil specimens, only a tooth fromone sidewas preserved (details in Table 1). Any image data from theleft side were flipped to obtain a homogeneous right sided sample.For each tooth, we defined a set of landmarks as well as a set ofsemi-landmarks along the marginal ridge between the maindentine horns (DHs) as an approximation of the marginal ridge(Fig. 1). For premolars, the landmarks were placed on the tips of theDHs (i.e., 1. protoconid, 2. metaconid; numbered red circles inFig. 1), with 55 semi-landmarks (30 and 15 along the distal andmesial marginal ridges, respectively, and 10 on the transverse crestthat connects the two DHs). The molar landmark set included fourlandmarks on the tips of the DHs (i.e., 1. protoconid, 2. metaconid, 3.entoconid, 4. hypoconid; all marked with numbered red circles inFig. 1), with 60 semi-landmarks forming a continuous line begin-ning at the tip of the protoconid and moving in a clockwise direc-tion. All semi-landmarks were slid along their respective curves,which were separated by the main landmarks.
2.5. Statistical analyses
Differences in the distribution of 3D AET and RET betweengroups were tested using the rank-based KruskaleWallis test withConover's post hoc comparisons (see SOM Table 3 for details).Summary and boxplots of 3D AET and RET in each taxon are shownin Table 2 and Figure 2. The GM analysis was conducted using R (RDevelopment Core Team, 2012; packages ade4, scatterplot3d, andshapes). A Generalized Procrustes Analysis (GPA) was performed,and between-group PCAs (bgPCA) were undertaken to explore EDJmorphometric variations between groups (Mitteroecker andBookstein, 2011; Gunz et al., 2012; Braga et al., 2013). The first
Figure 1. EDJ surface model of a lower premolar (AeC, occlusal, buccal, and lingual views of Sof SKW 5 from Swartkrans), illustrating the landmarks collected on the tips of the dentin(yellow circles) used to capture EDJ shape. Abbreviations: buccal ¼ B, distal ¼ D, lingual ¼premolars and molars are not illustrated to scale. (For interpretation of the references to c
two axes were plotted in order to visualize the shape distribution ofeach group and the overall shape variation.
3. Results
3.1. 3D enamel thickness and distribution
Average and relative enamel thickness (3D AET and RET) valuesare given in Table 2 and Figure 2 for each species (detailed in SOMTable 1). There was considerable overlap of 3D RET among thegroups, regardless of dental position. However, only a minor over-lap of 3D AET was observed between South African hominin groupsand modern human/Neanderthals. Nonparametric tests revealedsignificant differences in premolar 3D RET and molar 3D AET andRET among the taxa. Conover's post hoc tests further highlighteddistinctions between P. robustus, extant humans, and Neanderthals.Extant human premolars have significantly thinner 3D RET thanP. robustus. Extant human molars have significantly thinner 3D AETthan P. robustus, but significantly thicker 3D RET than Neanderthals.Also, Neanderthal molars showed significantly thinner 3D AET andRET than P. robustus (SOM Table 3). Our early Homo M3 (SK 15) hasmoderately worn cusp tips but no dentine exposure; we report itsenamel thickness because it represents a group with a scarce fossilrecord, but interpretation of enamel thickness based on suchspecimens should be undertaken with caution.
Figures 3e6 present the enamel thickness distribution colormaps of the best-preserved postcanine dentition of the early Homo,australopiths, and extant humans and the molar dentition of Ne-anderthals, which because of their preservation are most likely torepresent accurately the enamel thickness distribution pattern ofeach taxon. The rest of the color maps are shown in SOMFigures 1e4. In general, the australopith lower post-canines have
KX 21204 from Swartkrans) and a lower molar (DeF, occlusal, buccal, and lingual viewse horns (larger, red circles) and semi-landmarks that run between the dentine hornsL, and mesial ¼ M. See text for explanations of numbers on the red circles. Note thatolor in this figure legend, the reader is referred to the web version of this article.)
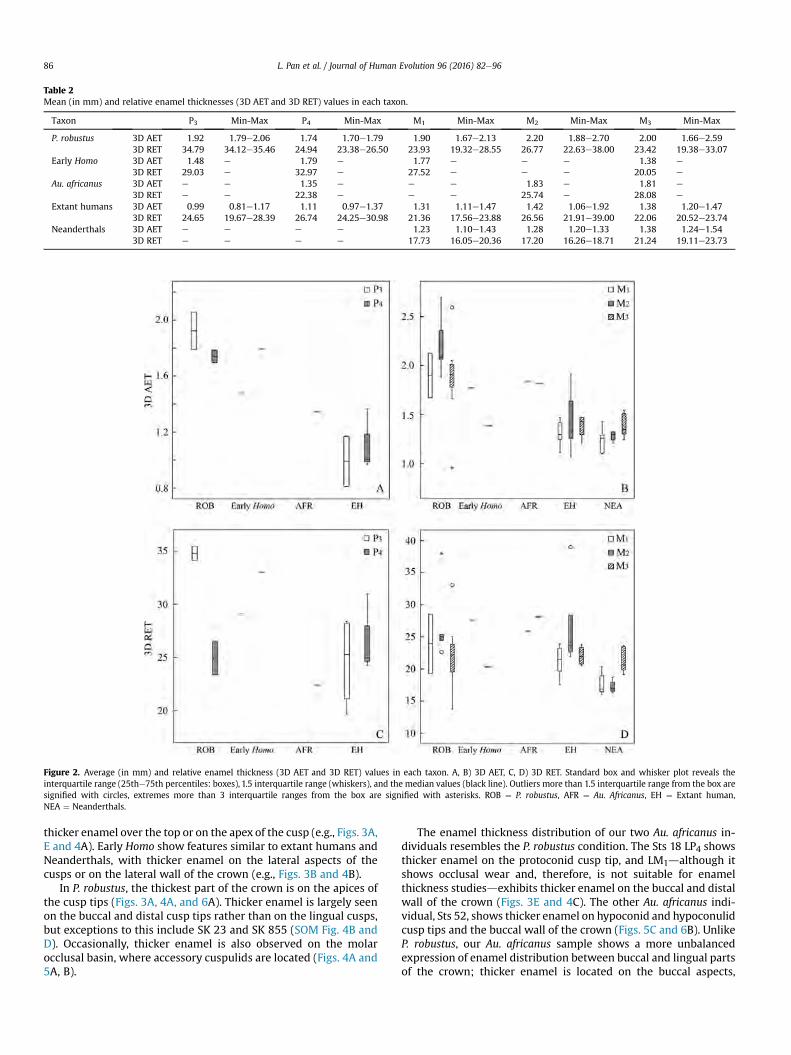
Table 2Mean (in mm) and relative enamel thicknesses (3D AET and 3D RET) values in each taxon.
Taxon P3 Min-Max P4 Min-Max M1 Min-Max M2 Min-Max M3 Min-Max
P. robustus 3D AET 1.92 1.79e2.06 1.74 1.70e1.79 1.90 1.67e2.13 2.20 1.88e2.70 2.00 1.66e2.593D RET 34.79 34.12e35.46 24.94 23.38e26.50 23.93 19.32e28.55 26.77 22.63e38.00 23.42 19.38e33.07
Early Homo 3D AET 1.48 e 1.79 e 1.77 e e e 1.38 e
3D RET 29.03 e 32.97 e 27.52 e e e 20.05 e
Au. africanus 3D AET e e 1.35 e e e 1.83 e 1.81 e
3D RET e e 22.38 e e e 25.74 e 28.08 e
Extant humans 3D AET 0.99 0.81e1.17 1.11 0.97e1.37 1.31 1.11e1.47 1.42 1.06e1.92 1.38 1.20e1.473D RET 24.65 19.67e28.39 26.74 24.25e30.98 21.36 17.56e23.88 26.56 21.91e39.00 22.06 20.52e23.74
Neanderthals 3D AET e e e e 1.23 1.10e1.43 1.28 1.20e1.33 1.38 1.24e1.543D RET e e e e 17.73 16.05e20.36 17.20 16.26e18.71 21.24 19.11e23.73
Figure 2. Average (in mm) and relative enamel thickness (3D AET and 3D RET) values in each taxon. A, B) 3D AET, C, D) 3D RET. Standard box and whisker plot reveals theinterquartile range (25the75th percentiles: boxes), 1.5 interquartile range (whiskers), and the median values (black line). Outliers more than 1.5 interquartile range from the box aresignified with circles, extremes more than 3 interquartile ranges from the box are signified with asterisks. ROB ¼ P. robustus, AFR ¼ Au. Africanus, EH ¼ Extant human,NEA ¼ Neanderthals.
L. Pan et al. / Journal of Human Evolution 96 (2016) 82e9686
thicker enamel over the top or on the apex of the cusp (e.g., Figs. 3A,E and 4A). Early Homo show features similar to extant humans andNeanderthals, with thicker enamel on the lateral aspects of thecusps or on the lateral wall of the crown (e.g., Figs. 3B and 4B).
In P. robustus, the thickest part of the crown is on the apices ofthe cusp tips (Figs. 3A, 4A, and 6A). Thicker enamel is largely seenon the buccal and distal cusp tips rather than on the lingual cusps,but exceptions to this include SK 23 and SK 855 (SOM Fig. 4B andD). Occasionally, thicker enamel is also observed on the molarocclusal basin, where accessory cuspulids are located (Figs. 4A and5A, B).
The enamel thickness distribution of our two Au. africanus in-dividuals resembles the P. robustus condition. The Sts 18 LP4 showsthicker enamel on the protoconid cusp tip, and LM1dalthough itshows occlusal wear and, therefore, is not suitable for enamelthickness studiesdexhibits thicker enamel on the buccal and distalwall of the crown (Figs. 3E and 4C). The other Au. africanus indi-vidual, Sts 52, shows thicker enamel on hypoconid and hypoconulidcusp tips and the buccal wall of the crown (Figs. 5C and 6B). UnlikeP. robustus, our Au. africanus sample shows a more unbalancedexpression of enamel distribution between buccal and lingual partsof the crown; thicker enamel is located on the buccal aspects,
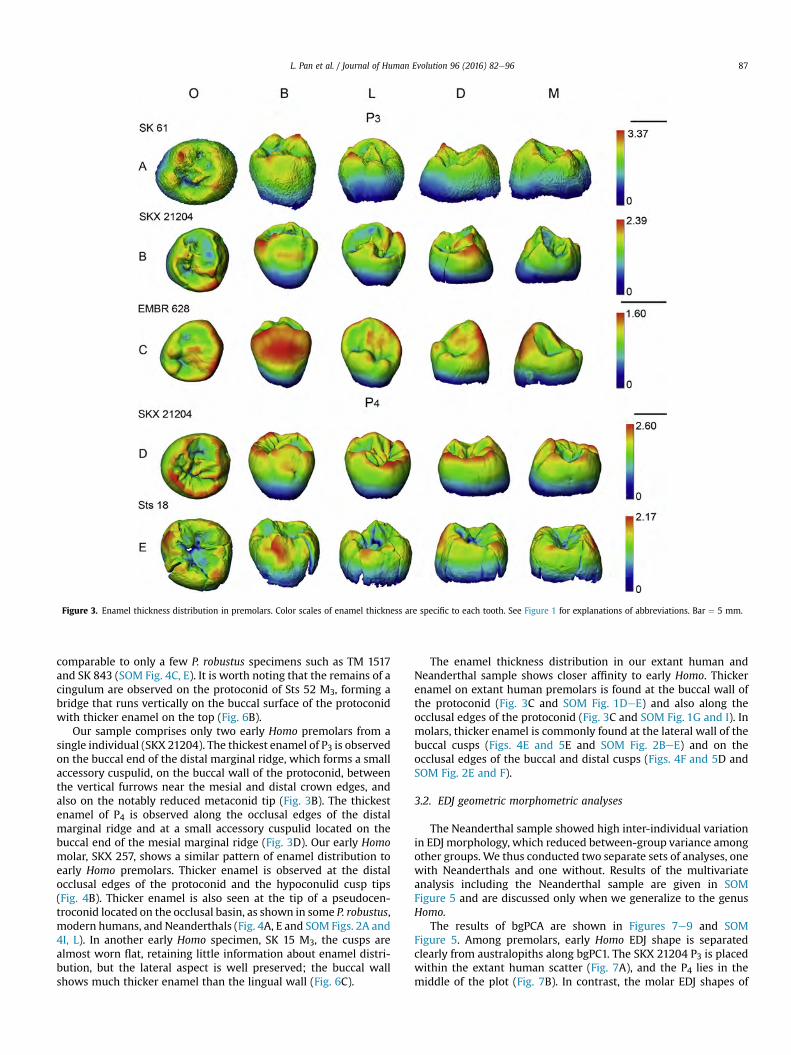
Figure 3. Enamel thickness distribution in premolars. Color scales of enamel thickness are specific to each tooth. See Figure 1 for explanations of abbreviations. Bar ¼ 5 mm.
L. Pan et al. / Journal of Human Evolution 96 (2016) 82e96 87
comparable to only a few P. robustus specimens such as TM 1517and SK 843 (SOM Fig. 4C, E). It is worth noting that the remains of acingulum are observed on the protoconid of Sts 52 M3, forming abridge that runs vertically on the buccal surface of the protoconidwith thicker enamel on the top (Fig. 6B).
Our sample comprises only two early Homo premolars from asingle individual (SKX 21204). The thickest enamel of P3 is observedon the buccal end of the distal marginal ridge, which forms a smallaccessory cuspulid, on the buccal wall of the protoconid, betweenthe vertical furrows near the mesial and distal crown edges, andalso on the notably reduced metaconid tip (Fig. 3B). The thickestenamel of P4 is observed along the occlusal edges of the distalmarginal ridge and at a small accessory cuspulid located on thebuccal end of the mesial marginal ridge (Fig. 3D). Our early Homomolar, SKX 257, shows a similar pattern of enamel distribution toearly Homo premolars. Thicker enamel is observed at the distalocclusal edges of the protoconid and the hypoconulid cusp tips(Fig. 4B). Thicker enamel is also seen at the tip of a pseudocen-troconid located on the occlusal basin, as shown in some P. robustus,modern humans, and Neanderthals (Fig. 4A, E and SOM Figs. 2A and4I, L). In another early Homo specimen, SK 15 M3, the cusps arealmost worn flat, retaining little information about enamel distri-bution, but the lateral aspect is well preserved; the buccal wallshows much thicker enamel than the lingual wall (Fig. 6C).
The enamel thickness distribution in our extant human andNeanderthal sample shows closer affinity to early Homo. Thickerenamel on extant human premolars is found at the buccal wall ofthe protoconid (Fig. 3C and SOM Fig. 1DeE) and also along theocclusal edges of the protoconid (Fig. 3C and SOM Fig. 1G and I). Inmolars, thicker enamel is commonly found at the lateral wall of thebuccal cusps (Figs. 4E and 5E and SOM Fig. 2BeE) and on theocclusal edges of the buccal and distal cusps (Figs. 4F and 5D andSOM Fig. 2E and F).
3.2. EDJ geometric morphometric analyses
The Neanderthal sample showed high inter-individual variationin EDJ morphology, which reduced between-group variance amongother groups. We thus conducted two separate sets of analyses, onewith Neanderthals and one without. Results of the multivariateanalysis including the Neanderthal sample are given in SOMFigure 5 and are discussed only when we generalize to the genusHomo.
The results of bgPCA are shown in Figures 7e9 and SOMFigure 5. Among premolars, early Homo EDJ shape is separatedclearly from australopiths along bgPC1. The SKX 21204 P3 is placedwithin the extant human scatter (Fig. 7A), and the P4 lies in themiddle of the plot (Fig. 7B). In contrast, the molar EDJ shapes of
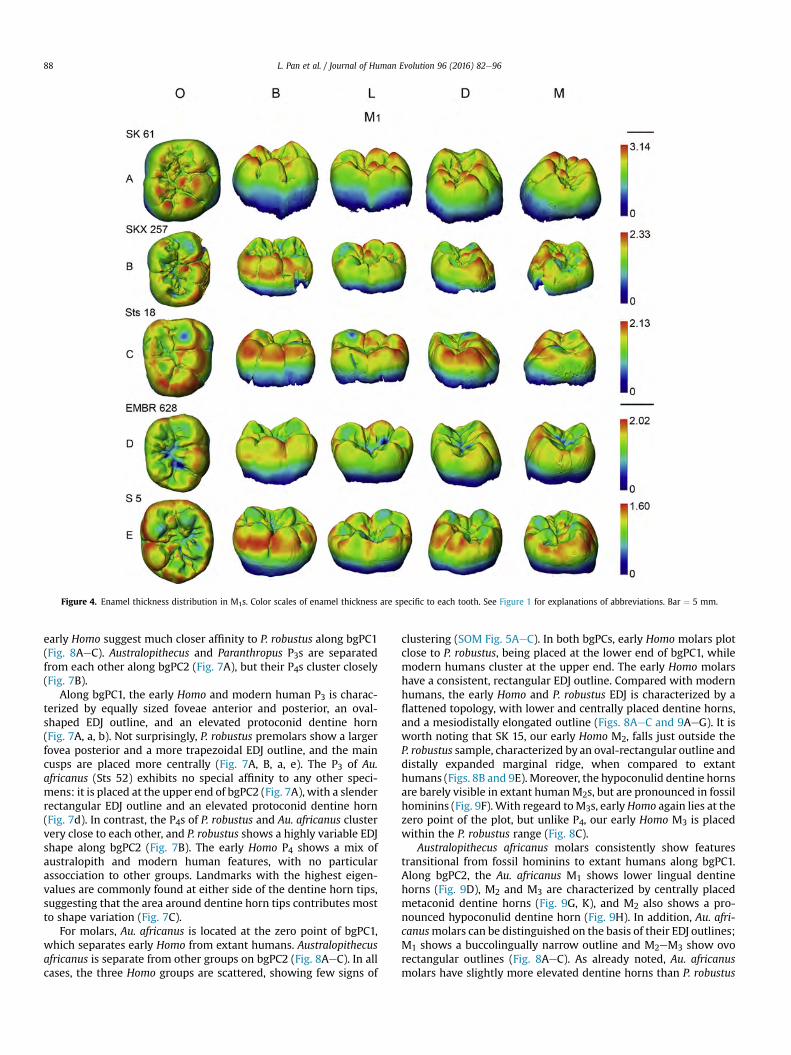
Figure 4. Enamel thickness distribution in M1s. Color scales of enamel thickness are specific to each tooth. See Figure 1 for explanations of abbreviations. Bar ¼ 5 mm.
L. Pan et al. / Journal of Human Evolution 96 (2016) 82e9688
early Homo suggest much closer affinity to P. robustus along bgPC1(Fig. 8AeC). Australopithecus and Paranthropus P3s are separatedfrom each other along bgPC2 (Fig. 7A), but their P4s cluster closely(Fig. 7B).
Along bgPC1, the early Homo and modern human P3 is charac-terized by equally sized foveae anterior and posterior, an oval-shaped EDJ outline, and an elevated protoconid dentine horn(Fig. 7A, a, b). Not surprisingly, P. robustus premolars show a largerfovea posterior and a more trapezoidal EDJ outline, and the maincusps are placed more centrally (Fig. 7A, B, a, e). The P3 of Au.africanus (Sts 52) exhibits no special affinity to any other speci-mens: it is placed at the upper end of bgPC2 (Fig. 7A), with a slenderrectangular EDJ outline and an elevated protoconid dentine horn(Fig. 7d). In contrast, the P4s of P. robustus and Au. africanus clustervery close to each other, and P. robustus shows a highly variable EDJshape along bgPC2 (Fig. 7B). The early Homo P4 shows a mix ofaustralopith and modern human features, with no particularassocciation to other groups. Landmarks with the highest eigen-values are commonly found at either side of the dentine horn tips,suggesting that the area around dentine horn tips contributes mostto shape variation (Fig. 7C).
For molars, Au. africanus is located at the zero point of bgPC1,which separates early Homo from extant humans. Australopithecusafricanus is separate from other groups on bgPC2 (Fig. 8AeC). In allcases, the three Homo groups are scattered, showing few signs of
clustering (SOM Fig. 5AeC). In both bgPCs, early Homo molars plotclose to P. robustus, being placed at the lower end of bgPC1, whilemodern humans cluster at the upper end. The early Homo molarshave a consistent, rectangular EDJ outline. Compared with modernhumans, the early Homo and P. robustus EDJ is characterized by aflattened topology, with lower and centrally placed dentine horns,and a mesiodistally elongated outline (Figs. 8AeC and 9AeG). It isworth noting that SK 15, our early Homo M2, falls just outside theP. robustus sample, characterized by an oval-rectangular outline anddistally expanded marginal ridge, when compared to extanthumans (Figs. 8B and 9E). Moreover, the hypoconulid dentine hornsare barely visible in extant humanM2s, but are pronounced in fossilhominins (Fig. 9F). With regeard toM3s, earlyHomo again lies at thezero point of the plot, but unlike P4, our early Homo M3 is placedwithin the P. robustus range (Fig. 8C).
Australopithecus africanus molars consistently show featurestransitional from fossil hominins to extant humans along bgPC1.Along bgPC2, the Au. africanus M1 shows lower lingual dentinehorns (Fig. 9D), M2 and M3 are characterized by centrally placedmetaconid dentine horns (Fig. 9G, K), and M2 also shows a pro-nounced hypoconulid dentine horn (Fig. 9H). In addition, Au. afri-canusmolars can be distinguished on the basis of their EDJ outlines;M1 shows a buccolingually narrow outline and M2eM3 show ovorectangular outlines (Fig. 8AeC). As already noted, Au. africanusmolars have slightly more elevated dentine horns than P. robustus

Figure 5. Enamel thickness distribution in M2s. Color scales of enamel thickness are specific to each tooth. See Figure 1 for explanations of abbreviations. Bar ¼ 5 mm.
L. Pan et al. / Journal of Human Evolution 96 (2016) 82e96 89
(Skinner et al., 2008b). This is consistent with our results, as bgPC1probably contributes to variation of dentine horn height, althoughour study has a small sample size. Like in the premolars, landmarkswith the highest eigenvalues are commonly placed at either side ofthe dentine horn tips, at the lowest point of ridge curves thatconnect two dentine horns (Fig. 8D).
When the Neanderthal sample is included in analysis, Nean-derthals and modern humans form two separate groups alongbgPC2 (SOM Fig. 5AeC), and Neanderthal M1s and M3s showappreciable inter-individual variation, with the distributioncovering one-half of the axis/plot (e.g., SOM Fig. 5A and C). It is alsointeresting to note that when we introduce Neanderthal data, theM1 of Au. africanus plots with modern humans, which is probablydue to the strongly centrally placed lingual dentine horns in theNeanderthal sample, a distinct character that “compresses”between-group dispersion (SOM Fig. 5AeC, c, g, k). Neanderthalsalso show high protoconid dentine horns, and M3s show anexcessively deep and curved mesial marginal ridge. The shapedifferences among other species are unclear in the plot for there is asignificant inter-individual variation in Neanderthals, although thesample size is small and our generalization is based on landmarkshapes yielded by GPA and bgPCA, at either end of the axes (SOM
Fig. 5k). However, it is clear that early Homo molars have a closersimilarity to P. robustus than to other Homo groups.
4. Discussion
4.1. Variation in enamel thickness parameters and distributionbetween groups
We observe a trend for an increase in 3D AET and RET along thepremolar dentition in the modern human group and our earlyHomo individual. However, a limited sample size currently preventsstatistical generalization of early Homo enamel thickness. No clearrelationship is found between 3D enamel thickness and molarposition in australopiths, as already suggested by other studies(Olejniczak et al., 2008b). We also find that extant human pre-molars have significantly thinner RET than P. robustus (SOMTable 3). Our results on 3D molar enamel thickness in extanthumans are consistent with cross-sectional studies. They indicatethat extant human M1s have significantly thinner enamel than M2sand M3s (Grine, 2005; Smith et al., 2005). It is unclear if early Homoalso shows this trend, as owing to a small sample size and occlusal
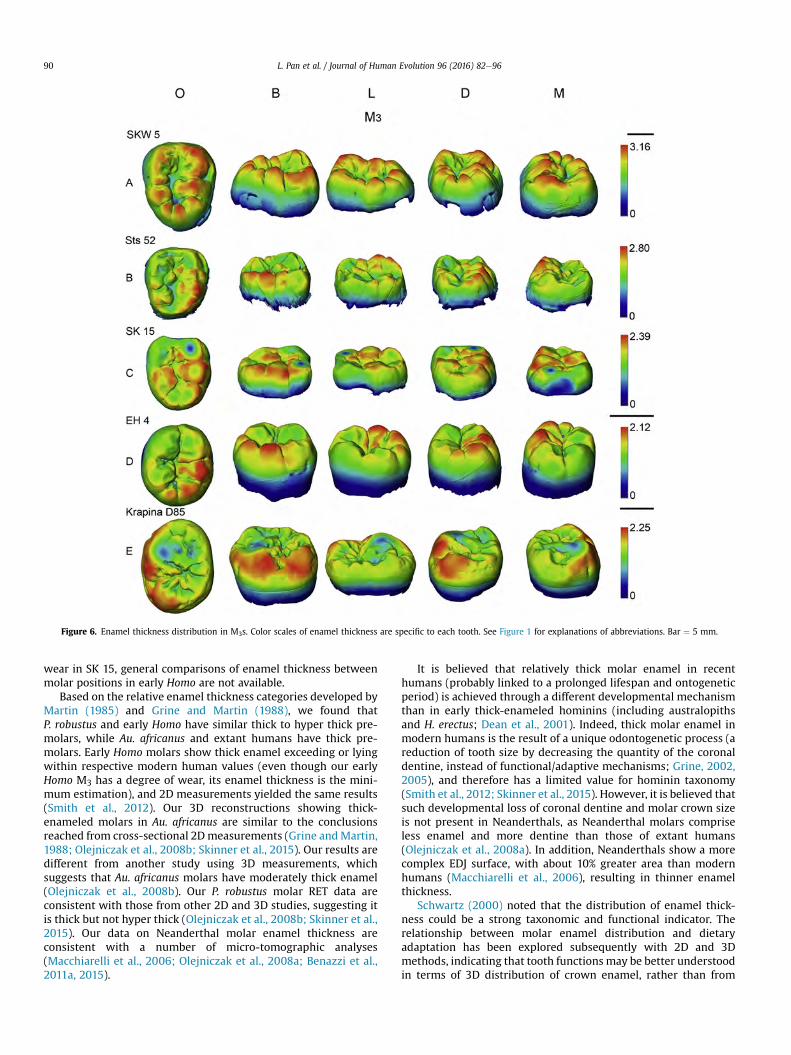
Figure 6. Enamel thickness distribution in M3s. Color scales of enamel thickness are specific to each tooth. See Figure 1 for explanations of abbreviations. Bar ¼ 5 mm.
L. Pan et al. / Journal of Human Evolution 96 (2016) 82e9690
wear in SK 15, general comparisons of enamel thickness betweenmolar positions in early Homo are not available.
Based on the relative enamel thickness categories developed byMartin (1985) and Grine and Martin (1988), we found thatP. robustus and early Homo have similar thick to hyper thick pre-molars, while Au. africanus and extant humans have thick pre-molars. Early Homo molars show thick enamel exceeding or lyingwithin respective modern human values (even though our earlyHomo M3 has a degree of wear, its enamel thickness is the mini-mum estimation), and 2D measurements yielded the same results(Smith et al., 2012). Our 3D reconstructions showing thick-enameled molars in Au. africanus are similar to the conclusionsreached from cross-sectional 2Dmeasurements (Grine andMartin,1988; Olejniczak et al., 2008b; Skinner et al., 2015). Our results aredifferent from another study using 3D measurements, whichsuggests that Au. africanus molars have moderately thick enamel(Olejniczak et al., 2008b). Our P. robustus molar RET data areconsistent with those from other 2D and 3D studies, suggesting itis thick but not hyper thick (Olejniczak et al., 2008b; Skinner et al.,2015). Our data on Neanderthal molar enamel thickness areconsistent with a number of micro-tomographic analyses(Macchiarelli et al., 2006; Olejniczak et al., 2008a; Benazzi et al.,2011a, 2015).
It is believed that relatively thick molar enamel in recenthumans (probably linked to a prolonged lifespan and ontogeneticperiod) is achieved through a different developmental mechanismthan in early thick-enameled hominins (including australopithsand H. erectus; Dean et al., 2001). Indeed, thick molar enamel inmodern humans is the result of a unique odontogenetic process (areduction of tooth size by decreasing the quantity of the coronaldentine, instead of functional/adaptive mechanisms; Grine, 2002,2005), and therefore has a limited value for hominin taxonomy(Smith et al., 2012; Skinner et al., 2015). However, it is believed thatsuch developmental loss of coronal dentine and molar crown sizeis not present in Neanderthals, as Neanderthal molars compriseless enamel and more dentine than those of extant humans(Olejniczak et al., 2008a). In addition, Neanderthals show a morecomplex EDJ surface, with about 10% greater area than modernhumans (Macchiarelli et al., 2006), resulting in thinner enamelthickness.
Schwartz (2000) noted that the distribution of enamel thick-ness could be a strong taxonomic and functional indicator. Therelationship between molar enamel distribution and dietaryadaptation has been explored subsequently with 2D and 3Dmethods, indicating that tooth functions may be better understoodin terms of 3D distribution of crown enamel, rather than from

Figure 7. A, B) Results of bgPCAs of the semi-landmark configurations of P3 and P4, respectively. BgPC1 and bgPC2 represent components of the shape variation, the 95% confidenceellipses are presented, and ridge curves shown at the end of each axis illustrate the conformation trends of shape along each PC. C) Eigenvalues of each landmark involved inbgPCAs. The range of the eigenvalues is from �1 to 1. The bar denotes absolute values of the eigenvalues. See Figure 1 for explanations of abbreviations. aeh) Landmark series of EDJafter Procrustes superimposition and bgPCA. (The reader is referred to the web version of this article for colored figures.)
L. Pan et al. / Journal of Human Evolution 96 (2016) 82e96 91
enamel thickness indices extracted from a single section plane(Macho and Thackeray, 1993; Kono et al., 2002; Kono, 2004; Konoand Suwa, 2008; Olejniczak et al., 2008b; Suwa et al., 2009;Skinner et al., 2015). The early Homo molars sampled in thisstudy share a similar distribution pattern with H. erectus andextant H. sapiens, where the thickest enamel is commonly found atlateral aspects of a cusp, around cusp bases, and at the buccalaspect of the hypoconulid, rather than the occlusal aspect of thecrown (Grine, 2005; Olejniczak et al., 2008b; Zanolli, 2015). Wealso observe thicker enamel along or at the end of marginal ridgesand crests in Homo specimens, together with proportionatelythicker enamel on the lateral surfaces of the “functional” cusps.This may prolong functional crown life by dispersing masticatoryforces and by preventing cusp fracture, rather than being anadaptation to hard/abrasive object feeding (Macho and Spears,1999; Grine, 2005). Moreover, studies on dental biomechanics inhuman molars suggest marginal ridges might be high stress-
bearing areas (Benazzi et al., 2013), indicating that our observeddifferences in enamel distribution along marginal ridges betweenHomo and australopiths could reflect differences in food process-ing. As has been suggested, occlusal topography, like the presenceof grooves, crests, and cusp sharpness, might have more importantbiomechanical implications than enamel thickness (Benazzi et al.,2013; Berthaume, 2014; Berthaume et al., 2014). Similar enamelthickness distribution patterns among our early and later mem-bers of the genus Homo suggest that this dietary or functionaladaptation has probably emerged along the origin of the Homolineage. On the other hand, thick cuspal enamel exhibited alongthe postcanine dentition of australopiths could be an adaptation toincrease the attritional longevity of wear facets in response toabrasive diet (Lucas et al., 2008). Studies on enamel thicknessin other mammals such as cave bears also support that thickenamel could be considered as an adaptation to hard and abrasiveplant-based food sources, while thin enamel could indicate an

Figure 8. AeC) Results of bgPCAs of the semi-landmark configurations of M1eM3, respectively. BgPC1 and bgPC2 represent components of the shape variation, the 95% confidenceellipses are presented, and ridge curves shown at the end of each axis illustrate the conformation trends of shape along each PC. D) Eigenvalues of each landmark involved inbgPCAs. The range of the eigenvalues is from �1 to 1. The bar denotes absolute values of the eigenvalues. See Figure 1 for explanations of abbreviations.
L. Pan et al. / Journal of Human Evolution 96 (2016) 82e9692
exclusive carnivorous diet (Mackiewicz et al., 2010). Our data onenamel thickness distribution are in line with previous studiesdemonstrating diversified dietary habits between P. robustus andearly Homo, and the more specialized masticatory apparatus ofP. robustus (Laden and Wrangham, 2005; Balter et al., 2012). Asstated by Villmoare et al. (2015), genus Homo may arise at ca.2.8 Ma (but see Hawks et al., 2015), and further investigations ofenamel thickness distribution in early Homo species in East Africamay yield a better understanding of the evolutionary trends andadaptive significance of enamel thickness distribution in earlyHomo. Our database on enamel thickness and its distributionpattern could offer some insights into the affinity of specifictaxonomically uncertain specimens.
4.2. Variation in EDJ morphology between groups
The differences we observe between P. robustus and Au. afri-canus molars in dentine horn height, relative dentine horn posi-tions, and EDJ outline have already been reported (Robinson, 1956;Suwa et al., 1996; Olejniczak et al., 2008a; Skinner et al., 2008b).However, we record a transitional feature on the EDJ level, alongthe postcanine dentition of our early Homo sample. In particular,premolars of early Homo show EDJ shapes that closely approxi-mate the extant human condition, with equal-sized foveae ante-rior and posterior, and higher protoconid dentine horns, while themolars show a relatively low EDJ topography associated with amesiodistally elongated occlusal basin, to some extent reminiscent
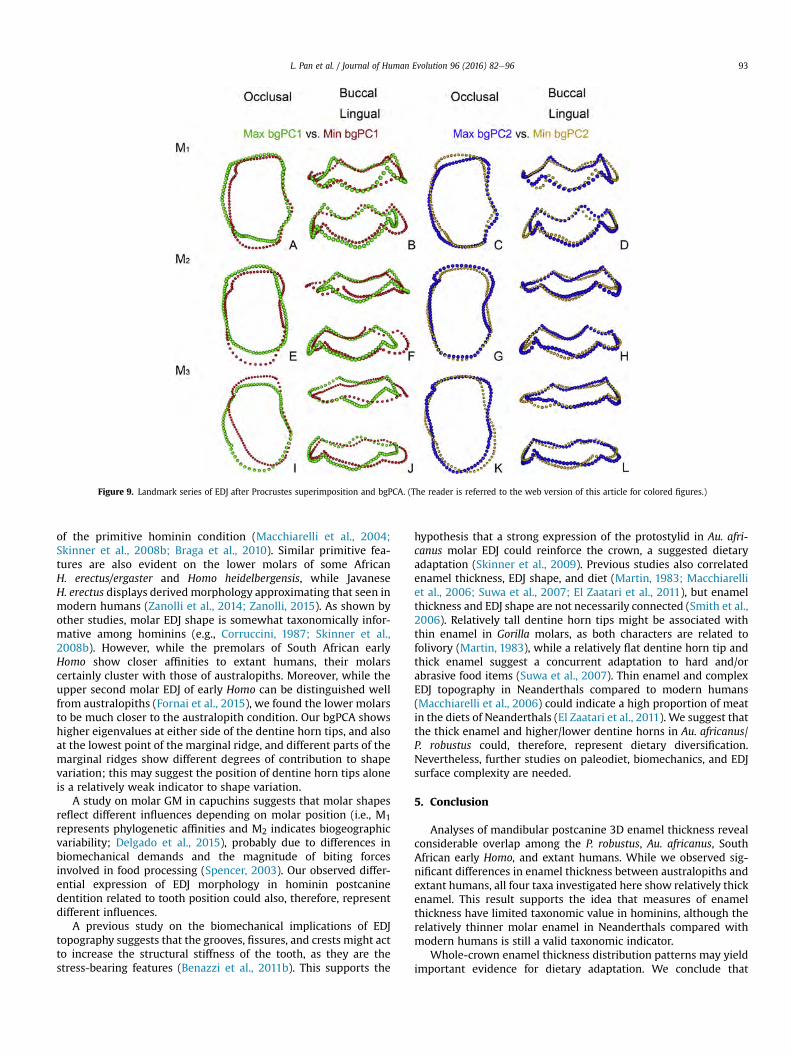
Figure 9. Landmark series of EDJ after Procrustes superimposition and bgPCA. (The reader is referred to the web version of this article for colored figures.)
L. Pan et al. / Journal of Human Evolution 96 (2016) 82e96 93
of the primitive hominin condition (Macchiarelli et al., 2004;Skinner et al., 2008b; Braga et al., 2010). Similar primitive fea-tures are also evident on the lower molars of some AfricanH. erectus/ergaster and Homo heidelbergensis, while JavaneseH. erectus displays derived morphology approximating that seen inmodern humans (Zanolli et al., 2014; Zanolli, 2015). As shown byother studies, molar EDJ shape is somewhat taxonomically infor-mative among hominins (e.g., Corruccini, 1987; Skinner et al.,2008b). However, while the premolars of South African earlyHomo show closer affinities to extant humans, their molarscertainly cluster with those of australopiths. Moreover, while theupper second molar EDJ of early Homo can be distinguished wellfrom australopiths (Fornai et al., 2015), we found the lower molarsto be much closer to the australopith condition. Our bgPCA showshigher eigenvalues at either side of the dentine horn tips, and alsoat the lowest point of the marginal ridge, and different parts of themarginal ridges show different degrees of contribution to shapevariation; this may suggest the position of dentine horn tips aloneis a relatively weak indicator to shape variation.
A study on molar GM in capuchins suggests that molar shapesreflect different influences depending on molar position (i.e., M1
represents phylogenetic affinities and M2 indicates biogeographicvariability; Delgado et al., 2015), probably due to differences inbiomechanical demands and the magnitude of biting forcesinvolved in food processing (Spencer, 2003). Our observed differ-ential expression of EDJ morphology in hominin postcaninedentition related to tooth position could also, therefore, representdifferent influences.
A previous study on the biomechanical implications of EDJtopography suggests that the grooves, fissures, and crests might actto increase the structural stiffness of the tooth, as they are thestress-bearing features (Benazzi et al., 2011b). This supports the
hypothesis that a strong expression of the protostylid in Au. afri-canus molar EDJ could reinforce the crown, a suggested dietaryadaptation (Skinner et al., 2009). Previous studies also correlatedenamel thickness, EDJ shape, and diet (Martin, 1983; Macchiarelliet al., 2006; Suwa et al., 2007; El Zaatari et al., 2011), but enamelthickness and EDJ shape are not necessarily connected (Smith et al.,2006). Relatively tall dentine horn tips might be associated withthin enamel in Gorilla molars, as both characters are related tofolivory (Martin, 1983), while a relatively flat dentine horn tip andthick enamel suggest a concurrent adaptation to hard and/orabrasive food items (Suwa et al., 2007). Thin enamel and complexEDJ topography in Neanderthals compared to modern humans(Macchiarelli et al., 2006) could indicate a high proportion of meatin the diets of Neanderthals (El Zaatari et al., 2011). We suggest thatthe thick enamel and higher/lower dentine horns in Au. africanus/P. robustus could, therefore, represent dietary diversification.Nevertheless, further studies on paleodiet, biomechanics, and EDJsurface complexity are needed.
5. Conclusion
Analyses of mandibular postcanine 3D enamel thickness revealconsiderable overlap among the P. robustus, Au. africanus, SouthAfrican early Homo, and extant humans. While we observed sig-nificant differences in enamel thickness between australopiths andextant humans, all four taxa investigated here show relatively thickenamel. This result supports the idea that measures of enamelthickness have limited taxonomic value in hominins, although therelatively thinner molar enamel in Neanderthals compared withmodern humans is still a valid taxonomic indicator.
Whole-crown enamel thickness distribution patterns may yieldimportant evidence for dietary adaptation. We conclude that

L. Pan et al. / Journal of Human Evolution 96 (2016) 82e9694
thicker enamel is observed at the lateral aspects of cusps and crownin modern humans and some fossil Homo (Grine, 2005; Olejniczaket al., 2008b; Zanolli et al., 2014), and was present in some of theearliest members of the genus Homo, suggesting occupation of adifferent dietary niche as compared to South African australopiths.However, as our data on whole-crown enamel distribution arerestricted to qualitative description, without statistical evaluation,interpretations based on whole-crown enamel distribution shouldbe made with caution.
High resolution micro-CT imaging coupled with 3D geometricmorphometric analyses of the EDJ can be useful for taxonomiccomparisons. While mosaic features are evident throughout thehistory of human evolution, especially in transitional species (e.g.,Kivell et al., 2011; Villmoare et al., 2015), it is not surprising thatwe observed a mix of australopith (flattened and elongated EDJmorphology) and Homo-like (premolar EDJ morphology) charac-ters in our South African early Homo sample. However, given thelack of early Homo specimens, the evolutionary/adaptive signifi-cance of different EDJ morphologies in the postcanine dentition ofearly Homo, australopiths, and extant humans is still unclear. Therecent discovery of Homo naledi enriches the Homo fossil record(Berger et al., 2015). While we observed a complex occlusal surfacein our unworn early Homo specimens, H. naledi lower postcaninedentition shows a complex occlusal surface in premolars, but arather simple topography in molars. A comparative study of dentalinner structure of H. nalediwill further improve our understandingof the evolution of genus Homo in South Africa. Our results indi-cate that premolar EDJ morphology has more discriminatory po-wer when distinguishing genus Homo (including Neanderthal)from australopiths. While most studies of EDJ morphology arefocused on molars, few investigations have established variation inpremolar EDJ morphology, and its contribution to understandingtaxonomy needs to be examined with other Plio-Pleistocenehominin species.
The fossil record of South African early Homo dentition is ratherlimited, but in the meantime, it appears that some taxonomicallydistinctive features evident in the premolars of extant humanswere already present in the early members of the genus Homo, andmolar EDJ shapes are highly variable within the genus Homo.Comparative studies on the East African H. habilis and H. erectuswould shed light on the evolutionary dynamics of EDJ morphologyin early members of the genus Homo.
Acknowledgments
This work was supported by the Centre National de la RechercheScientifique, the French Ministry of Foreign Affairs, the FrenchEmbassy in South Africa through the Cultural and CooperationServices, and the China Scholarship Council. We thank StephanyPotze, curator of the Palaeontology Section of the Ditsong NationalMuseum of Natural History (Pretoria), for her continuous support.We appreciate Professor Roberto Macchiarelli for his valuable in-sights on the Neanderthal taxonomy and chronology. We thank Dr.A. Beaudet for her technical support during the image processing ofdata and the statistical analysis. We are also indebted to Dr. C.Zanolli for providing CT data of extant human and Neanderthalspecimens. We thank N. Ngoloyi for proofreading. We thank threeanonymous reviewers and the Associated Editor for their valuablecomments which helped us to improve the manuscript.
Supplementary Online Material
Supplementary online material related to this article can befound at http://dx.doi.org/10.1016/j.jhevol.2016.05.003.
References
Bailey, S.E., Benazzi, S., Souday, C., Astorino, C., Paul, K., Hublin, J.-J., 2014. Taxonomicdifferences in deciduous upper second molar crown outlines of Homo sapiens,Homo neanderthalensis and Homo erectus. J. Hum. Evol. 72, 1e9.
Balter, V., Blichert-Toftv, J., Braga, J., Telouk, P., Thackeray, F., Albar�ede, F., 2008. U-Pbdating of fossil enamel from the Swartkrans Pleistocene hominid site, SouthAfrica. Earth Planet. Sci. Lett. 267, 236e246.
Balter, V., Braga, J., T�elouk, P., Thackeray, J.F., 2012. Evidence for dietary change butnot landscape use in South African early hominins. Nature 489, 558e560.
Benazzi, S., Fornai, C., Bayle, P., Coquerelle, M., Kullmer, O., Mallegni, F., Weber, G.W.,2011a. Comparison of dental measurement systems for taxonomic assignmentof Neanderthal and modern human lower second deciduous molars. J. Hum.Evol. 61, 320e326.
Benazzi, S., Kullmer, O., Grosse, I.R., Weber, G.W., 2011b. Using occlusal wear in-formation and finite element analysis to investigate stress distributions inhuman molars. J. Anat. 219, 259e272.
Benazzi, S., Nguyen, H.N., Kullmer, O., Hublin, J.-J., 2013. Unravelling the functionalbiomechanics of dental features and tooth wear. PLoS One 8, e69990.
Benazzi, S., Panetta, D., Fornai, C., Toussaint, M., Gruppioni, G., Hublin, J.-J., 2014.Technical Note: Guidelines for the digital computation of 2D and 3D enamelthickness in hominoid teeth. Am. J. Phys. Anthropol. 153, 305e313.
Benazzi, S., Slon, V., Talamo, S., Negrino, F., Peresani, M., Bailey, S.E., Sawyer, S.,Panetta, D., Vicino, G., Starnini, E., 2015. The makers of the Protoaurignacian andimplications for Neandertal extinction. Science 348, 793e796.
Berger, L., Hawks, J., de Ruiter, D.J., Churchill, S., Schmid, P., Delezene, L., Kivell, T.,Garvin, H., Williams, S., DeSilva, J., Skinner, M., Musiba, C., Cameron, N.,Holliday, T., Harcourt-Smith, W., Ackermann, R., Bastir, M., Bogin, B., Bolter, D.,Brophy, J., Cofran, Z., Congdon, K., Deane, A., Dembo, M., Drapeau, M., Elliott, M.,Feuerriegel, E., Garcia-Martinez, D., Green, D., Gurtov, A., Irish, J., Kruger, A.,Laird, M., Marchi, D., Meyer, M., Nalla, S., Negash, E., Orr, C., Radov�ci�c, J.,Schroeder, L., Scott, J., Throckmorton, Z., Tocheri, M., VanSickle, C., Walker, C.,Wei, P., Zipfel, B., 2015. Homo naledi, a new species of the genus Homo from theDinaledi Chamber, South Africa. eLife 4, e09560.
Berger, L.R., Lacruz, R., de Ruiter, D.J., 2002. Revised age estimates of Austral-opithecus-bearing deposits at Sterkfontein, South Africa. Am. J. Phys. Anthropol.119, 192e197.
Berthaume, M.A., 2014. Tooth cusp sharpness as a dietary correlate in great apes.Am. J. Phys. Anthropol. 153, 226e235.
Berthaume, M.A., Dumont, E.R., Godfrey, L.R., Grosse, I.R., 2014. The effects ofrelative food item size on optimal tooth cusp sharpness during brittle food itemprocessing. J.R. Soc. Interface 11, 20140965.
Beynon, A., Wood, B., 1986. Variations in enamel thickness and structure in eastAfrican hominids. Am. J. Phys. Anthropol. 70, 177e193.
Beynon, A., Wood, B., 1987. Patterns and rates of enamel growth in the molar teethof early hominids. Nature 326, 493e496.
Billy, G., Vallois, H., 1977a. La mandibule pr�e-Rissienne de Montmaurin. L'Anthro-pologie 81, 273e312.
Billy, G., Vallois, H., 1977b. La mandibule pr�e-Rissienne de Montmaurin (suite).L'Anthropologie 81, 411e458.
Braga, J., Thackeray, J.F., Subsol, G., Kahn, J.L., Maret, D., Treil, J., Beck, A., 2010. Theenamel-dentine junction in the postcanine dentition of Australopithecus afri-canus: intra-individual metameric and antimeric variation. J. Anat. 216, 62e79.
Braga, J., Thackeray, J.F., Dumoncel, J., Descouens, D., Bruxelles, L., Loubes, J.-M.,Kahn, J.-L., Stampanon, M., Bam, L., Hoffman, J., de Beer, F., Spoor, F., 2013. A newpartial temporal bone of a juvenile hominin from the site of Kromdraai B (SouthAfrica). J. Hum. Evol. 65, 447e456.
Brain, C., 1975. An interpretation of the bone assemblage from the Kromdraaiaustralopithecine site, South Africa. In: Tuttle, R.H. (Ed.), Paleoanthropology,Morphology and Paleoecology. Walter de Gruyter, Berlin, pp. 225e243.
Brain, C., 1981. The Hunters or the Hunted? University of Chicago Press, Chicago.Broom, R.,1938. The Pleistocene anthropoid apes of South Africa. Nature 142, 377e379.Broom, R., 1949. Another new type of fossil ape-man. Nature 163, 57.Broom, R., Robinson, J.T., 1949. A new type of fossil man. Nature 164, 322e323.Broom, R., Robinson, J.T., 1952. Swartkrans ape-man, Paranthropus crassidens. Trans.
Mus. Mem. No. 6, 1e124.Butler, P., 1956. The ontogeny of molar pattern. Biol. Rev. 31, 30e69.Clarke, R., 1994. On some new interpretations of Sterkfontein stratigraphy. S. Afr. J.
Sci. 90, 211e214.Corruccini, R., 1987. The dentinoenamel junction in primates. Int. J. Primatol. 8,
99e114.Dean, C., Leakey, M.G., Reid, D., Schrenk, F., Schwartz, G.T., Stringer, C., Walker, A.,
2001. Growth processes in teeth distinguish modern humans from Homoerectus and earlier hominins. Nature 414, 628e631.
Deb�enath, A., 1977. The latest finds of ant�ewürmian human remains in Charente(France). J. Hum. Evol. 6, 297e302.
Delgado, M.N., Galbany, J., G�orka, K., P�erez-P�erez, A., 2015. Taxonomic implicationsof molar morphology variability in Capuchins. Int. J. Primatol. 36, 707e727.
El Zaatari, S., Grine, F., Ungar, P.S., Hublin, J.-J., 2011. Ecogeographic variation inNeandertal dietary habits: evidence from occlusal molar microwear textureanalysis. J. Hum. Evol. 61, 411e424.
Fornai, C., Benazzi, S., Svoboda, J., Pap, I., Harvati, K., Weber, G.W., 2014. Enamelthickness variation of deciduous first and second upper molars in modernhumans and Neanderthals. J. Hum. Evol. 83e91.
L. Pan et al. / Journal of Human Evolution 96 (2016) 82e96 95
Fornai, C., Bookstein, F.L., Weber, G.W., 2015. Variability of Australopithecus secondmaxillary molars from Sterkfontein Member 4. J. Hum. Evol. 85, 181e192.
Gibbon, R.J., Pickering, T.R., Sutton, M.B., Heaton, J.L., Kuman, K., Clarke, R.J., Brain, C.,Granger, D.E., 2014. Cosmogenic nuclide burial dating of hominin-bearingPleistocene cave deposits at Swartkrans, South Africa. Quat. Geochronol. 24,10e15.
Girard, M., 1973. La br�eche �a “Machairodus” de Montmaurin (Pyr�en�ees centrales).Bulletin de l'AFEQ 3, 193e207.
Grine, F.E., 1989. New hominid fossils from the Swartkrans formation (1979e1986excavations): craniodental specimens. Am. J. Phys. Anthropol. 79, 409e449.
Grine, F.E., Daeglin, D.J., 1993. New mandible of Paranthropus robustus fromMember1, Swartkrans Formation, South Africa. J. Hum. Evol. 24, 319e333.
Grine, F.E., 2002. Scaling of tooth enamel thickness, and molar crown size reductionin modern humans: research letter. S. Afr. J. Sci. 98, 503e509.
Grine, F.E., 2005. Enamel thickness of deciduous and permanent molars in modernHomo sapiens. Am. J. Phys. Anthropol. 126, 14e31.
Grine, F.E., Martin, L., 1988. Enamel thickness and development in Australopithecusand Paranthropus. In: Grine, F.E. (Ed.), Evolutionary history of the “robust”australopithecines. Aldine de Gruyter, New York, pp. 3e42.
Gunz, P., Ramsier, M., Kuhrig, M., Hublin, J.-J., Spoor, F., 2012. The mammalian bonylabyrinth reconsidered, introducing a comprehensive geometric morphometricapproach. J. Anat. 220, 529e543.
Hawks, J., de Ruiter, D.J., Berger, L.R., 2015. Comment on “Early Homo at 2.8 Ma fromLedi-Geraru, Afar, Ethiopia”. Science 348, 1326.
Hlusko, L., 2002. Identifying metameric variation in extant hominoid and fossilhominid mandibular molars. Am. J. Phys. Anthropol. 118, 86e97.
Hoffman, J.W., de Beer, F., 2012. Characteristics of the micro-focus X-ray tomogra-phy facility (MIXRAD) at Necsa in South Africa, 18th World Conference onNondestructive Testing, Durban, South Africa.
Kay, R., 1981. The nut-crackersda new theory of the adaptations of the Ram-apithecinae. Am. J. Phys. Anthropol. 55, 141e151.
Kay, R., 1985. Dental evidence for the diet of Australopithecus. A. Rev. Anthropol. 14,315e341.
Kivell, T.L., Kibii, J.M., Churchill, S.E., Schmid, P., Berger, L.R., 2011. Australopithecussediba hand demonstrates mosaic evolution of locomotor and manipulativeabilities. Science 333, 1411e1417.
Kono, R., 2004. Molar enamel thickness and distribution patterns in extant greatapes and humans, new insights based on a 3-dimensional whole crownperspective. Anthropol. Sci. 112, 121e146.
Kono, R., Suwa, G., 2008. Enamel distribution patterns of extant human and hom-inoid molars: occlusal versus lateral enamel thickness. Bull. Natl. Mus. Nat. Sci.34, 1e9.
Kono, R., Suwa, G., Tanijiri, T., 2002. A three-dimensional analysis of enamel dis-tribution patterns in human permanent first molars. Arch. Oral. Biol. 47,867e875.
Laden, G., Wrangham, R., 2005. The rise of the hominids as an adaptive shift infallback foods: plant underground storage organs (USOs) and australopith or-igins. J. Hum. Evol. 49, 482e498.
Lucas, P., Constantino, P., Wood, B., Lawn, B., 2008. Dental enamel as a dietary in-dicator in mammals. Bioessays 30, 374e385.
Macchiarelli, R., Bondioli, L., Falk, D., Faupl, P., Illerhaus, B., Kullmer, O., Richter, W.,Said, H., Sandrock, O., Sch€afer, K., 2004. Early Pliocene hominid tooth fromGalili, Somali region, Ethiopia. Coll. Antropol. 28, 65e76.
Macchiarelli, R., Bondioli, L., Deb�enath, A., Mazurier, A., Tournepiche, J.-F.,Birch, W., Dean, C., 2006. How Neanderthal molar teeth grew. Nature 444,748e751.
Macho, G., Thackeray, J., 1993. Computed tomography and intercuspal angulation ofmaxillary molars of Plio-Pleistocene hominids from Sterkfontein, Swartkransand Kromdraai (South Africa): An exploratory study. Z. Morphol. Anthropol.261e269.
Macho, G.A., Spears, I.R., 1999. Effects of loading on the biochemical behavior ofmolars of Homo, Pan, and Pongo. Am. J. Phys. Anthropol. 109, 211e227.
Mackiewicz, P., Wiszniowska, T., Olejniczak, A., Stefaniak, K., Socha, P.,Nadachowski, A., 2010. Analysis of dental enamel thickness in bears withspecial attention to Ursus spelaeus and U. wenzensis (¼minimus) in comparisonto selected representatives of mammals. In: Nowakowski, D. (Ed.), Morphologyand systematics of fossil vertebrates. DN Publisher, Wroclaw, pp. 60e77.
Martin, L., 1983. The relationships of the later Miocene hominoidea. Department ofAnthropology, Ph.D. Dissertation, University College London.
Martin, L., 1985. Significance of enamel thickness in hominoid evolution. Nature314, 260e263.
Mitteroecker, P., Bookstein, F., 2011. Linear discrimination, ordination, and thevisualization of selection gradients in modern morphometrics. Evol. Biol. 38,100e114.
Molnar, S., 1971. Human tooth wear, tooth function and cultural variability. Am. J.Phys. Anthropol. 34, 175e189.
NESPOS database, 2015. Neanderthal Studies Professional Online Service. http://www.nespos.org.
Olejniczak, A., Martin, L., Ulhaas, L., 2004. Quantification of dentine shape in an-thropoid primates. Annls. Anat. 186, 479e485.
Olejniczak, A., Gilbert, C., Martin, L., Smith, T., Ulhaas, L., Grine, F., 2007. Morphologyof the enamel-dentine junction in sections of anthropoid primate maxillarymolars. J. Hum. Evol. 53, 292e301.
Olejniczak, A., Smith, T.M., Feeney, R.N.M., Macchiarelli, R., Mazurier, A., Bondioli, L.,Rosas, A., Fortea, J., de la Rasilla, M., Garcia-Tabernero, A., Radov�ci�c, J.,
Skinner, M.M., Toussaint, M., Hublin, J.-J., 2008a. Dental tissue proportions andenamel thickness in Neandertal and modern human molars. J. Hum. Evol. 55,12e23.
Olejniczak, A., Smith, T.M., Skinner, M.M., Grine, F.E., Feeney, R.N.M., Thackeray, J.F.,Hublin, J.-J., 2008b. Three-dimensional molar enamel distribution and thicknessin Australopithecus and Paranthropus. Biol. Lett. 4, 406e410.
Olejniczak, A., Tafforeau, P., Feeney, R.N.M., Martin, L.B., 2008c. Three-dimensionalprimate molar enamel thickness. J. Hum. Evol. 54, 187e195.
Pickering, R., Kramers, J.D., Hancox, P.J., de Ruiter, D.J., Woodhead, J.D., 2011.Contemporary flowstone development links early hominin bearing cave de-posits in South Africa. Earth Planet. Sci. Lett. 306, 23e32.
R Development Core Team, 2012. R: A language and environment for statisticalcomputing. R Foundation for Statistical Computing, Vienna.
Radov�ci�c, J., Smith, F.H., Trinkaus, E., Wolpoff, M.H., 1988. The Krapina Hominids: AnIllustrated Catalog of Skeletal Collection. Mladost and the Croatian NaturalHistory Museum, Zagreb.
Rampont, M., 1994. Les squelettes, os et dents de foetus, nouveaux-n�es et enfantsdu Mus�ee Anatomique de Strasbourg. Aspects historiques et catalogue. Ph.D.Dissertation, Louis Pasteur University.
Rink, W.J., Schwarcz, H.P., Smith, F.H., Radov�ci�c, J., 1995. ESR dates for Krapinahominids. Nature 378, 24.
Robinson, J.T., 1956. The dentition of the Australopithecinae. Trans. Mus. Mem. 9,1e179.
Rozzi, F.R., 1998. Can enamel microstructure be used to establish the presence ofdifferent species of Plio-Pleistocene hominids from Omo, Ethiopia? J. Hum.Evol. 35, 543e576.
Schwarcz, H.P., Grün, R., Tobias, P.V., 1994. ESR dating studies of the australopith-ecine site of Sterkfontein, South Africa. J. Hum. Evol. 26, 175e181.
Schwartz, G., 2000. Taxonomic and functional aspects of the patterning of enamelthickness distribution in extant large-bodied hominoids. Am. J. Phys. Anthropol.111, 221e244.
Schwartz, G.T., 1997. Taxonomic and functional aspects of enamel cap structure inSouth African plio-pleistocene hominids: a high resolution computed tomo-graphic study. Ph.D. Dissertation, Washington University.
Skinner, M.M., 2008. Enamel-dentine junction morphology of extant hominoid andfossil hominin lower molars. Ph.D. Dissertation, George Washington University.
Skinner, M.M., Wood, B.A., Boesch, C., Olejniczak, A.J., Rosas, A., Smith, T.M.,Hublin, J.-J., 2008a. Dental trait expression at the enamel-dentine junction oflower molars in extant and fossil hominoids. J. Hum. Evol. 54, 173e186.
Skinner, M.M., Gunz, P., Wood, B.A., Hublin, J.-J., 2008b. Enamel-dentine junction(EDJ) morphology distinguishes the lower molars of Australopithecus africanusand Paranthropus robustus. J. Hum. Evol. 55, 979e988.
Skinner, M.M., Wood, B., Hublin, J.-J., 2009. Protostylid expression at the enamel-dentine junction and enamel surface of mandibular molars of Paranthropusrobustus and Australopithecus africanus. J. Hum. Evol. 56, 76e85.
Skinner, M.M., Evans, A., Smith, T., Jernvall, J., Tafforeau, P., Kupczik, K.,Olejniczak, A.J., Rosas, A., Radov�ci�c, J., Thackeray, J.F., Toussaint, M., Hublin, J.-J.,2010. Brief communication: Contributions of enamel-dentine junction shapeand enamel deposition to primate molar crown complexity. Am. J. Phys.Anthropol. 142, 157e163.
Skinner, M.M., Alemseged, Z., Gaunitz, C., Hublin, J.-J., 2015. Enamel thicknesstrends in Plio-Pleistocene hominin mandibular molars. J. Hum. Evol. 85, 35e45.
Smith, T.M., Martin, L.B., Leakey, M.G., 2003. Enamel thickness, microstructure anddevelopment in Afropithecus turkanensis. J. Hum. Evol. 44, 283e306.
Smith, T.M., Olejniczak, A.J., Martin, L., Reid, D.J., 2005. Variation in hominoid molarenamel thickness. J. Hum. Evol. 48, 575e592.
Smith, T.M., Olejniczak, A.J., Reid, D.J., Ferrell, R., Hublin, J.-J., 2006. Modern humanmolar enamel thickness and enameledentine junction shape. Arch. Oral. Biol.51, 974e995.
Smith, T.M., Olejniczak, A.J., Reh, S., Reid, D.J., Hublin, J.-J., 2008. Brief communi-cation: enamel thickness trends in the dental arcade of humans and chim-panzees. Am. J. Phys. Anthropol. 136, 237e241.
Smith, T.M., Olejniczak, A.J., Zermeno, J.P., Tafforeau, P., Skinner, M.M.,Hoffmann, A., Radov�ci�c, J., Toussaint, M., Kruszynski, R., Menter, C., Moggi-Cecchi, J., Glasmacher, U.A., Kullmer, O., Schrenk, F., Stringer, C., Hublin, J.-J.,2012. Variation in enamel thickness within the genus Homo. J. Hum. Evol. 62,395e411.
Spencer, M.A., 2003. Tooth-root form and function in platyrrhine seed-eaters. Am. J.Phys. Anthropol. 122, 325e335.
Stricker, D., 2008. BrightStat.com: free statistics online. Comput. Meth. Prog. Bio. 92,135e143.
Suwa, G., White, T.D., Howell, F., 1996. Mandibular postcanine dentition from theShungura Formation, Ethiopia: crown morphology, taxonomic allocations, andPlio-Pleistocene hominid evolution. Am. J. Phys. Anthropol. 101, 247e282.
Suwa, G., Kono, R., Katoh, S., Asfaw, B., Beyene, Y., 2007. A new species of great apefrom the late Miocene epoch in Ethiopia. Nature 448, 921e924.
Suwa, G., Kono, R., Simpson, S.W., Asfaw, B., Lovejoy, C.O., White, T.D., 2009.Paleobiological implications of the Ardipithecus ramidus dentition. Nature 326,70e99.
Thackeray, J., de Ruiter, D.J., Berger, L.R., van der Merwe, N., 2001. Hominid fossilsfrom Kromdraai: a revised list of specimens discovered since 1938. Annls.Transv. Mus. 38, 43e56.
Thackeray, J., Kirschvink, J.L., Raub, T.D., 2002. Palaeomagnetic analyses of calcifieddeposits from the Plio-Pleistocene hominid site of Kromdraai, South Africa. S.Afr. J. Sci. 98, 537e540.

L. Pan et al. / Journal of Human Evolution 96 (2016) 82e9696
Thackeray, J., Braga, J., S�en�egas, F., Gommery, D., Potze, S., Senut, B., 2005. Dis-covery of a humerus shaft from Kromdraai B: part of the skeleton of thetype specimen of Paranthropus robustus Broom, 1938? Annls. Transv. Mus.42, 92e93.
Tobias, P.V., 1978. The earliest Transvaal members of the genus Homo with anotherlook at some problems of hominid taxonomy and systematics. Z. Morphol.Anthropol. 69, 225e265.
Ungar, P.S., Grine, F.E., Teaford, M.F., Zaatari, S.E., 2006. Dental microwear and dietsof African early Homo. J. Hum. Evol. 50, 78e95.
Villmoare, B., Kimbel, W.H., Seyoum, C., Campisano, C.J., DiMaggio, E., Rowan, J.,Braun, D.R., Arrowsmith, J.R., Reed, K.E., 2015. Early Homo at 2.8 Ma from Ledi-Geraru, Afar, Ethiopia. Science 347, 1352e1355.
Vrba, E.S., 1985. Early hominids in southern Africa: updated observations onchronological and ecological background. In: Tobias, P.V. (Ed.), Hominid evo-lution: past, present and future. Alan R. Liss, New York, pp. 195e200.
White, T.D., Harris, J.M., 1977. Suid evolution and correlation of African hominidlocalities. Science 198, 13e21.
White, T.D., Suwa, G., Asfaw, B., 1994. Australopithecus ramidus, a new species ofearly hominid from Aramis, Ethiopia. Nature 371, 306e312.
Wood, B., 2010. Reconstructing human evolution: achievements, challenges, andopportunities. Proc. Natl. Acad. Sci. 107, 8902e8909.
Zanolli, C., 2015. Brief communication: molar crown inner structural organization inJavanese Homo erectus. Am. J. Phys. Anthropol. 156, 148e157.
Zanolli, C., Bayle, P., Macchiarelli, R., 2010. Tissue proportions and enamel thicknessdistribution in the early Middle Pleistocene human deciduous molars fromTighenif, Algeria. C.R. Palevol. 9, 341e348.
Zanolli, C., Bondioli, L., Coppa, A., Dean, C.M., Bayle, P., Candilio, F., Capuani, S.,Dreossi, D., Fiore, I., Frayer, D.W., 2014. The late Early Pleistocene human dentalremains from Uadi Aalad and Mulhuli-Amo (Buia), Eritrean Danakil: macro-morphology and microstructure. J. Hum. Evol. 74, 96e113.
58
4.3.2 Intra- and inter-individual metameric variation of EDJ shape
The study of intra-individual metameric variation in shape was completed by Procrustes
superimposition of the semi-landmark configurations. The 3D-EDJ metameric variation is shown in
Figure 4.10 and Figure 4.11, comparisons of P3–P4, M1–M2 and M2–M3 are illustrated by dendrograms
and bgPCA plots. Because early Homo and Au. africanus have only one specimen representing their
groups, respectively, to avoid possible error, they are projected subsequently onto the shape space,
without assigning to groups a priori. Specimens are marked according to species and dental position. In
bgPCA plots, specimens from the same individual are marked using the same symbol, with different
colors. Spatial associations in bgPCA plots should be interpreted with caution, as only two dimensions
of a multidimensional shape space are represented.
Dendrograms generated from hierarchical clustering reveal intra-individual metameric shape
distances and bgPCA plots indicate metameric patterns (Figs. 4.10 and 4.11). Metameric shape distances
and patterns can be strongly differ according to species and tooth position, but some trends in shape-
change are shared between different taxa. In comparative pair P3–P4, groups are separated with reference
to species, two groups are represented by P. robustus and modern humans (Fig. 4.11A), in general. But
the magnitude of intra-individual distance in these two species do not substantially differ (Fig. 4.10A).
The P3s of early Homo and Au. africanus are clustered with modern human P3s, while their P4s are
clustered with P. robustus P4s. Conformation of ridge curves after GPA are shown around bgPCA plots
and Figs. 4.10a–l. We observe that the bgPC1 is driven by size ratio between foveae anterior and
posterior, and heights of protoconid and metaconid dentine horns. Equal-sized foveae anterior and
posterior, as well as higher protoconid dentine horn are seen at the negative end of bgPC1; smaller fovea
anterior and higher metaconid dentine horn are seen at the positive end of bgPC1 (Fig. 4.10A, a, b).
59
BgPC2 is driven by the buccolingual width, resulting in changes of EDJ outline (slender or oval) and
metaconid dentine horn height (Fig. 4.10A, c, d). Common metameric pattern is found among taxa: P3s
show equal-spaced foveae and P4s show a more or less larger fovea posterior.
Different degrees of metameric variation are observed in M1–M2, between modern human and P.
robustus, but materials from early Homo and Au. africanus are not avaliable for comparison. In modern
humans, M1s and M2s are clustered separatly, suggesting a marked metameric variation, while P. robustus
M1s and M2s are grouped together (except for SK 6 M2) (Fig. 4.11B). Shape conformation suggests that
the decline of hypoconulid from M1s to M2s is a common metameric pattern in modern humans and P.
robustus (Fig. 4.10B). BgPC1 is driven by the presence and degree of hypoconulid dentine horn, and the
height of hypoconid dentine horn (Fig. 4.10B, e, f). A pronounced hypoconulid dentine horn and higher
hypoconid dentine horn place P. robustus sample at the positive end of bgPC1. Modern human M1s, on
the other hand, are seen at the upper end of bgPC2, characterized by elevated EDJ topology, pentagon-
shaped outline and pronounced hypoconulid dentine horn, in contrast with P. robustus M2s. Dendrograms
suggest that in most of the cases (except for Embr179), the intra-individual metameric distances in
modern human is 25 (Fig. 4.11B), while in P. robustus this distance is usually less than 5 (except for SK
6).

60
Figure 4.10 Metameric EDJ shape variation in fossil and extant taxa. A–C: Results of bgPCA of the semi-landmark configurations. BgPC1 and bgPC2 represent functions of the shape variation, the 95% confident ellipses are presented, and ridge curves shown at the end of each axis illustrate the conformation trends of shape along each PC. Semi-transparent oval and oval-rectangular shapes overlapping EDJ outlines in A and C show the similarity between them. a–l: Landmark series of EDJ after Procrustes superimposition and bgPCA. Arrows locate corresponding features described in the text. In one species, different tooth positions from the same individual are marked using the same symbol.
61
In comparative pair M2–M3, dendrograms suggest significant distinctions between fossil and
modern species, but groups are not very well-separated using bgPCA. The dentition of fossil species
form one single cluster, but M2s and M3s of modern humans group separately, suggesting a stronger
metameric variation (Fig. 4.11C). The smallest intra-individual distance in modern humans is around 2.5
(SP5678), but in most of the cases, distance between M2 and M3 of the same human individual is 25.
BgPCA reveals common metameric patterns shared among taxa, the M3s of a species are in general
grouped at the lower part of bgPC2, compared with the M2s (Fig. 4.10C). M3s show oval outline and
distally extended marginal ridge (probably bears accessory cusps), M2s have oval-rectangular outline,
but it should be noted that the degree of intra-individual metameric differences in fossil hominins is very
low. Fossil hominins are clustered at the lower half of bgPC1 axis, showing flattened EDJ topology, an
oval-rectangular outline and the evidence of hypoconulid (Fig. 4.10C, i, j). The intra-individual
metameric variation are unstable in modern humans, in contrast, intra-individual patterns are constant in
P. robustus. It is not surprising given that modern human sample has a much wider geological range. We
first observe that, our early Homo sample shows the same metameric pattern as australopiths—teeth from
the same fossil individual are best-fit together—in modern humans, teeth are best clustered according to
dental position, instead of individual (Fig. 4.11C).
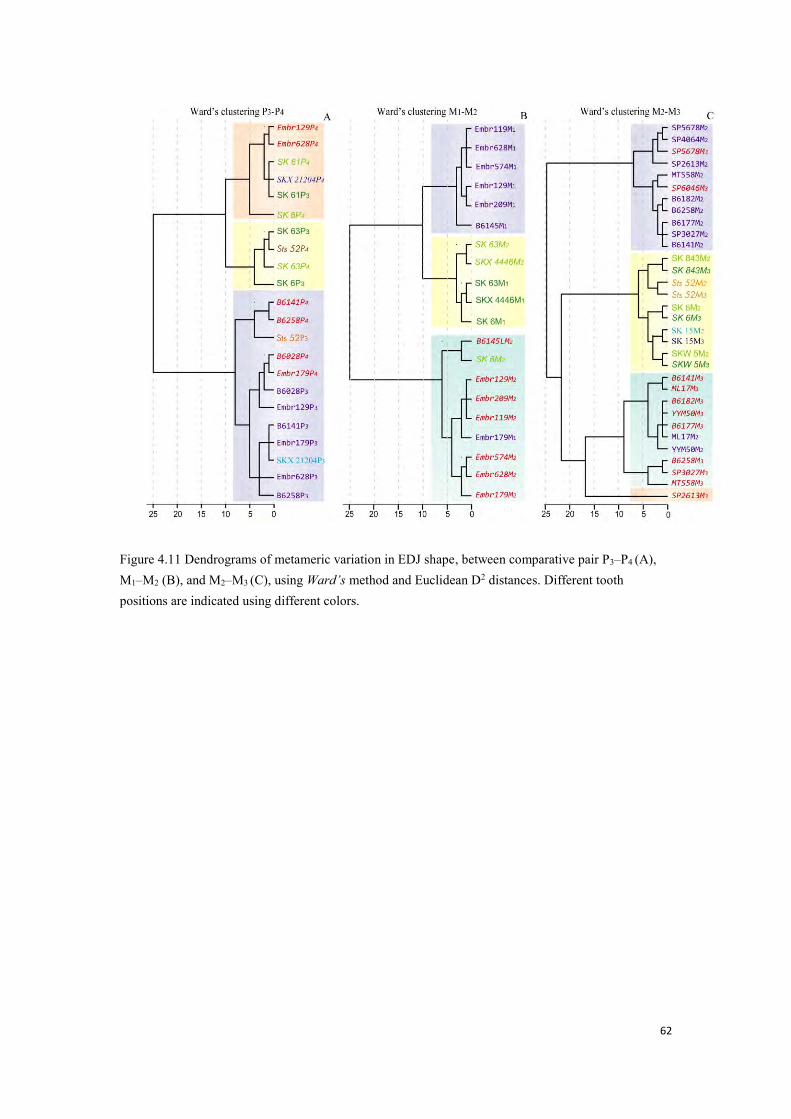
62
Figure 4.11 Dendrograms of metameric variation in EDJ shape, between comparative pair P3–P4 (A), M1–M2 (B), and M2–M3 (C), using Ward’s method and Euclidean D2 distances. Different tooth positions are indicated using different colors.

63
Pan, L., Thackeray, J., Dumoncel, J., Zanolli, C., Oettlé, A., De Beer, F., Hoffman, J., Duployer, B.,
Tenailleau, C., Braga, J., 2016. Intra-individual metameric variation expressed at the enamel-
dentine junction of lower post-canine dentition of South African fossil hominins and modern
humans. Am. J. Phys. Anthropol. (Sumbitted).

64
5. DISCUSSION
In this thesis, we discribe and compare dental inner structures in fossil hominins and modern
humans, with special reference to the characteristics of South African early Homo, including enamel
thickness, enamel distribution and EDJ geometric morphometrics. Here we summarize the features we
observed, according to each taxon.
Intra-individual metameric variation expressed at the
enamel-dentine junction of lower post-canine dentition of South African fossil hominins and modern humans
Journal: American Journal of Physical Anthropology
Manuscript ID Draft
Wiley - Manuscript type: Brief Communication
Date Submitted by the Author: n/a
Complete List of Authors: Pan, Lei; Key Laboratory of Vertebrate Evolution and Human Origins of Chinese Academy of Sciences, Institute of Vertebrate Paleontology and Paleoanthropology, Chinese Academy of Sciences, ; Laboratoire d’Anthropobiologie Moléculaire et d’Imagerie de Synthèse, UMR 5288 CNRS-Université de Toulouse (Paul Sabatier), Thackeray, J.; University of the Witwatersrand, Institute for Human Evolution Dumoncel, Jean; Laboratoire d’Anthropobiologie Moléculaire et d’Imagerie de Synthèse, UMR 5288 CNRS-Université de Toulouse (Paul Sabatier), Zanolli, Clément; Laboratoire d’Anthropobiologie Moléculaire et d’Imagerie de Synthèse, UMR 5288 CNRS-Université de Toulouse (Paul Sabatier), Oettlé, Anna; University of Pretoria, Department of Anatomy, School of Medicine, Faculty of Health Sciences de Beer, Frikkie; South African Nuclear Energy Corporation Hoffman, Jakobus; South African Nuclear Energy Corporation (Necsa) Duployer, Benjamin; Centre Inter-universitaire de Recherche et d’Ingénierie des Matériaux, UMR 5085 CNRS-Université de Toulouse (Paul Sabatier) Tenailleau, Christophe; Centre Inter-universitaire de Recherche et d’Ingénierie des Matériaux, UMR 5085 CNRS-Université de Toulouse (Paul Sabatier) Braga, José; Laboratoire d’Anthropobiologie Moléculaire et d’Imagerie de Synthèse, UMR 5288 CNRS-Université de Toulouse (Paul Sabatier); University of the Witwatersrand, Institute for Human Evolution
Key Words: Metamerism, tooth internal structure, Australopithecus africanus, Paranthropus robustus, early Homo
Subfield: Please select your first choice in the first field.:
Paleontology , Human biology [living humans; behavior, ecology, physiology, anatomy]
John Wiley & Sons, Inc.
American Journal of Physical Anthropology
Intra-individual metameric variation expressed at the enamel-dentine junction of lower post-canine
dentition of South African fossil hominins and modern humans
Lei Pana, b *
, John Francis Thackerayc, Jean Dumoncel
b, Clément Zanolli
b, Anna Oettlé
d, Frikkie de Beer
e,
Jakobus Hoffmane, Benjamin Duployer
f, Christophe Tenailleau
f, and José Braga
b, c
a Key Laboratory of Vertebrate Evolution and Human Origins of Chinese Academy of Sciences, Institute of
Vertebrate Paleontology and Paleoanthropology, Chinese Academy of Sciences, Beijing 100044, China
b Laboratoire d’Anthropobiologie Moléculaire et d’Imagerie de Synthèse, UMR 5288 CNRS-Université de
Toulouse (Paul Sabatier), 37 Allées Jules Guesde, 31000 Toulouse, France
c Evolutionary Studies Institute and School of Geosciences, University of the Witwatersrand, PO WITS,
Johannesburg, 2050, South Africa
d Department of Anatomy, School of Medicine, Faculty of Health Sciences, University of Pretoria, Pretoria,
South Africa
e Radiation Science Department, South African Nuclear Energy Corporation (Necsa), Pelindaba, North
West Province, South Africa
fCentre Inter-universitaire de Recherche et d’Ingénierie des Matériaux, UMR 5085 CNRS-Université de
Toulouse (Paul Sabatier), 118 route de Narbonne, 31062 Toulouse Cedex 9, France
#text pages: 12
#bibliographic pages: 5
#table: 1
#figures: 3
KEY WORDS Metamerism; tooth internal structure; Australopithecus africanus; Paranthropus
robustus; early Homo; Homo sapiens
Abbreviated title Hominin lower postcanine EDJ metameric variation
* Corresponding author (L. Pan)
Address: Laboratoire AMIS UMR 5288, Bâtiment 4R3 B2, 118 route de Narbonne, 31062
Toulouse Cedex, France
Tel. number: +33 (0)5 61 55 80 64
Fax number: +33 (0)5 61 14 59 79
E-mail address: [email protected] / [email protected]
Grant sponsors: French Ministry of Foreign Affairs, China Scholarship Council and the Centre
National de la Recherche Scientifique (CNRS)
Page 2 of 25
John Wiley & Sons, Inc.
American Journal of Physical Anthropology
123456789101112131415161718192021222324252627282930313233343536373839404142434445464748495051525354555657585960
ABSTRACT
Objectives Even though the intra-individual metameric variation likely reflects developmental processes
and may also be taxonomically useful, its patterning along the early hominin postcanine dentition is not
well understood. Despite a number of studies based on different sets of individuals, the strictly intra-
individual metameric variation along postcanine dentition of South African fossil hominins is less
understood.
Materials and Methods Using microfocus X-ray computed tomography (µXCT) and geometric
morphometric tools, we studied the enamel dentine junction (EDJ) morphology and we investigated the
intra- and inter-individual EDJ metameric variation among eight australopiths and two early Homo
specimens from South Africa, as well as 32 modern humans.
Results Common metameric trends were captured between fossil and modern taxa, while different degrees
of expressing such trends distinguished fossil from modern species. For premolars, fossil and modern taxa
did not show substantial differences in the magnitude of intra-individual metameric distances, but modern
humans exhibited the highest degree of variation toward the distal molars. For all post-canine teeth, early
Homo individuals displayed a similar pattern to Australopithecus africanus than to modern humans,
although the shape distances in fossil taxa are subtle.
Conclusion The distalward increase of metameric variation along the modern human molar row is
consistent with the odontogenetic models of molar row structure (inhibitory cascade model) and molar
crown morphology (patterning cascade model). We show here that, in addition to its taxonomic diagnostic
features, the EDJ of the post-canine dentition represents a reliable indicator for identifying the position of
Page 3 of 25
John Wiley & Sons, Inc.
American Journal of Physical Anthropology
123456789101112131415161718192021222324252627282930313233343536373839404142434445464748495051525354555657585960
the post-canine teeth in fossil and extant hominins. This could be useful to accurately discriminate among
the isolated Plio-Pleistocene hominin teeth samples which constitute the major part of the South African
fossil record.
INTRODUCTION
Metameric variations observed among species may reflect differences in developmental processes (Weiss
1990; Braga et al., 2010; Evans et al., 2016; Morita et al., 2016). For instance, size-related shape variations
in human upper molars are consistent with odontogenetic models of molar row structure (inhibitory cascade
model) and molar crown morphology (patterning cascade model) (Jernvall 2000; Kavanagh et al., 2007).
Metameric variation could also be used to infer ecological conditions or/and functional adaptations
(Kavanagh et al., 2007; Polly 2007), as well as to distinguish symplesiomorphic traits from autamorphic
traits (Hlusko 2002). Dental metameric studies also yield some insights into primate taxonomy (e.g., Weiss
1990; Hlusko 2002; Braga et al., 2010; Singleton et al., 2011; Bailey et al., 2014, 2016; Morita et al., 2016).
However, few analyses of metameric variation were yet conducted at the intra-individual level (i.e., strictly
based on teeth from the same individuals) (Braga et al., 2010), and most studies were based on teeth
representing different sets of individuals (Hlusko 2002; Smith et al., 2006; Olejniczak et al., 2007; Skinner
et al., 2008a). Besides its potential usefulness for developmental, functional/ecological and taxonomic
inferences, more studies of intra- versus inter-individual metameric variations may also help to identify
position of isolated teeth among fossil hominin assemblages. Indeed, efforts made aiming to distinguish
Page 4 of 25
John Wiley & Sons, Inc.
American Journal of Physical Anthropology
123456789101112131415161718192021222324252627282930313233343536373839404142434445464748495051525354555657585960

molars positions by quantifying wear facets have provided unsatisfying results (Fiorenza et al., 2010;
Benazzi et al., 2011).
Previous studies of metameric variation mainly focused on the outer enamel surface (OES) (Hlusko
2002; Singleton et al., 2011). Since the assessment of OES features may be obscured by occlusal wear,
more recent analyses have investigated the enamel-dentine junction (EDJ). However, only few studies have
yet dealt with the relevance of the EDJ morphology to assess metameric variation in hominin teeth (Braga
et al., 2010). As noted by Braga et al., (2010), modern humans exhibit stronger metameric variation
between first and second molar, as compared with Au. africanus. Another study based on EDJ shape
showed that Au. africanus and P. robustus show similar 3D-EDJ intra-group metameric trend along the
molar dentition, but P. robustus preserves a marked reduction in the buccolingual breadth of the distal
crown between M2 and M3, and a marked interradicular extension of the enamel cap in M1 and M2 (Skinner
et al., 2008a).
Here we newly assess the intra-individual, inter-individual and intra-group degrees of metameric
variation at the EDJ level of the post-canine dentition in three Plio-Pleistocene hominin taxa
(Australopithecus, Paranthropus and early Homo) and in modern humans. We mainly aim to test if the
intra- and inter-individual metameric pattern differ between australopiths and genus Homo, in other words,
does the metameric pattern observed in modern humans is already seen in early Homo and/or australopiths?
We also test if 3D-EDJ metameric variation is a useful indicator of dental position in lower postcanine
teeth.
MATERIALS AND METHODS
Page 5 of 25
John Wiley & Sons, Inc.
American Journal of Physical Anthropology
123456789101112131415161718192021222324252627282930313233343536373839404142434445464748495051525354555657585960

Study sample
In order to examine intra-individual metameric variation, only the postcanine dentition from
mandibular specimens was selected—isolated teeth were excluded. Whenever the antimeres were
preserved, only the teeth on the better preserved side were used in our analyses. The fossil hominin
materials came from collections housed at the Ditsong Museum (Pretoria, South Africa). Our fossil sample
includes permanent lower post-canine teeth representing P. robustus (N=17, six individuals), Au. africanus
(N=4, one individual) and early Pleistocene Homo specimens, attributed either to hominins transitional to
Homo (e.g. H. habilis) or to Homo erectus s.l. (Wood 2010). (Table 1).
The modern human reference material includes 88 teeth, representing 32 individuals of European,
Asian and African origin (Table 1).
Because of unconformable wear stages along the molar dentition in many modern specimens, we used
different individuals for comparisons M1-M2 and M2-M3 (detailed in Table 1).
#Take in Table 1
Microfocus X-Raycomputed tomography (µXCT)
The South African early Homo and P. robustus specimens were scanned using 4 comparable X-ray
microtomographic instruments: an X-Tek (Metris) XT H225L industrialµXCT system at the South African
Nuclear Energy Corporation (Necsa) (Hoffman, de Beer 2012), a Scanco Medical X-Treme micro-XCT
scanner at the Institute for Space Medicine and Physiology (MEDES) of Toulouse, a Phoenix Nanotom 180
scanner from the FERMAT Federation, based at the Inter-university Material Research and Engineering
Centre (CIRIMAT, UMR 5085 CNRS), a 225 kV-µXCT scanner housed at the Institute of Vertebrate
Paleontology and Paleoanthropology (IVPP, Chinese Academy of Sciences). Isometric voxel size ranged
Page 6 of 25
John Wiley & Sons, Inc.
American Journal of Physical Anthropology
123456789101112131415161718192021222324252627282930313233343536373839404142434445464748495051525354555657585960
from 10 to 70 µm. Each specimen was segmented in Avizo 8.0 (Visualization Sciences Group,
www.vsg3d.com).
3D surface reconstruction
Micro-XCT image stacks were imported for semi-automated (modules “magic wand” and “threshold”)
and automated (module “watershed”) segmentations. After the segmentation, the EDJ surface was
generated using the “unconstrained smoothing” parameter.
The degree of wear for each fossil specimen is listed in Table 1, according to tooth wear categories
proposed by Molnar (1971). In the majority of cases, our specimens show no dentine horn wear on EDJs,
but when necessary the dentine horn tip was reconstructed based on the morphology of the intact cusps.
Geometric morphometrics
Landmarks were defined using “Create Splines” in Avizo 8.0. For each tooth, we defined a set of
landmarks as well as a set of semi-landmarks along the marginal ridge between the main dentine horns
(DHs), as an approximation of the marginal ridge (Fig. 1). For premolars, the landmarks were placed on the
tips of the DHs (i.e., 1. protoconid, 2. metaconid), with 55 semi-landmarks in between (30 on the mesial
marginal ridge, 15 on the distal marginal ridge and 10 on the essential crest that connects the two DHs).
The molar landmark set included four landmarks on the tips of the DHs (i.e., 1. protoconid, 2. metaconid, 3.
entoconid, 4. hypoconid), with 80 semi-landmarks, forming a continuous line, beginning at the tip of the
protoconid and moving in a clockwise direction. All semi-landmarks were slid along and within their
respective curve sections, which is separated by landmarks.
#Take in Figure 1
Multivariate analyses
Page 7 of 25
John Wiley & Sons, Inc.
American Journal of Physical Anthropology
123456789101112131415161718192021222324252627282930313233343536373839404142434445464748495051525354555657585960
In order to investigate intra-group metameric variation, the samples were grouped into three pairs,
according to tooth position (P3-P4, M1-M2, M2-M3), and multivariate comparisons were performed within
each pair.
The landmark sets were imported in R software (R Development Core Team 2012), and statistical
analyses were conducted subsequently. The study of intra-individual metameric variation in shape was
completed by Procrustes superimposition of the semi-landmark configurations (using R packages ade4).
Generalized Procrustes Analysis (GPA) was performed and between-group PCAs (bgPCA) were
undertaken to assess EDJ morphometric variations between groups (Mitteroecker, Bookstein 2011; Gunz et
al., 2012; Braga et al., 2013; Pan et al., 2016). Because early Homo and Au. africanus have only one
specimen representing their groups, respectively, to avoid unexpected error, they were projected
subsequently onto the shape space, without being assigned to groups a priori. The first two axes were
plotted in order to visualize the dispersion of EDJ shapes of different tooth position within one species, and
to examine inter-specific metameric variation.
As a complementary method of assessing phenetic similitude, hierarchical clustering on principal
components (HCPC) was undertaken using R (R Development Core Team 2012, package hclust), and
dendrograms were created. HCPC visualizes distances between any individuals or clusters, using a 0 to 25
scale. It comprises two steps: first, a classical PCA was conducted, using raw shape coordinates after
Procrustes superimposition, yielding a number of principal components and respective scores; second, all
PC scores were imported to run a hierarchical clustering, using Ward’s method and squared Euclidean
distance. Ward's minimum variance method aims at finding compact clusters in which individuals are
grouped so as to minimize the increase of intra-group inertia at each step of the algorithm.
Page 8 of 25
John Wiley & Sons, Inc.
American Journal of Physical Anthropology
123456789101112131415161718192021222324252627282930313233343536373839404142434445464748495051525354555657585960
RESULTS
The 3D-EDJ metameric variation is shown in Figures 2 and 3, and comparisons of P3-P4, M1-M2 and
M2-M3 are illustrated by bgPCA plots and dendrograms. The first two bgPCs account for 53.5–58.5% of the
total variance. Specimens are marked according to species and dental position. In the bgPCA plots,
specimens from the same individual are marked using the same symbol, and each colors representing the
tooth position for each taxon; in the dendrograms, the text color indicates tooth position.
Results from the bgPCA and hierarchical clustering suggest that patterns and degrees of intra-
individual metameric variation differ according to species and tooth position, but some trends in shape-
change are shared between the different taxa. The extreme conformations of the EDJ are shown at the end
of the bgPCA axes (Fig. 2A-C) and in the Figure 2a-l. For the premolars, the bgPC1 is mostly driven by the
respective development of the anterior and posterior foveae, as well as by the height of the protoconid and
metaconid dentine horns. Equal-sized anterior and posterior foveae, as well as higher protoconid dentine
horn characterising the P3s of modern humans are found in the maximal values of bgPC1; smaller fovea
anterior and higher metaconid dentine horn of P. robustus P4s are seen in the negative space of bgPC1 (Fig.
2A, a, b). The BgPC2 is driven by the buccolingual width, resulting in changes of EDJ outline (slender or
oval) and metaconid dentine horn height (Fig. 2A, c, d). While modern human P4s and P. robustus P3s
overlap along bgPC1, they are clearly discriminated along bgPC2, the former having rounder and more
parallely set dentine horns than the latter. Within-group metameric patterns are similar for both taxa: P3s
tend to show more buccolingually elongated EDJwhile P4s show a rounder shape and P3s and P4s of both
taxa have a similar level of dispersion (i.e., a similar level of variability). The Au. africanus specimen Sts
52 and the early Homo specimen SKX 21204 share a particular pattern, with their P3 resembling that of
Page 9 of 25
John Wiley & Sons, Inc.
American Journal of Physical Anthropology
123456789101112131415161718192021222324252627282930313233343536373839404142434445464748495051525354555657585960

modern humans, but their P4 being similar to that of P. robustus (Fig. 2A).
#Take in Figure 2
Different degrees of metameric variation between modern humans and P. robustus were observed in
M1-M2, but materials from early Homo and Au. africanus are not avaliable for comparison. Our shape
conformation analysis indicate that the reduction of hypoconulid from M1s to M2s is a metameric pattern
shared in modern humans and P. robustus (Fig. 2B). The bgPC1 axis is driven by the presence and degree
of expression of the hypoconulid dentine horn, and the position and height of the hypoconid dentine horn
(Fig. 2B, e, f). Well-developed hypoconulid and hypoconid dentine horns are characteristic of P. robustus
M1s , falling in the maximal values of bgPC1, whereas modern human M2s, having a reduced (or absent)
hypoconulid and more distally set hypoconid are found in the negative space of this axis. As for the P3s and
P4s, modern human M1s overlap with P. robustus M2s along bgPC1, but are differentiated along bPC2. The
modern human M1s, located in the positive part of bgPC2 are characterized by a higher EDJ topography, a
pentagonal outline and a high hypoconulid dentine horn, while P. robustus M2s, falling in the negative
space of bgPC2, displays lower dentine horns, a more mesiodistally elongated outline and a well-developed
hypoconulid. P. robustus and modern humans exhibit a similar metameric pattern from the M1 to the M2,
even if the intra-individual and intra-group variability of these teeth is lower in the fossil taxon. For the
M3s, our bgPCA reveals similar metameric patterns between modern humans, early Homo and Au.
africanus, with the M2s showing a mesiodistally elongated (sub-rectangular) outline and a higher
hypoconid found in more positive values of bgPC2 than the M3s that are discriminated by their ovoid,
rounder outline and lower distal dentine horns. , P. robustus M2s and M3s display a unique metameric
pattern, with their M2s and M3s discriminated along bgPC1, the M3s being differentiated from the M2s by a
Page 10 of 25
John Wiley & Sons, Inc.
American Journal of Physical Anthropology
123456789101112131415161718192021222324252627282930313233343536373839404142434445464748495051525354555657585960

longer talonid and flatter EDJ topography (Fig. 2C, i, j).Overall, most of the fossil hominins are grouped in
the negative space of bgPC1 and bgPC2 axes, while the modern human M2s and M3s have a much larger
dispersion range in the shape space. With this respect, it has to be noted that the degree of intra-individual
and intra-group metameric differences in fossil hominins is very low, compared with modern humans (that
are also represented by individuals from a larger geographical range and a much higher genetic pool
variability).
In comparative pair P3-P4, groups were separated with reference to species, two main groups are
represented by P. robustus and modern humans (Fig. 3A), in general. The magnitude of intra-individual
shape distances between these two species does not substantially differ (Figs. 2A, 3A), and common
patterns are shown among groups: the P3 of an individual is placed at the upper part of bgPC1, compared
with its P4. The P3s of early Homo and Au. africanus are clustered with modern human P3s, while their P4s
are clustered with P. robustus P4s.
Modern human M1s showed closer affinity to all the P. robustus specimens, and to a minor number of
modern human M2s, in most of the cases M1 and M2 of an individual are linked at a distance (Fig. 3B).
Intra-individual metameric distances in P. robustus were also greater than inter-individual shape distances
for a given dental position, for example, SK63M2 was better paired with SKX4446M2, than with its own
M1, although the degree of difference was very low (except for Sk6M2, which was better clustered with
modern humans).
In comparative pair M2-M3, dendrograms suggested significant distinctions between fossil and modern
species, but groups were not very well-separated using bgPCA, probably as a result of highly diversified
M3 shape of modern humans. Five modern human specimens are grouped far away from the rest (Fig. 3C),
Page 11 of 25
John Wiley & Sons, Inc.
American Journal of Physical Anthropology
123456789101112131415161718192021222324252627282930313233343536373839404142434445464748495051525354555657585960
and an appreciable overlap is shown between M2s and M3s (Figs. 2C, 3C), suggesting an abundant and
unstable intra-individual metameric variation in the modern human sample. In contrast, spatial placement
between P. robustus M2 and M3s is constant. The smallest intra-individual distance in modern humans is
around 2.5 (SP5678), but in most of the cases, the intra-individual distance is 25 (Fig. 3C). Overall, the
limited available specimens for early Homo (SK 15) and Au. africanus (Sts 52) show an intermediate
metameric pattern between Paranthropus and modern humans.
#Take in Figure 3
DISCUSSION
Tooth morphology is controlled by the combined effects of biochemical signaling degraded from
mesial to distal direction at the tooth row level and at the individual crown level (Weiss 1990; Jernvall
2000). As suggested by the inhibitory cascade model (Kavanagh et al., 2007; Evans et al., 2016), the
development of each premolar and molar is controlled by the balance between inhibitor molecules from
mesially located tooth germs and activator molecules from the mesenchyme. The ratio of genetic activation
and inhibition during development determines the relative size of the dental elements in the post-canine
tooth row.
If allometric shape variation has a pervasive influence on primate tooth morphology and function, the
impact and extent of metameric variation is a less well understood phenomenon. Metameric differences are
often subtle, and the risk of conflating metameric and taxonomic variation is a general concern (Hlusko
2002; Singleton et al., 2011). However, dental metameric variation in Plio-Pleistocene hominins remains
relatively unexplored owing to difficulty in quantifying the complex and subtle shape variation in premolar
Page 12 of 25
John Wiley & Sons, Inc.
American Journal of Physical Anthropology
123456789101112131415161718192021222324252627282930313233343536373839404142434445464748495051525354555657585960

and molar crowns, especially at the level of the EDJ. By investigating the dental inner structure, we
confirm that the EDJ shapes of the lower post-canine dentition are distinctive between fossil and modern
taxa, but also that fossil and modern groups share some intra-individual metameric patterns.
As revealed by geometric morphometric analyses, the intra-individual metameric variation in
premolars of fossil hominins is as high in modern humans. However, in the molar row, and especially for
the M2s and M3s, shape variation is much more limited in fossil hominins than in modern humans which
show a huge degree of variability. This is consistent with previous observations of metameric patterns of
modern human upper molar EDJ using morphometric mapping (Morita et al., 2016). We first observe that
the early Homo and Au. africanus very close premolar EDJ metameric patterns are intermediate between
those of modern humans and P. robustus. It has been suggested that in modern humans, the inter-individual
differences are larger for the M2s than for the M1s (Braga et al., 2010), this observation is in line with the
distalward molar size reduction seen in Pleistocene humans (Brace, Mahler 1971; Brace et al., 1987;
Bermúdez de Castro, Nicolas 1995; Evans et al., 2016) and it is possible that smaller tooth size may be
associated to highly unstable shapes. From our results, the shape variability in extant humans do not
substantially differ between M1s and M2s. However, there are some differences of variation between M2s
and M3s depending on the taxon. As Skinner et al., (2008a) observed a small-scale, distal expansion of the
marginal ridge in M2-M3s of P. robustus, we confirm such trend in all of our P. robustus and a number of
modern human specimens. Such trend is weakly expressed in our Au. africanus and early Homo specimens.
The small sample size for the fossil hominins prevents a conclusive statement, but allows us to make some
preliminary comments. The early Homo mandible SK 15 displays a relatively small degree of metameric
variation, close to that of the Au. africanus specimen Sts 52. P. robustus seems to exhibit a low degree of
Page 13 of 25
John Wiley & Sons, Inc.
American Journal of Physical Anthropology
123456789101112131415161718192021222324252627282930313233343536373839404142434445464748495051525354555657585960
variation, stable for all the post-canine teeth (including the M3). In modern humans, while the variability of
the premolars is low (similar to that of P. robustus), they tend to show a higher variablity in the molar raw
(with an increasing trend from the M1 to the M3). The low variation observed in the fossil hominin groups
could be explained by lower population size and genetic diversity than in our modern human sample
including individuals from three continents (Africa, Europe and Asia) and from a total population
constituted by billions of individuals. However, it is also important to consider the fact that in our analyses
the fossil hominins are underrepresented with respect to the modern humans and further studies including
more fossils specimens will be necessary to ascertain the lower level of intra-specific and intra-group
variability observed here.
While the EDJ morphology is considered a reliable taxonomic proxy among early hominins (Skinner
et al., 2008b, b; 2009b; 2016), we also suggest its shape is a useful indicator of tooth position in their post-
canine dentition. However, our analyses also warn us that, whenever considered together with the modern
humans, the South African hominin molars are not well discriminated due to the subtle degree of shape
variation (notably in the molar row).
CONCLUSIONS
While 2D studies based on the OES suggest the existence of a distinctive metameric pattern in
modern humans compared with that found in chimpanzees and Au. africanus (Hlusko 2002), in each
comparative pair of EDJ (P3-P4, M1-M2 and M2-M3) that we investigated, we do not observe a specific
metameric pattern that belongs only to extant humans (as P. robustus also share a similar pattern), but we
recognize that Au. africanus (together with early Homo) differ in their meristic shape variation. As a whole,
the EDJ proves to be a reliable proxy to identify the taxonomic identity and metameric position of the post-
Page 14 of 25
John Wiley & Sons, Inc.
American Journal of Physical Anthropology
123456789101112131415161718192021222324252627282930313233343536373839404142434445464748495051525354555657585960

canine dentition in fossil and extant hominins. When considering the post-canine dentition as a whole,
extant humans exhibit a marked degree of intra-individual metameric variation, which increases in a
distalward direction. These results are generally in accordance with morphogenetic models of molar rows
(inhibitory cascade model) and molar crowns (patterning cascade model). However, such a trend does not
seem to be explicitely expressed in the South African fossil hominins. It should be noted that our study
focuses only on the EDJ marginal ridges, but additional studies of the accessory ridges (e.g. protostylid),
and a more global analysis of shape variation among early hominins based on the whole EDJ surface and
diffeomorphisms (Braga 2016) will supplement our understanding on the metameric variation in hominin
dentition.
ACKNOWLEDGEMENTS
This work was supported by the Centre National de la Recherche Scientifique (CNRS), the French Ministry
of Foreign Affairs, the French Embassy in South Africa through the Cultural and Cooperation Services, and
the China Scholarship Council. For access to specimens we thank the following individuals and
institutions: Stephany Potze (Ditsong National Museum of Natural History, Pretoria), Jean-Luc Kahn
(Strasbourg University), Dr. S. Xing (Institute of Vertebrate Paleontology and Paleoanthropology, Beijing),
Dr. M. Zhou (Institute of Archeology and Cultural Relics of Hubei Province, Wuhan), and Dr. C. Thèves.
We thank Dr. A. Beaudet for her technical support during the imaging processing of data and the statistical
analysis.
LITERATURE CITED
Page 15 of 25
John Wiley & Sons, Inc.
American Journal of Physical Anthropology
123456789101112131415161718192021222324252627282930313233343536373839404142434445464748495051525354555657585960
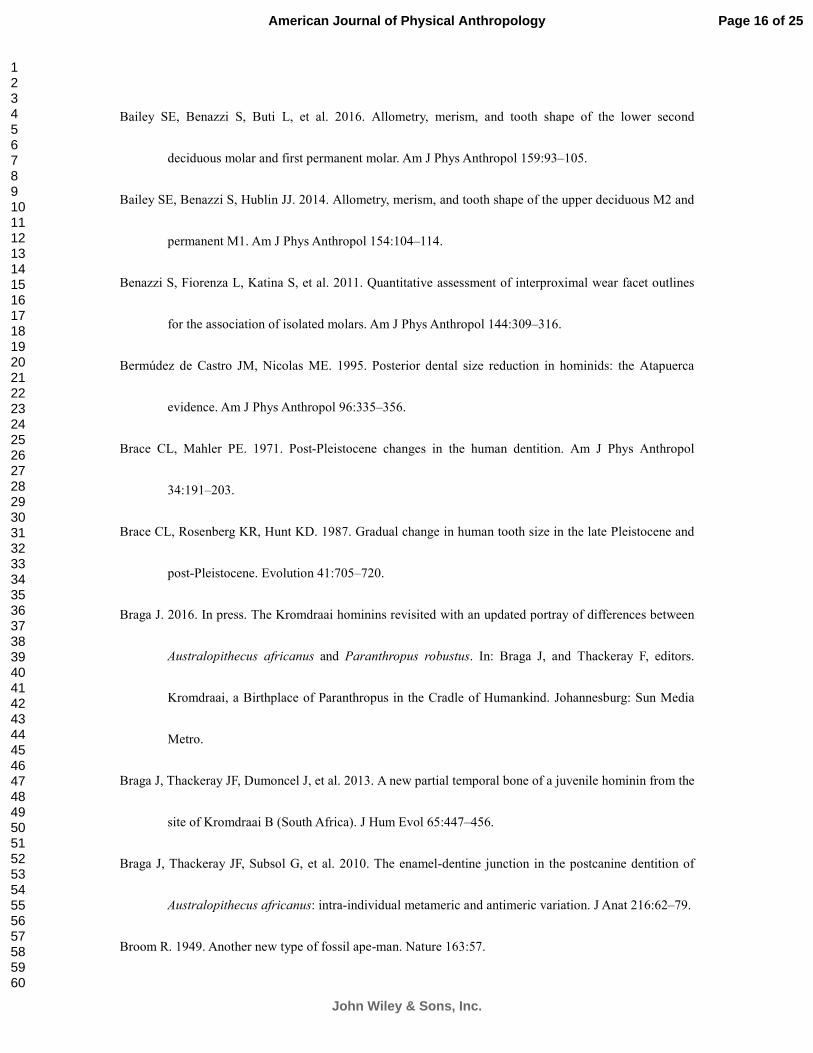
Bailey SE, Benazzi S, Buti L, et al. 2016. Allometry, merism, and tooth shape of the lower second
deciduous molar and first permanent molar. Am J Phys Anthropol 159:93–105.
Bailey SE, Benazzi S, Hublin JJ. 2014. Allometry, merism, and tooth shape of the upper deciduous M2 and
permanent M1. Am J Phys Anthropol 154:104–114.
Benazzi S, Fiorenza L, Katina S, et al. 2011. Quantitative assessment of interproximal wear facet outlines
for the association of isolated molars. Am J Phys Anthropol 144:309–316.
Bermúdez de Castro JM, Nicolas ME. 1995. Posterior dental size reduction in hominids: the Atapuerca
evidence. Am J Phys Anthropol 96:335–356.
Brace CL, Mahler PE. 1971. Post-Pleistocene changes in the human dentition. Am J Phys Anthropol
34:191–203.
Brace CL, Rosenberg KR, Hunt KD. 1987. Gradual change in human tooth size in the late Pleistocene and
post-Pleistocene. Evolution 41:705–720.
Braga J. 2016. In press. The Kromdraai hominins revisited with an updated portray of differences between
Australopithecus africanus and Paranthropus robustus. In: Braga J, and Thackeray F, editors.
Kromdraai, a Birthplace of Paranthropus in the Cradle of Humankind. Johannesburg: Sun Media
Metro.
Braga J, Thackeray JF, Dumoncel J, et al. 2013. A new partial temporal bone of a juvenile hominin from the
site of Kromdraai B (South Africa). J Hum Evol 65:447–456.
Braga J, Thackeray JF, Subsol G, et al. 2010. The enamel-dentine junction in the postcanine dentition of
Australopithecus africanus: intra-individual metameric and antimeric variation. J Anat 216:62–79.
Broom R. 1949. Another new type of fossil ape-man. Nature 163:57.
Page 16 of 25
John Wiley & Sons, Inc.
American Journal of Physical Anthropology
123456789101112131415161718192021222324252627282930313233343536373839404142434445464748495051525354555657585960

Broom R, Robinson JT. 1949. A new type of fossil man. Nature 164:322–323.
Broom R, Robinson JT. 1952. Swartkrans ape-man, Paranthropus crassidens. Trans Mus Mem No 6:1–
124.
Butler P. 1956. The ontogeny of molar pattern. Biol Rev 31:30–69.
Corruccini R. 1987. The dentinoenamel junction in primates. Int J Primatol 8:99–114.
Evans AR, Daly ES, Catlett KK, et al. 2016. A simple rule governs the evolution and development of
hominin tooth size. Nature 530:477–480.
Fiorenza L, Benazzi S, Tausch J, et al. 2010. Brief communication: identification reassessment of the
isolated tooth Krapina D58 through occlusal fingerprint analysis. Am J Phys Anthropol 143:306–
312.
Grine FE. 1989. New hominid fossils from the Swartkrans formation (1979-1986 excavations):
craniodental specimens. Am J Phys Anthropol 79:409–449.
Grine FE, Daeglin DJ. 1993. New mandible of Paranthropus robustus from Member 1, Swartkrans
Formation, South Africa. J Hum Evol 24:319–333.
Gunz P, Ramsier M, Kuhrig M, et al. 2012. The mammalian bony labyrinth reconsidered, introducing a
comprehensive geometric morphometric approach. J Anat 220:529–543.
Hillson S. 1996. Dental anthropology. Cambridge: Cambridge University Press.
Hlusko L. 2002. Identifying metameric variation in extant hominoid and fossil hominid mandibular molars.
Am J Phys Anthropol 118:86–97.
Hoffman JW, de Beer F. 2012. Characteristics of the micro-focus X-ray tomography facility (MIXRAD) at
Necsa in South Africa. 18th
World Conference on Nondestructive Testing, Durban, South Africa.
Page 17 of 25
John Wiley & Sons, Inc.
American Journal of Physical Anthropology
123456789101112131415161718192021222324252627282930313233343536373839404142434445464748495051525354555657585960

Jernvall J. 2000. Linking development with generation of novelty in mammalian teeth. Proc Natl Acad Sci
97:2641–2645.
Kavanagh KD, Evans AR, Jernvall J. 2007. Predicting evolutionary patterns of mammalian teeth from
development. Nature 449:427–432.
Korenhof CAW. 1960. Morphogenetic Aspects of the Human Upper Molar. Utrecht: Uitgeversmaatschappij
Neerlandia.
Mitteroecker P, Bookstein F. 2011. Linear discrimination, ordination, and the visualization of selection
gradients in modern morphometrics. Evol Biol 38:100–114.
Molnar S. 1971. Human tooth wear, tooth function and cultural variability. Am J Phys Anthropol 34:175–
189.
Morita W, Morimoto N, Ohshima H. 2016. Exploring metameric variation in human molars: a
morphological study using morphometric mapping. J Anat.
Olejniczak A, Gilbert C, Martin L, et al. 2007. Morphology of the enamel-dentine junction in sections of
anthropoid primate maxillary molars. J Hum Evol 53:292–301.
Olejniczak A, Smith TM, Skinner MM, et al. 2008. Three-dimensional molar enamel distribution and
thickness in Australopithecus and Paranthropus. Biol Lett 4:406–410.
Pan L, Dumoncel J, de Beer F, et al. 2016. In press. Further morphological evidence on South African
earliest Homo lower postcanine dentition: enamel thickness and enamel dentine junction. J Hum
Evol.
Polly PD. 2007. Development with a bite. Nature 449:413–415.
R Development Core Team. 2012. R: A language and environment for statistical computing. Vienna: R
Page 18 of 25
John Wiley & Sons, Inc.
American Journal of Physical Anthropology
123456789101112131415161718192021222324252627282930313233343536373839404142434445464748495051525354555657585960
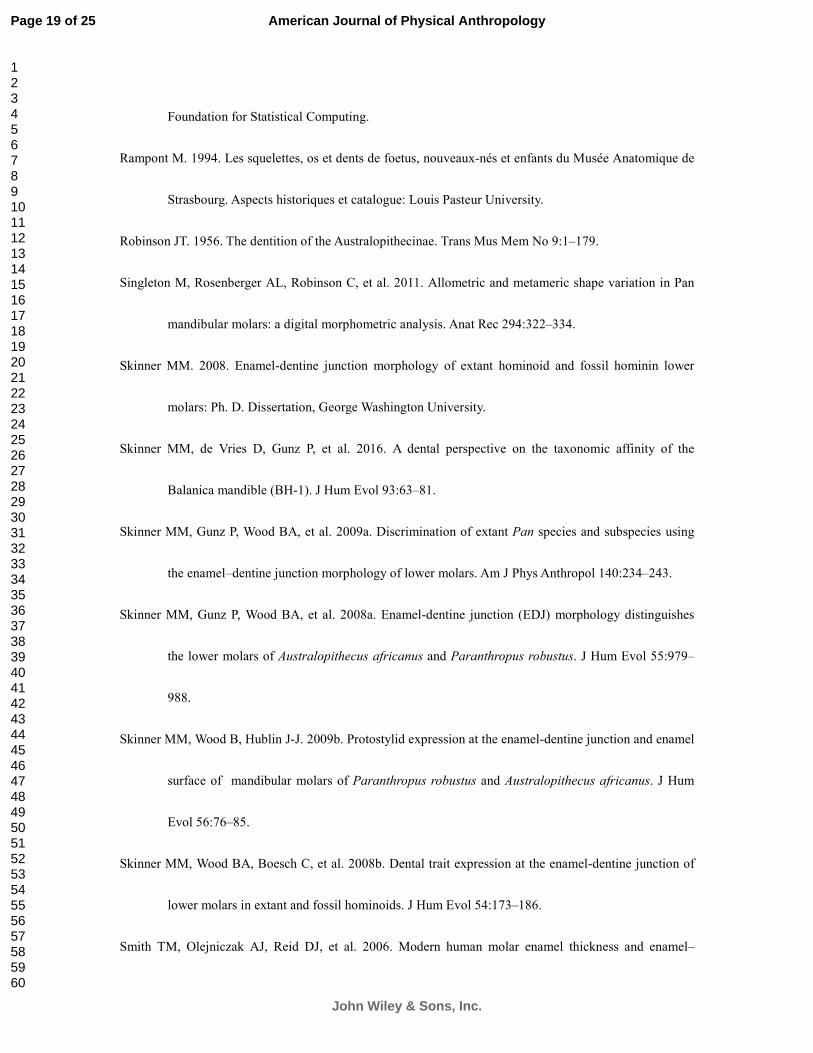
Foundation for Statistical Computing.
Rampont M. 1994. Les squelettes, os et dents de foetus, nouveaux-nés et enfants du Musée Anatomique de
Strasbourg. Aspects historiques et catalogue: Louis Pasteur University.
Robinson JT. 1956. The dentition of the Australopithecinae. Trans Mus Mem No 9:1–179.
Singleton M, Rosenberger AL, Robinson C, et al. 2011. Allometric and metameric shape variation in Pan
mandibular molars: a digital morphometric analysis. Anat Rec 294:322–334.
Skinner MM. 2008. Enamel-dentine junction morphology of extant hominoid and fossil hominin lower
molars: Ph. D. Dissertation, George Washington University.
Skinner MM, de Vries D, Gunz P, et al. 2016. A dental perspective on the taxonomic affinity of the
Balanica mandible (BH-1). J Hum Evol 93:63–81.
Skinner MM, Gunz P, Wood BA, et al. 2009a. Discrimination of extant Pan species and subspecies using
the enamel–dentine junction morphology of lower molars. Am J Phys Anthropol 140:234–243.
Skinner MM, Gunz P, Wood BA, et al. 2008a. Enamel-dentine junction (EDJ) morphology distinguishes
the lower molars of Australopithecus africanus and Paranthropus robustus. J Hum Evol 55:979–
988.
Skinner MM, Wood B, Hublin J-J. 2009b. Protostylid expression at the enamel-dentine junction and enamel
surface of mandibular molars of Paranthropus robustus and Australopithecus africanus. J Hum
Evol 56:76–85.
Skinner MM, Wood BA, Boesch C, et al. 2008b. Dental trait expression at the enamel-dentine junction of
lower molars in extant and fossil hominoids. J Hum Evol 54:173–186.
Smith TM, Olejniczak AJ, Reid DJ, et al. 2006. Modern human molar enamel thickness and enamel–
Page 19 of 25
John Wiley & Sons, Inc.
American Journal of Physical Anthropology
123456789101112131415161718192021222324252627282930313233343536373839404142434445464748495051525354555657585960
dentine junction shape. Arch Oral Biol 51:974–995.
Weiss KM. 1990. Duplication with variation: metameric logic in evolution from genes to morphology.
Yearb Phys Anthropol 11:1–23.
White TD, Folkens PA. 2005. The human bone manual. Amsterdam: Elsevier Academic.
Wood B. 2010. Reconstructing human evolution: achievements, challenges, and opportunities. Proc Natl
Acad Sci 107:8902–8909.
Page 20 of 25
John Wiley & Sons, Inc.
American Journal of Physical Anthropology
123456789101112131415161718192021222324252627282930313233343536373839404142434445464748495051525354555657585960

Figure 1. EDJ surface model of a lower premolar (A-C, SKX 21204 from Swartkrans) and a lower molar
(D-F, SKW 5 from Swartkrans), illustrating the landmarks collected on the tips of the dentine horns (red
spheres) and semi-landmarks that run between the dentine horns (yellow spheres) used to capture EDJ
shape. Abbreviations: buccal (B), distal (D), lingual (L) and mesial (M). See text for explanations of
numbers on the red spheres. Note that sizes of premolars and molars are not to scale.
Figure 2. Metameric EDJ shape variation in fossil and extant taxa. A-C: Results of bgPCA of the
semi-landmark configurations. BgPC1 and bgPC2 represent functions of the shape variation, the 95%
confident ellipses are presented, and ridge curves shown at the end of each axis illustrate the conformation
trends of shape along each PC. Semi-transparent oval and oval-rectangular shapes overlapping EDJ
outlines in A and C show the similarity between them. a-l: Landmark series of EDJ after Procrustes
superimposition and bgPCA. Arrows locate corresponding features described in the text. In one species,
different tooth positions from the same individual are marked using the same symbol but different colors.
Figure 3. Dendrograms of metameric variation in EDJ shape, between comparative pair P3-P4 (A), M1-M2
(B), and M2-M3 (C), using Ward’s method and squared Euclidean distances. Scales from 0 to 25 indicate
phenetic similitude. Different tooth positions are indicated using different colors.
Page 21 of 25
John Wiley & Sons, Inc.
American Journal of Physical Anthropology
123456789101112131415161718192021222324252627282930313233343536373839404142434445464748495051525354555657585960
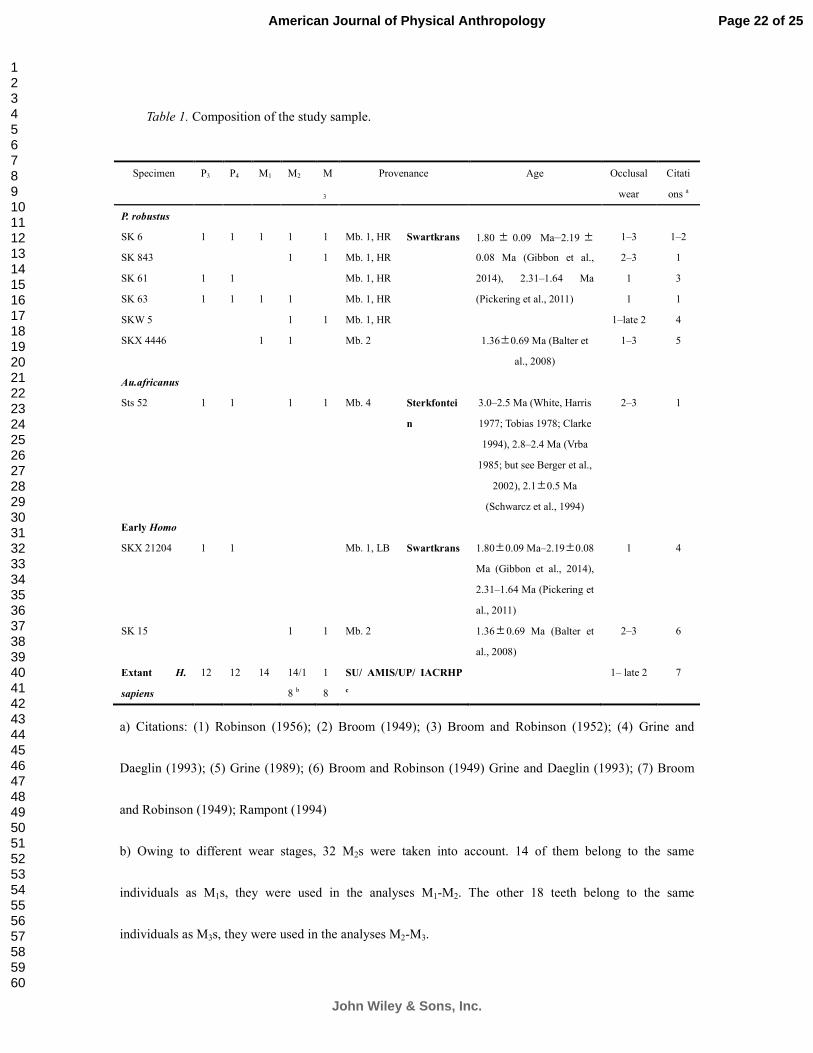
Table 1. Composition of the study sample.
a) Citations: (1) Robinson (1956); (2) Broom (1949); (3) Broom and Robinson (1952); (4) Grine and
Daeglin (1993); (5) Grine (1989); (6) Broom and Robinson (1949) Grine and Daeglin (1993); (7) Broom
and Robinson (1949); Rampont (1994)
b) Owing to different wear stages, 32 M2s were taken into account. 14 of them belong to the same
individuals as M1s, they were used in the analyses M1-M2. The other 18 teeth belong to the same
individuals as M3s, they were used in the analyses M2-M3.
Specimen P3 P4 M1 M2 M
3
Provenance Age Occlusal
wear
Citati
ons a
P. robustus
SK 6 1 1 1 1 1 Mb. 1, HR Swartkrans 1.80 ± 0.09 Ma–2.19 ±
0.08 Ma (Gibbon et al.,
2014), 2.31–1.64 Ma
(Pickering et al., 2011)
1–3 1–2
SK 843 1 1 Mb. 1, HR 2–3 1
SK 61 1 1 Mb. 1, HR 1 3
SK 63 1 1 1 1 Mb. 1, HR 1 1
SKW 5 1 1 Mb. 1, HR 1–late 2 4
SKX 4446 1 1 Mb. 2 1.36±0.69 Ma (Balter et
al., 2008)
1–3 5
Au.africanus
Sts 52 1 1 1 1 Mb. 4 Sterkfontei
n
3.0–2.5 Ma (White, Harris
1977; Tobias 1978; Clarke
1994), 2.8–2.4 Ma (Vrba
1985; but see Berger et al.,
2002), 2.1±0.5 Ma
(Schwarcz et al., 1994)
2–3 1
Early Homo
SKX 21204 1 1 Mb. 1, LB Swartkrans 1.80±0.09 Ma–2.19±0.08
Ma (Gibbon et al., 2014),
2.31–1.64 Ma (Pickering et
al., 2011)
1 4
SK 15 1 1 Mb. 2 1.36±0.69 Ma (Balter et
al., 2008)
2–3 6
Extant H.
sapiens
12 12 14 14/1
8 b
1
8
SU/ AMIS/UP/ IACRHP
c
1– late 2 7
Page 22 of 25
John Wiley & Sons, Inc.
American Journal of Physical Anthropology
123456789101112131415161718192021222324252627282930313233343536373839404142434445464748495051525354555657585960

c) SU: Strasbourg University; AMIS: Laboratory of Molecular Anthropology and Image Synthesis; UP:
University of Pretoria; IACRHP: Institute of Archeology and Cultural Relics of Hubei Province
Page 23 of 25
John Wiley & Sons, Inc.
American Journal of Physical Anthropology
123456789101112131415161718192021222324252627282930313233343536373839404142434445464748495051525354555657585960
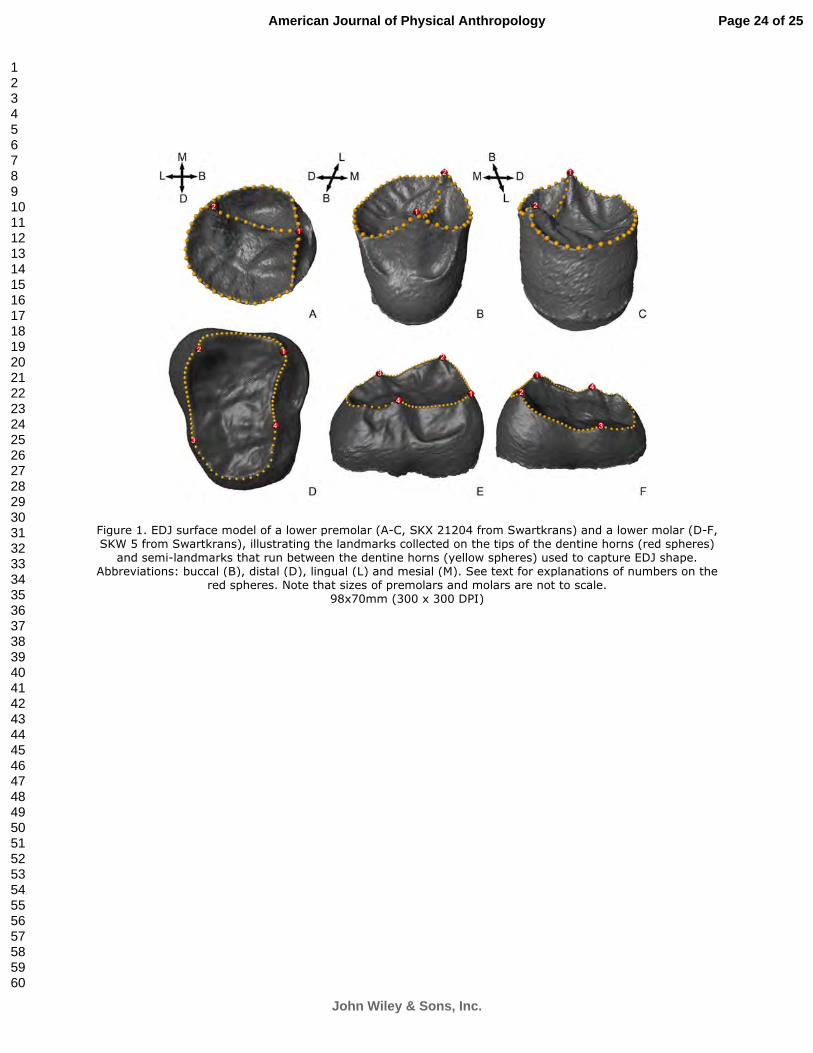
Figure 1. EDJ surface model of a lower premolar (A-C, SKX 21204 from Swartkrans) and a lower molar (D-F, SKW 5 from Swartkrans), illustrating the landmarks collected on the tips of the dentine horns (red spheres)
and semi-landmarks that run between the dentine horns (yellow spheres) used to capture EDJ shape. Abbreviations: buccal (B), distal (D), lingual (L) and mesial (M). See text for explanations of numbers on the
red spheres. Note that sizes of premolars and molars are not to scale. 98x70mm (300 x 300 DPI)
Page 24 of 25
John Wiley & Sons, Inc.
American Journal of Physical Anthropology
123456789101112131415161718192021222324252627282930313233343536373839404142434445464748495051525354555657585960

Figure 2. Metameric EDJ shape variation in fossil and extant taxa. A-C: Results of bgPCA of the semi-landmark configurations. BgPC1 and bgPC2 represent functions of the shape variation, the 95% confident ellipses are presented, and ridge curves shown at the end of each axis illustrate the conformation trends of
shape along each PC. Semi-transparent oval and oval-rectangular shapes overlapping EDJ outlines in A and C show the similarity between them. a-l: Landmark series of EDJ after Procrustes superimposition and
bgPCA. Arrows locate corresponding features described in the text. In one species, different tooth positions from the same individual are marked using the same symbol but different colors.
218x251mm (300 x 300 DPI)
Page 25 of 25
John Wiley & Sons, Inc.
American Journal of Physical Anthropology
123456789101112131415161718192021222324252627282930313233343536373839404142434445464748495051525354555657585960

Figure 3. Dendrograms of metameric variation in EDJ shape, between comparative pair P3-P4 (A), M1-M2 (B), and M2-M3 (C), using Ward’s method and squared Euclidean distances. Scales from 0 to 25 indicate
phenetic similitude. Different tooth positions are indicated using different colors. 139x101mm (300 x 300 DPI)
Page 26 of 25
John Wiley & Sons, Inc.
American Journal of Physical Anthropology
123456789101112131415161718192021222324252627282930313233343536373839404142434445464748495051525354555657585960
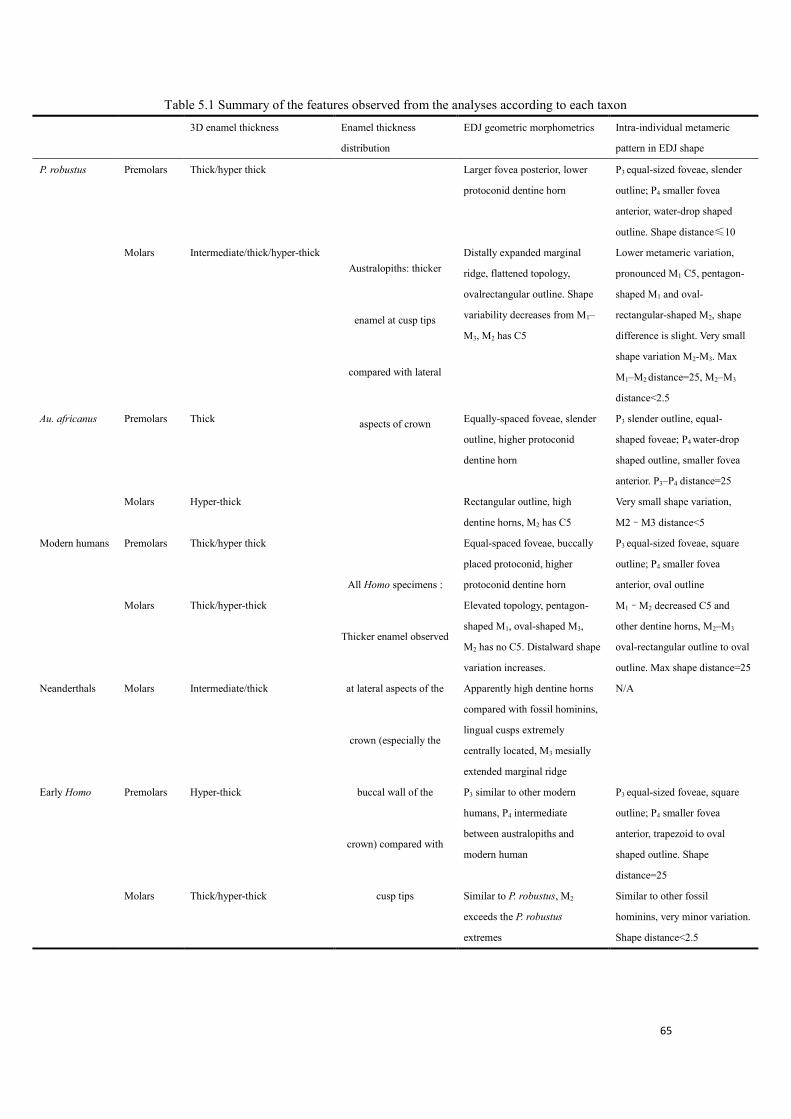
65
Table 5.1 Summary of the features observed from the analyses according to each taxon
3D enamel thickness Enamel thickness
distribution
EDJ geometric morphometrics Intra-individual metameric
pattern in EDJ shape
P. robustus Premolars Thick/hyper thick
Australopiths: thicker
enamel at cusp tips
compared with lateral
aspects of crown
Larger fovea posterior, lower
protoconid dentine horn
P3 equal-sized foveae, slender
outline; P4 smaller fovea
anterior, water-drop shaped
outline. Shape distance≤10
Molars Intermediate/thick/hyper-thick Distally expanded marginal
ridge, flattened topology,
ovalrectangular outline. Shape
variability decreases from M1–
M3, M2 has C5
Lower metameric variation,
pronounced M1 C5, pentagon-
shaped M1 and oval-
rectangular-shaped M2, shape
difference is slight. Very small
shape variation M2-M3. Max
M1–M2 distance=25, M2–M3
distance<2.5
Au. africanus Premolars Thick Equally-spaced foveae, slender
outline, higher protoconid
dentine horn
P3 slender outline, equal-
shaped foveae; P4 water-drop
shaped outline, smaller fovea
anterior. P3–P4 distance=25
Molars Hyper-thick Rectangular outline, high
dentine horns, M2 has C5
Very small shape variation,
M2–M3 distance<5
Modern humans Premolars Thick/hyper thick
All Homo specimens :
Thicker enamel observed
at lateral aspects of the
crown (especially the
buccal wall of the
crown) compared with
cusp tips
Equal-spaced foveae, buccally
placed protoconid, higher
protoconid dentine horn
P3 equal-sized foveae, square
outline; P4 smaller fovea
anterior, oval outline
Molars Thick/hyper-thick Elevated topology, pentagon-
shaped M1, oval-shaped M3,
M2 has no C5. Distalward shape
variation increases.
M1–M2 decreased C5 and
other dentine horns, M2–M3
oval-rectangular outline to oval
outline. Max shape distance=25
Neanderthals Molars Intermediate/thick Apparently high dentine horns
compared with fossil hominins,
lingual cusps extremely
centrally located, M3 mesially
extended marginal ridge
N/A
Early Homo Premolars Hyper-thick P3 similar to other modern
humans, P4 intermediate
between australopiths and
modern human
P3 equal-sized foveae, square
outline; P4 smaller fovea
anterior, trapezoid to oval
shaped outline. Shape
distance=25
Molars Thick/hyper-thick Similar to P. robustus, M2
exceeds the P. robustus
extremes
Similar to other fossil
hominins, very minor variation.
Shape distance<2.5

66
5.1 The taxonomical/adaptive values of enamel thickness
We observed considerable overlap of enamel thickness between groups. Thick molar enamel in
modern humans is the result of a unique odontogenetic process: a reduction of tooth size by decreasing
the quantity of the coronal dentine, instead of functional/adaptive mechanisms (Grine, 2002, 2005b), and
therefore has a limited value for hominin taxonomy (Smith et al., 2012; Skinner et al., 2015). An
activator–inhibitor model has been proposed to explain the distalward molar size reduction/enamel
thickness increase, based on the developmental inhibitory cascade mechanism: higher or lower relative
inhibition yields smaller or larger posterior molars, a decrease in mesenchymal activation drives the
change in tooth proportions in genus Homo (Kavanagh et al., 2007; Evans et al., 2016). However, such
developmental loss of coronal dentine and molar crown size is perhaps not presented in Neanderthals, as
Neanderthal molars are comprised of less enamel and more dentine than extant humans (Olejniczak et
al., 2008a). In addition, Neanderthals show a more complex EDJ surface, with about 10% greater area
than modern humans (Macchiarelli et al., 2006), resulting in thinner enamel thickness. To sum up, while
enamel thickness is no longer a reliable indicator of hominin taxa or dietary adaptation, developmental
parameters and enamel microstructure (e.g., Hunter-Schreger band) need to be examined in an attempt
to explain the mechanisms of changes in enamel thickness (Beynon and Wood, 1986, 1987; Beynon and
Dean, 1988; Dean, 1988).
Schwartz (2000) noted that the distribution of enamel thickness could be a strong taxonomical and
functional indicator, the relationship of molar enamel distribution and taxonomy/dietary adaptation has
been subsequently recorded with 2D and 3D methods, indicating tooth functions may be better
understood in terms of 3D distribution of crown enamel, rather than from enamel thickness indices
extracted from a single section plane (Macho and Thackeray, 1993; Kono, 2004; Kono and Suwa, 2008;

67
Olejniczak et al., 2008b; Suwa et al., 2009; Skinner et al., 2015). Our observation on the whole-crown
enamel thickness distribution of australopiths and Homo molars is consistent with previous 3D
observations that australopith molar enamel was thickest over cusp tips (Olejniczak et al., 2008b),
although 2D studies often find thickest enamel in the occlusal basin (Macchiarelli et al., 2004; Skinner
et al., 2015). The comparative data of East African australopiths and Homo is still needed. The early
Homo molars sampled in this study share a similar distribution pattern with H. erectus and extant H.
sapiens, where the thickest enamel is commonly found on the lateral aspects of a cusp, around cusp bases,
and at the buccal aspect of hypoconulid, rather than the occlusal aspect of the crown (Grine, 2005b;
Olejniczak et al., 2008b; Zanolli, 2015). In addition, we newly describe the premolar enamel thickness
distribution of australopiths, early Homo and extant human, the distribution patterns are consistent with
previous and present observations on molars of these groups. We also observe thicker enamel along or at
the end of marginal ridges and crests in Homo specimens, together with proportionately thicker enamel
on the cuspal-lateral surfaces of the “functional” cusps. This may prolong functional crown life by
dispersing masticatory forces and by preventing cusp fracture, rather than being an adaption to
hard/abrasive object feeding (Macho and Spears, 1999; Grine, 2005b). Moreover, studies on dental
biomechanics in human molars suggest marginal ridges might be highly stress-bearing areas (Benazzi et
al., 2013), indicating that our observed differences in enamel distribution along marginal ridges between
Homo and australopiths could reflect differences in food processing. As has been suggested, the occlusal
topology like the presence of grooves and crests, and the cusp sharpness, might have more important
biomechanical implications than enamel thickness (Benazzi et al., 2013; Berthaume, 2014; Berthaume
et al., 2014), extending the analyses of enamel thickness distribution to occlusal topology could therefore
offer some insights into the feeding mechanics and dietary adaptation of fossil hominins. The presence
68
of highly similar enamel thickness distribution pattern among early Homo and more advanced members
of the genus Homo postcanine dentition suggests that this dietary or functional adaptation has emerged
along the origin of the Homo lineage. On the other hand, thick cuspal enamel exhibited along the
postcanine dentition of australopiths could be an adaptation to increase the attritional longevity of wear
facets in response to abrasive diet (Lucas et al., 2008). Studies on enamel thickness in other mammals
such as cave bears also support that thick enamel could be considered as an adaptation to hard and
abrasive vegetarian food source, while thin enamel could indicate an exclusive carnivorous diet
(Mackiewicz et al., 2010). Genetic studies suggest that human tooth enamel development gene could
implicate in the adaptive evolution of the human species (Daubert et al., 2016), thinner enamel is
subjected to caries as modern diet relies higher on refined carbohydrates.
Our results on enamel thickness distribution are in line with previous studies demonstrating
diversified dietary habits between P. robustus and early Homo, and the more specialized masticatory
apparatus of P. robustus (Laden and Wrangham, 2005; Balter et al., 2012). As stated by Villmoare et al.
(2015), genus Homo may arise at ca 2.8 Ma (but see Hawks et al., 2015), further investigations on enamel
thickness distribution in early Homo species in East Africa may yield a better understanding of the
evolutionary trend and adaptive significance on enamel thickness distribution of early Homo, the
combination of developmental and biomechanical perspective is needed to investigate the evolution of
enamel thickness in hominins, and our database on enamel thickness and its distribution pattern could
offer some insights into the affinity of specific taxonomically uncertain specimens.

69
5.2 What does 3D-EDJ shape tell us?
A nonmetric analysis of mandibular premolars between “robust” and “non-robust” Australopithecus
(based on features like cusp positions, transverse crest prominence) suggests that morphological
differences between these two groups are more conspicuous in P3s than in P4s (Suwa, 1988). Our results
confirm this morphological correspondence on the EDJ level.
Our observed differences between P. robustus and Au. africanus molars in dentine horn height,
relative dentine horn positions, and EDJ outline, have already been reported (Robinson, 1956; Suwa et
al., 1996; Olejniczak et al., 2008a; Skinner et al., 2008b). However, we observe a transitional feature on
the EDJ level, along the postcanine dentition of our early Homo sample. In particular, premolars of early
Homo show EDJ shapes that are closely approximating the extant human conformation, with equal-sized
foveae anterior and posterior, and higher protoconid dentine horns, while the molars show a relatively
low EDJ topology associated to a mesiodistally elongated occlusal basin, to some extent reminiscent of
the primitive hominin condition (Macchiarelli et al., 2004; Skinner et al., 2008b; Braga et al., 2010). It
should be noted that we have only three individuals representing the early Homo, due to small sample
size, it is too early to make any conclusive generalization, and possibilities are such trend observed here
is a variation between individuals. On the other hand, similar primitive features are also exhibited at the
lower molars of some African H. erectus/ergaster and H. heidelbergensis, while Javanese H. erectus
displays derived morphology approximating the modern human condition (Zanolli et al., 2014; Zanolli,
2015). As shown by other studies, the molar EDJ shape is rather taxonomically indicative among
hominins (e.g., Corruccini, 1987; Skinner et al., 2008b). However, while the premolars of South African
early Homo show closer affinities to extant humans, its molars certainly cluster with the australopith
condition. Moreover, when upper second molar EDJ of early Homo distinguishes well with australopiths

70
(Fornai et al., 2015), we found the lower molars are much closer to australopith condition.
Previous studies demonstrated that molar cusp sizes could be valuable in the assessment of the
taxonomic affinities of hominin fossils (Suwa, 1988; Suwa et al., 1994; Bailey, 2004). Based on the
comparative study of permanent molar cusp areas of South and East African early Homo, Grine et al.
(2009) suggested that “the South African fossils tend to have closer phenetic resemblances among
themselves, regardless of derivation, than with East African specimens attributed to either H. habilis or
H. erectus”, and South African early Homo may represent unique species other than Plio-Pleistocene
early Homo in East Africa.
A study on molar GM in capuchins suggests that molar shapes reflect different influences depending
on molar position (i.e. M1 represents phylogenetic affinities and M2 indicates biogeographic variability)
(Delgado et al., 2015). Indeed, previous studies of mammalian dental variation have already
demonstrated that the stability of molar morphology is highly dependent on tooth position (Gómez-
Robles et al., 2007, 2011), probably due to differences in biomechanical demands and the magnitude of
biting forces involved in food processing (Spencer, 2003). Our observed differential expression of EDJ
morphology in hominin postcanine dentition related to tooth position could also, therefore, represent
different evolutionary factors as well.
We observed that along the postcanine dentition in P. robustus, there is a decrease of EDJ shape
variability, the intra-individual metameric variation is also weaker in M2-M3 compared with M1-M2. In
contrast, H. sapiens has a distalward increase of the EDJ shape variability, and an increase of intra-
individual metameric variation. Our available Neanderthal sample does not permit an intra-individual
comparison, but we assume that the intra-individual shape variation in Neanderthals could be equal to,
or even greater than modern humans. It has been suggested that in modern humans, the inter-individual
71
differences are larger for the M2s than for the M1s (Braga et al., 2010), this observation is in line with the
distalward molar size reduction seen in Pleistocene humans (Brace and Mahler, 1971; Brace et al., 1987;
Bermúdez de Castro and Nicolas, 1995; Evans et al., 2016), it is reasonable to assume that smaller tooth
size is connected to highly unstable shapes. We observe this trend in extant humans, with the inclusion
of Neanderthal sample (Fig. 4.9), but we do not observe a significant increase of shape variability from
M1 to M2, in other GM analyses (i.e., intra-individual metameric variation and EDJ shape variation of a
given tooth position without Neanderthals). Instead, significant larger shape variation is shown in modern
human M3 compared with M1 and M2, remarkable intra-individual variation is also seen in M2–M3,
compared with M1–M2.
It has been pointed out that metameric variaiton serves as a key for linking the morphology to the
development (Weiss, 1990; Braga et al., 2010; Singleton et al., 2011). Furthermore, metameric variation
could also be used to infer ecological and functional adaptations (Hlusko, 2002; Kavanagh et al., 2007;
Polly, 2007). As revealed by geometric morphometric analyses, in fossil hominins, there is a distalward
reduction of shape variation along lower dentition. In modern humans, while the magnitude of P3–P4
shape variation is comparable to fossil hominins, the M2–M3 shape variation is much stronger owing to
a highly varied M3 shape, this is in line with previous study using morphometric mapping and modern
human upper EDJs (Morita et al., 2016), and could be explained as a consequence of developmental
processes described by the inhibitory cascade model (Kavanagh et al., 2007; Evans et al., 2016), which
suggests that the developmental processes of a molar row may produce cumulative effects of local
epigenetic events, particularly on the third molar, which forms last. Braga et al. (2010) noticed a
significantly enlarged distal margin in Au. africanus P4 than P3, we suggest it is globally viewed in our
fossil and modern samples, although degrees vary. We first observe that the early Homo and Au. africanus

72
premolars have very close metameric pattern in EDJ, they are situated between groups of modern human
and P. robustus. In accordance with observations made by Skinner et al. (2008b), a small-scale, distal
expansion of the marginal ridge is seen in M2–M3s of P. robustus, we also observed such trend in a
number of modern human specimens, whose M3s are located at the lower part of bgPC1 plot, compared
with M2s (Fig. 4.10C). Distal expansion of the marigial ridge is weak in our early Homo and Au. africanus,
which is consistent with Skinner (2008)’s observation of Au. africanus, but due to our small sample size,
it is difficult to conclude the presence and degree of such ridge expansion in early Homo. We find
common metameric variations in fossil and modern specimens, but the degree of variation is relatively
subtle in fossil species. On the other hand, EDJ shape in fossil species shows a distalwardly increased
similarity (i.e., posterior molars show minor intra-individual variation and shape distance), clearly
distinguish from extant humans, may support the observations that at least some distinctive modern
human metameric patterns had not evolved in the times of Sterkfontein Member 4 (and Swartkrans
Members 1 and 2) (Hlusko, 2002; Braga et al., 2010). But we did not identify specific metameric patterns
within each comparative pair that are strictly associated with modern humans: what we observed in each
bgPCA is rather an enlarged shape distance in modern humans compared with fossil species. Admittedly,
small sample size prevents a broad generalization, what we could say is our early Homo specimen, SK
15, displays a relatively small metameric distance, which is closer to South African australopiths than to
modern humans. The Au. africanus and early Homo present similar metameric patterns, which are closer
to extant humans in M2–M3s.
While metamerism in EDJ shape could be a useful indicator of tooth position in modern human
postcanine dentition, we demonstrate it has less distinctive power in our South African hominin molars,
as our fossil sample has developed distal cusps along molar dentition. Small degree of shape variability
73
is viewed in fossil hominin M2–M3, suggesting the metameric distinctions lies more on size differences.
A relatively strong and constant metameric pattern is veiwed in fossil and modern premolars, it can be
used as a basis for identifying dental positions.
Previous study on the biomechanical implications of EDJ topology suggests, the grooves, fissures
and crests might act to increase the structural stiffness of the tooth, as they are the stress-bearing features
(Benazzi et al., 2011) This supports the hypothesis that a strong expression of the protostylid in Au.
africanus molar EDJ could reinforce the crown, a suggested dietary adaptation (Skinner et al., 2009).
Previous studies also correlated enamel thickness, EDJ shape, and diet (Martin, 1983; Macchiarelli et al.,
2006; Suwa et al., 2007; El Zaatari et al., 2011), but enamel thickness and EDJ shape are not necessarily
connected (Smith et al., 2006). Relatively tall dentine horn tips might be associated with thin enamel in
Gorilla molars, as both characters are related to folivory (Martin, 1983), while a relatively flat dentine
horn tip and thick enamel suggest a concurrent adaptation to hard and/or abrasive food items (Suwa et
al., 2007). Nevertheless, further studies on paleodiet, biomechanics and EDJ surface complexity are
needed to enrich our understandings of EDJ morphology and dietary adaptations. Modern humans
underwent different dental developmental process compared with early hominins (Dean et al., 2001),
such differences may be represented in morphological patterns: the distalward reduction of molar crown
size and relatively thicker enamel of human distal molars (e.g., Grine, 2005b), similar metameric patterns
shared among our early Homo, Au. africanus and modern human EDJs could probably relate to
dietary/functional adaptation. However, more evidence is needed to generalize the EDJ shape variation
in fossil hominin groups.
74
5.3 Perspectives
Computer-aided, high resolution virtual imaging coupled with 3D inner structural analyses of dental
tissue have the potential for allowing more accurate inter-group comparisons than those uniquely based
on outer enamel morphology, or natural, histological sections of teeth. Our attempt to characterize the
lower postcanine inner structure of the South African early Homo sample faced the unavoidable limits
represented by the preservation conditions and small sample size. Nonetheless, it is noteworthy that few
studies have attempted to investigate such materials representing a group with a scarce fossil record,
using micro-CT techniques and tools of virtual paleontology (e.g., Smith et al., 2012; Fornai et al., 2015;
Skinner et al., 2015). Further studies could focus on following aspects:
(1) The enlargement of sample size, to older East African H. erectus and H. habilis, and to
investigate the possible kinship between East and South African early Homo linage.
(2) Inner features other than EDJ ridge curves, e.g., the grooves and ridges which are not examined
in this thesis (the expression of protostylid for example). Moreover, this thesis did not look into morpho-
structural evidence of pulp chamber and root configuration, previous studies demonstrated that
corresponding structures between pulp chamber and OES could be worth noting (Zanolli, 2015), and
premolar root and canal variation highlights taxonomical differences between Au. africanus and P.
robustus (Moore et al., 2016). Studies on the protostylid expression at the EDJ, the pulp chamber
morphology and root traits tolerate substantially worn teeth (SK 45 for example), as South African early
Homo has few well-preserved fossil records, attempts on these aspects will enlarge the sample size and
extract new information that is no longer preserved in the worn crown.
(3) A global and quantitative analysis of shape variation among early hominins based on the whole
OES/EDJ surface and diffeomorphisms (e.g., Beaudet et al., 2016; Braga, 2016; Morita et al., 2016) will
75
supplement our understanding on the variation of hominin dentition.
(4) Enlarge the sample size to other dental positions of South African early Homo. For example, the
comparative studies between the cranial fragments of SK 847 and a series of Oldowai Homo attributed
the former to H. habilis (Clarke et al., 1970; Clarke, 1978), and cladistic analysis of early hominin
relationships (Strait et al., 1997) also placed SK 847 in H. habilis, together with three other Swartkrans
specimens (SK 15, SK 27, SK 45). Further investigations on the inner structure of anterior, upper (e.g.,
SK 27 and 847) and deciduous dentition (e.g., SKX 267 and 1756) will provide a global view of the
dental morphology and development of South African early Homo.
(5) The assessment of relationships between chronologically successive Homo samples from
Swartkrans Member 1 and Member 2. There is a shift from Oldowan to Acheulean technology from
Member 1 to Member 2, at ~1.5 ma, which supports the hypothesis that Member 1 contains H. habilis
rather than H. ergaster (Sutton, 2012). On the other hand, metrical comparison between the dental
remains of Member 1, 2 and 3 Paranthropus revealed no discernible tendencies for morphological of
metrical change (Grine, 1988, 1993), but (possible) time-related morphological differences throughout
the time of Swartkrans deposition in early Homo still needs to be investigated.
76
6. CONCLUSION
The 3D enamel thickness observed in this thesis supported previous ideas that enamel thickness
has limited taxonomic value in hominins. Whole-crown enamel thickness distribution pattern can yield
important evidence for dietary adaptation. We conclude that thicker enamel at the cusp bases and on the
lateral aspects of cusps observed in modern human and some fossil Homo (Grine, 2005b; Olejniczak et
al., 2008b; Zanolli et al., 2014) has already appeared in some of the earliest members of the genus Homo,
suggesting a different occupation of dietary niche as compared with South African australopiths.
However, our findings of whole-crown enamel distribution are restricted to qualitative description,
without statistical evaluation, interpretations based on whole-crown enamel distribution should be
undertaken with caution.
Enamel dentine junction morphology may provide information that is independent of the OES, this
thesis has confirmed that the enamel-dentine junction can be useful for taxonomic comparisons. While
mosaic features are evident throughout the history of human evolution, especially in transitional species
(e.g., Kivell et al., 2011; Villmoare et al., 2015), it is not surprising that South African early Homo teeth
show a mix of australopith (flattened and elongated EDJ morphology) and Homo-like (premolar EDJ
morphology) characters. Our early Homo specimens, SKX 21204 and SK 15, show similar degree and
pattern of metamerism to our Au. africanus specimen Sts 52. And we newly report that the metameric
patterns on the 3D-EDJ in premolars can be a useful indicator of dental position. Compared with modern
humans, the degree of intra-individual metameric variation in fossil hominin molars is relatively small
and constant, but similar trends were captured between fossil and modern 3D-EDJ shapes. However,
given the lack of early Homo materials, and biomechanical and developmental information about the
EDJ topology, the evolutionary/adaptive significance of our findings on the similarities of EDJ
77
morphologies along postcanine dentitions between early Homo, australopiths and extant humans remains
to be explained in depth. As modern human has experienced different developmental mechanism than in
early thick-enameled hominins (probably linked to a prolonged lifespan and ontogenetic period), and the
fact that neoteny has played an important role in human evolution, the distalward reduction of molar size
(Grine, 2002; Evans et al., 2016), and the distalward increase of enamel thickness (Grine, 2005b),
together with the higher intra-individual metameric variation in M2-M3 compared with M1-M2 observed
here, could be all related to same developmental factors. But the interpretation of the evidence for a
certain degree of similarity between South African Homo in Early Pleistocene and modern human is still
open. It has been suggested that for the Early and Middle Pleistocene African fossil record, the temporal
variations of morphological dental trait distribution have not yet undergone the scrutiny of theoretical
evolutionary models (Zanolli et al., 2014). Recent discoveries of Homo naledi largely enriches the Homo
fossil record (Berger et al., 2015; Dembo et al., 2016). While we observed a complex occlusal surface in
our unworn early Homo specimens, H. naledi lower postcanines shows a complex occlusal surface in
premolars, but a rather simple topology in molars. As the Bayesian phylogenetic techniques reveal a
geological age of H. naledi at 912 ka (Dembo et al., 2016), which is roughly equivalent to or slightly
younger than Swartkrans Member 3 (Balter et al., 2008; Gibbon et al., 2014), therefore a comparative
study of dental inner structure of H. naledi will fulfil our understanding of the Homo lingeage in South
Africa. Our results indicate that premolar EDJ morphology has more discriminatory power when
distinguishing genus Homo (including Neanderthal) from australopiths, it is tempting to agree that some
taxonomically distinctive features presented in the premolars of extant humans have already appeared
with the early members of the genus Homo, and molar EDJ shapes are highly diversified within the genus
Homo. While most studies of EDJ morphology are focused on molars, few investigations established the

78
variations of premolar EDJ morphology, and its contribution to understanding the taxonomy needs to be
examined with other Plio-Pleistocene hominin species.

79
LITERATURE CITED
Antón, S.C., 2012. Early Homo : Who, When, and Where. Curr. Anthropol. 53, S278–S298. Bailey, S.E., 2004. A morphometric analysis of maxillary molar crowns of Middle-Late Pleistocene hominins. . J. Hum. Evol. 47, 183–198. Bailey, S.E., Hublin, J.-J., 2007. Dental Perspectives on Human Evolution: State of the Art Research in Dental Paleoanthropology. Springer, Dordrecht. Bailey, S.E., Skinner, M., Hublin, J.-J., 2011. What lies beneath? An evaluation of lower molar trigonid crest patterns based on both dentine and enamel expression. Am. J. Phys. Anthropol. 145, 505–518. Bailey, S.E., Benazzi, S., Souday, C., Astorino, C., Paul, K., Hublin, J.-J., 2014. Taxonomic differences in deciduous upper second molar crown outlines of Homo sapiens, Homo neanderthalensis and Homo erectus. J. Hum. Evol. 72, 1–9. Balter, V., Blichert-Toftv, J., Braga, J., Telouk, P., Thackeray, F., Albarède, F., 2008. U-Pb dating of fossil enamel from the Swartkrans Pleistocene hominid site, South Africa. Earth Planet. Sci. Lett. 267, 236–246. Balter, V., Braga, J., Télouk, P., Thackeray, J.F., 2012. Evidence for dietary change but not landscape use in South African early hominins. Nature 489, 558–560. Beaudet, A., 2015. Caractérisation des structures crânio-dentaires internes des cercopithécoïdes et étude diachronique de leurs variations morphologiques dans la séquence Plio-Pléistocène sud-africaine. Ph. D. Dissertation, Université de Toulouse. Beaudet, A., Braga, J., de Beer, F., Schillinger, B., Steininger, C., Vodopivec, V., Zanolli, C., 2015. Neutron microtomography‐based virtual extraction and analysis of a cercopithecoid partial cranium (STS 1039) embedded in a breccia fragment from Sterkfontein member 4 (South Africa). Am. J. Phys. Anthropol. Beaudet, A., Dumoncel, J., Thackeray, F., Bruxelles, L., Duployer, B., Tenailleau, C., Bam, L., Hoffman, J., de Beer, F., Braga, J., 2016. Upper third molar internal structural organization and semicircular canal morphology in Plio-Pleistocene South African cercopithecoids. J. Hum. Evol. 95, 104–120. Ben‐Dor, M., Gopher, A., Barkai, R., 2016. Neandertals' large lower thorax may represent adaptation to high protein diet. Am. J. Phys. Anthropol. Benazzi, S., Kullmer, O., Grosse, I.R., Weber, G.W., 2011. Using occlusal wear information and finite element analysis to investigate stress distributions in human molars. J. Anat. 219, 259–272. Benazzi, S., Nguyen, H.N., Kullmer, O., Hublin, J.-J., 2013. Unravelling the functional biomechanics of dental features and tooth wear. PLoS One 8, e69990. Benazzi, S., Panetta, D., Fornai, C., Toussaint, M., Gruppioni, G., Hublin, J.-J., 2014. Technical Note: Guidelines for the digital computation of 2D and 3D enamel thickness in hominoid teeth. Am. J. Phys. Anthropol. 153, 305–313. Benazzi, S., Slon, V., Talamo, S., Negrino, F., Peresani, M., Bailey, S.E., Sawyer, S., Panetta, D., Vicino, G., Starnini, E., 2015. The makers of the Protoaurignacian and implications for Neandertal extinction. Science 348, 793–796. Berger, L., Hawks, J., de Ruiter, D.J., Churchill, S., Schmid, P., Delezene, L., Kivell, T., Garvin, H., Williams, S., DeSilva, J., Skinner, M., Musiba, C., Cameron, N., Holliday, T., Harcourt-Smith, W., Ackermann, R., Bastir, M., Bogin, B., Bolter, D., Brophy, J., Cofran, Z., Congdon, K., Deane, A., Dembo, M., Drapeau, M., Elliott, M., Feuerriegel, E., Garcia-Martinez, D., Green, D., Gurtov, A., Irish, J., Kruger, A., Laird, M., Marchi, D., Meyer, M., Nalla, S., Negash, E., Orr, C., Radovčić, J., Schroeder, L., Scott,

80
J., Throckmorton, Z., Tocheri, M., VanSickle, C., Walker, C., Wei, P., Zipfel, B., 2015. Homo naledi, a new species of the genus Homo from the Dinaledi Chamber, South Africa. eLife 4, e09560. Berger, L.R., Lacruz, R., de Ruiter, D.J., 2002. Revised age estimates of Australopithecus-bearing deposits at Sterkfontein, South Africa. Am. J. Phys. Anthropol. 119, 192–197. Bermúdez de Castro, J.M., Nicolas, M.E., 1995. Posterior dental size reduction in hominids: the Atapuerca evidence. Am. J. Phys. Anthropol. 96, 335–356. Berthaume, M.A., Dumont, E.R., Godfrey, L.R., Grosse, I.R., 2014. The effects of relative food item size on optimal tooth cusp sharpness during brittle food item processing. J. R. Soc. Interface. 11, 20140965. Berthaume, M.A., 2014. Tooth cusp sharpness as a dietary correlate in great apes. Am. J. Phys. Anthropol. 153, 226–235. Beynon, A., Wood, B., 1986. Variations in enamel thickness and structure in east African hominids. Am. J. Phys. Anthropol. 70, 177–193. Beynon, A., Wood, B., 1987. Patterns and rates of enamel growth in the molar teeth of early hominids. Nature 326, 493–496. Beynon, A., Dean, M.C., 1988. Distinct dental development patterns in early fossil hominids. Nature 335, 509–514. Billy, G., Vallois, H., 1977a. La mandibule pré-Rissienne de Montmaurin. L'Anthropologie 81, 273–312. Billy, G., Vallois, H., 1977b. La mandibule pré-Rissienne de Montmaurin (suite). L'Anthropologie 81, 411–458. Brace, C.L., Mahler, P.E., 1971. Post-Pleistocene changes in the human dentition. Am. J. Phys. Anthropol. 34, 191–203. Brace, C.L., 1979. Krapina,“Classic” Neanderthals, and the evolution of the European face. J. Hum. Evol. 8, 527–550. Brace, C.L., Rosenberg, K.R., Hunt, K.D., 1987. Gradual change in human tooth size in the late Pleistocene and post-Pleistocene. Evolution 41, 705–720. Braga, J., Thackeray, J.F., Subsol, G., Kahn, J.L., Maret, D., Treil, J., Beck, A., 2010. The enamel-dentine junction in the postcanine dentition of Australopithecus africanus: intra-individual metameric and antimeric variation. J. Anat. 216, 62–79. Braga, J., Thackeray, J.F., Dumoncel, J., Descouens, D., Bruxelles, L., Loubes, J.-M., Kahn, J.-L., Stampanon, M., Bam, L., Hoffman, J., de Beer, F., Spoor, F., 2013. A new partial temporal bone of a juvenile hominin from the site of Kromdraai B (South Africa). J. Hum. Evol. 65, 447–456. Braga, J., 2016. In press. The Kromdraai hominins revisited with an updated portray of differences between Australopithecus africanus and Paranthropus robustus, In: Braga, J., Thackeray, F. (Eds.), Kromdraai, a Birthplace of Paranthropus in the Cradle of Humankind. Sun Media Metro, Johannesburg. Braga, J., Thackeray, J.F., Bruxelles, L., Dumoncel, J., Fourvel, J.-B., 2016. Stretching the time span of hominin evolution at Kromdraai (Gauteng, South Africa): Recent discoveries. C. R. Palevol. Brain, C., 1958. The Transvaal ape-man-bearing cave deposits. Transvaal Museum, Pretoria. Brain, C., An interpretation of the bone assemblage from the Kromdraai australopithecine site, South Africa. In: Tuttle, R.H. (Ed.), Paleoanthropology, Morphology and Paleoecology. 1975, Walter de Gruyter, Berlin, pp. 225–243. Brain, C., 1981. The Hunters or the Hunted? University of Chicago Press, Chicago. Brain, C., 1993. The occurrence of burnt bones at Swartkrans and their implications for the control of fire by early hominids, In: Brain, C. (Ed.), Swartkrans: A Cave’s Chronicle of Early Man. Transvaal Museum, Pretoria, pp. 229–242.
81
Broom, R., 1938. The Pleistocene anthropoid apes of South Africa. Nature 142, 377–379. Broom, R., 1949. Another new type of fossil ape-man. Nature 163, 57. Broom, R., Robinson, J.T., 1949. A new type of fossil man. Nature 164, 322–323. Broom, R., Robinson, J.T., 1950. Note on the Skull of the Swartkrans Ape-Man, Paranthropos crassidens. Am. J. Phys. Anthropol. 8, 295–304. Broom, R., Robinson, J.T., 1952. Swartkrans ape-man, Paranthropus crassidens. Trans. Mus. Mem. No. 6, 1–124. Brown, P., Sutikna, T., Morwood, M.J., Soejono, R.P., Saptomo, E.W., Due, R.A., 2004. A new small-bodied hominin from the Late Pleistocene of Flores, Indonesia. Nature 431, 1055–1061. Bruxelles, L., Braga, J., Couzens, R., Duranthon, F., Maire, R., Orthga, R., Roudeau, S., Thackeray, F., 2014, Geomorphologyand stratigraphy of the Kromdraai hominin site, Gauteng, South Africa: New excavation and new results, The African Human Fossil Record. Toulouse, France. Butler, P., 1956. The ontogeny of molar pattern. Biol. Rev. 31, 30–69. Carayon, D., Vaysse, F., Tramini, P., Dumoncel, J., Esclassan, R., 2015. The age-related maturational pattern of the human subarcuate fossa (petromastoid canal). Preliminary results from the application of a new three-dimensional analytical approach. C. R. Palevol 14, 139–145. Clarke, R., Howell, F.C., Brain, C., 1970. More evidence of an advanced hominid at Swartkrans. Nature 225, 1219–1222. Clarke, R., Howell, F.C., 1972. Affinities of the Swartkrans 847 hominid cranium. Am. J. Phys. Anthropol. 37, 319–335. Clarke, R., 1985a. Australopithecus and early Homo in Southern Africa, In: Delson, E. (Ed.), Ancestors: The Hard Evidence. Alan R. Liss, New York, pp. 171–177. Clarke, R., Early acheulean with Homo habilis at Sterkfontein. In: Tobias, P.V. (Ed.), Hominid evolution: Past, Pesent and Future. 1985b, Alan R. Liss, New York, pp. 287–298. Clarke, R., 1994a. On some new interpretations of Sterkfontein stratigraphy. S. Afr. J. Sci. 90, 211–214. Clarke, R., 1994b. The significance of the Swartkrans Homo to the Homo erectus problem. Cour. Forsch. Inst. Senckenberg 171, 185–193. Clarke, R.J., 1978. The Cranium Of The Swartkrans Hominid, SK 847, and Its Relevance to Human Origins. Ph. D. Dissertation, University of the Witwatersrand. Corruccini, R., 1987. The dentinoenamel junction in primates. Int. J. Primatol. 8, 99–114. Curnoe, D., 2001. Early Homo from southern Africa: a cladistic perspective. S. Afr. J. Sci. 97, 186. Curnoe, D., Tobias, P.V., 2006. Description, new reconstruction, comparative anatomy, and classification of the Sterkfontein Stw 53 cranium, with discussions about the taxonomy of other southern African early Homo remains. J. Hum. Evol. 50, 36–77. Curnoe, D., 2006. Odontometric systematic assessment of the Swartkrans SK 15 mandible. Homo 57, 263–294. Curnoe, D., 2008. Affinities of the Swartkrans early Homo mandibles. Homo 59, 123–147. Curnoe, D., 2010. A review of early Homo in southern Africa focusing on cranial, mandibular and dental remains, with the description of a new species (Homo gautengensis sp. nov.). Homo 61, 151–177. Dahlberg, A.A., 1945. The changing dentition of man. J. Am. Dent. Assoc. 32, 676–690. Daubert, D.M., Kelley, J.L., Udod, Y.G., Habor, C., Kleist, C.G., Furman, I.K., Tikonov, I.N., Swanson, W.J., Roberts, F.A., 2016. Human enamel thickness and ENAM polymorphism. Int. J. Oral. Sci. Dean, C., Leakey, M.G., Reid, D., Schrenk, F., Schwartz, G.T., Stringer, C., Walker, A., 2001. Growth processes in teeth distinguish modern humans from Homo erectus and earlier hominins. Nature 414, 628–
82
631. Dean, M.C., 1988. Growth of teeth and development of the dentition in Paranthropus, Evolutionary History of the “Robust” Australopithecines. Aldine de Gruyter New York, pp. 43–53. Debénath, A., 1977. The latest finds of antéwürmian human remains in Charente (France). J. Hum. Evol. 6, 297–302. Delgado, M.N., Galbany, J., Górka, K., Pérez-Pérez, A., 2015. Taxonomic implications of molar morphology variability in Capuchins. Int. J. Primatol. 36, 707–727. Delson, E., 1984. Cercopithecid biochronology of the African Plio-Pleistocene: correlation among eastern and southern hominid-bearing localities. Cour. Forsch. Inst. Senckenberg 69, 199–218. Delson, E., 1988. Chronology of South African australopiths site units, In: Grine, F. (Ed.), Evolutionary History of the "Robust" Australopithecines. Aldine de Gruyter, New York, pp. 317–324. Dembo, M., Radovčić, D., Garvin, H.M., Laird, M.F., Schroeder, L., Scott, J.E., Brophy, J., Ackermann, R.R., Musiba, C.M., de Ruiter, D.J., Mooers, A.Ø., Collard, M., 2016. The evolutionary relationships and age of Homo naledi: An assessment using dated Bayesian phylogenetic methods. J. Hum. Evol. 97, 17–26. El Zaatari, S., Grine, F., Ungar, P.S., Hublin, J.-J., 2011. Ecogeographic variation in Neandertal dietary habits: evidence from occlusal molar microwear texture analysis. J. Hum. Evol. 61, 411–424. Evans, A.R., Daly, E.S., Catlett, K.K., Paul, K.S., King, S.J., Skinner, M.M., Nesse, H.P., Hublin, J.-J., Townsend, G.C., Schwartz, G.T., 2016. A simple rule governs the evolution and development of hominin tooth size. Nature 530, 477–480. Fornai, C., Benazzi, S., Svoboda, J., Pap, I., Harvati, K., Weber, G.W., 2014. Enamel thickness variation of deciduous first and second upper molars in modern humans and Neanderthals. J. Hum. Evol., 83–91. Fornai, C., Bookstein, F.L., Weber, G.W., 2015. Variability of Australopithecus second maxillary molars from Sterkfontein Member 4. J. Hum. Evol. 85, 181–192. Gómez-Robles, A., Martinón-Torres, M., De Castro, J.B., Margvelashvili, A., Bastir, M., Arsuaga, J.L., Pérez-Pérez, A., Estebaranz, F., Martínez, L.M., 2007. A geometric morphometric analysis of hominin upper first molar shape. J. Hum. Evol. 53, 272–285. Gómez-Robles, A., Olejniczak, A.J., Martinón-Torres, M., Prado-Simón, L., Bermúdez de Castro, J.M., 2011. Evolutionary novelties and losses in geometric morphometrics: a practical approach through hominin molar morphology. Evolution 65, 1772–1790. Galway-Witham, J., 2016. “What’s in a name?” The taxonomy & phylogeny of early Homo. PIA 25. Gibbon, R.J., Pickering, T.R., Sutton, M.B., Heaton, J.L., Kuman, K., Clarke, R.J., Brain, C., Granger, D.E., 2014. Cosmogenic nuclide burial dating of hominin-bearing Pleistocene cave deposits at Swartkrans, South Africa. Quat. Geochronol. 24, 10–15. Girard, M., 1973. La brèche à "Machairodus" de Montmaurin (Pyrénées centrales). Bulletin de l'AFEQ 3, 193–207. Granger, D.E., Gibbon, R.J., Kuman, K., Clarke, R.J., Bruxelles, L., Caffee, M.W., 2015. New cosmogenic burial ages for Sterkfontein Member 2 Australopithecus and Member 5 Oldowan. Nature 522, 85–88. Grine, F.E., Martin, L., 1988. Enamel thickness and development in Australopithecus and Paranthropus, In: Grine, F.E. (Ed.), Evolutionary History of the “Robust” Australopithecines. Aldine de Gruyter, New York, pp. 3–42. Grine, F.E., 1988. New craniodental fossils of Paranthropus from the Swartkrans formation and their significance in "robust" australopithecine evolution, In: Grine, F.E. (Ed.), Evolutionary History of the
83
"Robust" Australopithecines. Aldine de Gruyter, New York, pp. 223–243. Grine, F.E., 1989. New hominid fossils from the Swartkrans formation (1979-1986 excavations): craniodental specimens. Am. J. Phys. Anthropol. 79, 409–449. Grine, F.E., Daeglin, D.J., 1993. New mandible of Paranthropus robustus from Member 1, Swartkrans Formation, South Africa. J. Hum. Evol. 24, 319–333. Grine, F.E., Demes, B., Jungers, W.L., Cole, T., 1993. Taxonomic affinity of the early Homo cranium from Swartkrans, South Africa. Am. J. Phys. Anthropol. 92, 411–426. Grine, F.E., 1993. Description and preliminary analysis of new hominid craniodental fossils from the Swartkrans formation, In: Brain, C.K. (Ed.), Swartkrans: A Cave’s Chronicle of Early Man. Transvaal Museum, Pretoria, pp. 75–116. Grine, F.E., 2002. Scaling of tooth enamel thickness, and molar crown size reduction in modern humans: research letter. S. Afr. J. Sci. 98, 503–509. Grine, F.E., 2005a. Early Homo at Swartkrans, South Africa: a review of the evidence and an evaluation of recently proposed morphs. S. Afr. J. Sci. 101, 43–52. Grine, F.E., 2005b. Enamel thickness of deciduous and permanent molars in modern Homo sapiens. Am. J. Phys. Anthropol. 126, 14–31. Grine, F.E., Smith, H.F., Heesy, C.P., Smith, E.J., 2009. Phenetic affinities of Plio-Pleistocene Homo fossils from South Africa: molar cusp proportions, In: Grine, F.E., Fleagle, J.G., Leakey, R.E. (Eds.), The First Humans–Origin and Early Evolution of the Genus Homo. Springer, Berlin, pp. 49–62. Guy, F., Lazzari, V., Gilissen, E., Thiery, G., 2015. To what extent is primate second molar enamel occlusal morphology shaped by the enamel-dentine junction? PLoS One 10, e0138802. Hammer, Ø., Harper, D., Ryan, P., 2001. PAST: Paleontological Statistics Software Package for Education and Data Analysis. Palaeontol. Electron. 4, 19. Hawks, J., de Ruiter, D.J., Berger, L.R., 2015. Comment on “Early Homo at 2.8 Ma from Ledi-Geraru, Afar, Ethiopia”. Science 348, 1326. Hlusko, L., 2002. Identifying metameric variation in extant hominoid and fossil hominid mandibular molars. Am. J. Phys. Anthropol. 118, 86–97. Hoffman, J.W., de Beer, F., 2012. Characteristics of the micro-focus X-ray tomography facility (MIXRAD) at Necsa in South Africa. 18th World Conference on Nondestructive Testing, Durban, South Africa, Conference, Location. Kaiser, T.M., Clauss, M., Schulz-Kornas, E., 2015. A set of hypotheses on tribology of mammalian herbivore teeth. Surface Topography: Metrology and Properties 4, 014003. Kavanagh, K.D., Evans, A.R., Jernvall, J., 2007. Predicting evolutionary patterns of mammalian teeth from development. Nature 449, 427–432. Kay, R., 1981. The nut-crackers—a new theory of the adaptations of the Ramapithecinae. Am. J. Phys. Anthropol. 55, 141–151. Kay, R., 1985. Dental evidence for the diet of Australopithecus. A. Rev. Anthropol. 14, 315–341. Keyser, A., Menter, C., Moggi-Cecchi, J., Pickering, T.R., Berger, L., 2000. Drimolen: a new hominid-bearing site in Gauteng, South Africa. S. Afr. J. Sci. 96, 193–197. Kimbel, W.H., 2009. The origin of Homo, In: Grine, F.E., Fleagle, J.G., Leakey, R.E. (Eds.), The First Humans–Origin and Early Evolution of the Genus Homo. Springer, Berlin, pp. 31–38. Kivell, T.L., Kibii, J.M., Churchill, S.E., Schmid, P., Berger, L.R., 2011. Australopithecus sediba hand demonstrates mosaic evolution of locomotor and manipulative abilities. Science 333, 1411–1417. Kono, R., Suwa, G., Tanijiri, T., 2002. A three-dimensional analysis of enamel distribution patterns in

84
human permanent first molars. Arch. Oral. Biol. 47, 867–875. Kono, R., 2004. Molar enamel thickness and distribution patterns in extant great apes and humans, new insights based on a 3-dimensional whole crown perspective. Anthropol. Sci. 112, 121–146. Kono, R., Suwa, G., 2008. Enamel distribution patterns of extant human and hominoid molars: occlusal versus lateral enamel thickness. Bull. Natl. Mus. Nat. Sci. 34, 1–9. Kuman, K., Clarke, R., 2000. Stratigraphy, artefacts, industries and hominid associations for Sterkfontein, Member 5. J. Hum. Evol. 38, 827–847. Lacruz, R.S., Dean, M.C., Ramirez‐Rozzi, F., Bromage, T.G., 2008. Megadontia, striae periodicity and patterns of enamel secretion in Plio‐Pleistocene fossil hominins. J. Anat. 213, 148–158. Laden, G., Wrangham, R., 2005. The rise of the hominids as an adaptive shift in fallback foods: plant underground storage organs (USOs) and australopith origins. J. Hum. Evol. 49, 482–498. Lockwood, C.A., Kimbel, W.H., Johanson, D.C., 2000. Temporal trends and metric variation in the mandibles and dentition of Australopithecus afarensis. J. Hum. Evol. 39, 23–55. Lordkipanidze, D., de León, M.S.P., Margvelashvili, A., Rak, Y., Rightmire, G.P., Vekua, A., Zollikofer, C.P., 2013. A complete skull from Dmanisi, Georgia, and the evolutionary biology of early Homo. Science 342, 326–331. Lucas, P., Corlett, R., Luke, D., 1985. Plio-Pleistocene hominid diets: an approach combining masticatory and ecological analysis. J. Hum. Evol. 14, 187–202. Lucas, P., Constantino, P., Wood, B., Lawn, B., 2008. Dental enamel as a dietary indicator in mammals. Bioessays 30, 374–385. Macchiarelli, R., Bondioli, L., Falk, D., Faupl, P., Illerhaus, B., Kullmer, O., Richter, W., Said, H., Sandrock, O., Schäfer, K., 2004. Early Pliocene hominid tooth from Galili, Somali region, Ethiopia. Coll. Antropol. 28, 65–76. Macchiarelli, R., Bondioli, L., Debénath, A., Mazurier, A., Tournepiche, J.-F., Birch, W., Dean, C., 2006. How Neanderthal molar teeth grew. Nature 444, 748–751. Macho, G., Thackeray, J., 1993. Computed tomography and intercuspal angulation of maxillary molars of Plio-Pleistocene hominids from Sterkfontein, Swartkrans and Kromdraai (South Africa): An exploratory study. Z. Morphol. Anthropol., 261–269. Macho, G.A., Spears, I.R., 1999. Effects of loading on the biochemical behavior of molars of Homo, Pan, and Pongo. Am. J. Phys. Anthropol. 109, 211–227. Mackiewicz, P., Wiszniowska, T., Olejniczak, A., Stefaniak, K., Socha, P., Nadachowski, A., 2010. Analysis of dental enamel thickness in bears with special attention to Ursus spelaeus and U. wenzensis (=minimus) in comparison to selected representatives of mammals, In: Nowakowski, D. (Ed.), Morphology and Systematics of Fossil Vertebrates. DN Publisher, Wroclaw, pp. 60–77. Martin, L., 1983. The relationships of the later Miocene hominoidea. Department of Anthropology, Ph. D. Dissertation, University College London. Martin, L., 1985. Significance of enamel thickness in hominoid evolution. Nature 314, 260–263. Martini, J.E., Wipplinger, P.E., Moen, H.F., Keyser, A., 2003. Contribution to the speleology of Sterkfontein cave, Gauteng province, South Africa. Int. J. Speleol. 32, 4. Mitteroecker, P., Bookstein, F., 2011. Linear discrimination, ordination, and the visualization of selection gradients in modern morphometrics. Evol. Biol. 38, 100–114. Moggi-Cecchi, J., Grine, F.E., Tobias, P.V., 2006. Early hominid dental remains from Members 4 and 5 of the Sterkfontein Formation (1966–1996 excavations): catalogue, individual associations, morphological descriptions and initial metrical analysis. J. Hum. Evol. 50, 239–328.
85
Molnar, S., 1971. Human tooth wear, tooth function and cultural variability. Am. J. Phys. Anthropol. 34, 175–189. Moore, N.C., Thackeray, J.F., Hublin, J.-J., Skinner, M.M., 2016. Premolar root and canal variation in South African Plio-Pleistocene specimens attributed to Australopithecus africanus and Paranthropus robustus. J. Hum. Evol. 93, 46–62. Morita, W., Morimoto, N., Ohshima, H., 2016. Exploring metameric variation in human molars: a morphological study using morphometric mapping. J. Anat. DOI: 10.1111/joa.12482. NESPOS database, 2015, NEanderthal Studies Professional Online Service. http://www.nespos.org. Olejniczak, A., Martin, L., Ulhaas, L., 2004. Quantification of dentine shape in anthropoid primates. Annls. Anat. 186, 479–485. Olejniczak, A., Gilbert, C., Martin, L., Smith, T., Ulhaas, L., Grine, F., 2007. Morphology of the enamel-dentine junction in sections of anthropoid primate maxillary molars. J. Hum. Evol. 53, 292–301. Olejniczak, A., Smith, T.M., Feeney, R.N.M., Macchiarelli, R., Mazurier, A., Bondioli, L., Rosas, A., Fortea, J., de la Rasilla, M., Garcia-Tabernero, A., Radovčić, J., Skinner, M.M., Toussaint, M., Hublin, J.-J., 2008a. Dental tissue proportions and enamel thickness in Neandertal and modern human molars. J. Hum. Evol. 55, 12–23. Olejniczak, A., Smith, T.M., Skinner, M.M., Grine, F.E., Feeney, R.N.M., Thackeray, J.F., Hublin, J.-J., 2008b. Three-dimensional molar enamel distribution and thickness in Australopithecus and Paranthropus. Biol. Lett. 4, 406–410. Olejniczak, A., Tafforeau, P., Feeney, R.N.M., Martin, L.B., 2008c. Three-dimensional primate molar enamel thickness. J. Hum. Evol. 54, 187–195. Osborn, J., 1978. Morphogenetic gradients: fields versus clones, In: PM, B., KA, J. (Eds.), Development, function and evolution of teeth. Academic Press, London, pp. 171–201. Partridge, T., 1978. Re-appraisal of lithostratigraphy of Sterkfontein hominid site. Nature 275, 282–287. Partridge, T., 1982. Some preliminary observations on the stratigraphy and sedimentology of the Kromdraai B hominid site. Palaeoecol. Afr. Surround. Isl. 15, 3–12. Partridge, T., Watt, I., 1991. The stratigraphy of the Sterkfontein hominid deposit and its relationship to the underground cave system. Palaeontol. Afr. 28, 35–40. Pickering, R., Kramers, J.D., 2010. Re-appraisal of the stratigraphy and determination of new U-Pb dates for the Sterkfontein hominin site, South Africa. J. Hum. Evol. 59, 70–86. Pickering, R., Kramers, J.D., Hancox, P.J., de Ruiter, D.J., Woodhead, J.D., 2011. Contemporary flowstone development links early hominin bearing cave deposits in South Africa. Earth Planet. Sci. Lett. 306, 23–32. Polly, P.D., 2007. Development with a bite. Nature 449, 413–415. R Development Core Team, 2012, R: A language and environment for statistical computing. R Foundation for Statistical Computing, Vienna. Radovčić, J., Smith, F.H., Trinkaus, E., Wolpoff, M.H., 1988. The Krapina Hominids: An Illustrated Catalog of Skeletal Collection. Mladost and the Croatian Natural History Museum, Zagreb. Rampont, M., 1994. Les squelettes, os et dents de foetus, nouveaux-nés et enfants du Musée Anatomique de Strasbourg. Aspects historiques et catalogue. Ph.D. Dissertation, Louis Pasteur University. Reynolds, S., Clarke, R., Kuman, K., 2007. The view from the Lincoln Cave: mid-to late Pleistocene fossil deposits from Sterkfontein hominid site, South Africa. J. Hum. Evol. 53, 260–271. Rightmire, G.P., Lordkipanidze, D., 2009. Comparisons of early Pleistocene skulls from East Africa and the Georgian Caucasus: evidence
86
bearing on the origin and systematic of genus Homo, In: Grine, F.E., Fleagle, J.G., Leakey, R.E. (Eds.), The First Humans–Origin and Early Evolution of the Genus Homo. Springer, Berlin. Rink, W.J., Schwarcz, H.P., Smith, F.H., Radovčić, J., 1995. ESR dates for Krapina hominids. Nature 378, 24. Robinson, J.T., 1953. Telanthropus and its phylogenetic significance. Am. J. Phys. Anthropol. 11, 1–38. Robinson, J.T., 1956. The dentition of the Australopithecinae. Trans. Mus. Mem. No. 9, 1–179. Robinson, J.T., 1962. Australopithecines and artefacts at Sterkfontein. Part I. Sterkfontein stratigraphy and the significance of the Extension. S. Afr. Archaeol. Bull., 87–126. Rozzi, F.R., 1998. Can enamel microstructure be used to establish the presence of different species of Plio-Pleistocene hominids from Omo, Ethiopia? J. Hum. Evol. 35, 543–576. Schwarcz, H.P., Grün, R., Tobias, P.V., 1994. ESR dating studies of the australopithecine site of Sterkfontein, South Africa. J. Hum. Evol. 26, 175–181. Schwartz, G., 2000. Taxonomic and functional aspects of the patterning of enamel thickness distribution in extant large-bodied hominoids. Am. J. Phys. Anthropol. 111, 221–244. Schwartz, G.T., 1997. Taxonomic and functional aspects of enamel cap structure in South African plio-pleistocene hominids: a high resolution computed tomographic study. Ph. D. Dissertation, Washington University. Singleton, M., Rosenberger, A.L., Robinson, C., O'neill, R., 2011. Allometric and metameric shape variation in Pan mandibular molars: a digital morphometric analysis. Anat. Rec. 294, 322–334. Skinner, M.M., Wood, B.A., Boesch, C., Olejniczak, A.J., Rosas, A., Smith, T.M., Hublin, J.-J., 2008a. Dental trait expression at the enamel-dentine junction of lower molars in extant and fossil hominoids. J. Hum. Evol. 54, 173–186. Skinner, M.M., Gunz, P., Wood, B.A., Hublin, J.-J., 2008b. Enamel-dentine junction (EDJ) morphology distinguishes the lower molars of Australopithecus africanus and Paranthropus robustus. J. Hum. Evol. 55, 979–988. Skinner, M.M., 2008. Enamel-dentine junction morphology of extant hominoid and fossil hominin lower molars. Ph. D. Dissertation, George Washington University. Skinner, M.M., Wood, B., Hublin, J.-J., 2009. Protostylid expression at the enamel-dentine junction and enamel surface of mandibular molars of Paranthropus robustus and Australopithecus africanus. J. Hum. Evol. 56, 76–85. Skinner, M.M., Evans, A., Smith, T., Jernvall, J., Tafforeau, P., Kupczik, K., Olejniczak, A.J., Rosas, A., Radovčić, J., Thackeray, J.F., Toussaint, M., Hublin, J.-J., 2010. Brief communication: Contributions of enamel-dentine junction shape and enamel deposition to primate molar crown complexity. Am. J. Phys. Anthropol. 142, 157–163. Skinner, M.M., Alemseged, Z., Gaunitz, C., Hublin, J.-J., 2015. Enamel thickness trends in Plio-Pleistocene hominin mandibular molars. J. Hum. Evol. 85, 35–45. Smith, P., Gomorri, J., Spitz, S., Becker, J., 1997. Model for the examination of evolutionary trends in tooth development. Am. J. Phys. Anthropol. 102, 283–294. Smith, T.M., Martin, L.B., Leakey, M.G., 2003. Enamel thickness, microstructure and development in Afropithecus turkanensis. J. Hum. Evol. 44, 283–306. Smith, T.M., Olejniczak, A.J., Martin, L., Reid, D.J., 2005. Variation in hominoid molar enamel thickness. J. Hum. Evol. 48, 575–592. Smith, T.M., Olejniczak, A.J., Reid, D.J., Ferrell, R., Hublin, J.-J., 2006. Modern human molar enamel thickness and enamel–dentine junction shape. Arch. Oral. Biol. 51, 974–995.
87
Smith, T.M., Olejniczak, A.J., Reh, S., Reid, D.J., Hublin, J.-J., 2008. Brief communication: enamel thickness trends in the dental arcade of humans and chimpanzees. Am. J. Phys. Anthropol. 136, 237–241. Smith, T.M., Olejniczak, A.J., Zermeno, J.P., Tafforeau, P., Skinner, M.M., Hoffmann, A., Radovčić, J., Toussaint, M., Kruszynski, R., Menter, C., Moggi-Cecchi, J., Glasmacher, U.A., Kullmer, O., Schrenk, F., Stringer, C., Hublin, J.-J., 2012. Variation in enamel thickness within the genus Homo. J. Hum. Evol. 62, 395–411. Spencer, M.A., 2003. Tooth-root form and function in platyrrhine seed-eaters. Am. J. Phys. Anthropol. 122, 325–335. Strait, D.S., Grine, F.E., Moniz, M.A., 1997. A reappraisal of early hominid phylogeny. J. Hum. Evol. 32, 17–82. Stricker, D., 2008. BrightStat. com: free statistics online. Comput. Meth. Prog. Bio. 92, 135–143. Sutton, M., 2012. The archaeology of Swartkrans cave, Gauteng, South Africa: new excavations of Members 1 and 4 Ph. D. Dissertation, University of the Witwatersrand. Suwa, G., 1988. Evolution of the “robust” australopithecines in the Omo succession: evidence from mandibular premolar morphology, In: Grine, F.E. (Ed.), Evolutionary History of the “Robust” Australopithecines. Aldine de Gruyter, New York, pp. 199–222. Suwa, G., Wood, B., White, T.D., 1994. Further analysis of mandiblular molar crown and cusp areas in Pliocene and early Pleistocene hominids Am. J. Phys. Anthropol. 93, 407–426. Suwa, G., White, T.D., Howell, F., 1996. Mandibular postcanine dentition from the Shungura Formation, Ethiopia: crown morphology, taxonomic allocations, and Plio-Pleistocene hominid evolution. Am. J. Phys. Anthropol. 101, 247–282. Suwa, G., Kono, R., 2005. A micro-CT based study of linear enamel thickness in the mesial cusp section of human molars reevaluation of methodology and assessment of within-tooth, serial, and individual variation. Anthropol. Sci. 113, 273–289. Suwa, G., Kono, R., Katoh, S., Asfaw, B., Beyene, Y., 2007. A new species of great ape from the late Miocene epoch in Ethiopia. Nature 448, 921–924. Suwa, G., Kono, R., Simpson, S.W., Asfaw, B., Lovejoy, C.O., White, T.D., 2009. Paleobiological implications of the Ardipithecus ramidus dentition. Nature 326, 70–99. Tafforeau, P., 2004. Phylogenetic and functional aspects of tooth enamel microstructure and three-dimensional structure of modern and fossil primate molars. Ph.D. Dissertation, Université de Montpellier II. Thackeray, J., de Ruiter, D.J., Berger, L.R., van der Merwe, N., 2001. Hominid fossils from Kromdraai: a revised list of specimens discovered since 1938. Annls. Transv. Mus. 38, 43–56. Thackeray, J., Kirschvink, J.L., Raub, T.D., 2002. Palaeomagnetic analyses of calcified deposits from the Plio-Pleistocene hominid site of Kromdraai, South Africa. S. Afr. J. Sci. 98, 537–540. Thackeray, J., Braga, J., Sénégas, F., Gommery, D., Potze, S., Senut, B., 2005. Discovery of a humerus shaft from Kromdraai B: part of the skeleton of the type specimen of Paranthropus robustus Broom, 1938? Annls. Transv. Mus. 42, 92–93. Tobias, P.V., 1978. The earliest Transvaal members of the genus Homo with another look at some problems of hominid taxonomy and systematics. Z. Morphol. Anthropol. 69, 225–265. Townsend, G., Harris, E.F., Lesot, H., Clauss, F., Brook, A., 2009. Morphogenetic fields within the human dentition: a new, clinically relevant synthesis of an old concept. Arch. Oral. Biol. 54, S34–S44. Tremsin, A., Morgano, M., Panzner, T., Lehmann, E., Filgers, U., Vallerga, J., McPhate, J., Siegmund, O., Feller, W., 2015. High resolution neutron imaging capabilities at BOA beamline at Paul Scherrer

88
Institut. Nucl. Instr. Meth. Phys. Res. A 784, 486–493. Ungar, P.S., Grine, F.E., Teaford, M.F., Zaatari, S.E., 2006. Dental microwear and diets of African early Homo J. Hum. Evol. 50, 78–95. Van Valen, L., 1970. An analysis of developmental fields. Dev. Biol. 23, 456–477. Villmoare, B., Kimbel, W.H., Seyoum, C., Campisano, C.J., DiMaggio, E., Rowan, J., Braun, D.R., Arrowsmith, J.R., Reed, K.E., 2015. Early Homo at 2.8 Ma from Ledi-Geraru, Afar, Ethiopia Science 347, 1352–1355. Vrba, E.S., 1975. Some evidence of chronology and palaeoecology of Sterkfontein, Swartkrans and Kromdraai from the fossil Bovidae. Nature 254, 301–304. Vrba, E.S., 1981. The Kromdraai australopithecine site revisited in 1980, recent investigations and results. Annls. Transv. Mus. 33, 17–60. Vrba, E.S., Panagos, D.C., 1982. New perspectives on taphonomy, palaeoecology, and chronology of the Kromdraai apeman. Paleoecol. Afr. 15, 13–26. Vrba, E.S., 1985. Early hominids in southern Africa: updated observations on chronological and ecological background, In: Tobias, P.V. (Ed.), Hominid evolution: Past, present and future. Alan R. Liss, New York, pp. 195–200. Weiss, K.M., 1990. Duplication with variation: metameric logic in evolution from genes to morphology. Yearb. Phys. Anthropol. 11, 1–23. White, T.D., Harris, J.M., 1977. Suid evolution and correlation of African hominid localities. Science 198, 13–21. White, T.D., Suwa, G., Asfaw, B., 1994. Australopithecus ramidus, a new species of early hominid from Aramis, Ethiopia. Nature 371, 306–312. Wood, B., 2010. Reconstructing human evolution: achievements, challenges, and opportunities. Proc. Natl. Acad. Sci. 107, 8902–8909. Wood, B., 2011. Wiley-Blackwell Encyclopedia of Human Evolution. John Wiley & Sons, Chichester. Zanolli, C., Bondioli, L., Coppa, A., Dean, C.M., Bayle, P., Candilio, F., Capuani, S., Dreossi, D., Fiore, I., Frayer, D.W., 2014. The late Early Pleistocene human dental remains from Uadi Aalad and Mulhuli-Amo (Buia), Eritrean Danakil: macromorphology and microstructure. J. Hum. Evol. 74, 96–113. Zanolli, C., 2015. Brief communication: molar crown inner structural organization in Javanese Homo erectus. Am. J. Phys. Anthropol. 156, 148–157.

89
Appendix A. 3D enamel thickness data for each mandibular specimen. Values are measured in mm, mm2 or mm3. The crown and roots were separated by cervical line according to Benazzi et al. (2014).
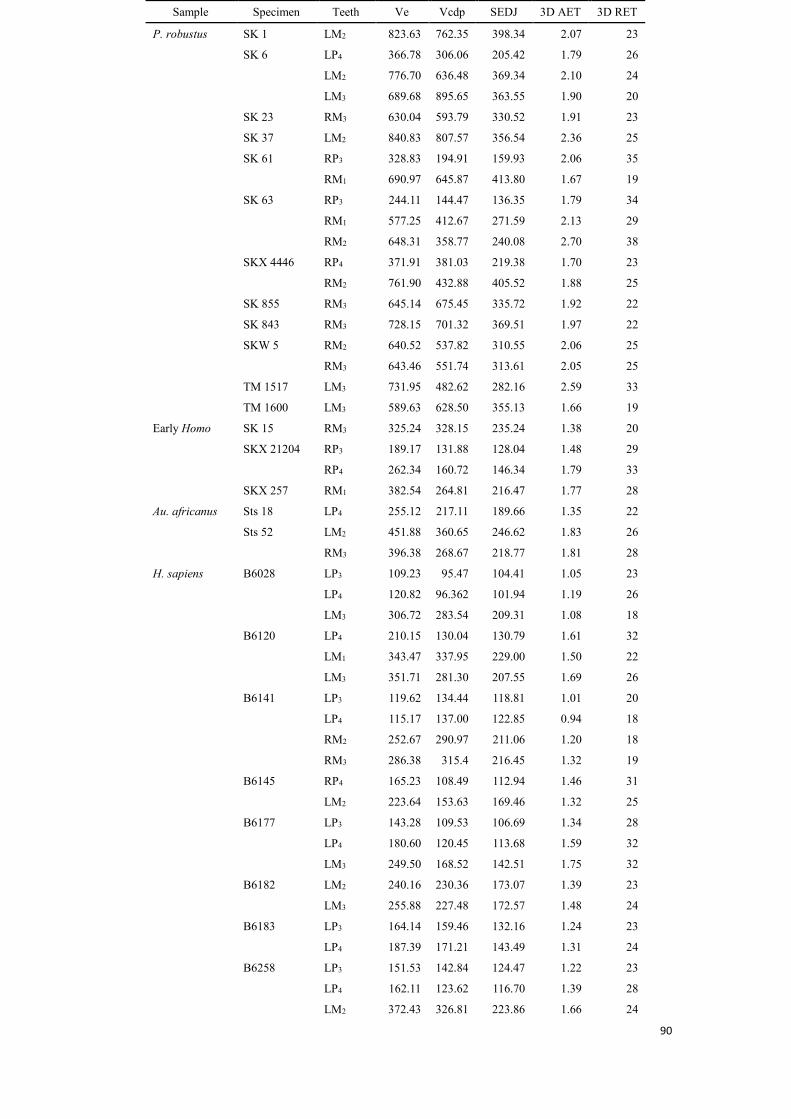
90
Sample Specimen Teeth Ve Vcdp SEDJ 3D AET 3D RET
P. robustus SK 1 LM2 823.63 762.35 398.34 2.07 23
SK 6 LP4 366.78 306.06 205.42 1.79 26
LM2 776.70 636.48 369.34 2.10 24
LM3 689.68 895.65 363.55 1.90 20
SK 23 RM3 630.04 593.79 330.52 1.91 23
SK 37 LM2 840.83 807.57 356.54 2.36 25
SK 61 RP3 328.83 194.91 159.93 2.06 35
RM1 690.97 645.87 413.80 1.67 19
SK 63 RP3 244.11 144.47 136.35 1.79 34
RM1 577.25 412.67 271.59 2.13 29
RM2 648.31 358.77 240.08 2.70 38
SKX 4446 RP4 371.91 381.03 219.38 1.70 23
RM2 761.90 432.88 405.52 1.88 25
SK 855 RM3 645.14 675.45 335.72 1.92 22
SK 843 RM3 728.15 701.32 369.51 1.97 22
SKW 5 RM2 640.52 537.82 310.55 2.06 25
RM3 643.46 551.74 313.61 2.05 25
TM 1517 LM3 731.95 482.62 282.16 2.59 33
TM 1600 LM3 589.63 628.50 355.13 1.66 19
Early Homo SK 15 RM3 325.24 328.15 235.24 1.38 20
SKX 21204 RP3 189.17 131.88 128.04 1.48 29
RP4 262.34 160.72 146.34 1.79 33
SKX 257 RM1 382.54 264.81 216.47 1.77 28
Au. africanus Sts 18 LP4 255.12 217.11 189.66 1.35 22
Sts 52 LM2 451.88 360.65 246.62 1.83 26
RM3 396.38 268.67 218.77 1.81 28
H. sapiens B6028 LP3 109.23 95.47 104.41 1.05 23
LP4 120.82 96.362 101.94 1.19 26
LM3 306.72 283.54 209.31 1.08 18
B6120 LP4 210.15 130.04 130.79 1.61 32
LM1 343.47 337.95 229.00 1.50 22
LM3 351.71 281.30 207.55 1.69 26
B6141 LP3 119.62 134.44 118.81 1.01 20
LP4 115.17 137.00 122.85 0.94 18
RM2 252.67 290.97 211.06 1.20 18
RM3 286.38 315.4 216.45 1.32 19
B6145 RP4 165.23 108.49 112.94 1.46 31
LM2 223.64 153.63 169.46 1.32 25
B6177 LP3 143.28 109.53 106.69 1.34 28
LP4 180.60 120.45 113.68 1.59 32
LM3 249.50 168.52 142.51 1.75 32
B6182 LM2 240.16 230.36 173.07 1.39 23
LM3 255.88 227.48 172.57 1.48 24
B6183 LP3 164.14 159.46 132.16 1.24 23
LP4 187.39 171.21 143.49 1.31 24
B6258 LP3 151.53 142.84 124.47 1.22 23
LP4 162.11 123.62 116.70 1.39 28
LM2 372.43 326.81 223.86 1.66 24
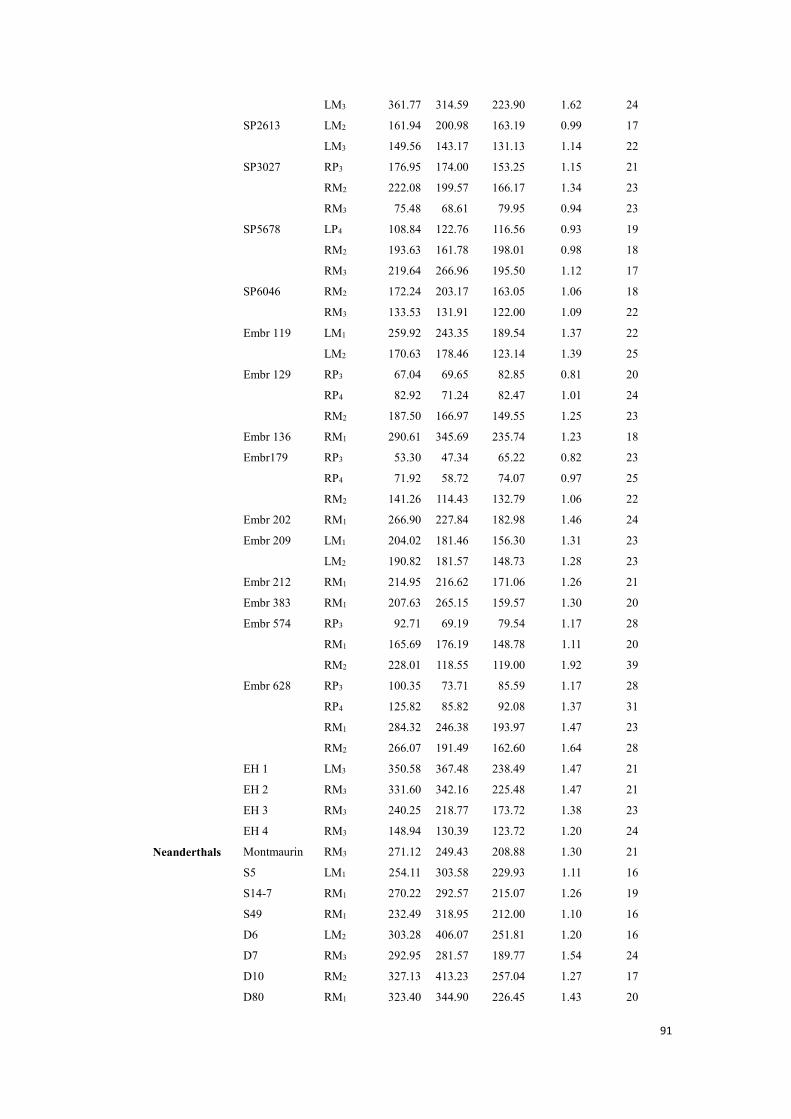
91
LM3 361.77 314.59 223.90 1.62 24
SP2613 LM2 161.94 200.98 163.19 0.99 17
LM3 149.56 143.17 131.13 1.14 22
SP3027 RP3 176.95 174.00 153.25 1.15 21
RM2 222.08 199.57 166.17 1.34 23
RM3 75.48 68.61 79.95 0.94 23
SP5678 LP4 108.84 122.76 116.56 0.93 19
RM2 193.63 161.78 198.01 0.98 18
RM3 219.64 266.96 195.50 1.12 17
SP6046 RM2 172.24 203.17 163.05 1.06 18
RM3 133.53 131.91 122.00 1.09 22
Embr 119 LM1 259.92 243.35 189.54 1.37 22
LM2 170.63 178.46 123.14 1.39 25
Embr 129 RP3 67.04 69.65 82.85 0.81 20
RP4 82.92 71.24 82.47 1.01 24
RM2 187.50 166.97 149.55 1.25 23
Embr 136 RM1 290.61 345.69 235.74 1.23 18
Embr179 RP3 53.30 47.34 65.22 0.82 23
RP4 71.92 58.72 74.07 0.97 25
RM2 141.26 114.43 132.79 1.06 22
Embr 202 RM1 266.90 227.84 182.98 1.46 24
Embr 209 LM1 204.02 181.46 156.30 1.31 23
LM2 190.82 181.57 148.73 1.28 23
Embr 212 RM1 214.95 216.62 171.06 1.26 21
Embr 383 RM1 207.63 265.15 159.57 1.30 20
Embr 574 RP3 92.71 69.19 79.54 1.17 28
RM1 165.69 176.19 148.78 1.11 20
RM2 228.01 118.55 119.00 1.92 39
Embr 628 RP3 100.35 73.71 85.59 1.17 28
RP4 125.82 85.82 92.08 1.37 31
RM1 284.32 246.38 193.97 1.47 23
RM2 266.07 191.49 162.60 1.64 28
EH 1 LM3 350.58 367.48 238.49 1.47 21
EH 2 RM3 331.60 342.16 225.48 1.47 21
EH 3 RM3 240.25 218.77 173.72 1.38 23
EH 4 RM3 148.94 130.39 123.72 1.20 24
Neanderthals Montmaurin RM3 271.12 249.43 208.88 1.30 21
S5 LM1 254.11 303.58 229.93 1.11 16
S14-7 RM1 270.22 292.57 215.07 1.26 19
S49 RM1 232.49 318.95 212.00 1.10 16
D6 LM2 303.28 406.07 251.81 1.20 16
D7 RM3 292.95 281.57 189.77 1.54 24
D10 RM2 327.13 413.23 257.04 1.27 17
D80 RM1 323.40 344.90 226.45 1.43 20

92
Appendix B. Connover’s post hoc pairwise comparisons of 3D AET and RET after Kruskal-Wallis test statistics are reported below the table
Tooth position Group 1 Group 2 3DAET 3DRET
Premolars Au. africanus P. robustus Au. africanus Early Homo Au. africanus Extant humans P. robustus Early Homo P. robustus Extant humans >a Early Homo Extant humans
Molars Au. africanus P. robustus Au. africanus Early Homo Au. africanus Extant humans Au. africanus Neanderthals > P. robustus Early Homo P. robustus Extant humans > P. robustus Neanderthals > > Early Homo Extant humans Early Homo Neanderthals Extant humans Neanderthals >
a) Significant differences (group 1-group 2) are indicated by the directions, when p≤0.05 Premolars 3DAET Kruskal-Wallis test statistics: Chi Square=13.4;
D85 LM3 276.65 257.28 183.32 1.51 24
D86 LM2 309.70 353.48 234.12 1.32 19
D105 LM1 351.70 446.04 272.97 1.29 17
D106 LM3 317.62 349.66 227.52 1.40 20
D107 LM2 393.46 497.07 296.75 1.33 17
D108 RM3 246.48 274.50 198.43 1.24 19

93
Premolars 3DRET Kruskal-Wallis test statistics: Chi Square=6.6; Molars 3DAET Kruskal-Wallis test statistics: Chi Square=37.3; Molars 3DRET Kruskal-Wallis test statistics: Chi Square=20.0;