Embed Size (px)
Citation preview
This Valuation Report has been prepared by AAHCompany and contains information relating to the Company, and its subsidiaries and constituents. The material in this document is confidential and the property of Ajwaa Alalam Aviation Group and its subsidiaries and constituents. This document may not be copied, or transmitted to anyone without the prior written consent of Ajwaa Alalam Aviation Group.

VALUATION REPORT Page 2
ABBREVIATIONS
AAS AAS Company Limited
AAL AAL Company Limited
AAT AAT Company Limited
AAH AAH Company or AAH Group Companies
AOC Air Operator Certificate
CEO Chief Executive Officer
DCF Discounted Cash Flow
GACA General Authority of Civil Aviation, Saudi Arabia
IPO Initial Public offering
AA CONSULTING AA Consultants
MRO Maintenance, Repair and Overhaul
NAV Net Asset Value
OEM Original Equipment Manufacturer
PMA Parts Manufacturing Authority
SAMA Saudi Arabian Monetary Agency
SAR Saudi Arabian Riyals
SLA Service Level Agreement

VALUATION REPORT Page 3
3
TABLE OF CONTENTS
I. EXECUTIVE SUMMARY ............................................................................................................................. 7
A. Background to the Group ...................................................................................................................... 7
B. The Group’s philosophy, Vision and Mission Statements ...................................................................... 7
C. Business Description .............................................................................................................................. 8
D. Historical Financial Results .................................................................................................................... 9
E. Financial Projections ........................................................................................................................... 10
II. INTRODUCTION ..................................................................................................................................... 12
III. STATEMENT OF LIMITING CONDITIONS ................................................................................................. 13
IV. AJWA ALALAM HOLDING COMPANY ................................................................................................. 15
A. Overview ............................................................................................................................................. 15
B. Background to the Group .................................................................................................................... 15
C. The Group’s philosophy, Vision and Mission Statements .................................................................... 19
D. Summary of the Group's strengths ...................................................................................................... 23
E. Strategic Partnerships ......................................................................................................................... 25
F. Group Company structure, holding and shareholding patterns .......................................................... 30
G. Business Description ............................................................................................................................ 30
H. Historical Financial Results .................................................................................................................. 34
I. Summary ............................................................................................................................................. 38
V. INDUSTRY OVERVIEW ............................................................................................................................ 39
A. Introduction ......................................................................................................................................... 39
B. General Overview ................................................................................................................................ 39
C. Aircraft Operations .............................................................................................................................. 39
D. Aircraft Maintenance .......................................................................................................................... 41
E. Aircraft Spares ..................................................................................................................................... 45
F. Aviation Consulting ............................................................................................................................. 47
G. Understanding the Non-traditional Aviation Market .......................................................................... 48
H. Conclusion ........................................................................................................................................... 48
VI. ECONOMIC OVERVIEW ...................................................................................................................... 49
A. Review of key economic indicators ..................................................................................................... 49
B. Oil sector overview .............................................................................................................................. 50
C. Inflation ............................................................................................................................................... 51
D. Demography ........................................................................................................................................ 51
E. Employment ........................................................................................................................................ 52
F. Interest rates ....................................................................................................................................... 53
G. The Securities Market .......................................................................................................................... 53
H. Equity Markets .................................................................................................................................... 54
I. Industrial Scenario ............................................................................................................................... 56
J. Future economic outlook ..................................................................................................................... 56
VII. FINANCIAL PROJECTIONS................................................................................................................... 58
A. Income Statement Assumptions .......................................................................................................... 58
B. Balance Sheet Assumptions................................................................................................................. 70

VALUATION REPORT Page 4
VIII. GENERAL VALUATION METHODOLOGY ............................................................................................. 71
A. Income Approach ................................................................................................................................ 71
B. Asset Based Approach ......................................................................................................................... 71
C. Market Approach ................................................................................................................................ 72
D. Valuation Adjustment Factors ............................................................................................................. 73
IX. VALUATION ANALYSIS ........................................................................................................................... 75
A. Discount and Capitalization Rate ........................................................................................................ 75
B. Terminal Year Growth Factor .............................................................................................................. 76
C. Discounted Cash Flow ......................................................................................................................... 76
X. SUMMARY AND RECOMMENDATIONS .................................................................................................. 77
VALUATION REPORT Page 5
LIST OF TABLES
Table 1: Annualized Growth Rates of Group Companies ...................................................................... 10
Table 2: Market Value ........................................................................................................................... 11
Table 3: Shareholding Structure of the Group companies ................................................................... 30
Table 4: Historical Net Margins of group companies............................................................................ 35
Table 5: Historical Return on Capital for group companies .................................................................. 36
Table 6: Average Aircraft Age ............................................................................................................... 40
Table 7: Breakdown of status of private aircraft in the Middle East .................................................... 40
Table 8: Private aircraft by country of operation ................................................................................. 40
Table 9: Aircraft type operating in the region ...................................................................................... 41
Table 10: Key Aircraft maintenance players and their revenue estimates ........................................... 42
Table 11: Forecast for Air Transportation market ................................................................................ 42
Table 12: Maintenance industry breakdown by type ........................................................................... 43
Table 13: Economic Indicators for Saudi Arabia ................................................................................... 50
Table 14: Cost of Living Indices ............................................................................................................. 51
Table 15: Demographic breakdown of the Saudi Population ............................................................... 51
Table 16: Saudi Labor force .................................................................................................................. 52
Table 17: Interest rate data .................................................................................................................. 53
Table 18: Government securities subscription ..................................................................................... 53
Table 19: Capital market data ............................................................................................................... 54
Table 20: Sectoral value traded for Saudi Stocks .................................................................................. 55
Table 21: Growth estimates for the region ........................................................................................... 56
Table 22: Projected growth assumptions for group companies ........................................................... 58
Table 23: Price indicators of transportation companies on Saudi Stock Exchange .............................. 72
Table 24: Price indicators of multi-investment companies on Saudi Stock Exchange ......................... 72
Table 25: Valuation basis for companies in the group.......................................................................... 73
Table 26: Discount Rate assumptions for valuation ............................................................................. 75
Table 27: Terminal Growth rate assumptions ...................................................................................... 76

VALUATION REPORT Page 6
APPENDICES
APPENDIX I Summary CVs of the key management APPENDIX II Summary Consolidated historical and projected Financial Statements for AJWAA APPENDIX III Summary historical and projected Financial Statements for AASCompany APPENDIX IV Summary historical and projected Financial Statements for AATCompany APPENDIX V Summary historical and projected Financial Statements for AA Consultants
Company

VALUATION REPORT I. EXECUTIVE SUMMARY Page 7
7
I. EXECUTIVE SUMMARY
AAHGroup consists of four companies, which together constitute the group. In order to leverage this
position, AAHGroup now intends to offer its shares to prospective investors who will increase the pace
of growth of the companies in the group. We have performed a valuation analysis of the fair market
value of a 100% interest in the shares of AAHgroup companies as of 30 June 2008.
The private and specialized aviation market in the Middle East is one of the fastest growing markets.
With nearly 200 aircraft on order, the region will witness heightened private and specialized aviation
activities. The market for aviation services in the region is huge, but fragmented and there is no
established professional services company that has the capability or expertise to service the needs of
the market.
The AAHGroup of companies was started in 2006 as a business concept to serve the underserved
Middle Eastern private and specialized aviation market needs. Initially, two business entities were
created to serve the needs of the customer: AA Consultants, which operates as a professional office
offering purely advisory services, and Ajwaa Aviation, which operated as a specialized aviation services
company.
A. Background to the Group
AAHCompany Limited was established on 21 July 2008 (18 Rajab 1429 Hijri), as a holding
company for the AAHGroup in order to formalize and expand the services of the group into in
Kingdom certified aircraft operations, maintenance and logistics services. Through companies
in the Group, the Company offers end-to-end aviation support services to the private aviation
industry. AAHGroup’s “hands on” expertise spans all elements of the Aviation Industry
including, among others, Aviation Consulting, Aircraft Operation, Logistics and Maintenance,
Aircraft Acquisition and Financing, and Project Management.
Mr Founder Founder is the Chairman of the AAHGroup of Companies. Mr Founder Founder
is a recognized figure in the aviation industry, and more particularly in the business and
specialized aviation industry. Mr. Founder 's exposure to the international side of the aviation
business came while working initially at Al Salam Aircraft Company, and further as the
President and CEO at ABC(ABC).
B. The Group’s philosophy, Vision and Mission Statements

VALUATION REPORT I. EXECUTIVE SUMMARY Page 8
The Vision of the Group is:
To be recognized:
As the Middle East Leading provider of Specialized Aviation Services
and Aviation Investment Group
The Mission of the Group is:
To Establish
An integrated group of companies focused on serving its Employees ,
Clients and Being an added value to its Shareholders and Business
Partners
The Group’s strengths arise from its unique experience and market position, which gives the
group its ability to continually expand its business thus enhancing its market value.
AAHGroup has been recognized in the field of business and specialized aviation, and as a result
of this reputation, and its position in the Middle Eastern markets, the Group has attracted a
number of companies eager to establish a footprint in the region. Some of the well-known
strategic relationships are with Airbus and Comlux Group, and Studio E/motions.
C. Business Description
The business of the Group can be broadly classified into two areas: consulting, advisory and,
aircraft operations and technical support business. In order to service these two sectors, the
Group has been organized into four companies: each company in the Group has been formed
as a closely held company, with a unique business proposition and headed by a Chief Executive
Officer.
Each company is formed as a company which is held by Mr Founder Founder and
AAHCompany Limited as the key shareholders. AAHCompany Limited is the holding company
for the group, and does not perform any operations other than acting as the holding company,
and making strategic decisions to invest into new businesses or companies.
A brief description of each of the companies and their business is as follows:

VALUATION REPORT I. EXECUTIVE SUMMARY Page 9
AASCompany Limited (AAS): The Company was formed in 2008 and is headquartered in
Riyadh. The Chief Executive Officer of the Company is Captain Sultan AlDowaihy.
AAS specialized in providing services to the private and specialized aviation clients and shall be
responsible for operations of aircraft in the region, and turnkey aircraft management services
for individuals, government and corporate. The Company is already assisting in the operations
of an aircraft and is in negotiations with clients for operations of two other aircraft. AAS does
not directly own any aircraft, and currently assists customers by operating their aircraft for
them.
AAS has already obtained the 125 AOC certification, and is currently in the process of obtaining
its 121(S) AOC certification. These certifications will enable AAS to operate its own planes in
the future. For the purpose of this valuation, the implied investments and value realizable out
of these are not being considered.
AATCompany Limited (AAT): The Company was formed in 2008 and is headquartered in
Riyadh. AAT is in the business of providing aviation maintenance and technical services to
private and specialized aviation clients. The Company will provide line maintenance services,
including A, B and C checks for aircraft. In addition the company will provide VIP aircraft
interior upkeep services.
AAT has recently been awarded the 145 certification at Riyadh Airport as an approved repair
station. It is also in the process of setting up a private hangar facility at the King Khalid
International Airport at Riyadh, Saudi Arabia. For the purpose of this valuation, the implied
investments and value realizable out of these are not being considered.
AAL Company Limited (AAL ): The Company was formed in 2008 and is headquartered in
Riyadh. The company’s main business is to provide logistic support, including the purchase,
storage and sale of spare parts to support the needs of private aviation customers. AAL will
be actively involved in providing logistic support to aircraft that are being operated or
maintained by other companies in the group or other aircraft in the region.
The experience it gains in providing logistics support within the group will be leveraged to offer
logistic solutions to other businesses in the region.
AA Consultants (AA CONSULTING): The primary function of the company is to offer aviation
consulting, strategic advisory, investment advisory, and project management services to
companies in the region. Mr Ahmed Abdullah is the Chief Executive Officer of the company.
Its clients and relationships include high net-worth individuals, private companies and
government establishments and ministries, and virtually the who’s who of the Middle Eastern
private aviation industry. The company is involved mainly in aviation consultancy services and
aviation project management activities.
D. Historical Financial Results
VALUATION REPORT I. EXECUTIVE SUMMARY Page 10
The management of AAHGroup has reconstructed the financials statements of the group based
on the logical translation of businesses that belong to a specific line of activity to the company
that is expected to conduct that business.
AAHCompany provides significant strategic support to the companies in the Group, the value
of which cannot be easily estimated.
Total revenue for the AAHGroup of companies increased significantly from around SR 24
million in 2007 to more than SR 130 million in 2008.
Net margins, in general, have improved across all companies in the group. This is primarily
due to increased activity for the group, and also larger ticket business for the group.
The increased revenue for the group is a reflection of increasing confidence in the region for
the capabilities of the AAHGroup.
Each of the businesses of the group could grow through investment in related assets. For
example, obtaining GACA certifications for the operations and maintenance of aircraft and the
investments in hangar facilities are likely to significantly improve the performance of
AATCompany.
Net margins of most of the companies in the Group are superior to benchmark margins for companies in the region, and clearly demonstrate the potential for growth in these businesses.
E. Financial Projections
We have prepared these financial projections for assessing the future prospects and
profitability of the company in order to arrive at an estimated fair market value of the
company’s equity. It is possible that the company will exceed or underachieve some of the
projections for individual companies. These projections are not a substitute for business
planning, which will require detailed financial planning.
Revenue
The assumed revenue growth for each of the companies, over the previous year, is as follows:
Table 1: Annualized Growth Rates of Group Companies
Annualized Growth Rates 2009 2010 2011 2012 2013
AA Consultants (35 %) 9% 5% 30% 25%
AAH* 167% 96% 46% 14% 23%
* Consolidated for AAS and AAT
Valuation Analysis
In deriving values, we relied on: (i) historical financial data for the Companies (summary
provided in the section labeled “Historical Financial Results”), (ii) a Company-prepared

VALUATION REPORT I. EXECUTIVE SUMMARY Page 11
business plan for fiscal years 2009-13, and (iii) economic and industry data relating to the
business aviation industry and other related industries in which companies in the group
operate, as they impact the operations of the Companies.
The future business of the group has been broadly categorized as consulting related (MAZ
Aviation Consulting) and Aircraft operations related (AAS, AAT, and AAL ). The risks and the
returns expected on each of these businesses is different and moreover, a direct revenue and
cost linkage exists between financial performance for each of these two segments.
The discount rates for each of the companies was arrived at based on a combination of the
current rates of return based on risk free investments, the business risk premium associated
with the Company’s operations, and other relevant factors. The discount rate for each
company takes into account the risk free rate of return, country risk, industry risk and business
risk.
The valuation analysis estimates the fair market value of AAHGroup of companies using a
sum of parts method.
(all amounts in million Saudi Riyals) Table 2: Market Value
Company Name Valuation Basis
Total
Enterprise
Value
Less:
outstanding
loans/
(partner
advances)
Total
Equity
Value
AAH* DCF 645.58 0 645.58
AA Consultants DCF 595.84 0 595.84
Value
1,241.42 0 1,241.42
* Consolidated for AAS and AAT
Based on our analysis the fair market value of a 100% equity in the AAHgroup companies,
using the sum of parts valuation methodology as at 30 June 2008 is represented as Saudi
Riyals 1,241 million.
VALUATION REPORT II. INTRODUCTION Page 12
12
II. INTRODUCTION
The AAHGroup consists of four companies, which together make up the group. In a short span of less
than two years, the group has managed to gain a number of clients and established a formidable
reputation for the quality of its services, and the professionalism displayed by its team. The Group’s ability
to service the market in the Middle East is particularly strengthened due to some of the strategic
partnerships that it has entered into through its sister companies. As one of the few companies in the
region that has such significant partnerships, the Group occupies a position of strength. The Group is
poised for greater growth, and has over the past few months taken a number of steps to align the group’s
activities to maximize this growth potential.
The market for private and specialized aviation in the Middle East is fragmented, and poorly serviced due
to lack of adequate and professional manpower in the industry. In these conditions, the AAHGroup of
companies provides one of the best opportunities for growth and establishment of a dominant market
position. In order to leverage this position, AAHGroup now intends to offer its shares to prospective
investors who will increase the pace of growth of the companies in the group. This valuation exercise has
been prepared in order to assist in arriving at a value indication to guide in discussions with prospective
investors.
The objective of our valuation is to provide a recommendation for a possible stake sale or transfer in the
holding company to potential investors.
We have performed a valuation analysis of the fair market value of a 100% interest in the shares of
AAHgroup companies as of 30 June 2008. For the purpose of this analysis, fair market value is defined as:
…the price at which the 100% interest would change hands between a willing buyer and willing
seller, neither being under compulsion to buy or sell and both having reasonable knowledge of all
relevant facts as of the valuation date.
This valuation has been prepared based on a sum of parts method, whereby the value of the holding
company is derived based on the interest held by the holding company (either directly or indirectly) in
each of the subsidiary companies.
The recommendations in the report are based upon the information prepared internally and upon records
of events and contracts available with us, and other relevant sources. While we have carried out sufficient
procedures to ensure the accuracy of the information, it is possible that there could be some differences
between the audited financial statements and the historical financial statements used in this report.
Presentations of summaries of, or references to, the Valuation Report to third parties must be reviewed
by readers and they are cautioned to make their own evaluations.

VALUATION REPORT III. LIMITING CONDITIONS Page 13
13
III. STATEMENT OF LIMITING CONDITIONS
This valuation report is contingent on the following limiting conditions and assumptions made by us:
This valuation report is prepared by the management of AAHCompany and for the purpose of
assisting potential investors during discussions for a possible stake sale/transfer of the equity in
the Holding Company. This valuation report may not be distributed either in whole or in part to
any third party without the prior approval and written consent of the management of
AAHCompany.
Information used in this report and which forms a basis for the valuation is internally verified for
accuracy but has not been independently verified. This information primarily included: (i) the
proforma financial statements for years ended 31 December 2007 and 30 June 2008, and (ii)
financial projections and underlying assumptions for the five years ending 31 December 2013. The
performance of the companies in the group for the six month period ended 31 December 2008
are based on assumptions of business continuing on the same basis as on 30 June 2008.
This valuation report is not intended for use as investment, tax or accounting advice and does not
constitute a fairness opinion.
The valuation contained in this report is only to represent the estimated fair market value of
AAHgroup companies at 30 June 2008, i.e. the Valuation Date. Subsequent changes in market
conditions could result in a substantially different valuation. Specifically, it is assumed that the
business will maintain a status-quo position with respect to the methods of conducting business.
Any impact arising out of subsequent changes to the business including licensing and certifications,
establishment of hangars, and their impact on the potential revenues and profitability to the
companies in the group have neither been prepared nor are they being considered for the
purposes of this valuation.
Transaction prices may reflect specific circumstances and considerations other than the fair
market value. Such factors include, but are not limited to: (i) the profile of potential buyer, (ii)
potential synergy and strategic opportunities arising from business combination, and (iii) the
degree of urgency attached to the sale or acquisition. The user is responsible for making his/her
own determination of the fairness of any transaction.
Estimates of future events described herein represent our management’s general expectations
concerning such events as at 30 June 2008, the Valuation Date. These events may not occur as
anticipated, and actual operating results may vary materially from those projected by us.
Our report is prepared on the basis that AAHCompany Limited and its group companies and
associates have an unrestricted title to all property and other assets of the Company and that it
complies with local laws and regulations.
This report does not take into consideration the potential impact of some planned activities of the
group including, but not limited to establishment of hangar facilities, AOC certification (Part 125

VALUATION REPORT III. LIMITING CONDITIONS Page 14
and 121 (S) certification) and 145 certification for repair station operations. It is possible that the
inclusion of these facilities and certifications could significantly increase the value of the business.
Legal and financial impact, unless to the extent relevant for consideration of the valuation of
AAHCompany Limited, arising from any contractual and legal agreements between the Company,
its associates, and any of its principals that might affect the operations of the Company has not
been considered in our valuation analysis.
Except as specifically stated to the contrary, this Valuation Report has given no consideration to
the following matters to the extent they exist: (i) matters of a legal nature, including issues of
legal title and compliance with local laws, and (ii) litigation and other contingent liabilities that are
not recorded in the balance sheet. The user of this Valuation Report may be required to make his
own determination about the impact, if any, of these matters on the value reported in our report.
The prospective financial information has been prepared by us based on expectations of
competitive and economic environments as these may impact the future operations of the
Companies in the group. We have consistently applied key assumptions during the estimation
period and have not omitted any factors that may be relevant.
VALUATION REPORT IV. AAHCOMPANY Page 15
15
IV. AJWA ALALAM HOLDING COMPANY
A. Overview
The private and specialized aviation market in the Middle East is one of the fastest growing
regions. With nearly 200 aircraft on order, the region will witness heightened private and
specialized aviation activities. While the aircraft acquisition activity is in full swing, there are
very few companies in the region which have the capability of servicing the end-to-end needs
of private aviation players, right from initial aircraft purchase decision and negotiations to
purchase and outfitting, and to operations and maintenance of the aircraft.
The market for aviation services in the region is huge, but fragmented and there are few
established professional services company that had the capability or expertise to service the
needs of the market. Even where companies do exist, their quality of service leaves a lot to be
desired. Most of the existing aircraft owners typically relied on captains/pilots or other
technical support who had limited business exposure or understanding, or rely on expensive
services provided by European Service Providers.
The AAHGroup of companies was started as a business concept to serve the underserved
Middle Eastern private and specialized aviation market needs. In association with a group of
highly experienced and professional set of people, all of whom represent the best available
talent in the field of private aviation, AAHGroup has the privileged access to a combined talent
pool which is second to none.
Initially, two business entities were created to serve the needs of the customer: AA
Consultants, which operates as a professional office offering purely advisory services, and
Ajwaa Aviation, which operated as an aviation services establishment. The Ajwaa Aviation
business has now been further divided, for the purposes of strategic, administrative and
logistical convenience, into AAS, AAT, and AAL .
B. Background to the Group
AAHCompany Limited (“Subject” or the “Company”) was established on 21 July 2008 (18 Rajab
1429 Hijri), as a holding company for the AAHGroup in order to formalize and expand the
services of the group into in Kingdom certified aircraft operations, maintenance and logistics
services. The AAHGroup of companies offers end-to-end aviation support services to the
private aviation industry. AAHGroup’s “hands on” expertise spans all elements of the Aviation
Industry including, among others, Aviation Consulting, Aircraft Operation, Logistics and
Maintenance, Aircraft Acquisition and Financing, and Project Management.
Mr Founder Founder is the Chairman of the AAHGroup of Companies. Mr Founder Founder
is a recognized figure in the aviation industry, and more particularly in the business aviation
industry. Mr Founder is a Mechanical Engineer, having graduated from the University of New
Haven, CT, in 1984.
VALUATION REPORT IV. AAHCOMPANY Page 16
He has almost 25 years of hands on aviation experience that spans almost all aspects of the
aviation industry both commercial and military. For the first 22 years of his career Mr. Founder
worked on local, regional and global projects.
Mr. Founder was involved in obtaining one of the first licenses for an aircraft maintenance
facility in Saudi Arabia, in 1992.
Mr. Founder 's exposure to the international side of the aviation business came while working
at Al Salam Aircraft Company (Al Salam), a privately owned company which was formed as a
joint venture with Boeing as a part of the offset program.
In Al Salam, Mr Founder Founder was responsible for all business acquisition and contractual
activities, and in a span of 3 years, concluded contracts worth more than SR 1.5 Billion, with
almost 80% of it directly with the US government.
However, Mr Founder ’s is mostly recognized as the pioneer of organized private aviation
business in the Kingdom of Saudi Arabia. As the President and Chief Executive Officer of
ABC(ABC), he was responsible for redefining the landscape of business aviation in the region.
Under the leadership of Mr Founder , ABC became the first privately owned company to obtain
the first privately owned 135, 125 and 121 Aircraft Operator Certificates (AOC) and conduct
operations under these AOC's in the Kingdom. ABC also introduced and operated the Middle
East service of the global NetJets® program, the world’s first and largest fractional aircraft
ownership program.
In mid 2006, ABC was sold to a private equity fund for a market value seven times it original
capitalization. This was possible due to the significant value created under the leadership of
Mr. Founder during his tenure at ABC.
Immediately after the sale of ABC, Mr Founder , started the AAHGroup of companies in the
third quarter of 2006. Using his market experience, industry relationships, customer contacts
and understanding of the industry’s regulatory environment, Mr Founder put the initial
foundation for the AAHGroup with a clear vision driven by its objectives.
The objective was to establish an integrated group of companies each specialized in a certain
segment of the industry with a focus in three specific area of expertise which are:
• VIP and specialized aircraft services
• Specialized Aviation Consulting, and
• Selective Aviation Investment
The market potential in the aviation industry exists in the non-traditional markets, which is a
largely untapped segment. Other companies do not have the prior experience or the expertise
to address such needs, and the AAHGroup through its structure, is best equipped to serve this
market.

VALUATION REPORT IV. AAHCOMPANY Page 17
Recognizing the challenges of this industry, Mr. Founder recognized that to achieve success
two important risks that could result in failure, needed to be mitigated. These were:
1. Lack of financial support; and
2. Lack of competent team
To mitigate these two risks the following steps were undertaken:
In order to mitigate the financial stability risk; a long term corporate development strategy
was developed with a clear target of achieving a strong cash positive position within 18 months
of commencing operations (this target was, in reality, achieved within 6 months). Once this
target is achieved, plans for the group’s expansion could start. To achieve this target; all initial
activities were concentrated on the VIP aircraft activities since this market could be developed
based upon Mr Founder ’s reputation and industry contacts.
In order to mitigate the risk of failure due to the lack to competent team members, Mr Founder
recruited a group of highly experienced professionals all of whom had prior experience of
working in the Aviation industry outside the traditional domain.
Once the business stabilized and the initial targets were achieved, Mr. Founder and the team
started to activate the other two elements of the charter i.e. Aviation consulting and Aviation
Investment.
In early 2008, the team put together the foundation of the full structure. This took about 6
months to achieve and is designed to support the overall investment vision and also ensures
that the operational and business needs of the market are also addressed.
The goal of the structure creation is defined by a set of internal as well as external functions,
as described below:
Internal functions External functions
• To create clear lines of business that are distinct and separate from each other.
• To create a clear leadership and a performance orientation for each business line.
• To create a structure that relies on line leaders.
• To enable the rewarding of individuals within the company.
• To realize the full potential of business opportunities available in the aviation industry.
• To leverage the availability of external funding sources to rapidly accelerate growth of the business.
• To bring in partners, where necessary and possible.
A strategy was developed for the development of the group structure; this strategy revolves
around a basic principle that each company in the group adheres to four clearly defined
guidelines. These guidelines are:

VALUATION REPORT IV. AAHCOMPANY Page 18
Each company has to
• Have a clearly identified business line;
• Have synergies with other companies in the Group;
• Draw from the strengths of the Group; and
• Contribute to the strength and efficiency of the Group.
As a result, a group company structure was evolved with separate independent entities being
created to meet the vision of the group. In addition, the group has entered into a number of
strategic partnerships that further enhance the ability of companies within the group to deliver
better. The companies that constitute the group and their relationship with AAHCompany are:
The group’s principal facilities and corporate offices are located in Jeddah and Riyadh in Saudi
Arabia.

VALUATION REPORT IV. AAHCOMPANY Page 19
C. The Group’s philosophy, Vision and Mission Statements
The group’s philosophies closely are reflected in its functioning, which encourages
independent functioning of its staff, each of whom is expected to take decisions
independently, and in the best interests of the key stakeholders of the business.
The Vision of the Group is:
To be recognized:
As the Middle East Leading provider of Specialized Aviation Services
and Aviation Investment Group The Mission of the Group is:
To Establish
An integrated group of companies focused on serving its Employees ,
Clients and Being an added value to its Shareholders and Business
Partners The group plans to realize its Vision, and achieve its Mission by using the following strategies:
Use our market network & position and our understanding of the
Industry & Regulation to develop:
1) Unique solutions for our clients; and
2) Low risk high reward investments
Some of the core strengths of the group arise out of the dynamic management and leadership
skills of the key persons within the group.
Critical Elements of Success
The Group’s strengths arise from its unique experience and market position which gives the
Group its ability to continually expand its business in the most lucrative segment of the VIP
and Specialized aviation market thus enhancing its market value.
The Group has also leveraged its ability to take quick decisions even while carefully weighing
the implications of these decisions. This ability to react with rapidity gives it the advantage of
being able to close deals quickly.
For a business operating in the non-traditional aviation markets in the Middle East, some of
the critical elements of success include:

VALUATION REPORT IV. AAHCOMPANY Page 20
Leadership and Management:
One of the core strengths of the Group arises from its excellent Leadership, driven by its key
management team. Some of these leadership traits include the ability to motivate the team,
to deliver non-traditional solutions.
Greatest freedom is provided to each team member, thus encouraging innovative thinking,
and pride of ownership across all levels of management.
Professional competence and managerial skills:
Each member of AAHGroup has been selected based on their vast and diverse experience in
the field of aviation. The skill sets of the team members encompass all elements of the
Aviation Industry including, Operation, Command and Control, Logistics and Maintenance,
Quality Control and Standardization, Safety and accident investigation, Remote Site Operation,
Aircraft Acquisition and Financing, Aircraft Cost Analysis, and Project Management.
The combined work experience of the core team members, as individuals, spans more than
200 years and covers almost all major Commercial and Military aviation projects established
in the Kingdom during the last 30 years.
While a number of the team members have cut their teeth learning about the traditional
aviation business with reputed and established companies, in their subsequent career paths,
they have gained business experience that has enabled them to leverage this learning for
effecting far more professional solutions. Due to the vast experience of the team, they are able
to add value to projects way beyond what is possible by any other company in the aviation
business in the Middle East.
Please refer to the Appendix I for brief CVs of the key members.
In summary, AAH is the only Saudi Group
• To have aviation investment experience in Saudi as well as international aviation markets.
• To possess unique abilities to leverage the experience of our international partners.
• To have experience across all aspects of the aviation industry – commercial, private,
military, etc.
• To have experience in end-to-end servicing of the needs of the industry from advisory to
operations.
Networking:
AAHGroup has excellent networking within the customer community, the regulator and the
industry. The strength of this networking have been built on a believe that relationships are
the essence of being able to create sustainable business models, and continuously strengthen
them. The group leverages its networking to the benefit of its clients and its partners. As a
result, the group has won a number of key business on “sole sources” basis.

VALUATION REPORT IV. AAHCOMPANY Page 21
Strategic Alliances:
AAHGroup has been recognized in the field of business and specialized aviation, and as a result
of this reputation, and its position in the Middle Eastern markets, the Group has attracted a
number of companies eager to establish a footprint in the region. Some of the well known
relationships (see following pages) are with companies such as Airbus, Comlux Group, Hawker
Beechcraft, Indianapolis Jet Centre, etc.
Some of the reputed companies with which the Group has on-going relationships include:
• Legal Advisors: Clifford Chance
• Risk Management advisors: Willis Insurance Brokerage
• International Banks: UBS, Citibank
A number of international companies constantly keep approaching us for tie-ups or long term
relationships and we continuously evaluates such propositions.
Market Understanding and Positioning:
One of the biggest challenges facing users of private and specialized aviation services has been
the inability of one company to meet the end-to-end needs of its customers. Typically, a
customer requires approaching multiple vendors for each of its needs. For example, in order
to purchase an aircraft, he will require approaching one vendor, and for financing assistance,
he may need to approach a different vendor. The design and outfitting needs are then met by
a different set of vendor’s altogether, and finally for operations and maintenance, the same
customer has to approach a different company. All of this results in loss of efficiency, and
potentially ends up as a very expensive proposition for the customer.
The private and specialized aviation industry has traditionally remained highly fragmented,
with few centers of excellence, and disaggregated business models. The AAHGroup is one of
the first and perhaps the only company in the region that can offer end-to-end solutions to
meet customers’ needs, all under one roof.
Over the past 25 years members of the AAH have been involved as individuals, in almost all
fields of the aviation market, this has given it an excellent understanding of the opportunities,
risks and needs of the market. The group is therefore not a “me-too” service provider, but we
developed our Group to address the specific market needs. This, together with experience
ensures that the Group has hands-on operations and investment experience which help it
focus on the most lucrative opportunities within the VIP and Specialized opportunities in the
aviation industry.

VALUATION REPORT IV. AAHCOMPANY Page 22
Weaknesses
Some areas that require further strengthening include:
Number of years in business:
The Group is relatively young and has been in operation for barely a couple of years. The
opportunities that are available in the non-traditional aviation business have been so vast, that
the group has been working hard to meet the demands of the industry.
However, while the Group is young, individually most of the team members have long and
varied years of experience which more than makes up for this.
Being new in business also presents an opportunity to the Group to be dynamic and respond
to emerging needs better than long established aviation service companies in the region.
Geographical spread:
The group’s business activities remain largely restricted to the Middle East. The Group
continuously evaluates new business propositions for establishing or acquiring strategic stakes
in businesses all across the world. These decisions require careful consideration and also
evaluation to ensure strategic fit with the current business objectives of the Group.
However, the presence of strong international strategic partners helps in complementing the
strong local presence that the group has in the region.
A summary of the relative competitive position of the Group and the ability this has to impact
the markets are presented through the following Strategic Implications Matrix, below:

VALUATION REPORT IV. AAHCOMPANY Page 23
As is clearly evident, though the group is young in age, it has established a formidable reputation as a
provider of business aviation services in the Middle Eastern region.
D. Summary of the Group's strengths
A summary of the strengths of the group are as follows:
1. Excellent and comprehensive understanding of the Saudi and Middle East aviation markets.
2. Well established relationships - a critical success factor for any aviation business in the region.
3. Strong Team with practical hands-on Aviation Investment and Operational experience: We are
not first-timers.
4. Ability to Provide “Total In-House” solutions for VIP aircraft owners: Never done before in the
Middle East.
5. Local presence and capabilities: With offices in Riyadh and Jeddah we are well established with
local capabilities to support our clients.
6. Regional and international presence: We have capabilities to work under different
jurisdictions.
7. Excellent understanding of the regulatory, legal and cross-border issues: We can ensure that
these critical factors are accounted for in the clients’ requirements.

VALUATION REPORT IV. AAHCOMPANY Page 24
8. Extensive industry relationship and credibility: We can take an Idea to the Industry and get
them to at least listen.
9. Quick decision making process, giving us great business agility.
10. Excellent financial strength, which is a great support for our business expansion plans.

VALUATION REPORT IV. AAHCOMPANY Page 25
E. Strategic Partnerships
In addition to these direct holdings, the AAHGroup also has strategic partnerships with reputed
aviation companies. Some of these companies include:
Airbus Corporate Jet Centre:
Airbus’ Corporate Jet Centre, which was earlier
operating as a division of Airbus, had traditional
weaknesses in marketing and deliveries.
AAHGroup sister company MAZ Consultancy,
Bahrain entered into a joint venture agreement
with Airbus, by virtue of which, it agreed to MAZ
Bahrain become a shareholder in Airbus Corporate
Jet Centre. MAZ Consultancy, Bahrain also
committed to bringing business to the Centre. As a
result, the Airbus Corporate jet Centre has turned
around and shown a rapid increase in clientele.
AAHGroup has been rewarded through an
established relationship.
Airbus has shown appreciation of the
professionalism and competence of the
AAHManagement team in managing the entire
process, commencing with the review of the
business plans, to the due diligence and closure of
the deal.
Today, Mr Founder has board representation on the company. He also regularly reviews the
performance of the company, and provides advisory support.
About Airbus Corporate Jet
Centre
Airbus is one of the world's leading
aircraft manufacturers, and it
consistently captures approximately
half or more of all orders for airliners
with more than 100 seats.
Airbus' mission is to provide the
aircraft best suited to the market's
needs and to support these aircraft
with the highest quality of service. The
Airbus product line comprises 14
aircraft models.
Airbus' Corporate Jet Centre is based
in the former EADS Sogerma facilities
at Toulouse, and regroups most of the
company's experienced cabin-
outfitting personnel under a new
management team. It is a majority
owned subsidiary of Airbus.

VALUATION REPORT IV. AAHCOMPANY Page 26
Comlux Completions:
Comlux, through its Chairman, Mr Richard Goana,
showed interest in partnering with AAHGroup for
the Middle East business. Whereas Comlux had a
strong presence in the East European and Russian
markets, AAHGroup of companies had a strong
presence in the Middle Eastern markets. A new
company, Comlux Middle East is being created by
combining their strengths.
As a result of the first successful joint venture
between AAHGroup and Comlux, Comlux has
realized the skills and ability of the AAHGroup
management and has expressed its desire to
further deepen the relationship.
Comlux has agreed to the establishment of a
strategic relationship with AAHGroup for exploring the areas of aircraft management, charter
and completions business in the region.
Comlux and the AAHGroup are continuously evaluating possible business opportunities
together, that provide them a unique ability to leverage each of their areas of expertise.
About Comlux
Comlux The Aviation Group, is
managed by Comlux Management AG,
and provides its customer with the
ultimate business aviation solution at
the highest quality level. The group is
organized in divisions, covering all of
the customer needs under the lead of
Richard Gaona.
Mr Richard Gaona is the former Vice
President at Airbus Executive and VIP
Aircraft Division. Group companies
include Comlux Aviation, Comlux
Creatives, Comlux Transactions takes,
and Comlux Completions.

VALUATION REPORT IV. AAHCOMPANY Page 27
Indianapolis Jet Centre:
Indianapolis Jet Centre is one of the few companies that has an outfitting facility for a
wide variety of aircraft, which is based out of the
USA. In 2008, the company decided to expand its
activities to include Airbus Completions. The
company was hitherto operating in outfitting of
Learjets and Challengers. Aircraft manufactures
are currently experience a record breaking order
backlog creating record demand for completions.
The manufacturer of both the Lear and
Challenger lines, Bombardier, is experience a
backlog of $22.7 billion or roughly 1.9 years.
The company, operated by its Promoter, Randy
Keeler, required financing for its expansion
program. At the same time, AAH required
additional facilities available to service its clients’
outfitting requirements. While the ACJC facility
provided it with a facility in Europe, the
opportunity through IJC opened up a window to
the smaller aircraft as well as the US markets.
Along with Comlux, AAH’s sister company MAZ Bahrain has taken an investment in IJC,
resulting in a strategic equity stake in IJC.
About IJC
Indianapolis Jet Center, Inc. (“IJC”) is
a premier aircraft completion,
modification and maintenance
company, offering a broad array of
services to selected upper market
business jets. Over 600 aircraft
interiors have been completed
including six Boeings, one Russian
TU134, 28 Gulfstreams, 52
Challengers, 120 Learjets, 12 Hawkers
and 13 Citations.
IJC has held the Federal Aviation
Administration (“FAA”) air agency
repair station designation since 1979
and also holds European Aviation
Safety Agency (“EASA”) approvals. In
addition the Indianapolis Jet Center is
a prestigious FAA Diamond Award
facility.

VALUATION REPORT IV. AAHCOMPANY Page 28
Hawker/Beechcraft:
The Middle East offers Hawker/Beechcraft, a manufacturer of both small jets and
turboprops,a large market. In fact, with a market share of 16%, it has the largest share
of private aircraft in the region after Bombardier. However, the company has been
facing challenges of reaching to two of the largest markets in the region, both in
Kingdoms of Saudi Arabia and Bahrain.
While initially, the company approached MAZ Bahrain, a sister company of AAH group
for a sole representative arrangement for its Hawker aircraft only, it also decided to
award the sole representative arrangement to the group for its Beechcraft aircraft too.
The process of selection involved detailed due diligence by the company and several
rounds of discussions and evaluation.

VALUATION REPORT IV. AAHCOMPANY Page 29
Studio E/motions:
The strategic relationship between AAHcompany
Limited and Studio E/motions is aimed at providing
much needed aircraft design services to companies
in the region. Through this strategic partnership,
the Group can seamlessly offer aircraft design
solutions to its customers, combining the deep
knowledge that AAHGroup has of the requirements
of clients in the Middle East, and the expertise that
Studio E/motions has to offer in the area of interior
design.
Mr Francis Munch, the owner of Studio E/Motions
has established a formidable reputation in the field
of interior design for aircraft, especially with Airbus.
Studio E/motions is one of the few companies that
are recognized by Airbus as a provider of services to
private aviation customers of Airbus. Studio
E/motions has also entered into an MOU with Jet
Aviation to offer them design services.
Mr Francis Munch built his reputation while working with Jet Aviation. In the Middle East, one
of his projects includes the interior design for BBJs, 757, 767, 747, A320s and an A340s for Saad
Aviation.
About Studio E/motions
Studio E/motions is a company that is
owned by Mr Francis Munch, a French
national, and has its office in 1 Street's
Vineyard, Habsheim. The company
exists as a Sarl Unipersonnelle (single
person company) with a capital of
9,000 Euro, and operates out of
France.
Mr Francis Munch has also applied for
patent for one of his design works
relating to aircraft interiors that he has
undertaken (Application number:
11/109,677, Publication number: US
2005/0236523 A1, Filing date: 20 Apr
2005, Abstract: Internal arrangement
of the walls of the fuselage of an
aircraft).

VALUATION REPORT IV. AAHCOMPANY Page 30
F. Group Company structure, holding and shareholding patterns
All the group companies listed above have been formed as closely held companies, each with
a unique business proposition and headed by a Chief Executive Officer.
Each of the companies is fully funded, based on presented and anticipated future funding
requirements, out of the internal funds of the group. Each company is formed as a company
which is held by Mr Founder Founder and AAHCompany Limited as the key shareholders.
The Equity Capital and the shareholding pattern of each of the companies are as follows:
Table 3: Shareholding Structure of the Group companies
Company Name Equity Capital Shareholding Pattern
AASCompany Limited (AAS) SR 2 million 50% - Mr Founder Founder 50% - AAHCompany
AATCompany Limited (AAT) SR3 million 50% - Mr Founder Founder 50% - AAHCompany
AA Consultants SR 20 thousand 50% - Mr Founder Founder 50% - AAHCompany
AAL Company Limited (AAL ) SR 6 million 50% - Mr Founder Founder 50% - AAHCompany
The principal shareholders of AAHCompany Limited are Mr Founder Founder , who holds 95%
of the existing share capital, and Mr Hamad Founder who holds the remaining 5% of the
capital. The Share Capital of AAHCompany Limited is SR 10 million, consisting of one hundred
thousand shares of Saudi Riyals 100 each.
The executive management team for AAHCompany Limited includes:
Individual Position
Mr Founder Founder Chairman and Chief Executive Officer
Mr Ahmed Abdullah Director on the Board of the company
Mr Saleh Abdulrahman Director on the Board of the company
Mr Nasir Alsaaed Director on the Board of the company
Brief CVs of the team members are presented in the appendix to this document.
G. Business Description
As mentioned earlier, AAHCompany Limited is the holding company for the group, and does
not perform any operations other than acting as the holding company, and making strategic
decisions to invest into new businesses or companies. The holding company is guided in its

VALUATION REPORT IV. AAHCOMPANY Page 31
decision making process by the Board of Directors, and a Strategic Advisory Committee, which
consists of the CEOs of each of the companies of the group.
The Strategic Advisory Committee meets twice a year and discusses new business
opportunities and possible plans of action.
A brief description of each of the companies and their business is as follows:
AASCompany Limited (AAS): The Company was formed in 2008 and is headquartered in
Riyadh. The Chief Executive Officer of the company is Captain Sultan AlDowaihy. Captain
Sultan has more than 25 years of experience, having started his career with Saudi Arabia
Airlines. He subsequently joined ABC in 2004 as Director, Flight Operations. During his tenure,
he was responsible for obtaining 125 and 121 certifications for the company’s operations.
AAS specializes in providing services to the private and specialized aviation clients and shall be
responsible for operations of aircraft in the region, and turnkey aircraft management services
for individuals, government and corporate. The Company is already assisting in the operations
of one aircraft, and is in negotiations with clients for operations of two other aircraft. AAS does
not directly own any aircraft, and currently assists customers by operating their aircraft for
them.
AAS has already obtained the 125 AOC certification, and is currently in the process of obtaining
its 121(S) AOC certification. These certifications will enable AAS to operate its own planes in
the future. For the purpose of this valuation, the implied investments and value realizable out
of these are not being considered.
AATCompany Limited (AAT): The Company was formed in 2008 and is headquartered in
Riyadh. The Chief Executive Officer of the company is Mr Saleh Al Rasheed. Saleh is a graduate
in Aerospace Engineering and spent his initial career with Riyadh and Dahran Air bases, and
subsequently with the Royal Saudi Air Force. His previous position before joining the
AAHGroup was as Vice President Engineering and Maintenance at ABC.
AAT is in the business of providing aviation maintenance and technical services to private and
specialized aviation clients. The Company will provide line maintenance services, including A,
B and C checks for aircraft. It will also have some support shops such as tire, wheels and
brakes, avionics, electrical, battery and interior shops. In addition, the company will provide
VIP aircraft interior upkeep services.
The main business components of the company are as follows:
1. Aircraft survey, inspection and record review & acceptance: This service takes care of,
inspecting, and reviewing the records as a part of aircraft procurement activity.
2. Design review: This service involves reviewing of aircraft design that includes outfits and
interiors, entertainment system, avionics systems, etc., in compliance with the aviation
regulatory norms with regard to material used and the design.

VALUATION REPORT IV. AAHCOMPANY Page 32
3. Heavy Maintenance Projects: This service includes checks when major parts of the aircraft are
stripped and reassembled, with the services being offered either through outsourced partners
or, where possible through available resources within the company.
4. In-service aircraft line maintenance engineering support: This is a critical service. It involves
supporting the maintenance mechanics and liaison with the manufacturer when anything is
missing in the manual.
5. Engine monitoring: This service is related to regulatory requirement and hence critical. It takes
care of obtaining the real-time data or physical data of the engine and sending it to the
manufacturer.
6. Technical publication control and distribution: This is also a critical service as an aircraft
operation is done by technical manuals. It ensures that all the technical manuals are accurate
and up- to date.
7. Aircraft record keeping: This service includes maintaining a record of aircraft maintenance
activities, alterations, etc. It provides complete traceability relating to an aircraft.
By establishing a maintenance company, the company intends to fulfill a long felt need to have
a strong player in the region who can provide services without necessarily requiring moving
the aircraft to Europe or other regions. Clients will potentially reduce their time lost in service
as well as achieve more price effective solutions than were earlier possible.
AAT has recently been awarded the 145 certification at Riyadh Airport as an approved repair
station. It is also in the process of setting up a private hangar facility at the King Khalid
International Airport at Riyadh, Saudi Arabia. For the purpose of this valuation, the implied
investments and value realizable out of these are not being considered.
AAL Company Limited (AAL ): The Company was formed in 2008 and is headquartered in
Riyadh. Mr Saleh Al Rasheed is the Chief Executive Officer of AAL as well.
The company’s main business is to provide logistic support, including the purchase, storage
and sale of spare parts to support the needs of private aviation customers. The company
currently also has a small storage unit at the airport in Riyadh. On establishment of a larger
hangar and office support at the airport, the storage unit of the company will be transferred
to this location.
The company will primarily be dealing with two types of spares: Consumables, which are for
one-time use, and Ratable items, that are re-usable and could be sent for repairs.
AAL will be actively involved in providing logistic support to aircraft that are being operated
or maintained by other companies in the group. In order to provide support, the company will
stock items that are typically expected to be consumed by aircraft users.
Where necessary, the company will also enter into relations with established manufacturers
or other aircraft spares companies in order to augment its requirements, and to extend

VALUATION REPORT IV. AAHCOMPANY Page 33
services even where it does not have adequate spares. The company holds spares arising out
of allocation of the funds received by AAS for the purposes of spares for the aircraft. This has
been assumed at the rate of US$150 thousand per month per aircraft.
Eventually, the company will be able to provide logistic support to other industries in the
region, by leveraging its logistics capabilities and thereby:
• Reducing turnaround time for supplies
• Increasing logistic efficiencies
• Reducing logistic costs
AA Consultants (AA CONSULTING): AA Consultants was initially set up as a professional
office of Mr Founder Founder in 2006. It is fully certified by the Ministry of Commerce, with
offices in both Riyadh and Jeddah. Its certification was obtained based on recommendations
and approval from both the General Authority of Civil Aviation (GACA) and the Royal Saudi Air
Force (RSAF). The primary function of the company is to offer aviation consulting, strategic
advisory, investment advisory, and project management services to governments and aviation
companies in the region.
Since inception of services, AA CONSULTING has quickly gained a formidable reputation as
provider of quality consulting services in the field of aviation. As a result, it has established
strong relationships with clients as well as vendors who have appreciated the professionalism
as well as expertise that the company has shown.
AA CONSULTING’s unique approach to client relationship ensures not only repeated business
with the same clients, but also referrals to other clients. AA CONSULTING’s clients and
relationships include high net-worth individuals, private companies and government
establishments and ministries, and virtually the who’s who of the Middle Eastern private
aviation industry. Its key clients are:
• Government Clients: These mainly consist of the Ministry of Finance, and the Ministry of
Interior, Kingdom of Saudi Arabia.
• Private: AA CONSULTING has a total of 12 VIP clients, each one represent one aircraft
project, including one Head of State.
Based on its successful execution of the first contract with the Ministry of Finance (MOF), AA
CONSULTING is today poised to enter into a long term relationship with the Ministry whereby
all future AA CONSULTING will act in an advisory capacity for all future investment related
activities for the MOF.
AA CONSULTING has also submitted a proposal to the Ministry of Interior (MOI) for assistance
in aircraft management advisory.
Mr Ahmed Abdullah is the Chief Executive Officer of the company. Omar is a product of the
reputed Embry Riddle Aeronautical University. After starting his career with ABC, he was finally

VALUATION REPORT IV. AAHCOMPANY Page 34
responsible as the Managing Director of ABC Air, the Kingdom’s first low-cost airline. During
his tenure at ABC, he was also responsible for successfully launching the Al Khayala Services.
H. Historical Financial Results
As on the date of the valuation, the companies that form a part of the group have all not yet
been formed as legal entities.
At present, most of the business of the AAH Group is conducted primarily through two legal
entities: Ajwaa Aviation, which functions as an Establishment under the Saudi laws, and AA
Consultants, which operates as a professional office under Saudi laws.
The management of AAH Group has reconstructed the financials statements of the group
based on the logical translation of businesses that belong to a specific line of activity to the
company that is expected to conduct that business.
The reorganization of the historical financial statements have been performed using a basic set
of assumptions, which are expected to substantially form the fundamental and underlying
bases for all the transactions that are expected to be conducted between companies within
the group.
These assumptions are separately being agreed to as the Service Level Agreements (SLAs)
between the companies within the group. It is possible that there may be minor modifications
to the final SLAs that could result in a variation of the individual income statements and balance
sheets that are presented; however, the overall impact is not expected to be significant, if any.
The audit of the existing legal entities has not been completed as on the date of this valuation
report. It is possible that as a result of the audit there could be modifications that could be
effected to the financial statements, and these are expected to have minor impact, in terms of
the final valuation.
Basis for preparation of the historical financials
The key rules that were applied to prepare the historical financial statements for each of the
companies are as follows:
1. AAHCompany Limited, as the holding company, provides support services to all the companies
in the group. The costs incurred for this purpose of charged to each company in the group in
proportion to the revenues of its business. This charge is based on the fact that AAHCompany
provides significant strategic support to the companies in the group, the value of which cannot
be easily estimated.
2. Mr Founder , as the Chairman and the CEO of AAH, has been assumed to draw a gross salary
of SR 100 thousand per month. This amount is in compensation for his role as the Chairman of
the group. A revised salary package, in line with the new group structure, is being worked out.
In addition, as a majority shareholder, he reserves the rights to draw dividends in accordance
with the policies of each of the companies in the group.

VALUATION REPORT IV. AAHCOMPANY Page 35
3. Profits made by AA Consultants during the current year and the previous year have been drawn
out by the promoters for reinvestment mainly in creating AAHGroup and acquiring aircraft that
are used to support AAS operations.
4. In the year 2007, AAHAviation Services Company Limited charged a fixed amount of SR1 million
Saudi Riyals as compensation for services provided by it to AA Consultants. In the year 2008,
Ajwaa Aviation Services Company Limited charged 5% of the contract size for the costs it
incurred in assisting AA Consultants in fulfilling its obligations. Ajwaa Aviation Services
Company will draw revenues mainly from operations. The Company made revenues of around
$650,000 per month on the management of one aircraft. In addition, it is paid a monthly charge
of about $5,000 per hour on aircraft flight operations.
5. AATCompany charges a fixed amount of $175,000 per aircraft that is managed by AAHAviation
Services Company towards maintenance management of aircraft operated by it. In addition,
in 2008, it charged 2.5% of the contract value for a large consulting project undertaken by AA
Consultants for assistance provided to the company in fulfilling its obligations.
6. For providing support to AATCompany, AAL Company charges a fixed monthly amount of SR
125,000 per month. This is for inventory holding costs on behalf of AATCompany. It currently
has no other revenues.
The recast historical financial statements of each of the companies in the group were analyzed
in order to understand the past performance and operating trends. It should be noted that
this analysis is done entirely based upon the unaudited financial information, and it may not
be possible to develop audited financial statements for some of these companies.
The following narrative description includes an analysis of selected income statement items,
balance sheet items, cash flow items, and financial and operating ratios.
Income Statement Data
The summary income statements for each of the companies of the group are as provided in
Appendix II to Appendix V.
Total revenue for the AAHGroup of companies increased significantly from 2007 to the first
half of 2008. Whereas in the entire year of 2007, the group had total revenue of around SR 24
million, in 2008, AAHGroup has already made revenues in excess of SR 130 million. This
represents a phenomenal of more than 437% growth in revenues. However, considering the
fact that 2007 was the first year of operations of the group, the revenues of the first year are
not entirely comparable with the revenues of 2008.
The historical net margins for each of the significant businesses in the group, and an
explanation of these returns are as follows:
Table 4: Historical Net Margins of group companies
Company Name Net Margin
2007 2008

VALUATION REPORT IV. AAHCOMPANY Page 36
AASCompany (AAS) 56% 54%
AATCompany (AAT) 33% 46%
AA Consultants (AA CONSULTING) 60% 89%
Net margins, in general, have improved across all companies in the group. This is primarily due to increased activity for the group, and also larger ticket business for the group.
The increased revenue for the group is a reflection of increasing confidence in the region for
the capabilities of the AAHGroup. Some of the revenues arose from new contracts with
existing customers, whereas others were a result of new contacts and references. In the year
2008, the biggest source of revenue was a large contract that was won by AA Consultants from
the Ministry of Finance. While it is unlikely that contracts of a similar size will be signed in the
remaining part of the current year, it is possible that the group will continue to have at least
one large contract of this nature every year.
In terms of Returns on Capital, the performance of each of the companies in the group is as
follows:
Table 5: Historical Return on Capital for group companies
Company Name Return on Capital
2007 2008
AASCompany (AAS) 21% 519%
AATCompany (AAS Tech) 1% 85%
AA Consultants 1954% 19230%
It is evident that companies in the group are generating significant returns on capital, and at
the current rate of returns, the payback for most businesses is less than one year. The Return
on Capital is high in AA Consultants both on account of low capital base, as well as the nature
of industry in which they operate.
It may also be an indicator to the fact that greater investments in the business are likely to
significantly increase the profitability of the companies in the group. Each of the businesses of
the group could grow through investment in related assets. For example, investments in
hangar facilities are likely to significantly improve the performance of AATCompany.
Perhaps the only exception to the high returns of companies in the group is AAHfor Logistics.
By nature the spares business requires larger investment in capital, and since spares are a
relatively low revenue generating item, slow moving business, the returns on capital are

VALUATION REPORT IV. AAHCOMPANY Page 37
naturally lower. However, the AAHGroup intends to use this expertise to leverage its ability
to enter other logistics businesses such as government logistic support contracts.
Balance Sheet Data
The summary income statements for each of the companies of the group are as provided in
Appendix II to Appendix V. In addition, the group has invested SR 10 million in AAHCompany.
The overall investment by the shareholders in companies in the group total are about SR24
million, with the combined balance sheet size being in excess of SR35 million.
Current assets comprise cash, accounts receivable, inventory, and other current assets. Cash
and bank account for more than SR10 million as on 31 December 2008.
Property and equipment, Fixed assets are a very small percentage of the total investments by
the group, and make for about 6% of the total capital investments by the group.

VALUATION REPORT IV. AAHCOMPANY Page 38
I. Summary
Overall, the analysis of AAHGroup companies’ historical financial statements data provided an
indication of their past performance and operating trends. In addition, the analysis provided
a basis with which to compare future cash flow estimated provided by management. Based
on the financial statement analysis outlined above, the following items were considered to be
of primary importance:
• The financial results of the companies for the year 2007 are not comparable to the financial performance of the year 2008 since all the businesses are in growth phase, and therefore have demonstrated a very rapid growth.
• Overall, the group has made revenues in excess of SR130 million and net profit in excess of SR106 million during 2008. While it may not be possible for the companies to sustain the same trend for the remainder of the year, the companies have not yet exploited the full potential of their businesses, and this is likely to get reflected only in the following years.
• Net margins on most of the companies in the group are superior to benchmark margins for companies in the region, and clearly demonstrate the potential for growth in these businesses.
• The companies in the group continue to remain underinvested and demonstrate capabilities to absorb further capital and continue to grow based on additional investments.
• The management has demonstrated an ability to sense opportunities that have not been discovered by others, and have therefore made strategic investments as well as grown into growth paths that are likely to yield significantly better results in the years to come. Partnerships in Comlux, Airbus Corporate Jet Centre, and Indianapolis Jet Centre are all a demonstration of this.

VALUATION REPORT V. INDUSTRY OVERVIEW Page 39
39
V. INDUSTRY OVERVIEW
A. Introduction
An analysis of the business aviation industry is essential to developing an understanding of the
operations of AAHGroup. Industry data was compiled from several sources including reputed
industry leaders’ published data including from Boeing, Airbus, Rolls Royce, GE, IATA, and
research organizations such as Ascend. The following sections provide: (i) an overview and
general discussion of the business aviation industry, (ii) specific statistics concerning the
business aviation industry, and (iii) projected future trends in the industry.
The industry analysis has been further subdivided based on specific industries within the
aviation industry in which each of these companies operate.
B. General Overview
The Middle East is now one of the fastest growing markets for commercial jetliners, according
to both Airbus and Boeing forecasts. Airbus predicts a growth of 6.4 percent between 2006
and 2025, primarily based on liberalization of the airline industry and a growing desire for
travel to and from the Middle East. Greatest growth will be between 2006 and 2015, at 9.1
percent, slowing down somewhat between 2016 and 2025 to 4.9 percent.
More than $21.3 billion in new orders announced at 2007’s Dubai air show underscore the
dramatic growth in Middle East aviation. Oil wealth and a favorable location between Europe
and Asia help, of course. Moreover, deregulation and start-up carriers are increasing the
supply of low-fare services and encouraging legacy airlines to spread their wings wider. The
Mid-east governments are building their own infrastructures: one example being Dubai alone
investing some $82 billion.
C. Aircraft Operations
The Middle East has some of the largest number of private and specialized aircraft in operation
outside the United States of America. The activity of purchase of new aircraft in the region has
been spurred by three main factors:
• Increasingly robust economic growth in the region.
• A desire to replace old aircraft, a number of which have already outlived their useful life.
• Changing environment where the need for specialized aviation is increasing.

VALUATION REPORT V. INDUSTRY OVERVIEW Page 40
Table 6: Average Aircraft Age
More than 20 years old 44
10-20 years old 29
5-10 years old 57
Less than 5 years old 76
(Source: Ascend Database)
The total number of private aircraft in operation in the region is estimated at more than 250.
These do not account for aircraft which are either with the ministries of various governments
and not shown in public records as private aircraft, or those which were initially purchased for
commercial aviation and subsequently converted for private aviation.
Including the aircraft on order, the total number of aircraft is in excess of 400. It is noteworthy
that there are nearly 200 aircraft on order. The breakdown of aircraft by status is as follows:
Table 7: Breakdown of status of private aircraft in the Middle East
In Service 197
Storage 16
Order 125
On Option 41
Letter of Intent 23
Option Letter of Intent 5 (Source: Ascend Database)
The aircraft on order will likely result in increased aviation activity in the region. The
breakdown of aircraft currently in operation, by country is as follows:
Table 8: Private aircraft by country of operation
(Source: Ascend Database)
Series1, Saudi Arabia, 94,
37%
Series1, United Arab Emirates, 83,
32%
Series1, Libya, 16, 6%
Series1, Lebanon, 13, 5%
Series1, Egypt, 11, 4%
Series1, Kuwait, 10,
4% Series1, Bahrain, 9, 4%
Series1, Others, 20, 8%

VALUATION REPORT V. INDUSTRY OVERVIEW Page 41
Saudi Arabia has the largest number of private aircraft in the Middle East, followed by the
United Arab Emirates.
In terms of aircraft manufacturers, Bombardier followed by the Hawker Beechcraft appear to
be the most popular aircraft in the region.
Table 9: Aircraft type operating in the region
(Source: Ascend Database)
D. Aircraft Maintenance
The aircraft maintenance, repair, and overhaul industry, generally referred to as the “MRO
market”, grew out of the early 1970’s trend of airlines committing technicians lying idle
between in-house jobs, to performing third-party contracted repairs. The airlines were
motivated by the prospect of drawing profits and productivity out of an underutilized resource.
With the labor intensive nature of the Maintenance, Repair and Overhaul (MRO), it is not
surprising that most of the leading MRO companies, aircraft engine Original Equipment
Manufacturers (OEMs) as well as almost half of global based airlines have outsourced heavy
maintenance work.
The biggest players in the maintenance business, and the annual business that they do is as
shown in the following graph. Clearly, Lufthansa Technic is one of the biggest players, with GE,
KLM, Rolls Royce, Honeywell and AMR Corp also being seen to be in the big league.
Series1, Bombardier, 51,
20%
Series1, Hawker Beechcraft, 40,
16%
Series1, Gulfstream, 36,
14%Series1, Boeing,
31, 12%
Series1, Embraer, 28,
11%
Series1,
Cessna, 25, 10%
Series1, Dassault, 16,
6%
Series1, Airbus, 14,
5%
Series1, Others, 15, 6%

VALUATION REPORT V. INDUSTRY OVERVIEW Page 42
Table 10: Key Aircraft maintenance players and their revenue estimates
(Source: TeamSAI)
The maintenance, and repair market looks strong and is expected to grow during the next 10
years by 51 percent, generating $62 billion in annual revenue by 2018. Supporting that upbeat
prediction is the fact that the commercial aviation market has witnessed 10.6 percent growth
in new aircraft deliveries and 5.1 percent growth in aircraft utilization. That trend is expected
to continue.
The value of maintenance industry rose a modest 1.3 percent in 2007 to $38.8 billion, but it is
expected to grow at a pace approaching 5 percent annually over the next five years as the
recent decline in labor rates bottoms out and engine overhaul costs continue their upward
trajectory. The annual MRO Forecast, prepared for O&M by TeamSAI and BACK Aviation
Solutions, predicts a compound annual growth rate (CAGR) of 4.7 percent, with the worldwide
MRO market reaching a value of $48.8 billion by 2011.
Table 11: Forecast for Air Transportation market
(Source: AeroStrategy)

VALUATION REPORT V. INDUSTRY OVERVIEW Page 43
The main components of the aircraft repair and maintenance business consist of HMV and
Mod, Line maintenance, Engines, and components. The breakdown of these businesses is
projected to be as follows:
Table 12: Maintenance industry breakdown by type
TeamSAI foresees Asia’s Aircraft maintenance demand to increase by 21 to 26 percent.
Maintenance facilities in the Middle East are bound to grow. Major carriers are achieving the
scale necessary for more complete in-house work, although they still will need global partners.
And international Maintenance companies increasingly will need to have facilities in the
region, according to Fouad Attar, Air France Industries' sales and Marketing Vice President.
Several third-party shops in the Middle East already are highly competitive in airframe checks
and cargo conversions. The most capital-intensive component work still will be done outside
the region, but local component resources are being strengthened and some engine facilities
in the Middle East will be upgraded.
The maintenance units of the fastest growing Middle East airlines may concentrate chiefly on
their own fleets, at least for a while. But several shops aggressively are pursuing third-party
work, within the region, across the Mediterranean and over the globe.
In the Middle East, several firms in countries without massive oil resources also are expanding
their maintenance capabilities and looking for new markets.
• GAMCO a subsidiary of Gulf Air's takes care of maintenance, which has been the only
Middle East shop to provide broad third-party support for the Airbus jets that have been
dominating recent aircraft orders.
GAMCO's 1,700 employees provide a wide range of maintenance, including all heavy
airframe checks for Gulf Air, Etihad and Sharjah's Air Arabia. GAMCO has worked for
airlines around the world, including DHL, Qatar, Air France, Iberia and American Trans Air.
GAMCO supports all Airbus and most Boeing jets, except for the 747 and 777. GAMCO is
expanding in both scale and scope. "Demand for maintenance services will increase in the
region as more and more low-cost carriers and start-up airlines with smaller aircraft fleets
emerge," said a senior GAMCO official.

VALUATION REPORT V. INDUSTRY OVERVIEW Page 44
GAMCO plans to double its capacity within the next few years. In 2006, a new hangar that
can accommodate three 777s was opened, allowing GAMCO to begin heavy checks on this
model. Heavy maintenance on 747s is added soon as additional hangar space is complete.
GAMCO engine shops, which currently specialize in GE CF6-80C2s and CFM56-5As, will be
expanded to do full overhauls of Trent 700s. GAMCO expects to add 7,000 square feet of
shop space in the next five years. Overall, total staff is expected to increase by as much as
150 percent by 2010.
• JorAMCo's Hadi sees plenty of opportunity as airlines are expanding fleets and looking for
better maintenance solutions such as one-stop shops and comprehensive MRO services.
JorAMCo's airframe capabilities, which included heavy checks on A310s, A320s and 727s,
have expanded to cover A300-600s, A330s and 737s. New ownership capital will bring
further expansion by early 2007. To its current three hangar bays, capable of handling
three wide bodies, JorAMCo will add three more bays and 300 square meters for cabin
maintenance. The current staff of 650 will be increased by 50 percent over 18 months.
JorAMCo recently adopted new maintenance software and hired Mercer to help with a
continuous improvement program.
JorAMCo does about 60 percent of its business in airframe maintenance, including third-
party checks for Air India, Air Luxor, debis AirFinance and Eurowings. Hadi now wants to
team up with one or two major suppliers, so that JorAMCo can do airframe work (at labor
rates that are 70 percent of European levels), while sending engines and most components
to major European firms. Hadi expects to grow the airframe business serving low-cost and
charter airlines from both Europe and the Middle East, along with home-carrier Royal
Jordanian.
JorAMCo focuses on a few components where it has special strengths. It recently became
an approved repair center for hydraulic components made by Eaton Aerospace, and Hadi
is looking for similar agreements with other component manufacturers.
VALUATION REPORT V. INDUSTRY OVERVIEW Page 45
E. Aircraft Spares
Internationally, the market for aircraft parts in the civil aviation sector is dominated by Boeing
(60 per cent of the global market) and Airbus Industry (30 per cent of the market). This
oligopoly (Boeing and Airbus) controls the standards that aircraft parts suppliers must meet.
In addition to this concentration of companies, the aerospace component industry and market
is concentrated geographically in the United States (75 per cent), although Europe (14 per
cent) and Japan (5 per cent) are important centres. The military aircraft parts industry is
dominated by large aerospace and defence conglomerates in a small number of large,
industrial countries such as the United States, France and the United Kingdom.
Aircraft hydraulic and pneumatic assemblies comprise 6.7% of total industry shipments. The
split between civilian and military hydraulic and pneumatic assemblies is 78% for civilian and
22% for military applications. Aircraft power transmission equipment comprises 6.1% of total
industry shipments. The split between civilian and military power transmission equipment is
56% for civilian and 44% for military applications.
The parts business requires a high degree of service and local interaction with the airline
companies. Parts are more customized, and are not the high volume commodity type of parts
found in the automotive sector, for example. Because of the international scope of the market
currency fluctuations, tariffs and similar import limitations, price controls and labor
regulations can have a major impact on the sectors financial health. This is exacerbated by the
fact that the industry is capital intensive compared to other manufacturing concerns.
Aircraft spare parts conditions are classified within the industry as (i) Factory new, (ii) New
surplus, (iii) Overhauled, (iv) Serviceable and (v) As removed.
A factory new or new surplus part is one that has never been installed or used. Factory new
parts are purchased from manufacturers or their authorized distributors. New surplus parts
are purchased from excess stock of airlines, repair facilities or other redistributors. An
overhauled part has been completely disassembled, inspected, repaired, reassembled and
tested by a licensed repair facility. An aircraft spare part is classified serviceable if it is removed
by the operator from an aircraft or engine while operating under an approved maintenance
program and is functional and meets any manufacturer or time and cycle restrictions
applicable to the part. A factory new, new surplus, overhauled or serviceable part designation
indicates that the part can be immediately utilized on an aircraft. A part in "as-removed"
condition requires functional testing, repair or overhaul by a licensed facility prior to being
returned to service in an aircraft.
OEM is the best long term solution for parts supply. Traditionally, many companies
manufacture spare parts only, under the wing of an OEM. However, the FAA’s recent PMA
process allows private vendors to reverse-engineer parts and sell the non-OEM parts at a
reduced price. While this could be very significant in the future, the penetration of PMA parts
today is still small.

VALUATION REPORT V. INDUSTRY OVERVIEW Page 46
OEMs will bundle total care programs with new aircraft sales. For example, HEICO, a PMA parts
manufacturer with a strong presence in the aftermarket distribution system, has
agreements/partnerships with major airlines – including Lufthansa (which owns 20 percent of
HEICO), American Airlines, United Airlines and Delta Airlines. The company has also established
a significant global footprint with operations throughout the United States, in Europe and in
Asia. Twenty-eight percent of its revenues come from international operations.
The parts brokers also have a significant role to play in the parts supply chain. Brokers are often
smaller businesses run by personnel previously employed by OEMs, airlines or other aviation
organizations who use their extensive personnel network of suppliers and customers to get
the parts delivered where and when their customers need them. When an executive jet is
grounded for a part, a broker’s handling fee is not the largest problem facing aircraft fleet.
Some of the key players in the aircraft spares business include the following:
• Lufthansa Technik Logistik is a leading international player in time critical material supply
and spares logistics for the aviation industry. The company supports a network of up to
1,000 aircraft around the world for more than 450 customers. The company was
established in 1998 from Lufthansa Technik AG and has developed since then on a stable
growth course. In 2005, LTL achieved sales of €€133 million with a workforce of some
1,000.
• HEICO offers its products at prices which are 20 to 50 percent lower than those demanded
by the original manufacturers for identical products. HEICO Aerospace offers 3,000
different parts, to which it adds 300 new ones every year. The parts produced at HEICO
are designed (and approved by the FAA) to be equal to or better than the original
manufacturer’s parts.
• Unison Industries is a world leader in the design, manufacture, and integration of electrical
and mechanical components and systems for aircraft engines and airframes. Unison serves
both original equipment manufacturers and aftermarket customers in the general,
commercial, and military aviation markets. The company manufactures turbine and piston
engine ignition systems, electric power generation and control systems, electrical wiring
harnesses and panel assemblies, sensors, switches, and bellows assemblies, tubing,
ducting, brackets, flex joints, and air valves.
Unison sales at the privately-held company were up 13 percent to more than $150 million
in 2004 and were up a sizable amount in 2003 as well. And the company has been churning
out contracts for new parts deals at an unusually fast clip.
• Goodrich Corporation (NYSE: GR) has formed an alliance to streamline the sale of its
Aviation Technical Services division's spare parts inventory to customers such as airlines
and providers of maintenance repair and overhaul services. The Everett, WA-based
Aviation Technical Services team, working with Tracer, an aircraft aftermarket parts and
services provider, has formed a three-year alliance to outsource the marketing and sales
of its spare parts inventory.

VALUATION REPORT V. INDUSTRY OVERVIEW Page 47
The Goodrich spare parts inventory includes airframe and engine parts, Auxiliary Power
Units, wheels and brakes as well as a large number of aircraft expendables.
• International Airline Support Group Inc believes that the annual worldwide market for
aircraft spare parts is approximately $10 billion, of which approximately $ 1.3 billion
represents sales of aircraft spares parts to the redistribution market. The company
believes that this market will continue to grow due to several trends. According to Boeing’s
current market outlook (the “Boeing Report”), the demand for aircraft continue to grow
with the world fleet of aircraft projected to increase to 17,000 in 2006 from 11,500 in 1999.
The company believes that, over the long term, the growing number of aircraft will
increase demand of spares parts.
F. Aviation Consulting
About 1,500 companies provide airport support services to the general aviation (private and
business plane) market, with combined annual revenue of $3 billion. Most companies are
either privately held or are divisions of larger corporations. Most aviation services firms are
single-facility operations with annual revenue less than $1 million. About 50 companies have
annual revenue over $10 million and operate facilities at multiple airports.
Local and regional air travel, especially business travel, drives demand for aviation services to
small and private aircraft. Profitability is based on sales volume, as prices fluctuate only
periodically. Small companies can compete effectively in hometown markets. Big companies
have more clout in negotiating with suppliers, which allows them better pricing.
The competition comes in several forms:
1. The most significant competition is no consulting at all, companies choosing to do business
development, channel development and market analysis in-house. Their own managers
do this on their own, as part of their regular business functions. AA Consultants’ key
advantage in competition with in-house development is that managers are already
overloaded with responsibilities; they don't have time for additional responsibilities. Also,
AA CONSULTING can approach alliances, vendors, and channels on a confidential basis,
gathering information and making initial contacts in ways that the corporate managers
can't.
2. The high-level prestige management consulting: SH&E, Aviation Consulting LLC, etc. These
are essentially generalists who take their name-brand management consulting into
specialty areas. Their other very important weakness is the management structure that
has the partners selling new jobs, and inexperienced associates delivering the work. We
compete against them as experts in our specific fields, and with the guarantee that our
clients will have the top-level people doing the actual work.
3. Sales representation, brokering, and deal catalysts are an ad-hoc business form that will
be defined in detail by the specific nature of each individual case.

VALUATION REPORT V. INDUSTRY OVERVIEW Page 48
G. Understanding the Non-traditional Aviation Market
The Saudi Arabian market is characterized by a large aviation sector need which demands a
non-traditional and innovative solution. Whereas the traditional market is crowded with a
number of players, all competing for the same aircraft, the non-traditional market
opportunities arise out of customer needs that are currently not serviceable based on a
traditional approach.
Some of the typical examples are for the governmental sectors, and the Hajj and Omrah
markets. The solutions required to service these markets cannot be provided without having
strategic alliances and relationships that can be leveraged to deliver such options.
H. Conclusion
The Saudi Arabian Aviation market is the largest in the Middle East. The Saudi Arabian
aviation market is one of the most stable globally due to the following factors:
o High expenditure on defense and security
o One of the most stable commercial Air Transportation markets globally due to
the existence of inherent stabilizing forces that do not exist in other markets.
o Saudi Arabia is the oldest and largest private aviation market outside the USA
and Europe.
AAHGroup operates in practically all areas related to private aviation. As a result, it is generally
insulated from the economic cycles related to the industry: a possible downturn in one sector
is more than compensated by an upturn in another sector.
Given the robust economic growth of the region, and the heightened private aviation activity,
the future growth of the group companies is well assured.
AAHGroup, in a short span of time, has already proven its capabilities in managing a profitable
business, having rapidly achieved recognition, revenues and profitability in each of the
companies in operation. AAHGroup has a headstart over other companies of nearly 2 years
due since it has:
• Tried “Clay imaging the market”; hence the Group is providing solutions to existing needs
instead of developing needs for existing solutions.
• It has already established a group that, at its initial phase, is not asset dependant.
• Create a structure that will ensure access to assets without the financial burden of having
to be constrained by ownership of the assets.

VALUATION REPORT VI. ECONOMIC OVERVIEW Page 49
49
VI. ECONOMIC OVERVIEW
A. Review of key economic indicators
Saudi Arabia has an oil-based economy with strong government controls over major economic
activities. It possesses more than 20% of the world's proven petroleum reserves, ranks as the
largest exporter of petroleum, and plays a leading role in OPEC. The petroleum sector
accounts for roughly 75% of budget revenues, 45% of GDP, and 90% of export earnings. About
40% of GDP comes from the private sector. Roughly 5.5 million foreign workers play an
important role in the Saudi economy, particularly in the oil and service sectors. High oil prices
have boosted growth, government revenues, and Saudi ownership of foreign assets, while
enabling Riyadh to pay down domestic debt. The government is encouraging private sector
growth - especially in power generation, telecommunications, natural gas exploration, and
petrochemicals - to lessen the kingdom's dependence on oil exports and to increase
employment opportunities for the swelling Saudi population, nearly 40% of which are youths
under 15 years old. Unemployment is high, and the large youth population generally lacks the
education and technical skills the private sector needs. Riyadh has substantially boosted
spending on job training and education, infrastructure development, and government
salaries. As part of its effort to attract foreign investment and diversify the economy, Saudi
Arabia acceded to the WTO in December 2005 after many years of negotiations. The
government has recently announced plans to establish six "economic cities" in different
regions of the country to promote development and diversification, and this move is expected
to significantly benefit the economy of the region.
The Saudi economy continued its good performance during 2006 with the improvement in oil
prices. According to OPEC’s data, the average price of the Arabian Light oil rose from $50.15
a barrel in 2005 to $61.05 a barrel in 2006. This rose further to a high of $150 per barrel inmid-
2008, but has subsequently fallen back to about $80 per barrel. Given the high demand for
oil, the volatility of oil prices is expected to continue for some time until there is economic
stability in some of the high growth countries such as China and India.
The data of the Ministry of Petroleum and Mineral Resources indicated that the Kingdom’s oil
output stood at 9.21 million b/d compared to 9.35 in the preceding year, decreasing by 1.6
percent. The continued improvement in oil prices was reflected in all economic conditions of
the Kingdom. The growth rate of GDP (at current prices) rose by 10.6 percent to SAR 1.3 trillion
while the real growth was 4.3 percent, amounting to SAR 798.9 billion. The state budget
registered a substantial surplus, amounting to SAR 289.7 billion or 22.2 percent of GDP as
compared to a surplus of SAR 217.9 billion or 18.4 percent in the preceding year. The balance
of payments current account recorded a surplus for the eighth consecutive year, amounting
to SAR 357.7 billion, increasing by 6.0 percent over the preceding year.
Some of the significant economic indicators for the past five years are presented in the table
below and discussed in the paragraphs that follow:

VALUATION REPORT VI. ECONOMIC OVERVIEW Page 50
Table 13: Economic Indicators for Saudi Arabia
Indicator 2002 2003 2004 2005 2006
GDP at current prices (SR bn)
701.10 804.6 938.8 1,182.5 1,307.5
Real GDP growth (%)
- - - 6.1 4.3
Budget deficit (as a % of GDP)
-2.9 4.5 11.4 18.4 22.2
Population (mn) 21.49 22.02 22.67 23.1 23.68
Exports (SR bn) 271.7 349.7 472.5 677.1 786.6
Current account balance (SR bn)
44.5 105.2 194.7 337.5 357.7
Oil production (mn barrels/day)
- 3,070 3,256 3,414 3,361
Exchange rate (SR: $)
3.75 3.75 3.75 3.75 3.75
(Source: SAMA)
B. Oil sector overview
Oil is the leading industry in Saudi Arabia and is an indicator of the state of the economy.
Historically, it has contributed, on an average, just under 40% of the GDP and almost 75% of
the government’s revenue. The Kingdom, with oil reserves of 261.2 billion barrels, accounts
for 26.9% of the world oil reserves.
Despite four years of high oil prices, increasing market tightness is expected beyond 2010,
with OPEC spare capacity declining to minimal levels by 2012. A stronger demand outlook,
together with project slippage and geopolitical problems has led to downward revisions of
OPEC spare capacity by 2 mb/d in 2009.
Global oil product demand is forecast to expand by 2.2% per year on average between 2007
and 2012, from 86.1 mb/d to 95.8 mb/d, underpinned by an annual global economic growth
rate of +4.5% on average over the period. This represents an annual average volumetric
growth of 1.9 mb/d. Growth will be driven by non-OECD countries, where demand is seen
increasing more than three times
Saudi Arabia is responsible for almost half of expected OPEC capacity growth to 2012, as
capacity reaches 12.6 mb/d in 2012, a rise of 1.8 mb/d from 2007. The 900 kb/d Manifa project
(Arab Heavy) is now included from 2011, with crude here likely destined for new complex
Saudi refining capacity. Otherwise, Saudi crude expansion largely centres on its
lighter/sweeter grades from Khursaniyah, Shaybah and Khurais, together with associated gas
liquids. (Source: International Energy Agency)

VALUATION REPORT VI. ECONOMIC OVERVIEW Page 51
C. Inflation
The general cost of living index (for all cities) in Saudi Arabia recorded an increase of 2.2
percent to 101.8 during 2006 against a rise of 0.7 percent in the previous year. Such a relative
increase in the cost of living index represents the annual inflation rate, measured by the
change in the general price level. The increase in the cost of living index was attributable to
the rise in the prices of some items of major expenditure groups. Prices of food and beverages
rose by 5.4 percent in 2006 compared with a rise of 3.0 percent in the previous year. Prices of
house furnishing increased by 0.3 percent compared to the index in 2005 and 2004 which
stood at 94.5. Education and entertainment prices maintained the same rise of 0.2 percent of
the preceding year. Prices of goods and other services went up by 7.8 percent against an
increase of 2.4 percent in the preceding year, recording the highest rise in the major
expenditure groups.
Table 14: Cost of Living Indices
Year General Index % Change
1999 100 -
2002 98.00 -
2003 98.6 0.6
2004 98.9 0.3
2005 99.6 0.7
2006 101.8 2.2 (Source: SAMA Economic Survey Report)
D. Demography
The latest estimates of the Central Department of Statistics state that the population of the
Kingdom total 28.14 million in July 2008. The Saudi national population is around 22.7 million,
representing approximately 80.4% of the total population and the remaining comprises
expatriates. The average population growth rate is around 1.9% per annum. This growth rate,
however, disguises the fact that the national residents population is growing at a much faster
rate than the expatriate population. The former is believed to be increasing at an average
annual growth rate of 5 - 6% while the later is increasing at around 1 - 2% per annum.
Among Saudi nationals, persons whose ages ranged from 15 to 64 years constituted 59.5% of
the total population while those above the age of 65 years constitute only 2.40% of the
population.
Table 15: Demographic breakdown of the Saudi Population
% of total Male Female
0-14 years 38% 5,458,023 5,245,911
15-64 years 59.50% 9,470,353 7,284,696
65 years and over 2.40% 356,910 330,764 (Source: CIA fact book, 2008)

VALUATION REPORT VI. ECONOMIC OVERVIEW Page 52
The rate of population growth amongst Saudis has declined from 3.87% in 1992 to 2.49% in
2004. The decline amongst Saudis can be explained by a number of factors: increased
urbanization, improved literacy levels amongst females, and openness to the modern world
through satellites and of late through the internet. All these factors have a proven negative
correlation with population growth.
In the long run, this downward trend is likely to continue and the population is expected to
grow at 2.07% over the next decade, after which it will significantly decline to around 1.54%
during 2015-2025. (Source: AME Info)
The average household size in Saudi Arabia has seen a downward trend - from 7.4 people in
1987 to 5.7 in 2004 - a year on year decrease of 1.57%. And all indications show a further
reduction to around four by 2015.
E. Employment
Manpower development is one of the cornerstones for overall development and its
sustainability because of its pivotal role in refining skills, activating capabilities and developing
human competence in scientific, professional and technical aspects to meet development
requirements and immediate and future needs of the labour market.
The total labor force in the Kingdom stood at 8.02 million of whom 6.78 million are male
workers (84.5 percent of the total labor force), and the total number of working laborers was
7.52 million (6.46 million male or 80.5 percent of the total labor force). It also showed that
the Saudi labor force amounted to 3.9 million (3.23 million male or 40.3 percent of the total
labor force). The number of Saudi working laborers stood at 3.43 million (2.94 million male or
36.6 percent). The non-Saudi manpower amounted to 4.12 million (3.55 million male or 44.2
percent of total manpower). The total number of non-Saudi working labourers stood at 4.09
million (3.52 million male or 43.9 percent).
Table 16: Saudi Labor force
Labor Employed Unemployed
Nationality Male Female Total Male Female Total Male Female
Total
Saudis 3,230,200
670,391
3,900,591
2,937,293
494,278
3,431,571
292,907
176,113
469,020
Ratio to total 82.8 17.2 100 85.6 14.4 100 62.5 37.5 100
Ratio to grand total
40.3 8.4 48.6 36.6 6.2 42.8 3.6 2.2 5.8
Non-Saudis 3,550,350
573,944
4,124,294
3,524,202
567,216
4,091,413
26,152
6,729 32,881
Ratio to total 86.1 13.9 100 86.1 13.9 100 79.5 20.5 100
Ratio to grand total
44.2 7.2 51.4 43.9 7.1 51 0.3 0.1 0.4
Grand Total 6,780,550
1,244,335
8,024,885
6,461,495
1,061,494
7,522,984
319,059
182,842
501,901

VALUATION REPORT VI. ECONOMIC OVERVIEW Page 53
Labor Employed Unemployed
Nationality Male Female Total Male Female Total Male Female
Total
Ratio to grand total
84.5 15.5 100 80.5 13.2 93.7 4 2.3 6.3
(Source: Central Department of Statistics and Information, Ministry of Economy and Planning)
F. Interest rates
Since the Saudi exchange rates are closely linked to the US-dollar, the interest rate movement
for domestic deposits closely follows the US patterns. The Saudi Riyal rates are higher than
the US-dollar rates, primarily to account for the higher country risk. On short term deposits
(inter-bank rates), the rates for US-dollar and Saudi Riyals are as shown in the table below:
Table 17: Interest rate data
Year Saudi Riyal deposit rates (%)
6-month 12-month
2002 2.408 2.810
2003 2.695 1.947
2004 1.932 2.318
2005 3.928 4.170
2006 5.155 5.284 (Source: SAMA quarterly statistical report)
G. The Securities Market
The Saudi bond market is controlled by SAMA. These securities are only issued to banks in
the Kingdom and there is no active secondary market. The amount of Government bonds
issued has steadily increased over the years. The subscription to Treasury bills and
Government bonds over the past four years is as follows:
Table 18: Government securities subscription
(in SR billion)
2004 2005 2006 2007
Outstanding treasury bills 266 715 9,131 5,752
Outstanding govt. bonds 146,390 127,091 114,122 118,650 (Source: SAMA quarterly reports)
With substantial improvement in its fiscal position over the last four years, the government
has substantially reduced its public debt which coupled with the strong GDP growth brought
down steadily the ratio of public debt to GDP from 82.0 percent in 2003 to 65.0 percent in
2004, to 38.9 percent in 2005 and 27.9 percent in 2006. Public debt in Saudi Arabia is entirely
owed to local institutions.

VALUATION REPORT VI. ECONOMIC OVERVIEW Page 54
The government also reduced its recourse to weekly issue of Treasury bills from SAR 2 billion
in 2005 to SAR 1.0 billion in 2006 and quarterly issue of Government Development Bonds
(GDBs) from SAR 5.0 billion to SAR 1.5 billion over the same period. Issuance of Floating Rate
Notes (FRNs) was stopped in 2006.
Commercial banks' investments in government securities decreased during 2006 by SAR 4.5
billion or 3.6 percent to SAR 123.3 billion, while total bank credit rose by SAR 44.6 billion or
9.8 percent to SAR 497.1 billion at the end of 2006. Actual loans disbursed by the specialized
credit institutions amounted to SAR 10.2 billion during 2006, denoting a rise of 16.9 percent
(SAR 0.3 billion) as compared to the preceding year.
H. Equity Markets
With a view to regulating and developing the capital market operation, the Capital Market
Authority (CMA) issued a set of regulations including the implementation regulations of the
Capital Market Law. In 2006, CMA issued several significant regulations concerning the market
operation such as the Real Estate Investment Funds Regulations, and the Corporate
Governance Regulations. The total number of licensed brokerage firms and consultation
offices stood at 37 in 2006, raising their number to 45 by the end of 2006.
At the end of 2006, the number of traders registered in Tadawul system stood at 3,574.6
thousand against 2,573.6 thousand at the end of the previous year, increasing by 38.9 percent
(1.0 million). The number of traders who traded on-line trading amounted to 543.0 thousand
at the end of 2006 compared to 245.5 thousand at the end of 2005, rising by 121.2 percent.
The number of companies whose shares were traded on the Saudi share market reached 86
at the end of 2006, with an average market capitalization of $3,800.6 million per company.
The key figures for the market for the past few years are as follows:
Table 19: Capital market data
2002 2003 2004 2005 2006 * 2007
Value of traded shares (SR bn) 133.79 596.51 1,773.86 4,138.70 5,261.85 854.51
Number of shares traded (million)* 8,679.20 27,829.30 51,491.70 61,406.65 68,515.28 18,792.14
Number of transactions (‘000s) 1,033.67 3,763.40 13,319.52 46,607.95 96,095.92 21,444.27
Market capitalisation (SR bn) 280.73 589.93 1,148.60 2,438.16 1,225.86 1,193.92
The share index (1985 = 1000) 2,518.08 4,437.58 8,206.23 16,712.64 7,933.29 7,666.11

VALUATION REPORT VI. ECONOMIC OVERVIEW Page 55
Rate of return on current index (%) 3.62 76.23 84.93 103.66 -52.53 -55.06
*Revised data to exclude the effect of the split of the nominal value of all listed companies’ shares to be SAR10 per share instead of SAR50 in April 2006.
(Source: SAMA Annual Report)
During 2006, ten new companies (with a total capital of SAR 14.27 billion and 1,411.4 million
shares) offered 465.4 million shares for public subscription with a total value of SAR 10.45
billion. The total value of shares subscribed for stood at SAR 30.42 billion, as the rate of over-
subscription was 2.9 times at the market level, and the average rate of over-subscription was
4.2 times.
A comparison of the selected Arab share markets during 2006 shows that the Saudi share
market recorded the highest indicators among all Arab share markets. Market capitalization
of the Saudi share market stood at $326.9 billion, compared to an average of $59.2 billion for
the Arab countries composing AMFI. Market capitalization of the Saudi share market
represented 36.8 percent of total market capitalization of Arab securities markets at the end
of 2006. The value of shares traded on the Saudi share market rose to $1,402.9 billion,
constituting 83.3 percent of total value of shares traded in the markets of Arab countries
participating in Arab securities markets’ data base.
The sector-wise distribution of companies based on the value traded as at 30 June 2008 is as
follows:
Table 20: Sectoral value traded for Saudi Stocks
Sector Value Traded % Of Market
Petrochemical Industries 166.50 28.63%
Telecommunication & Information Technology 77.36 13.30%
Banks & Financial Services 65.85 11.32%
Building & Construction 48.44 8.33%
Real Estate Development 48.19 8.29%
Insurance 36.08 6.20%
Industrial Investment 35.00 6.02%
Agriculture & Food Industries 26.56 4.57%
Transport 24.83 4.27%
Multi-Investment 17.95 3.09%
Retail 13.72 2.36%
Cement 7.33 1.26%
Energy & Utilities 6.87 1.18%
Media and Publishing 3.79 0.65%
Hotel & Tourism 3.11 0.53%
Total 581.59 100.00% (Source: Tadawul Quarterly Report, 2008)

VALUATION REPORT VI. ECONOMIC OVERVIEW Page 56
The biggest sectors of the Saudi stock market are the petrochemicals and telecom sectors.
I. Industrial Scenario
At the end of 2006, the total number of the existing companies licensed by the Ministry of
Commerce and Industry rose to 16,514 with a total capital investment of SAR 414.7 billion.
The total capital of joint-stock companies constituted 63.4 percent of the total capital of the
existing companies during 2006, and limited liability companies accounted for 33.1 percent
During 2006, the Ministry of Commerce and Industry issued commercial licenses for the
establishment of 38,462 commercial individual proprietorships spread over the various
regions of the Kingdom. These were mainly concentrated in Riyadh Region (33.3 percent),
followed by Makkah Region (22.5 percent), and the Eastern Region (20.4 percent). The
wholesale and retail trade accounted for the biggest proportion of those licenses classified by
economic activity and constituted 98.8 percent of the total number of new businesses. Thus,
at the end of 2006, the total number of operating individual proprietorship firms licensed by
the Ministry of Commerce and Industry rose to 646.9 thousand, of which 30.8 percent was in
Riyadh Region, 26.1 percent in Makkah Region and 16.4 percent in the Eastern Region.
Of the total number of the existing units licensed by the Ministry of Commerce and Industry
in the Kingdom up to the end of 2006, there were 520 units, with a total capital of SAR 147.8
billion, operating under the Foreign Capital Investment Law, providing employment to 88
thousand employees and workers, accounting for 13.3 percent of the total units existing in
the Kingdom and 49.8 percent of total financing. A breakdown of these units by industrial
activity and total financing indicates that chemical and plastic product industries (141 units)
accounted for 83.1 percent of total financing, followed by construction materials, ceramics
and glass (61 units) which accounted for 6.5 percent, basic metal industries (112 units) 3.1
percent, food and beverages (46 units) 2.6 percent, and manufactured metal products and
machines (90 units) 2.5 percent of total financing. These five industries (450 units) constituted
86.5 percent of the total number of industrial units operating in the Kingdom under the
Foreign Capital Investment Law, accounting for 97.8 percent of their total financing.
J. Future economic outlook
The global financial market turmoil has had little direct effect on the Middle East, although
the depreciation of the U.S. dollar is complicating policymaking in some countries. Regional
growth remains strong, reaching 5.8 percent in 2007. In Saudi Arabia, in particular, increases
in oil production have been limited, but high oil prices are supporting increased government
spending, including on infrastructure and social projects, and strong expansion of credit to the
private sector. Despite the increase in domestic spending and imports, the large current
account surpluses in these countries have narrowed only slightly — to about 22¾ percent of
GDP — as higher oil prices have further boosted export revenues.
Table 21: Growth estimates for the region

VALUATION REPORT VI. ECONOMIC OVERVIEW Page 57
Real GDP Consumer prices Current Account Balances
2006 2007 2008 2009 2006 2007 2008 2009 2006 2007 2008 2009
Middle East
5.80 5.80 6.10 6.10 7.00 10.40
11.50
10.00
20.90
19.80
23.00
19.40
Oil Exporters
5.80 5.60 6.00 5.90 7.60 10.50
12.20
10.40
24.00
22.80
26.30
22.40
Iran 5.80 5.80 5.80 4.70 11.90
17.50
20.70
17.40
9.30 10.40
11.20
8.40
Saudi Arabia
4.30 4.10 4.80 5.60 2.30 4.10 6.20 5.60 27.40
26.80
31.30
24.00
UAE 9.40 7.40 6.30 6.40 9.30 11.00
9.00 5.30 22.00
21.60
27.50
26.00
Kuwait 6.30 4.60 6.00 6.20 3.10 5.00 6.50 5.50 51.70
47.40
45.20
42.30
Mashreq 5.90 6.30 6.20 6.50 5.40 9.50 8.40 8.20 –2.4 –2.8 –3.0 –3.4
Egypt 6.80 7.10 7.00 7.10 4.20 11.00
8.80 8.80 0.80 1.50 0.80 –0.5
Syria 4.40 3.90 4.00 4.80 10.60
7.00 7.00 7.00 –6.1 –5.8 –6.6 –5.5
Jordan 6.30 5.70 5.50 5.80 6.30 5.40 10.90
6.50 –11.3
–17.3
–15.5
–13.4
Lebanon — 4.00 3.00 4.50 5.60 4.10 5.50 5.30 –6.0 –10.7
–9.8 –10.2
(Source: World Economic Outlook, IMF)
The short-term outlook for the region generally remains positive. Growth is projected to rise to
over 6 percent in both 2008 and 2009, the current account surplus is expected to remain very
large, and inflation pressures should moderate. Risks to the outlook at this stage appear broadly
balanced. Continued high oil prices and/or the large cut in U.S. interest rates could stimulate a
stronger than expected expansion of domestic demand, although this would likely come at the
cost of higher inflation and would create risks of a possible asset price bubble. A broad-based
global slowdown that resulted in a substantial drop in oil prices and regional geopolitical
uncertainties are the main near-term downside risks to the outlook.
VALUATION REPORT VII. FINANCIAL PROJECTIONS Page 58
58
VII. FINANCIAL PROJECTIONS
We have prepared these financial projections for the purpose of assessing the future prospects and
profitability of the company in order to arrive at an estimated fair market value of the company’s
equity. These projections have been prepared using hypothetical assumptions about future events and
planned activities by the management of the companies. However, it is not possible to state with
certainty that these projections will be achieved. It is possible that the company may exceed or
underachieve some of the projections for individual companies. Actual results may differ from the
projections since anticipated events frequently do not occur as expected and variation may be
material.
Appendix II to VI present the selected income statement data, balance sheet data, and the cash flow
statements used to develop each Company’s estimated debt-free cash flow available for distribution.
The primary assumptions applied in the analysis are summarized below.
A. Income Statement Assumptions
Revenue
The revenue growth assumptions for each company are based on historical performance and
an assumption of increase in growth over the next few years. For the year 2008, estimates are
made for the reminder of the year on the basis of best estimates of management.
The assumed revenue growth for each of the companies is as follows:
Table 22: Projected growth assumptions for group companies
Annualized Growth Rates 2009 2010 2011 2012 2013
AA Consultants (35 %) 9% 5% 30% 25%
AAH* 167% 96% 46% 14% 23%
* consolidated for AAS and AAT
AA CONSULTING is uniquely positioned in the region as the only company that is able to offer
comprehensive advisory assistance to aviation investment projects. It has already
demonstrated its capabilities by successfully concluding its first project. It is now in discussions
with the MOF, and also with the MOI, which is expected to gain further projects to the
company on a continuous and long-term basis.
Overall, it is expected over the next few years, the businesses of the AAS and AAT will start to
emerge as significant revenue generators in the group. The projected group revenue over the
next five years is as follows:

VALUATION REPORT VII. FINANCIAL PROJECTIONS Page 59
The Key Income Statement assumptions for each company are as follows:
AAHServices
Assumptions:
The key assumptions used while preparing the financial projections for AASCompany (AAS) are as
follows:
1. Aircraft in use: It has been assumed that AAS will not own any aircraft. All aircraft that it will
operate will be through management contracts with other owners. AAS does not intend to
operate small aircraft. All aircraft are assumed to be large aircraft (ACJs and BBJs or higher),
and will be operated as private aircraft.
2. The aircraft in operation over the next five years are assumed as follows:
Aircraft operations 2009 2010 2011 2012 2013
H1 H2 H1 H2 H1 H2 H1 H2 H1 H2
No. of Aircrafts 1 2 3 3 4 4 4 5 5 6
3. Revenue per aircraft: Revenue from aircraft operations arises out of the payments received
by the customers of AAS. Revenues consist of two main streams – fixed monthly payments,
and hourly charges. The fixed monthly payments and the hourly charges are assumed as
follows:
Fixed monthly charges US$ 650,000 per month
Hourly rates US$ 4,000 per hour
In S
R M
illio
n
MAZAV AJWAA SERV AJWAA TECH AJWAA LOGISTICS

VALUATION REPORT VII. FINANCIAL PROJECTIONS Page 60
Assumed number of hours flown per aircraft per month
40 hours
4. A 10% increase in billing rates has been assumed per annum from the year 2011, applicable
both for the variable as well as the fixed monthly charges.
5. The revenues for the company for the five year period of projection are as follows:
(in SAR ‘000s)
2009 2010 2011 2012 2013
Gross revenue 54,675 109,350 160,380 182,067 224,732
6. Fixed maintenance costs have been assumed at US$ 175,000 per month per aircraft, which is
paid to AAT as a fixed monthly payment.
7. Spares costs have been assumed at US$ 150,000 per month. This is used by AAL to stock for
spares for all aircraft that are operated or maintained by AAS and AAT.
8. The operating costs of AAS mainly consist of direct variable costs, and fixed costs. The direct
variable costs consist of the following:
a. Fuel Costs
b. Landing/Parking Costs
c. Supplies/Catering
9. The fuel costs have been assumed based on an average rate for fuel of US$ 3.50 per gallon
(based on average rate for the last 12 months). The fuel consumption has been assumed at
740 gallons per hour (source: Conklin Dedecker). The composite fuel costs per annum for
operating one aircraft for 40 hours in a month are SAR 4.6 million per annum.
10. Landing/parking costs have been assumed at US$ 137 per hour (source: Conklin Dedecker).
11. Supplies/Catering costs have been assumed at US$ 90 per hour (source: Conklin Dedecker).
12. The direct fixed costs consist of the following:
a. Navigation Chart Services
b. Computer Mx program
c. Insurance
d. Miscellaneous (Weather, Legal, etc.)
13. Navigation Chart Services have been assumed at US$ 16,233 per annum (source: Conklin
Dedecker).

VALUATION REPORT VII. FINANCIAL PROJECTIONS Page 61
14. Computer Mx Program costs have been assumed at US$ 12,000 per annum ((source: Conklin
Dedecker).
15. Insurance costs comprise of Hull insurance, Hull war risk, hull deductible, Liability and Excess
war liability risk. These insurance costs together have been assumed at US$ 250,000 per
annum per aircraft.
16. Miscellaneous costs have been assumed at US$ 20,000 per annum per aircraft.
17. Manpower costs consist of management staff, and crew costs. The manpower in the company
as on 31 December 2008 is as follows:
Name Job Title Hire Date
Captin Chief Executive Officer 6-Dec-07
Mamdooh Mokhtar Captain A320 1-Mar-08
Abed Al Khammash 9o9o9o9o9o0\
Captain A320 1-Mar-08
Mamdooh Allaf Captain Airbus A320 7-Jun-08
M Al-Shammary In-flight Services Manager
1-Jul-08
M Al Samil Flight Operation Supervisor
1-Mar-08
B-Shammary Senior F/A 1-Apr-08
Sultan T Senior F/A 1-Apr-08
H Al-Zahrani Senior F/A #########
A Bahaziq Flight Attendant 1-Mar-08
Sattam A Flight Attendant 1-Mar-08
Mansour Al- A VIP Serv. Rep. 1-Apr-08
AAl Hibshi Flight Attendant 1-Jul-08
Gh Wahaif Flight Attendant 1-Jul-08

VALUATION REPORT VII. FINANCIAL PROJECTIONS Page 62
PPrasanna Flight & Crew Dispatcher 2-Aug-08
S Al-Shahrani Commissary #########
R Albert Secretary 21-Apr-08
F Aamer Administrative Assis 2-Aug-08
F Fornes, Captain 6-Nov-08
J Evelyn Captain 8-Nov-08
S Mitchell Flight Attendant 9-Nov-08
F malak Flight Attendant 10-Nov-08
E Vieites Captain 10-Nov-08
Joshua Brain Kirby Captain 12-Nov-08
William Flight Attendant 13-Nov-08
Ronald Flight Attendant 2-Sep-08
Rachael Ground Staff 16-Nov-08
Abdullah Ground Staff 1-Dec-08
Sharahili Ground Staff 1-Dec-08
A Al- Thuwaini Ground Staff 13-Dec-08
A Alzahrani Captain 17-Dec-08
Khaled Flight Attendant 1-Apr-08
18. The management team for AAS is already in place and the company also has adequate number
of crew members to cater to up to 3 aircraft operations.
19. Crew consist of Captains, and Flight Attendants. It has been assumed that for every additional
aircraft, 3.5 captains will be recruited. In addition, for every aircraft, 5 flight attendants will
be recruited. This is considered adequate, given the current levels of staffing within the
company.

VALUATION REPORT VII. FINANCIAL PROJECTIONS Page 63
The overall manpower costs for the company over the five years are assumed as follows:
(in SAR ‘000s)
2009 2010 2011 2012 2013
Employee Costs 11,895 14,285 17,035 19,465 25,153
20. General and Administrative costs consist of rent, conveyance expenses, postage, telephone
and stationery expenses, training costs, maintenance, insurance, consulting fees, legal and
professional fees, and intercompany support costs. General and Administrative costs for the
company over the five years is assumed as follows:
(in SAR ‘000s)
2009 2010 2011 2012 2013
Travel 2,127 1,834 2,070 2,412 3,114
Strategic support services 1,923 2,116 2,327 2,560 2,816
Provision for doubtful debts 1,094 2,187 3,208 3,641 4,495
Legal and professional fees 844 1,688 2,250 2,531 3,094
Training 319 407 506 594 825
Conveyance expenses 253 253 322 364 653
Consulting fees 206 227 250 275 302
Postage, telephone telex and stationery 164 328 481 546 674
Computer maintenance 104 104 133 166 270
Miscellaneous 60 59 71 83 112
Rent 40 44 48 53 59
Magazines and subscription 28 56 75 84 103
Total 7,162 9,303 11,742 13,309 16,517
21. Travelling costs have been assumed at SAR 375 per day per crew member, and a total number
of 275 days per employee in year has been assumed.
22. Strategic Support Services consist of expenses of AAHapportioned to each of the companies
in the group. These costs mainly consist of salary expenses for staff of AAHCompany.
23. Provision for doubtful debts has been assumed at the rate of 2% on Gross Revenue.
24. Legal and Professional fees have been assumed at US$ 150,000 per aircraft per annum.
25. Training costs have been assumed at SAR 10,000 per new crew member annum, increasing by
10% every year.
26. Conveyance expenses have been assumed at a rate of SAR 20 per day per employee, and
number of working days has been assumed to be 22 days of local travelling per month,
increasing by 10% every year.

VALUATION REPORT VII. FINANCIAL PROJECTIONS Page 64
27. Consulting fees have been assumed at SAR 187,500 in the year 2008 and increasing by 10%
every year thereafter. Consulting fees are costs incurred in engaging outside consultants
initially while accepting an aircraft.
28. Postage, telephone, telex and stationery costs have been assumed at the rate of 0.30% on the
gross revenue.
29. Computer maintenance costs have been assumed at SAR 200 per employee per month,
increasing by 10% per annum.
30. Miscellaneous costs have been assumed at the rate of 2% on the total costs of rent,
conveyance expenses, postage, telephone and stationery expenses, strategic support
services, training costs, maintenance, and insurance.
31. Rental costs have been assumed at a rate of SAR 40,000 per annum. Rental rates are assumed
to increase by 10% every year.
32. Magazines and subscription costs have been assumed at US$ 5,000 per aircraft, increasing at
10% per annum.
AAHTechnical
The key assumptions used while preparing the financial projections for AATServices Company (AAT)
are as follows:
1. Aircraft in maintenance: It has been assumed that AAT will not have any independent aircraft
maintenance contracts. All aircraft that it will maintain will be through sub- contracts with
AAS. The number of aircraft under maintenance with AAT is assumed as follows:
Aircraft operations 2009 2010 2011 2012 2013
H1 H2 H1 H2 H1 H2 H1 H2 H1 H2
No. of Aircrafts 1 2 3 3 4 4 4 5 5 6
2. Revenue per aircraft: Revenue arises out of the maintenance fee received. Revenues consist
of two main streams – Maintenance contract fee, and Sale of units. The Maintenance contract
fee is assumed at US$175,000 per aircraft per year. These revenues arise out of the gross
payment received by AAS from its end customer
3. A 10% increase in billing rates has been assumed per annum from the year 2011, applicable
both for the variable as well as the fixed monthly charges.
4. The revenues for the company for the five year period of projection are as follows:
(in SR ‘000s)
2009 2010 2011 2012 2013

VALUATION REPORT VII. FINANCIAL PROJECTIONS Page 65
Gross Revenue 13,812 25,625 36,650 42,336 51,553
5. The operating costs of AAT mainly consist of manpower costs. These costs consist of
operations staff costs. The manpower in the company as on 31 December 2008 is as follows:
Name Job Title Hire Date
Ahmed Avionic Mechanics 1-Apr-08
Faisal Senior Mechanic 30-Mar-08
Trad Aircraft Mint. Tech 25-Sep-08
Salem Aircraft Avionic. Tech 1-Nov-08
Hamza Aircraft Technician 1-Nov-08
Sony Asst, Mechanic 4-Aug-08
Sultan Aircraft Avionics .Mechanic 1-Nov-08
Nahes up keeper 20-Jan-09
Bander up keeper 13-Jan-09
Fahad Aircraft Mech 11-Jan-09
6. The non-operating staff in the company as on 31 December 2008 is as follows:
Name Job Title Hire Date
Saleh CEO 24-Feb-07
Abdullrahman Admin Asst 3-Jan-09
7. The management team for AAT is already in place and the company also has adequate number
of crew members to cater to up to 2 aircraft maintenance contracts.
8. The main maintenance staff consists of Mechanics, and Technicians. It has been assumed that
for every each aircraft 5 Mechanics and 3 Technicians will be required. This is considered
adequate, given the current levels of staffing within the company. The overall manpower
costs for the company over the five years are assumed as follows:
(in SR ‘000s)
2009 2010 2011 2012 2013
Operating staff salaries 3,005 5,549 7,362 8,151 13,415
Non-operating staff salaries 1,378 1,516 1,668 1,835 2,018
9. It has been assumed that AAT will operate without its own investment in Hangars. As a result,
its investment in assets would mainly be in some tools. The additions for assets in AAT has
been assumed as follows:
(in SR ‘000s)
2009 2010 2011 2012 2013
240 240 440 550 730
All assets are assumed to be depreciated over a period of 5 years.
10. General and Administrative costs consist of non-operating salaries, maintenance
subscriptions, power, postage, telephone and stationery expenses, training costs, travel,

VALUATION REPORT VII. FINANCIAL PROJECTIONS Page 66
insurance, rent, legal and professional fees, depreciation and provision for doubtful debts.
General and Administrative costs for the company over the five years is assumed as follows:
(in SR ‘000s)
2009 2010 2011 2012 2013
Non-operating salaries 1,378 1,516 1,669 1,835 2,018
Strategic Support Services 399 438 482 530 583
Depreciation 208 256 344 454 440
Legal and professional fees 200 220 242 266 293
Training 160 160 160 160 320
Travel 140 220 300 380 460
Miscellaneous 50 55 61 67 73
Power 50 55 60 67 73
Rent- Office 48 86 125 163 202
Insurance 21 26 34 45 60
Maintenance subscriptions 20 22 24 27 29
Postage, telephone telex and stationery 5 5 6 7 7
Total 2,679 3,060 3,507 4,000 4,559
11. Non-operating Salaries are the salaries of Chief Executive Officer, Training Manager, and
Administrative officer’s salaries with an annual increment of 10%.
12. Strategic Support Services consist of expenses of AAHapportioned to each of the companies
in the group. These costs mainly consist of salary expenses for staff of AAHCompany.
13. Legal and professional fees have been assumed at SAR 200,000 per annum increasing by 10%
per annum.
14. Training costs have been assumed at SAR 20,000 per annum per additional operating staff.
15. Travel costs have been assumed at SAR 10,000 per annum per operational staff.
16. Miscellaneous costs have been assumed at SAR 50,000 per annum with an annual increment
of 10%.
17. Power costs have been assumed at SAR 50,000 per annum with an annual increment of 10%.
18. Rent-Office offsite costs have been calculated at SAR 4,800 per annum per operating staff.
19. Maintenance subscriptions costs have been assumed at SAR 20,000 per annum with annual
increment of 10%.
VALUATION REPORT VII. FINANCIAL PROJECTIONS Page 67
20. Postage, telephone, telex and stationery costs have been assumed at SAR 5,000 per annum with
an annual increment of 10%.
21. Insurance has been assumed at the rate of 2% per annum on the assets.
AA Consultants
The key assumptions used while preparing the financial projections for MAZ Aviation Consulting
Services Company are as follows:
1. Revenue per aircraft: Revenue arises out of the consulting services. Revenues consist of two
main streams – Consulting fee, and Income on Investments or trading . The billing rates are
assumed at SAR 5,000 per hour per person, with an increment of 5%per annum.
The revenues for the company for the five year period of projection are as follows:
(in SR ‘000s)
2009 2010 2011 2012 2013
Gross Revenue 72,708 79,148 82,918 107,658 134,675
2. The Cost of Sales of AA CONSULTING consist mainly of manpower resources, and have been
assumed to increase at the rate of 5% per annum.
(in SR ‘000s)
2009 2010 2011 2012 2013
Cost of Sales 3,590 3,770 3,958 5,195 6,546
3. The Manpower in the company as on 31 December 2008 is as follows:
Name Job Title Hire Date
CEO Omer Abdulaziz Halawani 01/Nov/07
Senior Consultant Helicopter Opration Hadi Al Alamri 01/Feb/08
Asst. Proj. Manager Asim Andijani 01/Apr/08
Financial Analyst Norah M. Al-Zeer 16/Jun/08
Admin Assistant Ajth Kumar 17/Nov/08
VIP Cabin Service Design Manager Aylin Suncoglu 01/May/07
VP Business Development Vinay Kumar 01/May/07
MAZ Consulting Specialist Samah Khalid Al-Metairi 01/May/08
4. The management team for AA CONSULTING is already in place and the company also has
adequate number of crew members.
5. It has been assumed that from 2010 onwards manpower will be increased by 2 additional
resources every year. This is considered adequate, given the current levels of staffing within
the company. The overall manpower costs for the company over the five years are assumed
as follows:

VALUATION REPORT VII. FINANCIAL PROJECTIONS Page 68
(in SR ‘000s)
2009 2010 2011 2012 2013
Personnel Costs 2,084 2,292 2,522 2,774 3,051
6. General and Administrative costs consist of rent or lease expenses, conveyance expenses,
postage, telephone telex and stationery, travel, computer maintenance, training,
miscellaneous expenses, consulting fees, legal and professional fees, bank charges,
depreciation, and strategic support services. General and Administrative costs for the
company over the five years is assumed as follows:
(in SR ‘000s)
2009 2010 2011 2012 2013
Strategic support services 751 826 826 826 826
Travel 307 569 626 689 758
Conveyance expenses 157 280 308 339 373
Rent or Lease Expenses 144 158 174 192 211
Consulting fees 75 375 375 375 375
Postage, telephone telex and stationery 73 79 83 108 135
Legal and professional fees 56 281 281 281 281
Miscellaneous 32 38 46 55 66
Bank charges 15 16 17 22 27
Computer maintenance 14 26 28 31 34
Training 7 7 7 7 7
Depreciation - - - - -
Total 1,631 2,656 2,771 2,924 3,093
7. Strategic Support Services consist of expenses of AAHapportioned to each of the companies
in the group. These costs mainly consist of salary expenses for staff of AAHCompany.
8. Travel costs have been assumed at the rates as specified and basing upon the trip. Total trips
allowable to an employee assumed to be 12 trips per annum.
9. Conveyance costs have been assumed at SAR 990 per month per employee with an increment
of 10% per annum.
10. Rent or Lease costs have been calculated at SAR 1,000 per month per employee increasing by
10% per annum.
11. Consulting fees has been assumed at the rate of 2% per annum on the investments of the
Company.
12. Postage, telephone, telex and stationery costs have been assumed at the rate of 1% per
annum, and with an annual increment of 10%.
13. Legal and professional fees have been assumed at the rate of 1.50% per annum.

VALUATION REPORT VII. FINANCIAL PROJECTIONS Page 69
14. Miscellaneous costs have been assumed at SAR 20,000 per annum with an annual increment
of 10%.
15. Bank Charges have been assumed at 0.02% on the Gross Revenue of the Company.
16. Computer Maintenance costs have been assumed at SAR 100 per employee per month, and
multiplied with average number of employees. These costs have been increased at the rate of
10% per annum in addition to 1.5 increments.
17. Training costs have been assumed at SAR 500,000 per annum per employee.

VALUATION REPORT VII. FINANCIAL PROJECTIONS Page 70
B. Balance Sheet Assumptions
The Balance Sheet assumptions have been maintained consistent across all the companies in the
group. The key assumptions for the balance sheet are as follows:
Accounts Receivable
Historically accounts receivable days have been assumed at 60 days for each of the companies
in the group and it is assumed that it will continue over the projected period.
Accounts Payable
Historically accounts payable days were taken in proportion to the days payable for each
company on a historical basis, and it is assumed that it will continue over the projected period.
Inventory
No significant inventory has been assumed for any company other than for AAL Company
Limited. The level of inventory for AAL Company has been assumed at US$ 1 million based on
the number of aircraft, with a proportionate increase in inventory with revenues.
Capital Expenditure
No significant capital expenditure has been assumed for any of the companies in the group.
Whereas there are possible investments in hangar facilities that are likely to be made by the
Group, for the purpose of this valuation, the investment, and the related returns have not
been taken into consideration.

VALUATION REPORT VIII. GENERAL VALUATION METHODOLOGY Page 71
71
VIII. GENERAL VALUATION METHODOLOGY
Business valuations are based on the following principles:
a) Value relates to a specific point in time.
b) Hindsight or retrospective evidence is inadmissible in reaching notional valuation conclusions.
c) Value is related to future expectations.
d) The value of assets is related to what they can earn.
e) Higher tangible asset backing supports higher going concern value.
f) Two or more special purchasers make a special purchaser market.
In the valuation of the shareholders’ equity of AAHGroup Companies, three different approaches
may be employed to determine its fair market value: (i) the Income Approach, (ii) the Cost
Approach, and (iii) the Market Approach. While each of these approaches is initially considered
in the valuation of the shareholders’ equity, the nature and characteristics of each of the
companies in the group will indicate which approach, or approaches, are most applicable.
A. Income Approach
The most commonly used valuation methodology in the Middle East is the capitalization of
maintainable earnings before tax. This technique arrives at a value by taking maintainable
earnings from operations before tax, and multiplying this by a selected capitalization rate.
Redundant assets are then added to the capitalized earnings to arrive at a final valuation figure.
Another Income based approach is the “Discounted Cash Flow Method”, which focuses on the
expected cash flow of AAHGroup Company. In applying this approach, the cash flow available for
distribution is calculated for a finite number of years. Cash flow available for distribution is
defined, for purposes of this approach, as the amount of cash that could be distributed as a
dividend without impairing the future profitability or operations of the AAHGroup Company. The
cash flow available for distribution and the terminal value (the value of the AAHgroup Company
at the end of the estimation period) are then discounted to present value are then added to
redundant assets to arrive at an indication of value of the business enterprise.
B. Asset Based Approach
Using the Asset Based Approach a company’s value is based on the identified fixed, financial, and
other assets. The derived aggregate value of these assets is then “netted” against the estimated
value of all existing and potential liabilities, resulting in an indication of the value of the
shareholders’ equity.
An ongoing business enterprise is typically worth more than the fair market value of its underlying
assets due to several factors: (i) the assets valued independently may not reflect the economic
value related to the prospective cash flows they could generate; (ii) this approach may not fully
reflect the synergy of the assets but rather their independent values; and (iii) intangible assets
inherent in the business such as reputation, superior management, proprietary procedures or

VALUATION REPORT VIII. GENERAL VALUATION METHODOLOGY Page 72
systems, or superior growth opportunities are very difficult to measure independent of the cash
flow they generate.
C. Market Approach
The market approach is typically based on a review of comparable companies that are traded
in the local stock exchange and which can be used as a benchmark for the valuation of the
subject company.
There are no companies in aviation sector that are listed in Saudi Arabia. However, there are
a few companies in the transportation and the Multi-investment sectors that could be
considered as comparable to AAHGroup’s business. The shares that constitute the
transportation sector and their financial performance are as follows:
Table 23: Price indicators of transportation companies on Saudi Stock Exchange
Company Name Market price (as at 30 June 2008)
Earnings per Share (in SAR)
Price To Earnings
Ratio The National Shipping Co. of Saudi Arabia
33.5 10.97 3.05
Saudi Public Transport Co.
14 N/A N/A
Saudi Transport and Investment Company
26.5 4.24 6.25
United International Transportation Company Ltd.
97.5 N/A N/A
(Source: Tadawul)
Some of the companies such as SAPTCO and Budget Saudi have not reported their financial
performance and therefore it is not possible to calculate their Earnings Per Share.
The companies in multi-investment sector include the following:
Table 24: Price indicators of multi-investment companies on Saudi Stock Exchange
Company Name Market price (as at 30 June 2008)
Earnings per Share (in SAR)
Price To Earnings Ratio
Saudi Arabia Refineries Co. 170 N/A N/A
Saudi Advanced Industries Co. 22.25 1.58 14.08
Al-Ahsa Development Co. 24 N/A N/A
Saudi Industrial Services Co. 26.5 1.62 16.36

VALUATION REPORT VIII. GENERAL VALUATION METHODOLOGY Page 73
Aseer Trading, Tourism & Manufacturing Co. 31.75 19.76 1.61
Al-Baha Investment & Development co 18.5 -5.5 (3.36)
Kingdom Holding Company 9.75 N/A N/A
(Source: Tadawul)
Clearly, the stock markets in Saudi Arabia do not have adequate breadth or depth to be used as a
benchmark for the computation of market multiples. Therefore, the valuation of the companies
in the AAHGroup will be performed using discount rates that reflect the risks and returns expected
from each of the businesses.
For the purposes of the analysis of each of the companies in the group, we have adopted different
valuation methodologies, which are as follows:
Table 25: Valuation basis for companies in the group
Company Name Valuation Basis
AASCompany (AAS) Discounted Cash Flow
AATCompany (AAT) Discounted Cash Flow
AA Consultants Discounted Cash Flow
The overall value of AAHCompany is derived as the sum of the value of each of the companies in
the group.
D. Valuation Adjustment Factors
Control Adjustment Factor (minority discounts/control premium)
The value for control arises to the investor, when the investor can influence the factors listed
below:
• Election of directors and appointment of management;
• Determination of management compensation and perquisites;
• Declaration and payment of dividends;
• Acquisition or sale of treasury shares;
• Acquisition or liquidation of assets or the firm itself;
• Establishment of policies and alteration of the course of business;
• Diversification through acquisitions or internal development;
• Consolidation through divestiture or merger;
• Selection or suppliers;
• Alteration of articles and bylaws; and
• Right to liquidate, dissolve, sell out, or recapitalize.
VALUATION REPORT VIII. GENERAL VALUATION METHODOLOGY Page 74
A prospective investor intending to acquire a 50% interest in the company will have the rights
to representation on the board as well as the ability to participate in the long term strategic
planning for the group. As a result, even if such an investor would not have a say in the day-
to-day operations of the company, he will be considered as having a controlling interest.
Minority discount will therefore not be applicable if a 50% stake is sold in the company.
Marketability Discount
Investments in privately held companies are valued at a discount as compared to investments
in publicly held companies due to their lack of liquidity and marketability. As a result of this
lack of marketability, a minority interest shareholder in a privately held company does not
enjoy many of the benefits of a minority interest investor in a publicly traded company. In
addition, due to regulatory reporting requirements and analyst coverage, an investor in a
publicly traded company has access to significant information concerning the company’s
performance.
A 20% marketability discount is applied to the valuation of companies on a Discounted Cash
Flow basis. This is taken into account while computing the discount factors.
VALUATION REPORT IX. VALUATION ANALYSIS Page 75
75
IX. VALUATION ANALYSIS
For the purposes of this report, the Income and Asset approaches to valuation were utilized in the
valuation of the shareholders’ equity of AAHCompany. In deriving values, we relied on: (i) historical
financial data for the Companies (summary provided in the section labeled “Historical Financial Results”),
(ii) a Company-prepared business plan for fiscal years 2009-13, and (iii) economic and industry data
relating to the business aviation industry and other related industries in which companies in the group
operate, as they impact the operations of the Companies.
A. Discount and Capitalization Rate
The discount rates for each of the companies was arrived at based on a combination of the
current rates of return based on risk free investments, the business risk premium associated
with the Company’s operations, and other relevant factors. The expected rate of return on
equity (or the discount rate) is arrived at by adjusting the risk free rate of return for equity risk
premium, inflation, country risk and business risk. The discount rate for each company takes
into account:
Nominal risk free rate: This is currently at around 6% the rates on government denominated bonds.
Country risk: The Middle East has well established and stable political and economic systems. The country risk is estimated at 3% -5% depending on the country of business of the company.
Market/Industry Risk: Aviation services in the Middle East general are highly regulated and new players will require licensing requirements, which raise the barriers to entry. While the AAHGroup does have some licenses, the process of licensing is yet to be completed in other companies. It is therefore, estimated that the aviation industry risk would be 5% - 7% depending on the nature of business of the company.
Business risk premium: The AAHGroup companies operate in a matured and competitive market and have successfully operated for the past two years during which time; they have established proof of concept as well as an established brand name. Hence a business risk premium for the Target operation is estimated at 5%.
Discount rate has been assumed to be different for each of the companies in the group, and has been assumed as follows:
Table 26: Discount Rate assumptions for valuation
Company Name
Risk free rate
Country risk
Industry risk
Business risk
Discount Rate
Reasoning
AA Consultants
6% 3% 6% 3% 18% Low barriers to entry, unpredictability of revenues and profits, low local competition
AASCompany Limited
6% 3% 3% 3% 15% Stable business, high barriers to entry for competition
AATCompany Limited
6% 3% 3% 3% 15% High investments creating barriers to entry, stable business
The business risk has also taken into account the fact that the shares of each of the companies
are closely held and therefore are subject to marketability risks.
VALUATION REPORT X. SUMMARY AND RECOMMENDATIONS Page 76
B. Terminal Year Growth Factor
The terminal growth rate is the growth rate at which the business can grow by not exceeding the
long term industry growth and growing at a rate which does not strain the business financial
resources.
Terminal value Terminal value is defined as the continuing value of the business after the last year of projection. It is calculated as the present value of cash flow in the last year of projection divided by the discount rate.
Terminal value is considered in the year 2013 and is calculated using the ‘Perpetuity Method’. The Perpetuity Method assumes a constant cash flow in the terminal year with a constant growth projected as perpetuity of infinite maturity. The terminal year growth factors have conservatively been assumed as follows:
Table 27: Terminal Growth rate assumptions
Company Name Terminal Growth Rate
Reasoning
AA Consultants 5% High competition in the long term
Ajwaa Alalam* 2% Will grow at a minimum of marginal growth rate of the industry
*consolidated for AAS and AAT
C. Discounted Cash Flow
Cash flows Cash flow from operations has been adjusted for capital expenditure to arrive at the free cash
flows. Free Cash flow to equity is defined as the amount leftover from cash from operating
activities after deducting interest and principal payments, and any capital expenditure needed
for the operation company. Furthermore a terminal value is added to the free cash flows at
the end of the projection period (31 December 2013). The total free cash flows are then
discounted back to present value.
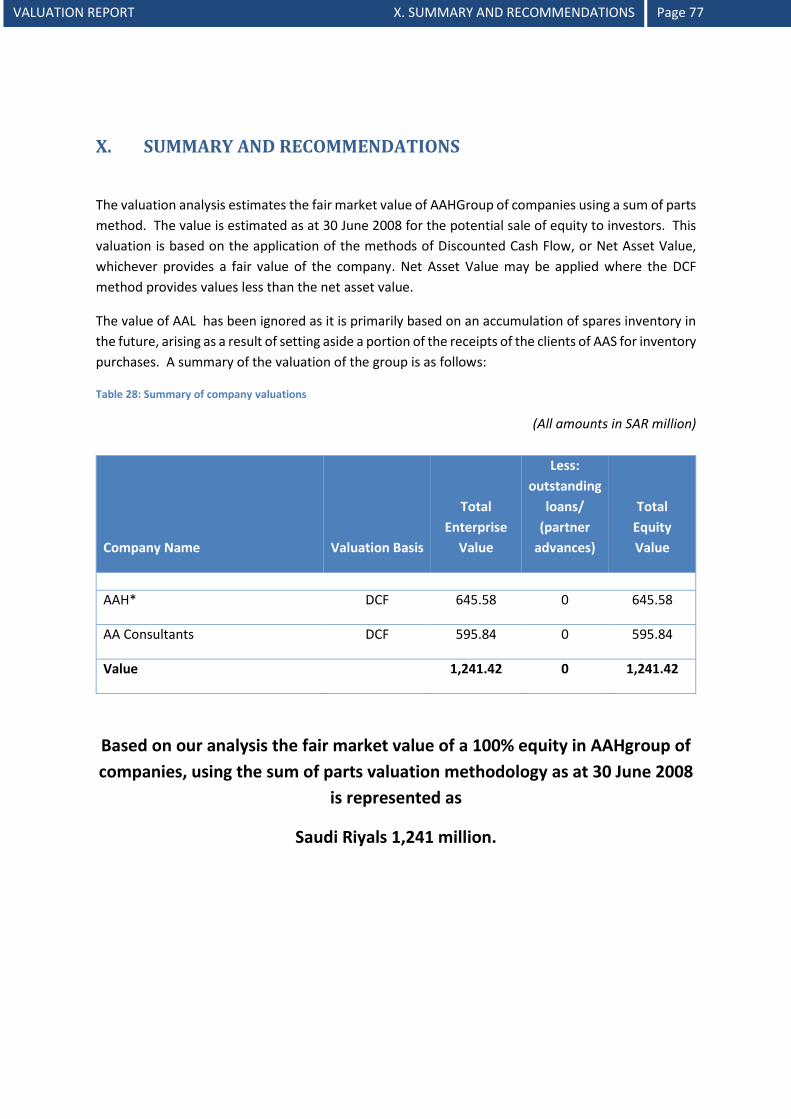
VALUATION REPORT X. SUMMARY AND RECOMMENDATIONS Page 77
X. SUMMARY AND RECOMMENDATIONS
The valuation analysis estimates the fair market value of AAHGroup of companies using a sum of parts
method. The value is estimated as at 30 June 2008 for the potential sale of equity to investors. This
valuation is based on the application of the methods of Discounted Cash Flow, or Net Asset Value,
whichever provides a fair value of the company. Net Asset Value may be applied where the DCF
method provides values less than the net asset value.
The value of AAL has been ignored as it is primarily based on an accumulation of spares inventory in
the future, arising as a result of setting aside a portion of the receipts of the clients of AAS for inventory
purchases. A summary of the valuation of the group is as follows:
Table 28: Summary of company valuations
(All amounts in SAR million)
Company Name Valuation Basis
Total
Enterprise
Value
Less:
outstanding
loans/
(partner
advances)
Total
Equity
Value
AAH* DCF 645.58 0 645.58
AA Consultants DCF 595.84 0 595.84
Value
1,241.42 0 1,241.42
Based on our analysis the fair market value of a 100% equity in AAHgroup of
companies, using the sum of parts valuation methodology as at 30 June 2008
is represented as
Saudi Riyals 1,241 million.
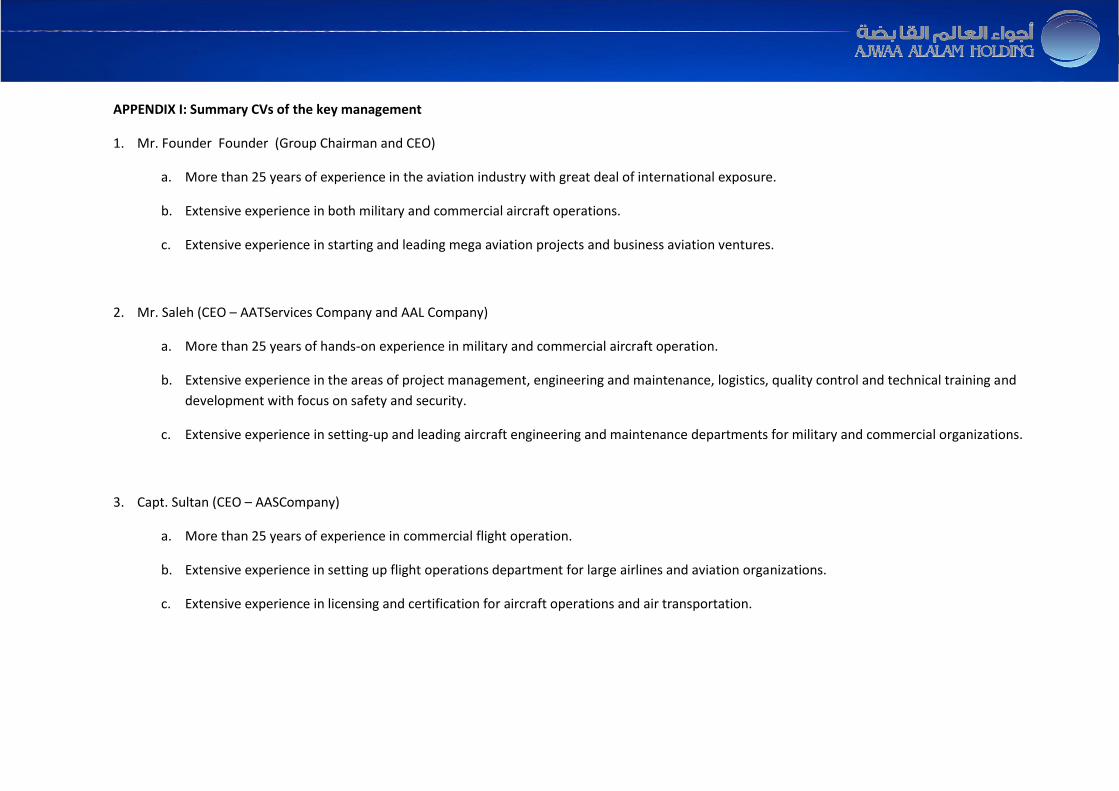
VALUATION REPORT APPENDICES
Page 78
APPENDIX I: Summary CVs of the key management
1. Mr. Founder Founder (Group Chairman and CEO)
a. More than 25 years of experience in the aviation industry with great deal of international exposure.
b. Extensive experience in both military and commercial aircraft operations.
c. Extensive experience in starting and leading mega aviation projects and business aviation ventures.
2. Mr. Saleh (CEO – AATServices Company and AAL Company)
a. More than 25 years of hands-on experience in military and commercial aircraft operation.
b. Extensive experience in the areas of project management, engineering and maintenance, logistics, quality control and technical training and
development with focus on safety and security.
c. Extensive experience in setting-up and leading aircraft engineering and maintenance departments for military and commercial organizations.
3. Capt. Sultan (CEO – AASCompany)
a. More than 25 years of experience in commercial flight operation.
b. Extensive experience in setting up flight operations department for large airlines and aviation organizations.
c. Extensive experience in licensing and certification for aircraft operations and air transportation.

VALUATION REPORT APPENDICES
Page 79
5. Mr. Ahmed Abdullah (CEO – AA Consultants, Jeddah)
a. Experienced professional in the field of private and commercial aviation.
b. Great deal of experience in starting and leading commercial air transport projects (Al Khayala Airlines, ABCair Airlines)
c. Proven ability to procure and employ control and quality systems to best suit operational requirements and to provide optimum
performance.
6. Mr. Saleh Abdulrahman (Member – Board of Directors, AAHCompany)
a. Extensive experience in accounting and finance management.
b. Good experience in aircraft financing, acquisition and insurance.
c. Proven ability to build a structure that improves performance by reducing costs and eliminating redundancies.

VALUATION REPORT APPENDICES
Page 80
APPENDIX II: Consolidated Statement
Consolidated summary historical and projected Income Statements for the AAS AND AAT are as follows:
(All figures in Saudi Riyals ‘000s)
PARTICULARS 2007 2008 2009 2010 2011 2012 2013
Gross Revenue
1,972 21,204 56,675 111,350 162,380 185,068 227,732
Cost of Sales
613 3,457 30,933 45,151 55,903 62,216 79,358
Gross profit
1,359 17,747 25,742 66,199 106,477 122,851 148,375
Selling and distribution expenses
- - 1,094 2,187 3,208 3,641 4,495
General and administrative expense
373 4,984 9,841 12,363 15,249 17,310 21,076
Amortization of deferred charges
- 1,000 1,000 1,000 1,000 1,000 -
Intercompany expenses
101 838 691 1,281 1,833 2,117 2,578
Operating income
885 10,926 13,116 49,368 85,189 98,784 120,226
Earnings before interest and taxes
885 10,926 13,116 49,368 85,189 98,784 120,226
Income taxes and Zakat
19 378 669 1,955 4,106 6,540 9,416
Net income before extra ordinaries
866 10,547 12,447 47,413 81,083 92,243 110,811
Net income
866 10,547 12,447 47,413 81,083 92,243 110,811
VALUATION REPORT APPENDICES
Page 81
Transfer to Statutory reserve
354 346 300 - - - -
Dividends for the year
- - - - - - -
Net income to common
512 10,202 12,147 47,413 81,083 92,243 110,811

VALUATION REPORT APPENDICES
Page 82
Summary historical and projected Consolidated Balance Sheets for AAT AND AAS are as follows:
(All figures in Saudi Riyals ‘000s)
PARTICULARS 2007 2008 2009 2010 2011 2012 2013
Property, plant & equipment
- 640 672 656 752 848 1,138
Deferred charges
- 4,000 3,000 2,000 1,000 - -
- 4,640 3,672 2,656 1,752 848 1,138
Current Assets
Accounts receivables and prepayments
1,972 5,651 8,988 17,976 26,364 29,929 36,943
Bank and cash
607 5,807 22,668 67,690 147,346 241,977 353,478
2,579 11,459 31,656 85,666 173,710 271,906 390,421
Current Liabilities
Accounts payable
350 684 6,506 9,925 12,816 14,311 17,939
Provision for bad debts/Due to affiliates 90 308 337 369 405 443 486
Short term loans
310 - - - - - -
Zakat and income tax-prov.
19 378 669 1,955 4,106 6,540 9,416
Proposed Dividends
- - - - - - -
770 1,371 7,512 12,249 17,327 21,294 27,841
Net Current Assets
1,810 10,088 24,144 73,416 156,383 250,612 362,580

VALUATION REPORT APPENDICES
Page 83
PARTICULARS 2007 2008 2009 2010 2011 2012 2013
Assets Employed
1,810 14,728 27,816 76,072 158,135 251,460 363,718
Shareholders’ Funds
Capital
3,200 3,200 3,200 3,200 3,200 3,200 3,200
Statutory reserve
354 700 1,000 1,000 1,000 1,000 1,000
Retained earnings
512 10,714 22,861 70,274 151,356 243,600 354,410
Other Reserves
- - - - - - -
4,066 14,614 27,061 74,474 155,556 247,800 358,610
Non Current Liabilities
Long term loan
(2,256) - - - - - -
Employees' terminal benefits
- 114 755 1,599 2,579 3,660 5,107
(2,256) 114 755 1,599 2,579 3,660 5,107
Total
1,810 14,728 27,816 76,072 158,135 251,460 363,718

VALUATION REPORT APPENDICES
Page 84
APPENDIX III: AASCompany
Summary historical and projected Income Statements for the company are as follows:
(All figures in Saudi Riyals ‘000s)
2007 2008 2009 2010 2011 2012 2013
Gross revenue 1,000 14,609 54,675 109,350 160,380 182,068 224,732
Cost of sales 313 3,038 39,741 63,227 83,191 93,401 114,496
Gross profit 687 11,571 14,934 46,123 77,189 88,666 110,236
Selling and distribution expenses - - 1,094 2,187 3,208 3,641 4,495
General and administrative expense 123 2,664 7,162 9,303 11,742 13,309 16,517
Amortization of deferred charges - 1,000 1,000 1,000 1,000 1,000 -
Earnings before interest and taxes 564 7,907 5,679 33,633 61,240 70,716 89,225
Zakat and income taxes 19 223 315 1,187 2,728 4,470 6,582
Net income 545 7,685 5,363 32,446 58,511 66,246 82,643
Transfer to Statutory reserve 54 46 - - - - -
Net income to common 545 7,685 5,363 32,446 58,511 66,246 82,643
* Estimated

VALUATION REPORT APPENDICES
Page 85
Summary historical and projected Balance Sheets for the company are as follows:
(All figures in Saudi Riyals ‘000s)
2007 2008 2009 2010 2011 2012 2013
Deferred charges 0 4,000 3,000 2,000 1,000 0 0
0 4,000 3,000 2,000 1,000 0 0
Current Assets
Account receivables & prepayments 1,000 5,109 8,988 17,975 26,364 29,929 36,942
Bank and cash 247 599 10,334 40,427 97,378 165,402 247,871
Accounts receivables and prepayments 1,247 5,708 19,322 58,402 123,742 195,331 284,813
Current Liabilities
Accounts payable 100 650 7,394 11,575 15,223 17,121 21,073
Due to affiliates 73 291 321 353 388 427 469
Short term loans 310 0 0 0 0 0 0
Zakat and income tax-prov. 19 223 315 1,187 2,728 4,470 6,582
503 1,164 8,030 13,114 18,339 22,017 28,125
Net Current Assets 745 4,544 11,292 45,288 105,403 173,314 256,689
Assets Employed 745 8,544 14,292 47,288 106,403 173,314 256,689
Shareholders’ Funds
Capital 200 200 200 200 200 200 200
Statutory reserve 54 100 100 100 100 100 100
Retained earnings 490 8,129 13,493 45,939 104,450 170,697 253,340
745 8,429 13,793 46,239 104,750 170,997 253,640
Non Current Liabilities
Employees' terminal benefits 0 114 499 1,049 1,653 2,318 3,049
0 114 499 1,049 1,653 2,318 3,049
Total 745 8,544 14,292 47,288 106,403 173,314 256,689

VALUATION REPORT APPENDICES
Page 86
APPENDIX IV: AATServices Company
Summary historical and projected Income Statements for the company are as follows:
(All figures in Saudi Riyals ‘000s)
2007 2008 2009 2010 2011 2012 2013
Gross revenue 972 6,595 13,812 25,625 36,650 42,335 51,553
Cost of sales 300 419 3,005 5,548 7,361 8,150 13,415
Gross profit 672 6,175 10,807 20,076 29,288 34,184 38,138
General and administrative expense 249 2,319 2,678 3,060 3,506 4,000 4,559
Amortization of deferred charges - - - - - - -
Intercompany expenses 100 837 690 1,281 1,832 2,116 2,577
Operating income 321 3,018 7,437 15,734 23,949 28,067 31,001
Earnings before interest and taxes 321 3,018 7,437 15,734 23,949 28,067 31,001
Income taxes and Zakat 0 155 353 768 1,377 2,070 2,834
Net income before extra ordinaries 321 2,862 7,084 14,966 22,571 25,997 28,167
Net income 321 2,862 7,084 14,966 22,571 25,997 28,167
Transfer to Statutory reserve 300 300 300 - - - -
Net income to common 21 2,562 6,784 14,966 22,571 25,997 28,167
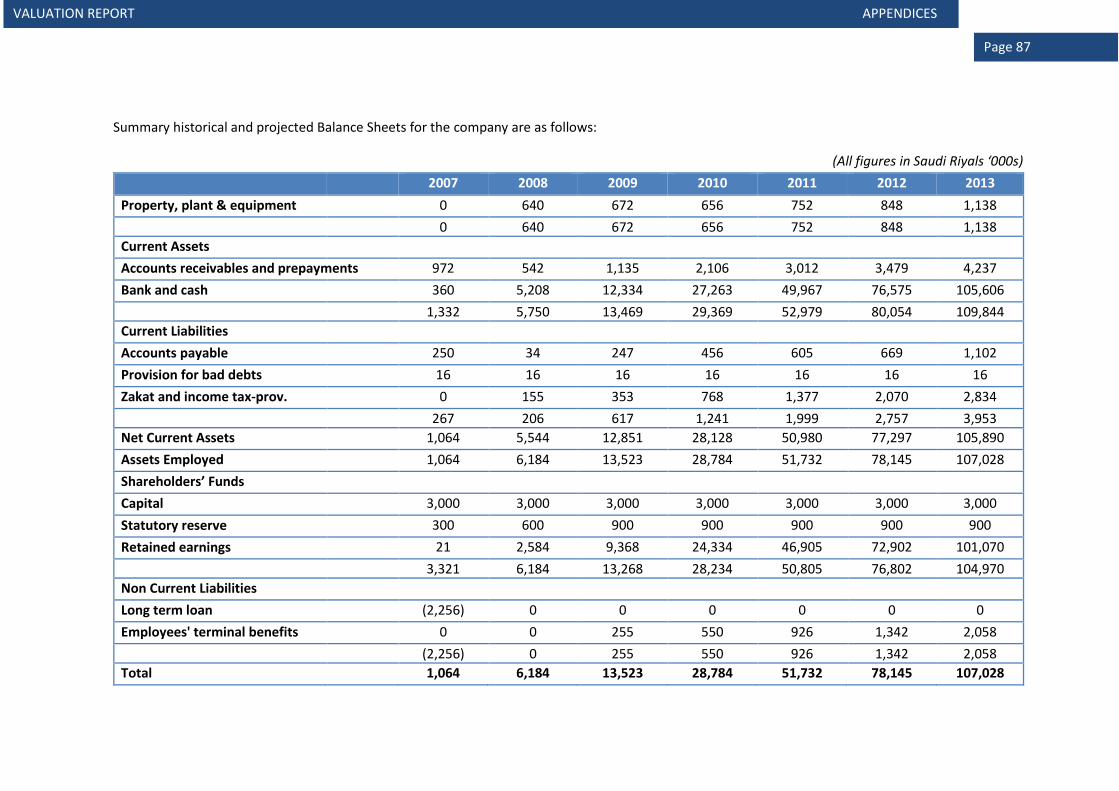
VALUATION REPORT APPENDICES
Page 87
Summary historical and projected Balance Sheets for the company are as follows:
(All figures in Saudi Riyals ‘000s)
2007 2008 2009 2010 2011 2012 2013
Property, plant & equipment
0 640 672 656 752 848 1,138
0 640 672 656 752 848 1,138
Current Assets
Accounts receivables and prepayments 972 542 1,135 2,106 3,012 3,479 4,237
Bank and cash
360 5,208 12,334 27,263 49,967 76,575 105,606
1,332 5,750 13,469 29,369 52,979 80,054 109,844
Current Liabilities
Accounts payable
250 34 247 456 605 669 1,102
Provision for bad debts
16 16 16 16 16 16 16
Zakat and income tax-prov.
0 155 353 768 1,377 2,070 2,834
267 206 617 1,241 1,999 2,757 3,953
Net Current Assets
1,064 5,544 12,851 28,128 50,980 77,297 105,890
Assets Employed
1,064 6,184 13,523 28,784 51,732 78,145 107,028
Shareholders’ Funds
Capital
3,000 3,000 3,000 3,000 3,000 3,000 3,000
Statutory reserve
300 600 900 900 900 900 900
Retained earnings
21 2,584 9,368 24,334 46,905 72,902 101,070
3,321 6,184 13,268 28,234 50,805 76,802 104,970
Non Current Liabilities
Long term loan
(2,256) 0 0 0 0 0 0
Employees' terminal benefits
0 0 255 550 926 1,342 2,058
(2,256) 0 255 550 926 1,342 2,058
Total
1,064 6,184 13,523 28,784 51,732 78,145 107,028
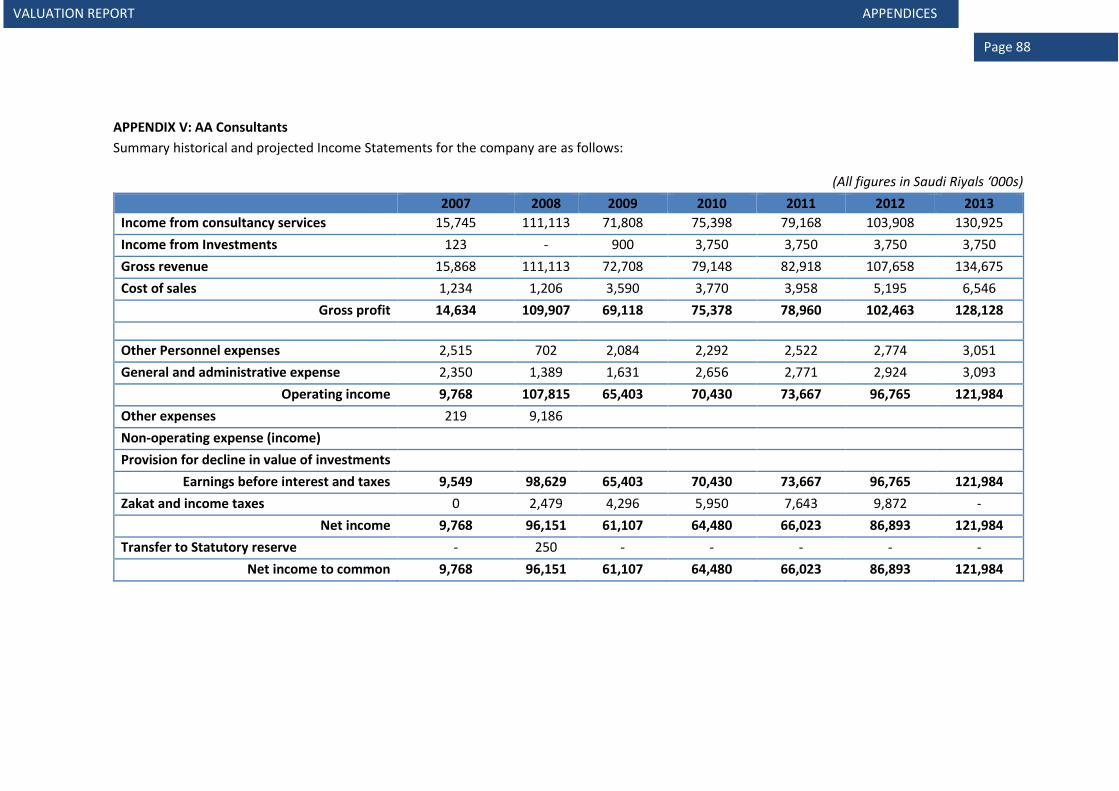
VALUATION REPORT APPENDICES
Page 88
APPENDIX V: AA Consultants
Summary historical and projected Income Statements for the company are as follows:
(All figures in Saudi Riyals ‘000s)
2007 2008 2009 2010 2011 2012 2013
Income from consultancy services 15,745 111,113 71,808 75,398 79,168 103,908 130,925
Income from Investments 123 - 900 3,750 3,750 3,750 3,750
Gross revenue 15,868 111,113 72,708 79,148 82,918 107,658 134,675
Cost of sales 1,234 1,206 3,590 3,770 3,958 5,195 6,546
Gross profit 14,634 109,907 69,118 75,378 78,960 102,463 128,128
Other Personnel expenses 2,515 702 2,084 2,292 2,522 2,774 3,051
General and administrative expense 2,350 1,389 1,631 2,656 2,771 2,924 3,093
Operating income 9,768 107,815 65,403 70,430 73,667 96,765 121,984
Other expenses 219 9,186
Non-operating expense (income)
Provision for decline in value of investments
Earnings before interest and taxes 9,549 98,629 65,403 70,430 73,667 96,765 121,984
Zakat and income taxes 0 2,479 4,296 5,950 7,643 9,872 -
Net income 9,768 96,151 61,107 64,480 66,023 86,893 121,984
Transfer to Statutory reserve - 250 - - - - -
Net income to common 9,768 96,151 61,107 64,480 66,023 86,893 121,984

VALUATION REPORT APPENDICES
Page 89
Summary historical and projected Balance Sheets for the company are as follows:
(All figures in Saudi Riyals ‘000s)
2007 2008 2009 2010 2011 2012 2013
Current Assets
Accounts receivables and prepayments 3,494 24,658 17,706 18,591 19,521 25,621 32,283
Short term Investments
0 0 3,750 18,750 18,750 18,750 18,750
Bank and cash
8,254 84,460 151,129 201,580 268,435 351,704 457,426
11,748 109,117 172,585 238,921 306,705 396,075 508,459
Current Liabilities
Accounts payable
1,472 110 590 620 651 854 1,076
Due to affiliates
0 96 145 301 320 345 373
Current portion of Long term loan
0 0 0 0 0 0 120
Zakat and income tax-prov.
0 2,479 4,296 5,950 7,643 9,872 0
1,472 2,684 5,031 6,871 8,614 11,071 1,569
Net Current Assets
10,276 106,433 167,554 232,051 298,092 385,004 506,890
Assets Employed
10,276 106,433 167,554 232,051 298,092 385,004 506,890
Shareholders’ Funds
Capital
500 500 500 500 500 500 500
Statutory reserve
- 250 250 250 250 250 250
Retained earnings
9,768 105,668 166,775 231,255 297,278 384,171 506,156
10,268 106,418 167,525 232,005 298,028 384,921 506,906
Non Current Liabilities
Long term loan
- - - - - (120)
Employees' terminal benefits
8 15 29 45 63 83 104
8 15 29 45 63 83 (16)
Total
10,276 106,433 167,554 232,051 298,092 385,004 506,890

VALUATION REPORT APPENDICES
Page 90