Embed Size (px)
Citation preview

This Week in Earnings provides analysis and commentary on aggregate earnings estimate revisions, growth rates and valuations. View all Thomson Reuters Proprietary Research subscription channels.
Thomson Reuters Eikon, a complete solution for research and analytics. It places the most comprehensive market information, news, analytics and trading tools available into a desktop as simple to use as the Internet. Thomson Reuters Eikon clients can run fundamental and technical screens against a global dataset representing more than 100 countries and over 200,000 securities. Learn more. Request a free trial of Thomson Reuters Eikon today. © 2018 Thomson Reuters. All marks herein are used under license.
PROPRIETARY RESEARCH EARNINGS AGGREGATES
REPORTING ANALYST: David Aurelio, Tajinder Dhillon June 1, 2018 Media Questions/Earnings Hotline: 617-856 2459 [email protected] PR team: 646-223-5985 [email protected]
THIS WEEK IN EARNINGS AGGREGATE ESTIMATES AND REVISIONS First quarter earnings are expected to increase 26.4% from Q1 2017. Excluding the energy sector, the
earnings growth estimate declines to 24.4%.
Of the 494 companies in the S&P 500 that have reported earnings to date for Q1 2018, 77.9% have reported earnings above analyst expectations. This is above the long-term average of 64% and above the average over the past four quarters of 75%.
First quarter revenue is expected to increase 8.3% from Q4 2016. Excluding the energy sector, the
revenue growth estimate declines to 7.9%.
75.9% of companies have reported Q1 2018 revenue above analyst expectations. This is above the long-term average of 60% and above the average over the past four quarters of 69%.
For Q2 2018, there have been 66 negative EPS preannouncements issued by S&P 500 corporations compared to 49 positive, which results in an N/P ratio of 1.3 for the S&P 500 Index.
The forward four-quarter (2Q18 – 1Q19) P/E ratio for the S&P 500 is 16.5.
During the week of Jun. 4, four S&P 500 companies are expected to report quarterly earnings.
You can find additional commentary and insight on Lipper Alpha Insight
SECTION A: EARNINGS OUTLOOK Q1 2018: EARNINGS REVISIONS EXHIBIT 1A. S&P 500: Q1 2018 SHARE-WEIGHTED EARNINGS ($B)
Source: Thomson Reuters I/B/E/S
295.0
300.0
305.0
310.0
315.0
320.0
325.0
330.0
2/2
2/9
2/16
2/23 3/
23/
93/
163/
233/
30 4/6
4/13
4/20
4/27 5/4
5/11
5/18
5/25 6/
16/
86/
156/
226/
29
© 2018 Thomson Reuters. All marks herein are used under license. TRPR_82221_439 2
THOMSON REUTERS PROPRIETARY RESEARCH JUNE 1, 2018 THIS WEEK IN EARNINGS
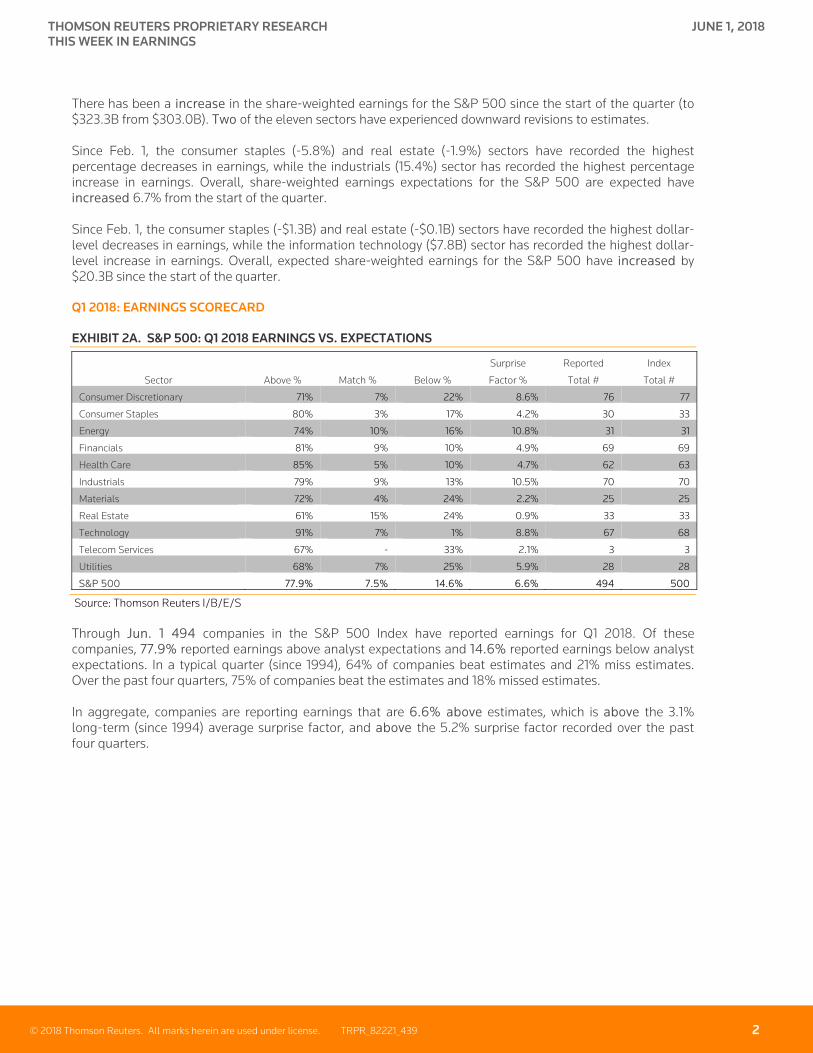
There has been a increase in the share-weighted earnings for the S&P 500 since the start of the quarter (to $323.3B from $303.0B). Two of the eleven sectors have experienced downward revisions to estimates. Since Feb. 1, the consumer staples (-5.8%) and real estate (-1.9%) sectors have recorded the highest percentage decreases in earnings, while the industrials (15.4%) sector has recorded the highest percentage increase in earnings. Overall, share-weighted earnings expectations for the S&P 500 are expected have increased 6.7% from the start of the quarter. Since Feb. 1, the consumer staples (-$1.3B) and real estate (-$0.1B) sectors have recorded the highest dollar-level decreases in earnings, while the information technology ($7.8B) sector has recorded the highest dollar-level increase in earnings. Overall, expected share-weighted earnings for the S&P 500 have increased by $20.3B since the start of the quarter. Q1 2018: EARNINGS SCORECARD EXHIBIT 2A. S&P 500: Q1 2018 EARNINGS VS. EXPECTATIONS
Surprise Reported Index
Sector Above % Match % Below % Factor % Total # Total #
Consumer Discretionary 71% 7% 22% 8.6% 76 77
Consumer Staples 80% 3% 17% 4.2% 30 33
Energy 74% 10% 16% 10.8% 31 31
Financials 81% 9% 10% 4.9% 69 69
Health Care 85% 5% 10% 4.7% 62 63
Industrials 79% 9% 13% 10.5% 70 70
Materials 72% 4% 24% 2.2% 25 25
Real Estate 61% 15% 24% 0.9% 33 33
Technology 91% 7% 1% 8.8% 67 68
Telecom Services 67% - 33% 2.1% 3 3
Utilities 68% 7% 25% 5.9% 28 28
S&P 500 77.9% 7.5% 14.6% 6.6% 494 500
Source: Thomson Reuters I/B/E/S Through Jun. 1 494 companies in the S&P 500 Index have reported earnings for Q1 2018. Of these companies, 77.9% reported earnings above analyst expectations and 14.6% reported earnings below analyst expectations. In a typical quarter (since 1994), 64% of companies beat estimates and 21% miss estimates. Over the past four quarters, 75% of companies beat the estimates and 18% missed estimates. In aggregate, companies are reporting earnings that are 6.6% above estimates, which is above the 3.1% long-term (since 1994) average surprise factor, and above the 5.2% surprise factor recorded over the past four quarters.

© 2018 Thomson Reuters. All marks herein are used under license. TRPR_82221_439 3
THOMSON REUTERS PROPRIETARY RESEARCH JUNE 1, 2018 THIS WEEK IN EARNINGS
Q1 2018: REVENUE SCORECARD EXHIBIT 3A. S&P 500: Q1 2018 REVENUE VS. EXPECTATIONS
Surprise Reported Index
Sector Above % Match % Below % Factor % Total # Total #
Consumer Discretionary 78% - 22% 2.0% 76 77
Consumer Staples 70% - 30% 1.3% 30 33
Energy 68% - 32% -0.2% 31 31
Financials 62% - 38% -1.2% 68 69
Health Care 76% - 24% 0.7% 62 63
Industrials 87% - 13% 2.8% 70 70
Materials 72% - 28% 1.0% 25 25
Real Estate 82% - 18% 6.1% 33 33
Technology 93% - 7% 2.3% 67 68
Telecom Services 33% - 67% -1.0% 3 3
Utilities 54% - 46% 2.2% 28 28
S&P 500 75.9% - 24.1% 1.1% 493 500
Source: Thomson Reuters I/B/E/S Through Jun. 1, 493 companies in the S&P 500 Index have reported revenues for Q1 2018. Of these companies, 75.9% reported revenues above analyst expectations and 24.1% reported revenues below analyst expectations. In aggregate, companies are reporting revenues that are 1.1% above estimates.

© 2018 Thomson Reuters. All marks herein are used under license. TRPR_82221_439 4
THOMSON REUTERS PROPRIETARY RESEARCH JUNE 1, 2018 THIS WEEK IN EARNINGS
Q1 2018: EARNINGS GROWTH RATES EXHIBIT 4A. S&P 500: Q1 2018 EARNINGS GROWTH
Earnings $B Earnings $B Growth $B Growth %
Sector 18Q1 17Q1 18Q1 18Q1
Consumer Discretionary 32.2 27.0 5.2 19.4%
Consumer Staples 20.5 18.2 2.3 12.8%
Energy 15.5 8.3 7.2 86.4%
Financials 63.0 48.2 14.8 30.7%
Health Care 51.1 43.9 7.1 16.3%
Industrials 29.0 23.3 5.8 24.7%
Materials 7.5 5.8 1.7 30.0%
Real Estate 7.3 7.0 0.2 3.1%
Technology 76.0 55.8 20.2 36.3%
Telecom Services 10.3 9.0 1.3 14.7%
Utilities 10.9 9.3 1.6 16.7%
S&P 500 323.3 255.8 67.5 26.4%
Source: Thomson Reuters I/B/E/S The estimated earnings growth rate for the S&P 500 for Q1 2017 is 26.4%. If the energy sector is excluded, the growth rate declines to 24.4%. The S&P 500 expects to see share-weighted earnings of $323.3B in Q1 2018, compared to share-weighted earnings of $255.8B (based on the year-ago earnings of the current 505 constituents) in Q1 2017. All 11 sectors in the index expect to see an improvement in earnings relative to Q1 2017. The energy and information technology sectors have the highest earnings growth rates for the quarter, while the real estate sector has the weakest anticipated growth compared to Q4 2016. The energy sector has the highest earnings growth rate (85.4%) of any sector. It is expected to earn $15.5B in Q1 2018, compared to earnings of $8.3B in Q1 2017. Five of the six sub-industries in the sector are anticipated to see higher earnings than a year ago. The oil & gas exploration & production (5,657.2%) and oil & gas equipment & services (189.6%) sub-industries have the highest EPS growth in the sector. If these sub-industries are removed, the growth rate declines to 35.6%. The information technology sector has the second highest earnings growth rate (36.3%) of any sector. It is expected to earn $76.0B in Q1 2018, compared to earnings of $55.8B in Q1 2017. Twelve of the 13 sub-industries in the sector are anticipated to see higher earnings than a year ago. The internet software & services (63.9%) and semiconductor equipment (54.5%) sub-industries have the highest EPS growth in the sector. If these sub-industries are removed, the growth rate declines to 31.0%. The real estate sector has the lowest growth rate (3.1%) of any sector. It is expected to earn $7.2B in Q1 2018, relative to earnings of $7.0B in Q1 2017. Three of the eight sub-industries in the sector are anticipated to see earnings decreases compared to Q1 2017, led by the office REITs (-9.9%) and health care REITs (-2.9%) sub-industries. If these sub-industries are removed, the growth rate improves to 6.0%.

© 2018 Thomson Reuters. All marks herein are used under license. TRPR_82221_439 5
THOMSON REUTERS PROPRIETARY RESEARCH JUNE 1, 2018 THIS WEEK IN EARNINGS
Q2 2018: EARNINGS GROWTH RATES EXHIBIT 5A. S&P 500: Q2 2018 EARNINGS GROWTH
Earnings $B Earnings $B Growth $B Growth %
Sector 18Q2 17Q2 18Q2 18Q2
Consumer Discretionary 34.6 30.0 4.6 15.5%
Consumer Staples 22.1 20.1 2.0 10.0%
Energy 18.7 7.9 10.8 136.2%
Financials 60.7 50.1 10.6 21.1%
Health Care 51.6 46.4 5.2 11.3%
Industrials 34.0 29.5 4.5 15.2%
Materials 8.3 6.4 1.9 29.4%
Real Estate 7.6 7.5 0.2 2.3%
Technology 70.9 57.2 13.7 24.0%
Telecom Services 10.5 9.3 1.2 13.0%
Utilities 8.4 8.4 0.0 -0.3%
S&P 500 327.4 272.7 54.7 20.1%
Source: Thomson Reuters I/B/E/S The estimated earnings growth rate for the S&P 500 for Q2 2018 is 20.1%. If the energy sector is excluded, the growth rate declines to 16.6%. The S&P 500 expects to see share-weighted earnings of $327.4B in Q2 2018, compared to share-weighted earnings of $272.7B (based on the year-ago earnings of the current 505 constituents) in Q2 2017. Ten of the 11 sectors in the index expect to see an improvement in earnings relative to Q2 2017. The energy and materials sectors have the highest earnings growth rates for the quarter, while the utilities sector has the weakest anticipated growth compared to Q2 2017. The energy sector has the highest earnings growth rate (136.2%) of any sector. It is expected to earn $18.7B in Q2 2018, compared to earnings of $7.9B in Q2 2017. All six sub-industries in the sector are anticipated to see higher earnings than a year ago. The oil & gas exploration & production (1,790.8%) and oil & gas drilling (114.9%) sub-industries have the highest EPS growth in the sector. If these sub-industries are removed, the growth rate declines to 86.2%. The materials sector has the second highest earnings growth rate (29.4%) of any sector. It is expected to earn $8.3B in Q2 2018, compared to earnings of $6.4B in Q2 2017. Ten of 11 sub-industries in the sector are anticipated to see higher earnings than a year ago. The copper (219.2%) and steel (67.7%) and sub-industries have the highest EPS growth in the sector. If these sub-industries are removed, the growth rate declines to 19.7%. The utilities sector has the lowest growth rate (-0.3%) of any sector. It is expected to earn $8.4B in Q2 2018, relative to earnings of $8.4B in Q2 2017. One of the four sub-industries in the sector is anticipated to see earnings decreases compared to Q2 2017, led by the electric utilities (-3.6%) and multi utilities (2.2%) sub-industries. If these sub-industries are removed, the growth rate improves to 33.4%.

© 2018 Thomson Reuters. All marks herein are used under license. TRPR_82221_439 6
THOMSON REUTERS PROPRIETARY RESEARCH JUNE 1, 2018 THIS WEEK IN EARNINGS
REVENUE GROWTH RATES EXHIBIT 6A. S&P 500: Q1 2018 REVENUE GROWTH
Revenue $B Revenue $B Growth $B Growth %
Sector 18Q1 17Q1 18Q1 18Q1
Consumer Discretionary 412.6 380.9 31.7 8.3%
Consumer Staples 288.7 273.8 14.9 5.5%
Energy 246.8 219.0 27.8 12.7%
Financials 334.6 327.4 7.2 2.2%
Health Care 484.7 453.5 31.2 6.9%
Industrials 318.5 288.2 30.3 10.5%
Materials 67.4 59.4 8.0 13.5%
Real Estate 25.0 22.0 3.0 13.5%
Technology 326.0 280.3 45.6 16.3%
Telecom Services 75.1 72.9 2.2 3.0%
Utilities 84.9 82.4 2.5 3.0%
S&P 500 2,664.2 2,459.9 204.3 8.3%
Source: Thomson Reuters I/B/E/S The estimated revenue growth rate for the S&P 500 for Q1 2018 is 8.3%. If the energy sector is excluded, the growth rate declines to 7.9%. The S&P 500 is expected to earn revenues of $2,664.2B in Q1 2018 compared to $2,459.9B in Q1 2017. All 11 sectors anticipate revenue growth for the quarter. The information technology sector is expected to have the highest revenue growth rates for the quarter, while the financials sector is anticipated to have the weakest growth compared to Q1 2017. The information technology sector expects the highest revenue growth rate (16.3%) for the quarter. It is expected to generate sales of $326.0B in Q1 2018, compared to sales of $280.3B in Q1 2017. All thirteen sub-industries in the sector are expected to see sales growth, led by the internet software & services (29.3%) and semiconductor equipment (28.2%) sub-industries. If these sub-industries are removed, the growth rate declines to 14.3%.
The financials sector has the lowest revenue growth rate at 2.2%. The sector is expected to post sales of $334.6B in Q1 2018, relative to sales of $327.4B in Q1 2017. Two of the 12 sub-industries in the sector are expected to see revenue decreases for the quarter, led by multi-sector holdings (-21.8%) & multi-line insurance (-4.7%) sub-industries. If these they are removed, the growth rate declines to a gain of 7.7%. EXHIBIT 7A. S&P 500: Q2 2018 REVENUE GROWTH
Revenue $B Revenue $B Growth $B Growth %
Sector 18Q2 17Q2 18Q2 18Q2
Consumer Discretionary 430.0 398.4 31.6 7.9%
Consumer Staples 289.6 276.1 13.5 4.9%
Energy 269.4 225.5 43.9 19.5%
Financials 342.6 328.1 14.5 4.4%
Health Care 495.6 468.5 27.0 5.8%
Industrials 335.8 312.1 23.7 7.6%
Materials 70.7 62.8 7.9 12.5%
Real Estate 25.2 22.8 2.4 10.5%
Technology 323.1 288.1 35.0 12.2%
Telecom Services 75.4 74.0 1.3 1.8%
Utilities 75.4 75.7 -0.3 -0.4%
S&P 500 2,732.8 2,532.2 200.6 7.9%
Source: Thomson Reuters I/B/E/S

© 2018 Thomson Reuters. All marks herein are used under license. TRPR_82221_439 7
THOMSON REUTERS PROPRIETARY RESEARCH JUNE 1, 2018 THIS WEEK IN EARNINGS
AGGREGATE ESTIMATES AND REVISIONS Note: The estimate revision numbers below are an aggregate of the total number of earnings estimate revisions for the Fiscal Year 1 period for all companies in the United States over the previous seven days. Up revisions represent the total number of estimates for Fiscal Year 1 submitted in the past seven days that are higher than the previous estimates for Fiscal Year 1. Down revisions represent the total number of estimates for Fiscal Year 1 submitted in the past seven days of that are lower than the previous estimates for Fiscal Year 1. EXHIBIT 8A. ESTIMATE REVISIONS – S&P 500
Total Up Down
Week Ending Revisions Revisions % Revisions %
11-May-18 1,286 800 62% 486 38%
18-May-18 723 399 55% 324 45%
25-May-18 761 507 67% 254 33%
01-Jun-18 524 309 59% 215 41%
Source: Thomson Reuters I/B/E/S EXHIBIT 9A. S&P 500: EARNINGS ESTIMATE REVISION TREND
Source: Thomson Reuters I/B/E/S

© 2018 Thomson Reuters. All marks herein are used under license. TRPR_82221_439 8
THOMSON REUTERS PROPRIETARY RESEARCH JUNE 1, 2018 THIS WEEK IN EARNINGS
EXHIBIT 10A. ESTIMATE REVISIONS – ALL U.S. COMPANIES Total Up Down
Week Ending Revisions Revisions % Revisions %
11-May-18 5,059 2,986 59% 2,073 41%
18-May-18 2,274 1,155 51% 1,119 49%
25-May-18 1,645 975 59% 670 41%
01-Jun-18 1,189 708 60% 481 40%
Source: Thomson Reuters I/B/E/S EXHIBIT 11A. ALL U.S. COMPANIES: EARNINGS ESTIMATE REVISION TREND
Source: Thomson Reuters I/B/E/S

© 2018 Thomson Reuters. All marks herein are used under license. TRPR_82221_439 9
THOMSON REUTERS PROPRIETARY RESEARCH JUNE 1, 2018 THIS WEEK IN EARNINGS
Q4 2017: EARNINGS GUIDANCE EXHIBIT 12A. S&P 500: Q2 2018 PREANNOUNCEMENTS
Q2 2018 Q2 2017 Q1 2018
Type Total (#) Total (%) Total (#) Total (%) Total (#) Total (%)
Positive 49 39% 44 34% 53 45%
In-Line 11 9% 10 8% 4 3%
Negative 66 52% 76 58% 61 52%
Total 126 130 118
N/P Ratio 1.3 1.7 1.2
Source: Thomson Reuters I/B/E/S In the S&P 500, there have been 66 negative EPS preannouncements issued by corporations for Q2 2018 compared to 49 positive EPS preannouncements. By dividing 66 by 49 one arrives at an N/P ratio of 1.3 for the S&P 500 Index. This 1.3 ratio is below the N/P ratio at the same point in time in Q2 2017 (1.7), and below the long-term aggregate (since 1995) N/P ratio for the S&P 500 (2.8). Q2 2018 – Q1 2019: FORWARD FOUR-QUARTER P/E RATIO EXHIBIT 13A. S&P 500: FORWARD FOUR-QUARTER (Q2 2018 – Q1 2019) P/E RATIO
Price EPS P/E Ratio
CY 2017 2,705.27 132.00 20.5
Forward 4 Quarter 2,705.27 163.84 16.5
CY 2018 2,705.27 161.09 16.8
Source: Thomson Reuters I/B/E/S The forward four-quarter (Q2 2018 – Q1 2019) P/E ratio for the S&P 500 is 16.5. Q1 2018 – Q1 2019: EARNINGS GROWTH
The estimated earnings growth rates for the S&P 500 for Q1 2018 through Q1 2019 are 26.4%, 20.1%, 23.0%, 19.9%, and 7.0% respectively. For sector-level growth rates for Q1 2018 through Q1 2019, see Exhibits 2C-6C in this report. EARNINGS CALENDAR There are 4 companies scheduled to report quarterly earnings during the week of June. 4, 2018. EXHIBIT 14A. NUMBER OF COMPANIES REPORTING Q1 2018 EARNINGS
Reported Report Report Report
Q1 2018 To Date This Week Next Week Remaining
Dow 30 30 0 0 0
S&P 500 494 4 2 0
Source: Thomson Reuters Eikon

© 2018 Thomson Reuters. All marks herein are used under license. TRPR_82221_439 10
THOMSON REUTERS PROPRIETARY RESEARCH JUNE 1, 2018 THIS WEEK IN EARNINGS
STARMINE EARNINGS SURPRISE FORECAST Looking forward at quarterly performance, we use StarMine’s SmartEstimate® to determine which companies in the S&P 500 are better poised to beat earnings estimates. The SmartEstimate® is a weighted average of analyst estimates, with more weight given to more recent estimates and more accurate analysts. Our studies have shown that when the SmartEstimate® differs significantly from the consensus (IBES Mean), the Predicted Surprise accurately predicts the direction of earnings surprises or further revisions 70% of the time. When significant Predicted Surprise for revenue is also present for the period, the accuracy improves to 78%. StarMine ARM is an analyst revisions stock ranking model, designed to predict future changes in analyst sentiment. Incorporates more accurate earnings estimates through the SmartEstimate prediction service. ARM region rankings scores companies by region on a scale of 1 to 100 where 100 represents the most bullish sentiment. Over the next two weeks, 6 S&P 500 companies are expected to report earnings. Of these companies, 0 positive surprise and 0 negative surprises are expected from S&P 500 companies reporting quarterly results. Exhibit 15A. S&P 500: Positive Predicted Surprises for Jun. 4 through Jun. 15, 2018
Company Ticker Sector Report Date
Smart Estimate Mean
Predicted Surprise %
ARM Region Rank
Sources: Thomson Reuters StarMine, Thomson Reuters Eikon Exhibit 16A. S&P 500: Negative Predicted Surprises for Jun. 4 through Jun. 15, 2018
Company Ticker Sector Report Date
Smart Estimate Mean
Predicted Surprise %
ARM Region Rank
Sources: Thomson Reuters StarMine, Thomson Reuters Eikon

© 2018 Thomson Reuters. All marks herein are used under license. TRPR_82221_439 11
THOMSON REUTERS PROPRIETARY RESEARCH JUNE 1, 2018 THIS WEEK IN EARNINGS
SECTION B: EARNINGS CALENDAR EARNINGS CALENDAR BY SECTOR EXHIBIT 1B. NUMBER OF S&P 500 COMPANIES EXPECTED TO REPORT NEXT WEEK BY SECTOR
Sector 04-Jun 05-Jun 06-Jun 07-Jun 08-Jun Total # Reported # of Cos Consumer Discretionary - - - - - - 76 77 Consumer Staples - - 1 1 - 2 30 33 Energy - - - - - - 31 31 Financials - - - - - - 69 69 Health Care - - - 1 - 1 62 63 Industrials - - - - - - 70 70 Materials - - - - - - 25 25 Real Estate - - - - - - 33 33 Technology - - - 1 - 1 67 68 Telecom - - - - - - 3 3 Utilities - - - - - - 28 28 S&P 500 - - 1 3 - 4 494 500
Source: Thomson Reuters Eikon

© 2018 Thomson Reuters. All marks herein are used under license. TRPR_82221_439 12
THOMSON REUTERS PROPRIETARY RESEARCH JUNE 1, 2018 THIS WEEK IN EARNINGS
MONDAY: JUNE 4 EXHIBIT 2B. MONDAY EARNINGS CALENDAR
Date Ticker Company Qtr Est Yr Ago % Dif Time
Source: Thomson Reuters Eikon, Thomson Reuters I/B/E/S

© 2018 Thomson Reuters. All marks herein are used under license. TRPR_82221_439 13
THOMSON REUTERS PROPRIETARY RESEARCH JUNE 1, 2018 THIS WEEK IN EARNINGS
TUESDAY: JUNE 5 EXHIBIT 3B. TUESDAY EARNINGS CALENDAR
Date Ticker Company Qtr Est Yr Ago % Dif Time
Thomson Reuters Eikon, Thomson Reuters I/B/E/S

© 2018 Thomson Reuters. All marks herein are used under license. TRPR_82221_439 14
THOMSON REUTERS PROPRIETARY RESEARCH JUNE 1, 2018 THIS WEEK IN EARNINGS
WEDNESDAY: JUNE 6 EXHIBIT 4B. WEDNESDAY EARNINGS CALENDAR
Date Ticker Company Qtr Est Yr Ago % Dif Time 6-Jun-18 BFb.N BROWN-FORMAN CORP Q4-Apr.18 0.22 0.30 -26.0 8:00 AM
Thomson Reuters Eikon, Thomson Reuters I/B/E/S

© 2018 Thomson Reuters. All marks herein are used under license. TRPR_82221_439 15
THOMSON REUTERS PROPRIETARY RESEARCH JUNE 1, 2018 THIS WEEK IN EARNINGS
THURSDAY: JUNE 7 EXHIBIT 5B. THURSDAY EARNINGS CALENDAR
Date Ticker Company Qtr Est Yr Ago % Dif Time 7-Jun-18 SJM.N J M SMUCKER CO Q4-Apr.18 2.20 1.80 22.2 8:30 AM 7-Jun-18 AVGO.OQ BROADCOM INC Q2-Apr.18 4.76 3.69 29.0 4:00 PM 7-Jun-18 COO.N COOPER COMPANIES INC Q2-Apr.18 2.84 2.50 13.4 4:15 PM
Thomson Reuters Eikon, Thomson Reuters I/B/E/S

© 2018 Thomson Reuters. All marks herein are used under license. TRPR_82221_439 16
THOMSON REUTERS PROPRIETARY RESEARCH JUNE 1, 2018 THIS WEEK IN EARNINGS
FRIDAY: JUNE 8 EXHIBIT 6B. FRIDAY EARNINGS CALENDAR
Date Ticker Company Qtr Est Yr Ago % Dif Time
Thomson Reuters Eikon, Thomson Reuters I/B/E/S

© 2018 Thomson Reuters. All marks herein are used under license. TRPR_82221_439 17
THOMSON REUTERS PROPRIETARY RESEARCH JUNE 1, 2018 THIS WEEK IN EARNINGS
SECTION C: EARNINGS DATA TABLES EXHIBIT 1C. S&P 500: Q1 2018 EARNINGS SCORECARD
Sector Above Match Below Surprise Reported IndexConsumer Discretionary 71% 7% 22% 8.6% 76 77Consumer Staples 80% 3% 17% 4.2% 30 33Energy 74% 10% 16% 10.8% 31 31Financials 81% 9% 10% 4.9% 69 69Health Care 85% 5% 10% 4.7% 62 63Industrials 79% 9% 13% 10.5% 70 70Materials 72% 4% 24% 2.2% 25 25Real Estate 61% 15% 24% 0.9% 33 33Technology 91% 7% 1% 8.8% 67 68Telecom 67% - 33% 2.1% 3 3Utilities 68% 7% 25% 5.9% 28 28S&P 500 77.9% 7.5% 14.6% 6.6% 494 500
Source: Thomson Reuters I/B/E/S EXHIBIT 2C. S&P 500: Q1 2018 EARNINGS GROWTH
Sector Today 1 Apr 1 Jan 1 Oct 1 JulConsumer Discretionary 19.4% 9.4% 4.8% 7.9% 9.2%Consumer Staples 12.8% 10.9% 9.0% 8.9% 7.7%Energy* 86.4% 71.3% 50.3% 27.9% 49.6%Financials 30.7% 24.4% 12.3% 10.0% 10.8%Health Care 16.3% 10.7% 5.6% 6.2% 5.0%Industrials 24.7% 14.6% 9.8% 13.7% 15.6%Materials 30.0% 27.6% 21.6% 18.7% 12.5%Real Estate 3.1% 3.0% 4.8% 6.1% 8.0%Technology 36.3% 23.4% 19.7% 14.4% 10.7%Telecom 14.7% 12.9% -1.1% 2.1% 1.7%Utilities 16.7% 10.0% 8.1% 5.3% 2.3%S&P 500 26.4% 18.5% 12.2% 10.6% 10.5%
Source: Thomson Reuters I/B/E/S EXHIBIT 3C. S&P 500: Q2 2018 EARNINGS GROWTH
Sector Today 1 Apr 1 Jan 1 Oct 1 JulConsumer Discretionary 15.5% 17.4% 8.7% 9.9% 14.6%Consumer Staples 10.0% 12.3% 8.4% 7.7% 8.4%Energy 136.2% 114.8% 78.6% 51.8% 56.8%Financials 21.1% 22.9% 11.7% 9.7% 15.5%Health Care 11.3% 10.5% 4.2% 5.0% 10.0%Industrials 15.2% 17.3% 6.0% 9.8% 15.1%Materials 29.4% 27.8% 18.0% 16.1% 16.8%Real Estate 2.3% 2.0% 4.0% 4.9% 8.9%Technology 24.0% 22.0% 16.4% 11.9% 13.6%Telecom 13.0% 14.5% -1.9% 1.0% 2.6%Utilities -0.3% -0.6% -0.5% -0.5% 9.0%S&P 500 20.1% 19.8% 11.4% 9.9% 14.2%
Source: Thomson Reuters I/B/E/S

© 2018 Thomson Reuters. All marks herein are used under license. TRPR_82221_439 18
THOMSON REUTERS PROPRIETARY RESEARCH JUNE 1, 2018 THIS WEEK IN EARNINGS
EXHIBIT 4C. S&P 500: Q3 2018 EARNINGS GROWTH
Sector Today 1 Apr 1 Jan 1 Oct Consumer Discretionary 20.5% 19.8% 10.9% 15.4% Consumer Staples 12.9% 12.8% 7.6% 8.8% Energy 100.4% 74.1% 44.4% 37.2% Financials 44.0% 45.3% 32.0% 18.0% Health Care 11.1% 11.1% 5.8% 10.7% Industrials 19.6% 20.3% 8.7% 8.7% Materials 30.1% 29.0% 18.9% 28.8% Real Estate 4.9% 5.0% 7.2% 8.5% Technology 16.4% 15.4% 8.8% 12.4% Telecom 16.5% 17.9% 0.9% 1.8% Utilities 6.1% 8.3% 3.9% 4.9% S&P 500 23.0% 22.1% 13.2% 13.2%
Source: Thomson Reuters I/B/E/S EXHIBIT 5C. S&P 500: Q4 2018 EARNINGS GROWTH
Sector Today 1 Apr 1 Jan Consumer Discretionary 20.6% 18.9% 11.9% Consumer Staples 10.4% 10.3% 8.2% Energy 70.1% 49.4% 17.5% Financials 27.7% 28.1% 17.1% Health Care 12.9% 13.7% 11.7% Industrials 29.4% 31.1% 13.4% Materials 17.3% 17.2% 14.7% Real Estate 9.0% 8.6% 7.3% Technology 14.9% 13.9% 9.1% Telecom 12.0% 14.0% 4.6% Utilities 1.2% 2.6% 3.5% S&P 500 19.9% 19.0% 11.7%
Source: Thomson Reuters I/B/E/S EXHIBIT 6C. S&P 500: Q1 2019 EARNINGS GROWTH
Sector Today 1 Apr Consumer Discretionary 6.8% 13.3% Consumer Staples 6.2% 7.5% Energy 30.0% 12.3% Financials 7.1% 11.7% Health Care 7.2% 10.7% Industrials 9.6% 16.6% Materials 9.7% 11.3% Real Estate 6.6% 5.9% Technology 2.7% 9.7% Telecom 2.9% 2.4% Utilities -0.7% 0.7% S&P 500 7.0% 10.6%
Source: Thomson Reuters I/B/E/S

© 2018 Thomson Reuters. All marks herein are used under license. TRPR_82221_439 19
THOMSON REUTERS PROPRIETARY RESEARCH JUNE 1, 2018 THIS WEEK IN EARNINGS
EXHIBIT 7C. S&P 500: CY 2018 EARNINGS GROWTH
Sector Today 1 Apr 1 Jan 1 Oct 1 JulConsumer Discretionary 19.3% 17.1% 9.2% 10.2% 11.9%Consumer Staples 11.4% 11.6% 8.3% 8.3% 8.0%Energy 93.3% 70.3% 40.8% 35.5% 43.1%Financials 30.4% 29.5% 17.5% 12.2% 12.5%Health Care 12.8% 11.5% 6.9% 8.5% 9.0%Industrials 22.1% 21.4% 9.7% 10.7% 12.2%Materials 25.1% 23.2% 17.7% 18.0% 12.7%Real Estate 4.8% 4.7% 6.0% 7.3% 7.9%Technology 21.8% 18.1% 13.1% 12.0% 11.5%Telecom 14.1% 14.5% 1.2% 1.6% 2.0%Utilities 5.8% 5.2% 4.6% 5.0% 6.3%S&P 500 22.1% 19.8% 12.0% 11.1% 11.8%
Source: Thomson Reuters I/B/E/S EXHIBIT 8C. S&P 500: CY 2019 EARNINGS GROWTH
Sector Today 1 Apr Consumer Discretionary 12.0% 12.4% Consumer Staples 7.6% 8.4% Energy 14.8% 12.2% Financials 10.0% 10.6% Health Care 8.8% 9.6% Industrials 12.1% 12.4% Materials 8.3% 9.6% Real Estate 6.9% 7.1% Technology 8.5% 9.9% Telecom 1.7% 1.7% Utilities 5.4% 5.6% S&P 500 9.5% 10.0%
Source: Thomson Reuters I/B/E/S EXHIBIT 9C. S&P 500: BOTTOMS-UP EPS ACTUALS AND ESTIMATES
Year Q1 Q2 Q3 Q4 CY 2004 15.87 16.74 16.59 17.83 67.10 2005 17.95 19.11 18.86 20.19 76.28 2006 20.73 22.31 22.60 22.44 88.18 2007 22.71 24.40 21.31 16.14 85.12 2008 18.96 19.78 17.49 5.62 65.47 2009 12.83 16.03 16.36 16.80 60.80 2010 19.71 21.48 21.75 22.55 85.28 2011 23.50 24.14 25.65 24.55 97.82 2012 25.60 25.84 26.00 26.32 103.80 2013 26.74 27.40 27.63 28.62 109.68 2014 28.18 30.07 30.04 30.54 118.78 2015 28.60 30.09 29.99 29.52 117.46 2016 26.96 29.61 31.21 31.30 118.10 2017 30.90 32.58 33.45 36.02 132.002018 38.21 39.04 40.92 42.64 161.092019 41.24 43.25 45.12 47.03 176.532020 193.20
Source: Thomson Reuters I/B/E/S

© 2018 Thomson Reuters. All marks herein are used under license. TRPR_82221_439 20
THOMSON REUTERS PROPRIETARY RESEARCH JUNE 1, 2018 THIS WEEK IN EARNINGS
EXHIBIT 10C. S&P 500: ACTUAL EARNINGS GROWTH RATES
Sector 17Q4 17Q3 17Q2 17Q1 16Q4Consumer Discretionary 10.7% 3.9% 4.1% 6.0% 5.3%Consumer Staples 12.1% 4.7% 4.5% 3.7% 7.2%Energy 120.4% 162.6% 563.9% 683.0% 5.5%Financials 14.6% -7.3% 12.2% 19.9% 11.6%Health Care 9.1% 8.3% 8.7% 7.3% 7.2%Industrials 1.8% 3.1% 5.5% 4.1% -0.9%Materials 35.9% 7.0% 6.1% 19.3% 7.1%Real Estate -4.1% 3.8% 4.7% 2.8% 8.7%Technology 20.1% 24.2% 18.3% 19.8% 12.7%Telecom 4.8% -2.8% 4.8% -4.9% -0.2%Utilities 13.0% -4.6% 5.9% 2.7% 10.1%S&P 500 14.8% 8.5% 12.3% 15.3% 8.0%
Source: Thomson Reuters I/B/E/S EXHIBIT 11C. S&P 500: ACTUAL VS. ESTIMATE (ABOVE/MATCH/BELOW)
17Q4 17Q3 17Q2 17Q1 16Q4Above 76.2% 72.8% 73.3% 75.6% 68.0%Match 8.4% 8.4% 8.8% 6.6% 10.7%Below 15.4% 18.8% 17.8% 17.8% 21.3%
Source: Thomson Reuters I/B/E/S EXHIBIT 12C. S&P 500: ACTUAL VS. ESTIMATE (AGGREGATE DIFFERENCE)
17Q4 17Q3 17Q2 17Q1 16Q4Surprise Factor 4.4% 4.8% 5.5% 6.1% 2.3%
Source: Thomson Reuters I/B/E/S

© 2018 Thomson Reuters. All marks herein are used under license. TRPR_82221_439 21
THOMSON REUTERS PROPRIETARY RESEARCH JUNE 1, 2018 THIS WEEK IN EARNINGS
NOTES/DEFINITIONS IMPORTANT NOTICE This disclaimer is in addition to and not in replacement of any disclaimer of warranties and liabilities set forth in a written agreement between Thomson Reuters and you or the party authorizing your access to the Service (“Contract Disclaimer”). In the event of a conflict or inconsistency between this disclaimer and the Contract Disclaimer the terms of the Contract Disclaimer shall control. By accessing these materials, you hereby agree to the following: These research reports and the information contained therein is for your internal use only and redistribution of this information is expressly prohibited. These reports including the information and analysis, any opinion or recommendation is not intended for investment purposes and does not constitute investment advice or an offer, or an invitation to make an offer, to buy or sell any securities or any derivatives related to such securities. Thomson Reuters does not warrant the accuracy of the reports for any particular purpose and expressly disclaims any warranties of merchantability or fitness for a particular purpose; nor does Thomson Reuters guarantee the accuracy, validity, timeliness or completeness of any information or data included in these reports for any particular purpose. Thomson Reuters is under no obligation to provide you with any current or corrected information. Neither Thomson Reuters nor any of its affiliates, directors, officers or employees, will be liable or have any responsibility of any kind for any loss or damage (whether direct, indirect, consequential, or any other damages of any kind even if Thomson Reuters was advised of the possibility thereof) that you incur in connection with, relating to or arising out of these materials or the analysis, views, recommendations, opinions or information contained therein, or from any other cause relating to your access to, inability to access, or use of these materials, whether or not the circumstances giving rise to such cause may have been within the control of Thomson Reuters. The information provided in these materials is not intended for distribution to, or use by, any person or entity in any jurisdiction or country where such distribution or use would be contrary to law or regulation or which would subject Thomson Reuters or its affiliates to any registration requirement within such jurisdiction or country. DISCLAIMERS The service does not constitute a recommendation to buy or sell securities of any kind and Thomson Reuters has not undertaken any liability or obligation relating to the purchase or sale of any securities for or by you. The service is furnished to you on an “as is” basis with all faults and defects contained therein. Thomson Reuters does not make any representations or warranties either express or implied, including without limitation, any implied warranty of merchantability or fitness for a particular purpose or use, with respect to any aspect of the service. Thomson Reuters does not make any warranties that the service will be uninterrupted, timely, complete, and accurate or error free, or the results to be obtained from use of the service. Use of the service is at your sole risk and Thomson Reuters shall not have any responsibility or liability for any errors or omissions in, or resulting from the use of, the services or the software product, any decision made or action taken by you in reliance upon the services, any failures or delays in providing the service, any loss of use thereof, or for any loss, damage, injury or expense caused directly or indirectly by its actions or inactions in connection with this agreement or the production, distribution or redistribution of the service. Thomson Reuters will not in any way be liable to you or to any other entity for any indirect, consequential, punitive, special or exemplary damages, including, but not limited to, loss of profits, resulting there from, regardless of cause and regardless of whether or not Thomson Reuters was advised of the possibility of such damages. JURISDICTION These Terms and Conditions shall be construed and enforced in accordance with the law of the State of New York without giving effect to any choice of law or conflict of law provisions. In no event shall these Terms and Conditions be governed by the United Nations Convention on Contracts for the International Sale of Goods. UCITA, whether enacted in whole or in part by any state or applicable jurisdiction, regardless of how codified shall not apply to these Terms and Conditions and is hereby disclaimed. Any disputes arising under these Terms and Conditions will be brought and heard in the appropriate Federal or state court located in New York County in the State of New York and each of the parties hereby irrevocably consents to the jurisdiction of such courts. You may not assign these Terms and Conditions nor any rights granted hereunder by sale, change in control or otherwise without Thomson Reuters’ prior written consent.

© 2018 Thomson Reuters. All marks herein are used under license. TRPR_82221_439 22
THOMSON REUTERS PROPRIETARY RESEARCH JUNE 1, 2018 THIS WEEK IN EARNINGS
About Thomson Reuters Eikon Thomson Reuters Eikon is more comprehensive and collaborative than anything you’ve ever worked with. It is a real-time research and portfolio management solution that delivers a broad and deep range of global financial content and insight. You get direct, unfiltered access to industry-leading sources of financial information and analytics, all in a fully integrated workspace designed to help you better analyze your investable universe and monitor your holdings. In a single application, you can: access broker research, estimates, financials, events, news, fixed income and credit analysis, and more; conduct in-depth portfolio analysis versus indices, sectors, and industries; investigate data aggregates and complex data relationships; broaden your understanding of the credit markets; monitor negative developments and uncover new investment ideas. We also provide effortless integration of our content into your proprietary spreadsheets, and allow you to stay connected to critical portfolio information on your BlackBerry®. Request free trial of Thomson Reuters Eikon Today. About Thomson Reuters Thomson Reuters is the world’s leading source of intelligent information for businesses and professionals. We combine industry expertise with innovative technology to deliver critical information to leading decision makers in the financial, legal, tax and accounting, scientific, healthcare and media markets, powered by the world’s most trusted news organization. With headquarters in New York and major operations in London and Eagan, Minnesota, Thomson Reuters employs more than 50,000 people in 93 countries. Thomson Reuters shares are listed on the New York Stock Exchange (NYSE: TRI) and Toronto Stock Exchange (TSX: TRI). For more information, go to www.thomsonreuters.com .