Embed Size (px)
Citation preview
This work has been submitted to NECTAR, the Northampton ElectronicCollection of Theses and Research.
Thesis
Title: Social bonds in dairy cattle: the effect of dynamic group systems on welfareand productivity
Creator: McLennan, K. M.
Example citation: McLennan, K. M. (2013) Social bonds in dairy cattle: the effectof dynamic group systems on welfare and productivity. Doctoral thesis. TheUniversity of Northampton.
Version: Accepted version
http://nectar.northampton.ac.uk/6466/
NECTAR
Social Bonds in Dairy Cattle: The Effect of Dynamic Group Systems on Welfare and Productivity.
Submitted for the Degree of Doctor of Philosophy At the University of Northampton
2013
Krista Marie McLennan
© [Krista Marie McLennan] [2013].
This thesis is copyright material and no quotation from it may be published without proper acknowledgement.
i
A THESIS
Submitted for
THE DEGREE OF DOCTORATE IN PHILOSOPHY
in
SOCIAL BONDS IN DAIRY CATTLE: THE EFFECT OF DYNAMIC GROUP
SYSTEMS ON WELFARE AND PRODUCTIVITY
Faculty of Applied Sciences, University of Northampton
In association with
Animal Welfare and Management, Moulton College, Moulton, Northampton
By
Krista Marie McLennan
BSc (Hons) Sparsholt College, University of Portsmouth
MSc University of Exeter
ii
To my mother and father for their enduring encouragement to learn
To my husband for all his love and support, I thank you
iii
Declaration I declare that this thesis is my own work and that the research described in it is my own
work, unless stated otherwise.
Krista M. McLennan January 2013
iv
Acknowledgements
There are many people that I would to thank for making this PhD possible. My family
have always been supportive and have encouraged me to strive forward in my pursuit to
learn. My parents have always ensured that I had as good an education as they could
give and this inspired me to go further. In particular I must thank my husband who has
been immensely supportive in my ambition to study and learn. I thank him for his
ability to keep me focused and driven on the tough days. Without his continuous
encouragement and support this project could not have been possible.
I would also like to thank my supervisors, Dr Hannah Gauci, Dr Joanne Meredith, Dr
Charlotte Stewart, Dr James Littlemore, and Dr Wanda McCormick. Their continued
confidence and dedication to my work has been extremely valuable at keeping me on
track and giving me confidence. They have guided me through the harder times and
kept me focused when it may have felt like things were not going to plan.
I must also thank all the friends that I have made throughout my studies for their
inspiration and encouragement. Thank you to my colleagues at Moulton College who
have been so supportive whilst I was juggling the teaching alongside my studies,
especially Stella Chapman MRCVS for her inspiration and the confidence that she gave
me in my work. They all have supported me and sometimes given advice, all of which
has spurred me on until the end.
v
A big thank you must go to the students who helped to collect some of the data for part
of the project; Phillip Watson, Lauren Ingledow, Hayley Walters, Louise Clarke, Holly
Cheriton, and Lauren Samat. Furthermore, thanks must go to the farm staff Chris, John,
Rob, Andrew, James, Steve and Matthew, for all their help and advice when handling
the cows, and for the support and understanding towards the project.
Thanks must also go to the Thomas Harrison Trust who funded my PhD. I would never
have been able to undertake such a project without this funding. Thanks also to the T D
Lewis Scholarship, University of Northampton for providing financial help with part of
the project, without this extra funding it could not have been possible to get the level of
welfare assessment achieved.
vi
Publications
Publications
McLennan, K. M., McCormick, W., (2012). Farmyard Friends. The Biologist. 59(4);
18-22
Conference Proceedings
McLennan, K. M., (2008). Social Bonds in Dairy Cattle: Effects of Dynamic Group
Systems on Welfare and Productivity. In: Proceedings of the Third Student Animal
Welfare Conference, Writtle College.
McLennan, K. M., Stewart, C., and Meredith, J., (2010). Social Bonds in Dairy Cattle
– Preliminary Observations. In: Proceedings of the Regional Meeting of the
International Society of Applied Ethology, UK/Eire p10
McLennan, K. M., Littlemore, J., McCormick, W., (2012) The Effects of Short-Term
Separation on Physiological Parameters of Dairy Cattle: Heart Rate versus Cortisol. In:
Proceedings of the Regional Meeting of the International Society of Applied Ethology,
UK/Eire
Other presentations
McLennan, K. M., (2011). Effects of Having a Preferred Partner Present on the Heart
Rate of Heifers During Short Term Social Isolation. Centre for Animal Welfare and
Anthrozoology Seminars, University of Cambridge.
vii
McLennan, K. M., (2011). The Cardiac Responses of Cattle When Isolated Either with
or Without Their Preferred Partner. In: Proceedings of Postgraduate Research Degree
Student & Early Career Researcher, Annual Research Conference 2011, The University
of Northampton.
McLennan, K. M., Littlemore, J., McCormick, W., (2012). Husbandry Practices in
Large Dynamic Dairy Herds: The Effects of Social Support. In: Proceedings of SET for
BRITAIN, Biological and Biomedical Sciences Exhibition, House of Commons.
viii
Abstract The recent increase in intensification of the UK dairy industry has led to the majority of cattle in the UK being housed in large, dynamic groups. Proposals for two large-scale dairies intending to house between 3,000 and 8,000 head of cattle have been met with considerable opposition by both producers and the public alike. Recent reports by both the Farm Animal Welfare Council and European Food Safety Authority have highlighted the continued welfare issues relating to dairy cattle, especially those housed in such large, dynamic groups. Conversely, with the current economic challenges being imposed on the UK dairy industry, there are many who see these systems as the future of dairying and discount the welfare concerns being highlighted. This project aimed to address one of the main welfare issues that receives scarce consideration when designing such systems; the social bonds of dairy cattle. A herd of 400 Holstein-Friesian cattle, plus followers, were observed in cubicle housing under commercial conditions. Through the identification of preferential relationships using an association index, important social bonds between individuals were identified. The majority of relationships between dyads were however weak, short term associations appearing together no more than once throughout the observation period. These bonds were significantly stronger in younger cattle demonstrated through the closer proximity maintained and the higher association index scores between dyads. Between the ages of 7 & 11 months animals performed the most positive social behaviour and had the strongest dyad relationships. In order to assess the strength of these positive relationships between dyads and to investigate the importance of these relationships to cattle, a short term (30 minutes) separation test from the remainder of the herd was carried out. Cattle’s responses to the challenge were assessed both physiologically and behaviourally. A significantly lower heart rate (p<0.01) during the separation period was observed when cattle were separated with their preferred partner compared to the non-preferred partner, and significantly lower levels of behaviour suggestive of agitation (p<0.05) were observed when they were with their preferred partner compared to when they were with the non-preferred partner. These results suggest that cattle were receiving social support from their preferred partners allowing them to have a reduced stress response to the social isolation test. As cattle aged and experienced regrouping, positive social bonds tended to disappear and cattle were more likely to have only weak associations. During long term separation (two weeks) from preferred partners, cattle showed significant behavioural, physiological and milk production changes. Upon subsequent reunion of preferred partners and consequential regrouping of individuals no further changes in behaviour, biology and milk production were observed, suggesting that separation rather than regrouping elicited a stress response. The bonds that had previously been evident between dyads were no longer present after the two weeks of separation. Subsequent relationships were also significantly weaker in focal cattle after separation of preferred partners and regrouping of animals.
ix
These results highlight the importance of relationships to the welfare of cattle and in particular the psychological well-being of cattle in commercial dairies. There is a significant need to reduce regrouping where possible and promote a more stable grouping system that enhances social bonds and positive social behaviour such as allogrooming; a behaviour which is currently rare in commercial systems. This will improve the quality of life for dairy cattle and increase their ability to cope with environmental challenge such as at times of regrouping and separation. In conclusion, social bonds do occur in domesticated dairy cattle and can be found when living in large dynamic group systems, but they are significantly affected by separation at the time of regrouping. These social bonds are important to the welfare and well-being of cattle; practices that promote stability and positive associations will be beneficial to the welfare of animals.
x
CONTENTS Page
Declaration ....................................................................................................................... iii
Acknowledgements .......................................................................................................... iv
Publications ...................................................................................................................... vi
Abstract .......................................................................................................................... viii
List of abbreviations.......................................................................................................xvi
List of tables ................................................................................................................. xviii
List of figures .................................................................................................................. xx
Chapter one. ............................................................................................................... 23
General Introduction ....................................................................................................... 23
1.1. Introduction ...................................................................................................... 24
1.2. Welfare concerns of intensive dairy farming systems ....................................25
1.3. Social behaviour of the domestic dairy cow .................................................... 28
1.3.1. Dominance hierarchy ................................................................................ 29
1.3.2. The influence of stocking density and space allowance on social behaviour and welfare ............................................................................................. 31
1.4. Impacts of regrouping in dynamic group systems on behaviour, productivity, and welfare ...................................................................................................................... 33
1.4.1. Regrouping ................................................................................................ 34
1.4.2. Effects of regrouping on behaviour .......................................................... 38
1.4.3. Effects of regrouping on productivity ....................................................... 38
1.4.4. Effects of regrouping on welfare .............................................................. 39
1.5. Living in large groups ...................................................................................... 40
1.5.1. Impacts on behaviour ................................................................................ 41
1.5.2. Impacts on health ...................................................................................... 42
1.6. Social behaviour in feral cattle ......................................................................... 43
1.6.1. Social bonds and group stability ............................................................... 44
1.6.1a. The mother-offspring bond......................................................................45
1.6.1b. Peer bonds...............................................................................................46
1.7. Measuring the social bond ............................................................................... 47
1.7.1. Maintenance of proximity and social grooming ....................................... 47
xi
1.7.2. Separation and isolation ............................................................................ 48
1.8. Social support ................................................................................................... 49
1.8.1. Measuring the effects of social support .................................................... 50
1.8.2. Social support and its application to industry ........................................... 52
1.9. Conclusions ...................................................................................................... 52
1.10. Aims and objectives ......................................................................................... 53
Ethical note ..................................................................................................................... 55
Chapter Two .......................................................................................................... 56
Social Bonds in Dairy Cattle Housed in a Large, Dynamic Group System. .................. 57
2.1 Introduction ...................................................................................................... 57
2.2 Method ............................................................................................................. 59
2.2.1 Housing area, animals and management ................................................... 59
2.2.1a. Observation 1a ....................................................................................61
2.2.1b. Observation 1b....................................................................................62
2.2.1c. Observation 1c.....................................................................................62
2.2.1d. Observation 1d....................................................................................62
2.2.2 Data collection .......................................................................................... 63
2.2.2a Individual social bond profiles.............................................................65
2.2.3 Statistical analysis ..................................................................................... 66
2.2.3a. Association indices..............................................................................67
2.2.3b. Inter-individual social associations within the herd............................67
2.2.3c. Individual social bond profiles............................................................68
2.2.4 Ethical considerations ............................................................................... 69
2.3 Results .............................................................................................................. 69
2.3.1 Inter-individual associations within the herd ............................................ 69
2.3.2 Individual social bond profiles ................................................................. 73
2.4 Discussion ........................................................................................................ 76
2.4.1 The existence of social bonds in dairy cattle ............................................ 76
2.4.2 The characteristics of social bonds in dairy cattle .................................... 79
2.4.2a Age.......................................................................................................79
2.4.2b. Proximity to nearest neighbour...........................................................81
2.4.3 Practical implications ................................................................................ 85
xii
2.5 Conclusion........................................................................................................ 86
Chapter Three....................................................................................................... 88
The Effects of Short Term Social Separation on the Behaviour, Production and Welfare of Dairy Cattle ................................................................................................................ 88
3.1 Introduction ...................................................................................................... 89
3.2 Materials and methods ..................................................................................... 92
3.2.1 Housing area, animals and management ................................................... 92
3.2.2 Experimental conditions and set-up .......................................................... 93
3.2.3 Measurements ........................................................................................... 95
3.2.3a Behavioural observations.....................................................................95
3.2.3b Runway test.........................................................................................96
3.2.3c Heart rates............................................................................................97
3.2.3d Cortisol.................................................................................................98
3.2.3e Production............................................................................................99
3.2.4 Statistical analyses .................................................................................. 100
3.2.4a. Behavioural observations..................................................................101
3.2.4b Runway test........................................................................................102
3.2.4c Heart rates..........................................................................................102
3.2.4d Cortisol...............................................................................................102
3.2.4e Production..........................................................................................103
3.2.5 Ethical note ............................................................................................. 103
3.3 Results ............................................................................................................ 104
3.3.1 Behavioural observations ........................................................................ 104
3.3.2 Runway test ............................................................................................. 108
3.3.3 Heart rates ............................................................................................... 109
3.3.4 Cortisol .................................................................................................... 114
3.3.5 Production ............................................................................................... 114
3.4 Discussion ...................................................................................................... 115
3.4.1 The effects of social separation on behaviour, physiology, and production .................................................................................................................115
3.4.1a Behaviour...........................................................................................116
3.4.1b Runway test........................................................................................117
3.4.1c Heart rates..........................................................................................119
xiii
3.4.1d Cortisol...............................................................................................120
3.4.1e Production..........................................................................................121
3.4.2 Social support ......................................................................................... 122
3.4.3 Individual differences ............................................................................. 124
3.5 Conclusions .................................................................................................... 126
Chapter Four ....................................................................................................... 128
The Effects of Long Term Separation from Preferred Groups Mates, and Subsequent Reunion, on Behaviour, Production and Health Parameters in Dairy Cattle ................ 128
4.1 Introduction .................................................................................................... 129
4.1.1 Long term separation and stress .............................................................. 129
4.1.2 The effects of reunion after separation ................................................... 131
4.2 Materials and methods ................................................................................... 133
4.2.1 Housing area, animals and management ................................................. 133
4.2.2 Experimental design and treatment ......................................................... 135
4.2.3 Measurements ......................................................................................... 139
4.2.3a Behaviour before, during and after separation...................................139
4.2.3b Production..........................................................................................142
4.2.3c Health parameters...............................................................................143
4.2.4 Statistical analysis ................................................................................... 144
4.2.4a Behaviour before, during and after separation...................................145
4.2.4b Production..........................................................................................146
4.2.4c Health parameters...............................................................................148
4.2.5 Ethical note ............................................................................................. 149
4.3 Results ............................................................................................................ 150
4.3.1 The effects of long term separation, and subsequent reunion, from preferred group mates on behaviour ...................................................................... 150
4.3.2 Effects of long term separation, and subsequent reunion, on production parameters in the main milking herd ..................................................................... 155
4.3.2a Yield...................................................................................................155
4.3.2b Quality...............................................................................................158
4.3.3 The effects of long term separation, and subsequent reunion, on health parameters in the younger cattle and on the main milking herd ............................ 159
4.3.3a Body condition score and weight.......................................................159
xiv
4.3.3b Somatic cell count..............................................................................161
4.3.3c Fertility...............................................................................................161
4.4 Discussion ...................................................................................................... 161
4.4.1 The effects of long term separation, and subsequent reunion, from preferred group mates and reunion on behaviour .................................................. 161
4.4.2 The effects of long term separation, and subsequent reunion, from preferred group mates and reunion on production ................................................ 166
4.4.3 The effects of long term separation, and subsequent reunion, from preferred group mates and reunion on health ........................................................ 168
4.4.4 Practical implications .............................................................................. 170
4.5 Conclusion...................................................................................................... 172
Chapter Five ........................................................................................................ 173
How Age Affects the Formation of Social Bonds, Behaviour, Production and Health Parameters at Regrouping ............................................................................................. 173
5.1 Introduction .................................................................................................... 174
5.2 Materials and methods ................................................................................... 176
5.2.1 Housing area, animals and management ................................................. 176
5.2.2 Measurements ......................................................................................... 177
5.2.3 Statistical analysis ................................................................................... 178
5.2.3a Bond formation..................................................................................178
5.2.3b Behaviour...........................................................................................179
5.2.3c Production..........................................................................................179
5.2.3d Health Parameters..............................................................................180
5.3 Results ............................................................................................................ 181
5.3.1 The influence of age on bond formation ................................................. 181
5.3.2 The influence of age on behaviour at regrouping. .................................. 185
5.3.3 The influence of age on production parameters at regrouping ............... 188
5.3.3a Yield...................................................................................................188
5.3.3b Quality and milk recorder data...........................................................189
5.3.4 The influence of age on health parameters at regrouping ....................... 193
5.3.4a Somatic cell count..............................................................................193
5.3.4b Fertility...............................................................................................193
5.4 Discussion ...................................................................................................... 194
xv
5.4.1 The effects of age on bond formation at regrouping .............................. 194
5.4.2 The effects of age on behaviour at regrouping ....................................... 197
5.4.3 The effects of age on production at regrouping ...................................... 199
5.4.4 The effects of age on health at regrouping ............................................. 202
5.4.5 Practical implications .............................................................................. 203
5.5 Conclusion...................................................................................................... 204
Chapter Six ........................................................................................................... 205
General Discussion ....................................................................................................... 205
6.1 Introduction .................................................................................................... 206
6.2 Social bonds in dairy cattle ............................................................................ 207
6.3 Social separation and reunion ........................................................................ 209
6.4 Welfare implications ...................................................................................... 211
6.5 Practical solutions .......................................................................................... 212
6.6 Future Research .............................................................................................. 214
6.7 Conclusions .................................................................................................... 216
References ..................................................................................................................... 217
Final word count: 42.035
xvi
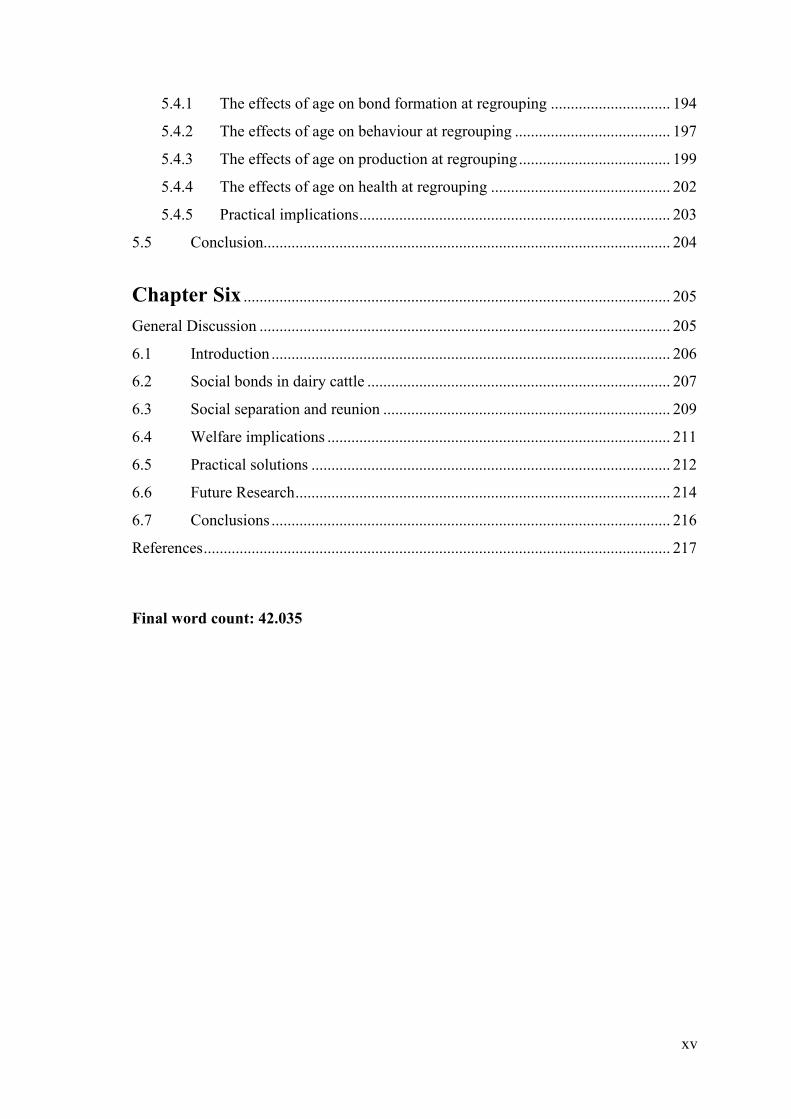
List of abbreviations ACTH Adrenocorticotrophic Hormone AI Artificial Insemination ANOVA Analysis of Variance BCS Body Condition Score BMSCC Bulk-Milk Somatic Cell Count bpm Beats Per Minute CAP Common Agricultural Policy CNS Central Nervous System CRH Corticotrophin Releasing Hormone d Days DEFRA Department for Environment, Food, and Rural Affairs DMI Dry Matter Intake EC Electrical Conductivity EFRAC Environment, Food and Rural Affairs Committee EFSA European Food Safety Authority ELISA Enzyme-Linked Immunosorbent Assay EU European Union FAWC Farm Animal Welfare Council GLM General Linear Model HPA Hypothalamus-Pituitary-Adrenal hr Hour HR Heart rate kg Kilogram LSD Least Significant Difference m Metres MC Moulton College Mins Minutes ml Millilitres mm Millimetres
xvii
mS milliSiemens ng Nanogram NMR National Milk Records NN Nearest Neighbour PP Preferred Partner PPL Pence per litre PR Focal with familiar but non-preferred individual R&R Regrouping and Relocation RP Partner with familiar random individual rpm Revolutions Per Minute SEM Standard Error Mean SCC Somatic Cell Count SD Standard Deviation secs Seconds TMR Total Mixed Ration UK United Kingdom
xviii
List of tables Table 1.1 Current dairy housing types found across the UK and their associated welfare issues.
27
Table 1.2 Review of the effects of regrouping and mixing farm and non-farm animals.
35
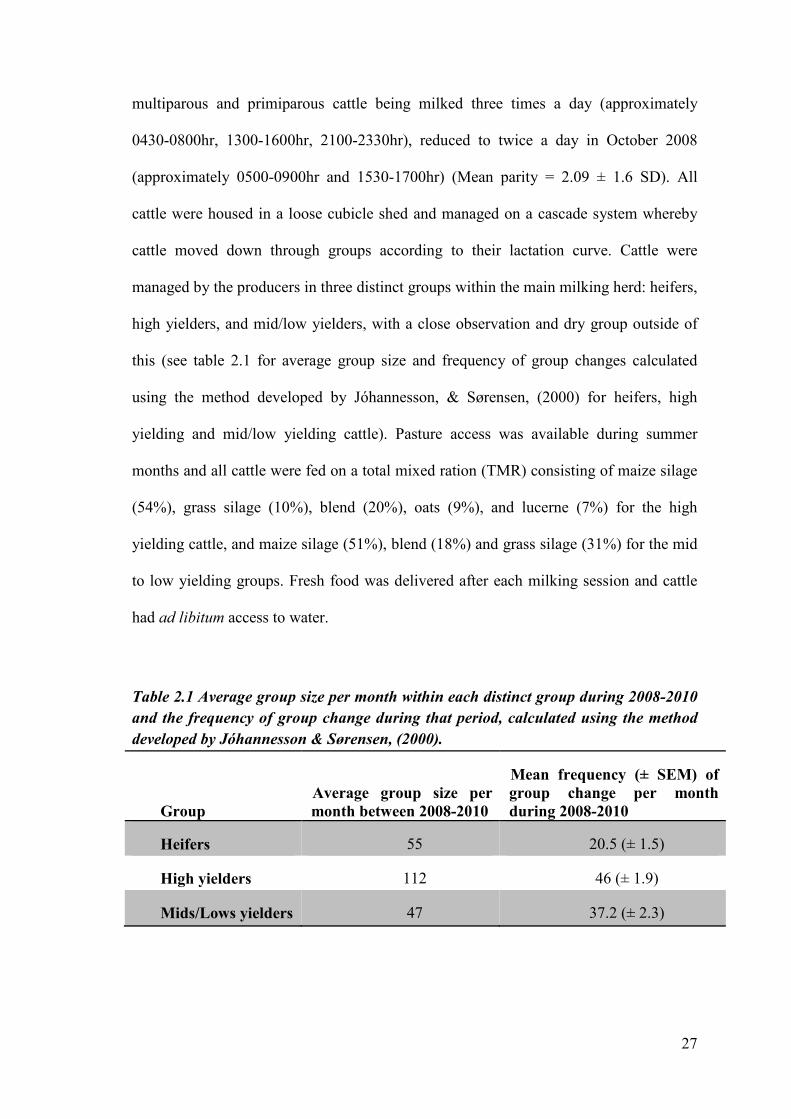
Table 2.1 Average group size per month within each distinct group during 2008-2010 and the frequency of group change during that period.
60
Table 2.2. The probability of seeing a focal cow with another individual on two, three, four or five occasions, for ten and fifteen scans.
68
Table 2.3. Data on the inter-individual associations within the her showing the
probability of seeing a focal individual with another individual by chance.
71
Table 3.1 Makeup of the eleven preferred partner pairings previously identified in study 1d.
93
Table 3.2 Behavioural ethogram for short term social separation when supported by either a preferred partner or a random familiar individual.
96
Table 3.3 Difference in mean frequency (± SEM) of behaviour during short term separation for focal, partner and random cattle across the three stages.
105
Table 3.4. The mean (± SEM) heart rates (bpm), maximum heart rate (bpm), latency to reach peak heart rate (seconds) and latency to reach 80 bpm (seconds), across the three stages for the focal, partner and random familiar individual, during the thirty minute separation period.
113
Table 4.1. Group details for focal animals on farm A.
134
Table 4.2. Behavioural ethogram for instantaneous focal sampling during long term separation from, and reunion of, preferred group mates.
140
Table 4.3. Mean (± SEM) proportion of time spent performing each of the behaviours, compared between the three time conditions using a repeated measures general linear model using focals as the random factor.
151
Table 4.4. The mean (±SEM) duration, and total frequency of, allogrooming events in different locations, and for different parts of the body.
153
xix
Table 4.5 The effects of long term separation and reunion on mean (± SEM) milk quality parameters.
159
Table 5.1. The age category for animals used within data analysis across farm A and farm B.
176
Table 5.2. The influence of age (youngster, 7-11 months: replacement heifers 12-23 months) on mean (± SEM) proportion of time spent performing behaviours upon regrouping of individuals and the significant difference between age groups.
186
Table 5.3. The number of preferred partners and the frequency of allogrooming performed and received, along with the mean (±SEM) duration of allogrooming bouts performed and received.
188
Table 5.4. Average (± SEM) %protein change across the stages of regrouping between different ages of cattle.
191
Table 5.5. Average (± SEM) %fat change across the stages of regrouping between different ages of cattle.
191
xx
List of figures
Figure 1.1 Factors influencing space allowance and stocking density, and the consequences of intensification on health and behaviour.
32
Figure 1.2 The negative correlation between mean body condition score and the number of cows in a group.
43
Figure 1.3 Factors that need to be considered when investigating social support.
51
Figure 2.1. Timeline of nearest neighbour observations for all four repeats (1a, 1b, 1c, 1d) showing duration (months) and the number of animals involved in each observation.
61
Figure 2.2. Illustration of the nearest neighbour data collection method
64
Figure 2.3. Diagram of cubicle housing showing area’s for data collection.
65
Figure 2.4 The distribution of the total number of occasions that focal heifers and cows were seen with a dyad between 2008 and 2010.
72
Figure 2.5. The total number of cows and heifers that had at least one preferred partner and the number of cows and heifers that had no preferred partners.
73
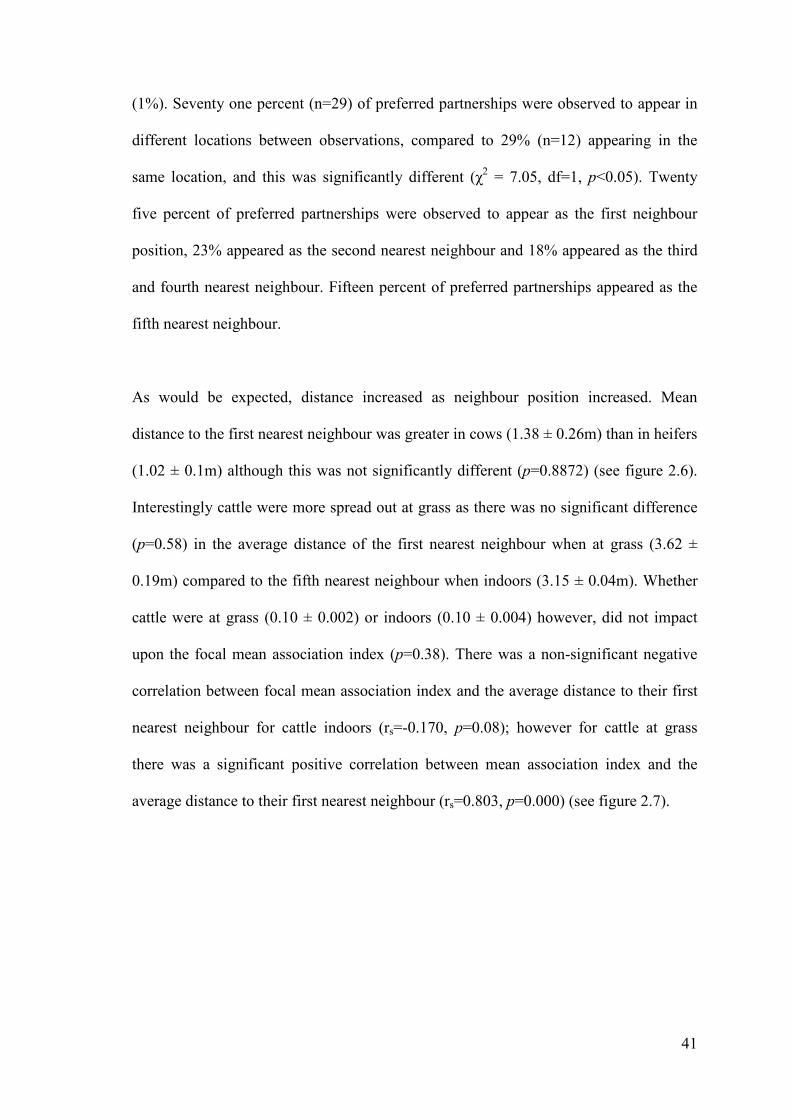
Figure 2.6. The distribution of the total frequency of observations of the mean distance (metres) to the first nearest neighbour for focal heifers and cows by cattle type.
75
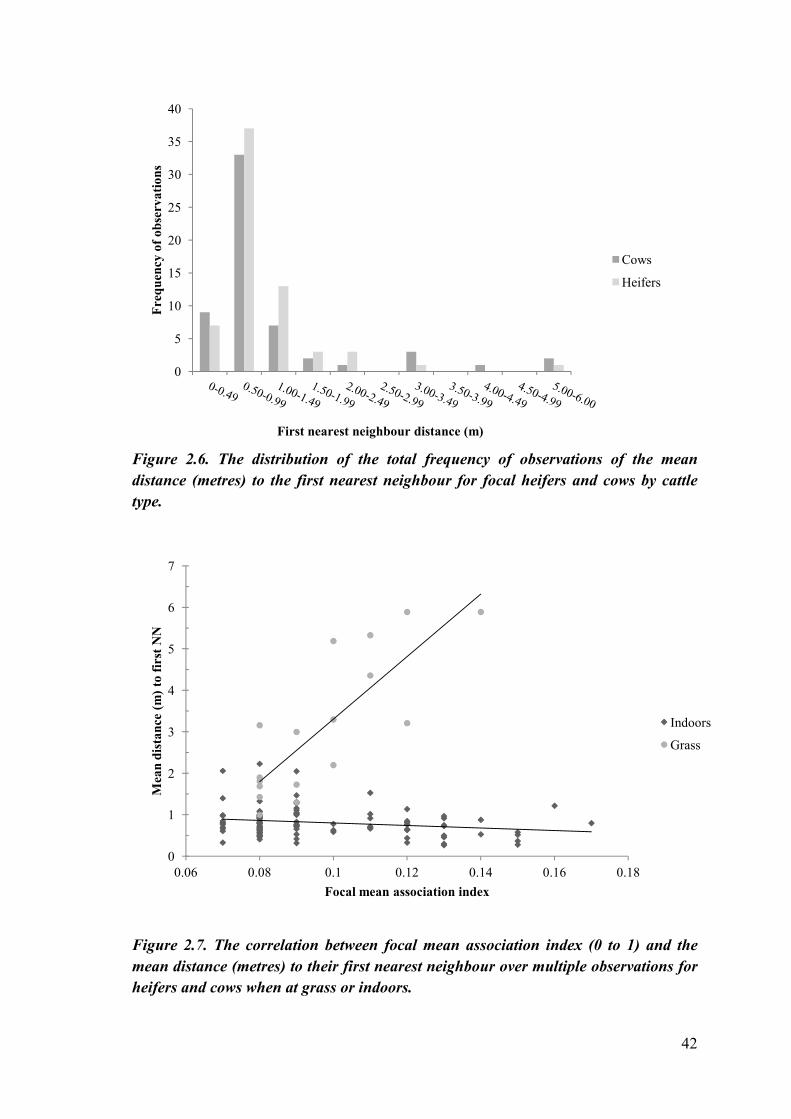
Figure 2.7. The correlation between focal mean association index (0 to 1) and the mean distance (metres) to their first nearest neighbour over multiple observations for heifers and cows when at grass or indoors.
75
Figure 3.1. Experimental layout of pen to study the effect of short term social separation when supported by either a preferred partner or a random familiar individual.
94
Figure 3.2 The mean (± SEM) frequency of vocalisations across the three stages for all cattle.
106
Figure 3.3 Mean (± SEM) number of observations dyads were less than one body length, between 1 and 2 body lengths and more than 2 body lengths apart across stages.
107
Figure 3.4 Mean (±SEM) frequencies for preferred placement in the observational pen when separated for all cattle observed.
108
xxi
Figure 3.5 Mean (±SEM) latency (seconds) to return to the herd during the runway test across the three stages for all cattle.
109
Figure 3.6 Mean heart rate (± SEM) (bpm) for focal heifers when socially isolated with their preferred partner and without their preferred partner but with a random individual.
110
Figure 3.7 Mean heart rate (± SEM) (bpm) of socially isolated focal heifers when with their preferred partner and their partners heart rate when isolated with a random individual.
111
Figure 3.8 Mean heart rate (± SEM) (bpm) of socially isolated focal heifers with a random individual and their partners heart rate when with a random individual.
111
Figure 4.1. Diagrammatic example of how groups were separated.
136
Figure 4.2. Example of how animals were chosen for inclusion in separation and reunion analysis.
138
Figure 4.3. The different areas of the body that were observed when collecting data on allogrooming behaviour.
141
Figure 4.4. Total frequency of positive and negative social behaviour in the three conditions.
152
Figure 4.5. The percentage of time cattle spent allogrooming the different areas of the body.
153
Figure 4.6. Total frequency of grooming bouts performed and received when focal cattle are with their preferred partner, when they are apart from their preferred partner long term, or when they have experiencing multiple regroupings.
154
Figure 4.7. Mean milk yield (per milking) before and after long term separation.
156
Figure 4.8. The effect of long term separation on mean (±SEM) milk yield (per milking) over an eight week period (four weeks before separation, and four weeks after separation).
157
Figure 4.9. Monthly mean (±SEM) milk yield per milking session for cattle when they are apart from their preferred partner, together with their preferred partner, going through multiple separations and reunions, compared to cattle that did not have any preferred partners.
158
xxii
Figure 4.10. Mean (±SEM) weight (kg) of individuals on farm A, before separation, when experiencing two weeks of separation and after separation upon reunion to partners.
160
Figure 5.1. The negative relationship between age (years) and the average association indices score (mean association indices score 0.15 ± 0.01; mean age 2.98 ± 0.11 year) for farm A (rearing stock) and farm B (main milking herd).
182
Figure 5.2. The negative relationship between age and the number of preferred partner’s (plus 1) cattle had.
183
Figure 5.3. Multiple comparisons between age category and the change in association score from the first observation to the second observation.
184
Figure 5.4. Relationship between age category and mean (± SEM) association indices score, before and after long term separation.
185
Figure 5.5. Total number of negative and positive behaviours performed when cattle were regrouped and thus reunited with preferred partners by age category.
186
Figure 5.6. Total number of allogrooming bouts performed and received by age of cattle.
187
Figure 5.7. The relationship between age (years) and the mean (± SEM) change in milk yield (litres) due to regrouping of cattle.
189
Figure 5.8. The relationship between age and mean (± SEM) milk production (kg) change when experiencing regrouping.
190
Figure 5.9. The relationship between age (years) and the average (± SEM) change in price paid per litre (Pence Per Litre; PPL) between the stages of regrouping.
192
Figure 5.10. The mean (±SEM) number of inseminations cattle received across the different ages (years) of cattle when experiencing regrouping.
194
23
Chapter Two
Social Bonds in Dairy Cattle Housed in a
Dynamic Group System.
24
2.1 Introduction
As outlined in the review (chapter 1), cattle (Bos species) are highly gregarious animals
which live in matriarchal units and have been observed to form long-lasting social
bonds with other individuals under feral conditions (Green et al., 1989; Kimura &
Ihobe, 1985; Lazo, 1994; Murphey, 1990; Reinhardt & Reinhardt, 1982; Reinhardt &
Reinhardt, 1981). It is these positive social relationships that form the very basis of the
structure and organisation of a herd, ensuring social cohesion and stability (Lazo, 1994;
Mitani, 2009; VanDierendonck et al., 2009; Wittemyer et al., 2005). The social
behaviours within these groups are primarily of a positive nature, with limited
aggression and individuals maintaining close spatial proximity (Bouissou & Andrieu,
1978).
The existence of such social bonds in domestic dairy cattle housed in large dynamic
groups under intensive commercial conditions has not yet been reported, despite them
being noted in domestic cattle maintained in smaller, more stable groupings (Duve &
Jensen, 2011; Val-Laillet et al., 2009). Val-Laillet et al. (2009) observed individual
cattle, within small groups of eight under commercial conditions, to choose a particular
individual to feed next to independent of the position at the feed bunk. This suggested
that the closeness in proximity between dyads was due to the existence of a social bond
rather than a chance encounter. In addition, cattle reared together from an early age with
full social contact appeared to form stronger associations compared to their conspecifics
who had been grouped later on in life (Bouissou & Andrieu, 1978; Duve & Jensen,
2011; Raussi et al., 2010). Even after mixing with unfamiliar individuals, a process very
similar to that of regrouping in commercial dynamic herds, bonds formed between cattle
25
reared together since birth were still present, whilst cattle that had been grouped later on
did not remain associated with one another (Bouissou & Andrieu, 1978).
The EFSA (2009) report indicates that taking note of any social bonds that can form
between cattle is important in ensuring their welfare. Social bonds can influence how an
animal responds to its environment and so can impact on the individual’s coping ability.
Animal welfare considers both the physical and psychological health of an individual,
particularly in relation to the animal’s ability to cope with its environment (Broom,
1991). It is therefore not surprising that in the absence of positive relationships, health
problems often occur in both humans (Birmingham et al., 2009) and non-human
animals (Waiblinger et al., 2006). In order to maintain positive social relationships and
bonds cattle must be able to recognise each other and form a memory of previous social
encounters (Fraser & Broom, 1997). The changes in grouping under domestic
commercial conditions (including the increase in group size) make this memory
formation and thus potential bond formation more difficult to achieve. Consequently the
potential for bonds within dairy cattle that live in intensive large dynamic groups
requires investigation.
Spatial distribution and maintenance of proximity between pairs of individuals has been
a widely used technique for assessing the social relationships between individuals
(Aschwanden et al., 2008; Bejder et al., 1998; Durrell et al., 2004; Huber et al., 2008;
Sibbald et al., 2005). In cattle, the consistent choice of a particular individual to be in
close proximity to, has been observed to be independent of the position at the feeder
(Val-Laillet et al., 2009). Furthermore, when at grass cattle tend to choose a familiar
individual as their nearest neighbour rather than an unfamiliar herd member (Patison et
26
al., 2010; Takeda et al., 2000). It can be considered from these results that the spatial
proximity that cattle maintain between themselves is affected by their relationship and
so proximity can be a reliable indicator of the existence of a social bond. As such, the
information on nearest neighbour proximity and group membership has been used to
develop association indices, giving an estimation of how much time two individuals
may be seen together (Cairns & Schwager, 1987; White & Smith, 2007; Whitehead,
2008). This time spent together is then interpreted as an indication of the relationship
strength between dyads (Lusseau et al., 2008).
The aim of this stage of the study was to ascertain whether social bonds existed in dairy
cattle when they were housed in a large dynamic group. The objective was to
investigate cattle social preferences through nearest neighbour observations that could
be practically and easily recorded on commercial farms by producers. Using these
observations, association index values for each pairing observed could be used to
determine whether the number of individuals showing a higher than average association
index occurred more frequently than would be expected by chance. The influence of age
(heifers versus cows) on social bonds and the general sociability of individuals were
also investigated through proximity recordings and association indices.
2.2 Method
2.2.1 Housing area, animals and management
The main milking dairy herd at Stud Farm Moulton College, Northampton was
observed to ascertain social preferences between July 2008 and February 2010. The
herd consisted of 334 Holstein-Friesian cattle plus followers, with on average 229
27
multiparous and primiparous cattle being milked three times a day (approximately
0430-0800hr, 1300-1600hr, 2100-2330hr), reduced to twice a day in October 2008
(approximately 0500-0900hr and 1530-1700hr) (Mean parity = 2.09 ± 1.6 SD). All
cattle were housed in a loose cubicle shed and managed on a cascade system whereby
cattle moved down through groups according to their lactation curve. Cattle were
managed by the producers in three distinct groups within the main milking herd: heifers,
high yielders, and mid/low yielders, with a close observation and dry group outside of
this (see table 2.1 for average group size and frequency of group changes calculated
using the method developed by Jóhannesson, & Sørensen, (2000) for heifers, high
yielding and mid/low yielding cattle). Pasture access was available during summer
months and all cattle were fed on a total mixed ration (TMR) consisting of maize silage
(54%), grass silage (10%), blend (20%), oats (9%), and lucerne (7%) for the high
yielding cattle, and maize silage (51%), blend (18%) and grass silage (31%) for the mid
to low yielding groups. Fresh food was delivered after each milking session and cattle
had ad libitum access to water.
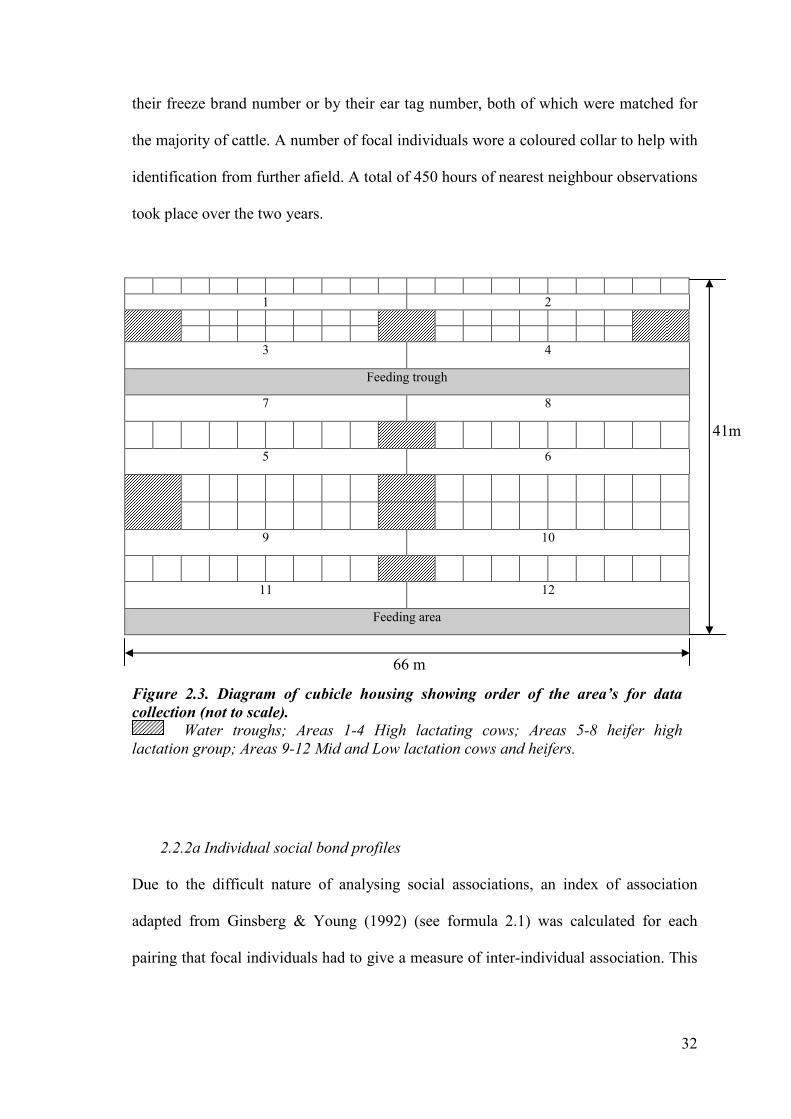
Table 2.1 Average group size per month within each distinct group during 2008-2010
and the frequency of group change during that period, calculated using the method
developed by Jóhannesson & Sørensen, (2000).
Group
Average group size per
month between 2008-2010
Mean frequency (± SEM) of
group change per month
during 2008-2010
Heifers 55 20.5 (± 1.5)
High yielders 112 46 (± 1.9)
Mids/Lows yielders 47 37.2 (± 2.3)
28
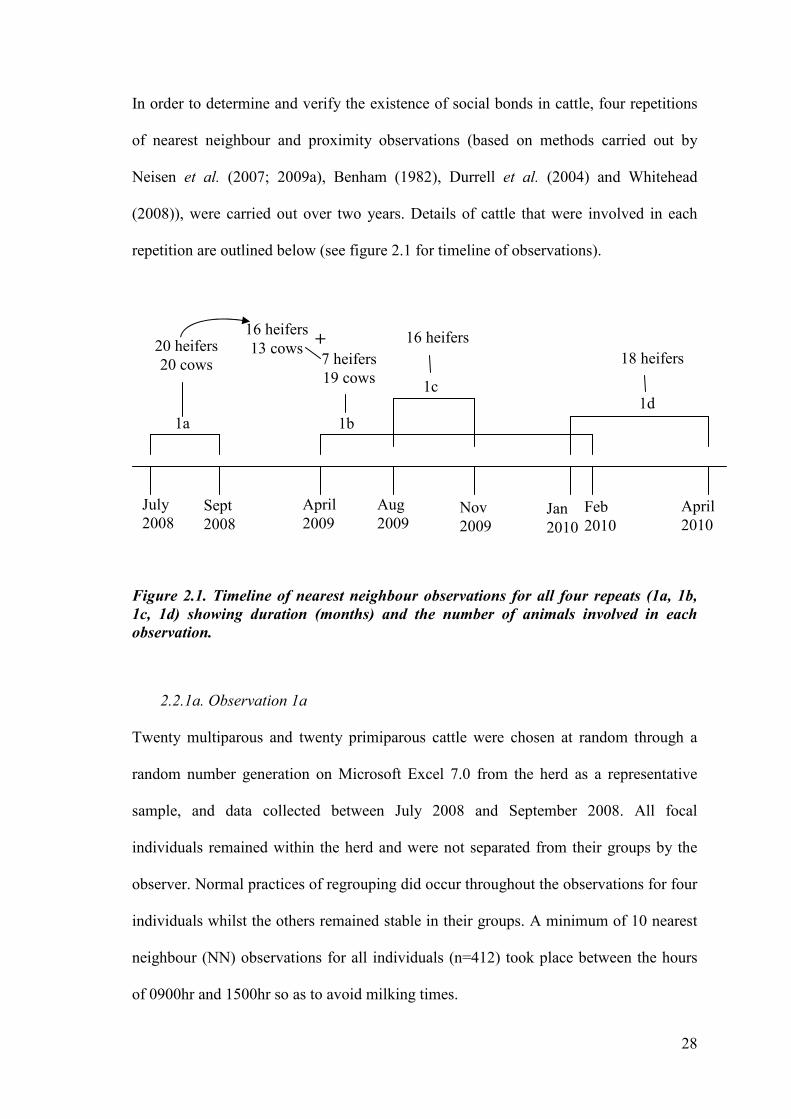
In order to determine and verify the existence of social bonds in cattle, four repetitions
of nearest neighbour and proximity observations (based on methods carried out by
Neisen et al. (2007; 2009a), Benham (1982), Durrell et al. (2004) and Whitehead
(2008)), were carried out over two years. Details of cattle that were involved in each
repetition are outlined below (see figure 2.1 for timeline of observations).
Figure 2.1. Timeline of nearest neighbour observations for all four repeats (1a, 1b,
1c, 1d) showing duration (months) and the number of animals involved in each
observation.
2.2.1a. Observation 1a
Twenty multiparous and twenty primiparous cattle were chosen at random through a
random number generation on Microsoft Excel 7.0 from the herd as a representative
sample, and data collected between July 2008 and September 2008. All focal
individuals remained within the herd and were not separated from their groups by the
observer. Normal practices of regrouping did occur throughout the observations for four
individuals whilst the others remained stable in their groups. A minimum of 10 nearest
neighbour (NN) observations for all individuals (n=412) took place between the hours
of 0900hr and 1500hr so as to avoid milking times.
April 2010
Sept 2008
April 2009
Aug 2009
Nov 2009
Jan 2010
1a 1b
1c 1d
20 heifers 20 cows 18 heifers
16 heifers 7 heifers 19 cows
16 heifers 13 cows +
July 2008
Feb 2010
29
2.2.1b. Observation 1b
Observation 1b took place between April 2009 and February 2010 and was an extension
of 1a and included thirteen multiparous and sixteen primiparous cows from 1a and
twenty-six new individuals (nineteen multiparous and seven primiparous) that had been
identified as potential partners to focals in 1a. As in observation 1a all cattle remained
within the herd and were not separated from the group unless it was part of the normal
regrouping practice required by the farm. A minimum of fifteen nearest neighbour
observations for each individual (n=781) took place between the hours of 0900hr and
1500hr avoiding milking times. The number of observations increased due to a change
in methods (see section 2.2.2.). Five animals died during observations and therefore
results for nearest neighbour observations for these individuals were removed from the
analysis.
2.2.1c. Observation 1c
Observation 1c took place between August 2009 and November 2009 and included
sixteen primiparous cattle; a new group brought in from rearing stock. A minimum of
fifteen nearest neighbour observations for each individual took place between 0900hr
and 1500hr avoiding milking times (n=243). All individuals remained within the herd
unless required to be regrouped for management practices. Observation 1c took place in
order to identify individuals that could be used in the short term separation test (chapter
3).
2.2.1d. Observation 1d
Observation 1d occurred before the short term separation test (chapter 3) could take
place due to animal separation by the producer. Between January 2010 and April 2010
30
eighteen primiparous cattle (a new group brought in from rearing stock) were observed.
Fifteen nearest neighbour observations for each individual took place between 0900hr
and 1500hr avoiding milking times (n=256). All animals remained within the herd and
remained stable throughout the observation period (no regrouping took place as part of
normal management for these individuals).
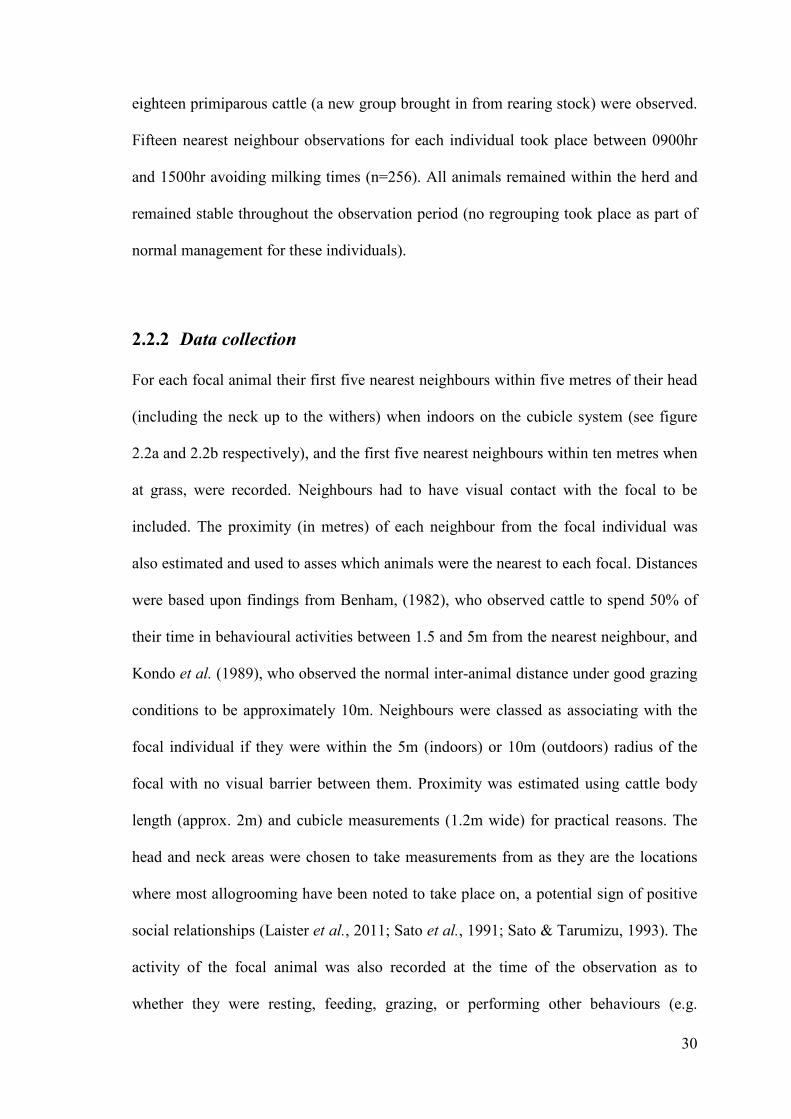
2.2.2 Data collection
For each focal animal their first five nearest neighbours within five metres of their head
(including the neck up to the withers) when indoors on the cubicle system (see figure
2.2a and 2.2b respectively), and the first five nearest neighbours within ten metres when
at grass, were recorded. Neighbours had to have visual contact with the focal to be
included. The proximity (in metres) of each neighbour from the focal individual was
also estimated and used to asses which animals were the nearest to each focal. Distances
were based upon findings from Benham, (1982), who observed cattle to spend 50% of
their time in behavioural activities between 1.5 and 5m from the nearest neighbour, and
Kondo et al. (1989), who observed the normal inter-animal distance under good grazing
conditions to be approximately 10m. Neighbours were classed as associating with the
focal individual if they were within the 5m (indoors) or 10m (outdoors) radius of the
focal with no visual barrier between them. Proximity was estimated using cattle body
length (approx. 2m) and cubicle measurements (1.2m wide) for practical reasons. The
head and neck areas were chosen to take measurements from as they are the locations
where most allogrooming have been noted to take place on, a potential sign of positive
social relationships (Laister et al., 2011; Sato et al., 1991; Sato & Tarumizu, 1993). The
activity of the focal animal was also recorded at the time of the observation as to
whether they were resting, feeding, grazing, or performing other behaviours (e.g.
31
walking or drinking) along with their location (cubicles, feed face, alley ways, grazing)
and current grouping (heifer, high, mid/lows, dry).
Figure 2.2. Illustration of the nearest neighbour data collection method. (a) The first
five nearest neighbours (patterned) from the focal animal (filled) were noted at five
metres when indoors (N.B. not to scale), and at ten metres when outdoors. (b)
Measurements were taken from the head, to include the neck and withers (inside the
dotted line).
Focal animals were sampled two and a half days a week for five hours a day at a
minimum of hourly intervals for observation 1a, and half hourly intervals for
observations 1b, 1c, and 1d (based on intervals established by Neisen et al. (2009a)). It
was likely that for each focal they would be sampled only once per day during the
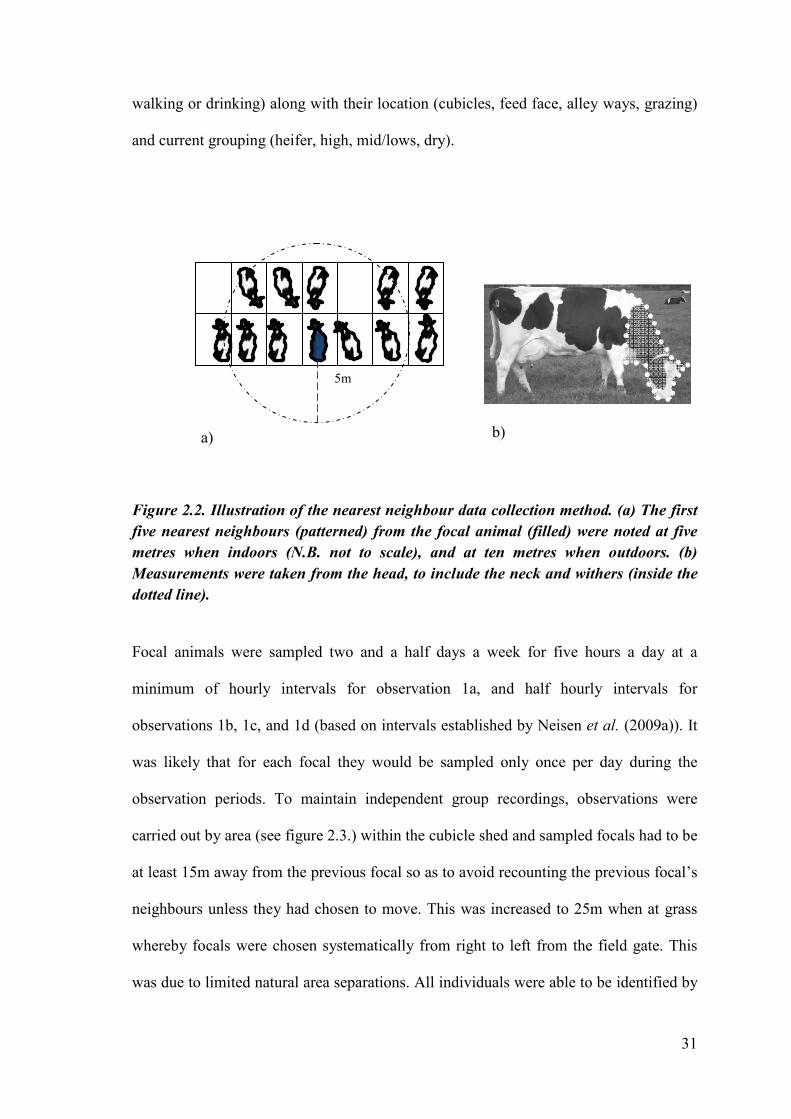
observation periods. To maintain independent group recordings, observations were
carried out by area (see figure 2.3.) within the cubicle shed and sampled focals had to be
at least 15m away from the previous focal so as to avoid recounting the previous focal’s
neighbours unless they had chosen to move. This was increased to 25m when at grass
whereby focals were chosen systematically from right to left from the field gate. This
was due to limited natural area separations. All individuals were able to be identified by
5m
a) b)
32
their freeze brand number or by their ear tag number, both of which were matched for
the majority of cattle. A number of focal individuals wore a coloured collar to help with
identification from further afield. A total of 450 hours of nearest neighbour observations
took place over the two years.
1 2
3 4
Feeding trough
7 8
5 6
9 10
11 12
Feeding area
Figure 2.3. Diagram of cubicle housing showing order of the area’s for data
collection (not to scale).
Water troughs; Areas 1-4 High lactating cows; Areas 5-8 heifer high
lactation group; Areas 9-12 Mid and Low lactation cows and heifers.
2.2.2a Individual social bond profiles
Due to the difficult nature of analysing social associations, an index of association
adapted from Ginsberg & Young (1992) (see formula 2.1) was calculated for each
pairing that focal individuals had to give a measure of inter-individual association. This
41m
66 m
33
index would give a value demonstrating the tendency to be found together and thus be
used as an indicator of the potential strength of the relationship.
Formula 2.1
Index of association = �
��
where x is the number of times during which A and B are observed together and NA is
the total number of observations of A.
This coefficient was favoured as it provides information regarding the tendency of the
focal animal A to be found in proximity to each of its partners, and due to the large data
set collected this was the most efficient way of calculating a preferred partner for each
focal animal. The resulting index ranges from 0 to 1, with values of 1 indicating a pair
to always be observed together, and values of zero to indicate a pair to never be
observed together. Resulting indices were utilised for further analysis as described
below.
2.2.3 Statistical analysis
All statistical analysis was carried out using Minitab version 13.20 and data presented
as means ± SEM unless where otherwise stated. For all statistical analyses a
significance level of p<0.05 was accepted. Any data which was not normally distributed
was log transformed using log10 to normalise where required. Where this log
transformation did not normalise data, non-parametric statistics were used. Details of
particular methods and tests employed are outlined below.
34
2.2.3a. Association indices
The mean association index for each focal was calculated as outlined in section 2.2.2.
As in Durrell et al. (2004), pairings that had a high association value (approximately
two and half times or more the mean association index) were classed as preferred
partners. This equated to three or more occasions where cattle were observed together
out of 10 observations, and four or more occasions where cattle were observed together
out of 15 observations. These parameters were then used to investigate on a herd basis
the significance of these association values.
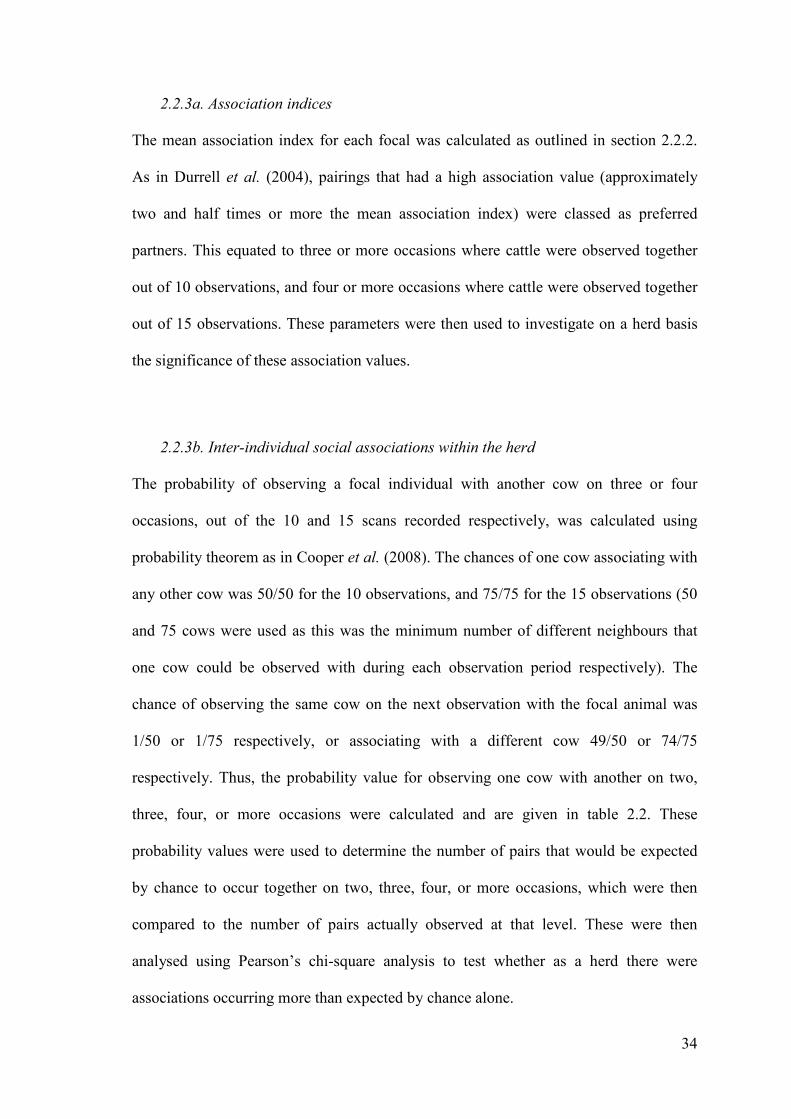
2.2.3b. Inter-individual social associations within the herd
The probability of observing a focal individual with another cow on three or four
occasions, out of the 10 and 15 scans recorded respectively, was calculated using
probability theorem as in Cooper et al. (2008). The chances of one cow associating with
any other cow was 50/50 for the 10 observations, and 75/75 for the 15 observations (50
and 75 cows were used as this was the minimum number of different neighbours that
one cow could be observed with during each observation period respectively). The
chance of observing the same cow on the next observation with the focal animal was
1/50 or 1/75 respectively, or associating with a different cow 49/50 or 74/75
respectively. Thus, the probability value for observing one cow with another on two,
three, four, or more occasions were calculated and are given in table 2.2. These
probability values were used to determine the number of pairs that would be expected
by chance to occur together on two, three, four, or more occasions, which were then
compared to the number of pairs actually observed at that level. These were then
analysed using Pearson’s chi-square analysis to test whether as a herd there were
associations occurring more than expected by chance alone.
35
2.2.3c. Individual social bond profiles
Statistical analysis of nearest neighbour data is problematic and so the association
indices were utilised to investigate individual social bond profiles further. A Pearson’s
chi-squared test was carried out to examine the difference in the total number of focal
heifers and the total number of focal cows that had at least one preferred partner, as this
allowed for the assessment of the influence of age on social bond profiles. An
independent two-sample t-test was used to analyse the difference between the total
number of partners that heifers had compared to cows. To determine if associations
were simply the result of sharing the same location within the cubicle shed a Pearson’s
chi-squared analysis was carried out on the number of pairings that were observed in the
same area, compared to those occurring in different areas of the shed.
The spatial relations of associations were investigated by comparing the distance
maintained to the first nearest neighbour when at grass compared to when in cubicles
using a Mann-Whitney U test as data was not normally distributed and log
transformation did not normalise the data. The difference between the average distance
to the first nearest neighbour for heifers and cows was also analysed using a Mann-
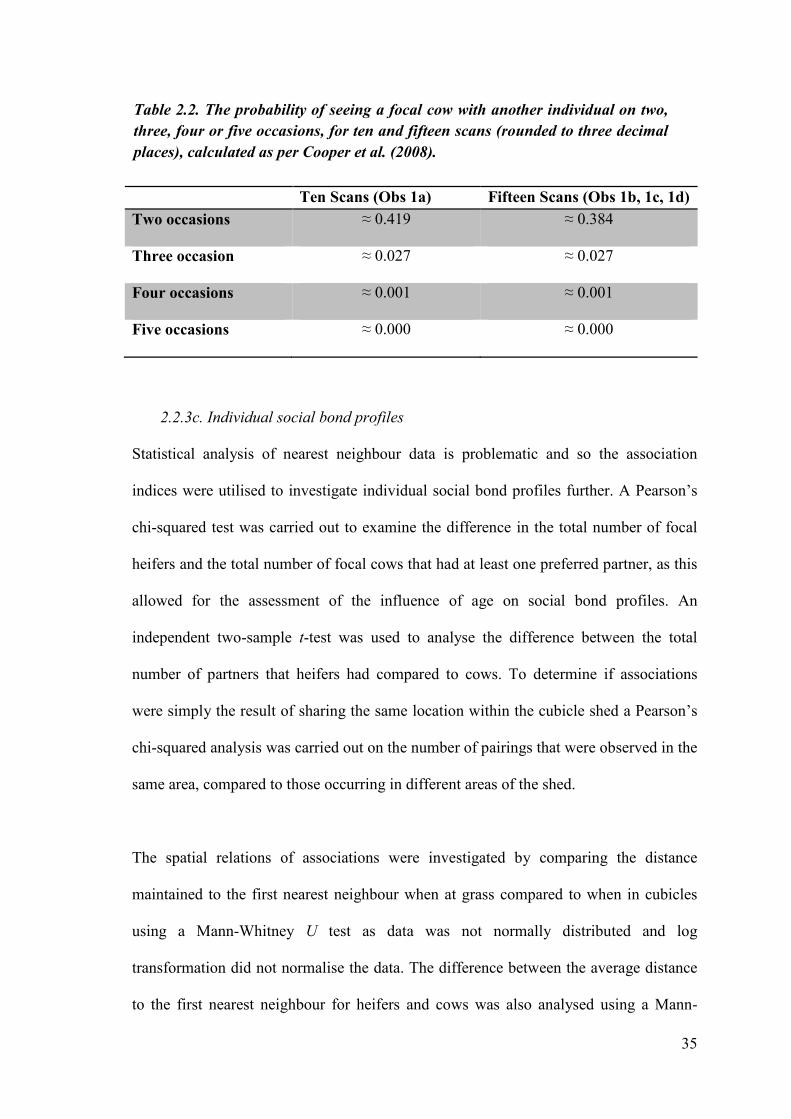
Ten Scans (Obs 1a) Fifteen Scans (Obs 1b, 1c, 1d)
Two occasions ≈ 0.419 ≈ 0.384
Three occasion ≈ 0.027 ≈ 0.027
Four occasions ≈ 0.001 ≈ 0.001
Five occasions ≈ 0.000 ≈ 0.000
Table 2.2. The probability of seeing a focal cow with another individual on two,
three, four or five occasions, for ten and fifteen scans (rounded to three decimal
places), calculated as per Cooper et al. (2008).
36
Whitney U test due to unequal variances between the data sets, to investigate the
differences in sociality due to age. A Spearman’s correlation analysis was carried out to
investigate the relationship between the focals mean association indices and the average
distance that they maintained to their first nearest neighbour over the observation
period.
2.2.4 Ethical considerations
The study was carried out on a commercial farm at Moulton College and involved the
walking through cubicle sheds and in fields. Cattle were accustomed to the presence of
humans as the farm was also a teaching farm and so students would often be walking
through the sheds and fields as part of their training. Cattle were habituated to the
presence of the researcher and the route taken for data collection within the sheds for
one week before data collection started. Every caution was taken so as not to disturb
cattle when walking through the sheds or fields and if any animal showed any signs of
distress caused by the researcher’s presence, the researcher would move away from the
animal to a distance that allowed it to return to its activity and remove the signs of
distress. Cattle that wore collars were checked twice daily by farm staff during milking
and all collars were specially designed for use in cattle and fitted so that the collar was
quick release if it were to get caught anywhere adhering to farm welfare standards.
2.3 Results
2.3.1 Inter-individual associations within the herd
With ten to fifteen observations per animal, a total of 1692 nearest neighbour
observations were made with 5724 different pairings identified. The mean number of
37
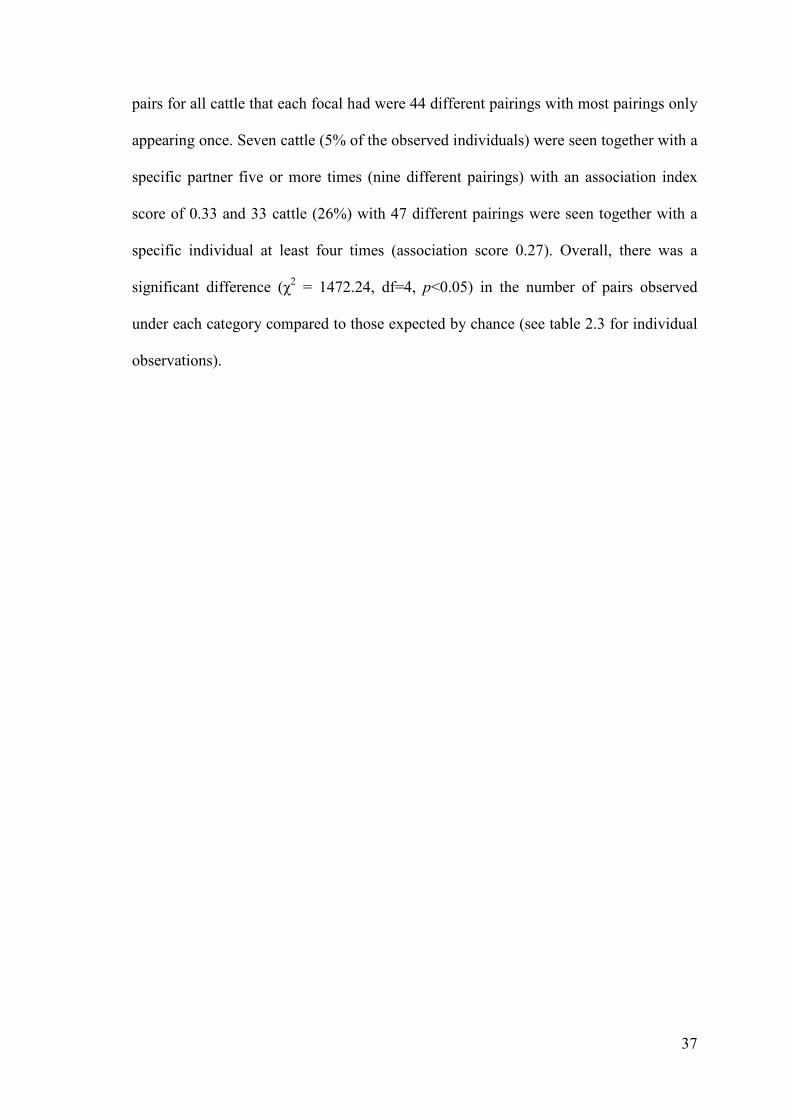
pairs for all cattle that each focal had were 44 different pairings with most pairings only
appearing once. Seven cattle (5% of the observed individuals) were seen together with a
specific partner five or more times (nine different pairings) with an association index
score of 0.33 and 33 cattle (26%) with 47 different pairings were seen together with a
specific individual at least four times (association score 0.27). Overall, there was a
significant difference (χ2 = 1472.24, df=4, p<0.05) in the number of pairs observed
under each category compared to those expected by chance (see table 2.3 for individual
observations).
38
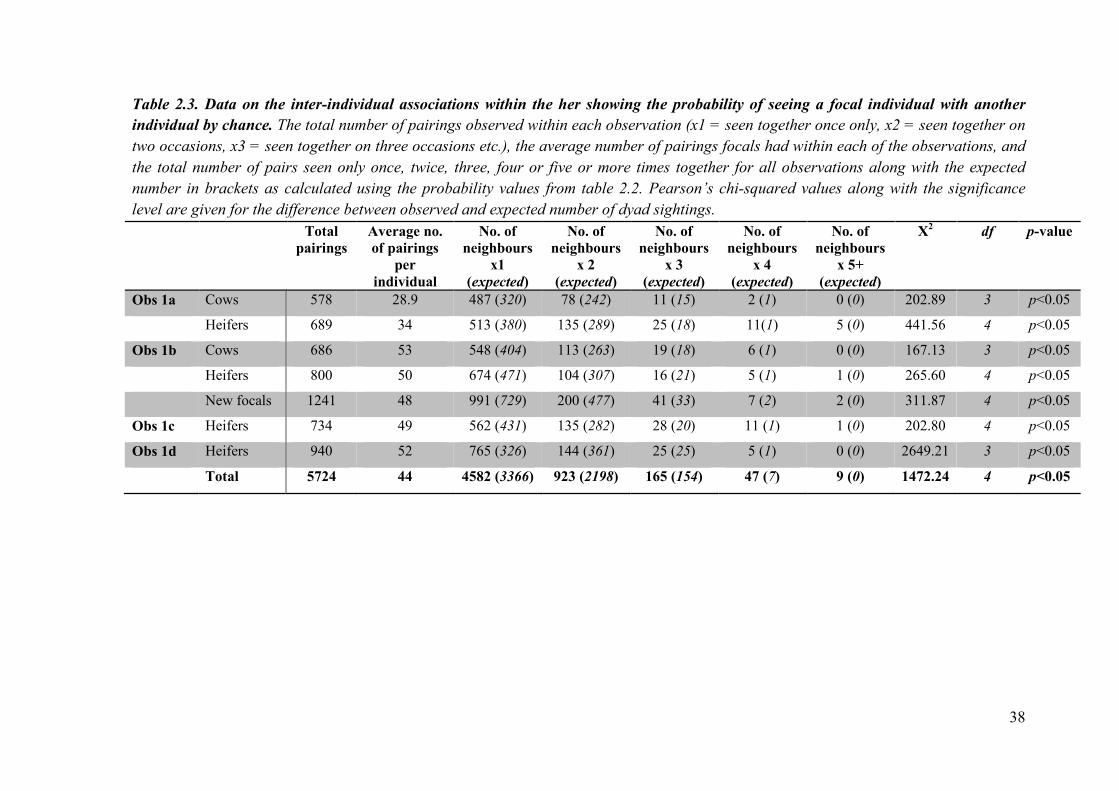
Table 2.3. Data on the inter-individual associations within the her showing the probability of seeing a focal individual with another
individual by chance. The total number of pairings observed within each observation (x1 = seen together once only, x2 = seen together on
two occasions, x3 = seen together on three occasions etc.), the average number of pairings focals had within each of the observations, and
the total number of pairs seen only once, twice, three, four or five or more times together for all observations along with the expected
number in brackets as calculated using the probability values from table 2.2. Pearson’s chi-squared values along with the significance
level are given for the difference between observed and expected number of dyad sightings.
Total
pairings
Average no.
of pairings
per
individual
No. of
neighbours
x1
(expected)
No. of
neighbours
x 2
(expected)
No. of
neighbours
x 3
(expected)
No. of
neighbours
x 4
(expected)
No. of
neighbours
x 5+
(expected)
Χ2 df p-value
Obs 1a Cows 578 28.9 487 (320) 78 (242) 11 (15) 2 (1) 0 (0) 202.89 3 p<0.05
Heifers 689 34 513 (380) 135 (289) 25 (18) 11(1) 5 (0) 441.56 4 p<0.05
Obs 1b Cows 686 53 548 (404) 113 (263) 19 (18) 6 (1) 0 (0) 167.13 3 p<0.05
Heifers 800 50 674 (471) 104 (307) 16 (21) 5 (1) 1 (0) 265.60 4 p<0.05
New focals 1241 48 991 (729) 200 (477) 41 (33) 7 (2) 2 (0) 311.87 4 p<0.05
Obs 1c Heifers 734 49 562 (431) 135 (282) 28 (20) 11 (1) 1 (0) 202.80 4 p<0.05
Obs 1d Heifers 940 52 765 (326) 144 (361) 25 (25) 5 (1) 0 (0) 2649.21 3 p<0.05
Total 5724 44 4582 (3366) 923 (2198) 165 (154) 47 (7) 9 (0) 1472.24 4 p<0.05
39
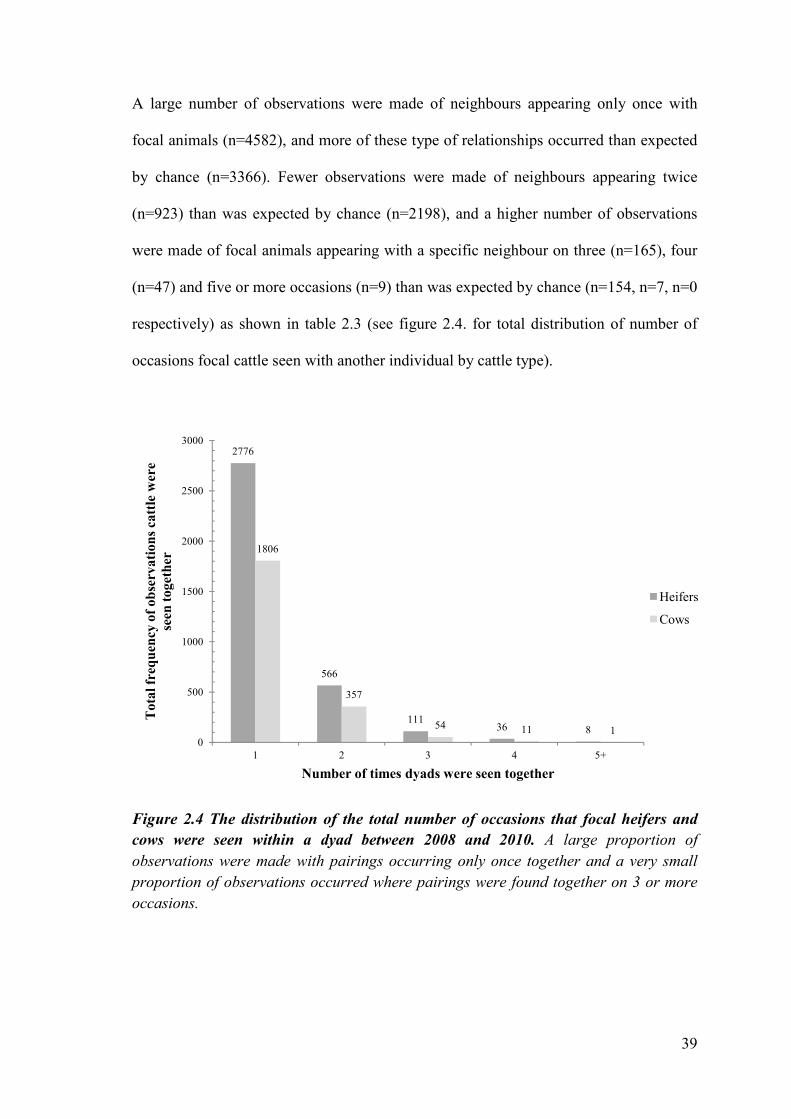
A large number of observations were made of neighbours appearing only once with
focal animals (n=4582), and more of these type of relationships occurred than expected
by chance (n=3366). Fewer observations were made of neighbours appearing twice
(n=923) than was expected by chance (n=2198), and a higher number of observations
were made of focal animals appearing with a specific neighbour on three (n=165), four
(n=47) and five or more occasions (n=9) than was expected by chance (n=154, n=7, n=0
respectively) as shown in table 2.3 (see figure 2.4. for total distribution of number of
occasions focal cattle seen with another individual by cattle type).
Figure 2.4 The distribution of the total number of occasions that focal heifers and
cows were seen within a dyad between 2008 and 2010. A large proportion of
observations were made with pairings occurring only once together and a very small
proportion of observations occurred where pairings were found together on 3 or more
occasions.
2776
566
11136 8
1806
357
54 11 10
500
1000
1500
2000
2500
3000
1 2 3 4 5+
Tota
l fr
equ
ency
of
ob
serv
ati
on
s ca
ttle
wer
e
seen
toget
her
Number of times dyads were seen together
Heifers
Cows
40
2.3.2 Individual social bond profiles
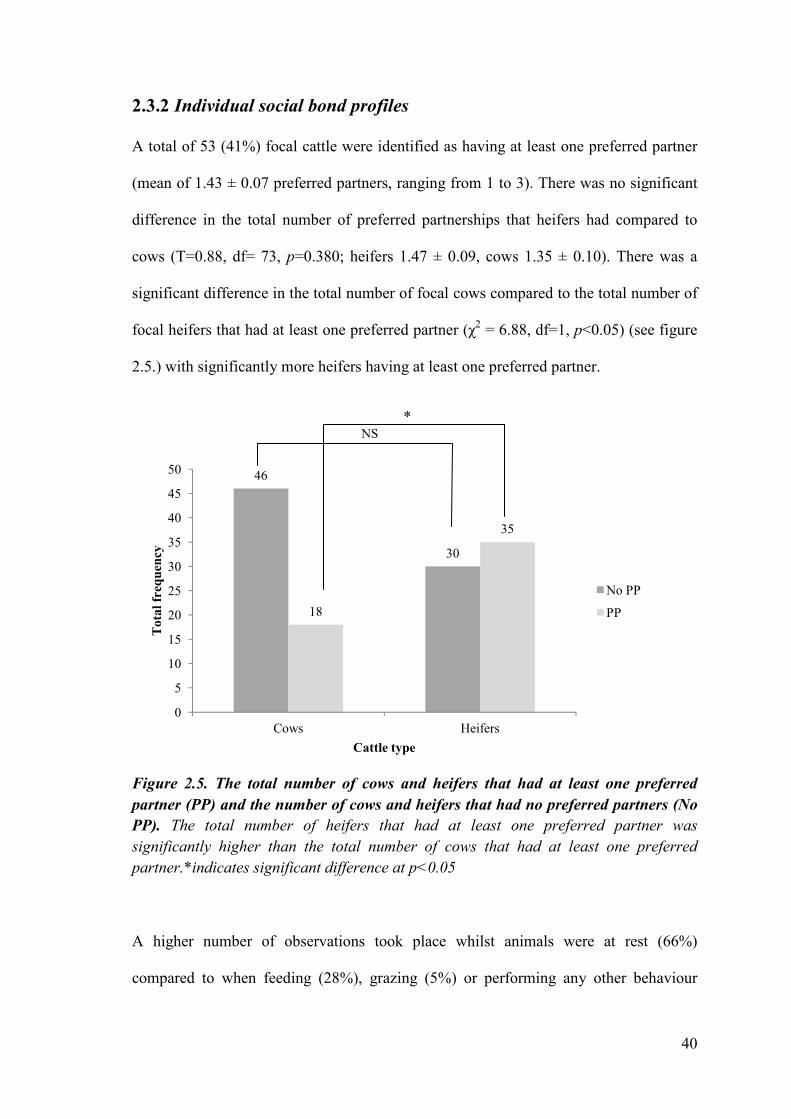
A total of 53 (41%) focal cattle were identified as having at least one preferred partner
(mean of 1.43 ± 0.07 preferred partners, ranging from 1 to 3). There was no significant
difference in the total number of preferred partnerships that heifers had compared to
cows (T=0.88, df= 73, p=0.380; heifers 1.47 ± 0.09, cows 1.35 ± 0.10). There was a
significant difference in the total number of focal cows compared to the total number of
focal heifers that had at least one preferred partner (χ2 = 6.88, df=1, p<0.05) (see figure
2.5.) with significantly more heifers having at least one preferred partner.
Figure 2.5. The total number of cows and heifers that had at least one preferred
partner (PP) and the number of cows and heifers that had no preferred partners (No
PP). The total number of heifers that had at least one preferred partner was
significantly higher than the total number of cows that had at least one preferred
partner.*indicates significant difference at p<0.05
A higher number of observations took place whilst animals were at rest (66%)
compared to when feeding (28%), grazing (5%) or performing any other behaviour
46
30
18
35
0
5
10
15
20
25
30
35
40
45
50
Cows Heifers
To
tal
freq
uen
cy
Cattle type
No PP
PP
NS *
41
(1%). Seventy one percent (n=29) of preferred partnerships were observed to appear in
different locations between observations, compared to 29% (n=12) appearing in the
same location, and this was significantly different (χ2 = 7.05, df=1, p<0.05). Twenty
five percent of preferred partnerships were observed to appear as the first neighbour
position, 23% appeared as the second nearest neighbour and 18% appeared as the third
and fourth nearest neighbour. Fifteen percent of preferred partnerships appeared as the
fifth nearest neighbour.
As would be expected, distance increased as neighbour position increased. Mean
distance to the first nearest neighbour was greater in cows (1.38 ± 0.26m) than in heifers
(1.02 ± 0.1m) although this was not significantly different (p=0.8872) (see figure 2.6).
Interestingly cattle were more spread out at grass as there was no significant difference
(p=0.58) in the average distance of the first nearest neighbour when at grass (3.62 ±
0.19m) compared to the fifth nearest neighbour when indoors (3.15 ± 0.04m). Whether
cattle were at grass (0.10 ± 0.002) or indoors (0.10 ± 0.004) however, did not impact
upon the focal mean association index (p=0.38). There was a non-significant negative
correlation between focal mean association index and the average distance to their first
nearest neighbour for cattle indoors (rs=-0.170, p=0.08); however for cattle at grass
there was a significant positive correlation between mean association index and the
average distance to their first nearest neighbour (rs=0.803, p=0.000) (see figure 2.7).
42
Figure 2.6. The distribution of the total frequency of observations of the mean
distance (metres) to the first nearest neighbour for focal heifers and cows by cattle
type.
Figure 2.7. The correlation between focal mean association index (0 to 1) and the
mean distance (metres) to their first nearest neighbour over multiple observations for
heifers and cows when at grass or indoors.
0
5
10
15
20
25
30
35
40
Fre
qu
ency
of
ob
serv
ati
on
s
First nearest neighbour distance (m)
Cows
Heifers
0
1
2
3
4
5
6
7
0.06 0.08 0.1 0.12 0.14 0.16 0.18
Mea
n d
ista
nce
(m
) to
fir
st N
N
Focal mean association index
Indoors
Grass
43
2.4 Discussion
2.4.1 The existence of social bonds in dairy cattle
The main aim of this study was to ascertain whether dairy cattle housed in a large
dynamic group system under intensive commercial conditions were able to form social
bonds with their conspecifics as has been reported in both feral cattle and domestic
cattle maintained in small stable groups (Bouissou & Andrieu, 1978; Duve & Jensen,
2011; Raussi et al., 2010; Val-Laillet et al., 2009). This was measured through the use
of nearest neighbour and proximity recordings which were transformed into association
indices. The results show that there were a number of dyads within the herd that had
higher than average association index scores suggesting that a preferential relationship
existed for some focal cattle with a particular social partner (chapter 4 and chapter 5
explore some of the reasons behind this). However very few cattle (5%) had particularly
high association index scores (0.33 and above), and only 26% of individuals had a mean
association index score of 0.27 with another individual, which was the cut off point for
determining a preferred partner. Thus, a large proportion of the associations were very
weak, with the majority of dyads seen together only once during the observation period.
This would have had a significant impact on the average association index score
lowering it to the point where it may have identified partners as a preferred partnership
when they may have occurred by chance.
To control for this, the probability of seeing two cattle together on two, three, four and
five occasions was calculated and the results for the total frequency of individuals that
associated significantly more than that expected by chance verified that this level of
association was unlikely to have occurred by chance alone. This confirmed that the
44
arbitrary value of 0.27 was a good indicator of a preferential relationship between
dyads. Furthermore, the value in this study is higher than values recorded by others in
different species; pigs 0.10 (Durrell et al., 2004); dolphins 0.09 (Ansmann et al., 2012).
Although this may not be the best method for assessing preferred or avoided
companionships as it does not take into account the interdependent nature of social
relationships (Asher et al., 2009; Croft et al., 2011), it is the most practical and simplest
assessment of individual social relationships and so can easily be performed on farm.
Such a high number of weak associations in group living animals are not uncommon.
This herd was very dynamic and animals changed groups on a regular basis with an
average of 34.55 (± 1.69) changes occurring in group membership a month, and this
may explain why there were a limited number of strong bonds observed. Furthermore,
the collection of nearest neighbour data relied upon co-occurrence of a sample group.
Due to the large number of animals in the herd, it did not take into account the entire
group, thus giving only a snapshot into the relationships at that moment in time. This
may have potentially under represented the full social structure of the herd (Asher et al.,
2009; Perreault, 2010). Benhajali et al. (2008) noted a high number of weak
associations in horses with only ten out of 44 horses having a preferred partner. The
stocking density was particularly high and the authors commented on the poor social
organisation of the group which may have contributed to the lack of preferred
partnerships noted. Poor stable groupings have also been noted in feral cattle
populations, especially in herds that did not retain the primary bond between mother
and calf (Kimura & Ihobe, 1985; Lott & Minta, 1983). Similar results have also been
seen in an eland herd, where it was only mother-offspring relationships that appeared to
have any strength, at least until the pair separated (Underwood, 1981). Due to the
45
dynamic nature and high stocking density seen in intensive commercial dairy systems,
this may explain why only a limited number of preferred associations were seen and a
large proportion of the observations were weak associations between dyads.
Potentially, weak associations may demonstrate a very open social organisation and
fluidity to the relationships that animals form (Bräger et al., 1994). Plasticity in social
relationships and grouping adaptability have been seen in other social systems, for
example dolphins in two separate communities restructured their social system and
joined together to form one cohesive group when their environmental conditions
changed (Ansmann et al., 2012). The plasticity in relationships seen in this study may
also be due to the very different groupings that dairy cattle experience under
commercial conditions compared to cattle in more natural environments; group sizes
tend to be larger, close kin are rare and most likely unknown, and groups are often
unstable under commercial conditions. Cattle have been seen to more readily form
bonds with their close relations (Reinhardt & Reinhardt, 1982; Reinhardt & Reinhardt,
1981) and have been seen to form bonds when housed in small groups (Patison et al.,
2010; Takeda et al., 2000). This is similar to the social nature of baboons, a highly
sociable animal, whereby stronger bonds are more likely to exist and remain stable
when groups are smaller and more close kin are available. When these conditions do not
exist, relationships are less favourable, more dynamic and less consistent over time
(Silk et al., 2012), which may be the case with cattle in commercial systems.
46
2.4.2 The characteristics of social bonds in dairy cattle
2.4.2a Age
Preferential relationships appeared significantly more often in heifers than in cows and
this is in line with the research by Bouissou & Andrieu (1978), Duve & Jensen (2011),
and Raussi et al. (2010). They all noted bonds to be stronger in younger cattle,
especially if they had been in contact with their peers since a very young age, and this is
independent of kin relationship (Ewbank, 1967). In addition Val-Laillet et al. (2009)
noted dyads which were often in close proximity were more likely to be composed of
two primiparous cows than be of a mixed pair or composed of two multiparous cows.
This attraction to a partner of similar age may be due to the grouping of individuals and
the level of familiarity that is present between pairs, as cattle are often raised in groups
of similar age. Cattle often show a preference to be near to a familiar individual rather
than to an unfamiliar individual. For example, when regrouping calves Færevik et al.
(2007) noted during periods of lying they showed a preference to be in close contact
with a familiar individual over unfamiliar individuals. In addition, Takeda et al. (2000)
observed Japanese black cattle to choose familiar cattle over unfamiliar cattle for both
their nearest neighbour and allogrooming partner.
Familiarity with an individual appears to be an important part of bond formation, more
so than kin; Murphey (1990) observed young cattle to maintain close proximity to their
mothers when visiting a shared resource, however they would then return to the group
that they had been raised in rather than staying with their mother. This phenomenon has
been documented in other species too, for example Mateo (2009) demonstrated the
importance of odours in recognition and bond formation in Belding’s ground squirrels.
47
When juveniles were exposed to odours of non-kin in the natal nest they were more
likely to play with those individuals that were familiar by odour, compared to groups
that were unfamiliar. In the current study, as heifers came from the same farm they were
likely to have been in the same rearing group before entering the main milking herd
which would have been made up of animals of a similar age. By having a separate
group for the heifers away from older individuals when first entering the milking herd,
heifers may have found it easier to recognise familiar individuals and be able to
maintain bonds with certain partners from their original grouping. Heifers were also
much more likely to be of a similar age compared to cows, which would have been
extensively mixed with other cattle of varying ages and experience, making it more
difficult to maintain bonds. This may suggest that the bonds recognised in this study
may be active partnerships, in that they were associating strongly with familiar
individuals that they had spent a significant amount of time with compared to
individuals that they were unfamiliar with (Couzin, 2006). This may explain some of
the variance between younger and older individuals, as heifers came from a more stable
environment before entering the milking herd which was highly dynamic.
An increase in group size and the number of regroupings that cattle had previously
experienced may also cause difficulty in bond formation and consequently fewer bonds
between adults were observed (this is explored further in chapter 4). Cattle may have
found it too difficult to remember each individual within the group. With regular
changes occurring in group membership it would have become increasingly difficult for
cattle to remember the specific relationships that they held with each other individual.
Instead of using energy to constantly re-assess the relationships within the group, cattle
may have changed their social strategy and adopted a more solitary social group system,
48
a result reported in unstable feral cattle herds (Kimura & Ihobe, 1985; Lott & Minta,
1983). As group sizes become larger and more dynamic, the social environment
becomes less stable and so an alternative social system must be adopted. Anderson et al.
(2011) noted goats which experienced an increase in their group size adapted their
social behaviour by reducing both their positive and negative social behaviours,
resulting in a lower level of sociability in the largest group size. Although a reduction in
negative behaviours at larger group sizes may be beneficial, the lack of positive social
behaviours and bond formation may be more of a welfare concern as it may
demonstrate poor psychological welfare.
These results, along with those of Gygax et al. (2009) and Neisen et al. (2009b), suggest
that the consideration of bonds in younger animals, and in particular heifers that are
joining the main herd may be of particular importance and should be considered to
ensure welfare is maintained. By considering this pairing when integrating heifers into
the main herd, mutual social support may have been reciprocally provided, thus easing
their integration (Gygax et al., 2009; Neisen et al., 2009b).
2.4.2b. Proximity to nearest neighbour
Most of the nearest neighbour observations occurred whilst animals were at rest (66%).
Under feral conditions relationships often consist of grazing partners (Reinhardt &
Reinhardt, 1981). Due to the lack of access to grazing for domestic cattle they were
unlikely to have been recorded performing this behaviour. Neisen et al. (2009b)
recognise that resting areas appear to be where limited agonistic interactions take place
and so positive associations are more likely to be noted in this area. Other locations
such as the feed bunk or the walkways are much more dynamic as cattle are often
49
displaced at the feeder and therefore are less likely to be in consistent contact with
another individual (Endres et al., 2005; Huzzey et al., 2006). Reinhardt et al. (1978) did
note that grazing partners would often lie in close proximity in the evening and
associate as resting partners as well. This dual relationship was interpreted by the
authors as showing cattle not making social contact on either a random or predictable
basis but due to a voluntary bond between individuals, and that they had a particular
individual which they preferred to spend their time with. This would suggest that
relationships seen at resting may also likely to have occurred at grazing, given the
opportunity. The positive relationship between average distance to the nearest
neighbour and the mean association index for animals at grass demonstrates that this
would have been likely. Furthermore, it helps to demonstrate the natural spacing of
cattle compared to the negative, although not significant relationship when animals are
indoors based on a cubicle system.
It may be that the associations noted whilst resting were more indicative of preferred
resting location than preferred partners. For example, Durrell et al. (2004) found a large
number of pigs showed an association in one particular pen but only a small number of
those partnerships remained when the group was moved to a second pen suggesting that
location was more important than the individual. However, in this study 71% of
preferred partnerships occurred in different locations and so were not a result of a
common preferred location. This is in agreement with the results by Val-Laillet et al.
(2009) who observed cattle at the feed bunk and noted their locations and proximity to
each other. They also noted cattle associated on a preferential basis and not as a result of
shared resources and preferred locations.
50
When assessing an individual’s sociability Sibbald et al. (2005) found sociability index
scores calculated using the first, second and third nearest neighbours were highly
correlated. Twenty five percent and 23% of preferred partnerships in this study
appeared as the first and second nearest neighbour respectively. Ramseyer et al. (2009)
also noted cattle and ewe-lambs that had a preferred partnership were spatially closer
together and would frequently move in subgroups, suggesting further the importance of
considering more than just the first nearest neighbour in order to get a better
representation of an individual’s social relationships.
Cattle also showed a trend towards having smaller distances between themselves and
their first nearest neighbour the higher their mean association index score was. This
would suggest that cattle which were more likely to form stronger bonds (have a higher
mean association score) were also more likely to maintain closer proximity to their first
nearest neighbour. This is in line with other research which has shown inter-individual
distances to be shorter when animals are near to familiar individuals (Boissy & Dumont,
2002).
In addition, the mean distance to the first nearest neighbour was greater in cows
compared to the distance that heifers maintained, although this was not significantly
different. Aschwanden et al. (2008) commented that the quality of the bonds in goats
significantly influenced the distances between individuals; dyads with more amicable
bonds showed smaller distances. As fewer older cattle had a preferred partner and,
although not significantly different, older cattle also had fewer preferred partners than
heifers, it is possible that older cattle had a lower quality of social bond with others and
therefore maintained greater distances. This reduced quality of bond could also explain
51
why the strongest bonds were mainly observed in heifers when compared to cows. This
reduction in bond quality could as mentioned previously, be the result of the continued
regrouping and large groups experienced by the older cattle. Further, as heifers are
likely to have come from the same group and therefore reared together, they are likely
to be more familiar with each other and so have a better quality of social bond
compared to cows.
Interestingly there was no significant difference in the distance to the first nearest
neighbour when at grass and the fifth nearest neighbour when indoors. The increase in
stocking density and the increase in group size as a result of increased intensification
may make it difficult for cattle to maintain their preferred distance to their neighbours.
Kondo et al. (1989) noted that the mean distance to the nearest neighbour in calf and
adult cattle groups increased as the group size decreased and space allowance increased.
This may explain the non-significant difference between the distances maintained to the
first nearest neighbour when at grass and when in cubicles and it may also explain the
reason why the preferred partner is not always the first nearest neighbour. The relatively
similar number of observations of partners appearing as the first and second neighbour
may be a result of the fact that cattle prefer to maintain a certain distance to their
neighbours, and as the number of cattle increases and space allowance decreases, cattle
without a preferred partner or preferential associations may simply fill in the space left
by cattle wanting to maintain a certain distance when living in cubicles. The
consequences of having non-preferred partners resting in closer proximity than would
naturally be maintained when at grass may have negative consequences on cattle
welfare as they may feel uneasy about having a random individual that close to them,
52
however this needs further investigation in order to understand what consequences it
could have for cattle’s welfare.
2.4.3 Practical implications
These findings have practical implications on farms. When animals do not have the
opportunity to form a social bond there could be negative consequences to their welfare.
Social bonds increase cohesion and stability in the group which in turn reduces
aggression and reduces social tension in cattle (Phillips, 2002). Improving the social
environment and encouraging stability allows cattle to potential have the ability to cope
with their environment better and so could relieve stress and ensure good welfare
(Veissier & Boissy, 2007) through improved physical as well as psychological health.
In addition, cattle’s learning ability is better when a conspecific is present and cattle
exhibit fewer signs of disturbance towards fear eliciting stimuli when a conspecific is
present (Boissy & Le Neindre, 1997; Hagen & Broom, 2004). This would aid learning
in younger individuals when introducing them to their new environment upon joining
the herd. Training younger cattle to correctly use cubicles is important to health and
welfare as incorrect use can lead to increased incidences of mastitis and lameness
(Friend & Polan, 1974; Galindo & Broom, 2000; Galindo & Broom, 2002).
Furthermore, when introducing cattle to the milking apparatus, a supporting conspecific
could help producers to handle cattle and get them settled into the routine more quickly
and safely, saving valuable time and increasing safety of stockpersons.
Encouragement for producers to offer an opportunity for cattle to form and maintain
positive relationships in the commercial setting is now required. It will now be possible
to take note of and adhere to EFSA’s recommendation regarding the maintenance of
53
social bonds as they have been demonstrated here to exist in dairy cattle housed under
full commercial conditions. Although the majority of the relationships were weak,
younger individuals were more likely to have associations and these were also stronger
in younger cattle. The rarity and weakness of bonds in older cattle may be due to the
lack of consideration given to them in the past and therefore their current environment,
as like many other commercial systems, has not considered the social environment fully
for dairy cattle to be able to maintain these important bonds.
2.5 Conclusion
In summary, the results of this study demonstrate that cattle under commercial
conditions can and do form preferential partnerships with other cattle. This was
indicated by the higher than average time that some dyads spent together. The
observation that these relationships occurred at a higher frequency than was expected by
chance alone indicated that dyads were associating due to a specific relationship
between the pair. Younger cattle were more likely to be observed as having a preferred
partnership and they were also likely to maintain closer proximity to others.
Relationships in cattle appear to change as they age; this is further investigated in
chapter 5.
Although spatial proximity may be a good indicator of a social bond, this does not
necessarily confirm the importance of the relationship. Most association indices are
based on a limited amount of time spent together and therefore the partnerships
identified may only be short term associations (Lusseau et al., 2008). Observations did
not involve any specific interactions, just spatial proximity, therefore the nature of the
bond cannot be determined (Lusseau et al., 2008). In order to fully understand these
54
relationships within cattle it is necessary to demonstrate the importance of this social
bond in cattle’s ability to cope with environmental challenges.
As the presence of an attachment figure can help to reduce the levels of stress
experienced during environmental challenge (Boissy & Le Neindre, 1997; Færevik et
al., 2006; Hennessy et al., 2002; Takeda et al., 2003) an observation that tests these
relationships in a stressful environment will help to further demonstrate the existence of
these bonds in dairy cattle. Furthermore, it will demonstrate the importance of these
relationships to cattle when attempting to cope with their environment when challenged,
and so is explored in chapter 3.
55
Chapter Three
The Effects of Short Term Social Separation on
the Behaviour, Production and Welfare of Dairy
Cattle
56
3.1 Introduction
The welfare of an animal is closely linked to its ability to cope with challenge and how
it perceives its environment (Veissier & Boissy, 2007). In humans, social support has
been readily studied and been found to have positive impacts on an individual’s coping
ability during psychogenic stressors (Ditzen et al., 2007; Ditzen et al., 2008; Heinrichs
et al., 2003). Moreover, the mental health and well-being of people suffering from
disease has also been seen to improve when being supported by others (Bloom et al.,
2001; Ironson & Hayward, 2008; Uchino, 2006). The elimination of potential stressors
within the commercial dairy setting may be difficult to achieve but there is the potential
ability to utilise the social support mechanism during periods of stress. This may help to
alleviate any negative consequences that may be experienced by cattle when separated
and promote positive physical and psychosocial welfare of dairy cattle leading to a
better quality of life and subsequently higher welfare.
Short term separation of cows from the remainder of the group is a common practice in
many dairies. Cattle are often held in a separate holding pen after milking when they are
required for pregnancy scanning, artificial insemination or foot trimming. From an early
age calves are highly motivated to gain full social contact with another calf compared to
just partial contact demonstrating the need for social contact in cattle (Holm et al.,
2002). Subsequently, any form of separation or isolation can be a potent psychogenic
stressor to cattle generating an acute stress response often resulting in behavioural
(Boissy et al., 2001; Piller et al., 1999; von Keyserlingk et al., 2008), endocrinological
(Hennessy, 1997; Ruis et al., 2002), immunological (Marsland et al., 2002; Tuchscherer
et al., 2009) and other physiological changes (Færevik et al., 2006; Phillips & Rind,
2001), which may be indicative of a reduced welfare status.
57
The strong emotional impact that social isolation and separation brings about has meant
that it has been frequently implemented to validate and quantify the existence of a social
bond between two individuals, as well as to explore the positive impacts of social
support when confronted with such challenges (Færevik et al., 2006; Price & Thos,
1980; Schweitzer et al., 2010). For example, heifers restrained during social isolation
exhibited signs of distress through increased vocalisations and struggling (Boissy & Le
Neindre, 1997). The heart rates of heifers also increased during social isolation showing
an autonomic stress response; on subsequent reunion of the isolated heifer with its
peers, there was a marked decline on both the behavioural and autonomic response to
the stressor. The rate of decline was, however, dependent on familiarity, with pen mates
having a more pronounced effect than non-pen mates (Boissy & Le Neindre, 1997).
Familiarity is important to bond formation, and appears to be important with regards to
an individual’s ability to reduce the stress response of another after a period of isolation;
it does not however automatically confirm a bond between individuals. It could be
argued that the distress caused by the separation of group mates may be indicative of the
response to the isolation in itself and therefore does not fully address the concept of
social support that may increase an individual’s ability to cope with potential stressful
conditions during that time.
Results by Færevik et al. (2006) however, do provide some evidence on the effects of
social support during isolation. Six week old calves were exposed to two tests: 1) to
observe the social preferences of calves using a Y-maze test; and 2) to observe the
effects of separation stress when isolated on their own, with an unfamiliar calf, or with a
familiar calf. During the Y-maze test, calves preferred to spend more time standing next
58
to and exploring the areas near the familiar calf, representing a preferred companion.
During the separation test, calves showed a reduced stress response when separated with
a familiar calf compared to when either alone or with an unfamiliar calf (Færevik et al.,
2006). From this it can be deduced that from an early age cattle are able to form
relationships with particular individuals and that these relationships are important to
them during a time of social separation as they appear to lessen the stress response
evoked, compared to another unfamiliar companion. Although familiarity did appear to
offer some support during the social separation test, the level of familiarity and,
therefore, the quantification of the bond between individuals was still not fully clarified.
In order to quantify the existence of a bond and the potential improvement in an
individual’s coping ability through support from its bonded partner, the effect of the
presence of a familiar and previously identified preferred partner compared to the
presence of a familiar but non-preferred partner during a period of social separation
must be demonstrated. Having established that cattle under commercial conditions do
form social bonds (see chapter two), the use of a short term separation test was utilised
to help quantify that social bond further, as has been seen in previous studies mentioned
above. The overall aim of this part of the study was to investigate the effects of short
term social separation from those preferred group mates on the welfare, productivity
and behaviour of dairy cattle. In order to fully understand the effects of social separation
from their preferred partner and not just from the remainder of the herd, the use of the
previously identified bonded individuals from study 1d (see section 2.2.1 for details)
were used and cattle were exposed to social isolation whilst supported by their preferred
partner and then by a non-preferred but familiar individual. This addressed some of the
concerns with previous research as discussed above regarding the dissociation of the
59
advantages of social support and the disadvantages of separation. As both animals were
familiar with the focal, but one a preferred partner, this allowed for the potential effects
of social support to be investigated, as well as to establish the importance of social
bonds in cattle and how they might aid an individual’s ability to cope with
psychological stressors such as social isolation.
3.2 Materials and methods
3.2.1 Housing area, animals and management
Eleven lactating Holstein-Friesian cattle from the main milking herd at Stud Farm,
Moulton College were used in the study: ten primiparous heifers, and one multiparous
cow. These eleven individuals made up of six pairings (one animal was involved in two
preferred partnerships) (see table 3.1), which had previously been identified as preferred
partners from observation 1d. All cattle remained within the herd apart from when being
socially separated for experimental observation and remained within the same lactation
group throughout the observation period. All cattle were housed loose in a cubicle shed
with ad libitum access to water and a total mixed ration (TMR) formulated to provide
adequate nutrients for that particular lactation group. Fresh feed was delivered twice a
day, after each milking period and cattle were allowed out to grass generally one hour
after feeding until the next milking at 1530hr (approximately six hours at grass). See
section 2.2.1 for more information.
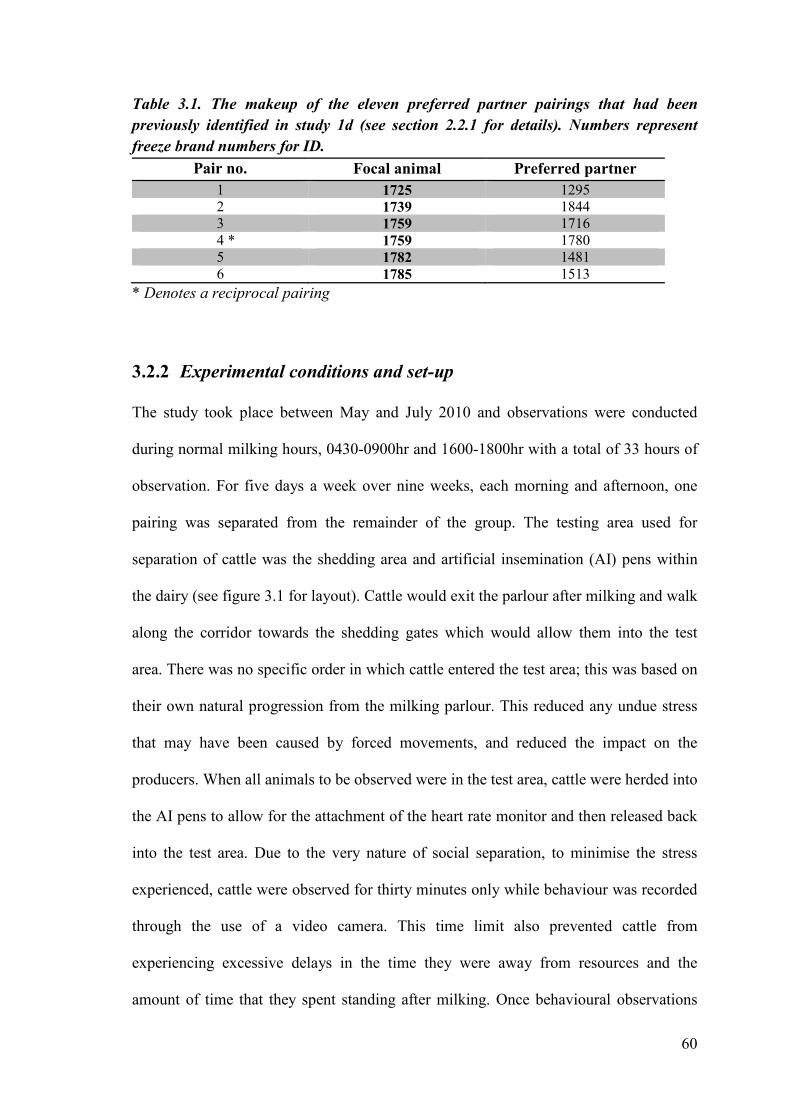
60
Table 3.1. The makeup of the eleven preferred partner pairings that had been
previously identified in study 1d (see section 2.2.1 for details). Numbers represent
freeze brand numbers for ID.
Pair no. Focal animal Preferred partner
1 1725 1295 2 1739 1844 3 1759 1716
4 * 1759 1780 5 1782 1481 6 1785 1513
* Denotes a reciprocal pairing
3.2.2 Experimental conditions and set-up
The study took place between May and July 2010 and observations were conducted
during normal milking hours, 0430-0900hr and 1600-1800hr with a total of 33 hours of
observation. For five days a week over nine weeks, each morning and afternoon, one
pairing was separated from the remainder of the group. The testing area used for
separation of cattle was the shedding area and artificial insemination (AI) pens within
the dairy (see figure 3.1 for layout). Cattle would exit the parlour after milking and walk
along the corridor towards the shedding gates which would allow them into the test
area. There was no specific order in which cattle entered the test area; this was based on
their own natural progression from the milking parlour. This reduced any undue stress
that may have been caused by forced movements, and reduced the impact on the
producers. When all animals to be observed were in the test area, cattle were herded into
the AI pens to allow for the attachment of the heart rate monitor and then released back
into the test area. Due to the very nature of social separation, to minimise the stress
experienced, cattle were observed for thirty minutes only while behaviour was recorded
through the use of a video camera. This time limit also prevented cattle from
experiencing excessive delays in the time they were away from resources and the
amount of time that they spent standing after milking. Once behavioural observations
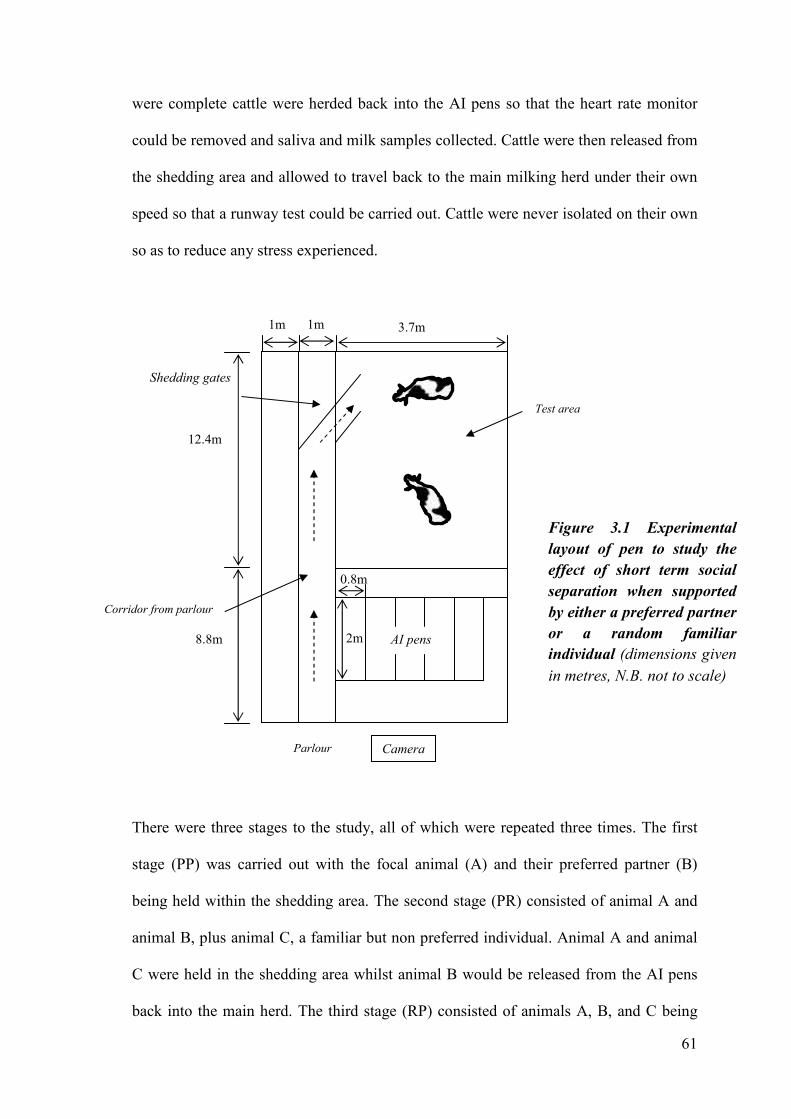
61
were complete cattle were herded back into the AI pens so that the heart rate monitor
could be removed and saliva and milk samples collected. Cattle were then released from
the shedding area and allowed to travel back to the main milking herd under their own
speed so that a runway test could be carried out. Cattle were never isolated on their own
so as to reduce any stress experienced.
There were three stages to the study, all of which were repeated three times. The first
stage (PP) was carried out with the focal animal (A) and their preferred partner (B)
being held within the shedding area. The second stage (PR) consisted of animal A and
animal B, plus animal C, a familiar but non preferred individual. Animal A and animal
C were held in the shedding area whilst animal B would be released from the AI pens
back into the main herd. The third stage (RP) consisted of animals A, B, and C being
Test area
Camera
Shedding gates
AI pens
Figure 3.1 Experimental
layout of pen to study the
effect of short term social
separation when supported
by either a preferred partner
or a random familiar
individual (dimensions given
in metres, N.B. not to scale)
Parlour
Corridor from parlour
3.7m 1m 1m
12.4m
8.8m 2m
0.8m
62
held in the shedding area. Animal A would then be released leaving, animal B and
animal C in the shedding area for observation.
3.2.3 Measurements
3.2.3a Behavioural observations
In order to assess the effects of short term separation on the welfare of cattle the
behavioural response of heifers was monitored for signs of distress or changes in their
response between treatments. From the video footage instantaneous behavioural
sampling was carried out at 15 second intervals for each pair over the thirty minute
separation period as defined in table 3.2 with the exception of vocalisation which was
recorded on a continuous behavioural basis. This interval was chosen so that behaviour
recordings coincided with the heart rate measurements and any unusual responses could
be traced back using the video footage. In addition, the proximity between the two
individuals was also recorded at 15 second intervals (<1 body length, 1-2 body lengths,
>2 body lengths at the point of withers), as was the position of each individual within
the pen (exit, middle, AI pens). This allowed comparisons between proximity
measurements of preferred and non-preferred partners.
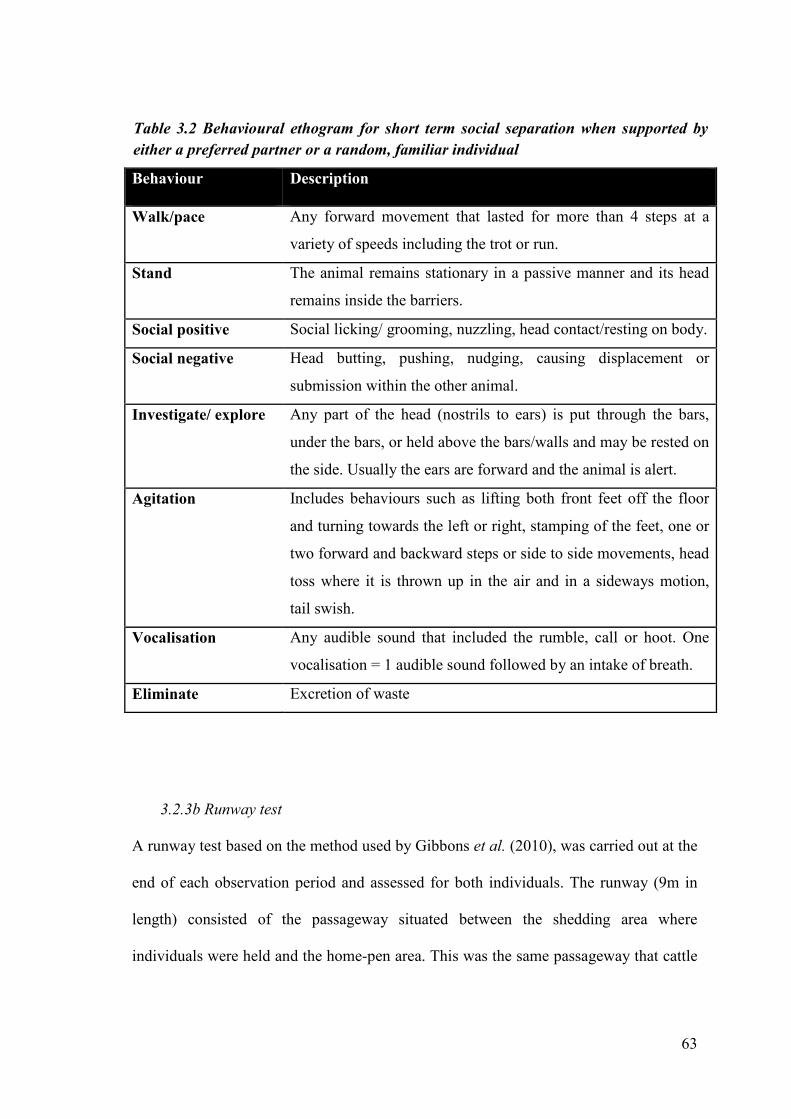
63
Behaviour Description
Walk/pace Any forward movement that lasted for more than 4 steps at a
variety of speeds including the trot or run.
Stand The animal remains stationary in a passive manner and its head
remains inside the barriers.
Social positive Social licking/ grooming, nuzzling, head contact/resting on body.
Social negative Head butting, pushing, nudging, causing displacement or
submission within the other animal.
Investigate/ explore Any part of the head (nostrils to ears) is put through the bars,
under the bars, or held above the bars/walls and may be rested on
the side. Usually the ears are forward and the animal is alert.
Agitation Includes behaviours such as lifting both front feet off the floor
and turning towards the left or right, stamping of the feet, one or
two forward and backward steps or side to side movements, head
toss where it is thrown up in the air and in a sideways motion,
tail swish.
Vocalisation Any audible sound that included the rumble, call or hoot. One
vocalisation = 1 audible sound followed by an intake of breath.
Eliminate Excretion of waste
3.2.3b Runway test
A runway test based on the method used by Gibbons et al. (2010), was carried out at the
end of each observation period and assessed for both individuals. The runway (9m in
length) consisted of the passageway situated between the shedding area where
individuals were held and the home-pen area. This was the same passageway that cattle
Table 3.2 Behavioural ethogram for short term social separation when supported by
either a preferred partner or a random, familiar individual
64
used to return to their home-pen after each milking period twice a day and so it was
familiar to all animals.
On test days, at the end of the thirty minute separation procedure both individuals were
released through the exit gate out of the holding area and into the runway. The test
began for each animal once they had taken one step past the first post in the passageway
and finished when they had taken one step with a front leg past the end of the runway
area (last post in view of the camera). The latency to reach the end of the runway was
taken from video recordings and used as a measure of social motivation to return to the
remainder of the group. This latency to return was used to assess whether cattle held
with their preferred partner were more or less inclined to access the remainder of the
herd compared to when they were held with a non-preferred but still familiar individual
(and their preferred partner was in the main herd).
3.2.3c Heart rates
The heart rates of cattle were measured to assess the autonomic stress response during
short term separation. Differences in heart rate responses between treatments would
provide numerical assessment of the importance of each partner, preferred or non-
preferred, in providing support to ease the stress experienced. Heart rate was recorded at
15 second intervals in beats per minute (bpm) using a non-invasive heart rate monitor
(Equine POLAR® RS800TM heart rate monitor) that was modified for use in dairy
cattle, similar to Hagen et al. (2005). The monitor was attached as per manufacturer’s
instructions to the left side with one electrode placed behind the shoulder blade near to
the withers and the other in a ventral position by the heart. Electrodes were heavily
moistened with warm water and ultrasound gel was applied under each electrode to
65
enhance transmission. No animal was shaved or trimmed. Data was transmitted from
the belt to the watch receiver where it was then downloaded to the Polar ProTrainer5TM
and then transferred to Microsoft Excel 7.0. Data was checked for abnormalities
including zero values or values above 200 bpm, and then mean heart rate per minute
were calculated, as in Stěhulová et al. (2008), ready for analysis. Collection of heart
rates could only be collected for one individual in each stage to avoid cross over in
readings. For stage 1 (PP) focal cattle (A) were monitored, for stage 2 (PR) focal cattle
(A) were monitored, and for stage 3 (RP) partners (B) were monitored.
3.2.3d Cortisol
The physiological response to a potential stressor can be quantified through the
measurement of glucocorticoid hormones, in particular cortisol. It is well established
that levels of cortisol within the body are good indicators of the current welfare status of
individuals as high levels of this hormone can indicate a high level of stress. Cortisol
samples were taken using non-invasive techniques and were collected at the end of the
separation period to assess the level of stress experienced due to the separation. Saliva
samples were obtained using a similar technique to Cook et al. (1996), Negrão et al.
(2004) and de Jong et al. (2000) whereby cattle were allowed to chew on a standard
cotton ball held in the mouth with tongs until completely soaked, or for as long as the
individual would allow. Swabs were then wrapped in cling film and placed on ice in a
polystyrene box ready for transport to the laboratory. Foremilk samples (approximately
10ml) from all quarters were manually extracted into a 125ml airtight container, with a
50mm diameter opening, which were then placed on ice for transportation. Pooled
samples from all four quarters were chosen so that the most representative physiological
samples were collected.
66
The longest time between sample collection and sample separation in the laboratory was
no longer than 2 hours. Samples were centrifuged using a SIGMA 2-16P Benchtop
Centrifuge (Laborzentriugen GmbH, Germany) (milk at 4000 rpm for 30 mins and
saliva at 1500 rpm for 20 mins) to remove fat and debris from the samples, as well as to
extract as much saliva from the cotton bud as possible. Samples were stored in 1.5ml
Eppendorf Safe Lock TubesTM (Eppendorf, Germany) and subsequently frozen at -40°C
in a Frigor -45°C chestfreezer (Snijders Sceintific B.V., The Netherlands) until required
for assay: this was no longer than twelve months. All samples were allowed to thaw
naturally for 30 minutes and mixed thoroughly before assay as per the manufacturers’
instructions. A high-sensitivity human saliva commercial 96 well ELISA kit (DRG®
Marburg, Germany) was used to determine cortisol levels. Its analytical sensitivity for
detection was 0.012 ng/ml and samples were prepared as per the instructions and
measured in duplicates. Plates were then analysed by a SPECTROStarNano Absorbance
microplate reader (BMG LABTECH GmbH, Germany). Both saliva and milk samples
were collected so that comparisons between the two could be made. It was hoped that
the saliva samples could be used to investigate the potential use of milk samples for
welfare assessment as it is readily available to both producers and researchers and thus
can be collected without interfering too much with the animal and therefore influencing
the results.
3.2.3e Production
In order to assess the potential impact on milk production that short term separation
from the herd might have, and to investigate how any changes might be limited by the
presence of a preferred partner, production data was collected. Individual milk yield
67
(litres) was automatically collected by Crystal, Fusion Electronics BV (Fullwood Packo
Group, The Netherlands) at each milking (am and pm). The Crystal software
automatically records a number of management factors such as activity levels and milk
volume produced (yield). The milk monitoring system employed is capable of
measuring milk volume, conductivity (milliSiemens [mS]), and temperature (°C). This
information was stored on a database within the farm’s computer system and could be
accessed to obtain the required information. Data was downloaded from farm records on
a monthly basis and transferred to Microsoft Excel 7.0 so that it could be arranged into
the required format for data analysis and where it could be checked for abnormalities.
Data was collected to include the two milkings before separation and the two milkings
after separation (24 hours either side) so that any changes between the time periods
could be analysed and thus the effect of separation could be assessed. As milk
production changes according to the time of day, it was important to compare both
times (am and pm) rather than just adjacent days (Plaut & Casey, 2012).
3.2.4 Statistical analyses
All statistical analysis was carried out using Minitab version 13.20 and data presented
as means ± SEM unless where otherwise stated. For all statistical analyses a
significance level of p<0.05 was accepted. Any data which was not normally distributed
was log transformed using the common logarithm log10 to normalise where required.
Where log transformation did not normalise data, non-parametric statistics were used.
Details of particular methods and tests employed are outlined below.
68
3.2.4a. Behavioural observations
Individual behaviours were compared for both the focal animal and its preferred partner,
between stages. Normality was tested using the Anderson-Darling test. If normality was
met a paired-samples t-test was used, and if normality assumptions were not met
whereby the data was either not normally distributed or there was unequal variances, the
non-parametric equivalent, the Wilcoxon’s signed rank test was used. Individual
behaviours for the non-preferred random animal between stages were compared using
either the independent two-sample t-test when normality was met (as above) or the non-
parametric equivalent Mann-Whitney U test when normality was not met, due to non-
repeated measures.
Distance between dyads within stages was analysed using a one-way ANOVA for stage
1 (PP) and stage 2 (PR), and a Kruskal-Wallis test for stage three (RP) as data was not
normally distributed after log transformation. Comparisons were made using Fisher’s a
priori least significant difference tests to further investigate where differences existed.
Due to non-normally distributed data after log transformation, a general linear model
was used to analyse the interaction effect of stage and the number of times cattle were
within each of the proximity categories (<1 body length, 1-2 body lengths, >2 body
lengths). To test for order effects that may have allowed habituation to the testing area,
Spearman rank correlations between each repeat test session for all animals were carried
out as data was not normally distributed.
69
3.2.4b Runway test
The latency to reach the herd upon release was analysed using non-parametric statistics
as the data was not normally distributed after log transformation. The average time
taken for cattle to return to the herd across the three stages was compared using a
Kruskal-Wallis test, as was the difference in average time taken between cattle (focal
animal A, preferred partner B, and random individual C). The effect of separation was
analysed using a Wilcoxon’s signed rank test for A and B due to paired-samples, and a
Mann-Whitney U test for C due to independent samples. Spearman’s rank correlations
between each repeat test session for all animals were carried out to test for habituation
across test sessions.
3.2.4c Heart rates
To avoid confounding effects of handling cattle on heart rate, the first ten minutes of
data were removed from the analysis. Differences in mean heart rates per minute, peak
heart rates, the latency to reach peak heart rate, and the latency to reach 80bpm (deemed
to be resting heart rate), were compared between stage 1 (PP) and stage 2 (PR) using
repeated measures analysis, and between stage 1 (PP) and stage 3 (RP), and stage 2
(PR) and stage 3 (RP) using independent analysis. Spearman’s rank correlations
between each test session for all animals were carried out to test for consistency across
test sessions.
3.2.4d Cortisol
Cortisol samples for both milk and saliva were analysed to test for the differences in
cortisol levels between stage 1 (PP) and stage 2 (PR). Milk cortisol samples were
compared using a non-parametric Wilcoxon’s signed rank test as data was not normally
70
distributed, and saliva cortisol samples were compared by a paired-samples t-test due to
repeated measures.
3.2.4e Production
To investigate general differences in total milk yield, milk conductivity, and duration of
milking between focal animal A and the preferred partner B, and the condition
experienced, a general linear model was used. The model included cattle identity (A/B),
condition (PP, PR, or RP), and whether it was before or after separation. The effects of
separation on each of the focal individuals were compared using a Wilcoxon’s signed
rank test to test for changes in yield and the duration of milking, and a paired-samples t-
test was used to test for changes in conductivity before and after separation, between
stages.
3.2.5 Ethical note
All ethical considerations were approved by MC ethics committee. All animals were
observed for any signs of excessive distress or behavioural reactions that may result in
injury. Any animal displaying behavioural signs of distress were removed from the
study and released from the area back towards the herd as soon as was possible and safe
to do so. Cattle were acclimatised to the use of the cotton wool swab before data
collection started. Any animal that showed signs of excessive disturbance when
collecting saliva or milk samples, collection was ceased and the animal released from
the pen.
71
3.3 Results
3.3.1 Behavioural observations
Table 3.3 shows the mean frequency (± SEM) and significance level for differences
between stages for all behaviours for focal animal A, the preferred partner B, and the
random individual C. During the separation period, the behaviour with the highest
frequency was standing for all animals and this did not differ significantly across stages.
The frequency for ‘investigate / explore’ and ‘walk / pace’ was also relatively high for
all cattle across the three conditions. In particular, for focal individuals (A), the mean
frequency of ‘walk / pace’ behaviour, although not significantly different did show a
tendency to increase when they were with a random individual compared to when with
their preferred partner.
For both A and B there were significant differences in behaviours suggestive of
agitation between stages, with higher frequencies observed when cattle were with the
random individual. C did not show any differences. Both A and B had lower levels of
agitation when in stage 1 (PP) than when with a random individual (stage 2 (PR) and
stage 3 (RP) respectively). There was no significant difference in the frequency of both
positive and negative social behaviours for all cattle across the three stages, although for
B there was a trend towards significance with more negative behaviours being
performed when with the random individual compared to when with the focal
individual.
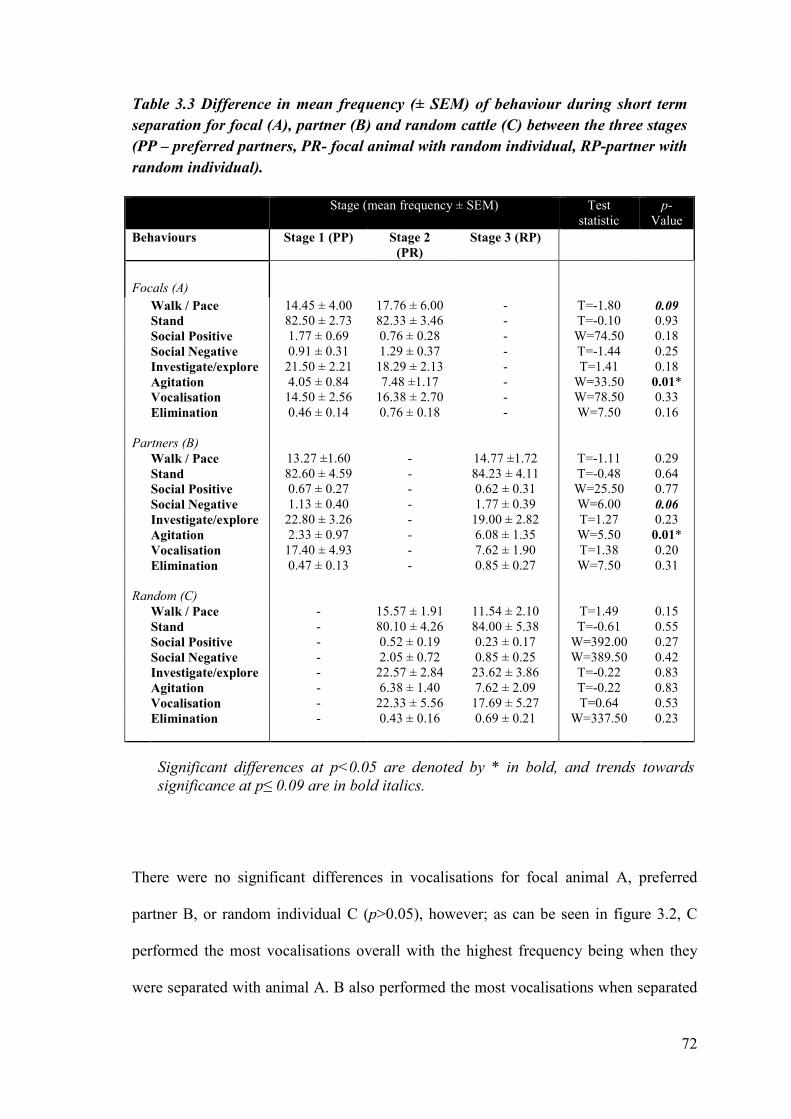
72
Table 3.3 Difference in mean frequency (± SEM) of behaviour during short term
separation for focal (A), partner (B) and random cattle (C) between the three stages
(PP – preferred partners, PR- focal animal with random individual, RP-partner with
random individual).
Stage (mean frequency ± SEM) Test statistic
p-Value
Behaviours Stage 1 (PP) Stage 2
(PR)
Stage 3 (RP)
Focals (A) Walk / Pace 14.45 ± 4.00 17.76 ± 6.00 - T=-1.80 0.09
Stand 82.50 ± 2.73 82.33 ± 3.46 - T=-0.10 0.93 Social Positive 1.77 ± 0.69 0.76 ± 0.28 - W=74.50 0.18 Social Negative 0.91 ± 0.31 1.29 ± 0.37 - T=-1.44 0.25 Investigate/explore 21.50 ± 2.21 18.29 ± 2.13 - T=1.41 0.18 Agitation 4.05 ± 0.84 7.48 ±1.17 - W=33.50 0.01* Vocalisation 14.50 ± 2.56 16.38 ± 2.70 - W=78.50 0.33 Elimination 0.46 ± 0.14 0.76 ± 0.18 - W=7.50 0.16
Partners (B)
Walk / Pace 13.27 ±1.60 - 14.77 ±1.72 T=-1.11 0.29 Stand 82.60 ± 4.59 - 84.23 ± 4.11 T=-0.48 0.64 Social Positive 0.67 ± 0.27 - 0.62 ± 0.31 W=25.50 0.77 Social Negative 1.13 ± 0.40 - 1.77 ± 0.39 W=6.00 0.06
Investigate/explore 22.80 ± 3.26 - 19.00 ± 2.82 T=1.27 0.23 Agitation 2.33 ± 0.97 - 6.08 ± 1.35 W=5.50 0.01* Vocalisation 17.40 ± 4.93 - 7.62 ± 1.90 T=1.38 0.20 Elimination 0.47 ± 0.13 - 0.85 ± 0.27 W=7.50 0.31
Random (C)
Walk / Pace - 15.57 ± 1.91 11.54 ± 2.10 T=1.49 0.15 Stand - 80.10 ± 4.26 84.00 ± 5.38 T=-0.61 0.55 Social Positive - 0.52 ± 0.19 0.23 ± 0.17 W=392.00 0.27 Social Negative - 2.05 ± 0.72 0.85 ± 0.25 W=389.50 0.42 Investigate/explore - 22.57 ± 2.84 23.62 ± 3.86 T=-0.22 0.83 Agitation - 6.38 ± 1.40 7.62 ± 2.09 T=-0.22 0.83 Vocalisation - 22.33 ± 5.56 17.69 ± 5.27 T=0.64 0.53 Elimination - 0.43 ± 0.16 0.69 ± 0.21 W=337.50 0.23
Significant differences at p<0.05 are denoted by * in bold, and trends towards
significance at p≤ 0.09 are in bold italics.
There were no significant differences in vocalisations for focal animal A, preferred
partner B, or random individual C (p>0.05), however; as can be seen in figure 3.2, C
performed the most vocalisations overall with the highest frequency being when they
were separated with animal A. B also performed the most vocalisations when separated
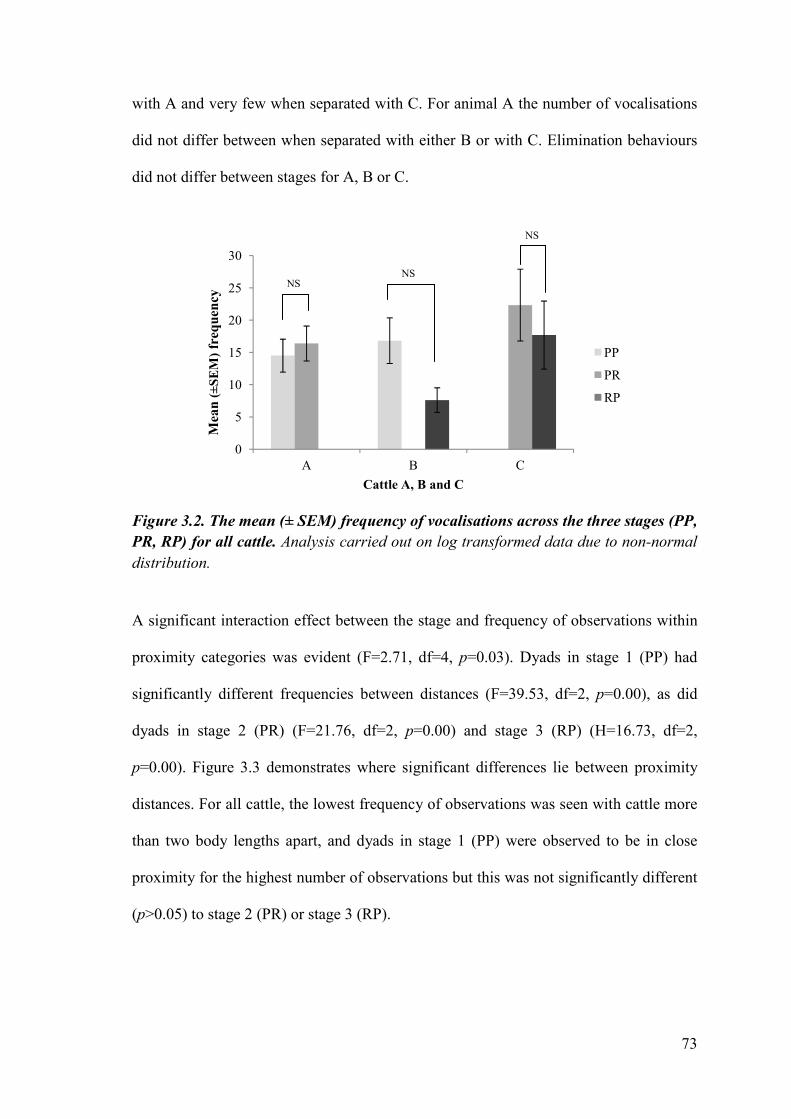
73
with A and very few when separated with C. For animal A the number of vocalisations
did not differ between when separated with either B or with C. Elimination behaviours
did not differ between stages for A, B or C.
Figure 3.2. The mean (± SEM) frequency of vocalisations across the three stages (PP,
PR, RP) for all cattle. Analysis carried out on log transformed data due to non-normal
distribution.
A significant interaction effect between the stage and frequency of observations within
proximity categories was evident (F=2.71, df=4, p=0.03). Dyads in stage 1 (PP) had
significantly different frequencies between distances (F=39.53, df=2, p=0.00), as did
dyads in stage 2 (PR) (F=21.76, df=2, p=0.00) and stage 3 (RP) (H=16.73, df=2,
p=0.00). Figure 3.3 demonstrates where significant differences lie between proximity
distances. For all cattle, the lowest frequency of observations was seen with cattle more
than two body lengths apart, and dyads in stage 1 (PP) were observed to be in close
proximity for the highest number of observations but this was not significantly different
(p>0.05) to stage 2 (PR) or stage 3 (RP).
0
5
10
15
20
25
30
A B C
Mea
n (
±S
EM
)fr
equ
ency
Cattle A, B and C
PP
PR
RP
NS NS
NS
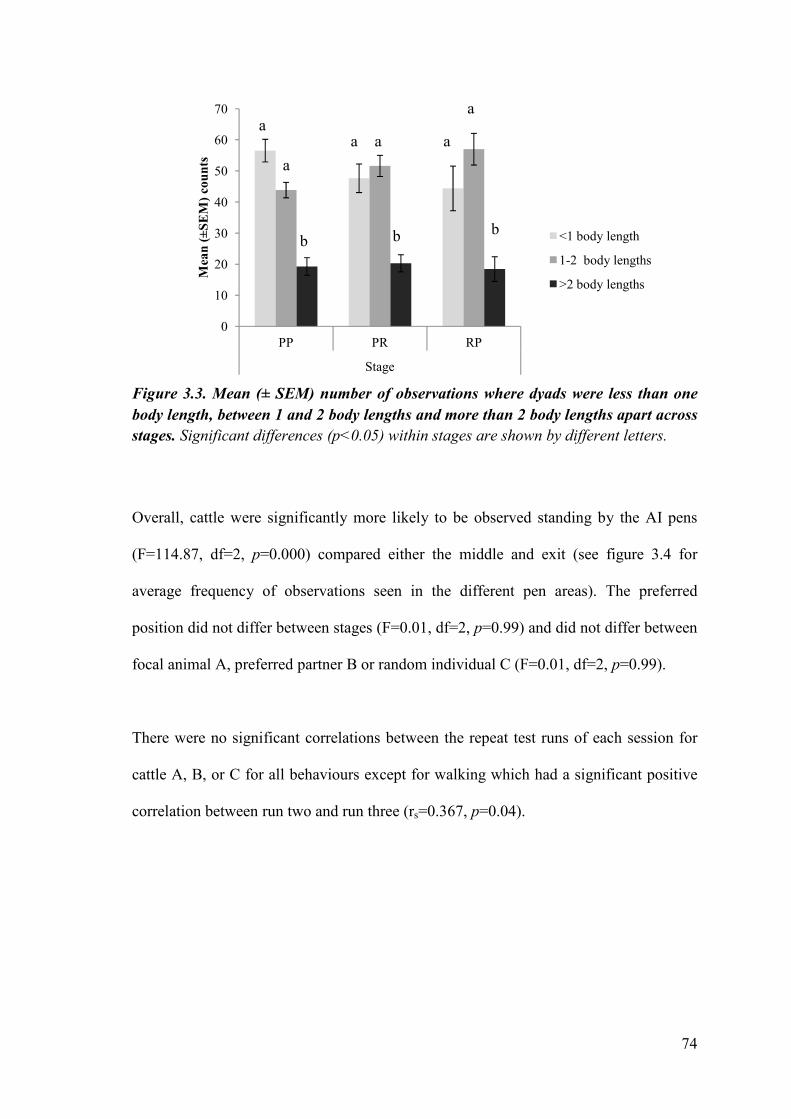
74
Figure 3.3. Mean (± SEM) number of observations where dyads were less than one
body length, between 1 and 2 body lengths and more than 2 body lengths apart across
stages. Significant differences (p<0.05) within stages are shown by different letters.
Overall, cattle were significantly more likely to be observed standing by the AI pens
(F=114.87, df=2, p=0.000) compared either the middle and exit (see figure 3.4 for
average frequency of observations seen in the different pen areas). The preferred
position did not differ between stages (F=0.01, df=2, p=0.99) and did not differ between
focal animal A, preferred partner B or random individual C (F=0.01, df=2, p=0.99).
There were no significant correlations between the repeat test runs of each session for
cattle A, B, or C for all behaviours except for walking which had a significant positive
correlation between run two and run three (rs=0.367, p=0.04).
0
10
20
30
40
50
60
70
PP PR RP
Stage
Mea
n (
±S
EM
) co
un
ts
<1 body length
1-2 body lengths
>2 body lengths
a
a
b
a a
b
a
a
b
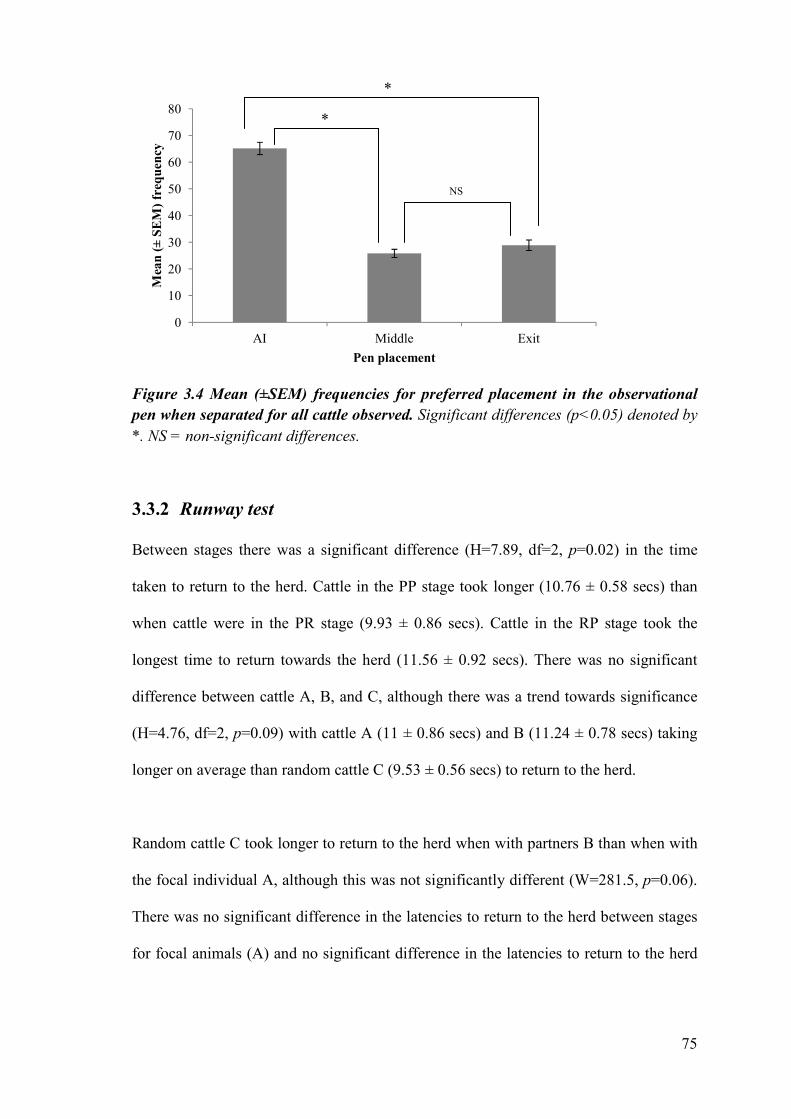
75
Figure 3.4 Mean (±SEM) frequencies for preferred placement in the observational
pen when separated for all cattle observed. Significant differences (p<0.05) denoted by
*. NS = non-significant differences.
3.3.2 Runway test
Between stages there was a significant difference (H=7.89, df=2, p=0.02) in the time
taken to return to the herd. Cattle in the PP stage took longer (10.76 ± 0.58 secs) than
when cattle were in the PR stage (9.93 ± 0.86 secs). Cattle in the RP stage took the
longest time to return towards the herd (11.56 ± 0.92 secs). There was no significant
difference between cattle A, B, and C, although there was a trend towards significance
(H=4.76, df=2, p=0.09) with cattle A (11 ± 0.86 secs) and B (11.24 ± 0.78 secs) taking
longer on average than random cattle C (9.53 ± 0.56 secs) to return to the herd.
Random cattle C took longer to return to the herd when with partners B than when with
the focal individual A, although this was not significantly different (W=281.5, p=0.06).
There was no significant difference in the latencies to return to the herd between stages
for focal animals (A) and no significant difference in the latencies to return to the herd
0
10
20
30
40
50
60
70
80
AI Middle Exit
Mea
n (
±S
EM
) fr
equ
ency
Pen placement
*
*
NS
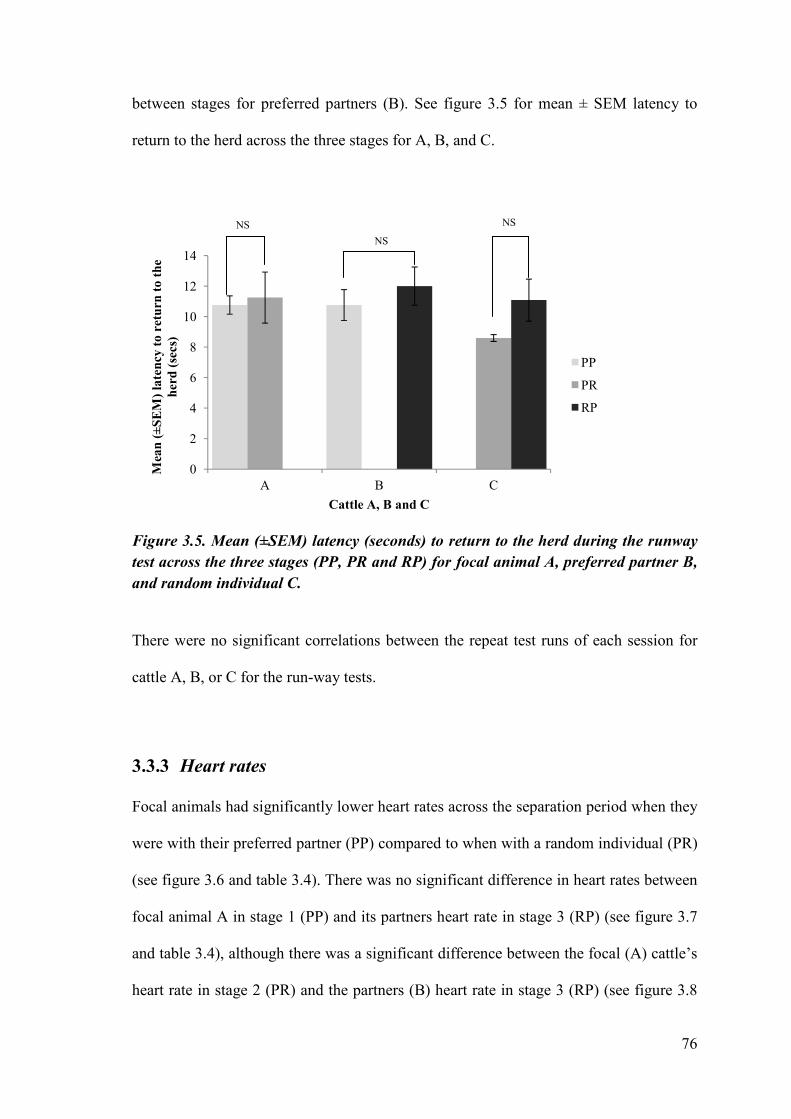
76
between stages for preferred partners (B). See figure 3.5 for mean ± SEM latency to
return to the herd across the three stages for A, B, and C.
Figure 3.5. Mean (±SEM) latency (seconds) to return to the herd during the runway
test across the three stages (PP, PR and RP) for focal animal A, preferred partner B,
and random individual C.
There were no significant correlations between the repeat test runs of each session for
cattle A, B, or C for the run-way tests.
3.3.3 Heart rates
Focal animals had significantly lower heart rates across the separation period when they
were with their preferred partner (PP) compared to when with a random individual (PR)
(see figure 3.6 and table 3.4). There was no significant difference in heart rates between
focal animal A in stage 1 (PP) and its partners heart rate in stage 3 (RP) (see figure 3.7
and table 3.4), although there was a significant difference between the focal (A) cattle’s
heart rate in stage 2 (PR) and the partners (B) heart rate in stage 3 (RP) (see figure 3.8
0
2
4
6
8
10
12
14
A B C
Mea
n (
±S
EM
) la
ten
cy t
o r
etu
rn t
o t
he
her
d (
secs
)
Cattle A, B and C
PP
PR
RP
NS
NS
NS
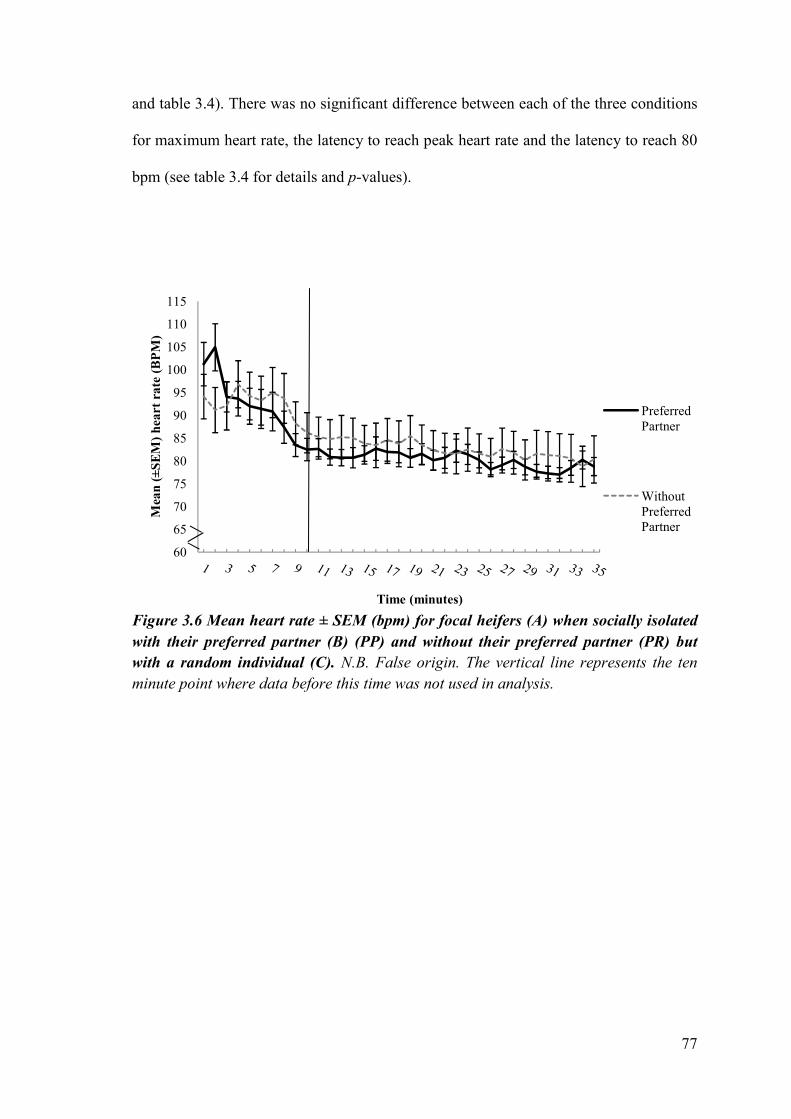
77
and table 3.4). There was no significant difference between each of the three conditions
for maximum heart rate, the latency to reach peak heart rate and the latency to reach 80
bpm (see table 3.4 for details and p-values).
Figure 3.6 Mean heart rate ± SEM (bpm) for focal heifers (A) when socially isolated
with their preferred partner (B) (PP) and without their preferred partner (PR) but
with a random individual (C). N.B. False origin. The vertical line represents the ten
minute point where data before this time was not used in analysis.
60
65
70
75
80
85
90
95
100
105
110
115
Mea
n (
±S
EM
)h
eart
ra
te (
BP
M)
Time (minutes)
Preferred Partner
Without Preferred Partner
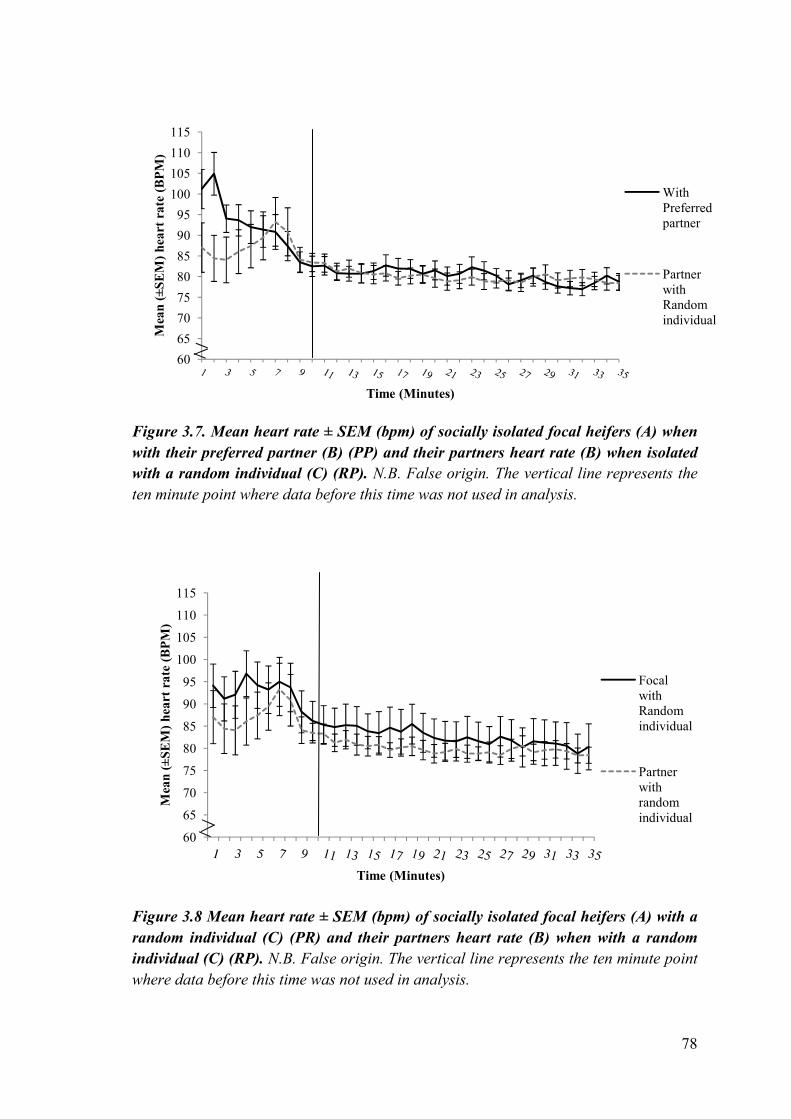
78
Figure 3.7. Mean heart rate ± SEM (bpm) of socially isolated focal heifers (A) when
with their preferred partner (B) (PP) and their partners heart rate (B) when isolated
with a random individual (C) (RP). N.B. False origin. The vertical line represents the
ten minute point where data before this time was not used in analysis.
Figure 3.8 Mean heart rate ± SEM (bpm) of socially isolated focal heifers (A) with a
random individual (C) (PR) and their partners heart rate (B) when with a random
individual (C) (RP). N.B. False origin. The vertical line represents the ten minute point
where data before this time was not used in analysis.
60
65
70
75
80
85
90
95
100
105
110
115
Mea
n (
±S
EM
)h
eart
ra
te (
BP
M)
Time (Minutes)
With Preferred partner
Partner with Random individual
60
65
70
75
80
85
90
95
100
105
110
115
Mea
n (
±S
EM
)h
eart
ra
te (
BP
M)
Time (Minutes)
Focal with Random individual
Partner with random individual
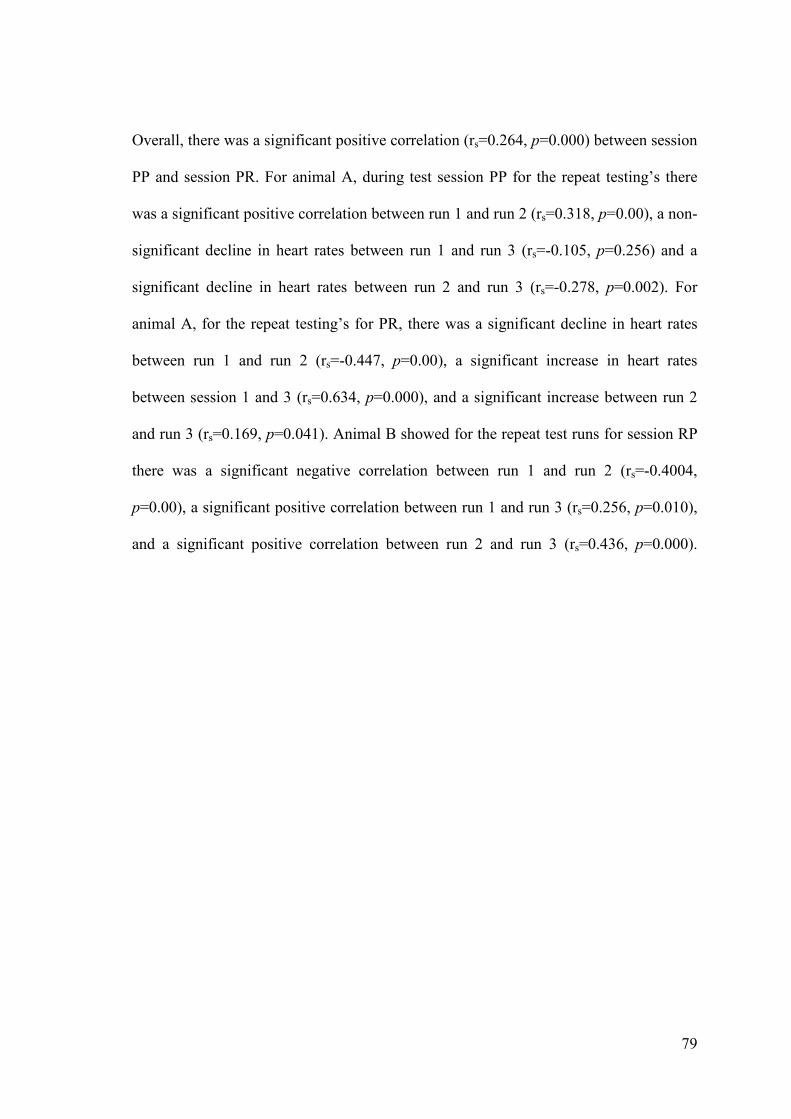
79
Overall, there was a significant positive correlation (rs=0.264, p=0.000) between session
PP and session PR. For animal A, during test session PP for the repeat testing’s there
was a significant positive correlation between run 1 and run 2 (rs=0.318, p=0.00), a non-
significant decline in heart rates between run 1 and run 3 (rs=-0.105, p=0.256) and a
significant decline in heart rates between run 2 and run 3 (rs=-0.278, p=0.002). For
animal A, for the repeat testing’s for PR, there was a significant decline in heart rates
between run 1 and run 2 (rs=-0.447, p=0.00), a significant increase in heart rates
between session 1 and 3 (rs=0.634, p=0.000), and a significant increase between run 2
and run 3 (rs=0.169, p=0.041). Animal B showed for the repeat test runs for session RP
there was a significant negative correlation between run 1 and run 2 (rs=-0.4004,
p=0.00), a significant positive correlation between run 1 and run 3 (rs=0.256, p=0.010),
and a significant positive correlation between run 2 and run 3 (rs=0.436, p=0.000).
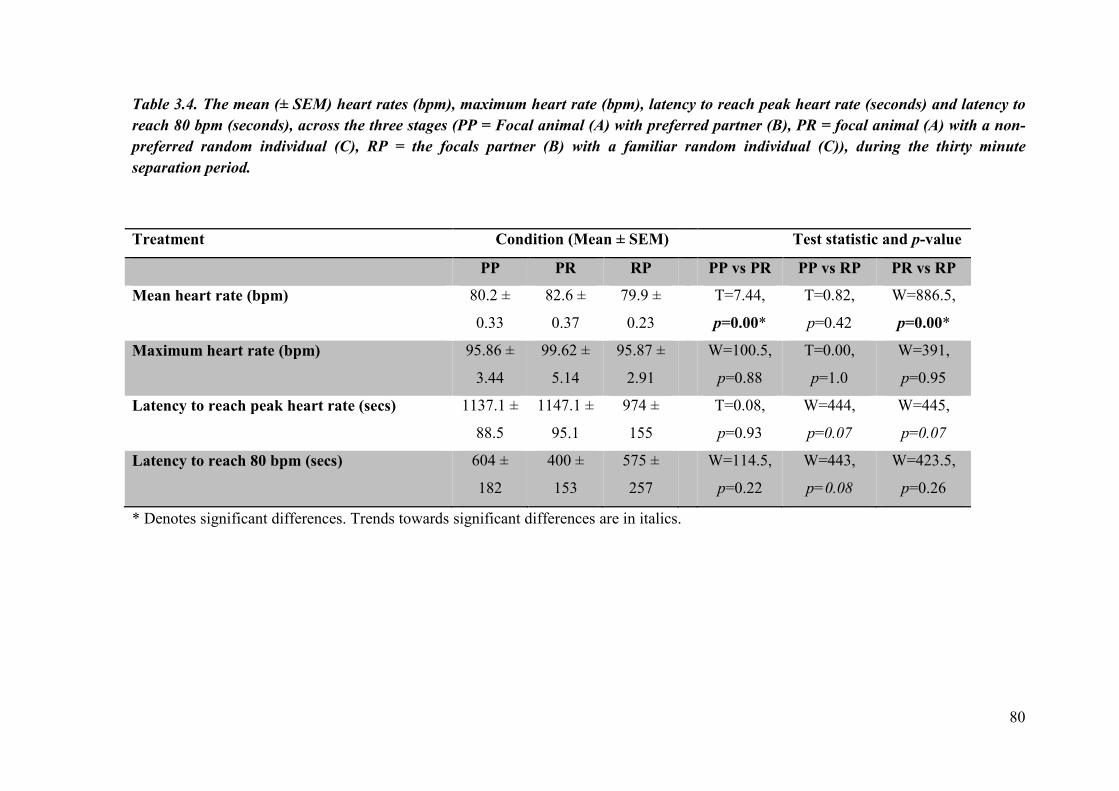
80
Table 3.4. The mean (± SEM) heart rates (bpm), maximum heart rate (bpm), latency to reach peak heart rate (seconds) and latency to
reach 80 bpm (seconds), across the three stages (PP = Focal animal (A) with preferred partner (B), PR = focal animal (A) with a non-
preferred random individual (C), RP = the focals partner (B) with a familiar random individual (C)), during the thirty minute
separation period.
* Denotes significant differences. Trends towards significant differences are in italics.
Treatment Condition (Mean ± SEM) Test statistic and p-value
PP PR RP PP vs PR PP vs RP PR vs RP
Mean heart rate (bpm) 80.2 ±
0.33
82.6 ±
0.37
79.9 ±
0.23
T=7.44,
p=0.00*
T=0.82,
p=0.42
W=886.5,
p=0.00*
Maximum heart rate (bpm) 95.86 ±
3.44
99.62 ±
5.14
95.87 ±
2.91
W=100.5,
p=0.88
T=0.00,
p=1.0
W=391,
p=0.95
Latency to reach peak heart rate (secs) 1137.1 ±
88.5
1147.1 ±
95.1
974 ±
155
T=0.08,
p=0.93
W=444,
p=0.07
W=445,
p=0.07
Latency to reach 80 bpm (secs) 604 ±
182
400 ±
153
575 ±
257
W=114.5,
p=0.22
W=443,
p=0.08
W=423.5,
p=0.26
81
3.3.4 Cortisol
A number of samples were not able to be read effectively and therefore there were a
limited number of replicates in each stage that could be used for analysis. Results for
both animal A and animal B were thus pooled for each stage. From the data that could
be analysed, the results showed that cortisol levels for milk between stage 1 (PP) (2.04
± 5.39 ng/ml) and stage 2 (PR) (1.04 ± 1.60 ng/ml) were not significantly different (Z=
4, p>0.05). Cortisol levels for saliva between stage 1 (PP) (2.84 ± 4.8 ng/ml) and stage 2
(PR) (3.66 ± 5.05 ng/ml) were also not significantly different (T= -2.33, p>0.05).
3.3.5 Production
Total milk yield differed significantly across stages (F=7.28, df=2, p=0.001) with
individuals in stage 3 (RP) having the highest average yield (16.04 ± 0.56 litres), and
individuals in the stage 2 (PR) having the lowest average yield (13.17 ± 0.51 litres)
across the four milking sessions. Yield also differed significantly (F=37.83, df=1,
p=0.000) between focals and their partners with focal cattle having a lower average
yield (12.57 ± 0.35 litres) than their partners (16.35 ± 0.50 litres) across the four
milking sessions. There was no significant interaction affect between the three stages
and between A and B (F=0.01, df=2, p=0.986).
When looking at the effects of separation on A and B, the yield for focal individuals
significantly reduced (W=181.5, p=0.02) when separated with their preferred partner (-
0.67 ± 0.55 litres) compared to when separated with a random individual (0.01 ± 0.37
litres). There was no significant changes in conductivity (W=87.5, p=0.95) and duration
(T=0.61, p=0.55) between stages for A, and there was no significant change in yield
82
(W=28, p=0.132), conductivity (W=44, p=0.94) or duration (W=72, p=0.23) for
individual B between stages.
Conductivity significantly differed (F=8.58, df=1, p=0.004) between focals and their
partners with focals having lower conductivity levels (9.24 ± 0.04mS) than their
partners, (9.46 ± 0.06mS), but did not differ between stages (F=1.75, df=2, p>0.05).
Duration of milking was not significantly different between A and B (F=0.35, df=1,
p>0.05) and was not significantly (F=2.68, df=2, p=0.07) affected by stages, although it
did show a trend to be of longest duration for those in RP (335.9 ± 12.3 secs) and of the
shortest duration in stage PR (300.9 ± 11.3 secs).
3.4 Discussion
3.4.1 The effects of social separation on behaviour, physiology, and
production
The main aim of this research was to investigate the effects of short term social
separation from preferred group mates on the behaviour, welfare and production of
cattle. The general pattern of results confirms social separation to be a psychosocial
stressor for cattle as has been seen in other studies (Boissy & Le Neindre, 1997; Hopster
& Blockhuis, 1994; Müller & Schrader, 2005; Waiblinger et al., 2006). The results also
indicate that certain relationships between dyads appear to be important when providing
social support during this type of stressor but there is also indication that differences
exist between individuals in their ability to cope with social challenges, and this may be
having an impact upon their welfare.
83
3.4.1a Behaviour
During the separation period cattle tended to be relatively inactive standing for the
majority of their time near to the AI pens within the shedding area. This is similar to the
results reported by Boissy & Bouissou (1995) who noted cattle to be relatively
immobile during isolation; however, the inactivity they noted was also positively
correlated with other fear-related reactions previously expressed. Such inactivity in the
current study could suggest that when cattle were separated with a companion they were
relatively unaffected by the stressor. However walking / pacing behaviours along with
vocalisations were also displayed at relatively high frequencies, particularly in the
initial stages of isolation. Together, the activity and passivity behaviours may suggest
that cattle were both motivated to regain contact with their peers and so performed a
number of reinstatement behaviours (Boissy & Bouissou, 1995), but when reunion
attempts were unsuccessful they experienced prolonged bouts of passivity for the
remainder of the separation. This two-stage reaction to such a stressor as social
separation and isolation has previously been referred to as ‘protest’ and ‘despair’
(Hennessy, 1997; Siebert et al., 2011) and has been seen in other species such as
capuchin infants (Byrne & Suomi, 1999) and goats (Siebert et al., 2011) over a two
hour and 30 minute period respectively. Alternatively, these behaviours could be due to
them ‘waiting’ to be released back into the main shed area with the remainder of the
herd. As cattle were used to this area and had experienced a number of very similar
separations when having vet checks, or when having their feet trimmed, they may have
learnt that they will be released back into the main group at some point. However,
correlations between test sessions demonstrated that cattle had not habituated to the
testing area. In practical terms, it is important to be aware of particularly prolonged
bouts of standing still which could be a general sign of depression and cause for concern
84
regarding their welfare and therefore cattle should be checked on a regular basis while
they may be waiting for vets to arrive.
Focal individuals performed higher frequencies of walking / pacing and vocalisation
behaviours (although not significantly different between stages) and significantly higher
frequencies of behaviours suggestive of agitation when they were separated with a
random individual compared to when they were separated with their preferred partner.
This could be suggestive of both the strength of the bond A has with B but also the
potential support that A received from B whilst separated from the remainder of the
herd. In support of this bond, cattle in the preferred partner stage tended to stand in
closer proximity to each other (less than one body length apart) than cattle in the other
two stages. This is similar to the results found by Waiblinger et al. (2006) and Færevik
et al. (2006) who also noted that cattle tended to stay closer to bonded and familiar
individuals, respectively.
3.4.1b Runway test
Latencies to return to the herd after separation have been demonstrated as a moderately
repeatable indicator of the assessment of sociability in dairy cattle and thus could be
suggestive of specific behavioural traits in cattle (Gibbons et al., 2010). Gibbons et al.
(2010) found that cows that had high latencies to reach the end of a runway area had
fewer recordings with two nearest neighbours. In the current study cattle with the
highest latencies to return to the herd were the preferred partner (B) and the random
individual (C) when together (RP). This may be due to a lack of preferred relationship
on both parts and would explain why each B and C had not been previously identified
as having a preferred partner. Furthermore, it may suggest that although B may be A’s
85
preferred partner the relationship may not be reciprocal, in that A may not be B’s
preferred partner.
When the focal animal (A) was with its preferred partner (B), they had a medium
latency to return towards the herd. This result may still be showing the level of
sociability that these cattle had as they were with their preferred partner at the time of
leaving the pen, which was not the case in the study carried out by Gibbons et al.
(2010). In addition, cattle in stage 2 (focal animal A with a random animal C) were
shorter in their latencies to return to the herd than when preferred partnerships (A and
B) were together (stage 1) suggesting that cattle were trying to rejoin their preferred
partner upon release. Interestingly, random cattle (C) who had not been necessarily
identified as having a preferred partner before separation took place, had the shortest
latencies to return to the herd compared to focal animals (A) and their partners (B). This
is contradictory to previous results. There are two possible explanations for this: 1.
random cattle had a preferred partner back in the herd that had not been identified in the
earlier study phases, and 2. they were trying to remove themselves from the other two
individuals. Random cattle were quickest to return to the herd when they were with A,
and although not significantly different, this result was seen in the preferred partners (B)
when they were also with A. This may suggest that A had an impact on the behaviour of
the other two individuals and may have increased their desire to return to the main herd
and remove themselves from A’s presence. It is possible that individual A had a
particular characteristic that meant that she was more likely to be seen with another
individual because she was highly sociable, but along with this came a need to be with
others. This may suggest that focal animals (A) were particularly needy individuals and
may have experienced a higher level of stress than others when separated from the herd.
86
The influence of an individual’s temperament on their social relationships needs
investigating further in order to fully understand its influence on their behaviour. In
addition, as animal A, B and C did not have significant correlations between repeat test
sessions for each condition may suggest that cattle were not consistent in their responses
and so results should be considered carefully.
3.4.1c Heart rates
Social separation also induced a physiological response by means of changes in the
heart rate of cattle, as seen in other studies (Boissy & Le Neindre, 1997; Færevik et al.,
2006; Hopster & Blockhuis, 1994; Hopster et al., 1995; Stěhulová et al., 2008). In line
with the behavioural results, focal individuals appeared to cope better with the social
separation when they were with their preferred partner. Although the difference in heart
rates between stage 1 (PP) and stage 2 (PR) were small, they were significantly different
across time with focals (A) having a lower heart rate when they were with their
preferred partner (B) compared to when with a random individual (C). Interestingly the
partner’s (B) heart rates were significantly lower than the focal’s (A) heart rate when
both were with a random individual (C), and although not significant the partners’ (B)
heart rates were lower when they were with a random individual (C) compared to the
focal’s (A) heart rate when they were separated with its preferred partner (B). These
results suggest that some individuals respond to the same stressor at a higher level than
others and that they may be more heavily reliant upon social contact and social support
than their partners. It may be that partners perceived the stress of the separation
differently than focals and therefore the emotional and physiological reaction differed
between individuals. This would support the possibility of focal animals being
87
particularly ‘needy’ individuals as was considered for the runway test. The use of heart
rate variability in future observations may help to identify these differences.
Positive correlations between stages 1 (PP) and stage 2 (PR) demonstrate that cattle had
not habituated to the testing area but that cattle were responding to the condition that
they found themselves in. The correlations between repeat testing’s within stages would
also suggest that cattle had not habituated to the testing area as there were differences
between repeats within stages. Furthermore these results suggest that the non-
randomising of the order in which cattle experienced conditions did not have an effect
on the results.
3.4.1d Cortisol
Within this study as in others (Verkerk et al., 1998; Waiblinger et al., 2006) cortisol
levels were either not affected by the stress experienced or there was a failure to detect
the level of change elicited by the ELISA kits. Although other studies have found milk
to be a reliable indicator of cortisol concentrations in blood and that mammary uptake
of cortisol from the blood is almost instantaneous (Termeulen et al., 1981), the assay
used for analysis was not specifically designed for cattle or for milk samples. It was
however able to pick up levels in both milk and saliva suggesting its sensitivity range
was adequate. Alternatively, it may be that the short term separation was not perceived
to be a big enough stressor to threaten the metabolism of the body and so did not elicit a
change in the HPA axis (Mormède et al., 2007). In contrast, social isolation has been
found to increase cortisol levels significantly in pigs, although the increase depended
upon the different coping strategies employed by individuals with reactive pigs having a
higher increase in saliva cortisol levels than proactive pigs (Ruis et al., 2001). It should
88
be noted that cattle in this study would have been familiar with the separation area and
would have experienced similar separations from the group before. As such this may
have allowed individuals to adapt to the situation and adjust their maintenance levels so
that noticeable changes in stress responses may not have been detected due to their
coping ability (Mormède et al., 2007).
3.4.1e Production
Production differed significantly across stages with individuals in stage 3 (RP – B and
C) having the highest average yield and individuals in stage 2 (PR - A and C) having the
lowest average yield. This would suggest that when focal animals are with a random
individual their yield along with the random individual’s is reduced. This would tie in
with previous results suggesting that animal C’s response was impacted by animal A.
However, in contrast to what might be expected for focal individuals, their yield
significantly decreased when they were separated with their preferred partner compared
to when they were with random individuals. For focal animals, there are two potential
explanations for such results: 1) the separation that took place with their preferred
partners was likely the first time separation of this nature had occurred and therefore
this may have been the initial response to the separation; 2) focal individuals (A) had
significantly lower milk yields than individuals B in general and therefore this could
have been affecting the results between stages, although there was no significant
interaction effects between stages and individuals A and B.
Electrical conductivity (EC) was significantly different between focals and their
partners with focals having a lower EC level. EC did not differ significantly between
stages. EC of milk is often used to monitor mastitis levels (Norberg, 2005). Mastitis
89
infections are influenced by high levels of bacteria which are often observed in animals
that are experiencing stress (Verbrugghe et al., 2012). Marsland et al. (2002) note that
stress can impact upon immune reactivity and can potentially cause susceptibility to
infections. This is in contrast to focal animal A in that it would suggest that animal A
was not particularly under high levels of stress. However, it would link in with the
potential impact that focal animals (A) may have been having on their partners (B). As
animal A was the focal animal observed, they may have been responsible for the
relationship and if it was not mutual, the continual presence of A may have been
affecting the health and welfare of B.
3.4.2 Social support
Focal cattle showed better coping abilities with the social separation stressor when they
were supported by their preferred partner through a reduced stress response. However,
the overall response to the separation did not appear to be particularly heightened in
comparison to other studies where cattle have been completely isolated (Boissy & Le
Neindre, 1997). It would appear that when cattle are separated with a companion they
are able to receive social support from an alternative attachment figure other than their
preferred partner. As both cattle were familiar to the focal individual the support
provided by each of them attenuated the depressive response often seen when cattle
have been completely isolated. Such alternative attachments have been seen in infant
bonnet macaques when they were separated from their mother, a highly stressful
experience; if they retained alternative attachment figures to their mother during the
separation they showed fewer behavioural signs of depression (Boccia et al., 1997).
90
The ability to provide and receive social support may be influenced by a number of
factors including an individual’s identity, whether they are familiar or not, the
emotional state of both provider and receiver, and the ontogeny of the relationship at an
individual level and at a dyad level (Rault, 2012). As an animal matures the
relationships they form with others and their social behaviour may change and therefore
their support mechanisms may also change (Hennessy et al., 2006). For example
Hopster et al. (1995) noted that multiparous cows were only mildly affected by the
removal of their calves. As the majority of focal and partner cattle were heifers, this
may indicate the potential dependence of younger individuals on their social
environment for support at a time of stress. Furthermore, the mixing of multiparous and
primiparous cattle has been shown to result in the disruption of grazing and social
behaviour which subsequently leads to a reduced milk yield (Phillips & Rind, 2001).
This may provide some explanation as to why random individuals which were more
often than not multiparous did not provide as much support as the focals preferred
partners which were at similar ages to themselves.
Provision of support or social buffering has been found to be costly. Langer et al.
(2009) found that partners that were supporting and buffering human patients suffering
with cancer reported adverse psychological outcomes. It is therefore possible that the
provision of the support itself may result in adverse effects on the cattle that are
providing the support to those that do not cope as well and this may explain some of the
results observed in this study.
91
3.4.3 Individual differences
Cattle have been found to show consistent and repeatable responses both behaviourally
and physiologically to a number of tests such as isolation, suggesting that they retain
individual characteristics (Hopster & Blockhuis, 1994; Müller & Schrader, 2005;
Schrader, 2002). An individual’s genetics and environmental and early-rearing
experiences can affect individual coping abilities and subsequently could affect their
welfare when faced with stress. Broom & Leaver (1978) found differences in the social
skills of isolation-reared and group-reared calves with isolation-reared calves spending
more time alone than group-reared calves and isolation-reared individuals both
initiating and receiving more negative social interactions when exposed to a social
environment. Additionally, Purcell & Arave, (1991) found that group-reared calves took
longer to complete a maze and showed higher stress levels when separated from
conspecifics, thus isolation-reared calves may cope better with separation from the herd
due to their lack of social skills. As there is a legal requirement (EU directive
97/2/EEC) within the UK to keep calves in contact with other calves from eight weeks
of age, it would be expected that there would be a higher susceptibility to stress caused
by isolation within the dairy industry.
Animals also tend to develop their own coping style which is often expressed through
differences in behavioural and physiological stress responses, similar to those seen in
the current study. This difference results from an individual’s cognitive evaluation of
the triggering stressor (Boissy et al., 2001; Veissier & Boissy, 2007). Proactive
individuals tend to try and remove themselves from stressors and have a tendency to
develop routines and anticipate situations (Ruis et al., 2001). These animals are
predominantly influenced by the sympathetic nervous system (Koolhaas et al., 1999)
92
affecting physiological parameters such as heart rates, as was seen in focal individuals.
Reactive animals appear to aim to reduce the emotional impact of the stressor and thus
tend to adapt more easily to variable conditions (Ruis et al., 2001) and are predominated
by the parasympathetic nervous system (Koolhaas et al., 1999). These different coping
styles can impact upon the animal’s emotional reactivity to their environment and
certain stressors both in magnitude and duration (Ruis et al., 2001) and may explain
some of the differences in response of cattle to the separation carried out in the current
study. More importantly the long term consequences of stress such as reduced immunity
as resources are used elsewhere (Moberg & Mench, 1999), may become more of an
issue for those individuals that cannot adapt as well as others and thus these particular
individuals may be at more of a risk for poor welfare. Further research is required to
look at the longer term effects of such different coping styles and how cattle respond to
everyday husbandry practices and to consider the potential breeding of fewer proactive
individuals.
3.4.4 Practical implications
There are a number of practical implications to this study. When separating individuals
for a short period of time, providing them with a companion is advised. It appears that
both a preferred partner and a non-preferred companion can provide some form of
support. It is important however to observe all individuals within the holding pen on a
regular basis for any adverse effects of the separation. In particular, animals that may be
showing signs of excessive inactivity may be of some concern as they may be
experiencing a high level of fear and so should be handled with care.
93
There is also the possibility that some highly sociable cattle may have adverse effects
on the well-being of others around them. Care needs to be taken when housing and
grouping individuals together. The temperament of individuals should be considered
where possible. Stable and consistent groupings will ensure that animals pair with those
individuals that are able to cope with their relationship. As a conspecific can also help
another increase their learning ability, pairing individuals together will ensure that cattle
are habituated quickly to their routine and any changes within their environment will be
more easily dealt with.
These results were however observed in younger cattle due to their higher level of
association with others. It may be that younger cattle need extra time and higher
consideration when settling in the herd and the provision of support may be more
important to them at this time due to the high stress levels they are likely to be
experiencing when first entering the main milking herd.
3.5 . Conclusions
In summary, there appears to be a complex relationship involving a number of factors
that influence the kind of effects that short term separation can have on individual cattle.
Short term separation in itself did produce a stress response within cattle, although the
results have highlighted some individual differences within responses. Results also
indicate that previously identified bonds between dyads were important with regards to
providing support as responses for both behaviour and physiology were lessened by the
presence of a preferred partner when compared to a familiar individual. Furthermore,
these bonds can be confirmed and quantified as significant due to the element of support
94
demonstrated. However, there appears to be a potentially negative effect on the
individuals that are providing support to other cattle and this needs further investigation.
95
Chapter Four
The Effects of Long Term Separation from
Preferred Groups Mates, and Subsequent
Reunion, on Behaviour, Production and Health
Parameters in Dairy Cattle
96
4.1 Introduction
In chapter two it was demonstrated that dairy cattle housed in commercial conditions
were able to form preferential partnerships. In particular, heifers spent significantly
more time with at least one other group member than was expected by chance. Chapter
three further demonstrated that these preferential partnerships appeared to be important
to cattle when experiencing short term separation, by providing a form of social support
during this stressor. Both behavioural and physiological responses to the short term
separation stressor were reduced by the presence of a preferred partner. This suggested
that partners offered the opportunity to enhance an individual’s ability to cope with their
environment compared to another familiar non-preferred conspecific. In order to fully
understand and appreciate the value of these bonds to cattle it was necessary to
investigate the longevity of the relationship. Furthermore, it was necessary to
investigate how these preferential relationships may be affected by long term
separation. A higher number of dyads than would be expected by chance were only seen
together once suggesting that for some cattle they did not have a preferential
relationship with another member of the group. Therefore factors such as long term
separation may be influencing this and thus needed investigating.
4.1.1 Long term separation and stress
Under commercial conditions, the most likely cause of long term separation is during
regrouping, which can be a period of extreme stress and cause significant effects on
health, behaviour, productivity and welfare in dairy cattle (de Groot et al., 2001;
Dobson & Smith, 2000; Hagnestam-Nielsen et al., 2009; von Keyserlingk et al., 2008).
Previous investigations on regrouping have often focused upon the introduction and
97
mixing of cattle, observing how both the introduced and resident cattle of the group
respond to the changes in their social environment. Animals entering the herd have been
observed to receive the majority of aggressive acts from resident animals (Alexander &
Irvine, 1998; Beilharz & Zeeb, 1982; Mench et al., 1990). This aggression is likely to
continue until a stable hierarchy has been founded, which may take anywhere from 15
days to 13 weeks (Hasegawa et al., 1997; Mench et al., 1990). Often, there is a decrease
in time spent feeding as displacements at the feed barrier increase, and time spent
resting is reduced (Hasegawa et al., 1997; von Keyserlingk et al., 2008). Consequently,
milk production is affected (Hasegawa et al., 1997; Phillips & Rind, 2001) as energy
required for milk production is transferred elsewhere to enable the individual to cope
with the challenges in their environment (Moberg & Mench, 2000). In addition, higher
levels of cortisol are often seen in individuals entering the herd suggesting a higher
level of stress in these animals and thus a reduced welfare status (Hasegawa et al., 1997;
Mench et al., 1990; von Keyserlingk et al., 2008). The potential for a companion to
provide support during regrouping has already been demonstrated with integration into
the herd being eased by the presence of a conspecific at that time (Gygax et al., 2009;
Neisen et al., 2009b).
During regrouping not only are cattle introduced into a new group with unfamiliar
individuals, they also are potentially separated from their bonded partner. This aspect
has not been fully considered to date. The breaking of a social bond through separation
evokes an emotional response that often manifests itself through an increase in
reinstatement behaviours such as escape attempts and vocalisations as was seen in the
chapter three, in agreement with Boissy & Le Neindre (1997). This strong emotional
response at the beginning of the separation period generates an acute stress response
98
resulting in physiological as well as behavioural changes, as was documented in chapter
three. Prolonged bouts of separation from bonded partners can lead to signs of poor
psychological well-being and a depressed immunity (Boccia et al., 1997; Gordon et al.,
1992) leading to a reduced welfare status. On the other hand, animals have been seen to
adapt to long term separation from bonded partners, with the stress response subsiding
after time and routine activities being resumed (Newberry & Swanson, 2001). The
ability to adapt to the separation and resume routine activities is an important
consideration for animal welfare, although the context that this can occur in needs to be
investigated.
4.1.2 The effects of reunion after separation
Due to the nature of regrouping (the mixing of individuals into a new group with or
without their preferred partner), there may also be times when cattle previously
separated from their preferred partner are reunited (after a period of separation preferred
partners are joined back together). It is unclear however whether a bond previously
formed is remembered after a long period of separation, and if so, whether reunion with
a preferred partner within the group at the time of regrouping is enough to provide
support at this time.
The separation of a calf from its mother results in a behavioural response suggestive of
stress in both parties; however upon reunion of the bonded pair this response is reduced
in both mother and calf (Sandem & Braastad, 2005; Solano et al., 2007). This would
suggest that the bond had not been broken and cattle recognised and remembered their
young. This was after 4 days of being together (Sandem & Braastad, 2005) and with
fence line contact after 90 days of being together (Solano et al., 2007). Conversely, in
99
cows and also goats, if mothers are separated from their young for 24 hours after five
minutes of contact immediately postpartum, upon reunion with their offspring mothers
reject their young which is suggestive that the mother-young bond had not been
established in that initial short period (Hudson & Mullord, 1977; Ramírez et al., 1996).
The separation periods outlined in the studies above were fairly short compared to how
long cattle are likely to be apart when regrouped before reunion occurs. To the best of
the author’s knowledge, evidence for the effects of long term separation (two weeks or
more without repeated regrouping) has not been reported in cattle. When considering
other species, juvenile rhesus monkeys that experienced 18 weeks of separation from
their natal group before being reunited had a lower health status with a reduced
immunity and reduced weight gain compared to controls which had remained in the
group (Gordon et al., 1992). Upon reunion with their natal group, cortisol levels rose in
both the reintroduced and the resident animals, with reintroduced individuals having a
higher level than resident individuals (Gordon et al., 1992). This demonstrates that both
introduced and resident animals are affected by changes in their social groupings and
also that the bonds that may have been previously formed within the group were broken
after such a long period of separation. Furthermore, limited support was offered by the
group upon reinstatement of previous group members.
In order to fully understand and appreciate the value of social bonds in cattle, a better
understanding of the effects of long term separation without an element of regrouping or
mixing at that moment in time, is required. Furthermore, the ability for a previously
identified preferred partner to provide support to an individual at a time of regrouping
after separation has occurred is also required. As demonstrated previously in chapter
100
three, preferred partners have a particular ability to reduce the stress response in focal
cattle during short term isolation from the herd, more so than a familiar but non-
preferred partner. What is not clear is whether a period of long term separation will
have a negative impact upon the preferential relationship and reduce its ability to
provide a form of social support at the time of regrouping. Therefore, the main aim of
this part of the study was to investigate the effects of a long period (two weeks) of
separation from an identified preferred partner on the behaviour, production and health
parameters of cattle, whilst still maintaining a stable group membership, for example no
new individuals introduced. In addition, the influence of a previously identified
preferred partner upon an individual’s ability to cope with an environmental stressor
was investigated by examining the behaviour, production and health of cattle at the time
of regrouping when reunion occurred.
4.2 Materials and methods
4.2.1 Housing area, animals and management
Farm A
As the previous studies had highlighted younger individuals as having a stronger bond,
67 Holstein-Friesian replacement heifers and calves on farm A were observed between
Jan 2011 and November 2011. Cattle ranged in age from 4-30 months and all animals
were housed in loose straw yards at Arthingworth Farm, Leicestershire, UK. Ten focal
animals were randomly (through a random number generation on Microsoft Excel 7.0)
selected where possible from each of the existing groups so that a range of ages and
grouping experiences were represented. Due to commercial constraints, focal animals
had to be chosen from existing groups so could not be matched for age or size between
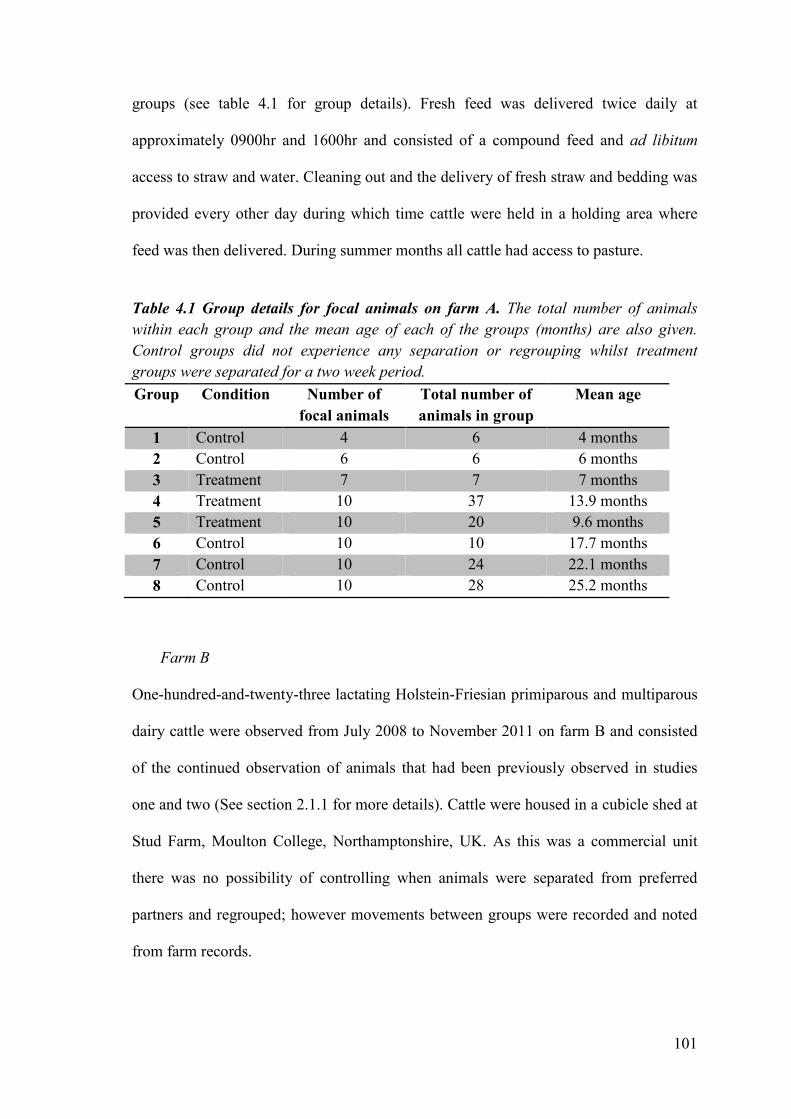
101
groups (see table 4.1 for group details). Fresh feed was delivered twice daily at
approximately 0900hr and 1600hr and consisted of a compound feed and ad libitum
access to straw and water. Cleaning out and the delivery of fresh straw and bedding was
provided every other day during which time cattle were held in a holding area where
feed was then delivered. During summer months all cattle had access to pasture.
Table 4.1 Group details for focal animals on farm A. The total number of animals
within each group and the mean age of each of the groups (months) are also given.
Control groups did not experience any separation or regrouping whilst treatment
groups were separated for a two week period.
Group Condition Number of
focal animals
Total number of
animals in group
Mean age
1 Control 4 6 4 months 2 Control 6 6 6 months 3 Treatment 7 7 7 months 4 Treatment 10 37 13.9 months 5 Treatment 10 20 9.6 months 6 Control 10 10 17.7 months 7 Control 10 24 22.1 months 8 Control 10 28 25.2 months
Farm B
One-hundred-and-twenty-three lactating Holstein-Friesian primiparous and multiparous
dairy cattle were observed from July 2008 to November 2011 on farm B and consisted
of the continued observation of animals that had been previously observed in studies
one and two (See section 2.1.1 for more details). Cattle were housed in a cubicle shed at
Stud Farm, Moulton College, Northamptonshire, UK. As this was a commercial unit
there was no possibility of controlling when animals were separated from preferred
partners and regrouped; however movements between groups were recorded and noted
from farm records.
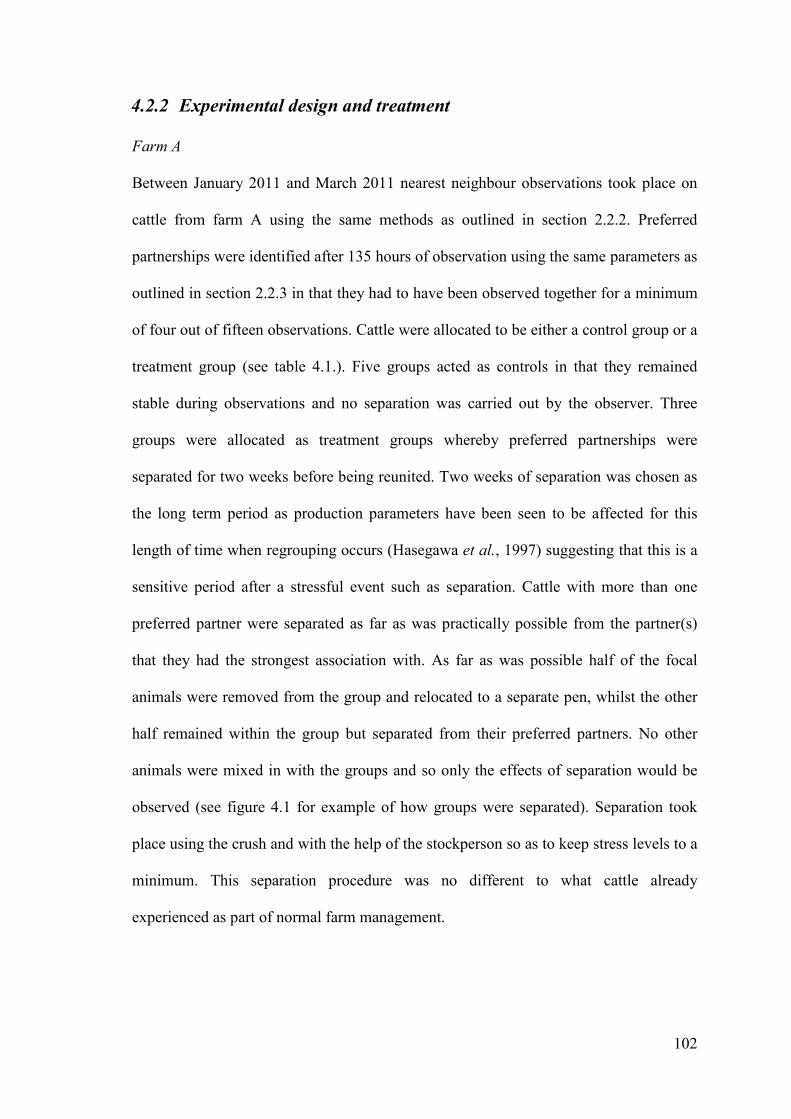
102
4.2.2 Experimental design and treatment
Farm A
Between January 2011 and March 2011 nearest neighbour observations took place on
cattle from farm A using the same methods as outlined in section 2.2.2. Preferred
partnerships were identified after 135 hours of observation using the same parameters as
outlined in section 2.2.3 in that they had to have been observed together for a minimum
of four out of fifteen observations. Cattle were allocated to be either a control group or a
treatment group (see table 4.1.). Five groups acted as controls in that they remained
stable during observations and no separation was carried out by the observer. Three
groups were allocated as treatment groups whereby preferred partnerships were
separated for two weeks before being reunited. Two weeks of separation was chosen as
the long term period as production parameters have been seen to be affected for this
length of time when regrouping occurs (Hasegawa et al., 1997) suggesting that this is a
sensitive period after a stressful event such as separation. Cattle with more than one
preferred partner were separated as far as was practically possible from the partner(s)
that they had the strongest association with. As far as was possible half of the focal
animals were removed from the group and relocated to a separate pen, whilst the other
half remained within the group but separated from their preferred partners. No other
animals were mixed in with the groups and so only the effects of separation would be
observed (see figure 4.1 for example of how groups were separated). Separation took
place using the crush and with the help of the stockperson so as to keep stress levels to a
minimum. This separation procedure was no different to what cattle already
experienced as part of normal farm management.
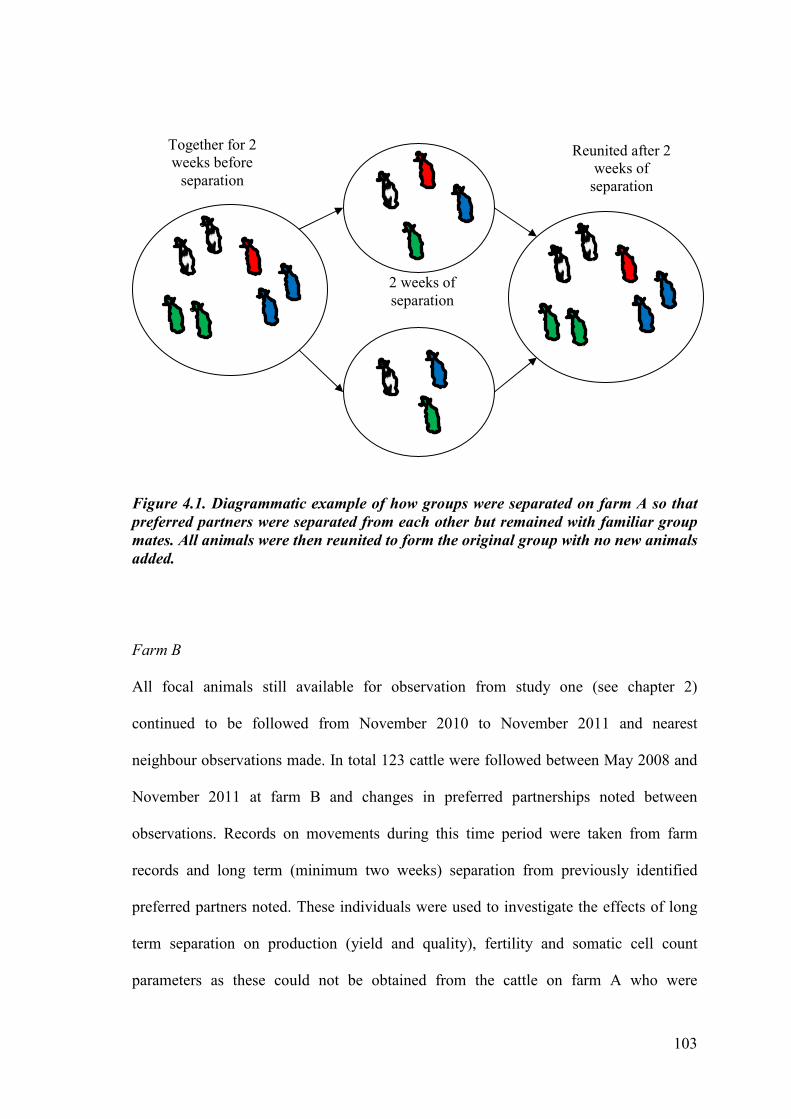
103
Figure 4.1. Diagrammatic example of how groups were separated on farm A so that
preferred partners were separated from each other but remained with familiar group
mates. All animals were then reunited to form the original group with no new animals
added.
Farm B
All focal animals still available for observation from study one (see chapter 2)
continued to be followed from November 2010 to November 2011 and nearest
neighbour observations made. In total 123 cattle were followed between May 2008 and
November 2011 at farm B and changes in preferred partnerships noted between
observations. Records on movements during this time period were taken from farm
records and long term (minimum two weeks) separation from previously identified
preferred partners noted. These individuals were used to investigate the effects of long
term separation on production (yield and quality), fertility and somatic cell count
parameters as these could not be obtained from the cattle on farm A who were
Together for 2 weeks before
separation
2 weeks of separation
Reunited after 2 weeks of
separation
104
replacement stock only. To qualify for long term separation analysis, previously
identified dyads had to have been separated for a minimum of two weeks without being
reunited with each other at any point within these two weeks. In order to qualify for
reunion analysis previously identified partnerships had to have been separated for a
minimum of two weeks before being reunited. Only the first reunion of a pair was
considered as new partners may have been identified after this time (see figure 4.2 for
example).
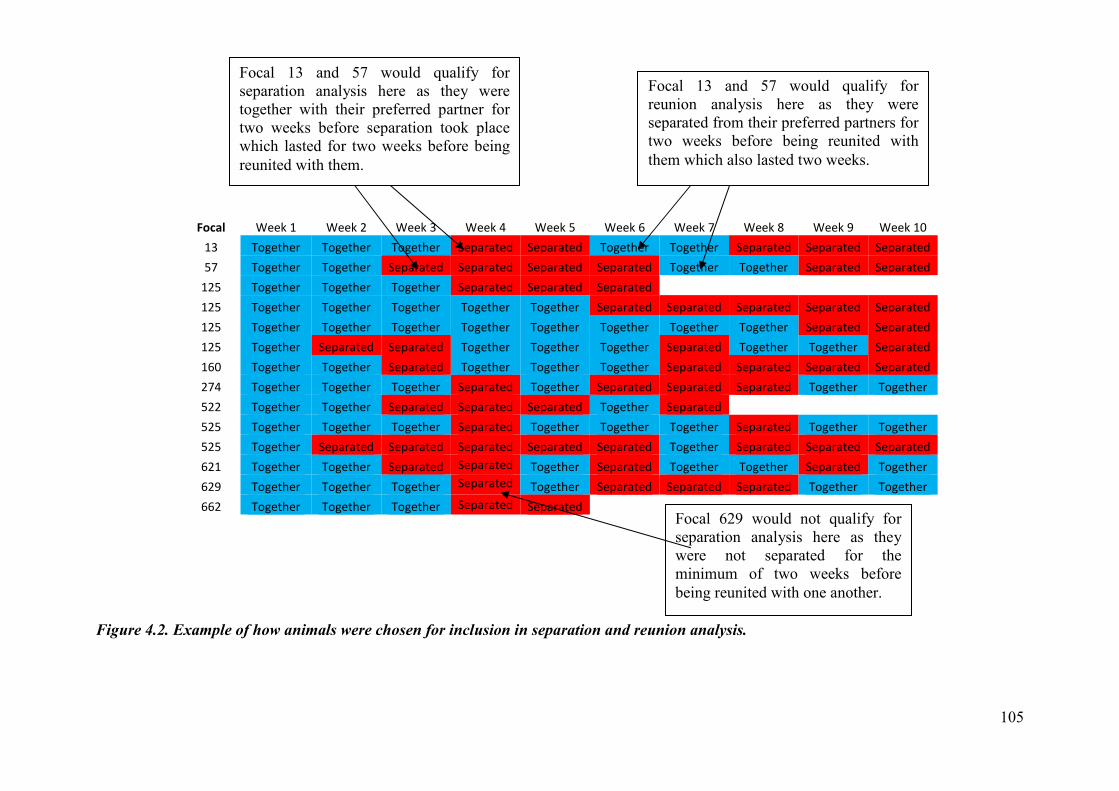
105
Focal Week 1 Week 2 Week 3 Week 4 Week 5 Week 6 Week 7 Week 8 Week 9 Week 10
13 Together Together Together Separated Separated Together Together Separated Separated Separated
57 Together Together Separated Separated Separated Separated Together Together Separated Separated
125 Together Together Together Separated Separated Separated
125 Together Together Together Together Together Separated Separated Separated Separated Separated
125 Together Together Together Together Together Together Together Together Separated Separated
125 Together Separated Separated Together Together Together Separated Together Together Separated
160 Together Together Separated Together Together Together Separated Separated Separated Separated
274 Together Together Together Separated Together Separated Separated Separated Together Together
522 Together Together Separated Separated Separated Together Separated
525 Together Together Together Separated Together Together Together Separated Together Together
525 Together Separated Separated Separated Separated Separated Together Separated Separated Separated
621 Together Together Separated Separated Together Separated Together Together Separated Together
629 Together Together Together Separated Together Separated Separated Separated Together Together
662 Together Together Together Separated Separated
Figure 4.2. Example of how animals were chosen for inclusion in separation and reunion analysis.
Focal 13 and 57 would qualify for separation analysis here as they were together with their preferred partner for two weeks before separation took place which lasted for two weeks before being reunited with them.
Focal 13 and 57 would qualify for reunion analysis here as they were separated from their preferred partners for two weeks before being reunited with them which also lasted two weeks.
Focal 629 would not qualify for separation analysis here as they were not separated for the minimum of two weeks before being reunited with one another.
106
4.2.3 Measurements
4.2.3a Behaviour before, during and after separation
In order to assess the impact of long term separation from preferred group mates on the
behaviour and welfare of cattle, a total of 88 hours of behavioural observation took
place on farm A. Treatment groups were observed on a rotational basis and observed
throughout the day (0800 – 1800hr), for two and a half days a week for six weeks. This
allowed all treatment focal animals to be observed five to seven times throughout the
observation period in ten minute sampling blocks. Observations were carried out two
weeks before animals were separated, for two weeks during separation, and for two
weeks after separation, between March 2011 and April 2011. This allowed for any
changes resulting from both separation and reunion to be monitored. Observations were
only recorded for those three groups which underwent separation using the behaviours
outlined in table 4.2, focals acted as their own controls between time periods to account
for individual variation in behaviour. Instantaneous focal animal sampling at 2 minute
intervals for a total of ten minutes per group was employed. The two minute interval
was chosen as this was the average time it would take to note down the behaviour and
position of all focals in the group. Event behaviours (see table 4.2) were recorded on an
ad libitum basis. The observer remained outside of the group in a position that would
not disturb the cattle from carrying out their normal daily behaviours; however cattle
may have been disturbed by normal daily routines carried out by the stockperson and
this could not be controlled for.
107
Allogrooming behaviour has been considered an important aspect in the maintenance of
social relationships and has been used as an indicator of preferential bonds in cattle
(Sato et al., 1993; Val-Laillet et al., 2009). It generally occurs at a relatively low rate in
cattle under commercial conditions (Takeda et al., 2000; Val-Laillet et al., 2009) and so
was not used to assess relationships in study one. Allogrooming is a socio-positive
behaviour and known to have a calming effect on those receiving the grooming (Laister
et al., 2011) suggesting that it provides a positive affective state and so should be
considered when observing positive behaviour in cattle, hence its inclusion in this part
of the study. By recording this behaviour it was also possible to investigate the
longevity of the bond, and how long term separation would affect this positive
behaviour.
Table 4.2 Behavioural ethogram for instantaneous focal sampling during long term
separation from, and reunion of, preferred group mates.
Behaviours Alert Head up, ears forward facing to direction of interest. Drink Taking in water through the lips or with the tongue into the mouth. Eat Feeding on either straw in round bale or concentrate feed at feeder. Investigate Explore surroundings, through sniffing and touching with nose Lying Lying in sternal or lateral recumbency Negative social Push, head butt, chase, or displace another individual Positive social Licking another cow, chin resting on another individual Standing Fully upright position with a relaxed posture; may or may not be
chewing cud. Vocalise One long or several short calls Walking
Four beat motion in a forward direction
Events Negative social As above Positive social As above
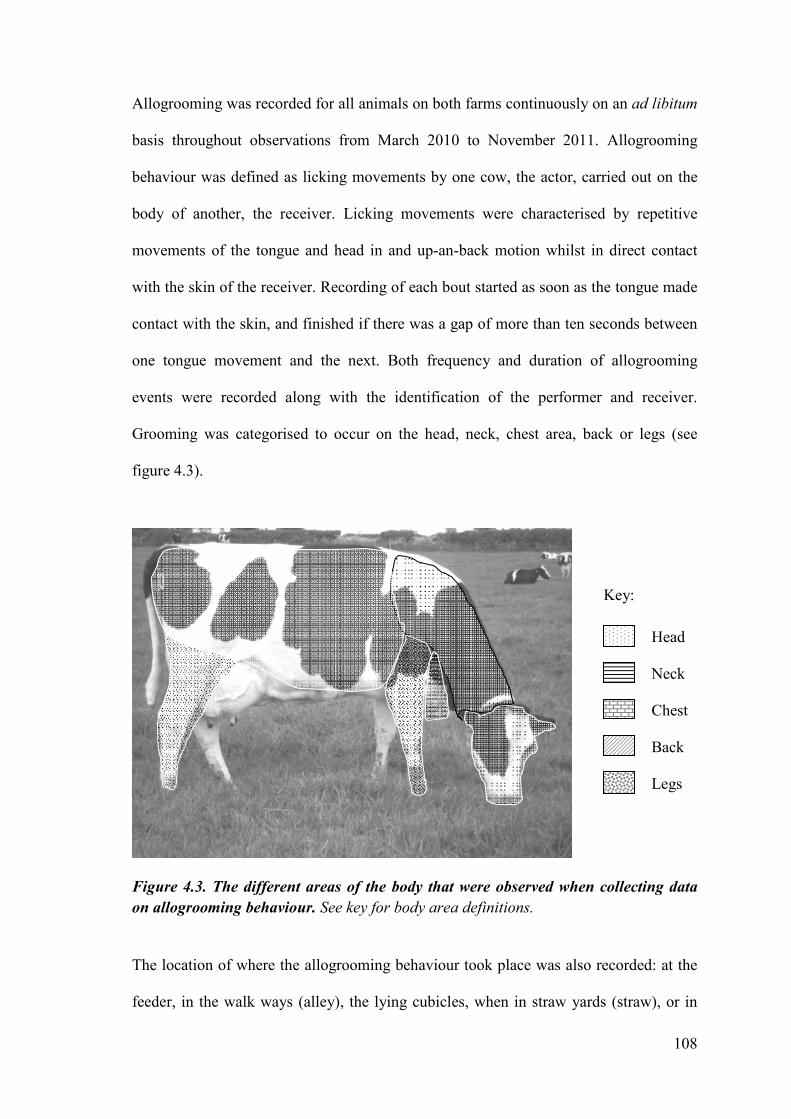
108
Allogrooming was recorded for all animals on both farms continuously on an ad libitum
basis throughout observations from March 2010 to November 2011. Allogrooming
behaviour was defined as licking movements by one cow, the actor, carried out on the
body of another, the receiver. Licking movements were characterised by repetitive
movements of the tongue and head in and up-an-back motion whilst in direct contact
with the skin of the receiver. Recording of each bout started as soon as the tongue made
contact with the skin, and finished if there was a gap of more than ten seconds between
one tongue movement and the next. Both frequency and duration of allogrooming
events were recorded along with the identification of the performer and receiver.
Grooming was categorised to occur on the head, neck, chest area, back or legs (see
figure 4.3).
Figure 4.3. The different areas of the body that were observed when collecting data
on allogrooming behaviour. See key for body area definitions.
The location of where the allogrooming behaviour took place was also recorded: at the
feeder, in the walk ways (alley), the lying cubicles, when in straw yards (straw), or in
Key: Head
Neck
Chest
Back
Legs
109
the field. A small number of bouts were also recorded at the drinking trough and in the
holding pen but due to lack of data in these areas they were removed from analysis.
4.2.3b Production
In order to investigate the effects of long term separation from preferred group mates on
production, both yield and quality parameters were assessed. Furthermore, the impact of
reunion and regrouping was also assessed by investigating the changes that occurred in
production. Production is often affected by stress as energy is diverted to biological
functions that are required more than milk production (Moberg & Mench, 2000) and so
this can be used as part of a welfare assessment of cattle.
Yield
Individual milk yield (litres) was automatically collected by Crystal, Fusion Electronics
BV (Fullwood Packo Group, The Netherlands) at each milking (am and pm) for cattle
on farm B. The Crystal software automatically records a number of management factors
such as activity levels and milk yield at each milking. The milk monitoring system
employed is capable of measuring milk yields, conductivity, and temperature. This
information was stored on a database within the farm’s network and could be accessed
to obtain the required information. Data was downloaded from farm records on a
monthly basis and transferred to Microsoft Excel 7.0 so that it could be arranged into
the required format for data analysis and where it could be checked for abnormalities.
Four weeks of milk yield data before the date of separation or reunion and up to four
weeks after the date of separation and reunion was used for analysis where possible.
This was to assess the extent of the change as previous observations have reported
110
effects lasting between two (Hasegawa et al., 1997) and six weeks (Phillips & Rind,
2001). Furthermore this would relate to the monthly milk quality reports.
Quality
Milk quality parameters were collected and analysed on a monthly basis by the National
Milk Records (NMR). NMR supply milk recording services to a large proportion of the
UK’s dairies and is responsible for recording individual cow performance and
information on production that can be used by producers to improve their management
of cattle (National Milk Records, 2012). These records came in a paper format and were
copied into Microsoft Excel 7.0 so that they could be used for analysis. The monthly
records for focal individuals before they were separated from or reunited with their
preferred partner, were collected and compared to the monthly records from after
separation, or on reunion.
4.2.3c Health parameters
There is a clear relationship between health and welfare in animals (Hughes & Curtis,
1997). It must however be remembered that health is not just the absence of disease; an
individual that is able to use its biological resources to remain healthy is unlikely to be
under any form of distress (Moberg & Mench, 2000). By assessing the impact that long
term separation and reunion may have on the health of individuals will augment the
ability to evaluate the impact that it may be having on the cattle’s welfare.
111
Body condition score and weight
Body condition score (BCS) was recorded on a monthly basis for 86 animals in total
using the chart by Edmonson et al. (1989) for body condition scoring Holstein’s. Body
condition is used by producers to assess the health status of their animals on a regular
basis, and so this was used for mature animals to represent this management technique.
Cattle on farm A were weighed (kg) as part of regular management approximately every
month and so weights were recorded from farm records between the periods Jan-April
2011 and Sept-Nov 2011 for all focal animals. The weight recordings were however
more accurate, especially for rearing stock that may be differing in their conformation
as they grow and so body condition scoring was not appropriate to use for these
individuals.
Somatic cell count and fertility
Somatic cell count and fertility measures were collected on a monthly basis by the
NMR. As for milk quality parameters, these records were transferred to Microsoft Excel
7.0 so that they could be formatted for use in analysis. The monthly records for focal
individuals before they were separated from or reunited with their preferred partner,
were collected and compared to the monthly records from after separation or reunion.
These two parameters were chosen due to their link with health and welfare (Cutullic et
al., 2012; Dobson et al., 2001; Verbrugghe et al., 2012).
4.2.4 Statistical analysis
All statistical analysis was carried out using Minitab version 13.20 and data presented
as means ± SEM unless where otherwise stated. For all statistical analyses a
significance level of p<0.05 was accepted. Any data which was not normally distributed
112
was log transformed using the common logarithm log10 to normalise where required.
Where log transformation did not normalise data, non-parametric statistics were used.
Details of particular methods and tests employed are outlined below.
4.2.4a Behaviour before, during and after separation
The proportion of time spent performing each of the behaviours was calculated for each
ten minute session for each treatment individual. Individual behaviours were compared
using a repeated measures general linear model with the proportion of time spent
performing each of the behaviours as the response and the GLM model including
condition (before, during and after separation) and focal identification, with the focal
identification as the random factor to count for repeated analysis. A GLM was favoured
due to data not being normally distributed. Pearson’s chi-squared analysis was used to
investigate the difference in total frequency of both positive and negative social
behaviours between the three conditions (before, during and upon reunion).
Allogrooming behaviour was analysed for both duration (seconds) and frequency across
conditions. Duration data was log transformed to normalise its distribution before all
analyses. The differences in both duration and frequency of grooming behaviour
between farms were compared with an independent two-sample t-test and a Pearson’s
chi-squared analysis respectively. Allogrooming behaviour from both farms was
analysed for the different body parts identified using a one-way ANOVA for duration,
followed by Fishers a priori least significant difference (LSD) test for pair-wise
comparisons between the different body areas. The frequency of grooming bouts on
body areas was analysed by Pearson’s chi-squared analysis. Due to a lack of data for the
‘legs’ this body area was removed from both the duration and frequency analysis. The
113
influence of location on the duration and frequency of allogrooming bouts was also
investigated across the two farms. A one-way ANOVA followed by Fishers a priori
LSD test for pair-wise comparisons between the different locations within the housing
area was used to analyse duration, and Pearson’s chi-squared for frequency analysis.
The effects of whether cattle were together with their partner, separated from their
preferred partner or experiencing multiple regrouping on allogrooming behaviour was
analysed for differences in both duration and frequency using a one-way ANOVA and a
Pearson’s chi-squared, respectively.
4.2.4b Production
A number of production parameters were analysed as part of the overall assessment of
the effects of separation and reunion. These parameters included milk yield and milk
quality. See below for individual parameters.
Yield
Forty-five focal individuals qualified for analysis before and after separation and 19
individuals qualified for analysis regarding the effect of reunion on milk yield. Due to
non-normally distributed data after log transformation, a Wilcoxon’s signed rank test
was carried out to analyse the individual difference in milk yield (per milking) before
and after separation over a period of eight weeks (four weeks before separation and four
weeks after separation). In order to investigate differences within the four week period
before separation and the four weeks after separation, and due to non-normally
distributed data after log transformation, a Kruskal-Wallis test was carried out followed
by a multiple comparisons post hoc test for Kruskal-Wallis (Siegel & Castellan, 1988).
To investigate the effect of reunion on milk yield over an eight week period (four weeks
114
before reunion and four weeks after reunion) a paired-samples t-test was carried out due
to repeated measures. A Kruskal-Wallis test was also carried out to investigate the
differences in yield within weeks due to non-normally distributed data after log
transformation.
To investigate the impact of the social environment being experienced by cattle on the
monthly average milk yield, data from 2008 to 2011 was investigated using a one-way
ANOVA with multiple comparisons carried out using Fishers a priori LSD test. Cattle
were grouped as to whether they were together with their preferred partner,
experiencing long term separation from their preferred partner, experiencing multiple
separation and reunion from their preferred partner, or were a control individual in that
they had no preferred partner identified during this period.
Quality
Sixty-four individuals qualified for separation analysis and 36 individuals qualified for
reunion analysis. To investigate the effect of long term separation on milk quality, the
difference in quality parameters from the month before separation compared to the
month after separation were analysed using a Wilcoxon’s signed rank test on each of the
quality parameters milk yield (kg), fat percentage (%) and pence per litre (PPL). A
paired-samples t-test was used to analyse the difference in protein percentage (%) from
the month before separation to the month after separation, as data was normally
distributed. In order to investigate the effects of reunion with a preferred partner on milk
quality, a paired-samples t-test was carried out on all quality parameters to compare the
values from the month before reunion with the month after reunion due to repeated
measures and data being normally distributed.
115
4.2.4c Health parameters
A number of health parameters were included in the overall assessment and included
body condition score and weight, somatic cell count, and fertility. See below for
individual parameters.
Body condition score and weight
Data investigating the effect of long term separation on BCS were analysed by farm.
For farm A, the effects of long term separation on BCS was investigated by analysing
the effects of separation compared to control animals using a Mann-Whitney U test as
data was not normally distributed after log transformation. For farm B the effects of
different social environments (together with preferred partner, separated from preferred
partner and experiencing multiple regroupings) was analysed using a Kruskal-Wallis
test as data was not normally distributed after log transformation. The difference in BCS
from the months before separation compared to the month after separation was
compared using a paired-samples t-test due to repeated measures and data being
normally distributed.
To investigate the effects of long term separation on body weight, data from groups that
had experienced separation were compared to control groups using a Mann-Whitney U
test due to non-normally distributed data after log transformation. The changes in
weight over the six week period was analysed using a one-way ANOVA with multiple
comparisons carried out using Fishers a priori LSD test.
116
Somatic cell count (SCC)
Fifty-one individuals qualified for separation, and 27 for reunion. The effects of long
term separation on somatic cell count (‘000 cells/ml) were investigated using a
Wilcoxon’s signed rank tests, comparing the SCC before separation with the SCC after
separation as the data was paired and not normally distributed after log transformation.
Reunion effects on SCC were analysed using a paired-samples t-test to compare the
previous month’s SCC with the month after reunion SCC as data was paired and
normally distributed.
Fertility
The fertility of 31 individuals was compared to assess the effect of long term separation.
Both the number of inseminations and the interval between inseminations from the
month before separation was compared to those from the month after separation using a
Wilcoxon’s signed rank test due to data not being normally distributed after log
transformation. Only eight individuals qualified to assess the effect of reunion on
fertility measures. A paired-samples t-test was carried out to investigate the difference
in the number of inseminations and for the interval between inseminations, with the
month before reunion compared to the month after reunion as data was paired and
normally distributed.
4.2.5 Ethical note
All ethical considerations were approved by MC ethics committee. All animals were
observed for any signs of excessive distress or behavioural reactions that may have
resulted in injury or distress. Any animal displaying such behaviours or signs of distress
were monitored closely and removed from the study. All cattle were monitored
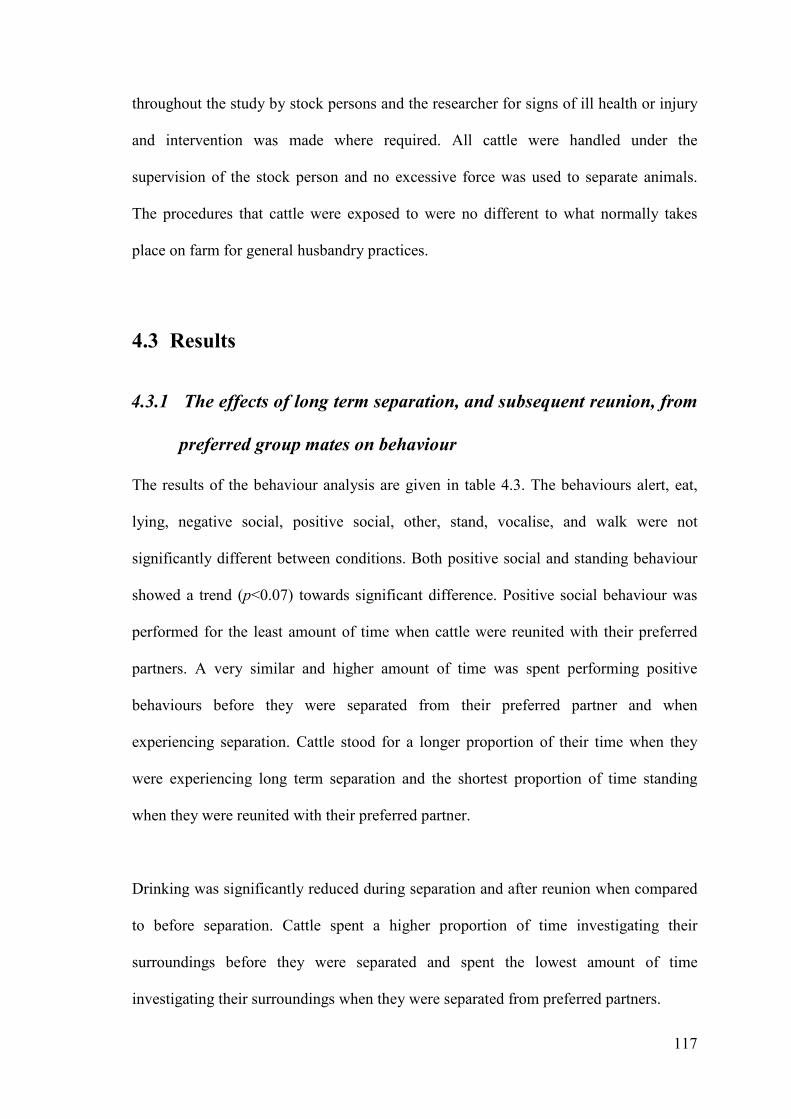
117
throughout the study by stock persons and the researcher for signs of ill health or injury
and intervention was made where required. All cattle were handled under the
supervision of the stock person and no excessive force was used to separate animals.
The procedures that cattle were exposed to were no different to what normally takes
place on farm for general husbandry practices.
4.3 Results
4.3.1 The effects of long term separation, and subsequent reunion, from
preferred group mates on behaviour
The results of the behaviour analysis are given in table 4.3. The behaviours alert, eat,
lying, negative social, positive social, other, stand, vocalise, and walk were not
significantly different between conditions. Both positive social and standing behaviour
showed a trend (p<0.07) towards significant difference. Positive social behaviour was
performed for the least amount of time when cattle were reunited with their preferred
partners. A very similar and higher amount of time was spent performing positive
behaviours before they were separated from their preferred partner and when
experiencing separation. Cattle stood for a longer proportion of their time when they
were experiencing long term separation and the shortest proportion of time standing
when they were reunited with their preferred partner.
Drinking was significantly reduced during separation and after reunion when compared
to before separation. Cattle spent a higher proportion of time investigating their
surroundings before they were separated and spent the lowest amount of time
investigating their surroundings when they were separated from preferred partners.
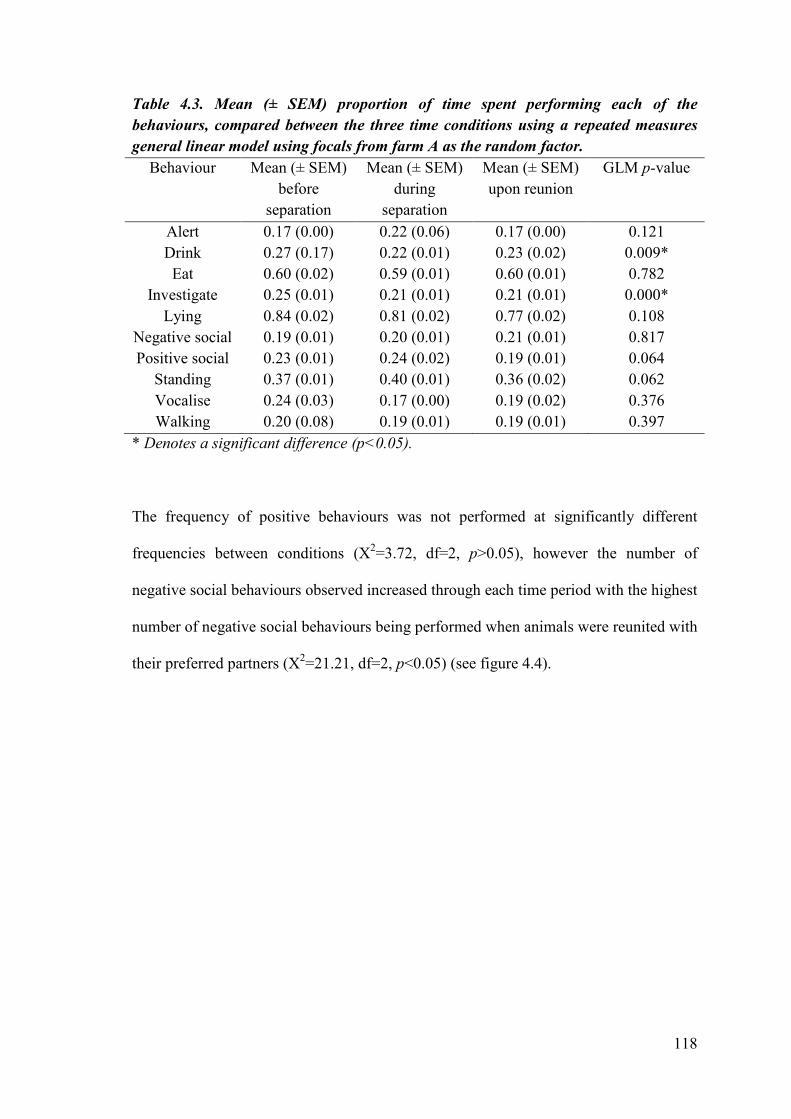
118
Table 4.3. Mean (± SEM) proportion of time spent performing each of the
behaviours, compared between the three time conditions using a repeated measures
general linear model using focals from farm A as the random factor.
Behaviour Mean (± SEM) before
separation
Mean (± SEM) during
separation
Mean (± SEM) upon reunion
GLM p-value
Alert 0.17 (0.00) 0.22 (0.06) 0.17 (0.00) 0.121 Drink 0.27 (0.17) 0.22 (0.01) 0.23 (0.02) 0.009* Eat 0.60 (0.02) 0.59 (0.01) 0.60 (0.01) 0.782
Investigate 0.25 (0.01) 0.21 (0.01) 0.21 (0.01) 0.000* Lying 0.84 (0.02) 0.81 (0.02) 0.77 (0.02) 0.108
Negative social 0.19 (0.01) 0.20 (0.01) 0.21 (0.01) 0.817 Positive social 0.23 (0.01) 0.24 (0.02) 0.19 (0.01) 0.064
Standing 0.37 (0.01) 0.40 (0.01) 0.36 (0.02) 0.062 Vocalise 0.24 (0.03) 0.17 (0.00) 0.19 (0.02) 0.376 Walking 0.20 (0.08) 0.19 (0.01) 0.19 (0.01) 0.397
* Denotes a significant difference (p<0.05).
The frequency of positive behaviours was not performed at significantly different
frequencies between conditions (X2=3.72, df=2, p>0.05), however the number of
negative social behaviours observed increased through each time period with the highest
number of negative social behaviours being performed when animals were reunited with
their preferred partners (X2=21.21, df=2, p<0.05) (see figure 4.4).
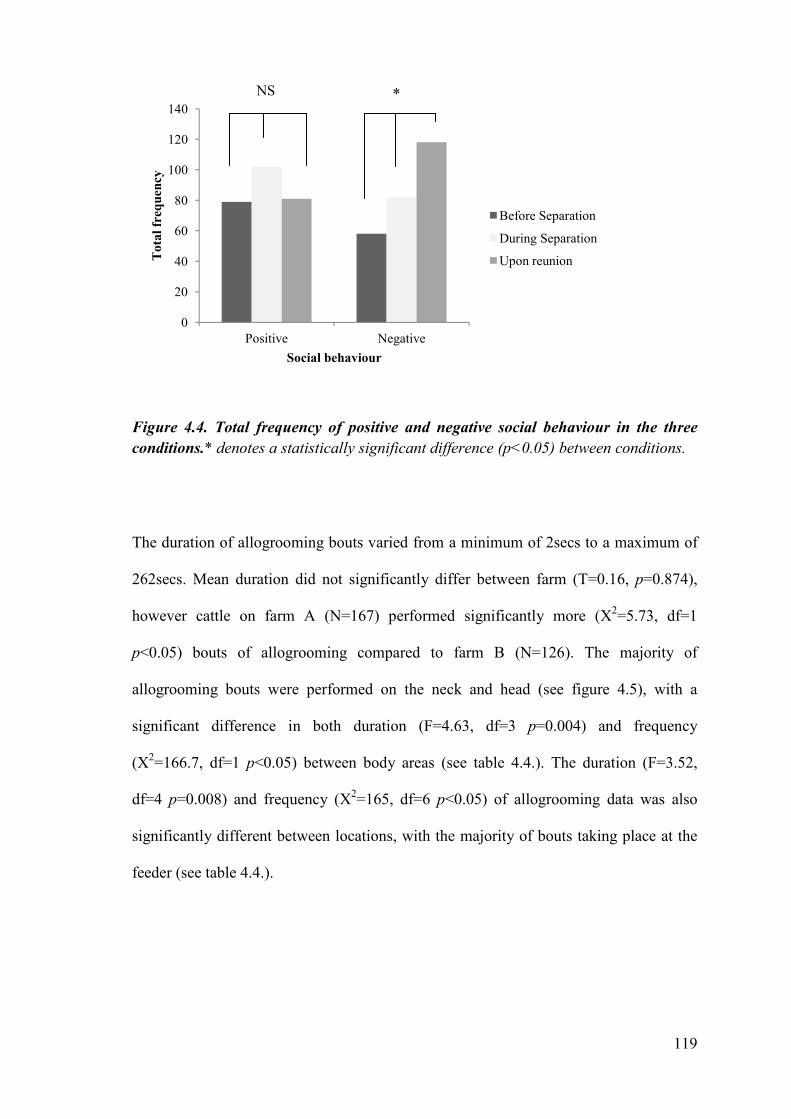
119
Figure 4.4. Total frequency of positive and negative social behaviour in the three
conditions.* denotes a statistically significant difference (p<0.05) between conditions.
The duration of allogrooming bouts varied from a minimum of 2secs to a maximum of
262secs. Mean duration did not significantly differ between farm (T=0.16, p=0.874),
however cattle on farm A (N=167) performed significantly more (X2=5.73, df=1
p<0.05) bouts of allogrooming compared to farm B (N=126). The majority of
allogrooming bouts were performed on the neck and head (see figure 4.5), with a
significant difference in both duration (F=4.63, df=3 p=0.004) and frequency
(X2=166.7, df=1 p<0.05) between body areas (see table 4.4.). The duration (F=3.52,
df=4 p=0.008) and frequency (X2=165, df=6 p<0.05) of allogrooming data was also
significantly different between locations, with the majority of bouts taking place at the
feeder (see table 4.4.).
0
20
40
60
80
100
120
140
Positive Negative
To
tal
freq
uen
cy
Social behaviour
Before Separation
During Separation
Upon reunion
* NS
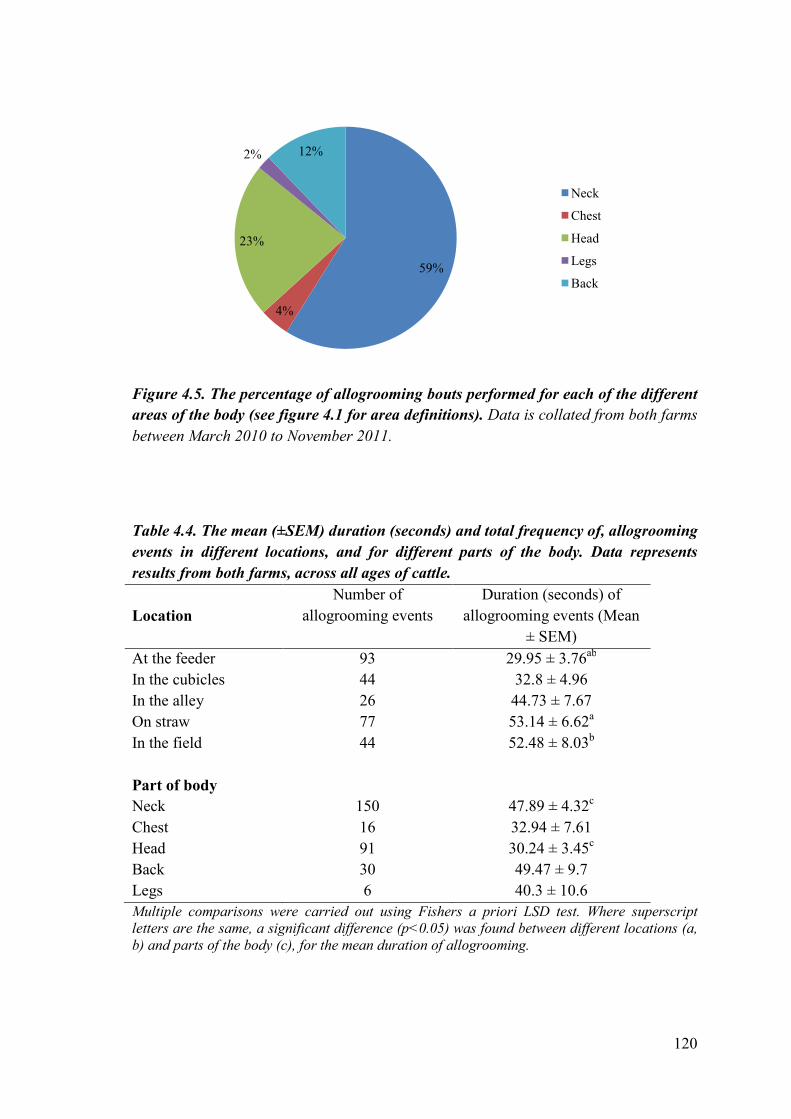
120
Figure 4.5. The percentage of allogrooming bouts performed for each of the different
areas of the body (see figure 4.1 for area definitions). Data is collated from both farms
between March 2010 to November 2011.
Table 4.4. The mean (±SEM) duration (seconds) and total frequency of, allogrooming
events in different locations, and for different parts of the body. Data represents
results from both farms, across all ages of cattle.
Location
Number of allogrooming events
Duration (seconds) of allogrooming events (Mean
± SEM)
At the feeder 93 29.95 ± 3.76ab
In the cubicles 44 32.8 ± 4.96 In the alley 26 44.73 ± 7.67
On straw 77 53.14 ± 6.62a
In the field 44 52.48 ± 8.03b
Part of body Neck 150 47.89 ± 4.32c Chest 16 32.94 ± 7.61 Head 91 30.24 ± 3.45c
Back 30 49.47 ± 9.7
Legs 6 40.3 ± 10.6 Multiple comparisons were carried out using Fishers a priori LSD test. Where superscript
letters are the same, a significant difference (p<0.05) was found between different locations (a,
b) and parts of the body (c), for the mean duration of allogrooming.
59%
4%
23%
2% 12%
Neck
Chest
Head
Legs
Back
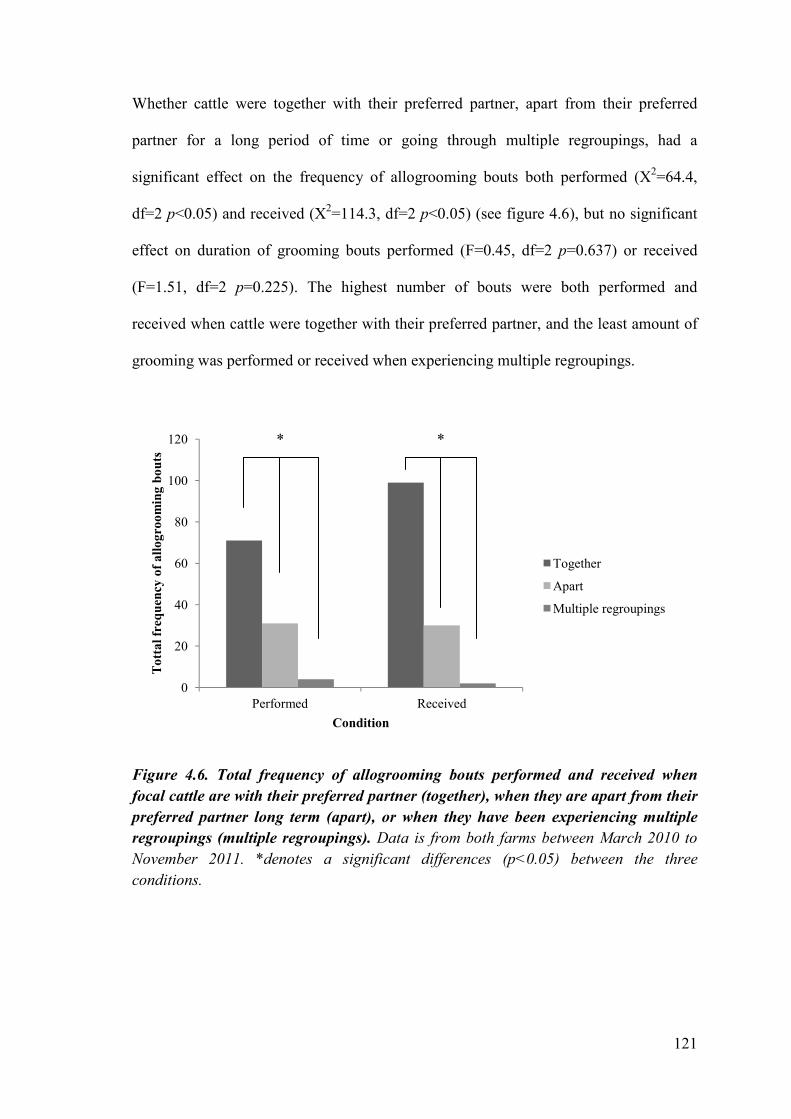
121
Whether cattle were together with their preferred partner, apart from their preferred
partner for a long period of time or going through multiple regroupings, had a
significant effect on the frequency of allogrooming bouts both performed (X2=64.4,
df=2 p<0.05) and received (X2=114.3, df=2 p<0.05) (see figure 4.6), but no significant
effect on duration of grooming bouts performed (F=0.45, df=2 p=0.637) or received
(F=1.51, df=2 p=0.225). The highest number of bouts were both performed and
received when cattle were together with their preferred partner, and the least amount of
grooming was performed or received when experiencing multiple regroupings.
Figure 4.6. Total frequency of allogrooming bouts performed and received when
focal cattle are with their preferred partner (together), when they are apart from their
preferred partner long term (apart), or when they have been experiencing multiple
regroupings (multiple regroupings). Data is from both farms between March 2010 to
November 2011. *denotes a significant differences (p<0.05) between the three
conditions.
0
20
40
60
80
100
120
Performed Received
To
tta
l fr
equ
ency
of
all
og
roo
min
g b
ou
ts
Condition
Together
Apart
Multiple regroupings
* *
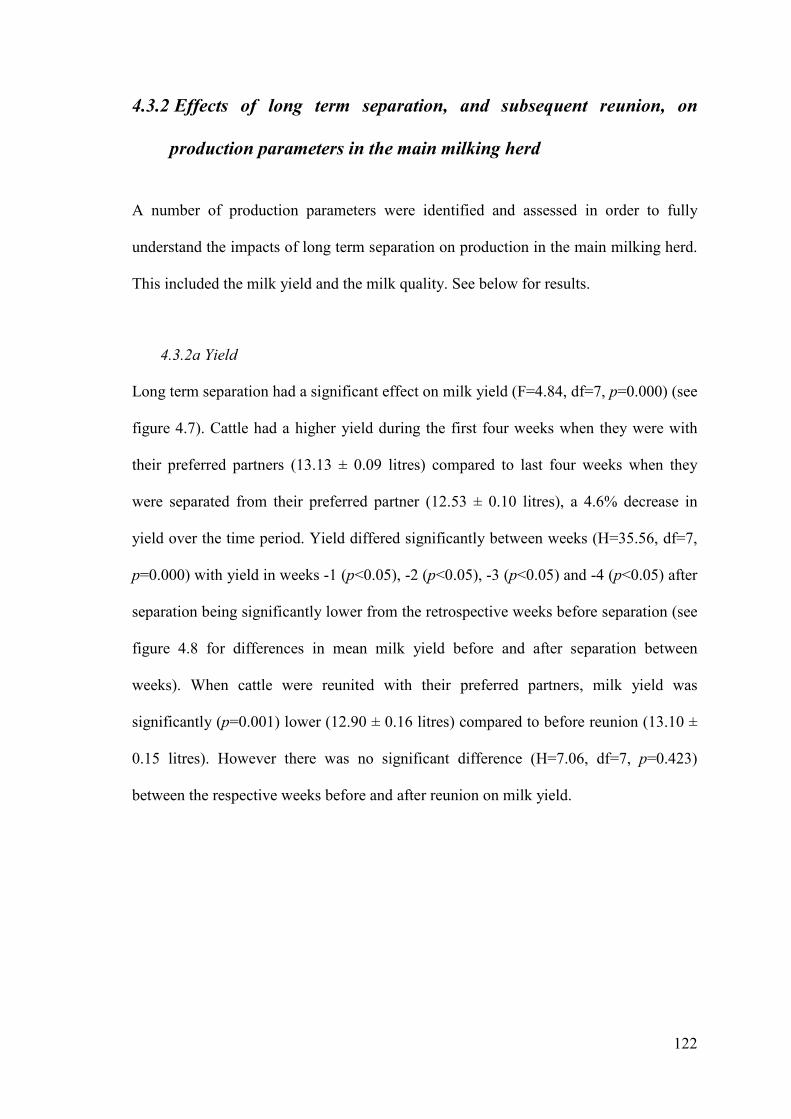
122
4.3.2 Effects of long term separation, and subsequent reunion, on
production parameters in the main milking herd
A number of production parameters were identified and assessed in order to fully
understand the impacts of long term separation on production in the main milking herd.
This included the milk yield and the milk quality. See below for results.
4.3.2a Yield
Long term separation had a significant effect on milk yield (F=4.84, df=7, p=0.000) (see
figure 4.7). Cattle had a higher yield during the first four weeks when they were with
their preferred partners (13.13 ± 0.09 litres) compared to last four weeks when they
were separated from their preferred partner (12.53 ± 0.10 litres), a 4.6% decrease in
yield over the time period. Yield differed significantly between weeks (H=35.56, df=7,
p=0.000) with yield in weeks -1 (p<0.05), -2 (p<0.05), -3 (p<0.05) and -4 (p<0.05) after
separation being significantly lower from the retrospective weeks before separation (see
figure 4.8 for differences in mean milk yield before and after separation between
weeks). When cattle were reunited with their preferred partners, milk yield was
significantly (p=0.001) lower (12.90 ± 0.16 litres) compared to before reunion (13.10 ±
0.15 litres). However there was no significant difference (H=7.06, df=7, p=0.423)
between the respective weeks before and after reunion on milk yield.
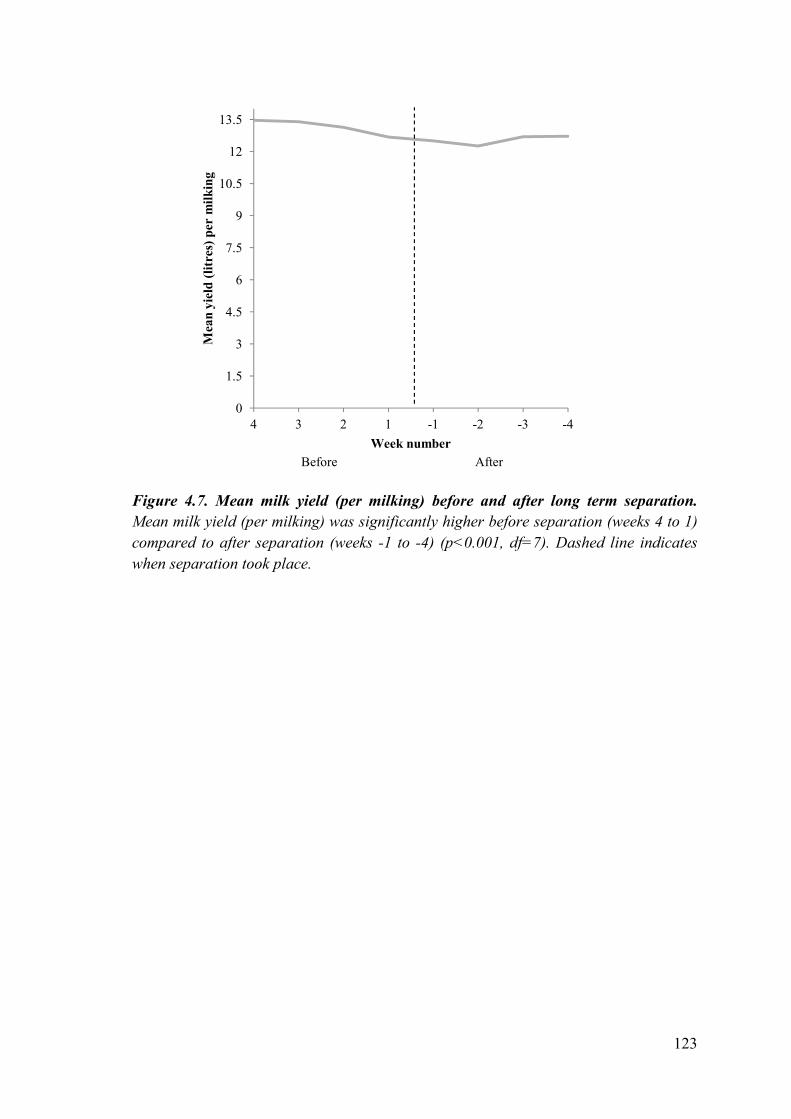
123
Figure 4.7. Mean milk yield (per milking) before and after long term separation.
Mean milk yield (per milking) was significantly higher before separation (weeks 4 to 1)
compared to after separation (weeks -1 to -4) (p<0.001, df=7). Dashed line indicates
when separation took place.
0
1.5
3
4.5
6
7.5
9
10.5
12
13.5
4 3 2 1 -1 -2 -3 -4
Mea
n y
ield
(li
tres
) p
er m
ilk
ing
Week number
Before After
124
Figure 4.8 The effect of long term separation on mean (±SEM) milk yield (per
milking) over an eight week period (four weeks before separation, and four weeks
after separation). Long term separation from preferred groups had a significant effect
on mean milk yield (per milking) (p<0.000, df=7) between weeks. Differences between
retrospective weeks are given below the horizontal axis to show where the effects of
separation occurred. *denotes a significant difference (p<0.05) in yield before and after
separation for particular weeks.
The average monthly yield of cattle between 2008 and 2011 was significantly different
between social environment conditions (F=2.96, df=3, p=0.033). Cattle that were
together with their preferred partner produced on average a higher milk yield (14.76 ±
0.781 litres) compared to when cattle were separated from their partner (11.55 ± 0.82
litres), when they were experiencing multiple regroupings (11.59 ± 0.88 litres), and
compared to those cattle that did not have a preferred partner identified (12.41 ± 0.54
litres) (see figure 4.9).
-0.18-0.87 -0.70 -0.75
-3
-1.5
0
1.5
3
4.5
6
7.5
9
10.5
12
13.5
15
1 2 3 4
Mea
n (
±S
EM
) y
ield
(li
tres
) p
er m
ilk
ing
Week number
Before
Difference in yield
After
* * * *
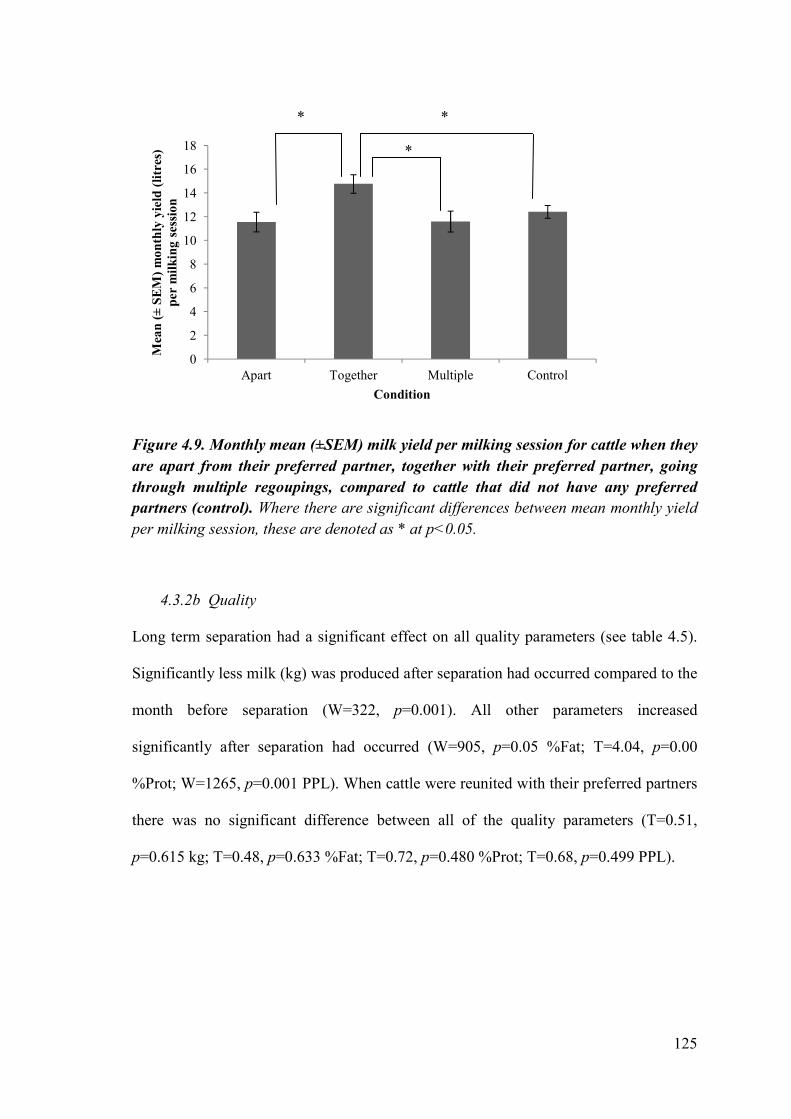
125
Figure 4.9. Monthly mean (±SEM) milk yield per milking session for cattle when they
are apart from their preferred partner, together with their preferred partner, going
through multiple regoupings, compared to cattle that did not have any preferred
partners (control). Where there are significant differences between mean monthly yield
per milking session, these are denoted as * at p<0.05.
4.3.2b Quality
Long term separation had a significant effect on all quality parameters (see table 4.5).
Significantly less milk (kg) was produced after separation had occurred compared to the
month before separation (W=322, p=0.001). All other parameters increased
significantly after separation had occurred (W=905, p=0.05 %Fat; T=4.04, p=0.00
%Prot; W=1265, p=0.001 PPL). When cattle were reunited with their preferred partners
there was no significant difference between all of the quality parameters (T=0.51,
p=0.615 kg; T=0.48, p=0.633 %Fat; T=0.72, p=0.480 %Prot; T=0.68, p=0.499 PPL).
0
2
4
6
8
10
12
14
16
18
Apart Together Multiple Control
Mea
n (
±S
EM
)m
on
thly
yie
ld (
litr
es)
per
mil
kin
g s
essi
on
Condition
* *
*
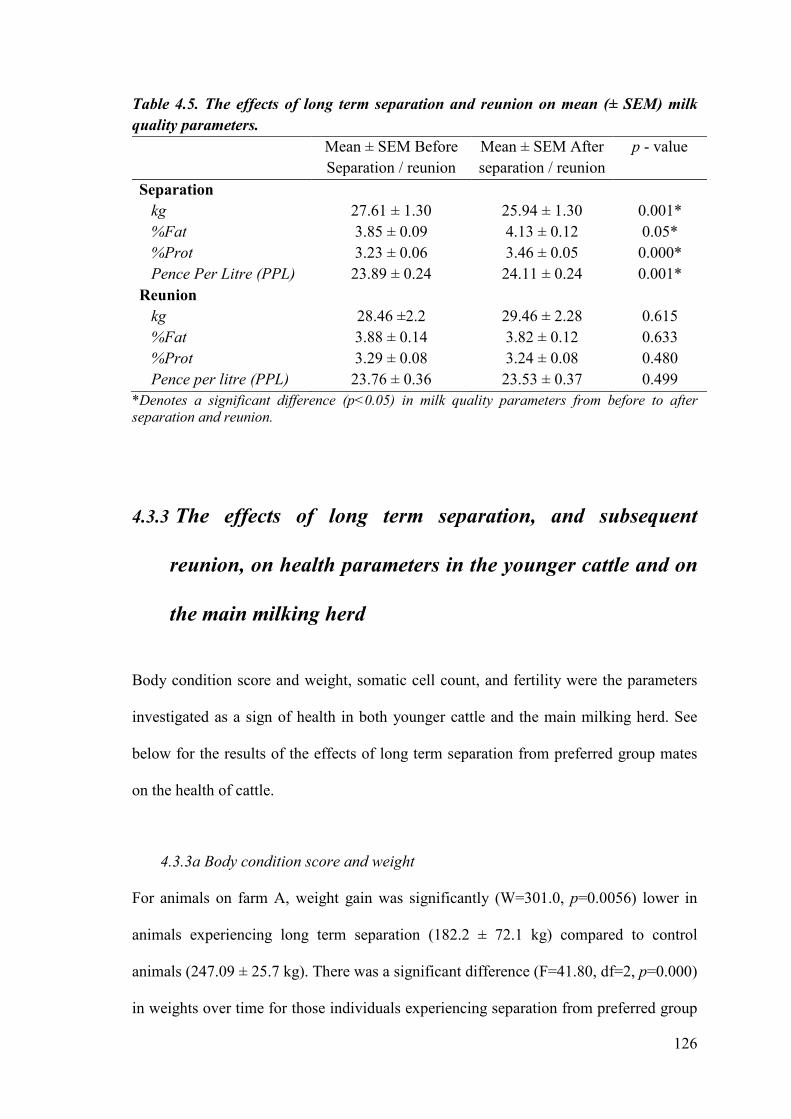
126
Table 4.5. The effects of long term separation and reunion on mean (± SEM) milk
quality parameters.
Mean ± SEM Before Separation / reunion
Mean ± SEM After separation / reunion
p - value
Separation kg 27.61 ± 1.30 25.94 ± 1.30 0.001* %Fat 3.85 ± 0.09 4.13 ± 0.12 0.05* %Prot 3.23 ± 0.06 3.46 ± 0.05 0.000* Pence Per Litre (PPL) 23.89 ± 0.24 24.11 ± 0.24 0.001* Reunion kg 28.46 ±2.2 29.46 ± 2.28 0.615 %Fat 3.88 ± 0.14 3.82 ± 0.12 0.633 %Prot 3.29 ± 0.08 3.24 ± 0.08 0.480 Pence per litre (PPL) 23.76 ± 0.36 23.53 ± 0.37 0.499
*Denotes a significant difference (p<0.05) in milk quality parameters from before to after
separation and reunion.
4.3.3 The effects of long term separation, and subsequent
reunion, on health parameters in the younger cattle and on
the main milking herd
Body condition score and weight, somatic cell count, and fertility were the parameters
investigated as a sign of health in both younger cattle and the main milking herd. See
below for the results of the effects of long term separation from preferred group mates
on the health of cattle.
4.3.3a Body condition score and weight
For animals on farm A, weight gain was significantly (W=301.0, p=0.0056) lower in
animals experiencing long term separation (182.2 ± 72.1 kg) compared to control
animals (247.09 ± 25.7 kg). There was a significant difference (F=41.80, df=2, p=0.000)
in weights over time for those individuals experiencing separation from preferred group
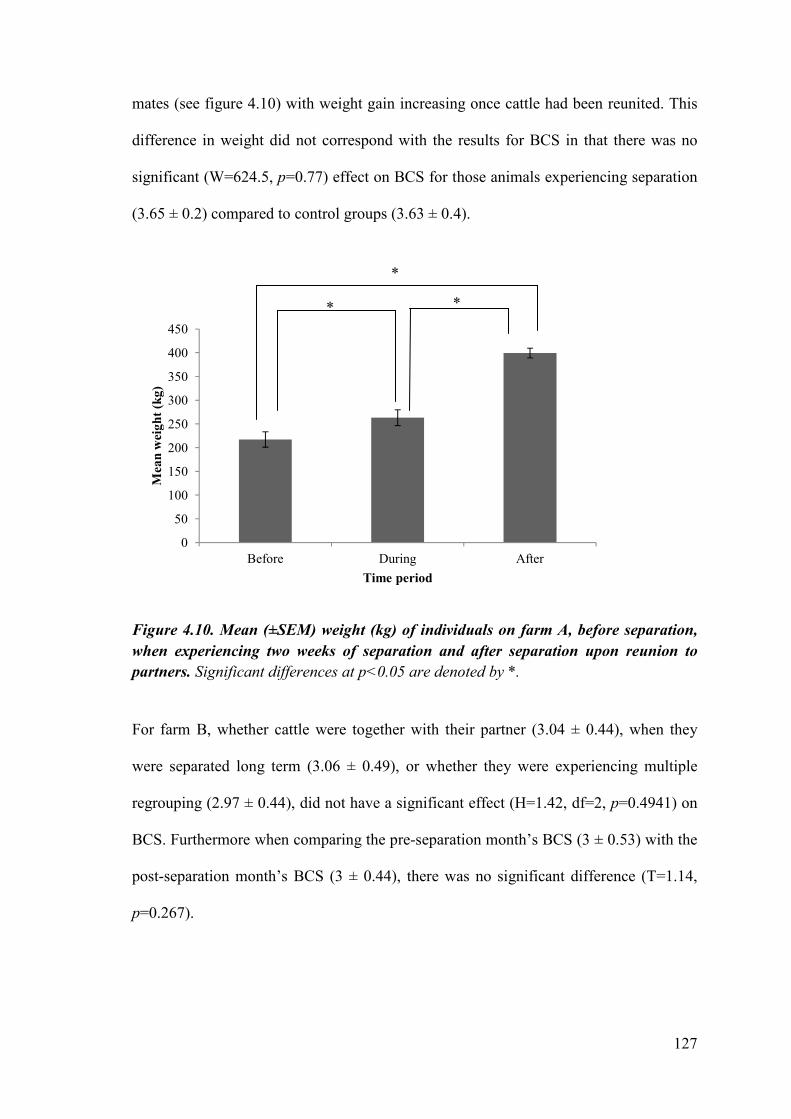
127
mates (see figure 4.10) with weight gain increasing once cattle had been reunited. This
difference in weight did not correspond with the results for BCS in that there was no
significant (W=624.5, p=0.77) effect on BCS for those animals experiencing separation
(3.65 ± 0.2) compared to control groups (3.63 ± 0.4).
Figure 4.10. Mean (±SEM) weight (kg) of individuals on farm A, before separation,
when experiencing two weeks of separation and after separation upon reunion to
partners. Significant differences at p<0.05 are denoted by *.
For farm B, whether cattle were together with their partner (3.04 ± 0.44), when they
were separated long term (3.06 ± 0.49), or whether they were experiencing multiple
regrouping (2.97 ± 0.44), did not have a significant effect (H=1.42, df=2, p=0.4941) on
BCS. Furthermore when comparing the pre-separation month’s BCS (3 ± 0.53) with the
post-separation month’s BCS (3 ± 0.44), there was no significant difference (T=1.14,
p=0.267).
0
50
100
150
200
250
300
350
400
450
Before During After
Mea
n w
eig
ht
(kg
)
Time period
*
*
*
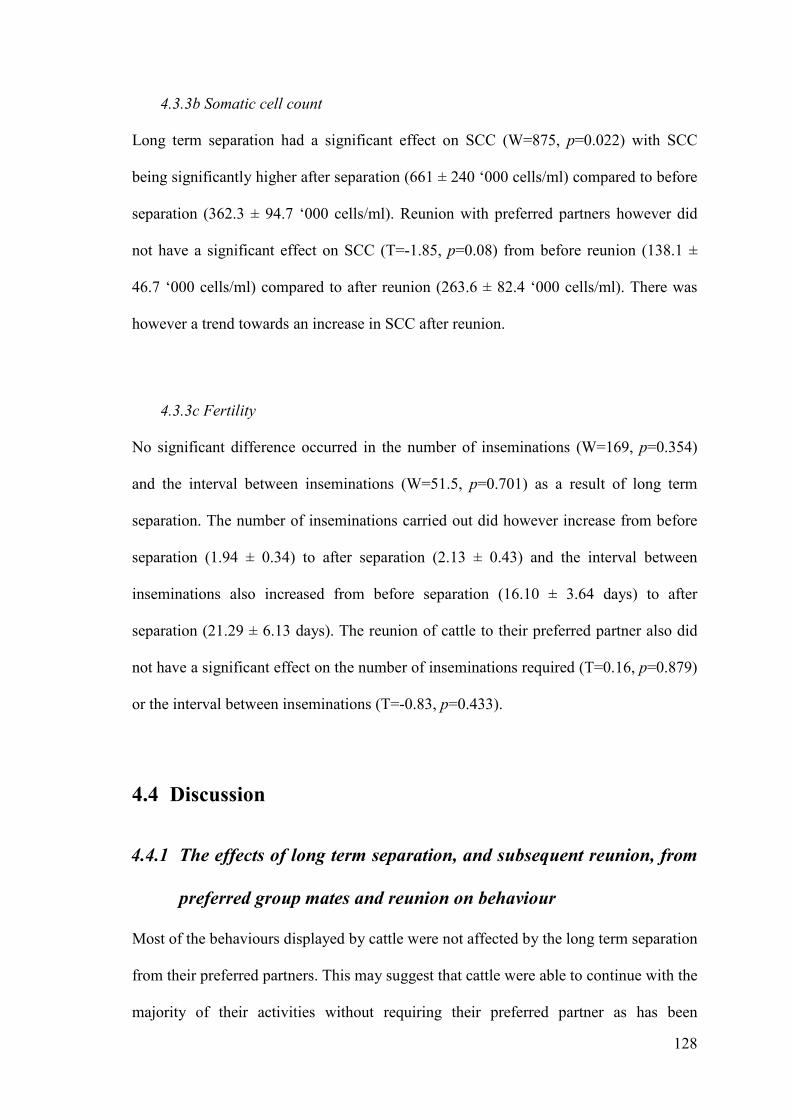
128
4.3.3b Somatic cell count
Long term separation had a significant effect on SCC (W=875, p=0.022) with SCC
being significantly higher after separation (661 ± 240 ‘000 cells/ml) compared to before
separation (362.3 ± 94.7 ‘000 cells/ml). Reunion with preferred partners however did
not have a significant effect on SCC (T=-1.85, p=0.08) from before reunion (138.1 ±
46.7 ‘000 cells/ml) compared to after reunion (263.6 ± 82.4 ‘000 cells/ml). There was
however a trend towards an increase in SCC after reunion.
4.3.3c Fertility
No significant difference occurred in the number of inseminations (W=169, p=0.354)
and the interval between inseminations (W=51.5, p=0.701) as a result of long term
separation. The number of inseminations carried out did however increase from before
separation (1.94 ± 0.34) to after separation (2.13 ± 0.43) and the interval between
inseminations also increased from before separation (16.10 ± 3.64 days) to after
separation (21.29 ± 6.13 days). The reunion of cattle to their preferred partner also did
not have a significant effect on the number of inseminations required (T=0.16, p=0.879)
or the interval between inseminations (T=-0.83, p=0.433).
4.4 Discussion
4.4.1 The effects of long term separation, and subsequent reunion, from
preferred group mates and reunion on behaviour
Most of the behaviours displayed by cattle were not affected by the long term separation
from their preferred partners. This may suggest that cattle were able to continue with the
majority of their activities without requiring their preferred partner as has been
129
suggested by Newberry & Swanson (2001). This apparent ability to continue with
regular activities is supported by the previous findings in chapter three regarding short
term separation where it appeared that any familiar conspecific was able to provide
some form of social support during that particular environmental challenge.
Similar to short term separation, long term separation from preferred group mates also
brought about a high frequency of standing. Although not significantly different
between conditions, standing behaviour showed a trend towards being higher during
separation compared to both before and after. This increase in standing behaviour is
often seen in regrouped animals (Hasegawa et al., 1997; von Keyserlingk et al., 2008)
and has been related to fear (Boissy & Bouissou, 1995) and so the high level of standing
observed during separation may be an indication that cattle were uneasy about the
change in their environment. Furthermore, an increase in time spent standing can
increase the chance of foot problems and lameness (O'Connell et al., 2008) causing
welfare issues, and so must be monitored closely.
The higher frequency of standing in the separation period may have influenced the
results for investigative behaviour which decreased during separation. This behaviour
was also lower after cattle had been reunited compared to before separation took place.
Cattle appear to feel safer exploring their surroundings when peers are present. As such
a low level of locomotive activity may indicate both a high level of fear and reduced
social motivation (Müller & Schrader, 2005) which may be due to the absence of
preferred relationships. Cattle may have reduced their investigative behaviour and
increased their time spent standing as they felt that they could not explore their
surrounding as much when a preferred partner was not present.
130
When being reunited there was an increase in the amount of negative behaviours
performed, as is often seen at regrouping. This may have influenced the lack of
investigative behaviours due to having to be aware of others around them who may
have been defending their resources from introduced cattle. This could also explain the
observed differences in drinking behaviour, which was lower in animals during
separation and upon reunion. It is likely that this difference in drinking behaviour was
more due to climatic conditions rather than the separation. The result of increased
negative behaviours would suggest the possibility that cattle did not maintain their
social bonds after two weeks of separation and so being returned to the group may have
meant that new relationships would have had to of been formed. It may have also
increased the stress levels of individuals, both resident and re-introduced, which would
have meant that support from previous preferred partners may have been lacking. The
behaviours displayed are similar to what would be expected at regrouping time and so
long periods of separation should be avoided where possible in order to ensure the
welfare of cattle.
Under controlled two week separation on farm A positive social behaviours such as
grooming or resting in contact with another, although not significantly different
between conditions, did show a trend towards being performed at a higher level before
and during separation when compared to after separation when partners were reunited.
The grooming behaviour seen before separation could be due to the bonds that existed
between cattle. Grooming is often seen as a method of reaffirming a bond between
individuals (Schneider & Krueger, 2012; Val-Laillet et al., 2009) but can also offer a
relaxation and comfort giving property (Pellis & Pellis, 2010). This may explain the
131
high proportion of time spent grooming others even though focal animals were
separated from their preferred partners during separation. Grooming has been seen to
slow the heart rates of those receiving the grooming (Laister et al., 2011) and cattle that
are lame receive more grooming than non-lame cattle (Galindo & Broom, 2002). The
fact that grooming behaviour decreased upon reunion may be due to the increase in
negative behaviour that was seen and may represent a regrouping reaction in cattle.
Although cattle were reunited with their peers after two weeks of separation, they
needed to re-establish their place in the group. Negative behaviours were at their lowest
in both before and during separation suggesting that groups were cohesive and stable
until reunion occurred and thus a change in social environment occurred, particularly
for resident individuals.
When evaluating the allogrooming behaviour overall from both farms, allogrooming
behaviour was performed and received at the highest frequency when cattle were
together with their preferred partner, compared to when separated from their partner or
when experiencing multiple regroupings, similar to the results on other positive
behaviours. This change in positive grooming behaviour over time may be due to the
instable nature of dynamic groups. This is also suggested from the results on
allogrooming between farms. Farm A had the highest frequency of allogrooming
compared to farm B, although there was no difference in the bout duration between
farms. As farm A housed the replacement heifers and had much more stable groupings
it would be expected that grooming would be performed more often in this setting
compared to within the main milking herd. Furthermore groups on farm A were smaller
and so it is likely that memory formation was better and so bonds were stronger, helping
cohesion.
132
Menke et al. (1999) also noted a reduction in social licking frequency when cattle had
been separated for a long period of time suggesting that separation had interfered with
the bonding mechanisms that had been in place previously. Reduction in such a socio-
positive behaviour that demonstrates cattle’s ability to experience affective states is of
great concern to the welfare of cattle. Promoting allogrooming and thus bond formation
could be an important aspect of measuring welfare in dairy cattle, and could be used as
an indicator of stable groupings if it were performed on a regular basis. In addition,
Hinch et al. (1982) noted that there were particular individuals that appeared to
dominate the grooming activity in a herd of Hereford cattle, with two individuals
grooming 56% of the total herd. It was suggested that these particular individuals may
play an important role in group cohesion (Hinch et al., 1982). As such it is important to
consider group dynamics carefully, as removal of a key groomer could be problematic
for stability and cohesion, and consequently potentially increase social tension (Phillips,
2002). This could have negative effects on the welfare of cattle as the group’s social
structure and organisation may change dramatically with the removal of key
individuals.
The majority of grooming bouts for both farm A and farm B together took place at the
feeder. This is in line with other research by Val-Laillet et al. (2009). In addition, and
potentially as a consequence of this positioning, most bouts of grooming were
performed on the head and neck region. Grooming in this area by others may also hold a
hygiene function due to cattle’s inability to reach this area of themselves.
133
4.4.2 The effects of long term separation, and subsequent
reunion, from preferred group mates and reunion on
production
Long term separation significantly reduced the volume of milk produced (litres) and this
reduction in yield lasted for at least four weeks. The yield for the four weeks after
separation was significantly lower than the retrospective previous weeks, apart from the
first week either side. This drop in milk production suggests that separation from
preferred partners caused a challenge that required energy that would normally be
required to produce milk to be transferred elsewhere. When animals experience stress,
they need to transfer energy to resources that are more vital to their survival (Moberg &
Mench, 2000). The reduction in milk would suggest that this transfer took place when
animals were separated. As cattle were included simply on the fact that they had been
separated from their preferred partner, there was no control as to whether it was their
partner that was regrouped or whether it was the focal that was regrouped, therefore
some of the changes in milk production could be due to regrouping more than
separation and so must be considered with caution. Furthermore, individual lactation
curves may have an effect on the outcome of results and could not be controlled for.
In addition to the above result, the monthly average yield (litres) for cattle was at its
highest when cattle were with their preferred partner compared to when they were apart
or experiencing multiple regroupings. Interestingly, monthly yield is higher when cattle
identified as having a preferred partner are with their preferred partner compared to the
monthly average yield of cattle that had no preferred partner identified. This may
suggest that the existence of a relationship and the presence of that preferred partner
134
allow cattle to produce higher volumes of milk. This link between a positive
relationship and the production of higher volumes of milk in cattle may be due to the
positive effects that these relationships appear to have on cattle. Val-Laillet et al. (2009)
noted that social relationships affected the spatial proximity between individuals at the
feed bunk in that individuals maintained a closer distance to each other at the feed area.
The increase in milk yield when cattle are with their preferred partner may be due to the
ability to access the feed area more and therefore gain more energy which can be
converted to milk. Even though Val-Laillet et al. (2009) observed cattle to displace each
other more the closer their proximity, it was also noted that cattle would groom each
other more the closer their proximity.
Cattle will trade feed quality for a place to feed that is away from a non-preferred
partner (usually a more dominant individual) (Rioja-Lang et al., 2009) and so it is likely
that cattle will choose minor displacements along with social grooming from preferred
partners over a displacement from a more dominant individual. Cattle this way are able
to gain better quality food and are probably likely to be able to eat a good amount of
food despite the number of displacements. Furthermore, the results regarding
allogrooming to be performed at the feed bunk are in agreement with Val-Laillet et al.
(2009) who noted that the preferred partners often seen at the feed bunk also
allogroomed each other the most. As allogrooming can relieve social tension (Phillips,
2002) the performance of a high frequency of allogrooming between a pair that often
displace each other at the feed area may help to affirm their relationship and so each of
the dyad are able to feed freely.
135
Upon reunion, the milk yield of cattle again dropped over the four weeks. As it was not
possible to control how long cattle had been separated from each other, it is likely that
they had been separated for longer than the minimum of two weeks and so had likely
been unable to maintain the relationship with their preferred partner. Reunion is also
likely to have happened due to regrouping which can be extremely stressful for cattle
and so as discussed earlier, energy will have been transferred to other resources than
being used for milk production. There was no significant difference between weeks and
so the reunion or potential regrouping did not cause as much impact on yield as the
initial separation had caused.
In line with the above results, the amount of milk recorded (kg) by NMR was
significantly reduced after separation. The amount of milk that was lost due to
separation might cost the producer a significant amount of profit if a number of animals
were regrouped or separated from the partners in one go. However the price per litre
that was paid each month, along with both the fat percentage and protein percentage
increased after separation. The increase in quality parameters may be associated with
the reduction in yield that was observed (Løvendahl & Chagunda, 2011). There was
however no significant effect on any of the quality parameters when cattle were reunited
with each other. This is in contrast to the results for separation.
4.4.3 The effects of long term separation, and subsequent reunion, from
preferred group mates and reunion on health
For cattle under the controlled two week separation on farm A, weight gain was
significantly affected by separation. Cattle experiencing the separation from their
preferred partners gained less weight than control cattle during the same period. Cattle
136
did gain weight upon reunion of their preferred partner but this did not match the weight
gain of control individuals. The potential stress experienced by cattle when separated
from their preferred partner appeared to affect weight gain. Replacement heifers are a
valuable source for dairy producers. This loss of weight or slow weight gain, in
replacement animals as a potential effect of separation from preferred partners could
have negative impacts on the health and welfare of the cattle, but also on rate of herd
replacement. If young heifers are served by their weight, losing weight could cause
setbacks and difficulty in insemination and thus fertility levels.
On the contrary, long term separation did not affect body condition score both on farm
A and farm B. This result has a number of potential concerns. If weight is significantly
affected by separation but body condition score is not, the practical implications for this
are problematic. Cattle could be losing weight but not enough to affect their body
condition score and so may go unnoticed by producers. For older animals this may not
be too much of an issue, but for younger animals, particularly replacement heifers, this
could cause difficulties for producers. Secondly, the difference in the body condition
score result and that for weight may be due to the calves and youngsters being affected
more by the separation than older cattle. As the younger cattle were too small to be
effectively condition scored on a regular basis, they were not observed for condition but
only observed for weight; therefore the younger individuals may be affected more by
the separation procedure than older individuals who may have already experienced
some regrouping. The assessment of body condition score is subjective compared to the
direct measurement of weight and so the measurement of weight and its reduction due
to separation should be considered as the main assessment to take note of.
137
Somatic cell counts are often a sign of an individual’s health, in particular regarding
udder health and potential infection by mastitis pathogens. Somatic cell counts were
significantly higher after long term separation compared to before separation. They also
increased, although not significantly, after reunion. This would suggest that the
separation and likely the regrouping of cattle had a negative effect on cattle’s udder
health. As stress levels increase, so do corticosteroids and this can impair the cattle’s
immune system and therefore they are less able to fight infections they exposed to
(Boccia et al., 1997; Gordon et al., 1992). It could however be that the high SCC caused
regrouping and subsequent reunion of individuals as cattle were separated into a close
observation group if they were undergoing treatment for mastitis.
Although the fertility of focal individuals was not significantly affected by long term
separation from their preferred partners, there was an increase in the number of
inseminations and the interval between inseminations required. This may suggest that
cattle took longer and more inseminations to be confirmed positive in pregnancy when
they had been separated from their preferred partners. Individuals under stress are likely
to divert energy requirements away from non-essential functions such as reproduction
(Moberg & Mench, 2000). However, the data available for this analysis was very
limited and no clear conclusions can be drawn from these results on fertility. As for
separation, reunion appears to have had no significant influence on fertility measures.
4.4.4 Practical implications
There are a number of practical implications from this part of the study. In particular it
would appear, as for the previous studies, that younger cattle may be more sensitive to
the separation and regrouping process. Extra care surrounding these individuals needs to
138
be considered. Further investigation of this formed the next and final stage of the study,
looking at the influence of age on the parameters described above.
At critical periods in cattle rearing such as when reaching the weight for insemination,
limited stress and limited changes in their social environment may be beneficial.
Although fertility was not significantly affected by separation, the occurrence of having
to do more inseminations later on after separation occurred would suggest that limiting
regrouping around this period may be beneficial for the health and well-being of the
cow so that her energy can concentrate on the foetus.
In order to avoid loss in production, both through the reduction in yield and the increase
in somatic cell count which is often used as a quality control parameter for processors,
the avoidance of separating preferred partners when regrouping occurs would be
beneficial. As has been seen by Gyax et al. (2009) and Neisen et al. (2009b), pairing
heifers at the introduction of regrouping eased integration, and so if pairs consisted of
preferred partners, the potential for social support is increased as it was in study two
(chapter three). Being able to regroup animals at the same time will require good
management of groups so that multiple animals are ready for regrouping at the same
time. If animals are carefully managed so that they can be regrouped together this may
help in the management of those individuals within a group and will ensure that the
avoidance of separating preferred partners is feasible.
Keeping individuals together allows for bonds to be continued and therefore stable
relationships can be formed and maintained. These relationships encourage positive
behaviours between individuals and allow animals to investigate and explore their
139
surroundings in comfort. Smaller, more stable groups make this easier and so negative
impacts on health and welfare are minimised as positive relationships help animals to
cope with their changing environment. This might be why there were very limited
excessive behavioural responses to separation observed as they were still with familiar
individuals.
4.5 Conclusion
In summary, long term separation from preferred group mates has negative
consequences on behaviour, health, production and welfare. The minimisation of
separation and regrouping of animals will improve the welfare of animals and in turn
prevent negative consequences on health, behaviour and production. The fact that upon
reunion there were no major significant improvements on the negative effects of
separation would suggest that separation of two weeks could cause bond formation to
break and so if cattle need to be removed from a group for reasons such as sickness,
they should not be held for any longer than needed, and where possible, less than two
weeks. This will help to ensure that these important bonds are not broken and their
positive impact on an animal’s coping ability is maintained. The impact of long term
separation was more significant than reunion suggesting that it is the separation from
their preferred partner that causes the most stress. It is possible that these effects seen
from long term separation would suggest that these preferential relationships are bonds
that exist over time but after long term separation become difficult to maintain.
140
Chapter Five
How Age Affects the Formation of Social Bonds,
Behaviour, Production and Health Parameters at
Regrouping
141
5.1 Introduction
Results from chapter two, three and four suggested that there were differences in the
social behaviour of cattle that were influenced by their age. In chapter two, younger
cattle (heifers) were more likely to form a preferential association with at least one other
member of the group. These bonds tended to be stronger amongst dyads that appeared
together more often and the association indices were higher in heifers than they were in
cows. This validated why heifers were utilised in the short term separation observation,
chapter three. During short term separation it appeared that a number of the familiar but
non-preferred partners did not show the same heightened stress response as some of the
focal individuals. This may be due to the differences in ages, and likely, experience
between these two cattle as focal individuals tended to be heifers, whereas familiar non-
preferred partners were cows. Furthermore, in the long term separation observation
(chapter four) the level of allogrooming was observed more often in cattle on farm A
(rearing herd) compared to cattle on farm B (main milking herd). This suggests that
younger cattle performed more grooming behaviour, a socio-positive behaviour
indicative of a preferential relationship (Val-Laillet et al., 2009; Waiblinger et al., 2006)
and this may be some of the reasoning behind the strong relationships observed in
younger cattle from chapter 4.
Under feral conditions, the matriarchal structure and organisation of cattle groups mean
that animals of different ages will be together; young calves are reared alongside their
mothers, peers and older siblings. The group would consist of very young, sub-adult,
adult and much older individuals. Under commercial conditions the groupings of
individuals are based on age, lactation stage, reproduction status or weight in order to
create homogenous groups for ease of management (St-Pierre & Thraen, 1999). This
142
begins at eight weeks of age at the most as the EU directive (97/2/EEC) states calves
must be housed together as a group. As cattle mature the relationships in an animal’s
life change and it isn’t until they join the main milking herd that they will encounter
individuals of considerably different ages when regrouping occurs.
This very dynamic social system can impact on the development of a relationship, and
the influence of age on changes in social environment has previously been recognised in
cattle. For example, multiparous cattle are only mildly affected by the removal of their
calves compared to primiparous cattle (Hopster et al., 1995); however, the mixing of
multiparous and primiparous cattle causes considerable disruption to grazing and social
behaviour (Phillips & Rind, 2001). The ability to cope with repeated changes in social
environment through regrouping and relocation has also been demonstrated to be
influenced by age; Veissier et al. (2001) found calves aged between 3 and 4 weeks old
to show an increased sensitivity to ACTH and a modified daily rhythm of activity when
regrouped. The authors did, however, report that there was no clear evidence that calves
were significantly stressed by the regrouping and relocation and so concluded that they
habituated to the process of regrouping (Veissier et al., 2001). Conversely, Raussi et al.
(2005) found heifers aged 11 months at first regrouping to not habituate to the
relocation and regrouping process. They observed aggression to be consistently induced
by the regrouping process and the behaviour of heifers was significantly affected, as
heifers would change their activity more often than controls. This would suggest that
cattle of different ages dealt with the process of regrouping and relocation differently.
Further investigation into these differences in ability to cope with dynamic social
systems that appear to be influenced by age is required in order to have a better
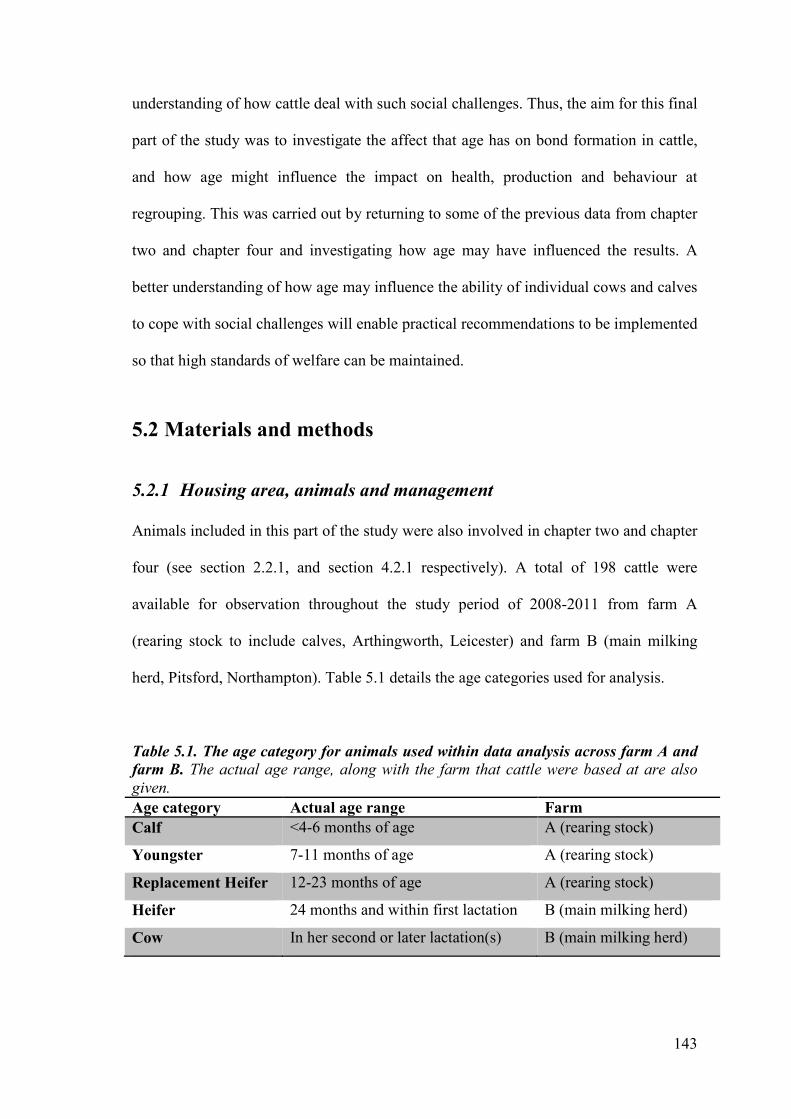
143
understanding of how cattle deal with such social challenges. Thus, the aim for this final
part of the study was to investigate the affect that age has on bond formation in cattle,
and how age might influence the impact on health, production and behaviour at
regrouping. This was carried out by returning to some of the previous data from chapter
two and chapter four and investigating how age may have influenced the results. A
better understanding of how age may influence the ability of individual cows and calves
to cope with social challenges will enable practical recommendations to be implemented
so that high standards of welfare can be maintained.
5.2 Materials and methods
5.2.1 Housing area, animals and management
Animals included in this part of the study were also involved in chapter two and chapter
four (see section 2.2.1, and section 4.2.1 respectively). A total of 198 cattle were
available for observation throughout the study period of 2008-2011 from farm A
(rearing stock to include calves, Arthingworth, Leicester) and farm B (main milking
herd, Pitsford, Northampton). Table 5.1 details the age categories used for analysis.
Table 5.1. The age category for animals used within data analysis across farm A and
farm B. The actual age range, along with the farm that cattle were based at are also
given.
Age category Actual age range Farm
Calf <4-6 months of age A (rearing stock)
Youngster 7-11 months of age A (rearing stock)
Replacement Heifer 12-23 months of age A (rearing stock)
Heifer 24 months and within first lactation B (main milking herd)
Cow In her second or later lactation(s) B (main milking herd)
144
5.2.2 Measurements
The data for this section of the study included the analysis of data previously collected
in chapters two and four as it was not possible to have a control group that had not
experienced regrouping due to commercial constraints. Overall herd parameters for
production and health were used along with information from animals that had not been
identified to have a preferred partner to help ascertain potential relationships. Therefore,
the social bonds between cattle were determined as for chapter two (see section 2.2.2.
for more details) and included data from July 2008 through to November 2011. The
behaviour of cattle on farm A experiencing separation was collected as in chapter four
(see section 4.2.3 for details) and allogrooming behaviour for cattle on both farms A
and B were collected as in chapter four (see section 4.2.3 for details). Production
parameters were also investigated including daily milk yield and monthly milk quality.
The data used was collected as described in section 4.2.3. For yield, the average
monthly yield for 110 focal cattle between 2008 and 2011 were calculated for the month
before regrouping, the month of regrouping and the month after regrouping. For milk
quality, the data from the month of regrouping, the month after regrouping, and the
month before regrouping for 103 focal cattle between 2008 and 2011, were used for
analysis. Health parameters were included in the overall assessment and included body
condition score, somatic cell count, and fertility. The data was collected as described in
section 4.2.3 for all parameters. For somatic cell count and fertility data from the month
of regrouping, the month after regrouping, and the month before regrouping for 103
focal cattle between 2008 and 2011, was used for analysis. Only the number of
inseminations that cattle had was used for analysis in this part of the study due to lack of
data available on the number of days between inseminations.
145
5.2.3 Statistical analysis
All statistical analysis was carried out using Minitab version 13.20 and 15.0, and data
presented as means ± SEM unless where otherwise stated. For all statistical analyses a
significance level of p<0.05 was accepted. Any data which was not normally distributed
was log transformed using the common logarithm log10 to normalise where required.
Where log transformation did not normalise data, non-parametric statistics were used.
Details of particular methods and tests employed are outlined below.
5.2.3a Bond formation
The effect of age on bond formation was investigated by exploring the association
between the number of preferred partners an individual had and the average association
index score of each focal with their age (years) using a Spearman’s rank correlation. In
order to investigate how regrouping may affect bond formation and preferential
relationships, an individual’s average association index score from the first observation
was compared to their average association index score on the second observation, a time
period which allowed for regrouping to have occurred. This was carried out using a
Wilcoxon’s signed rank test to test before and after for the same individual as data was
not normally distributed. The effect of age on this change in average association
strength was investigated further by analysing the difference between age categories
through the use of a Kruskal-Wallis test followed by a multiple comparisons post hoc
test for Kruskal-Wallis (Siegel & Castellan, 1988). In order to have a better
understanding of the dynamics of social relationships and the influence of age, the
impact that long term separation had on bond formation was investigated by comparing
the average association strength before and after long term separation (outlined in
section 4.2) by age. The changes in average association strength across time were
146
analysed using a general linear model with the model including time (before or after)
and age category (replacement heifer, 12-23 months; youngster, 7-11 months).
Categories of age were used to reflect grouping under normal management.
5.2.3b Behaviour
The influence of age on behaviour at regrouping was investigated by comparing the
difference in behaviour when cattle were reunited between the two different age
categories of replacement heifer and youngsters. Only these two groups were observed
for behavioural analysis due to movement in control groups before the end of the
separation period for management reasons. The proportion of time cattle spent drinking,
eating, lying down, standing, walking, and being alert was compared using a Mann-
Whitney U test as it was comparing two different samples that were not normally
distributed. The difference between age categories and the frequency of both negative
and positive behaviours performed was analysed using a Pearson’s chi-squared analysis.
The influence of age on allogrooming behaviour was analysed for both duration
(seconds) and frequency. Duration was log transformed and a one-way ANOVA
performed to investigate differences between the four age categories (cow, heifer,
youngsters, calf), followed by Fisher’s a priori LSD test for pair-wise comparisons.
Pearson’s chi-squared analysis was used to analyse differences in frequency of
allogrooming between the four age categories.
5.2.3c Production
A number of production parameters were investigated. These included the milk yield
and milk quality. Details of analysis are outlined below for each parameter.
147
Yield
In order to investigate how regrouping affected monthly average yield across age
(years), the difference between time periods (the month before regrouping compared to
the month of regrouping, the month of regrouping compared to the month after
regrouping, and the month before regrouping compared to the month after regrouping)
were calculated and used for analysis. Each time period was analysed separately to fully
investigate how regrouping affected milk yield across different ages using Kruskal-
Wallis tests.
Quality
As for yield, in order to investigate how regrouping at different ages (years) affected the
quality parameters of milk yield (kg), %protein, %fat, and price paid for the milk (pence
per litre, PPL), the difference between time periods for each of the quality parameters
were calculated and used for analysis. Each time period was analysed separately by age
using a Kruskal-Wallis test, apart from %fat for the month of regrouping and after
regrouping as data was normally distributed and so a one-way ANOVA was utilised.
5.2.3d Health Parameters
A number of health parameters were investigated. This included somatic cell count for
cattle on farm B only, and the fertility of cattle on both farm A and farm B. See below
for details on analysis carried out for each health parameter.
148
Somatic cell count
In order to investigate whether there was a significant difference between age groups on
somatic cell count (SCC) level when experiencing regrouping the difference between
each of the time periods was calculated and used for analysis, as for yield and quality
parameters. As data was not normally distributed a Kruskal-Wallis test was employed to
test for changes in somatic cell counts due to regrouping between age groups (year
categories).
Fertility
To investigate the influence of age (years) on fertility levels at regrouping, the changes
in the number of inseminations that cattle had from the month before regrouping, to the
month of regrouping, and to the month after regrouping were analysed using a Kruskal-
Wallis test as data was not normally distributed.
5.3 Results
5.3.1 The influence of age on bond formation
Cattle on farm A had significantly higher mean association index values (0.23 ± 0.02)
compared to cattle on farm B (0.09 ± 0.001). The correlation between age (years) and
average association strength (AI) was negative and significant on both farms (farm A
rs= -0.506, p=0.000; farm B rs= -0.165, p=0.027); as cattle got older they had a lower
average association strength and so fewer bonds (figure 5.1). Age also had a negative
correlation between the number of preferred partners that cattle had (Farm A rs= -0.338,
p=0.000; farm B rs= -0.208, p=0.005) with younger animals having a higher number of
preferred partners (figure 5.2).
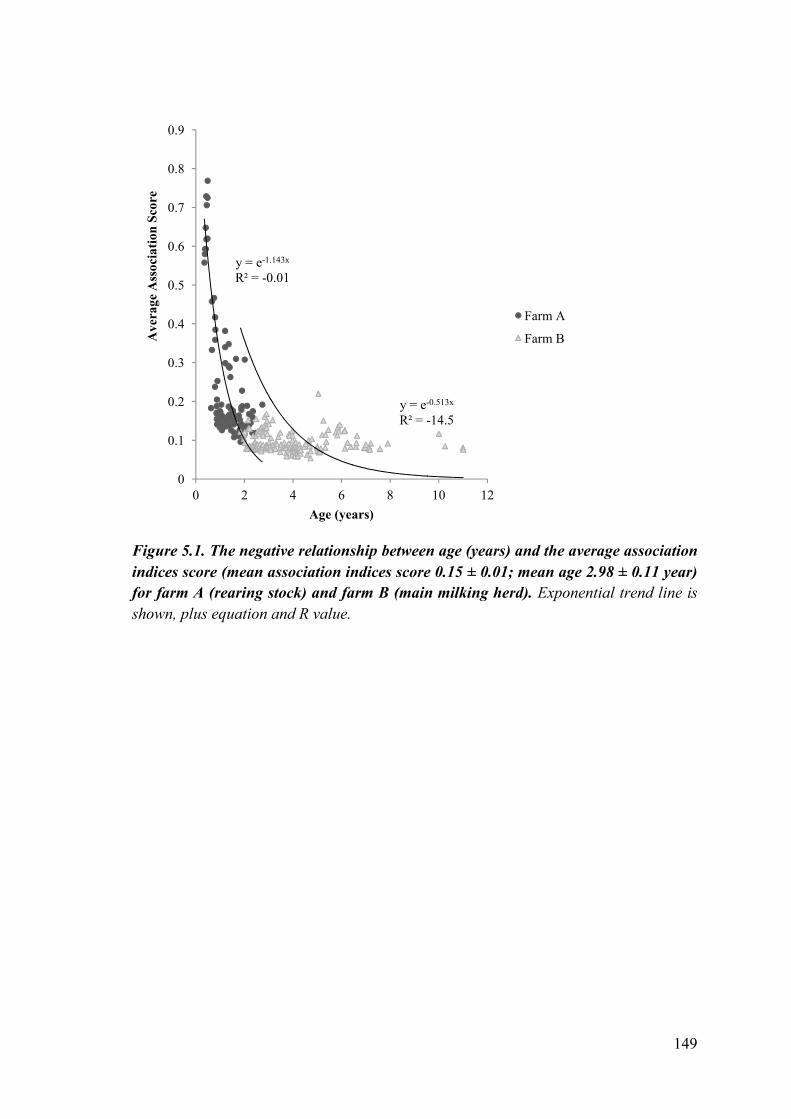
149
Figure 5.1. The negative relationship between age (years) and the average association
indices score (mean association indices score 0.15 ± 0.01; mean age 2.98 ± 0.11 year)
for farm A (rearing stock) and farm B (main milking herd). Exponential trend line is
shown, plus equation and R value.
y = e-1.143x
R² = -0.01
y = e-0.513x
R² = -14.5
0
0.1
0.2
0.3
0.4
0.5
0.6
0.7
0.8
0.9
0 2 4 6 8 10 12
Av
era
ge
Ass
oci
ati
on
Sco
re
Age (years)
Farm A
Farm B
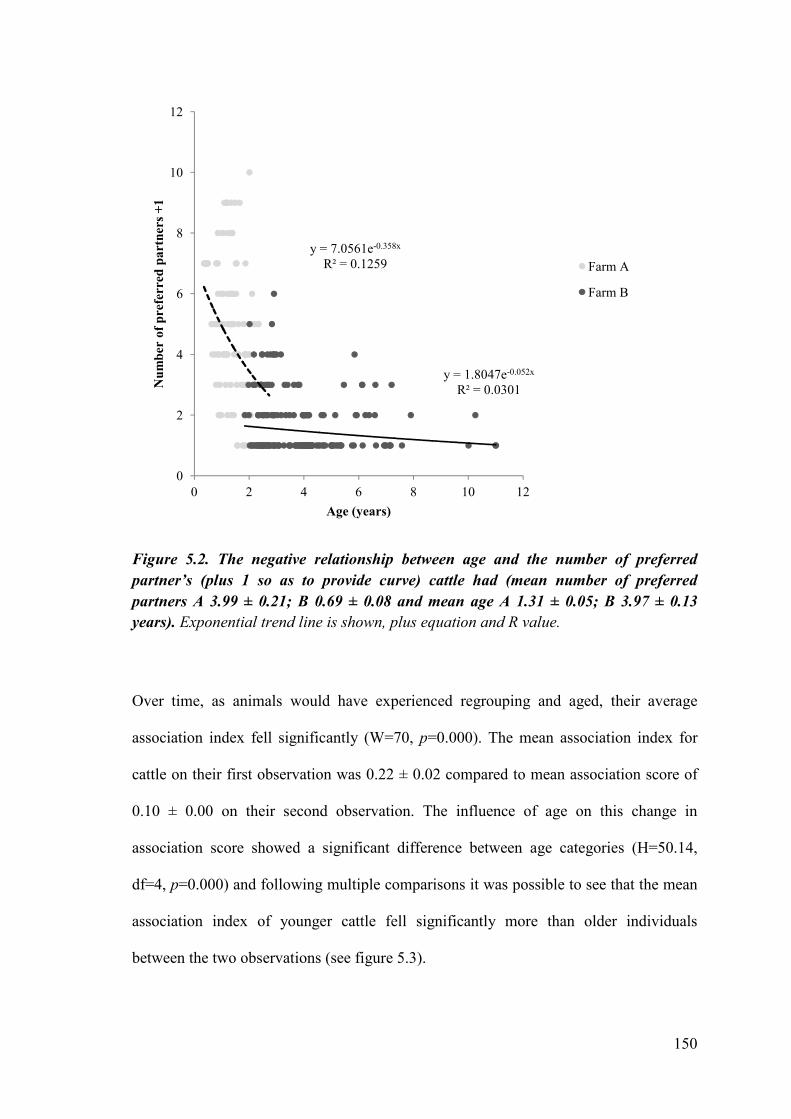
150
Figure 5.2. The negative relationship between age and the number of preferred
partner’s (plus 1 so as to provide curve) cattle had (mean number of preferred
partners A 3.99 ± 0.21; B 0.69 ± 0.08 and mean age A 1.31 ± 0.05; B 3.97 ± 0.13
years). Exponential trend line is shown, plus equation and R value.
Over time, as animals would have experienced regrouping and aged, their average
association index fell significantly (W=70, p=0.000). The mean association index for
cattle on their first observation was 0.22 ± 0.02 compared to mean association score of
0.10 ± 0.00 on their second observation. The influence of age on this change in
association score showed a significant difference between age categories (H=50.14,
df=4, p=0.000) and following multiple comparisons it was possible to see that the mean
association index of younger cattle fell significantly more than older individuals
between the two observations (see figure 5.3).
y = 7.0561e-0.358x
R² = 0.1259
y = 1.8047e-0.052x
R² = 0.0301
0
2
4
6
8
10
12
0 2 4 6 8 10 12
Nu
mb
er o
f p
refe
rred
pa
rtn
ers
+1
Age (years)
Farm A
Farm B
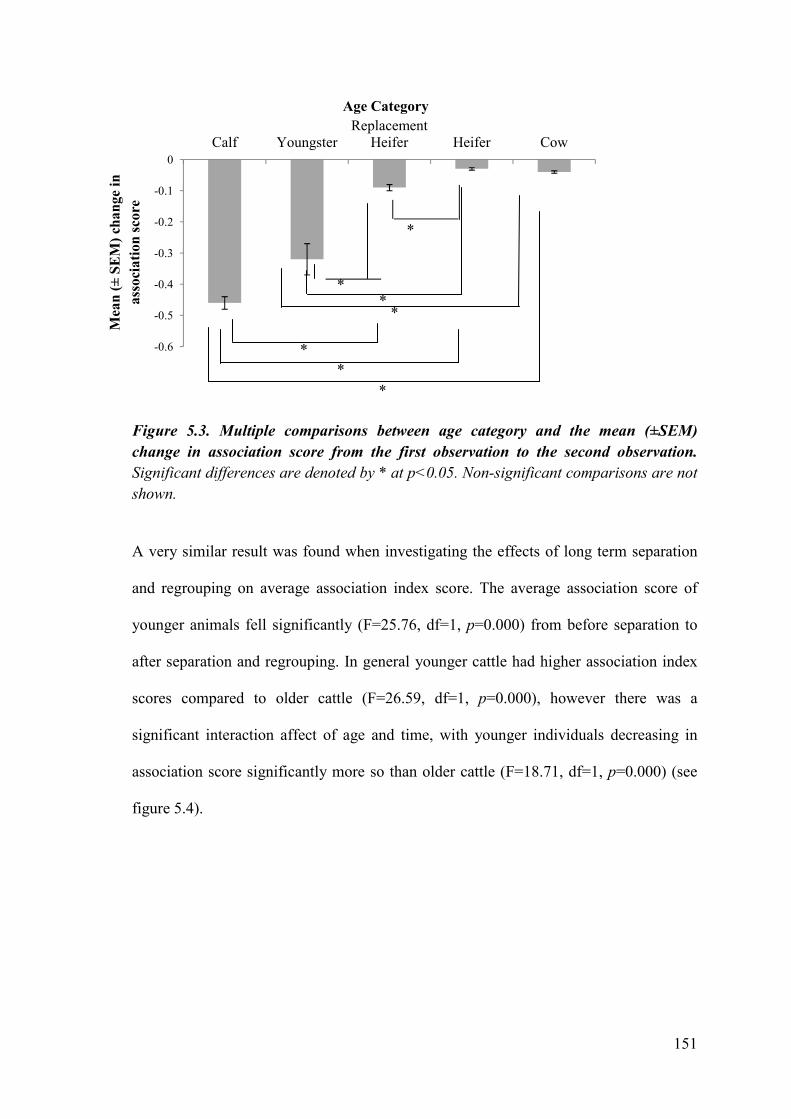
151
Figure 5.3. Multiple comparisons between age category and the mean (±SEM)
change in association score from the first observation to the second observation.
Significant differences are denoted by * at p<0.05. Non-significant comparisons are not
shown.
A very similar result was found when investigating the effects of long term separation
and regrouping on average association index score. The average association score of
younger animals fell significantly (F=25.76, df=1, p=0.000) from before separation to
after separation and regrouping. In general younger cattle had higher association index
scores compared to older cattle (F=26.59, df=1, p=0.000), however there was a
significant interaction affect of age and time, with younger individuals decreasing in
association score significantly more so than older cattle (F=18.71, df=1, p=0.000) (see
figure 5.4).
-0.6
-0.5
-0.4
-0.3
-0.2
-0.1
0
Calf YoungsterReplacement
Heifer Heifer Cow
Age Category
* *
*
*
*
* *
Mea
n (
± S
EM
) ch
an
ge
in
ass
oci
ati
on
sco
re
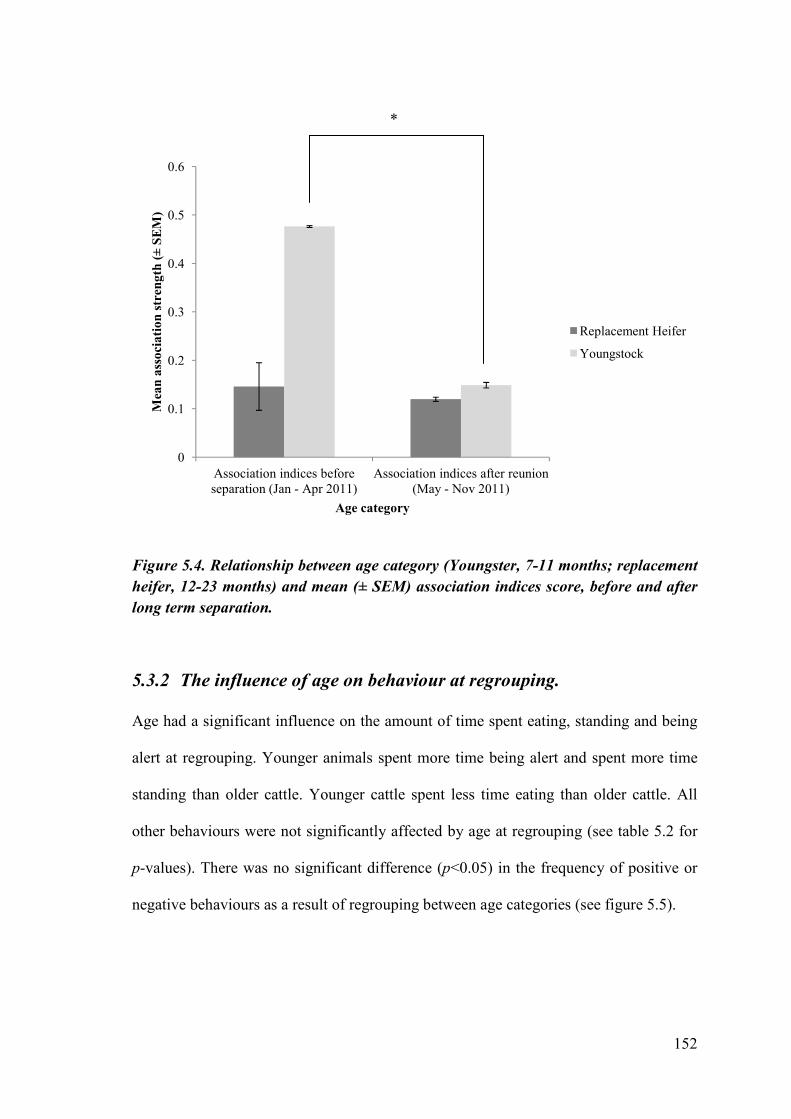
152
Figure 5.4. Relationship between age category (Youngster, 7-11 months; replacement
heifer, 12-23 months) and mean (± SEM) association indices score, before and after
long term separation.
5.3.2 The influence of age on behaviour at regrouping.
Age had a significant influence on the amount of time spent eating, standing and being
alert at regrouping. Younger animals spent more time being alert and spent more time
standing than older cattle. Younger cattle spent less time eating than older cattle. All
other behaviours were not significantly affected by age at regrouping (see table 5.2 for
p-values). There was no significant difference (p<0.05) in the frequency of positive or
negative behaviours as a result of regrouping between age categories (see figure 5.5).
0
0.1
0.2
0.3
0.4
0.5
0.6
Association indices before separation (Jan - Apr 2011)
Association indices after reunion (May - Nov 2011)
Mea
n a
sso
cia
tio
n s
tren
gth
(±
SE
M)
Age category
Replacement Heifer
Youngstock
*
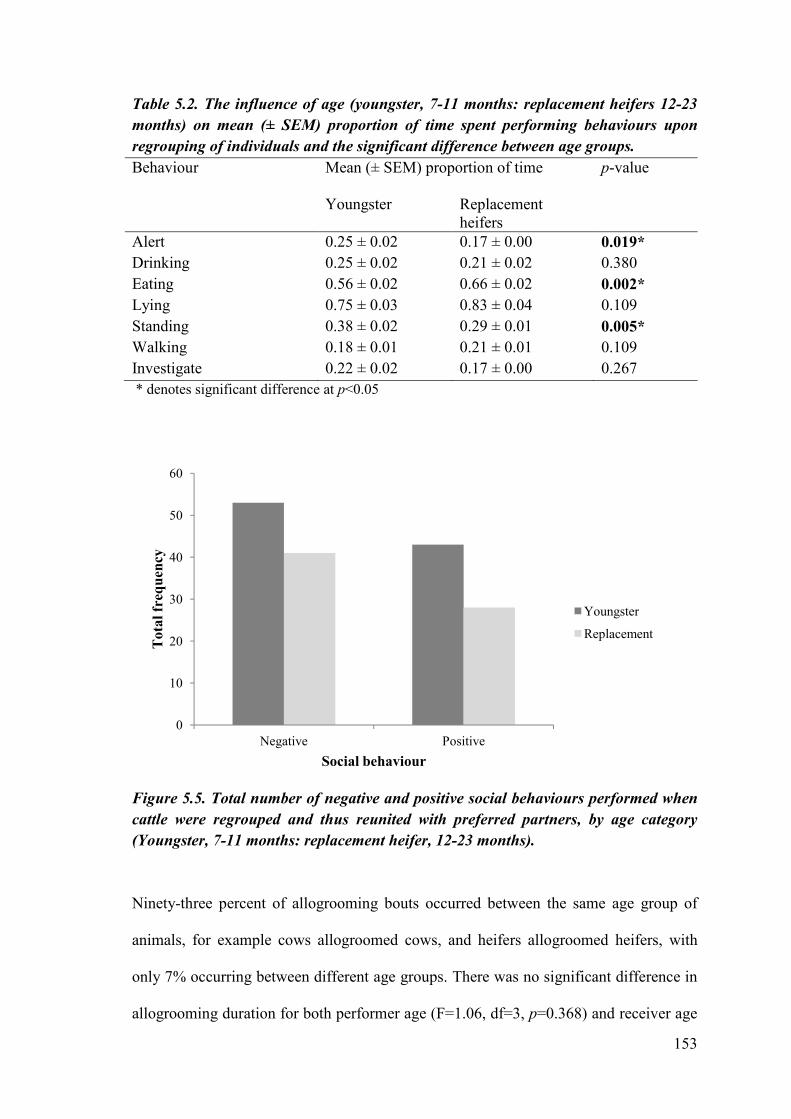
153
Table 5.2. The influence of age (youngster, 7-11 months: replacement heifers 12-23
months) on mean (± SEM) proportion of time spent performing behaviours upon
regrouping of individuals and the significant difference between age groups.
Behaviour Mean (± SEM) proportion of time
p-value
Youngster Replacement heifers
Alert 0.25 ± 0.02 0.17 ± 0.00 0.019*
Drinking 0.25 ± 0.02 0.21 ± 0.02 0.380 Eating 0.56 ± 0.02 0.66 ± 0.02 0.002*
Lying 0.75 ± 0.03 0.83 ± 0.04 0.109 Standing 0.38 ± 0.02 0.29 ± 0.01 0.005*
Walking 0.18 ± 0.01 0.21 ± 0.01 0.109 Investigate 0.22 ± 0.02 0.17 ± 0.00 0.267 * denotes significant difference at p<0.05
Figure 5.5. Total number of negative and positive social behaviours performed when
cattle were regrouped and thus reunited with preferred partners, by age category
(Youngster, 7-11 months: replacement heifer, 12-23 months).
Ninety-three percent of allogrooming bouts occurred between the same age group of
animals, for example cows allogroomed cows, and heifers allogroomed heifers, with
only 7% occurring between different age groups. There was no significant difference in
allogrooming duration for both performer age (F=1.06, df=3, p=0.368) and receiver age
0
10
20
30
40
50
60
Negative Positive
Tota
l fr
equ
ency
Social behaviour
Youngster
Replacement
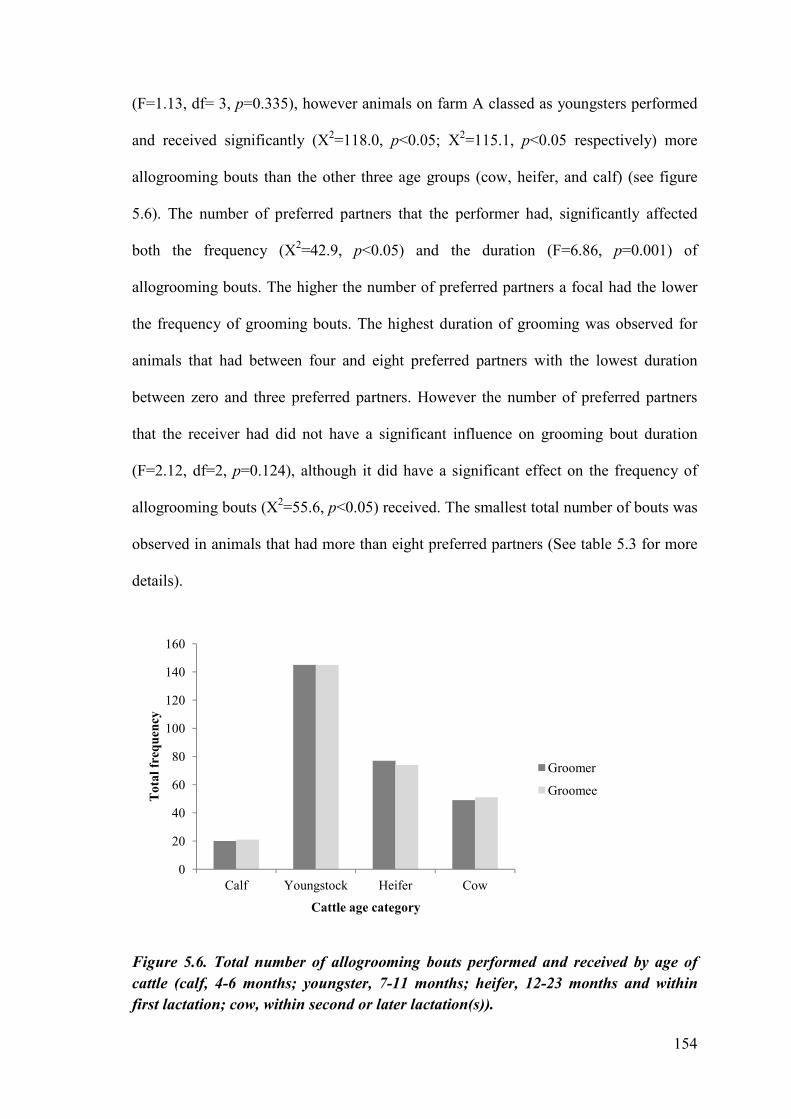
154
(F=1.13, df= 3, p=0.335), however animals on farm A classed as youngsters performed
and received significantly (X2=118.0, p<0.05; X2=115.1, p<0.05 respectively) more
allogrooming bouts than the other three age groups (cow, heifer, and calf) (see figure
5.6). The number of preferred partners that the performer had, significantly affected
both the frequency (X2=42.9, p<0.05) and the duration (F=6.86, p=0.001) of
allogrooming bouts. The higher the number of preferred partners a focal had the lower
the frequency of grooming bouts. The highest duration of grooming was observed for
animals that had between four and eight preferred partners with the lowest duration
between zero and three preferred partners. However the number of preferred partners
that the receiver had did not have a significant influence on grooming bout duration
(F=2.12, df=2, p=0.124), although it did have a significant effect on the frequency of
allogrooming bouts (X2=55.6, p<0.05) received. The smallest total number of bouts was
observed in animals that had more than eight preferred partners (See table 5.3 for more
details).
Figure 5.6. Total number of allogrooming bouts performed and received by age of
cattle (calf, 4-6 months; youngster, 7-11 months; heifer, 12-23 months and within
first lactation; cow, within second or later lactation(s)).
0
20
40
60
80
100
120
140
160
Calf Youngstock Heifer Cow
To
tal
freq
uen
cy
Cattle age category
Groomer
Groomee
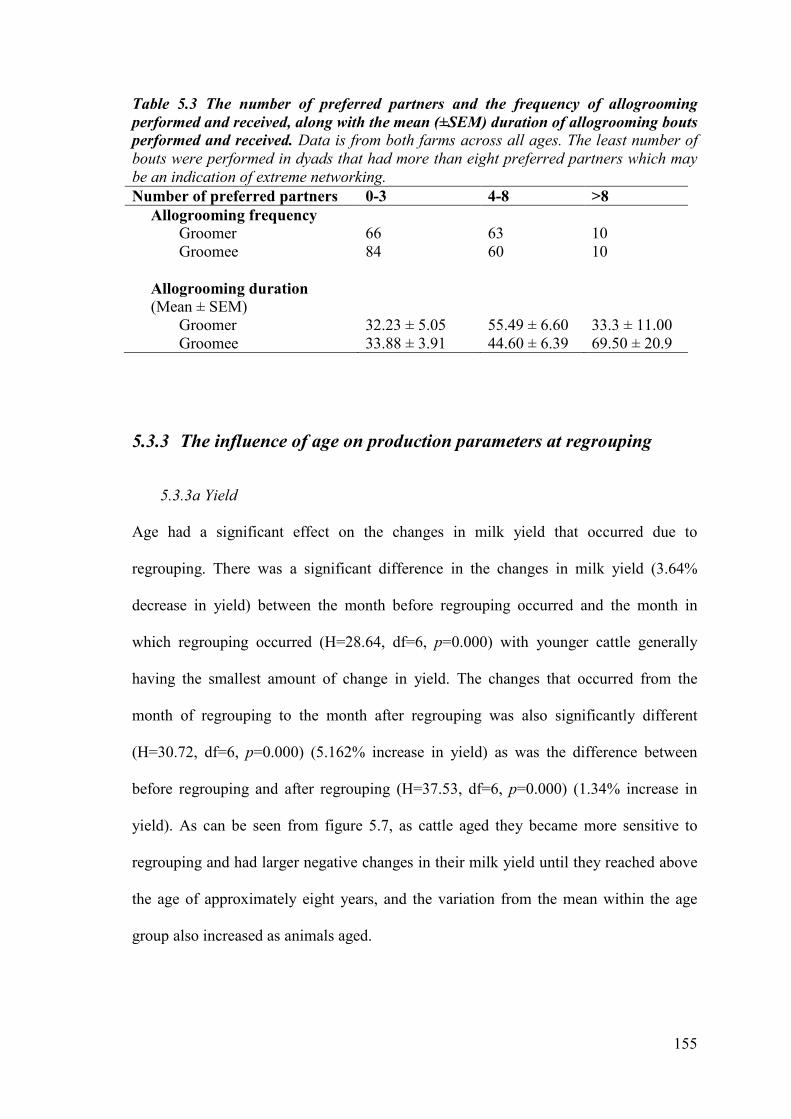
155
Table 5.3 The number of preferred partners and the frequency of allogrooming
performed and received, along with the mean (±SEM) duration of allogrooming bouts
performed and received. Data is from both farms across all ages. The least number of
bouts were performed in dyads that had more than eight preferred partners which may
be an indication of extreme networking.
Number of preferred partners 0-3 4-8 >8
Allogrooming frequency Groomer 66 63 10 Groomee 84 60 10
Allogrooming duration
(Mean ± SEM)
Groomer 32.23 ± 5.05 55.49 ± 6.60 33.3 ± 11.00 Groomee 33.88 ± 3.91 44.60 ± 6.39 69.50 ± 20.9
5.3.3 The influence of age on production parameters at regrouping
5.3.3a Yield
Age had a significant effect on the changes in milk yield that occurred due to
regrouping. There was a significant difference in the changes in milk yield (3.64%
decrease in yield) between the month before regrouping occurred and the month in
which regrouping occurred (H=28.64, df=6, p=0.000) with younger cattle generally
having the smallest amount of change in yield. The changes that occurred from the
month of regrouping to the month after regrouping was also significantly different
(H=30.72, df=6, p=0.000) (5.162% increase in yield) as was the difference between
before regrouping and after regrouping (H=37.53, df=6, p=0.000) (1.34% increase in
yield). As can be seen from figure 5.7, as cattle aged they became more sensitive to
regrouping and had larger negative changes in their milk yield until they reached above
the age of approximately eight years, and the variation from the mean within the age
group also increased as animals aged.
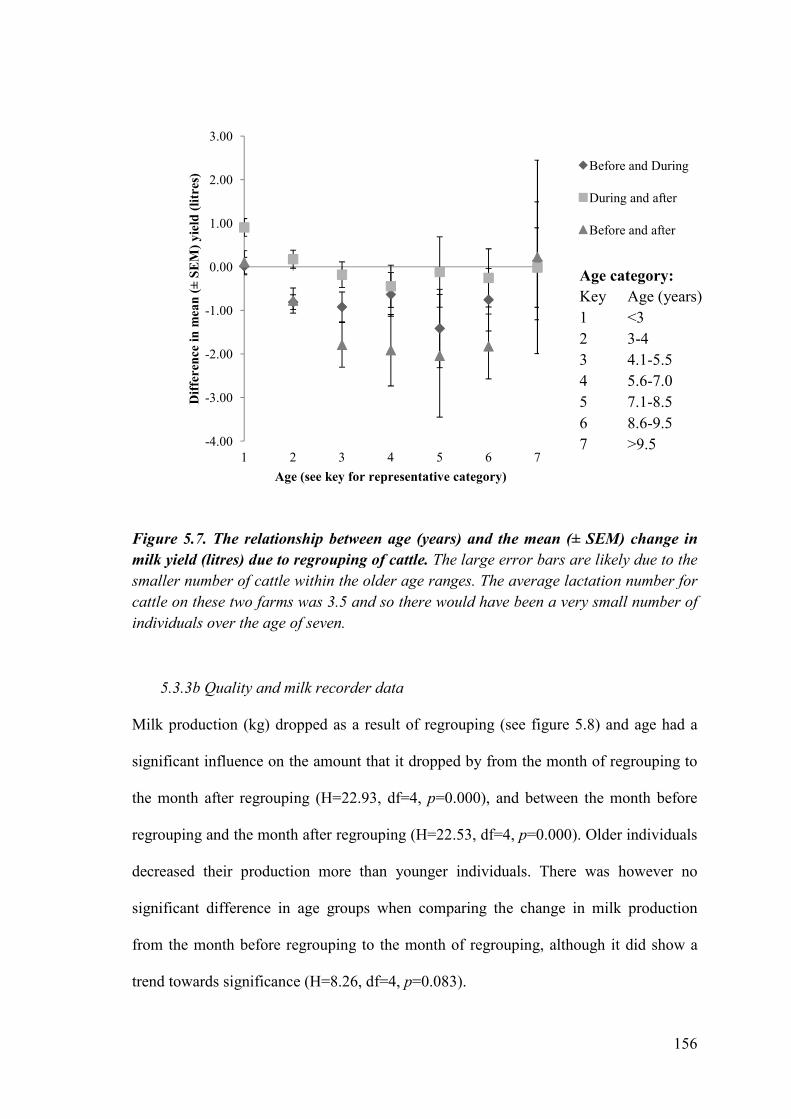
156
Figure 5.7. The relationship between age (years) and the mean (± SEM) change in
milk yield (litres) due to regrouping of cattle. The large error bars are likely due to the
smaller number of cattle within the older age ranges. The average lactation number for
cattle on these two farms was 3.5 and so there would have been a very small number of
individuals over the age of seven.
5.3.3b Quality and milk recorder data
Milk production (kg) dropped as a result of regrouping (see figure 5.8) and age had a
significant influence on the amount that it dropped by from the month of regrouping to
the month after regrouping (H=22.93, df=4, p=0.000), and between the month before
regrouping and the month after regrouping (H=22.53, df=4, p=0.000). Older individuals
decreased their production more than younger individuals. There was however no
significant difference in age groups when comparing the change in milk production
from the month before regrouping to the month of regrouping, although it did show a
trend towards significance (H=8.26, df=4, p=0.083).
-4.00
-3.00
-2.00
-1.00
0.00
1.00
2.00
3.00
1 2 3 4 5 6 7
Dif
fere
nce
in
mea
n (
±S
EM
) y
ield
(li
tres
)
Age (see key for representative category)
Before and During
During and after
Before and after
Age category:
Key Age (years) 1 <3 2 3-4 3 4.1-5.5 4 5.6-7.0 5 7.1-8.5 6 8.6-9.5 7 >9.5
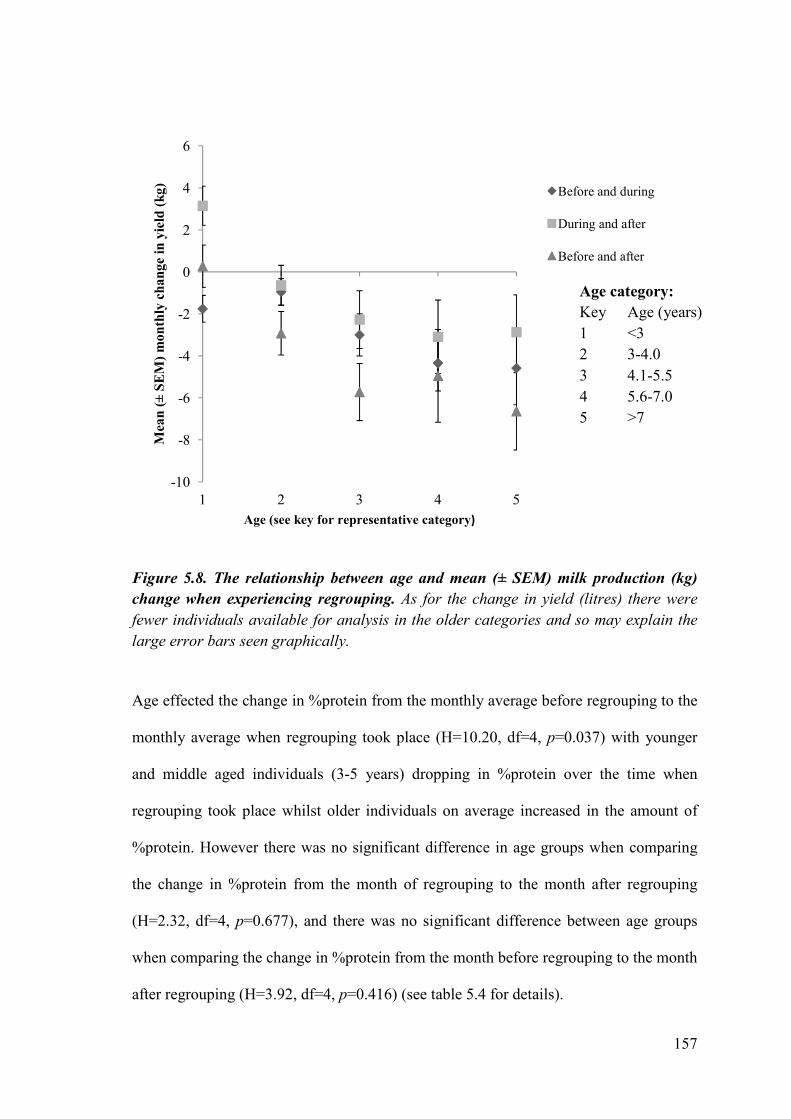
157
Figure 5.8. The relationship between age and mean (± SEM) milk production (kg)
change when experiencing regrouping. As for the change in yield (litres) there were
fewer individuals available for analysis in the older categories and so may explain the
large error bars seen graphically.
Age effected the change in %protein from the monthly average before regrouping to the
monthly average when regrouping took place (H=10.20, df=4, p=0.037) with younger
and middle aged individuals (3-5 years) dropping in %protein over the time when
regrouping took place whilst older individuals on average increased in the amount of
%protein. However there was no significant difference in age groups when comparing
the change in %protein from the month of regrouping to the month after regrouping
(H=2.32, df=4, p=0.677), and there was no significant difference between age groups
when comparing the change in %protein from the month before regrouping to the month
after regrouping (H=3.92, df=4, p=0.416) (see table 5.4 for details).
-10
-8
-6
-4
-2
0
2
4
6
1 2 3 4 5
Mea
n (
±S
EM
) m
on
thly
ch
an
ge
in y
ield
(k
g)
Age (see key for representative category)
Before and during
During and after
Before and after
Age category:
Key Age (years) 1 <3 2 3-4.0 3 4.1-5.5 4 5.6-7.0 5 >7
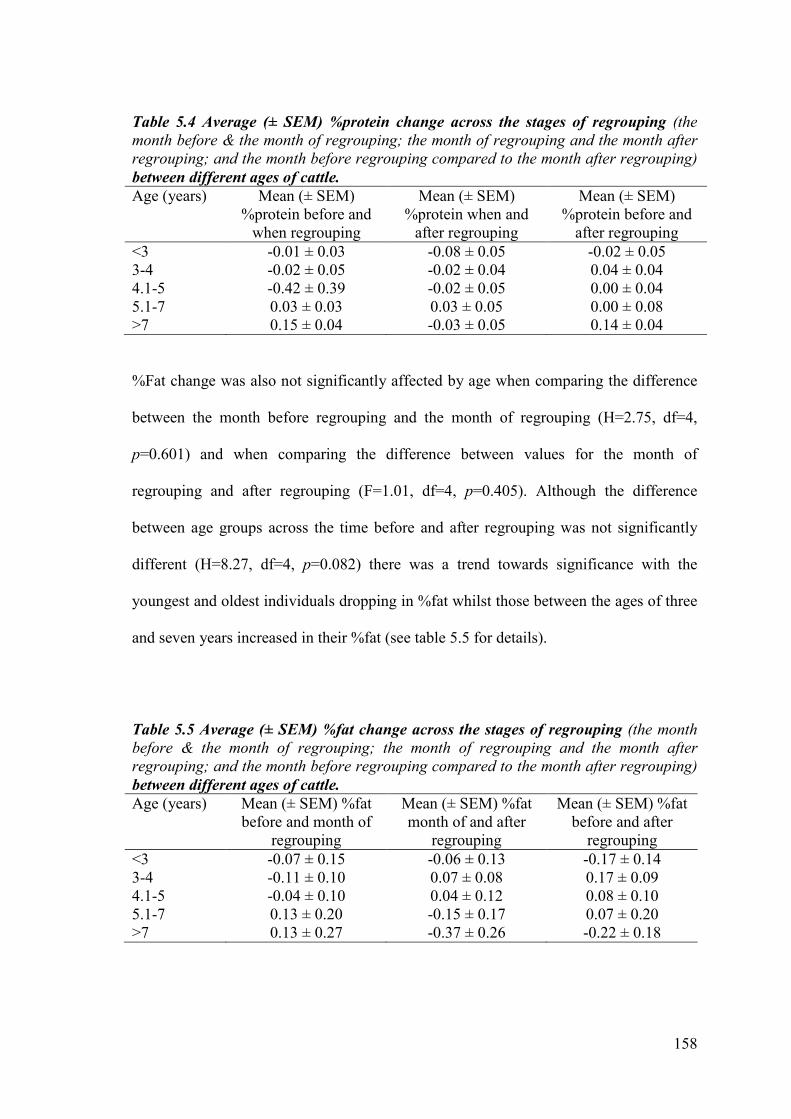
158
Table 5.4 Average (± SEM) %protein change across the stages of regrouping (the
month before & the month of regrouping; the month of regrouping and the month after
regrouping; and the month before regrouping compared to the month after regrouping)
between different ages of cattle.
Age (years) Mean (± SEM) %protein before and
when regrouping
Mean (± SEM) %protein when and
after regrouping
Mean (± SEM) %protein before and
after regrouping <3 -0.01 ± 0.03 -0.08 ± 0.05 -0.02 ± 0.05 3-4 -0.02 ± 0.05 -0.02 ± 0.04 0.04 ± 0.04 4.1-5 -0.42 ± 0.39 -0.02 ± 0.05 0.00 ± 0.04 5.1-7 0.03 ± 0.03 0.03 ± 0.05 0.00 ± 0.08 >7 0.15 ± 0.04 -0.03 ± 0.05 0.14 ± 0.04
%Fat change was also not significantly affected by age when comparing the difference
between the month before regrouping and the month of regrouping (H=2.75, df=4,
p=0.601) and when comparing the difference between values for the month of
regrouping and after regrouping (F=1.01, df=4, p=0.405). Although the difference
between age groups across the time before and after regrouping was not significantly
different (H=8.27, df=4, p=0.082) there was a trend towards significance with the
youngest and oldest individuals dropping in %fat whilst those between the ages of three
and seven years increased in their %fat (see table 5.5 for details).
Table 5.5 Average (± SEM) %fat change across the stages of regrouping (the month
before & the month of regrouping; the month of regrouping and the month after
regrouping; and the month before regrouping compared to the month after regrouping)
between different ages of cattle.
Age (years) Mean (± SEM) %fat before and month of
regrouping
Mean (± SEM) %fat month of and after
regrouping
Mean (± SEM) %fat before and after
regrouping <3 -0.07 ± 0.15 -0.06 ± 0.13 -0.17 ± 0.14 3-4 -0.11 ± 0.10 0.07 ± 0.08 0.17 ± 0.09 4.1-5 -0.04 ± 0.10 0.04 ± 0.12 0.08 ± 0.10 5.1-7 0.13 ± 0.20 -0.15 ± 0.17 0.07 ± 0.20 >7 0.13 ± 0.27 -0.37 ± 0.26 -0.22 ± 0.18
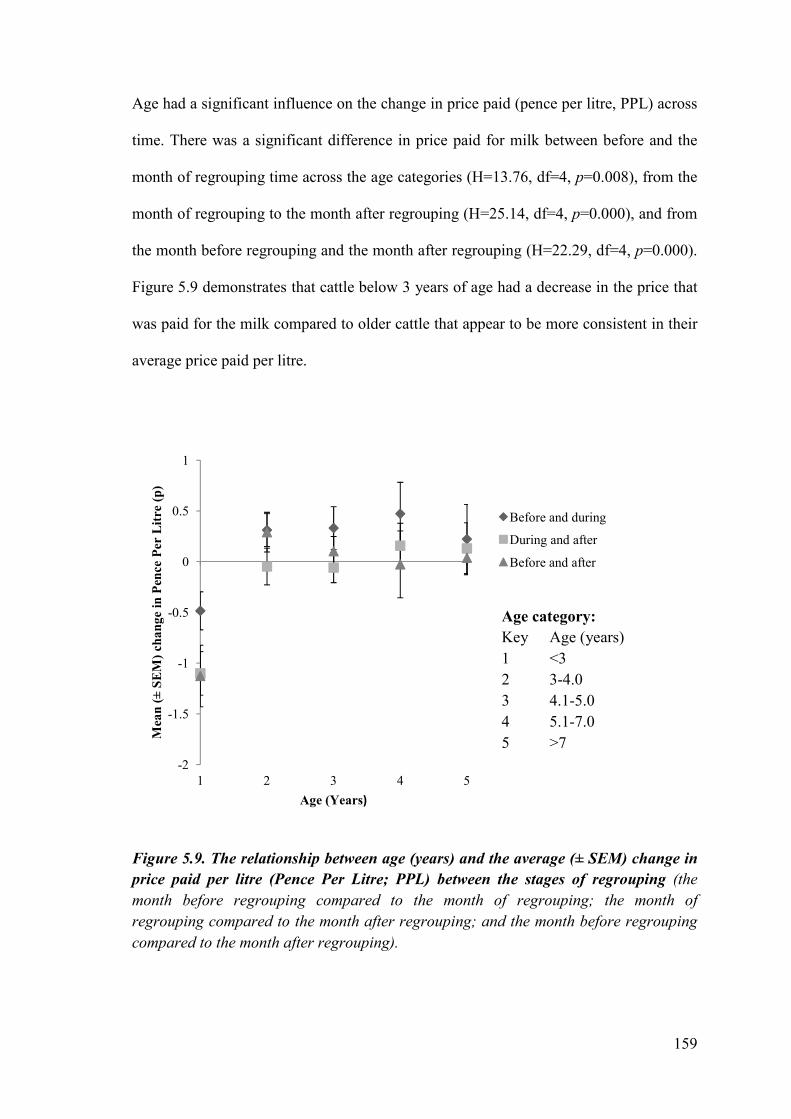
159
Age had a significant influence on the change in price paid (pence per litre, PPL) across
time. There was a significant difference in price paid for milk between before and the
month of regrouping time across the age categories (H=13.76, df=4, p=0.008), from the
month of regrouping to the month after regrouping (H=25.14, df=4, p=0.000), and from
the month before regrouping and the month after regrouping (H=22.29, df=4, p=0.000).
Figure 5.9 demonstrates that cattle below 3 years of age had a decrease in the price that
was paid for the milk compared to older cattle that appear to be more consistent in their
average price paid per litre.
Figure 5.9. The relationship between age (years) and the average (± SEM) change in
price paid per litre (Pence Per Litre; PPL) between the stages of regrouping (the
month before regrouping compared to the month of regrouping; the month of
regrouping compared to the month after regrouping; and the month before regrouping
compared to the month after regrouping).
-2
-1.5
-1
-0.5
0
0.5
1
1 2 3 4 5
Mea
n (
±S
EM
) ch
an
ge
in P
ence
Per
Lit
re (
p)
Age (Years)
Before and during
During and after
Before and after
Age category:
Key Age (years) 1 <3 2 3-4.0 3 4.1-5.0 4 5.1-7.0 5 >7
160
5.3.4 The influence of age on health parameters at regrouping
5.3.4a Somatic cell count
The degree of change on somatic cell count (SCC) between the months before
regrouping to the months after regrouping was significantly different between age
groups (H=17.51, df=4, p=0.002) with younger cattle (aged between 2 and 5 years)
showing a decrease in SCC whilst older cattle (5 years or more) showed an increase in
SCC. The change in SCC between the month before regrouping and the month of
regrouping was not significantly different between age groups (H=1.49, df=4, p=0.829),
and it was not significantly different between age groups from the month of regrouping
to the month after regrouping (H=8.74, df=4, p=0.068), although there was a potential
trend towards a significant difference with younger cattle dropping in SCC compared to
older cattle.
5.3.4b Fertility
There was no significant difference in the number of inseminations given from the
month before regrouping to the month of regrouping across the different age groups
(H=6.81, df=4, p=0.146). There was no significant difference across the age groups in
the number of inseminations given from the month of regrouping to the month after
regrouping (H=1.09, df=4, p=0.895), and there was no significant difference on the
number of inseminations given before the month of regrouping to the month after
regrouping across the different age categories (H=1.11, df=4, p=0.892). In general older
cattle required more inseminations than younger cattle but the difference in age groups
was not significant (see figure 5.10).
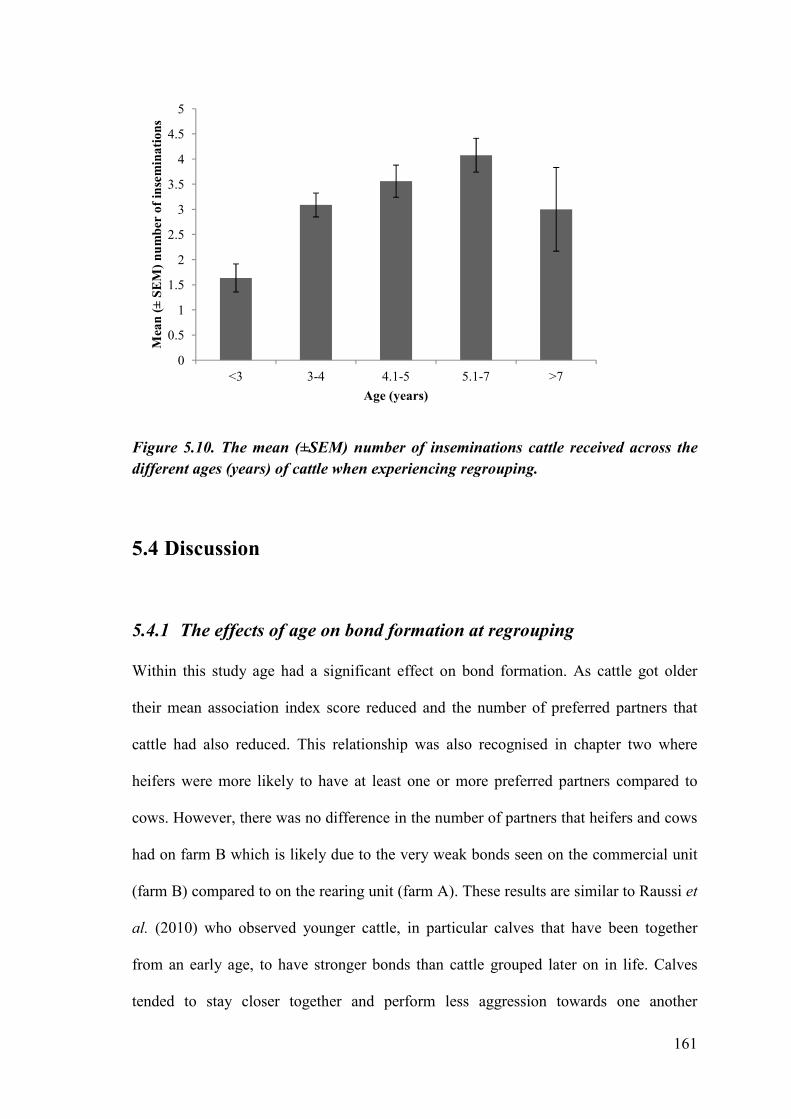
161
Figure 5.10. The mean (±SEM) number of inseminations cattle received across the
different ages (years) of cattle when experiencing regrouping.
5.4 Discussion
5.4.1 The effects of age on bond formation at regrouping
Within this study age had a significant effect on bond formation. As cattle got older
their mean association index score reduced and the number of preferred partners that
cattle had also reduced. This relationship was also recognised in chapter two where
heifers were more likely to have at least one or more preferred partners compared to
cows. However, there was no difference in the number of partners that heifers and cows
had on farm B which is likely due to the very weak bonds seen on the commercial unit
(farm B) compared to on the rearing unit (farm A). These results are similar to Raussi et
al. (2010) who observed younger cattle, in particular calves that have been together
from an early age, to have stronger bonds than cattle grouped later on in life. Calves
tended to stay closer together and perform less aggression towards one another
0
0.5
1
1.5
2
2.5
3
3.5
4
4.5
5
<3 3-4 4.1-5 5.1-7 >7
Mea
n (
±S
EM
) n
um
ber
of
inse
min
ati
on
s
Age (years)
162
compared to cattle that were grouped later in life, even after regrouping (Raussi et al.,
2010).
As calves reared in commercial conditions are separated very early on from their
mothers and then grouped with animals of very similar age, they are likely to replace
the mother attachment figure with an alternative, their peers (Veissier & Le Neindre,
1989). This is a process that naturally occurs at the time of weaning where cows will
start to prevent their calves from suckling more often and thus calves’ attraction to other
calves increases, making peers an important part of a young calf’s social group
(Veissier et al., 1990a). However, after repeated regrouping and relocation calves show
a lack of interest in unfamiliar calves and reduce the amount of sniffing of unfamiliar
calves as they are regrouped (Veissier et al., 2001). This has been suggested as a sign
that calves give up forming relationships with others due to the repeated regrouping and
relocation (Færevik et al., 2006). This may also be the case with cattle on commercial
dairy units. As animals age they experience more regrouping and relocation as they
move through the different groups and so give up forming strong associations and so a
number of weak associations are evident as was seen in chapter two.
As cattle aged and experienced changes in their social environments, their mean
association index score fell. This fall in association indices appeared to be more severe
in younger cattle compared to older cattle. This result appeared after cattle had
experienced the long term separation from preferred group mates that occurred in
chapter four. This change in association indices would suggest that previous social
relationships were not maintained after the long term separation. Younger cattle started
with higher mean association index values and so this may be one of the reasons why
163
such a dramatic fall in mean association index values was seen. Furthermore, younger
cattle started off in much smaller groups and as they aged they were mixed in to a much
larger group; in observation one younger cattle were in much smaller groups than they
were in observation two. Smaller groups tend to be more stable and due to a lower
number of potential partners, bonds may be stronger in smaller groups (Schweitzer et
al., 2011). However, this is in contrast to the results observed by Færevik et al. (2007);
where calves in larger groups (16) compared to smaller groups sizes (8) were found to
be in closer proximity with others and appeared to have a preference for a familiar
individual when in a larger group. This may however be due to cattle requiring more
support in larger groups in order to gain access to resources and the two group sizes
compared by Færevik et al. (2007) were still both small compared to the group sizes on
farm A and farm B.
The fall in mean association index value as cattle aged would suggest that even from an
early age, as cattle experience change in their social environment they will change their
sociability. A fall in mean association scores from one observation to the next would
suggest that cattle rarely held onto the same bonds as from their previous observations
and were associating more randomly than they had done before in smaller groups. This
may be a part of the regrouping process and in order to adjust to such a dynamic social
environment cattle have to amend the associations that they make. This process of
change in social associations may get easier as cattle age as cattle give up forming
preferential partnerships and so adapt to a more solitary lifestyle under commercial
conditions.
164
5.4.2 The effects of age on behaviour at regrouping
After cattle had experienced long term separation from preferred group mates they were
reunited with their home group which would have involved some elements of
regrouping as over this time it was evident that social relationships had changed as was
seen in the fall in mean association indices. For the period where regrouping had taken
place there were differences in eating behaviour, standing, and being alert between the
different age groups. Younger cattle spent less time eating and more time standing
compared to their older counterparts and younger animals were more alert than older
individuals when in separate groups and so was not an artefact of dominance. This
change in behaviour between different aged animals may suggest that younger
individuals may be more sensitive to changes in their social environment and so may
benefit more from stable groupings and where this is not possible, the presence of a
preferred partner during times of stress may help them to cope with the change. In
contrast older individuals appear to no longer respond to this regrouping process. This
may be due to habituation to such practices; however due to older individuals unlikely
to have a preferred partnership, the effects of separation and regrouping are reduced.
There was no significant difference between animals of different ages and the number
of negative behaviours seen. This is in contrast to results often reported for regrouping
adult cattle where there is an increase in the amount of aggression shown at regrouping
(Brakel & Leis, 1976; Hasegawa et al., 1997; Mench et al., 1990). This may suggest
that cattle were familiar enough with those that they were reunited with that it reduced
the negative effects of regrouping. This would support the need for relatively stable
groups and to avoid repeated regrouping of animals so that they are able to become
familiar with the remainder of the group.
165
Ninety-three percent of all allogrooming took place between animals of the same age
group with the remaining 7% carried out between animals in different age groups. This
would be expected due to the groups consisting of cattle of similar ages, although
individuals could access others of different ages through barriers on both farms.
Youngsters performed and received the most allogrooming. As grooming is thought to
be an indicator of positive associations, the large amount of grooming to take place
between the same age groups and within the youngster age category in particular,
strengthens the results observed regarding their social bond formation. The strongest
associations were seen in younger cattle and so younger individuals may form these
bonds through positive behaviour like allogrooming. Observing both strong bonds and a
high level of positive social behaviour in young animals would suggest that at this age,
the social environment that they are in becomes highly important to them and they will
work to maintain those relationships through behaviours such as allogrooming. Further
investigation into the social relationships of cattle at this age may help identify certain
time points where sociability levels change and so understanding of how this may affect
their behaviour and welfare can be found. It appeared that cattle aged between 7-11
months of age had the most changes in their social behaviour and welfare due to
regrouping.
In addition to the influence of age, the social associations and in particular the number
of preferred partners that cattle had significantly affected both the duration and
frequency of allogrooming bouts. The more partners that individuals had the fewer
bouts of grooming occurred. The highest mean duration of allogrooming was seen in
individuals that had between four and eight preferred partners whilst the lowest was
166
seen for individuals that had between zero and three preferred partners. In a short
observation carried out on a small stable herd of beef cattle by the BBC (2010), it was
noted that when the dominant individuals were removed from the group, one particular
individual, that was lower in age to the cattle removed, would frequently walk around
the group grooming multiple partners in what was thought to be a bid to change her
position within the group. For the young cattle in the current study, the high level of
grooming observed and the high number of preferred partners may suggest that social
relationships may start to change as they mature and in particular between 7 and 11
months of age there appears to be a significant shift in the grooming and association
behaviour. Establishing a position within the group and learning which relationships are
the most important may begin during this period and therefore an increase in grooming
behaviour may be a part of the formation of different relationships, both for the groomer
and for those receiving the grooming. The function of grooming at this time needs
further investigation as it could have different meanings for each individual depending
upon their current social status. In addition, this is around the same time when feral
cattle may start to wean their young ready for the new offspring to be born (Bouissou et
al., 2001). It could be suggested that at this age the social group and structure of that
group is of high import to cattle and so measures to ensure that groups remain relatively
stable should be implemented at this time so that affiliative bonds can be formed.
5.4.3 The effects of age on production at regrouping
The age of cattle significantly affected the changes that occurred in average milk
volume (yield) per milking and the overall amount of milk produced (kg) at regrouping.
Younger cattle decreased production levels, both yield and kg, less than older
individuals. As cattle aged, the loss in yield that occurred due to regrouping increased.
167
As milk production increases with age (Khan & Shook, 1996; Løvendahl & Chagunda,
2011; Zanella et al., 1998) older individuals will be producing more milk and so will
have higher demands on their body (Brun-Lafleur et al., 2010). Changes in diet have a
higher degree of effect on milk yield for high producing cattle compared to lower
producing cattle (Brun-Lafleur et al., 2010). Thus older cattle, as higher producing
individuals are more likely to have excessive strain on their body at the time of
regrouping and therefore larger changes in yield may occur, compared to younger,
lower producing cattle.
Conversely, other quality parameters decreased in younger cattle more significantly
compared to older individuals. %Protein decreased as a result of regrouping in younger
cattle whilst it increased in older cattle. Brun-Lafleur et al. (2010) noted that
primiparous individuals decreased their protein yield and protein content more than
multiparous cattle in response to changes in their diet. They suggested that this might be
due to primiparous cattle having higher energy demands for growth and maintenance
compared to multiparous cattle. As regrouping often results in a decrease in time spent
at the feeder and a decrease in time spent resting (Hasegawa et al., 1997; O'Driscoll et
al., 2006; von Keyserlingk et al., 2008), energy intake is likely to be lower and
therefore production is likely to suffer. The change that occurred at regrouping may be
because younger cattle needed more protein for maintenance compared to older cattle
and so the influence of regrouping stress may have impacted further on them than on
older individuals. The change in %protein only occurred when comparing %protein
from the month before regrouping and the month of regrouping. There was no
significant difference in age groups and the change in %protein when comparing the
month of regrouping to the month after regrouping, and when comparing the overall

168
change from the month before regrouping to the month after regrouping. This would
suggest that %protein changed when regrouping occurred but the effects did not last
long and levels returned to those from before regrouping by the month after regrouping.
This is in agreement with chapter three which highlighted separation to be the main
influence on animal welfare. In addition, a stable hierarchy, indicated by a reduced
amount of aggression, is often achieved between 15 (Hasegawa et al., 1997) and 45
(Sato et al., 1990) days after regrouping has occurred. This may have allowed younger
cattle to return to protein levels seen before the regrouping took place relatively soon
after regrouping as they were able to find a position to feed and therefore restore their
energy requirements.
The effect of regrouping on %fat was not significantly different between age groups.
There was however a trend for middle aged cattle to drop slightly in their %fat in the
month after regrouping when compared to %fat of the month before regrouping. These
results would suggest that quality parameters may not be significantly affected by the
regrouping process and so the effect on yield should be of most concern. In addition, fat
percentage is the least repeatable trait and variance in animals increases as lactation
progresses (Løvendahl & Chagunda, 2011) which was also seen in this study for most
of the production parameters. Variability in composition of milk is influenced by
biological factors, pathological and physiological changes (Forsbäck et al., 2010) and so
changes that may come about due to the regrouping process may be highly variable
between individuals and so this may explain why no significant changes were observed
in fat percentage change.
169
The change in price paid per litre of milk when regrouping took place was significantly
different between age groups with younger cattle (less than three years of age) having a
decrease in the price that was paid for their milk between all stages of regrouping
compared to older cattle. The price (pence per litre) paid for the milk that younger cattle
produced before regrouping took place was higher than the price they were paid for the
milk they produced after regrouping. This may be due to the changes in the quality
parameters that were observed previously; however, as they did not decrease the amount
of milk that they produced as much compared to older cattle, this change in price paid
per litre may not have a significant overall economic effect on the producer. Further
research would be required to fully understand the impact of these results on the
economic outcome for the producer.
5.4.4 The effects of age on health at regrouping
Younger cattle showed a decrease in somatic cell count due to regrouping, whilst older
cattle showed an increase in somatic cell count. Younger cattle may have been
regrouped because of a high somatic cell count as the decrease was observed between
the months before regrouping took place and the month after regrouping. This would
suggest that regrouping took place due to a high somatic cell count level and therefore
after receiving treatment a drop in somatic cell counts would have been observed.
Whereas for older cattle, an increase in somatic cell count appeared between the months
before regrouping and the month after regrouping took place. This would suggest that
the somatic cell count was higher the month after regrouping compared to before and so
regrouping did not take place due to a high number of somatic cells in older cattle. This
would suggest that the high somatic cell count level observed was likely due to the
regrouping process. Previous research by Haskell et al. (2009) also found that somatic
170
cell counts increased with increasing lactation number. These results together would
suggest that as cattle aged they naturally increased in somatic cell count numbers as part
of the increasing number of lactations.
Although there was no significant difference in the number of inseminations required
across the age groups as a result of regrouping, in general older cattle required more
inseminations than younger cattle. This would be expected, as cattle age their fertility
lowers and thus is one of the most common causes of early culling in cattle (Brickell &
Wathes, 2011).
5.4.5 Practical implications
Regrouping is a regular occurrence on larger dairy farms as producers try to manage a
group rather than an individual to aid efficiency (St-Pierre & Thraen, 1999). However,
there are a number of consequences to this management system; keeping the number of
regroupings as low as possible will reduce the negative consequences observed in this
study and the previous studies for this project. Where regroupings need to take place,
providing familiar individuals to others during this process may reduce some of these
negative consequences. Furthermore, if preferred partnerships have been identified,
keeping these individuals together at such a stressful time will also reduce these
negative consequences and provide some support, thus improving the animal’s welfare.
Keeping similar aged cattle together allows for stronger bond formation and for the
performance of positive behaviours such as allogrooming. The results would suggest
that cattle of similar ages should be housed together and for their groups to remain
stable, but also that age of cattle impacts upon their response to changes in their social
171
environment and so this must be considered. In particular younger cattle require extra
care when regrouping or making any changes to their social groups. When maturing
from a calf to a sub-adult, young cattle appear to have a significant change in their
social structure and extra care needs to be taken at this time not to disturb groups as
much as possible. Although older cattle appear to not be affected by regrouping as much
as some of the younger individuals, they have far fewer positive associations and are
more sensitive to changes in terms of production compared to younger individuals. Care
therefore needs to be taken when moving older cattle between groups on a regular basis
so as to avoid significant losses in production and to ensure positive interactions and
associations that will improve psychological well-being.
5.5 Conclusion
In summary, this study has shown age to have significant effects on how animals appear
to cope with changes in their social environment. When regrouping occurs, changes are
exhibited in all animals but younger individuals appear to be more sensitive to the
effects and therefore extra precautions should be taken for these individuals. However
this does not appear to be the case in terms of production in that younger cattle appeared
to be less affected by regrouping compared to older cattle in this case. Although the
results are from two different groups, they do give a better understanding of the factors
that might affect the changes that occur at regrouping. Having a better understanding of
these factors allows for enhanced solutions to be put into place so that the welfare of the
cattle can be improved. Furthermore, the results highlight the complexity of the affects
that changes in social environment have in cattle at a range of ages, and that thought
needs to be taken when regrouping animals at all stages of their life.
172
Chapter Six
General Discussion
173
6.1 Introduction
The UK dairy industry has faced a number of challenges in recent years including
changes in policies, abolition of milk quotas, lowering milk prices, and an increase in
competition from abroad. There has, however, also been an increase in the global
demand for milk products. Coupled together, these factors have prompted a change in
the way dairy products are produced which has lead to a further increase in
intensification. In order for the UK dairy industry to thrive in such a dynamic climate,
large-scale dairies may be the way forward (EFRAC, 2011). With the majority of dairy
cattle in the UK currently housed in already large and dynamic group systems, there has
been a need to further the understanding of such management practices. To ensure that
the welfare of dairy cattle is not compromised under such intensive systems a better
understanding of the impacts they may have on the behaviour and welfare of dairy was
required. In particular, the social behaviour of cattle, which has lacked serious
consideration when designing intensive housing for cattle, has been highlighted by the
European Food Safety Authority (EFSA, 2012) as a high welfare concern. This is
concurrent with the report made by the FAWC (2009) that also raised concerns
regarding the continuous regrouping of dairy cattle. A project investigating the potential
effects of current large dynamic group management systems on the social behaviour and
positive social relationships in dairy cattle, would assist in ensuring high standards of
welfare are maintained and that positive welfare indicators can be utilised on farm.
The overall aim of this thesis was to assess the impacts of large dynamic group systems
on the social bonds of dairy cattle and to evaluate how the formation and breaking of
these bonds under such dynamic management systems affects the behaviour, welfare
and productivity of the dairy cow. There were four main areas of the study; 1) to
174
ascertain whether dairy cattle living in large dynamic group systems were able to form
social bonds; 2) to analyse the effects of short term social isolation from preferred group
mates on behaviour, welfare and productivity; 3) to analyse the effects of long term
social separation from preferred group mates followed by the reunion with those
preferred group mates after long term separation, on behaviour, welfare and
productivity; and 4) to evaluate how age affects the formation of social bonds,
behaviour, welfare and productivity, at regrouping. From these four objectives practical
recommendations that could be instigated into commercial practice were proposed
throughout each of the respective chapters.
This chapter aims to provide an overall summary of the results presented in previous
chapters demonstrating their significance and relationship to current scientific
knowledge. Furthermore, it will highlight areas that have raised further questions over
the social behaviour of dairy cattle and recommend further investigation where needed.
By using the overall results, practical recommendations are put forward that can be
easily implemented on farm.
6.2 Social bonds in dairy cattle
The first aim of the project was to ascertain whether dairy cattle were able to form
social bonds while housed in large dynamic group systems. Social bonds in adult cattle
have been previously noted in feral populations (Lazo, 1994; 1995; Reinhardt &
Reinhardt, 1982; Reinhardt & Reinhardt, 1981) but had not been reported for cattle in
commercial dairy units. The results from chapter two established that these positive
social relationships did exist in commercial dairy cattle that were being housed in larger
than average, dynamic groups. However, the relationships observed were mainly weak
175
and strong associations were rare. In addition, relationships were more likely to be
observed in younger cattle. Chapter five also verified the existence of social bonds in
dairy cattle and further highlighted that the age of cattle affected the strength of the
bonds that they had. The older cattle became the fewer bonds they had and the weaker
those bonds were. Nevertheless, it was also demonstrated within chapter five that the
separation of bonded individuals, and subsequent regrouping, changed this important
social relationship with a sharp decrease in association value after regrouping had taken
place.
Where allogrooming has been considered a potential sign of a significant social bond,
the performance of this behaviour has been reported at very low frequencies in the
commercial setting (Takeda et al., 2000; Val-Laillet et al., 2009). The results from
chapter four and five concur that allogrooming frequency is fairly low under
commercial settings and this may explain the lack of strong bonds in commercial dairy
cattle that were noted. The results from chapter four show that allogrooming took place
more frequently when cattle were in stable groups compared to when either separated
from their preferred partner or when they experienced multiple regroupings. This
supports the hypothesis that allogrooming is an important aspect of the social behaviour
of dairy cattle and in particular for the formation and maintenance of social bonds.
Furthermore, in chapter five animals aged between 7 and 11 months old performed a
significantly higher amount of allogrooming than others. At this age (7-11 months of
age) cattle also had a high number of preferred partners. The results may suggest that
during this time cattle are forming social bonds that are important to them. Any
regrouping taking place after this age has been demonstrated to have negative
consequences on cattle in that they do not habituate to repeated regrouping and
176
relocation (Raussi et al., 2005). To ensure the performance of positive interactions and
the continuation of these important social bonds, every effort must be made to maintain
cattle in stable groups after 7-11 months of age.
6.3 Social separation and reunion
The process of separating cattle from their preferred group mates led to changes in their
behaviour, health, welfare and productivity. For short term separation in chapter three,
cattle showed a stress response similar to that seen in other separation and isolation
observations (Boissy & Le Neindre, 1997; Piller et al., 1999; von Keyserlingk et al.,
2008). Boissy and Le Neindre (1997) had previously noted that the presence of a
familiar animal reduced the stress response observed in cattle isolated from their peers.
The results from chapter three further this knowledge to show that the presence of a
preferred partner can provide more support during a stressful time than that provided by
just a familiar individual. The results also highlighted individual differences in the
coping ability of cattle with those individuals identified as having a preferred partner
having a higher stress response to the separation than cattle that had not been identified
as having a preferred partner. These cattle with a lower stress response were either a
partner of the focal individual or were a random member of the herd. This raises
questions regarding the temperament of cattle and whether there may be individuals that
require more social support during environmental challenge than others. Le Neindre and
Sourd, (1984) had previously noted differences in the behavioural response of Salers
and Friesians during social isolation suggesting that Friesians did not appear to be as
affected by the isolation from the social group compared to Salers. In addition, the
impacts on the supporting individuals of cattle that require more support than others
177
needs to be investigated as the results from chapter three suggested negative
consequences to the individual that was undertaking the supporting position.
The results from chapter four demonstrate that long term separation also had negative
consequences on cattle’s behaviour, health, welfare and productivity. Social bonds that
had been previously identified appeared to have been broken after long term separation
had occurred. Additionally, upon reunion cattle did not appear to regain their social
relationships, reflected in their reduced social association index value. This suggested
that cattle were not as sociable after the separation period compared to before separation
had occurred. Further analysis of these results in relation to the age of cattle in chapter
five showed that there appeared to be different coping abilities among cattle that were
influenced by their age. However, the results were somewhat complex showing
different responses for different age groups. Younger cattle had significant changes
occur in their behaviour during the separation and regrouping process and their health
with regards to weight was more significantly affected than older cattle. However with
regards to production parameters, the older cattle showed a higher response with a more
pronounced loss of production due to the separation and regrouping process.
The awareness of the negative effects that common management practices such as
regrouping have on dairy cattle raises concerns regarding the separation of bonded
individuals. The results from both chapter four and five argue that it is the separation of
individuals that is the main source of stress and not the regrouping process as has been
so readily focused upon in past research. When cattle were reunited with their preferred
group mates where similar elements to regrouping took place, there was a limited
response compared to when cattle were only separated from their bonded partner.
178
Furthermore, chapter four demonstrates that production parameters were affected more
by the separation procedure compared to when they were reunited with their partner. As
both separation and reunion contained elements of regrouping, the evidence for whether
it is the separation of individuals causing the negative effects or the regrouping phase is
not clear. After long term separation positive social bonds are no longer present and so
preferred partners can offer no support during this time, a result that has been seen in
this study as well as in the studies by Gygax et al. (2009) and Neisen et al. (2009b).
Therefore, preferred partners are no longer able to help cattle cope with changes in their
social environment.
6.4 Welfare implications
The ability to express natural behaviour is imperative to maintaining high standards of
welfare (Spinka, 2006; Wechsler & Lea, 2007). When animals are able to perform
highly motivated behaviours, for example rooting in pigs and dust bathing in hens, it
stimulates positive emotional circuits within their brains (Edwards, 2010). Being able to
experience positive emotional states can enhance animal welfare and promote the
welfare of sentient beings (Spinka, 2006). The housing systems employed by the
majority of dairy producers in the UK have, unfortunately, seriously lacked
consideration towards the social behaviour of cattle and this has been one of the most
affected behaviours by domestication and intensification (Phillips, 2002). Where it may
be that large-scale dairies can provide adequate health programs that ensure the physical
health of their animals involved, there is no current evidence on the psychological well-
being of cattle. How these housing systems and the lack of thought given to the social
organisation and behaviour of cattle may have impacted upon their psychological well-
being has now only just been investigated through this study.
179
Allowing and promoting positive social bonds and allowing for positive social
behaviours such as allogrooming will allow animals to experience positive affective
states and so enable a better coping ability and therefore a better quality of life, and this
has been demonstrated throughout the previous chapters. Through providing adequate
space and stable social groupings, the size of a group may not be significant to the
social behaviour and welfare of cattle and will still allow for highly motivated social
behaviours to be performed. It is the predictability and a sense of controllability about
the social environment that will be important, and as a result cattle will have higher
positive expectations (Veissier & Boissy, 2007). Evidence from chapter five suggests
that cattle appear to ‘give-up’ forming social bonds and so may have a current sense of
negative expectation about their social environment. As it appears to be the separation
of these important bonds that brings about a higher response suggestive of stress, this
negative emotional state that cattle experience may prohibit further bond formation and
thus along with it, the positive affective state of the animal. Therefore dairy cattle
experiencing repeated regrouping and separation may have negative emotional welfare
which exhibits itself through a change in behaviour, health and productivity. Stable
groupings will provide support and reduce negative affective states whilst promoting
positive experiences such as allogrooming and thus aiding coping ability and promoting
a better quality of life.
6.5 Practical solutions
In order to improve the welfare of dairy cattle and to prevent negative social
experiences that may be associated with large-scale dairies, the social behaviour and
structure of a herd must be considered. Producers need to assess current facilities and
resources in order to find a solution that will work for their herd as the management of a
180
farm with little regrouping will require careful planning. However, there are crucial
aspects of the results that must be considered when assessing housing requirements of
individual herds. The main aspect of this report, along with both the FAWC and EFSA
reports, is the reduction in the number of separations due to regrouping. This will in turn
aid the formation of a stable group and thus provide a constant and secure social
environment. Where regroupings cannot be avoided, providing a supportive partner will
reduce the negative consequences of regrouping and if that partner is a preferred
partner, it will aid the transition further and reduce the affects of separation improving
positive emotional welfare. Furthermore, if separations do occur for reasons such as ill
health, where separation may be longer than two weeks provision again of a supporting
partner will reduce separation stress and may aid recovery. More than two weeks apart
appears to be a time point when bonds are broken, although this needs further
investigation to confirm this time frame.
There is a need to assess individual characteristics and coping abilities. Temperament
testing of cattle may enable identification of individuals that may be a source of social
disruption and those that appear to be more ‘needy’ in their coping abilities (see
Gibbons et al. (2010) for methods of temperament testing that can be easily carried out
on farm). The breeding of cattle that do not require emotional social stability may be
beneficial for herds that are likely to carry out regular and repetitive regrouping.
Alternatively, identification of individuals that can provide support within groups may
be a better method of enhancing positive welfare.
As age had significant affects on cattle’s ability to cope with social challenges in
differing ways, care needs to be taken throughout the animals’ lives. Cattle between 7
181
and 11 months of age may be able to cope better with challenges such as regrouping as
they appear to be in a period where bonds are formed. After this age social challenges
become more problematic, and as cattle age and the presence of supportive positive
bonds disappear, coping ability is reduced. Replacement heifers are central to the
continuation of the dairy herd. If the social environment is carefully managed from this
time, their ability to cope with challenges they may face later on such as herd
integration, may be enhanced.
The occurrence of frequent allogrooming and the presence of strong, long lasting social
bonds are an indicator of group stability and thus a positive indicator of welfare. The
occurrence of such positive behaviours would indicate that cattle are not deprived of
important sources of pleasure and that their other needs are being met (Boissy et al.,
2007). This would allow for a positive assessment of welfare to be given.
6.6 Future Research
Research into positive emotional states and positive social environments of cattle and
other farm animals is limited and has long been overshadowed by research into the
negative aspects of social behaviour such as aggression. This project has offered
important positive social considerations of cattle housed in current large dynamic group
systems. It does, however, raise further questions regarding the positive social
behaviour in cattle and how current and future housing systems may affect their social
behaviour and welfare. Knowledge and understanding of the affective states
experienced by cattle during times of separation and regrouping along with those
experienced during bond formation, is required.
182
Cattle do appear to be socially adaptable through the changes that occur in their social
structure and individual relationships. Vasopressin receptor distribution patterns in the
brain have been demonstrated to partly determine the social system of voles and may
explain the plasticity of social bonds and social systems seen in this species (Nair &
Young, 2006). Oxytocin, a neurosecretary hormone involved in affiliation behaviour
has also been observed to increase prosocial choices and attention towards affiliates in
rhesus macaques (Chang et al., 2012). The link between oxytocin and milk let down
(Belo & Bruckmaier, 2010) may have a significant part to play in bond formation and
so scientific investigation into exactly how the bonds observed in this current project are
formed, will allow potentially for easier identification of bonds between individuals.
The pairing of individuals may be able to be manipulated so that positive social
experiences can be felt during times when they may have previously formed stress.
Further investigation into the social networks of cattle in larger systems will also be
beneficial, as will comparisons between systems with a more stable type of grouping
such as automatic milking systems with a more dynamic group system where
individuals need to be maintained in different social groups. Large-scale dairies may
provide an opportunity to have more stable social groups with fewer separations as
groups will be large enough that a number of animals are likely to be in sync with one
another. In addition, the full influence of age on cattle’s ability to cope with challenge
and the changes that occur throughout the life of dairy cattle with regards their social
behaviour will also be beneficial. Further study of particularly large groups such as
those seen in the US, may give understanding to the full impacts of group size. The
need for a preferred partner may no longer be required when cattle are in very large
183
groups as there is evidence in other species that suggests that it is the number of animals
around that provide support (Kikusui et al., 2006).
6.7 Conclusions
In conclusion, this project has aided the understanding of dairy cattle social behaviour
and the impact that large dynamic groups may have on the social behaviour and welfare
of cattle. The main findings of the project are that dairy cattle are able to form positive
associations under commercial practices, but that commonly utilised management
techniques can have a serious consequence on these positive relationships. In particular
there is a change in the strength and longevity of social bonds when separation and
regrouping occurs. These relationships are more likely to form in younger cattle and are
likely to be stronger in younger cattle. Serious consideration on the effects of
management on the social behaviour of rearing stock, especially replacement heifers
needs to be performed. These social relationships are able to provide support during
social challenges such as short term separation. Long term separation from a preferred
group partner, however, causes significant changes in the social behaviour and welfare
of cattle. The separation and splitting of partners at regrouping has more serious
negative consequences than the actual regrouping. It is thus extremely important that as
suggested by the EFSA and FAWC that social bonds in cattle are given consideration
when grouping animals and any form of separation and regrouping has to be very
careful considered regarding the negative impacts that it has on the welfare of cattle. It
may not be visible, except for where severe aggression may take place that the welfare
of cattle is compromised by this process, as it is likely that the negative impacts are
more psychological rather than physical.
184
References
Adeyemo, O., & Heath, E. (1982). Social Behaviour and Adrenal Cortical Activity in
Heifers. Applied Animal Ethology, 8(1-2), 99-108. Akre, A. K., Hovland, A. L., & Bakken, M. (2010). The Effects of Resource
Distribution on Behaviour in Pair Housed Silver Fox Vixens (Vulpes Vulpes) Subsequent to Mixing. Applied Animal Behaviour Science, 126(1-2), 67-74.
Alexander, S. L., & Irvine, C. H. G. (1998). The Effect of Social Stress on Adrenal Axis Activity in Horses: The Importance of Monitoring Corticosteroid-Binding Globulin Capacity. Journal of Endocrinology, 157(3), 425-432.
Alvarez, A., del Corral, J., Solis, D., & Perez, J. A. (2008). Does Intensification Improve the Economic Efficiency of Dairy Farms? J. Dairy Sci., 91(9), 3693-3698.
Alvarez, L., Nava, R. A., Ramírez, A., Ramírez, E., & Gutiérrez, J. (2009). Physiological and Behavioural Alterations in Disbudded Goat Kids with and without Local Anaesthesia. Applied Animal Behaviour Science, 117(3-4), 190-196.
Andersen, I. L., Tønnesen, H., Estevez, I., Cronin, G. M., & Bøe, K. E. (2011). The Relevance of Group Size on Goats' Social Dynamics in a Production Environment. Applied Animal Behaviour Science, 134(3-4), 136-143.
The Animal Welfare Act, (2006). London: HMSO. Ansmann, I. C., Parra, G. J., Chilvers, B. L., & Lanyon, J. M. (2012). Dolphins
Restructure Social System after Reduction of Commercial Fisheries. Animal
Behaviour, 84(4), 575-581. Arave, C. W., Mickelsen, C. H., & Walters, J. L. (1985). Effect of Early Rearing
Experience on Subsequent Behavior and Production of Holstein Heifers. J.
Dairy Sci., 68(4), 923-929. Aschwanden, J., Gygax, L., Wechsler, B., & Keil, N. M. (2008). Social Distances of
Goats at the Feeding Rack: Influence of the Quality of Social Bonds, Rank Differences, Grouping Age and Presence of Horns. Applied Animal Behaviour
Science, 114(1-2), 116-131. Asher, L., Collins, L. M., Ortiz-Pelaez, A., Drewe, J. A., Nicol, C. J., & Pfeiffer, D. U.
(2009). Recent Advances in the Analysis of Behavioural Organization and Interpretation as Indicators of Animal Welfare. Journal of The Royal Society
Interface, 6(41), 1103-1119. Barnett, J. L., Hemsworth, P. H., Cronin, G. M., Newman, E. A., McCallum, T. H., &
Chilton, D. (1992). Effects of Pen Size, Partial Stalls and Method of Feeding on Welfare-Related Behavioural and Physiological Responses of Group-Housed Pigs. Applied Animal Behaviour Science, 34(3), 207-220.
BBC. (2010). The Private Life of Cows. Scotland: BBC Scotland. Beilharz, R. G., & Zeeb, K. (1982). Social Dominance in Dairy Cattle. Applied Animal
Ethology, 8(1-2), 79-97. Bejder, L., Fletcher, D., & Bräger, S. (1998). A Method for Testing Association
Patterns of Social Animals. Animal Behaviour, 56(3), 719-725. Belo, C. J., & Bruckmaier, R. M. (2010). Suitability of Low-Dosage Oxytocin
Treatment to Induce Milk Ejection in Dairy Cows. J. Dairy Sci., 93(1), 63-69.
185
Benhajali, H., Richard-Yris, M. A., Leroux, M., Ezzaouia, M., Charfi, F., & Hausberger, M. (2008). A Note on the Time Budget and Social Behaviour of Densely Housed Horses: A Case Study in Arab Breeding Mares. Applied Animal
Behaviour Science, 112(1-2), 196-200. Benham, P. F. J. (1982). Social Organisation and Leadership in a Grazing Herd of
Suckler Cows. Applied Animal Ethology, 9(1), 95 Abstract Only. Bewley, J., Palmer, R. W., & Jackson-Smith, D. B. (2001). An Overview of
Experiences of Wisconsin Dairy Farmers Who Modernized Their Operations. J.
Dairy Sci., 84(3), 717-729. Birmingham, W., Uchino, B. N., Smith, T. W., Light, K. C., & Sanbonmatsu, D. M.
(2009). Social Ties and Caridovascular Function: An Examination of Relationship Positivity and Negativity During Stress. International Journal of
Psychophysiology, 74(2), 114-119. Bloom, J. R., Stewart, S. L., Johnston, M., Banks, P., & Fobair, P. (2001). Sources of
Support and the Physical and Mental Well-Being of Young Women with Breast Cancer. Social Science & Medicine, 53(11), 1513-1524.
Boccia, M. L., Scanlan, J. M., Laudenslager, M. L., Berger, C. L., Hijazi, A. S., & Reite, M. L. (1997). Juvenile Friends, Behavior, and Immune Responses to Separation in Bonnet Macaque Infants. Physiology & Behavior, 61(2), 191-198.
Boe, K. E., & Faerevik, G. (2003). Grouping and Social Preferences in Calves, Heifers and Cows. Applied Animal Behaviour Science, 80(3), 175-190.
Boissy, A., & Bouissou, M. F. (1995). Assessment of Individual Differences in Behavioural Reactions of Heifers Exposed to Various Fear-Eliciting Situations. Applied Animal Behaviour Science, 46(1-2), 17-31.
Boissy, A., & Dumont, B. (2002). Interactions between Social and Feeding Motivations on the Grazing Behaviour of Herbivores: Sheep More Easily Split into Subgroups with Familiar Peers. Applied Animal Behaviour Science, 79(3), 233-245.
Boissy, A., & Le Neindre, P. (1997). Behavioural, Cardiac and Cortisol Responses to Brief Peer Separation and Reunion in Cattle. Physiology & Behaviour, 61(5), 693-699.
Boissy, A., Manteuffel, G., Jensen, M. B., Moe, R. O., Spruijt, B., Keeling, L. J., Winckler, C., Forkman, B., Dimitrov, I., Langbein, J., Bakken, M., Veissier, I., & Aubert, A. (2007). Assessment of Positive Emotions in Animals to Improve Their Welfare. Physiology and Behaviour, 92(3), 375-397.
Boissy, A., Veissier, I., & Roussel, S. (2001). Behavioural Reactivity Affected by Chronic Stress: An Experimental Approach in Calves Submitted to Environmental Instability. Animal Welfare, 10(S1), 175-185.
Bokma, S., & Kersjes, G. J. K. (1988). The Introduction of Pregnant Sows in an Established Group. Research Institute for Pig Husbandry, 166 - 169.
Bouissou, M.-F., & Andrieu, S. (1978). Etablissement Des Relations Preferentielles Chez Les Bovins Domestiques. Behaviour, 64(1/2), 148-157.
Bouissou, M. F., & Boissy, A. (2005). Le Comportement Social Des Bovins Et Ses Conséquences En Élevage. Productions Animales, 18(2), 87-99.
Bouissou, M. F., Boissy, A., Le Neindre, P., & Veissier, I. (2001). The Social Behaviour of Cattle. In L. J. Keeling & H. W. Gonyou (Eds.), Social Behaviour
in Farm Animals (pp. 113-145). Oxon: CABI Publishing. Bowell, V. A., Rennie, L. J., Tierney, G., Lawrence, A. B., & Haskell, M. J. (2003).
Relationships between Building Design, Management System and Dairy Cow Welfare. Animal Welfare, 12(4), 547-552.
186
Boyle, L. A., Boyle, R. M., & French, P. (2008). Welfare and Performance of Yearling Dairy Heifers out-Wintered on a Wood-Ship Pad or Housed Indoors on Two Levels of Nutrition. Animal, 2(5), 769-778.
Bracke, M., & Hopster, H. (2006). Assessing the Importance of Natural Behavior for Animal Welfare. Journal of Agricultural and Environmental Ethics, 19(1), 77-89.
Bräger, S., Würsig, B., Acevedo, A., & Henningsen, T. (1994). Association Patterns of Bottlenose Dolphins (Tursiops Truncatus) in Galveston Bay, Texas. Journal of
Mammalogy, 75(2), 431-437. Brakel, W. J., & Leis, R. A. (1976). Impact of Social Disorganisation on Behaviour,
Milk Yield, and Body Weight of Dairy Cows. J. Dairy Sci., 59(4), 716-721. Brickell, J. S., & Wathes, D. C. (2011). A Descriptive Study of the Survival of Holstein-
Friesian Heifers through to Third Calving on English Dairy Farms. J. Dairy Sci.,
94(4), 1831-1838. Broom, D. M. (1978). The Development of Social Behaviour in Calves. Applied Animal
Ethology, 4(3), 285-294. Broom, D. M. (1991). Animal Welfare: Concepts and Measurement. J. Anim Sci.,
69(10), 4167-4175. Broom, D. M., & Leaver, J. D. (1978). Effects of Group-Rearing or Partial Isolation on
Later Social Behaviour of Calves. Animal Behaviour, 26(4), 1255-1263. Brun-Lafleur, L., Delaby, L., Husson, F., & Faverdin, P. (2010). Predicting Energy X
Protein Interaction on Milk Yield and Milk Composition in Dairy Cows. J.
Dairy Sci., 93(9), 4128-4143. Byrne, G., & Suomi, S. J. (1999). Social Separation in Infant Cebus Apella: Patterns of
Behavioral and Cortisol Response. International Journal of Developmental
Neuroscience, 17(3), 265-274. Cairns, S. J., & Schwager, S. J. (1987). A Comparison of Association Indices. Animal
Behaviour, 35(5), 1454-1146. Cameron, A. R., & Anderson, G. A. (1993). Relationship between Milk Production and
Somatic Cell Count in Dairy Cows in East Gippsland. Australian Veterinary
Journal, 70(1), 13-17. Capitanio, J. P., & Lerche, N. W. (1998). Social Separation, Housing Relocation, and
Survival in Simian Aids: A Retrospective Analysis. Psychosom Med, 60(3), 235-244.
Carter, A. J., Macdonald, S. L., Thomson, V. A., & Goldizen, A. W. (2009). Structured Association Patterns and Their Energetic Benefits in Female Eastern Grey Kangaroos, Macropus Giganteus. Animal Behaviour, 77(4), 839-846.
Chang, S. W. C., Barter, J. W., Ebitz, R. B., Watson, K. K., & Platt, M. L. (2012). Inhaled Oxytocin Amplifies Both Vicarious Reinforcement and Self Reinforcement in Rhesus Macaques (Macaca Mulatta). Proceedings of the
National Academy of Sciences, 109(3), 959-964. Chiyo, P. I., Archie, E. A., Hollister-Smith, J. A., Lee, P. C., Poole, J. H., Moss, C. J., &
Alberts, S. C. (2011). Association Patterns of African Elephants in All-Male Groups: The Role of Age and Genetic Relatedness. Animal Behaviour, 81(6), 1093-1099.
Clark, P. W., Ricketts, R. E., & Krause, G. F. (1977). Effect on Milk Yield of Moving Cows from Group to Group. J. Dairy Sci., 60(5), 769-772.
Colson, V., Orgeur, P., Courboulay, V., Dantec, S., Foury, A., & Mormede, P. (2006). Grouping Piglets by Sex at Weaning Reduces Aggressive Behaviour. Applied
Animal Behaviour Science, 97(2-4), 152-171.
187
Cook, N. J., Schaefer, A. L., Lepage, P., & Morgan Jones, S. (1996). Salivary Vs. Serum Cortisol for the Assessment of Adrenal Activity in Swine Canadian
Journal of Zoology, 76(3), 329-335. Cooper, M. D., Arney, D. R., & Phillips, C. J. C. (2007). Two- or Four-Hour Lying
Deprivation on the Behavior of Lactating Dairy Cows. J. Dairy Sci., 90(3), 1149-1158.
Cooper, M. D., Arney, D. R., Webb, C. R., & Phillips, C. J. (2008). Interactions between Housed Dairy Cows During Feeding, Lying, and Standing. Journal of
Veterinary Behavior: Clinical Applications and Research, 3(5), 218-227. Couzin, I. D. (2006). Behavioral Ecology: Social Organization in Fission-Fusion
Societies. Current Biology, 16(5), R169-R171. Croft, D. P., Madden, J. R., Franks, D. W., & James, R. (2011). Hypothesis Testing in
Animal Social Networks. Trends in Ecology & Evolution, 26(10), 502-507. Cross, P. C., Lloyd-Smith, J. O., & Getz, W. M. (2005). Disentangling Association
Patterns in Fission-Fusion Societies Using African Buffalo as an Example. Animal Behaviour, 69(2), 499-506.
Cutullic, E., Delaby, L., Gallard, Y., & Disenhaus, C. (2012). Towards a Better Understanding of the Respective Effects of Milk Yield and Body Condition Dynamics on Reproduction in Holstein Dairy Cows. Animal, 6(SI03), 476-487.
da Costa, A. P., Leigh, A. E., Man, M.-S., & Kendrick, K. M. (2004). Face Pictures Reduce Behavioural, Autonomic, Endocrine and Neural Indices of Stress and Fear in Sheep. Proc. R. Soc. Lond. B, 271(1552), 2077-2084.
Dado, R. G., & Allen, M. S. (1994). Variation in and Relationships among Feeding, Chewing, and Drinking Variables for Lactating Dairy Cows. J. Dairy Sci., 77(1), 132-144.
DairyCo, & DairyUK. (2009). Investment Prospects for British Dairy Farmers. UK: Agriculture and Horticulture Development Board (AHDB).
de Groot, J., Ruis, M. A. W., Scholten, J. W., Koolhaas, J. M., & Boersma, W. J. A. (2001). Long-Term Effects of Social Stress on Antiviral Immunity in Pigs. Physiology & Behavior, 73(1-2), 145-158.
de Jong, I. C., Prelle, I. T., van de Burgwal, J. A., Lambooij, E., Korte, S. M., Blokhuis, H. J., & Koolhaas, J. M. (2000). Effects of Environmental Enrichment on Behavioral Responses to Novelty, Learning, and Memory, and the Circadian Rhythm in Cortisol in Growing Pigs. Physiology & Behavior, 68(4), 571-578.
De Rosa, G., Grasso, F., Braghieri, A., Bilancione, A., Di Francia, A., & Napolitano, F. (2009). Behavior and Milk Production of Buffalo Cows as Affected by Housing System. J. Dairy Sci., 92(3), 907-912.
Code of Recommendations for the Welfare of Livestock: Cattle, (2003). DeVries, T. J., von Keyserlingk, M. A. G., & Weary, D. M. (2004). Effect of Feeding
Space on the Inter-Cow Distance, Aggression, and Feeding Behavior of Free-Stall Housed Lactating Dairy Cows. J. Dairy Sci., 87(5), 1432-1438.
Dickson, D. P., Barr, G. R., Johnson, L. P., & Wieckert, D. A. (1970). Social Dominance and Temperament of Holstein Cows. J. Dairy Sci., 53(7), 904-907.
Dickson, D. P., Barr, G. R., & Wieckert, D. A. (1967). Social Relationship of Dairy Cows in a Feed Lot. Behaviour, 29(2/4), 195-203.
Ditzen, B., Neumann, I. D., Bodenmann, G., von Dawans, B., Turner, R. A., Ehlert, U., & Heinrichs, M. (2007). Effects of Different Kinds of Couple Interaction on Cortisol and Heart Rate Responses to Stress in Women. Psychoneuroendocrinology, 32(5), 565-574.
188
Ditzen, B., Schmidt, S., Strauss, B., Nater, U. M., Ehlert, U., & Heinrichs, M. (2008). Adult Attachment and Social Support Interact to Reduce Psychological but Not Cortisol Responses to Stress. Journal of Psychosomatic Research, 64(5), 479-486.
Dobson, H., & Smith, R. F. (2000). What Is Stress, and How Does It Affect Reproduction? Animal Reproduction Science, 60-61(2), 743-752.
Dobson, H., Tebble, J. E., Smith, R. F., & Ward, W. R. (2001). Is Stress Really All That Important? Theriogenology, 55(1), 65-73.
Doerfler, R. L., & Peters, K. J. (2006). The Relativity of Ethical Issues in Animal Agriculture Related to Different Cultures and Production Conditions. 103(3), 257-262.
Dohoo, I. R., & Meek, A. H. (1982). Somatic Cell Counts in Bovine Milk. Canadian
Veterinary Journal, 23(4), 119-125. Durrell, J. L., Beattie, V. E., Sneddon, I. A., & Kilpatrick, D. (2003). Pre-Mixing as a
Technique for Facilitating Subgroup Formation and Reducing Sow Aggression in Large Dynamic Groups. Applied Animal Behaviour Science, 84(2), 89-99.
Durrell, J. L., Sneddon, I. A., O'Connell, N. E., & Whitehead, H. (2004). Do Pigs Form Preferential Associations? Applied Animal Behaviour Science, 89(1-2), 41-52.
Duve, L. R., & Jensen, M. B. (2011). The Level of Social Contact Affects Social Behaviour in Pre-Weaned Dairy Calves. Applied Animal Behaviour Science,
135(1-2), 34-43. Edmonson, A. J., Lean, I. J., Weaver, L. D., Farver, T., & Webster, G. (1989). A Body
Condition Scoring Chart for Holstein Dairy Cows. J. Dairy Sci., 72(1), 68 - 78. Edwards, L. N. (2010). Animal Well-Being and Behavioural Needs on the Farm. In T.
Grandin (Ed.), Improving Animal Welfare: A Practical Approach (pp. 139-159). Oxfordshire: CAB International.
EFRAC. (2011). Eu Proposals for the Dairy Sector and the Future of the Dairy
Industry. Retrieved. from. EFSA. (2009). Scientific Opinion of the Panel on Animal Health and Welfare on a
Request from the Commission on the Risk Assessment of the Impact of Housing, Nutrition and Feeding, Management and Genetic Selection on Behaviour, Fear and Pain Problems in Dairy Cows. The EFSA Journal, 1139, 1-68.
EFSA. (2012). Scientific Opinion on the Use of Animal-Based Measures to Assess Welfare of Dairy Cows. The EFSA Journal, 10(1), 1-81.
Ekkel, E. D., van Doorn, C. E. A., Hessing, M. J. C., & Tielen, M. J. M. (1995). The Specific-Stress-Free Housing System Has Positive Effects on Productivity, Health and Welfare of Pigs. Journal of Animal Science, 73(6), 1544-1551.
Endres, M. I., DeVries, T. J., Von Keyserlingk, M. A. G., & Weary, D. M. (2005). Short
Communication: Effects of Feed Barrier Design on the Behaviour of Loose-Housed Lactating Dairy Cows. J. Dairy Sci., 88(7), 2377-2380.
Ewbank, R. (1967). Behavior of Twin Cattle. J. Dairy Sci., 50(9), 1510-1512. Ewing, S. A., Lay Jr, D. C., & von Borell, E. (1999). Farm Animal Well-Being. Stress
Physiology, Animal Behaviour, and Environmental Design. New Jersey: Prentice Hall.
Færevik, G., Andersen, I. L., Jensen, M. B., & Boe, K. E. (2007). Increased Group Size Reduces Conflicts and Strengthens the Preference for Familiar Group Mates after Regrouping of Weaned Dairy Calves (Bos Taurus). Applied Animal
Behaviour Science, 108(3-4), 215-228.
189
Færevik, G., Jensen, M. B., & Boe, K. E. (2006). Dairy Calves Social Preferences and the Significance of a Companion Animal During Separation from the Group. Applied Animal Behaviour Science, 99(3-4), 205-221.
Færevik, G., Tjentland, K., Løvik, S., Andersen, I. L., & Bøe, K. E. (2008). Resting Pattern and Social Behaviour of Dairy Calves Housed in Pens with Different Sized Lying Areas. Applied Animal Behaviour Science, 114(1-2), 54-64.
FAWC. (2009). Farm Animal Welfare in Great Britain: Past, Present and Future. London. (FAWC o. Document Number)
Fisher, A., & Matthews, L. (2001). The Social Behaviour of Sheep. In L. J. Keeling & H. W. Gonyou (Eds.), Social Behaviour in Farm Animals (pp. 211-245). Oxon: CABI Publishing
Flower, F. C., & Weary, D. M. (2001). Effects of Early Separation on the Dairy Cow and Calf:: 2. Separation at 1 Day and 2 Weeks after Birth. Applied Animal
Behaviour Science, 70(4), 275-284. Forsbäck, L., Lindmark-Månsson, H., Andrén, A., & Svennersten-Sjaunja, K. (2010).
Evaluation of Quality Changes in Udder Quarter Milk from Cows with Low-to-Moderate Somatic Cell Counts. Animal, 4(4), 617-626.
Fraser, A. F., & Broom, D. M. (1997). Farm Animal Behaviour and Welfare. Oxon: CAB International.
Fraser, D. (2008). Toward a Global Perspective on Farm Animal Welfare. Applied
Animal Behaviour Science, 113(4), 330-339. Fregonesi, J. A., & Leaver, J. D. (2001). Behaviour, Performance and Health Indicators
of Welfare for Dairy Cows Housed in Strawyard or Cubicle Systems. Livestock
production science, 68(2-3), 205 - 216. Fregonesi, J. A., & Leaver, J. D. (2002). Influence of Space Allowance and Milk Yield
Level on Behaviour, Performance and Health of Dairy Cows Housed in Strawyard and Cubicle Systems. Livestock production science, 78(3), 245-257.
Fregonesi, J. A., Tucker, C. B., & Weary, D. M. (2007). Overstocking Reduces Lying Time in Dairy Cows. J. Dairy Sci., 90(7), 3349-3354.
Friend, T. H., & Polan, C. E. (1974). Social Rank, Feeding Behaviour, and Free Stall Utilization by Dairy Cattle. J. Dairy Sci., 57(10), 1214-1220.
Galindo, F., & Broom, D. M. (2000). The Relationships between Social Behaviour of Dairy Cows and the Occurrence of Lameness in Three Herds. Research in
Veterinary Science, 69(1), 75-79. Galindo, F., & Broom, D. M. (2002). The Effects of Lameness on Social and Individual
Behavior of Dairy Cows. Journal of Applied Animal Welfare Science, 5(3), 193-201.
Gibbons, J. M., Lawrence, A. B., & Haskell, M. J. (2010). Measuring Sociability in Dairy Cows. Applied Animal Behaviour Science, 122(2-4), 84-91.
Giersing, M., & Andersson, A. (1998). How Does Former Acquaintance Affect Aggressive Behaviour in Repeatedly Mixed Male and Female Pigs? Applied
Animal Behaviour Science, 59(4), 297-306. Ginsberg, J. R., & Young, T. P. (1992). Measuring Associations between Individuals or
Groups in Behavioural Studies. Short Communications. Animal Behaviour,
44(2), 377 - 379. Gonyou, H. W. (2001). The Social Behaviour of Pigs. In L. J. Keeling & H. W. Gonyou
(Eds.), Social Behaviour in Farm Animals (pp. 147-176). Oxon: CABI Publishing.
190
Gordon, T. P., Gust, D. A., Wilson, M. E., Ahmed-Ansari, A., Brodie, A. R., & McClure, H. M. (1992). Social Separation and Reunion Affects Immune System in Juvenile Rhesus Monkeys. Physiology and Behaviour, 51(3), 467-472.
Graves, H. B., Graves, K. L., & Sherritt, G. W. (1978). Social Behaviour and Growth of Pigs Following Mixing During the Growing-Finishing Period. Applied Animal
Ethology, 4(2), 169 - 180. Green, W. C. H., Griswold, J. G., & Rothstein, A. (1989). Post-Weaning Associations
among Bison Mothers and Daughters. Animal Behaviour, 38(5), 847-858. Gupta, S., Earley, B., Nolan, M., Formentin, E., & Crowe, M. A. (2008). Effect of
Repeated Regrouping and Relocation on Behaviour of Steers. Applied Animal
Behaviour Science, 110(3-4), 229-243. Guttridge, T. L., Gruber, S. H., Gledhill, K. S., Croft, D. P., Sims, D. W., & Krause, J.
(2009). Social Preferences of Juvenile Lemon Sharks, Negaprion Brevirostris. Animal Behaviour, 78(2), 543-548.
Gygax, L., Neisen, G., & Wechsler, B. (2009). Differences between Single and Paired Heifers in Residency in Functional Areas, Length of Travel Path, and Area Used Throughout Days 1-6 after Integration into a Free Stall Dairy Herd. Applied
Animal Behaviour Science, 120(1-2), 49-55. Hagen, K., & Broom, D. M. (2004). Emotional Reactions to Learning in Cattle. Applied
Animal Behaviour Science, 85(3-4), 203-213. Hagen, K., Langbein, J., Schmied, C., Lexer, D., & Waiblinger, S. (2005). Heart Rate
Variability in Dairy Cows-Influences of Breed and Milking System. Physiology
& Behavior, 85(2), 195-204. Hagnestam-Nielsen, C., Emanuelson, U., Berglund, B., & Strandberg, E. (2009).
Relationship between Somatic Cell Count and Milk Yield in Different Stages of Lactation. J. Dairy Sci., 92(7), 3124-3133.
Hanlon, A. J., Rhind, S. M., Reid, H. W., Burrells, C., & Lawrence, A. B. (1995). Effects of Repeated Changes in Group Composition on Immune Response, Behaviour, Adrenal Activity and Liveweight Gain in Farmed Red Deer Yearlings. Applied Animal Behaviour Science, 44(1), 57 - 64.
Harris, N. R., Johnson, D. E., McDougald, N. K., & George, M. R. (2007). Social Associations and Dominance of Individuals in Small Herds of Cattle. Rangeland
Ecology & Management, 60(4), 339-349. Hasegawa, N., Nishiwaki, A., Sugawara, K., & Ito, I. (1997). The Effects of Social
Exchange between Two Groups of Lactating Primiparous Heifers on Milk Production, Dominance Order, Behaviour and Adrenocortical Response. Applied
Animal Behaviour Science, 51(1-2), 15-27. Haskell, M. J., Rennie, L. J., Bowell, V. A., Bell, M. J., & Lawrence, A. B. (2006).
Housing System, Milk Production, and Zero-Grazing Effects on Lameness and Leg Injury in Dairy Cows. J. Dairy Sci., 89(11), 4259-4266.
Haufe, H. C., Gygax, L., Steiner, B., Friedli, K., Stauffacher, M., and, & Wechsler, B. (2009). Influence of Floor Type in the Walking Area of Cubicle Housing Systems on the Behaviour of Dairy Cows. Applied Animal Behaviour Science,
116(1), 21-27. Heinrichs, M., Baumgartner, T., Kirschbaum, C., & Ehlert, U. (2003). Social Support
and Oxytocin Interact to Suppress Cortisol and Subjective Responses to Psychosocial Stress. Biological Psychiatry, 54(12), 1389-1398.
Hennessy, M. B. (1997). Hypothalamic-Pituitary-Adrenal Responses to Brief Social Separation. Neuroscience & Biobehavioral Reviews, 21(1), 11-29.
191
Hennessy, M. B., Hornschuh, G., Kaiser, S., & Sachser, N. (2006). Cortisol Responses and Social Buffering: A Study Throughout the Life Span. Hormones and
Behavior, 49(3), 383-390. Hennessy, M. B., O'Leary, S. K., Hawke, J. L., & Wilson, S. E. (2002). Social
Influences on Cortisol and Behavioural Responses of Preweaning, Periadolescent, and Adult Guinea Pigs. Physiology & Behavior, 76(2), 305-314.
Hill, C. T., Krawczel, P. D., Dann, H. M., Ballard, C. S., Hovey, R. C., Falls, W. A., & Grant, R. J. (2009). Effect of Stocking Density on the Short-Term Behavioural Responses of Dairy Cows. Applied Animal Behaviour Science, 117(3-4), 144-149.
Hinch, G. N., Thwaites, C. J., Lynch, J. J., & Pearson, A. J. (1982). Spatial Relationships within a Herd of Young Sterile Bulls and Steers. Applied Animal
Ethology, 8(1-2), 27-44. Holm, L., Jensen, M. B., & Jeppesen, L. L. (2002). Calves' Motivation for Access to
Two Different Types of Social Contact Measured by Operant Conditioning. Applied Animal Behaviour Science, 79(3), 175-194.
Hopster, H., & Blockhuis, H. J. (1994). Validation of a Heart-Rate Monitor for Measuring a Stress Response in Dairy Cows. Canadian Journal of Animal
Science 74(3), 465-474. Hopster, H., O'Connell, J. M., & Blokhuis, H. J. (1995). Acute Effects of Cow-Calf
Separation on Heart Rate, Plasma Cortisol and Behaviour in Multiparous Dairy Cows. Applied Animal Behaviour Science, 44(1), 1-8.
Houpt, K. A., & Wolski, T. R. (1980). Stability of Equine Hierarchies and the Prevention of Dominance Related Aggression. Equine Veterinary Journal,
12(1), 15-18. Hovland, A. L., Akre, A. K., & Bakken, M. (2010). Group Housing of Adult Silver Fox
(Vulpes Vulpes) Vixens in Autumn: Agonistic Behaviour During the First Days Subsequent to Mixing. Applied Animal Behaviour Science, 126(3-4), 154-162.
Huber, R., Baumung, R., Wurzinger, M., Semambo, D., Mwai, O., & Winckler, C. (2008). Grazing, Social and Comfort Behaviour of Ankole and Crossbred (Ankoleã—Holstein) Heifers on Pasture in South Western Uganda. Applied
Animal Behaviour Science, 112(3), 223-234. Hudson, S. J., & Mullord, M. M. (1977). Investigations of Maternal Bonding in Dairy
Cattle. Applied Animal Ethology, 3(3), 271-276. Hughes, B. O., & Curtis, P. E. (1997). Health and Disease. In M. C. Appleby & B. O.
Hughes (Eds.), Animal Welfare (pp. 109-125). Oxfordshire: CABI International Huzzey, J. M., DeVries, T. J., Valois, P., & von Keyserlingk, M. A. G. (2006). Stocking
Density and Feed Barrier Design Affect the Feeding and Social Behavior of Dairy Cattle. J. Dairy Sci., 89(1), 126-133.
Ironson, G., & Hayward, H. S. (2008). Do Positive Psychosocial Factors Predict Disease Progression in Hiv-1? A Review of the Evidence. Psychosomatic
Medicine, 70(5), 546-554. Jago, J. G., & Berry, D. P. (2011). Associations between Herd Size, Rate of Expansion
and Production, Breeding Policy and Reproduction in Spring-Calving Dairy Herds. Animal, 5(10), 1626-1633.
Jensen, M. B., Pedersen, L. J., & Munksgaard, L. (2005). The Effect of Reward Duration on Demand Functions for Rest in Dairy Heifers and Lying Requirements as Measured by Demand Functions. Applied Animal Behaviour
Science, 90(3-4), 207-217.
192
Jóhannesson, T., & Sørensen, J. T. (2000). Evaluation of Welfare Indicators for the Social Environment in Cattle Herds. Animal Welfare, 9(3), 297-316.
Kawanaka, K. (1993). Age Differences in Spatial Positioning of Males in a Chimpanzee Unit-Group at the Mahale Mountains National Park, Tanzania. Primates, 34(3), 255-270.
Kay, S. J., Collis, K. A., & Anderson, J. C. (1977). The Effect of Intergroup Movement of Dairy Cows on Bulk-Milk Somatic Cell Numbers. Journal of Dairy research,
44(3), 589-593. Khan, M. S., & Shook, G. E. (1996). Effects of Age on Milk Yield: Time Trends and
Method of Adjustment. J. Dairy Sci., 79(6), 1057-1064. Kikusui, T., Winslow, J. T., & Mori, Y. (2006). Social Buffering: Relief from Stress
and Anxiety. Philosophical transactions of The Royal Society of Biology,
361(1476), 2215-2228. Kimberly, A. P., & Blumstein, D. T. (2008). Time Allocation and the Evolution of
Group Size. Animal Behaviour, 76(5), 1683-1699. Kimura, R., & Ihobe, H. (1985). Feral Cattle (Bos Taurus) on Kuchinoshima Island,
Southwestern Japan: Their Stable Ranging and Unstable Grouping. Journal of
Ethology, 3(1), 39-47. Kite-Consulting. (2011). World Class Dairying: A Vision for 2020. Staffordshire. (K.
Consulting o. Document Number) Kiyokawa, Y., Takeuchi, Y., & Mori, Y. (2007). Two Types of Social Buffering
Differentially Mitigate Conditioned Fear Responses. European Journal of
Neuroscience, 26(12), 3606-3613. Kjœstad, H. P., & Myren, H. J. (2001). Failure to Use Cubicles and Concentrate
Dispenser by Heifers after Transfer from Rearing Accommodation to Milking Herd. Acta vet. scand., 42(1), 171 - 180.
Klingel, H. (1982). Social Organization of Feral Horses. Journal of Reproduction and
Fertility, Supplement 32, 89-95. Kondo, S., Kawakami, N., Kohama, H., & Nishino, S. (1984). Changes in Activity,
Spatial Pattern and Social Behaviour in Calves after Grouping. Applied Animal
Ethology, 11(3), 217-228. Kondo, S., Sekine, J., Okubo, M., & Asahida, Y. (1989). The Effect of Group Size and
Space Allowance on the Agonistic and Spacing Behaviour of Cattle. Applied
Animal Behaviour Science, 24(2), 127-135. Koolhaas, J. M., Korte, S. M., De Boer, S. F., Van Der Vegt, B. J., Van Reenen, C. G.,
Hopster, H., De Jong, I. C., Ruis, M. A. W., & Blokhuis, H. J. (1999). Coping Styles in Animals: Current Status in Behavior and Stress-Physiology. Neuroscience & Biobehavioral Reviews, 23(7), 925-935.
Kornegay, E. T., Notter, D. R., Bartlett, H. S., & Lindemann, M. D. (1985). Variance of Body Weights and Daily Weight Gains of Weaner Pigs Housed at Various Stocking Densities in Confinement. Animal Production, 41(3), 369-373.
Krawczel, P. D., Mooney, C. S., Dann, H. M., Carter, M. P., Butzler, R. E., Ballard, C. S., & Grant, R. J. (2012). Effect of Alternative Models for Increasing Stocking Density on the Short-Term Behaviour and Hygiene of Holstein Dairy Cows. J.
Dairy Sci., 95(5), 2467-2475. Krohn, C. C., & Konggaard, S. P. (1979). Effects of Isolating First-Lactation Cows
from Older Cows. Livestock production science, 6(2), 137-146. Laister, S., Stockinger, B., Regner, A.-M., Zenger, K., Knierim, U., & Winckler, C.
(2011). Social Licking in Dairy Cattle--Effects on Heart Rate in Performers and Receivers. Applied Animal Behaviour Science, 130(3-4), 81-90.
193
Langer, S. L., Brown, J. D., & Syrjala, K. L. (2009). Intrapersonal and Interpersonal Consequences of Protective Suffering among Cancer Patients and Caregivers. Cancer, 115(18 Suppl), 4311-4325.
Lazo, A. (1994). Social Segregation and the Maintenance of Social Stability in a Feral Cattle Population. Animal Behaviour, 48(5), 1133-1141.
Lazo, A. (1995). Ranging Behaviour in Feral Cattle (Bos Taurus) in Doñana National Park S. W. Spain. J. Zool., Lond., 236(3), 359-369.
Le Neindre, P., & Sourd, C. (1984). Influence of Rearing Conditions on Subsequent Social Behaviour of Friesian and Salers Heifers from Birth to Six Months of Age. Applied Animal Behaviour Science, 12(1-2), 43-52.
Lefcourt, A. M., Erez, B., Varner, M. A., Barfield, R., & Tasch, U. (1999). A Noninvasive Radiotelemetry System to Monitor Heart Rate for Assessing Stress Responses of Bovines. J. Dairy Sci., 82(6), 1179-1187.
Lehmann, J., Korstjens, A. H., & Dunbar, R. I. M. (2007). Group Size, Grooming and Social Cohesion in Primates. Animal Behaviour, 74(6), 1617-1629.
Leone, E. H., Estevez, I., & Christman, M. C. (2007). Environmental Complexity and Group Size: Immediate Effects on Use of Space by Domestic Fowl. Applied
Animal Behaviour Science, 102(1-2), 39-52. Lévy, F., & Keller, M. (2009). Olfactory Mediation of Maternal Behavior in Selected
Mammalian Species. Behavioural Brain Research, 200(2), 336-345. Lidfors, L. M. (1996). Behavioural Effects of Separating the Dairy Calf Immediately or
4 Days Post-Partum. Applied Animal Behaviour Science, 49(3), 269-283. Lott, D. F., and, & Minta, S. C. (1983). Random Individual Association and Social
Group Instability in American Bison (Bison Bison). Z. Tierspsychol, 61(2), 153-172.
Løvendahl, P., & Chagunda, M. G. G. (2011). Covariance among Milking Frequency, Milk Yield, and Milk Composition from Automatically Milked Cows. J. Dairy
Sci., 94(11), 5381-5392. Lusseau, D., Whitehead, H. A. L., & Gero, S. (2008). Incorporating Uncertainty into the
Study of Animal Social Networks. Animal Behaviour, 75(5), 1809 - 1815. Marsland, A. L., Bachen, E. A., Cohen, S., Rabin, B., & Manuck, S. B. (2002). Stress,
Immune Reactivity and Susceptibility to Infectious Disease. Physiology &
Behaviour, 77(4-5), 711-716. Martin, J. E. (2005). The Effects of Rearing Conditions on Grooming and Play
Behaviour in Captive Chimpanzees. Animal Welfare, 14(2), 125-133. Mateo, J. M. (2009). The Causal Role of Odours in the Development of Recognition
Templates and Social Preferences. Animal Behaviour, 77(1), 115-121. Mejdell, C. M. (2006). The Role of Councils on Animal Ethics in Assessing Acceptable
Welfare Standards in Agriculture. 103(3), 292-296. Mench, J. A., Swanson, J. C., & Stricklin, W. R. (1990). Social Stress and Dominance
among Group Members after Mixing Beef Cows. Canadian Journal of Animal
Science, 70(2), 345–354. Mendl, M., Zanella, A. J., & Broom, D. M. (1992). Physiological and Reproductive
Correlates of Behavioural Strategies in Female Domestic Pigs. Animal
Behaviour, 44(6), 1107-1121. Menke, C., Waiblinger, S., lsch, D. W., & Wiepkema, P. R. (1999). Social Behaviour
and Injuries of Horned Cows in Loose Housing Systems. Animal Welfare, 8(3), 243-258.
Micheletta, J., & Waller, B. M. (2012). Friendship Affects Gaze Following in a Tolerant Species of Macaque, Macaca Nigra. Animal Behaviour, 83(2), 459-467.
194
Miller, K., & Wood-Gush, D. G. M. (1991). Some Effects of Housing on the Social Behaviour of Dairy Cows. British Society of Animal Production, 53(3), 271-278.
Mitani, J. C. (2009). Male Chimpanzees Form Enduring and Equitable Social Bonds. Animal Behaviour, 77(3), 633-640.
Moberg, G. P., & Mench, J. A. (1999). The Biology of Animal Stress: Basic Principles
and Implications for Animal Welfare. Wallingford CAB International. Moberg, G. P., & Mench, J. A. (2000). The Biology of Animal Stress: Basic Principles
and Implications for Animal Welfare. Wallingford CAB International. Mohr, E., Langbein, J., & Nürnberg, G. (2002). Heart Rate Variability: A Noninvasive
Approach to Measure Stress in Calves and Cows. Physiology & Behavior, 75(1-2), 251-259.
Mormède, P., Andanson, S., Aupérin, B., Beerda, B., Guémené, D., Malmkvist, J., Manteca, X., Manteuffel, G., Prunet, P., van Reenen, C. G., Richard, S., & Veissier, I. (2007). Exploration of the Hypothalamic-Pituitary-Adrenal Function as a Tool to Evaluate Animal Welfare. Physiology & Behaviour, 92(3), 317-339.
Müller, R., & Schrader, L. (2005). Behavioural Consistency During Social Separation and Personality in Dairy Cows. Behaviour, 142(9-10), 1289-1306.
Murphey, R. M. (1990). Social Aggregations in Cattle. I. Segregation by Breed in Free-Ranging Herds. Behaviour Genetics, 20(3), 341-354.
Nair, H. P., & Young, L. J. (2006). Vasopressin and Pair-Bond Formation: Genes to Brain to Behavior. Physiology, 21(2), 146-152.
National Milk Records. (2012). Service Overview. [online] Retrieved 28th August, 2012, from http://www.nmr.co.uk/services/
Negrão, J. A., Porcionato, M. A., de Passille, A. M., & Rushen, J. (2004). Cortisol in Saliva and Plasma of Cattle after Acth Administration and Milking. J. Dairy
Sci., 87(6), 1713-1718. Neisen, G., Wechsler, B., & Gygax, L. (2007). Evaluation of Sampling Intervals for
Quantifying Neighbourhood in Dairy Cows. Paper presented at the International Society of Applied Ethology, Mexico.
Neisen, G., Wechsler, B., & Gygax, L. (2009a). Choice of Scan-Sampling Intervals--an Example with Quantifying Neighbours in Dairy Cows. Applied Animal
Behaviour Science, 116(2-4), 134-140. Neisen, G., Wechsler, B., & Gygax, L. (2009b). Effects of the Introduction of Single
Heifers or Pairs of Heifers into Dairy-Cow Herds on the Temporal and Spatial Associations of Heifers and Cows. Applied Animal Behaviour Science, 119(3-4), 127-136.
Newberry, R. C., & Swanson, J. C. (2001). Breaking Social Bonds. In L. J. Keeling & H. W. Gonyou (Eds.), Social Behaviour in Farm Animals (pp. 307-331). Oxon: CABI Publishing.
Newberry, R. C., & Swanson, J. C. (2008). Implications of Breaking Mother-Young Social Bonds. Applied Animal Behaviour Science, 110(1-2), 3-23.
Norberg, E. (2005). Electrical Conductivity of Milk as a Phenotypic and Genetic Indicator of Bovine Mastitis: A Review. Livestock production science, 96(2-3), 129-139.
O'Connell, J., Giller, P. S., & Meaney, W. (1989). A Comparison of Dairy Cattle Behavioural Patterns at Pasture and During Confinement. Irish Journal of
Agricultural Research, 28(1), 65-72. O'Connell, N. E., Beattie, V. E., & Moss, B. W. (2004). Influence of Replacement Rate
on the Welfare of Sows Introduced to a Large Dynamic Group. Applied Animal
Behaviour Science, 85(1-2), 43-56.
195
O'Connell, N. E., Wicks, H. C. F., Carson, A. F., & McCoy, M. A. (2008). Influence of Post-Calving Regrouping Strategy on Welfare and Performance Parameters in Dairy Heifers. Applied Animal Behaviour Science, 114(3-4), 319-329.
O'Donnell, S., Horan, B., Butler, A. M., & Shalloo, L. (2011). A Survey of the Factors Affecting the Future Intentions of Irish Dairy Farmers. Journal of Agricultural
Science, 149(5), 647-654. O'Driscoll, K., von Keyserlingk, M. A. G., & Weary, D. M. (2006). Effects of Mixing
on Drinking and Competitive Behavior of Dairy Calves. J. Dairy Sci., 89(1), 229-233.
Olofsson, J. (1999). Competition for Total Mixed Diets Fed for Ad Libitum Intake Using One or Four Cows Per Feeding Station. J. Dairy Sci., 82(1), 69-79.
Olsson, A., & Svendsen, J. (1997). The Importance of Familiarity When Grouping Gilts, and the Effect of Frequent Grouping During Gestation. Swedish Journal of
Agriculture Research, 27(1), 33-43. Patison, K. P., Swain, D. L., Bishop-Hurley, G. J., Pattison, P., & Robins, G. (2010).
Social Companionship Versus Food: The Effect of the Presence of Familiar and Unfamiliar Conspecifics on the Distance Steers Travel. Applied Animal
Behaviour Science, 122(1), 13-20. Patullo, B. W., Baird, H. P., & Macmillan, D. L. (2009). Altered Aggression in
Different Sized Groups of Crayfish Supports a Dynamic Social Behaviour Model. Applied Animal Behaviour Science, 120(3-4), 231-237.
Pellis, S. M., & Pellis, V. C. (2010). Social Play, Social Grooming and the Regulation of Social Relationships In A. V. Kalueff, J. L. LaPorte & C. L. Bergner (Eds.), Neurobiology of Grooming Behaviour (pp. 66-87). New York: Cambridge University Press.
Perreault, C. (2010). A Note on Reconstructing Animal Social Networks from Independent Small-Group Observations. Animal Behaviour, 80(3), 551-562.
Phillips, C. (2002). Cattle Behaviour and Welfare (2nd ed.). Oxford: Blackwell Science Ltd.
Phillips, C. J. C., & Rind, M. I. (2001). The Effects on Production and Behavior of Mixing Uniparous and Multiparous Cows. J. Dairy Sci., 84(11), 2424-2429.
Phillips, C. J. C., & Schofield, S. A. (1994). The Effect of Cubicle and Straw Yard Housing on the Behaviour, Production and Hoof Health of Dairy Cows. Animal
Welfare, 3(1), 37-44. Piller, C. A. K., Stookey, J. M., & Watts, J. M. (1999). Effects of Mirror-Image
Exposure on Heart Rate and Movement of Isolated Heifers. Applied Animal
Behaviour Science, 63(2), 93-102. Pitts, A. D., Weary, D. M., Pajor, E. A., & Fraser, D. (2000). Mixing at Young Ages
Reduces Fighting in Unacquainted Domestic Pigs. Applied Animal Behaviour
Science, 68(3), 191-197. Plaut, K., & Casey, T. (2012). Does the Circadian System Regulate Lactation? Animal,
6(3), 394-402. Price, E. O., Harris, J. E., Borgwardt, R. E., Sween, M. L., & Connor, J. M. (2003).
Fenceline Contact of Beef Calves with Their Dams at Weaning Reduces the Negative Effects of Separation on Behaviour and Growth Rate. Journal of
Animal Science, 81(1), 116-121. Price, E. O., & Thos, J. (1980). Behavioural Responses to Short-Term Social Isolation
in Sheep and Goats. Applied Animal Ethology, 6(4), 331-339.
196
Proudfoot, K. L., Veira, D. M., Weary, D. M., & von Keyserlingk, M. A. G. (2009). Competition at the Feed Bunk Changes the Feeding, Standing, and Social Behavior of Transition Dairy Cows. J. Dairy Sci., 92(7), 3116-3123.
Purcell, D., & Arave, C. W. (1991). Isolation Vs. Group Rearing in Monozygous Twin Heifer Calves. Applied Animal Behaviour Science, 31(3-4), 147-156.
Ramírez, A., Quiles, A., Hevia, M. L., Sotillo, F., & Ramírez, M. C. (1996). Effects of Immediate and Early Post-Partum Separation on Maintenance of Maternal Responsiveness in Parturient Multiparous Goats. Applied Animal Behaviour
Science, 48(3-4), 215-224. Ramseyer, A., Boissy, A., Thierry, B., & Dumont, B. (2009). Individual and Social
Determinants of Spontaneous Group Movements in Cattle and Sheep. Animal,
3(09), 1319-1326. Rasmussen, L., Jensen, M. B., & Jeppesen, L. L. (2006). The Effect of Age at
Introduction and Number of Milk-Portions on the Behaviour of Group Housed Dairy Calves Fed by a Computer Controlled Milk Feeder. Applied Animal
Behaviour Science, 100(3-4), 153-163. Rault, J. L. (2012). Friends with Benefits: Social Support and Its Relevance for Farm
Animal Welfare. Applied Animal Behaviour Science, 136(1), 1-14. Raussi, S., Boissy, A., Delval, E., Pradel, P., Kaihilahti, J., & Veissier, I. (2005). Does
Repeated Regrouping Alter the Social Behaviour of Heifers? Applied Animal
Behaviour Science, 93(1-2), 1-12. Raussi, S., Niskanen, S., Siivonen, J., Hänninen, L., Hepola, H., Jauhiainen, L., &
Veissier, I. (2010). The Formation of Preferential Relationships at Early Age in Cattle. Behavioural processes, 84(3), 726-731.
Regula, G., Danuser, J., Spycher, B., & Wechsler, B. (2004). Health and Welfare of Dairy Cows in Different Husbandry Systems in Switzerland. Preventive
Veterinary Medicine, 66(1-4), 247-264. Reinhardt, A., & Reinhardt, V. (1982). Social Behaviour and Social Bonds between
Juvenille and Sub-Adult Bos Indicus Calves. Abstract. Applied Animal Ethology,
9(1), 99-93. Reinhardt, V. (1980). The Family Bonds in Cattle. Reviews in Rural Science, 4, 133-
134. Reinhardt, V., Mutiso, F. M., & Reinhardt, A. (1978). Social Behaviour and Social
Relationships between Female and Male Prepubetal Bovine Calves (Bos
Indicus). Applied Animal Ethology, 4(1), 43-54. Reinhardt, V., & Reinhardt, A. (1975). Dynamics of Social Hierarchy in a Dairy Herd.
Z. Tierspsychol, 38(3), 315 - 323. Reinhardt, V., & Reinhardt, A. (1981). Cohesive Relationships in a Cattle Herd.
Behaviour, 77(3), 121-151. Rioja-Lang, F. C., Roberts, D. J., Healy, S. D., Lawrence, A. B., & Haskell, M. J.
(2009). Dairy Cows Trade-Off Feed Quality with Proximity to a Dominant Individual in Y-Maze Choice Tests. Applied Animal Behaviour Science, 117(3-4), 159-164.
Rodríguez-Estévez, V., Sánchez-Rodríguez, M., Gómez-Castro, A. G., & Edwards, S. A. (2010). Group Sizes and Resting Locations of Free Range Pigs When Grazing in a Natural Environment. Applied Animal Behaviour Science, 127(1-2), 28-36.
Ruis, M. A. W., te Brake, J. H. A., Engel, B., Buist, W. G., Blokhuis, H. J., & Koolhaas, J. M. (2001). Adaptation to Social Isolation: Acute and Long-Term Stress
197
Responses of Growing Gilts with Different Coping Characteristics. Physiology
& Behaviour, 73(4), 541-551. Ruis, M. A. W., te Brake, J. H. A., Engel, B., Buist, W. G., Blokhuis, H. J., & Koolhaas,
J. M. (2002). Implications of Coping Characteristics and Social Status for Welfare and Production of Paired Growing Gilts. Applied Animal Behaviour
Science, 75(3), 207-231. Rushen, J., De Passille, A. M., Von Keyserlingk, M. A. G., & Weary, D. M. (2010). The
Welfare of Cattle (Vol. 5). Dordrecht: Springer. Salvatore, P. I., & Wilson, J. H. (2008). Social Buffering in Rats: Prolactin Attenuation
of Active Interaction. Psychological Reports, 103(1), 77-87. Samarakone, T. S., & Gonyou, H. W. (2009). Domestic Pigs Alter Their Social Strategy
in Response to Social Group Size. 121(1), 8-15. Sandem, A.-I., & Braastad, B. O. (2005). Effects of Cow-Calf Separation on Visible
Eye White and Behaviour in Dairy Cows-a Brief Report. Applied Animal
Behaviour Science, 95(3-4), 233-239. Sato, S., Sako, S., & Maeda, A. (1991). Social Licking Patterns in Cattle (Bos Taurus):
Influence of Environmental and Social Factors. Applied Animal Behaviour
Science, 32(1), 3-12. Sato, S., Sassa, H., & Sonoda, T. (1990). Effect of the Dominance Rank of Partner
Cows on Social Behaviour of Newly Introduced Heifers. . Jpn. J. Livest.
Manage., 26(2), 64-69 (In Japanese, with English abstract). Sato, S., & Tarumizu, K. (1993). Heart Rates before, During and after Allo-Grooming
in Cattle (Bos Taurus). Journal of Ethology, 11(2), 149-150. Sato, S., Tarumizu, K., & Hatae, K. (1993). The Influence of Social Factors on
Allogrooming in Cows. Applied Animal Behaviour Science, 38(3-4), 235-244. Sato, S., Wood-Gush, D. G. M., & Wetherhill, G. (1987). Observations on Creche
Behaviour in Suckler Calves. Behavioural processes, 15(2-3), 333-343. Savory, C. J. (2004). Laying Hen Welfare Standards: A Classic Case of 'Power to the
People'. Animal Welfare, 13(Supplement 1), 153-158. Schmolke, S. A., Li, Y. Z., & Gonyou, H. W. (2004). Effects of Group Size on Social
Behavior Following Regrouping of Growing-Finishing Pigs. Applied Animal
Behaviour Science, 88(1-2), 27-38. Schneider, G., & Krueger, K. (2012). Third-Party Interventions Keep Social Partners
from Exchanging Affiliative Interactionsâ with Others. Animal Behaviour, 83(2), 377-387.
Schrader, L. (2002). Consistency of Individual Behavioural Characteristics of Dairy Cows in Their Home Pen. Applied Animal Behaviour Science, 77(4), 255-266.
Schweitzer, C., Houdelier, C., Lumineau, S., Lévy, F., & Arnould, C. (2010). Social Motivation Does Not Go Hand in Hand with Social Bonding between Two Familiar Japanese Quail Chicks, Coturnix Japonica. Animal Behaviour, 79(3), 571-578.
Schweitzer, C., Lévy, F., & Arnould, C. (2011). Increasing Group Size Decreases Social Bonding in Young Japanese Quail, Coturnix Japonica. Animal Behaviour, 81(3), 535-542.
Sgoifo, A., De Boer, S. F., Westenbroek, Maes, F. W., Beldhuis, H., Suzuki, T., & Koolhaas, J. M. (1997). Incidence of Arrhythmias and Heart Rate Variability in Wild-Type Rats Exposed to Social Stress. American Physiological Society,
273(4), H1754 - 1760.
198
Shalloo, L., & Horan, B. (2007). Profitable Dairying in an Increased Eu Milk Quota
Scenario. Paper presented at the National Dairy Conference - Exploiting the Freedom to Milk, Kilkenny & Co. Mayo.
Sibbald, A. M., Elston, D. A., Smith, D. J. F., & Erhard, H. W. (2005). A Method for Assessing the Relative Sociability of Individuals within Groups: An Example with Grazing Sheep. Applied Animal Behaviour Science, 91(1-2), 57-73.
Siebert, K., Langbein, J., Schön, P.-C., Tuchscherer, A., & Puppe, B. (2011). Degree of Social Isolation Affects Behavioural and Vocal Response Patterns in Dwarf Goats (Capra Hircus). Applied Animal Behaviour Science, 131(1-2), 53-62.
Siegel, S., & Castellan, N., J., Jr,. (1988). Nonparametric Statistics for the Behavioral
Sciences (2 ed.). New york: McGraw-Hill book company. Sigurjonsdottir, H., van Dierendonck, M. C., & Thorhallsdottir, A. G. (N. D.).
Friendship among Horses- Rank and Kinship Matter. [online] Retrieved 06/11/04, 2004, from http://www2.vet.upenn.edu/labs/equinebehaviour/hvnwkshp/hv02/sigurjon.htm
Silk, J. B., Alberts, S. C., Altmann, J., Cheney, D. L., & Seyfarth, R. M. (2012). Stability of Partner Choice among Female Baboons. Animal Behaviour, 83(6), 1511-1518.
Simensen, E., Østerås, O., Bøe, K. E., Kielland, C., Ruud, L. E., & Næss, G. (2010). Housing System and Herd Size Interactions in Norwegian Dairy Herds; Associations with Performance and Disease Incidence. Acta vet. scand., 52(14), 1-9.
Simmins, P. H. (1993). Reproductive Performance of Sows Entering Stable and Dynamic Groups after Mating. Animal Production, 57(2), 293 - 298.
Smith, J. E., Powning, K. S., Dawes, S. E., Estrada, J. R., Hopper, A. L., Piotrowski, S. L., & Holekamp, K. E. (2011). Greetings Promote Cooperation and Reinforce Social Bonds among Spotted Hyaenas. Animal Behaviour, 81(2), 401-415.
Solano, J., Orihuela, A., Galina, C. S., & Aguirre, V. (2007). A Note on Behavioral Responses to Brief Cow-Calf Separation and Reunion in Cattle (Bos Indicus). Journal of Veterinary Behavior: Clinical Applications and Research, 2(1), 10-14.
Sowerby, M. E., & Polan, C. E. (1978). Milk Production Response to Shifting Cows between Intraherd Groups. J. Dairy Sci., 61(4), 455-460.
Spencer, K. A., & Verhulst, S. (2008). Post-Natal Exposure to Corticosterone Affects Standard Metabolic Rate in the Zebra Finch (Taeniopygia Guttata). General and
Comparative Endocrinology, 159(2-3), 250-256. Spinka, M. (2006). How Important Is Natural Behaviour in Animal Farming Systems?
Applied Animal Behaviour Science, 100(1-2), 117-128. St-Pierre, N. R., & Thraen, C. S. (1999). Animal Grouping Strategies, Sources of
Variation, and Economic Factors Affecting Nutrient Balance on Dairy Farms. Journal of Animal Science, 77(S2), 72-83.
Stěhulová, I., Lidfors, L., & Špinka, M. (2008). Response of Dairy Cows and Calves to Early Separation: Effect of Calf Age and Visual and Auditory Contact after Separation. Applied Animal Behaviour Science, 110(1-2), 144-165.
Stookey, J. M., & Gonyou, H. W. (1994). The Effects of Regrouping on Behavioral and Production Parameters in Finishing Swine. J. Anim Sci., 72(11), 2804-2811.
Svensson, C., & Liberg, P. (2006). The Effect of Group Size on Health and Growth Rate of Swedish Dairy Calves Housed in Pens with Automatic Milk-Feeders. Preventive Veterinary Medicine, 73(1), 43-53.
199
Swain, D. L., & Bishop-Hurley, G. J. (2007). Using Contact Logging Devices to Explore Animal Affiliations: Quantifying Cow-Calf Interactions. Applied
Animal Behaviour Science, 102(1-2), 1-11. Takeda, K., Sato, S., & Sugawara, K. (2000). The Number of Farm Mates Influences
Social and Maintenance Behaviours of Japanese Black Cows in a Communal Pasture. Applied Animal Behaviour Science, 67(3), 181-192.
Takeda, K., Sato, S., & Sugawara, K. (2003). Familiarity and Group Size Affect Emotional Stress in Japanese Black Heifers. Applied Animal Behaviour Science,
82(1), 1-11. Tan, S. S. L., & Shackleton, D. M. (1990). Effects of Mixing Unfamiliar Individuals
and of Azaperone on the Social Behaviour of Finishing Pigs. Applied Animal
Behaviour Science, 26(1), 157 - 168. Tan, S. S. L., Shackleton, D. M., & Beames, R. M. (1991). The Effect of Mixing
Unfamiliar Individuals on the Growth and Production of Finishing Pigs. Animal
Production, 52(1), 201 - 206. Tanner, C. J., & Jackson, A. L. (2011). The Combination of Social and Personal
Contexts Affects Dominance Hierarchy Development in Shore Crabs, Carcinus
Maenas. Animal Behaviour, 82(5), 1185-1192. Tennessen, T., Price, M. A., & Berg, R. T. (1985). The Social Interactions of Young
Bulls and Steers after Re-Grouping. Applied Animal Behaviour Science, 14(1), 37-47.
Termeulen, S. B., Butler, W. R., & Natzke, R. P. (1981). Rapidity of Cortisol Transfer between Blood and Milk Following Adrenocorticotropin Injection. J. Dairy Sci.,
64(11), 2197-2200. Tuchscherer, M., Kanitz, E., Puppe, B., Tuchscherer, A., & Viergutz, T. (2009).
Changes in Endocrine and Immune Responses of Neonatal Pigs Exposed to a Psychosocial Stressor. Research in Veterinary Science, 87(3), 380-388.
Tuchscherer, M., Puppe, B., Tuchscherer, A., & Kanitz, E. (1998). Effects of Social Status after Mixing on Immune, Metabolic, and Endocrine Responses in Pigs. Physiology & Behavior, 64(3), 353-360.
Tucker, C. B., Weary, D. M., Rushen, J., & De Passille, A. M. (2004). Designing Better Environments for Dairy Cattle to Rest. Advances in Dairy Technology, 16, 39-53.
Uchino, B. N. (2006). Social Support and Health: A Review of Physiological Processes Potentially Underlying Links to Disease Outcomes. Journal of Behavioural
Medicine, 29(4), 377-387. Underwood, R. (1981). Companion Preference in an Eland Herd. African Journal of
Ecology, 19(4), 341-354. Ursinus, W. W., Schepers, F., de Mol, R. M., Bracke, M. B. M., Metz, J. H. M., &
Groot Koerkamp, P. W. G. (2009). Cowel: A Decision Support System to Assess Welfare of Husbandry Systems for Dairy Cattle. Animal Welfare, 18(4), 545-552.
Val-Laillet, D., de Passille, A. M., Rushen, J., & von Keyserlingk, M. A. G. (2008). The Concept of Social Dominance and the Social Distribution of Feeding-Related Displacements between Cows. Applied Animal Behaviour Science, 111(1), 158-172.
Val-Laillet, D., Guesdon, V., von Keyserlingk, M. A. G., de Passillé, A. M., & Rushen, J. (2009). Allogrooming in Cattle: Relationships between Social Preferences, Feeding Displacements and Social Dominance. Applied Animal Behaviour
Science, 116(2-4), 141-149.
200
VanDierendonck, M. C., de Vries, H., Schilder, M. B. H., Colenbrander, B., Thorhallsdóttir, A. G., & Sigurjónsdóttir, H. (2009). Interventions in Social Behaviour in a Herd of Mares and Geldings. Applied Animal Behaviour Science,
116(1), 67-73. Veissier, I., & Boissy, A. (2007). Stress and Welfare: Two Complementary Concepts
That Are Intrinsically Related to the Animal's Point of View. Physiology &
Behavior, 92(3), 429-433. Veissier, I., Boissy, A., de Passille, A. M., Rushen, J., van Reenen, C. G., Roussel, S.,
Andanson, S., & Pradel, P. (2001). Calves' Responses to Repeated Social Regrouping and Relocation. J. Anim Sci., 79(10), 2580-2593.
Veissier, I., Lamy, D., & Le Neindre, P. (1990a). Social Behaviour in Domestic Beef Cattle When Yearling Calves Are Left with Cows for the Next Calving. Applied
Animal Behaviour Science, 27(3), 193-200. Veissier, I., & Le Neindre, P. (1989). Weaning in Calves: Its Effects on Social
Organisation. Applied Animal Behaviour Science, 24(1), 43-54. Veissier, I., Le Neindre, P., & Garel, J. P. (1990b). Decrease in Cow-Calf Attachment
after Weaning. Behavioural processes, 21(2-3), 95-105. Verbrugghe, E., Boyen, F., Gaastra, W., Bekhuis, L., Leyman, B., Van Parys, A.,
Haesebrouck, F., & Pasmans, F. (2012). The Complex Interplay between Stress and Bacterial Infections in Animals. Veterinary Microbiology, 155(2-4), 115-127.
Verkerk, G. A., Phipps, A. M., Carragher, J. F., Matthews, L. R., & Stelwagen, K. (1998). Characterization of Milk Cortisol Concentrations as a Measure of Short-Term Stress Responses in Lactating Dairy Cows. Animal Welfare, 7(1), 77-86.
von Keyserlingk, M. A. G., Olenick, D., & Weary, D. M. (2008). Acute Behavioural Effects of Regrouping Dairy Cows. J. Dairy Sci., 91(3), 1011-1016.
Von Keyserlingk, M. A. G., & Weary, D. M. (2007). Maternal Behaviour in Cattle. Hormones and Behavior, 52(1), 106-113.
Waiblinger, S., Cerny, D., Hofmann, R., Kraetzl, W. D., Meyer, H. H. D., Palme, R., & Menke, C. (2006). Social Bonds of Dairy Cows Affect Reactions in a
Challenging Situation and Relate to Health. Paper presented at the International Society of Applied Ethology, Bristol.
Wechsler, B., & Lea, S. E. G. (2007). Adaptation by Learning: Its Significance for Farm Animal Husbandry. Applied Animal Behaviour Science, 108(3-4), 197-214.
The Welfare of Farmed Animals (England) Regulations, (2007). London: HMSO. White, D. J., & Smith, V. A. (2007). Testing Measures of Animal Social Association by
Computer Simulation. Behaviour, 144(11), 1447-1468. Whitehead, H. (2008). Analysing Animal Societies. Quantitative Methods for Vertebrate
Social Analysis. London The University of Chicago Press, Ltd. Wierenga, H. K. (1990). Social Dominance in Dairy Cattle and the Influences of
Housing and Management. Applied Animal Behaviour Science, 27(3), 201-229. Wierenga, H. K., & Hopster, H. (1990). The Significance of Cubicles for the Behaviour
of Dairy Cows. Applied Animal Behaviour Science, 26(4), 309-337. Wittemyer, G., Douglas-Hamilton, I., & Getz, W. M. (2005). The Socioecology of
Elephants: Analysis of the Processes Creating Multitiered Social Structures. Animal Behaviour, 69(6), 1357-1371.
Zanella, A. J., Brunner, P., Unshelm, J., Mendl, M. T., & Broom, D. M. (1998). The Relationship between Housing and Social Rank on Cortisol, Β-Endorphin and Dynorphin (1-13) Secretion in Sows. Applied Animal Behaviour Science, 59(1), 1-10.