Embed Size (px)
Citation preview
Anderson Municipal Light & Power
Thomas Broderick. Jr. M.iyor
May 5, 2017
550 Dale KeithJones Road, Anderson, I:'ll 46011 (765) 648- 6480 0 Fa."t (765) 648-6551
http:/ /www.cityofandersOILcom
Via Electronic Filing - 30 Day Filings - Electric
Mary Becerra
Conunission Secretary
Indiana Utili ty Regulatory Conunission
101 West Washington St, Suite 1500 E
Indianapolis, IN 46204
Rii Reliable Public Power Provider
RE: Anderson Municipal Light & Power 30 Day Filing Pursuant to 170 IAC 1-6-1 et seq.
Dear Ms. Becerra:
Pursuant to 170 IAC 1-6-5, please find enclosed the following 30 Day Filing by A nderson Municipal
Light & Power: 3rd Quarter 2017 Tracker filing. The tariff sheets and work papers are attached. The
purpose of this filing is to adjust the rates in accordance with the tracker. This filing is necessary
because we are required to adjust the rates every quarter in accordance to the tracker. This filing is allowed under 170 IAC 1-6-3 for the following reasons: Changes in purchased power costs.
T he person at Anderson Municipal Light & Power to be contacted regarding this filing is:
Anthony P . Pochard
(7 65) 648-6480 I (7 65) 648-6551 (FAX)
550 Dale Keith Jones Road, Anderson, IN 46011
Affected customers have been notified as required under 170 IAC 1-6-6. Notice was published in the Anderson H erald Bulletin on May 5, 2017 . Notice has been posted in a public place in
the utility office. Notice has also been posted on the City of Anderson's website at www.cityofanderson.com. A copy of the notice is attached.
T verify that notice has been provided as stated in this letter and that this le tter and the attached
documents are true and accurate to the best of my knowledge, information, and belief.
Director
Anderson Municipal Ligh t and Power
NOTICE OF PROPOSED RATE CHANGE BY ANDERSON MUNICIPAL LIGHT & POWER
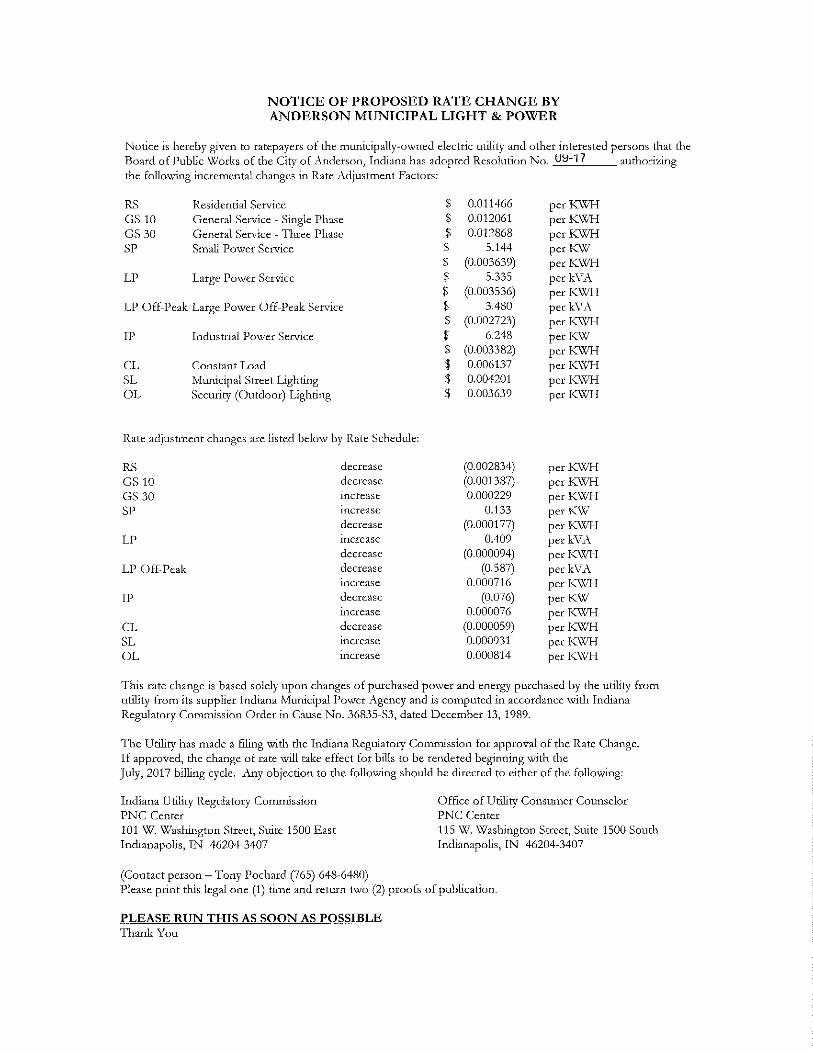
NoHce is hereby given lo ratepayers of the municipally-owned electric utility and other interested persons that the Board of Public Works of the City of Anderson, Indiana has adopted Resolution No. 09-17 authorizing the following incremental changes in Rate Adjustment Factors:
RS Residential Service $ 0.011466 per KWH GS10 General Service - Single Phase $ 0.012061 per KWH GS 30 General Service "Three Phase $ 0.012868 per KWH SP Small Power Service $ 5.144 per KW
$ (0.003639) per KWH LP Large Power Service $ 5.335 per kVA
$ (0.003536} per KWH LP Off-Peak Large Power Off-Peak Service $ 3.480 per !(VA
$ (0.002723} per KWH IP Industrial Power Service $ 6.248 per KW
$ (0.003382) per KWH CL Constant Load $ 0.006137 per KWH SL Municipal Street Lighting $ 0.004201 per l<WH OL Security (Outdoor) Lighting $ 0.003639 per KWH Rate adjustment changes are listed below by Rate Schedule: RS decrease (0.0028341 per KWH GS 10 decrease (0.001387 per KWH GS 30 increase 0.000229 per KWH SP increase 0.133 per KW
decrease (0.000177) per KWH LP increase 0.409 per kVA
decrease (0.000094) per KWH LP Off-Peak decrease (0.587) per kVA
increase 0.000716 per KWH IP decrease (0.076) per KW
increase 0.000076 per KWH CL decrease (0.000059) per KWH SL increase 0.000931 per KWH OL increase 0.000814 per KWH This rate change is based sOlely upon changes of purchased power and
energy purchased by the utility from its supplier _Indiana Municipal Power Agency and is computed in accordance with Indiana Regulatory Commission Order in Cause No. 36835-S3, dated December 13,1989.
The Utility has made a filing with the Indiana Regulatory Commission for approval of the Rate Change. If approved, the change of rate will tal1e effect for bills lo be rendered beginning with the July, 2017 billing cycle. Any objection to the following should be directed to either of the following:
Indiana Utility Office of Regulatory Commission Utility Consumer Counselor PNC Center PNC Center 101 W. Washington Street, 115 W. Washington Street Suite 1500 East Suite 1500 South Indianapolis, IN 46204-3407 Indianapolis, IN 46204-3407
HB-380 May 5 hspaxlp

Thomas Broderick. Jr. Mayor
April 26, 2017
Anderson Municipal Light & Power
550 Dale Keith Jones Road, Anderson, Dl -1601 1 (765) 648-6480 0 Fa."C (765) 648 -6551
http:/ / www.cityofander son.com
TO: Board of Public Works
FROM: Tony Pochard, Director
SUBJECT: New Purchased Power Cost Tracking Factor
Reliable Public Power Provider
Enclosed, for your review and approval, is a copy of our tracker filing with the Indiana Utility
Regulatory Commission for the three-month period of July, August and Sep tember, 2017.
The proposed tracker will result in a decrease for our residential customers; the average customer
using 800 k\Vh will see a decrease of $2.27 or 2.3%. This change is based solely upon changes
in purchased power costs from our supplier, Indiana Municipal Power Agency.
If you have any questions or need any additional information, let me lmow.
Sincerely,
AnthonyP.
Director
Anderson Municipal Light & Power
APP/jes
Enclosure
cc: Mayor Broderick
Evan Broderick
ANDERSON MUNICIPAL LIGHT & POWER
Appendix A
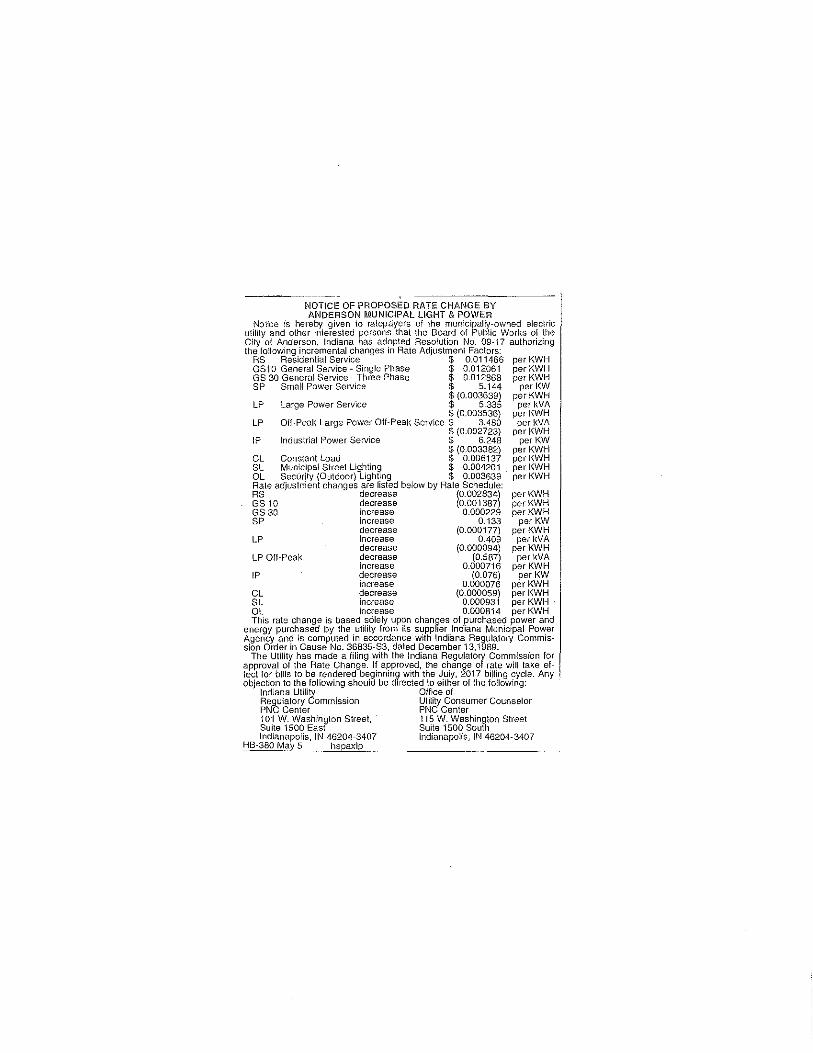
Rate Adjustments
TI1e Rate Adjustments shall be on the basis of a Purchase Power Cost Adjustment
Tracking Factor occasioned solely by changes in the cost of purchased po\.ver and
energy, in accordance with the Order of the Indiana Utility Regulatory Commission,
approved December 13, 1989 in Cause No. 36835-53, as follows:
Rate Adjustments applicable to the below listed Rate Schedules are as follows:
Residential Service (RS) $ 0.011466 per KWH
General Service - Single Phase (GS 10) $ 0.012061 per KWH
General Service - Three Phase (GS 30) $ 0.012868 per KWH
Small Power Service (SP) $ 5.144 per KW
$ (0.003639) per KWH
Large Power Service (LP ) $ 5.335 per KV A
$ (0.003536) per KWH
Large Power Off-Peak Service (LP Off-Peak) $ 3.480 per KV A
$ (0.002723) per KWH
Industrial Power Service (IP) $ 6.248 per KV A
$ (0.003382) per K\V'H
Constant Load (CL) $ 0.006137 per KWH
Municipal Street Lighting (SL) $ 0.004201 per KWH
Security (Outdoor) Lighting (OL) $ 0.003639 per KWH
Applicable: July, August and September 2017
NOTICE OF PROPOSED RATE CHANGE BY ANDERSON MUNICIPAL LIGHT & POWER
Notice is hereby given to ratepayers of the municipally-owned electric utility and other interested persons that the Board of Public \Vorks of the City of ~A..nderson, Indiana has adopted Resolution No. UB-17 authorizing the follo\ving incremental changes in Rate Adjustment Factors:
RS Residential Service $ 0.011466 perK\VH GS 10 General Service - Single Phase $ 0.012061 per K\'VH GS 30 General Service - Three Phase $ 0.012868 per I0J7H SP Small Po\ver Service $ 5.144 per KW
$ (0.003639) per K\'VH LP Large Power Service $ 5.335 per k:\l_A
$ (0.003536) per I<\"Xll-I LP ()ff-Peak Large Po'\ver Off-Peak Service $ 3.480 per k\r A
$ (0.002723) perK\VH IP Industrial Po"\ver Service $ 6.248 per K\V
$ (0.003382) per K\"'V'H CL Constant Load $ 0.006137 per K\'VH SL i'viunicipal Street Lighting $ 0.004201 per I<\V'I-:I OL Security (C)utdoor) Lighting $ 0.003639 per K\VH
Rate adjusttncnt changes arc listed belo'\V by Rate Schedule:
RS decrease (0.002834) perK\VH GS 10 decrease (0.001387) perK\VH GS 30 increase 0.000229 per K\"V'H SP increase 0.133 per I<.\V'
decrease (0.000177) per K\X7H LP increase 0.409 per k\T .. A
decrease (0.000094) per K\VT-l LP Off.Peak decrease (0.587) per k\l_A
increase 0.000716 per KWH IP decrease (0.076) per KW
increase 0.000076 per K\'VH CL decrease (0.000059) perK\VH SL increase 0.000931 per KWH OL increase 0.000814 perK\VH
This rate change is based solely upon changes of purchased po'\ver and energy purchased by the utility from utility from its supplier Indiana -~:lunicipal Power .t-\.gency and is co1nputed in accordance \vith Indiana Regulatory Commission Order in Cause No. 36835-S3, dated December 13, 1989.
T'he Utility has made a filing with the Indiana Regulatory Cornmission for approval of the Rate Change. If approved, the change of rate \Vill take effect for bills to be rendered beginning with the July, 2017 billing cycle . .Any objection to the following should be directed to either of the following:
Indiana Utility Regulatory Commission PNC Center 101 W. \V'ashington Street, Suite 1500 East Indianapolis, IN 46204-3407
(Contact person -Tony Pochard (765) 648-6480)
()ffice of Utility ConsLuner Counselor PNC Center 115 \Y/. \Y/ashington Street, Suite 1500 South Indianapolis, IN 46204-3407
Please print this legal one (1) time and return two (2) proofs of publication.
PLEASE RUN THIS AS SOON AS POSSIBLE Thank You
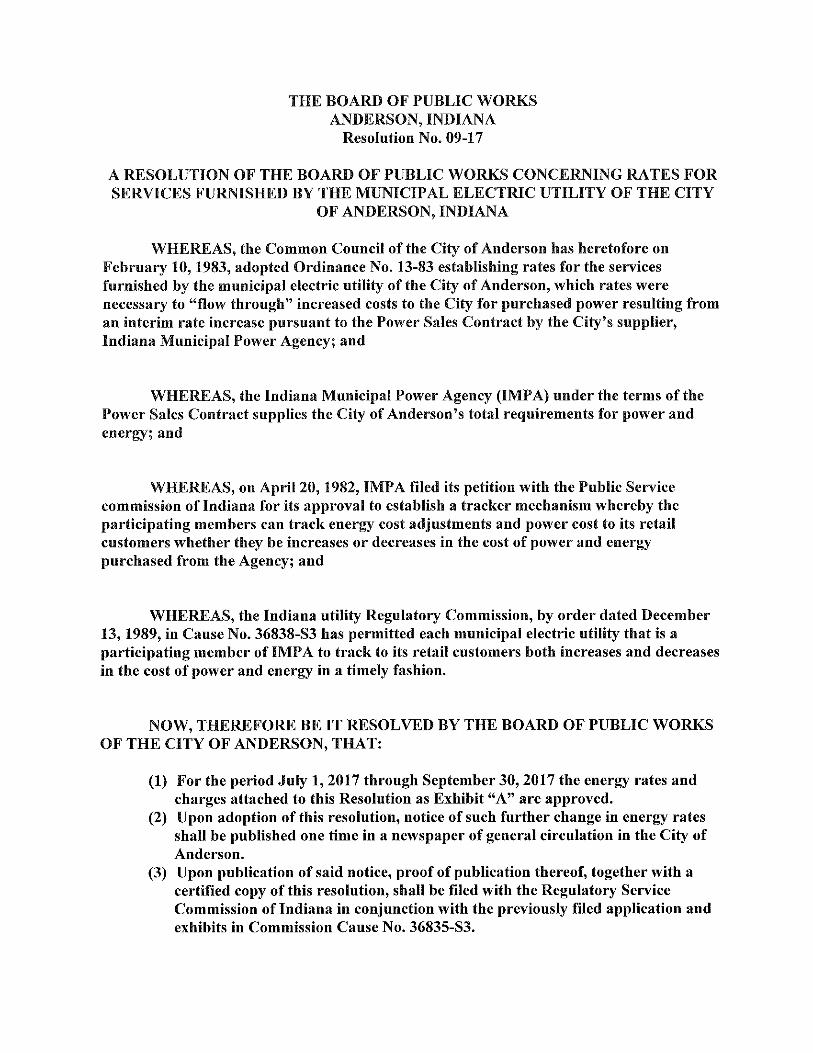
THE BOARD OF PUBLIC WORKS ANDERSON, INDIANA
Resolution No. 09-17
A RESOLUTION OF THE BOARD OF PUBLIC WORKS CONCERNING RATES FOR SERVICES FURNISHED BY THE MUNICIPAL ELECTRIC UTILITY OF THE CITY
OF ANDERSON, INDIANA
WHEREAS, the Common Council of the City of Anderson has heretofore on February 10, 1983, adopted Ordinance No. 13-83 establishing rates for the services furnished by the municipal electric utility of the City of Anderson, which rates were necessary to "flow through" increased costs to the City for purchased power resulting from an interim rate increase pursuant to the Power Sales Contract by the City's supplier, Indiana Municipal Power Agency; and
WHEREAS, the Indiana Municipal Power Agency (IMP A) under the terms of the Power Sales Contract supplies the City of Anderson's total requirements for power and energy; and
WHEREAS, on April 20, 1982, IMP A filed its petition with the Public Service commission of Indiana for its approval to establish a tracker mechanism whereby the participating members can track energy cost adjustments and power cost to its retail customers whether they be increases or decreases in the cost of power and energy purchased from the Agency; and
WHEREAS, the Indiana utility Regulatory Commission, by order dated December 13, 1989, in Cause No. 36838-S3 has permitted each municipal electric utility that is a participating member of IMP A to track to its retail customers both increases and decreases in the cost of power and energy in a timely fashion.
NOW, THEREFORE BE IT RESOLVED BY THE BOARD OF PUBLIC WORKS OF THE CITY OF ANDERSON, THAT:
(1) For the period July 1, 2017 through September 30, 2017 the energy rates and charges attached to this Resolution as Exhibit "A" are approved.
(2) Upon adoption of this resolution, notice of such further change in energy rates shall be published one time in a newspaper of general circulation in the City of Anderson.
(3) Upon publication of said notice, proof of publication thereof, together with a certified copy of this resolution, shall be filed with the Regulatory Service Commission of Indiana in conjunction with the previously filed application and exhibits in Commission Cause No. 36835-S3.
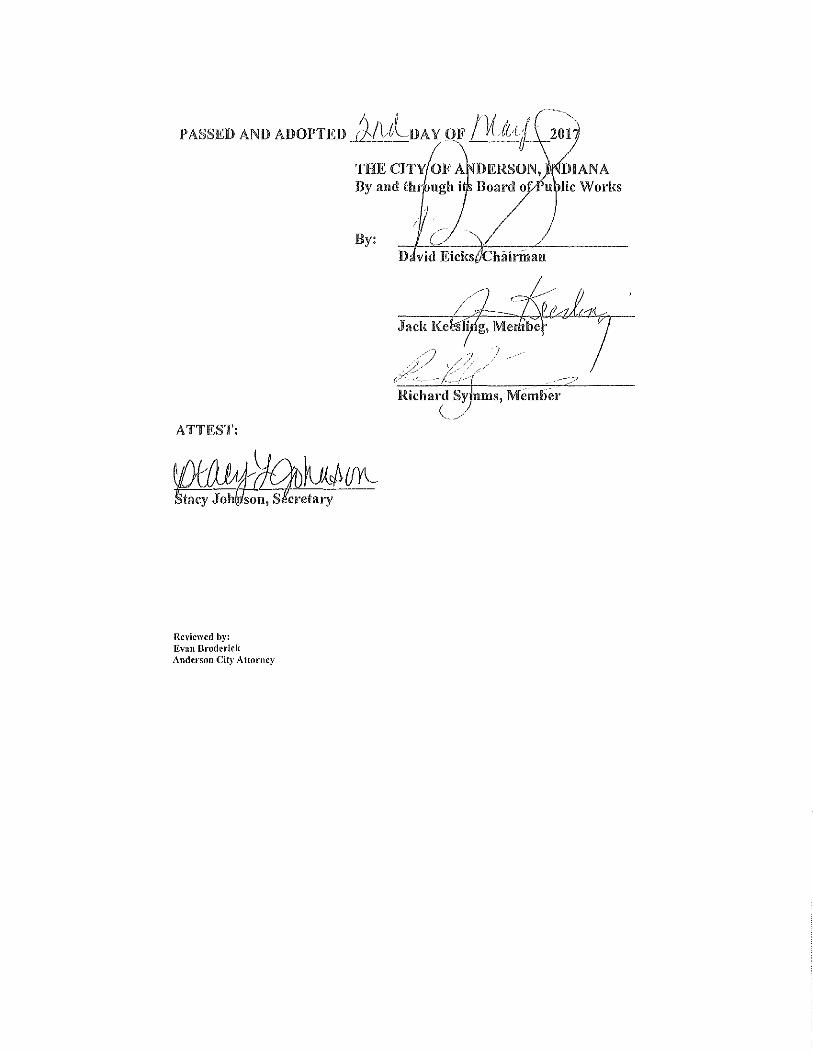
PASSED AND ADOPTED l~;ul DA y QF /1{ttc4
ATTEST:
Reviewed by: Evan Broderick Anderson City Attorney
THE CITY OF A By and thr ugh i
By:
Jack Ke!rsli
--,-~·~, 2, DIANA
u lie Works
Anderson Municipal Light & Power
550 Dale Keith Jones Road, Anderson, I:'I! 4601 1 (765} 648- 6480 0 Fax (765) 648-6551
http:/ /www.cityofanderson.com
Reliable Public Power Provider
Thomas Brodr.rick, Jr. M;oyor
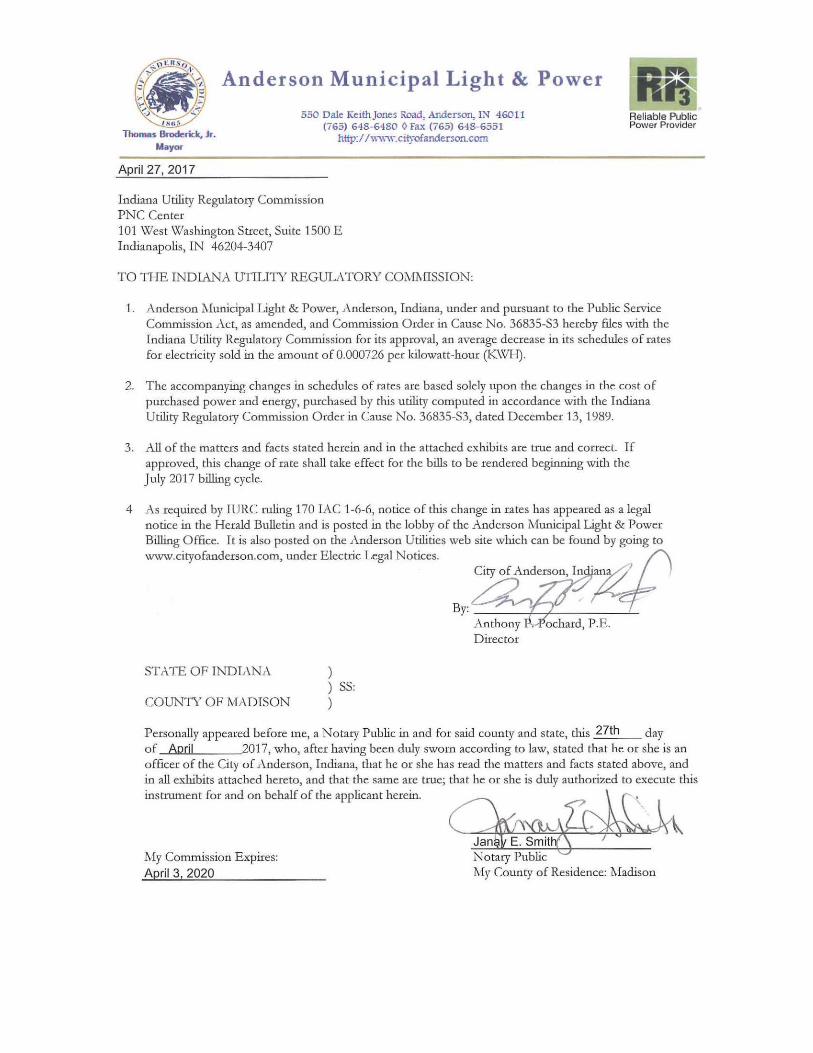
April 27, 2017
Indiana Utility Regulatory Commission PNC Center 101 West Washington Street, Suite 1500 E Indianapolis, IN 46204-3407
TO THE INDIANA UTILITY REGULATORY COt.ThIISSION:
1. .Anderson Municipal Light & Power, .Anderson, Indiana, under and pursuant to the Public Service Com.mission Act, as amended, and Commission Order in Cause No. 36835-S3 hereby files with the Indiana Utility Regulatory Commission for its approval, an average decrease in its schedules of ra tes for electricity sold in the amount of 0.000726 per kilowatt-hour (K\V'f-I).
2. The accompanying changes in schedules of rates are based solely upon the changes in the cost of purchased power and energy, purchased by this utility computed in accordance with the Indiana Utility Regulatory Commission Order in Cause No. 36835-S3, dated December 13, 1989.
3. All of the matters and facts stated herein and in the attached exhibits are true and correct. If approved, this change of rate shall take effect for the bills to be rendered beginning with the July 2017 billing cycle.
4 As required by IURC rnling 170 IAC 1-6-6, notice of this change in rates has appeared as a legal notice in the Herald Bulletin and is posted in the lobby of the Anderson Municipal Light & Power Billing Office. It is also posted on the Anderson Utilities web site which can be found by going to www.cityofanderson.com, under E lectric Legal Notices. ~an0'1 ()
City of Aud=on, In ~
ochard, P.E.
STATE OF INDIANA ) ) SS:
COUNTY OF iVL\DISON )
Personally appeared before me, a Notary Public in and for said county and state, this 27th day of April 2017, who, after having been duly sworn according to law, stated that he or she is an officer of the City of Anderson, Indiana, that he or she has read the matters and facts stated above, and in all exhibits attached hereto, and that the same are true; that he or she is duly authorized to execute this
i"'trum,ot fo< Md on behalf of the •pplie>nt h'«in. ~ l A
~
My Commission Expires: Notary Public April 3, 2020 Ivly County of Residence: Madison

Anderson Municipal Power & Light Anderson, Indiana
Proposed Rate Adjustment Applicable to the 3rd Quarter 2017 and Supporting Schedules
LINE NO.
2
3
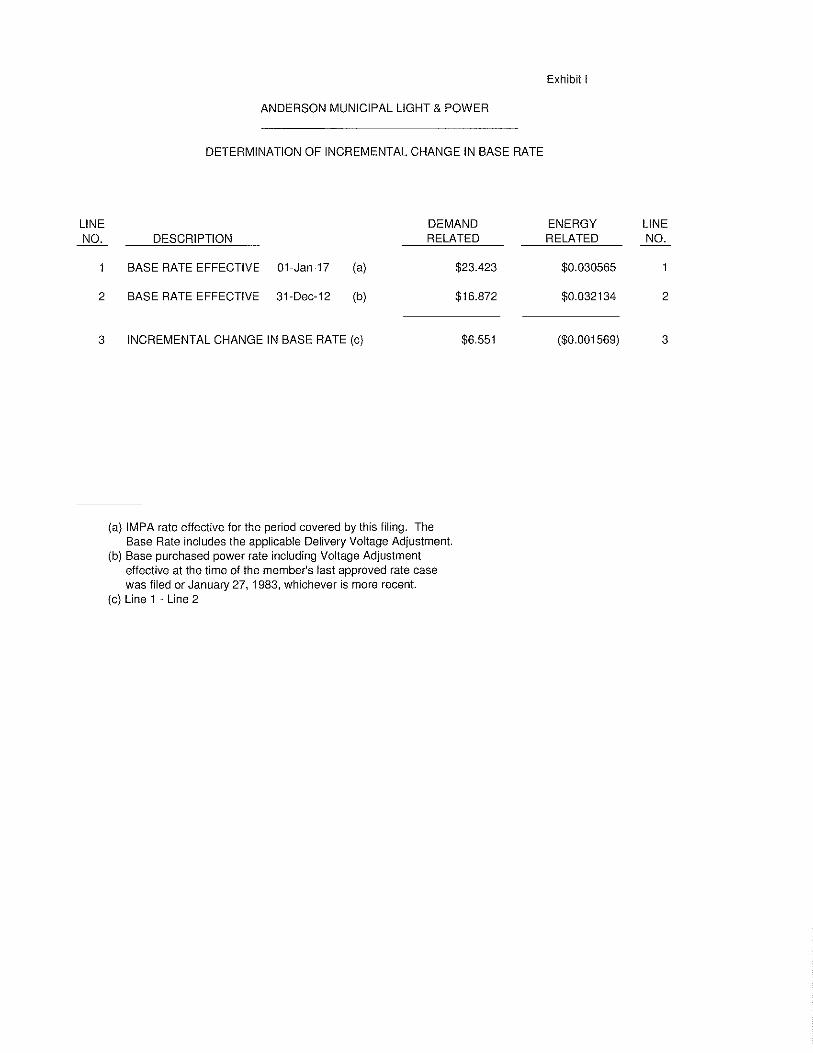
ANDERSON MUNICIPAL LIGHT & POWER
DETERMINATION OF INCREMENTAL CHANGE IN BASE RATE
DESCRIPTION DEMAND RELATED
BASE RATE EFFECTIVE 01-Jan-17
BASE RATE EFFECTIVE 31-Dec-12
(a)
(b)
INCREMENTAL CHANGE IN BASE RATE (c)
(a) IMPA rate effective for the period covered by this filing. The Base Rate includes the applicable Delivery Voltage Adjustment.
(b) Base purchased power rate including Voltage Adjustment effective at the time of the member's last approved rate case was filed or January 27, '1983, whichever is more recent.
(c) Line 1 - Line 2
$23.423
$16.872
$6.551
Exhibit I
ENERGY RELATED
$0.030565
$0.032134
($0.001569)
LINE NO.
2
3
LINE NO.
2
3
4
5
6
7
8
9
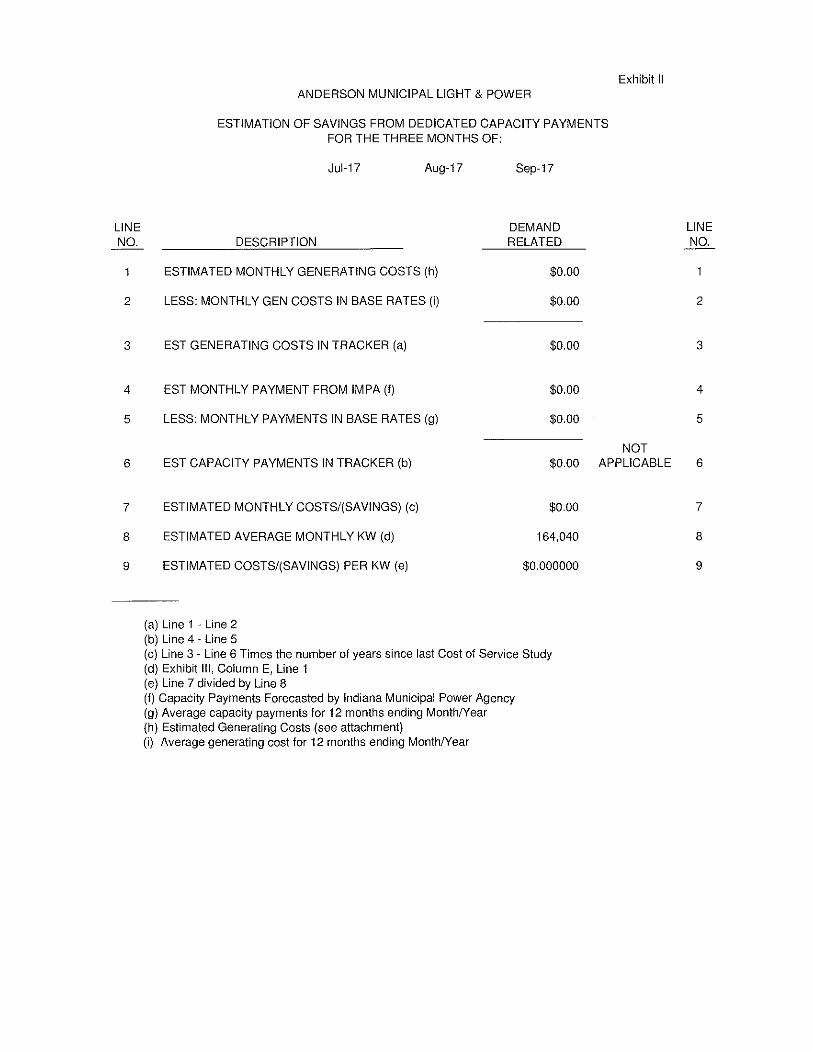
ANDERSON MUNICIPAL LIGHT & POWER
ESTIMATION OF SAVINGS FROM DEDICATED CAPACITY PAYMENTS FOR THE THREE MONTHS OF:
Jul-17 Aug-17 Sep-17
DEMAND DESCRIPTION RELATED
ESTIMATED MONTHLY GENERATING COSTS (h) $0.00
LESS: MONTHLY GEN COSTS IN BASE RATES (i) $0.00
EST GENERATING COSTS IN TRACKER (a) $0.00
EST MONTHLY PAYMENT FROM IMPA (f) $0.00
LESS: MONTHLY PAYMENTS IN BASE RATES (g) $0.00
Exhibit II
NOT EST CAPACITY PAYMENTS IN TRACKER (b) $0.00 APPLICABLE
ESTIMATED MONTHLY COSTS/(SAVINGS) (c)
ESTIMATED AVERAGE MONTHLY KW (d)
ESTIMATED COSTS/(SAVINGS) PER KW (e)
(a) Line 1 - Line 2 (b) Line 4 - Line 5
$0.00
164,040
$0.000000
(c) Line 3 - Line 6 Times the number of years since last Cost of Service Study (d) Exhibit Ill, Column E, Line 1 (e) Line 7 divided by Line 8 (I) Capacity Payments Forecasted by Indiana Municipal Power Agency (g) Average capacity payments for 12 months ending Month/Year (h) Estimated Generating Costs (see attachment) (i) Average generating cost for 12 months ending Month/Year
LINE NO.
2
3
4
5
6
7
8
9

LINE NO. DESCRIPTION
PURCHASED POWER FROM IMPA
1 KW DEMAND 2 KWH ENERGY
3 4
5 6
INCREMENTAL PURCHASED POWER COSTS
DEMAND RELATED EGA FACTOR PER KW CHARGE (a)
ENERGY RELATED EGA FACTOR PER KWH CHARGE (b)
(a) Line 1 times Line 3 (b) Line 2 times Line 5
ANDERSON MUNICIPAL LIGHT & POWER
ESTIMATION OF ENERGY COST ADJUSTMENT FOR THE THREE MONTHS OF:
Jul-17
Jul-17 (A)
172,765 85,637,670
0.416 $71,870.24
(0.001775) ($152,006.86)
Aug-17
Aug-17 (8)
157,033 84,749,812
0.416 $65,325.73
(0.001775) ($150.430.92)
Sep-17
Se~-17 (C)
162,321 70,484,392
0.416 $67,525.54
(0.001775) ($125, 109.80)
TOTAL (D)
492,119 240,871,874
$204,721.50
($427,547.58)
Exhibit Ill
ESTIMATED 3 MONTH AVERAGE
(E)
164,040 80,290,625
0.416 $68,240.50
(0.001775) ($142,515.86)
LINE NO.
1 2
3 4
5 6
LINE NO.
2
3
4
5
6
7
8
9
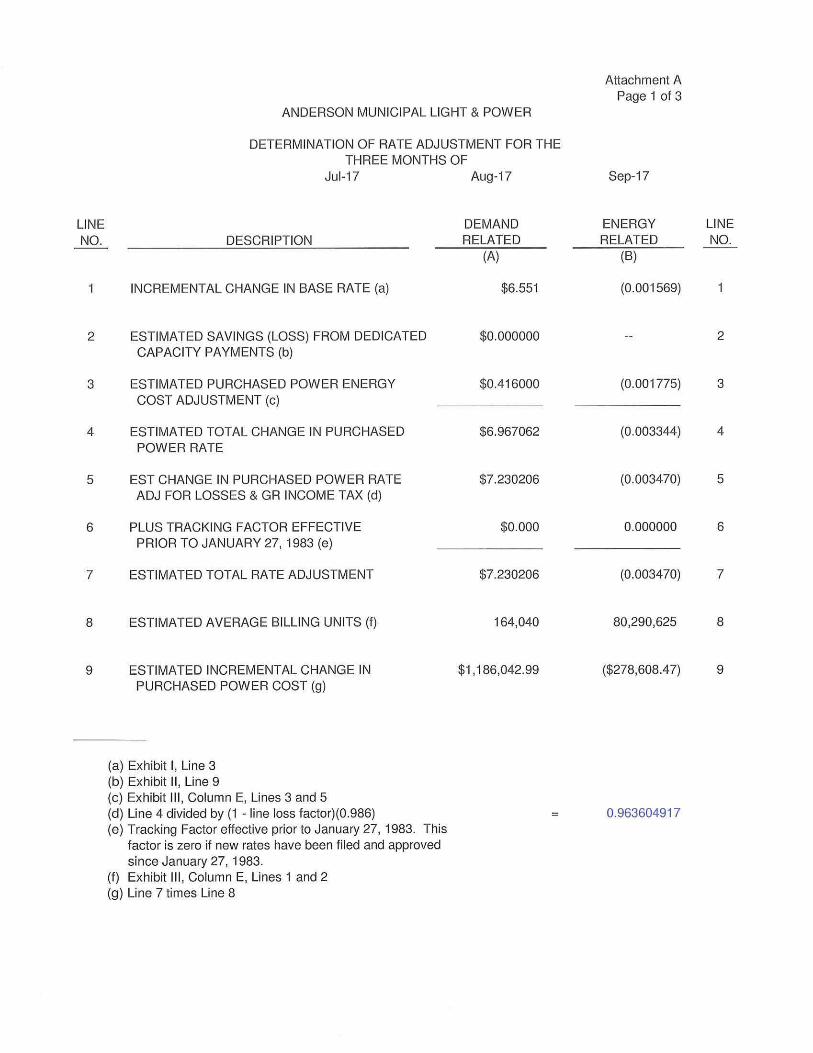
ANDERSON MUNICIPAL LIGHT & POWER
DETERMINATION OF RATE ADJUSTMENT FOR THE THREE MONTHS OF
Jul-1 7
DESCRIPTION
INCREMENTAL CHANGE IN BASE RATE (a)
ESTIMATED SAVINGS (LOSS) FROM DEDICATED CAPACITY PAYMENTS (b}
ESTIMATED PURCHASED POWER ENERGY COST ADJUSTMENT (c)
ESTIMATED TOTAL CHANGE IN PURCHASED POWER RATE
EST CHANGE IN PURCHASED POWER RATE ADJ FOR LOSSES & GR INCOME TAX (d)
PLUS TRACKING FACTOR EFFECTIVE PRIOR TO JANUARY 27, 1983 (e)
ESTIMATED TOTAL RATE ADJUSTMENT
ESTIMATED AVERAGE BILLING UNITS (f)
ESTIMATED INCREMENTAL CHANGE IN PURCHASED POWER COST (g)
(a) Exhibit I, Line 3 (b) Exhibit II, Line 9 (c) Exhibit Ill, Column E, Lines 3 and 5 (d) Line 4 divided by (1 - line loss factor)(0 .986) (e) Tracking Factor effective prior to January 27, 1983. This
factor is zero if new rates have been filed and approved since January 27, 1983.
(f) Exhibit Ill, Column E, Lines 1 and 2 (g) Line 7 times Line 8
Aug-17
DEMAND RELATED
(A)
$6.551
$0.000000
$0.416000
$6.967062
$7.230206
$0.000
$7.230206
164,040
$1, 186,042.99
Attachment A Page 1 of 3
Sep-17
ENERGY LINE RELATED NO.
(B)
(0.001569)
2
(0.001775) 3
(0.003344) 4
(0.003470) 5
0.000000 6
(0.003470) 7
80,290,625 8
($278,608.47) 9
0.963604917

LINE NO.
1 2 3 4 5 6 7 8 9
10 11 12
13
Attachment A Page 2 of 3
ANDERSON MUNICIPAL LIGHT & POWER
DETERMINATION OF RATE ADJUSTMENT FOR THE THREE MONTHS OF:
Jul-17
KW DEMAND KWH ENERGY ALLOCATED RATE ALLOCATOR ALLOCATOR ESTIMATED KW
SCHEDULE (%)(a) (%)(a) PURCHASED (b) (A) (B) (C)
RS 39.712°/o 35.414o/o 65,142.7 GS10 4.794°/o 4.275°/o 7,864.2 GS 30 10.426°/o 9.298°/o 17, 103.0 SP 17.236°/o 15.371°/o 28,274.4 LP 13.626°/o 16.096°/o 22,352.6 N/A 0.000°/o 0.000°/o 0.0 LP Off-Peak 0.929°/o 1.396°/o 1,523.9 IP 12.413°/o 16.589°/o 20,361.6 CL 0.046°/o 0.067% 75.6 SL 0.304°/o 0.555°/o 498.7 OL 0.514°/o 0.938°/o 843.2 N/A 0.000°/o 0.000°/o 0.0
TOTAL 100.000°/o 100.000°/o 164,039.9
(a) Taken From Cost of Service Study for the period ending December 31, 2012 (b) Page i of 3, Column A, Line 8 times Page 2 of 3, Column A (c) Page 1 of 3, Column B, Line 8 times Page 2 of 3, Column B (d) Page 1 of 3, Column A, Line 9 times Page 2 of 3, Column A (e) Page 1 of 3, Column B, Line 9 times Page 2 of 3, Column B
Aug-17
ALLOCATED ESTIMATED KWH PURCHASED (c)
(D)
28,434, 135 3,432,687 7,465,244
12,341,473 12,923,839
0 1,121,240
13,319,351 54,087
445,477 753,092
0
80,290,625
Sep-17
INCREMENTAL CHANGE IN PURCHASED POWER COST ADJ FOR LINE LOSSES & GROSS RECEIPTS TAX
DEMAND (d) ENERGY (e) TOTAL (E) (F) (G)
$470,995.46 ($98,666.45) $372,329.01 $56,860.09 ($11.911.42) $44,948.67
$123,658.03 ($25,904.40) $97,753.63 $204,429.93 ($42,824.91) $161.605.02 $161,613.78 ($44,845.72) $116,768.06
$0.00 $0.00 $0.00 $11,018.34 ($3,890.70) $7,127.64
$147,218.77 ($46,218.15) $101,000.62 $546.77 ($187.68) $359.09
$3,605.57 ($1,545.80) $2,059.77 $6,096.26 ($2,613.23) $3,483.03
$0.00 $0.00 $0.00
$1, 186,042.99 ($278,608.47) $907,434.52
LINE NO.
2 3 4 5 6 7 8 9
10 11 12
13
LINE
NO.
1 2 3 4 5 6 7 8 9 10 11 12
13
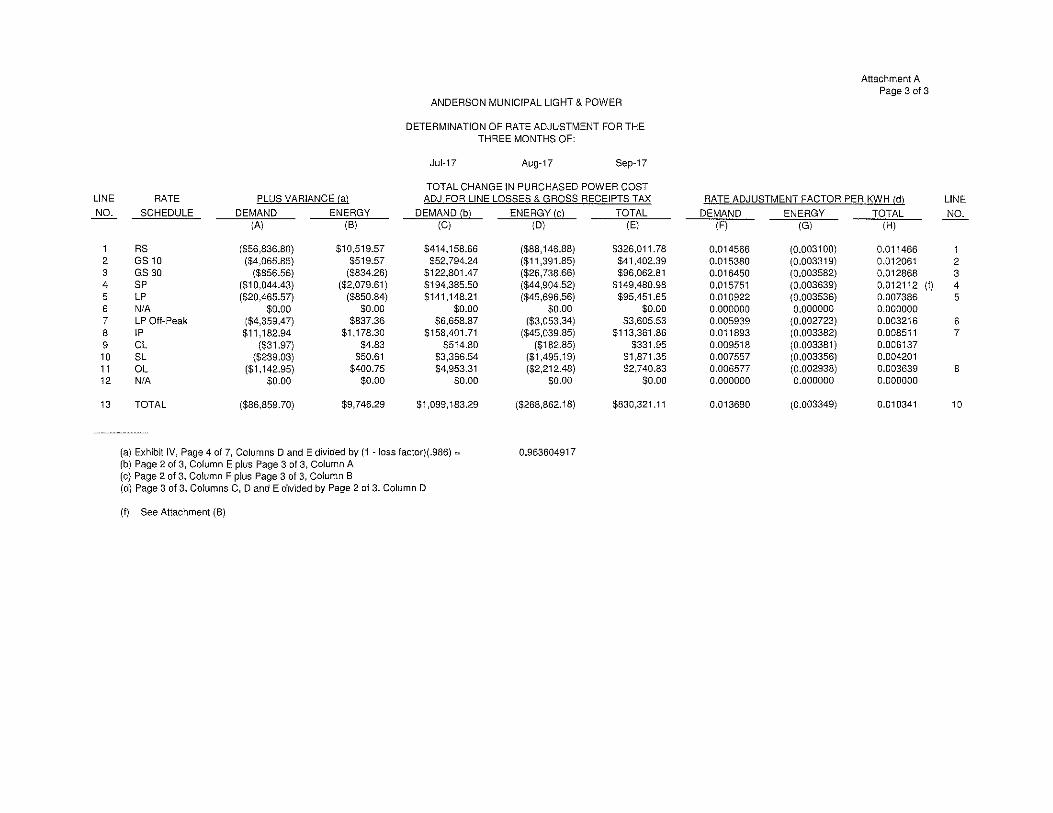
ANDERSON MUNICIPAL LIGHT & POWER
DETERMINATION OF RATE ADJUSTMENT FOR THE THREE MONTHS OF:
Jul-17 Aug-17 Sep-17
TOTAL CHANGE IN PURCHASED POWER COST RATE PLUS VARIANCE (a) ADJ FOR LINE LOSSES & GROSS RECEIPTS TAX
SCHEDULE DEMAND ENERGY DEMAND (b) ENERGY (c) TOTAL {A) {B) {C) {D) {E)
RS ($56,836.80) $10,519.57 $414,158.66 ($88, 146.88) $326,011.78 GS10 ($4,065.85) $519.57 $52,794.24 {$11,391.85) $41,402.39 GS 30 ($856.56) ($834.26) $122,801.47 ($26,738.66) $96,062.81 SP ($10,044.43) 1$2,079.61 I $194,385.50 ($44,904.52) $149,480.98 LP ($20,465.57) ($850.84) $141,148.21 ($45,696.56) $95,451.65 N/A $0.00 $0.00 $0.00 $0.00 $0.00 LP Off-Peak ($4,359.47) $837.36 $6,658.87 ($3,053.34) $3,605.53 IP $11,182.94 $1,178.30 $158,401.71 ($45,039.85) 5113,361.86 CL ($31.97) $4.83 $514.80 ($182.85) $331.95 SL ($239.03) $50.61 $3,366.54 ($1,495.19) $1,871.35 OL ($1,142.95) $400.75 $4,953.31 ($2,212.48) $2,740.83 N/A $0.00 $0.00 $0.00 $0.00 $0.00
TOTAL ($86,859.70) $9,746.29 $1,099, 183.29 ($268,862. 18) $830.321.11
(a) Exhibit IV, Page 4 of 7, Columns D and E divided by (1 - loss factor)(.986) =
(b) Page 2 of 3, Column E plus Page 3 of 3, Column A 0.963604917
(c) Page 2 of 3, Column F plus Page 3 of 3, Column B (d) Page 3 of 3, Columns C, D and E divided by Page 2 of 3, Column D
(f) See Attachment (B)
Attachment A Page 3 of 3
RATE ADJUSTMENT FACTOR PER KWH {d) LINE
DEMAND ENERGY TOTAL NO. {F) {G) {H)
0.014566 {0.003100) 0.011466 1 0.015380 {0.003319) 0.012061 2 0.016450 {0.003582) 0.012868 3 0.015751 (0.003639) 0.012112 {f) 4 0.010922 {0.003536) 0.007386 5 0.000000 0.000000 0.000000 0.005939 {0.002723) 0.003216 6 0.011893 (0.003382) 0.008511 7 0.009518 (0.003381) 0.006137 0.007557 (0.003356) 0.004201 0.006577 (0.002938) 0.003639 8 0.000000 0.000000 0.000000
0.013690 (0.003349) 0.010341 10

LINE NO.
1 2 3 4
5
6 7 8 9
10
11 12 13 14
15
16 17 18 19
20
Attachment B
ANDERSON MUNICIPAL LIGHT & POWER
DETERMINATION OF DEMAND RATE ADJUSTMENT FOR SP, LP, LP-OFF PEAK & IP FOR THE THREE MONTHS OF: JULY, AUGUST, AND SEPTEMBER,
2017
Demand Related Adjustment Factors
Rate SP
From Attachment A, Page 3 of 3, Column C, Line 4 $194,385.50 From Attachment A, Page 2 of 3, Column C, Line 4 28,274.40 kW
Line 1 divided by Line 2 $ 6.875 Line 3 multiplied by 74.817%. $ 5.144
Demand Related Rate Adjustment Factor $ 5.144 per KW
Rate LP
From Attachment A, Page 3 of 3, Column D, Line 5 $141,148.21 From Attachment A, Page 2 of 3, Column D, Line 5 22,352.60 KVA
Line 6 divided by Line 7 $ 6.315 Line 8 multiplied by: 84.485%. $ 5.335
Demand Related Rate Adjustment Factor $ 5.335 per KVA
Rate LP Off-Peak
From Attachment A, Page 3 of 3, Column D, Line 7 $6,658.87 From Attachment A, Page 2 of 3, Column D, Line 7 1,523.90 KVA
Line 11 divided by Line 12 $ 4.370 Line 13 multiplied by: 79.651%. $ 3.480
Demand Related Rate Adjustment Factor $ 3.480 per KVA
Rate IP
From Attachment A, Page 3 of 3, Column D, Line 8 $158,401.71 From Attachment A, Page 2 of 3, Column D, Line 8 20,362 kW
Line 16 divided by Line 17 $ 7.779 Line 18 multiplied by: 80.308%. $ 6.248
Demand Related Rate Adjustment Factor $ 6.248 per KW
LINE NO.
2
3
4
5
6
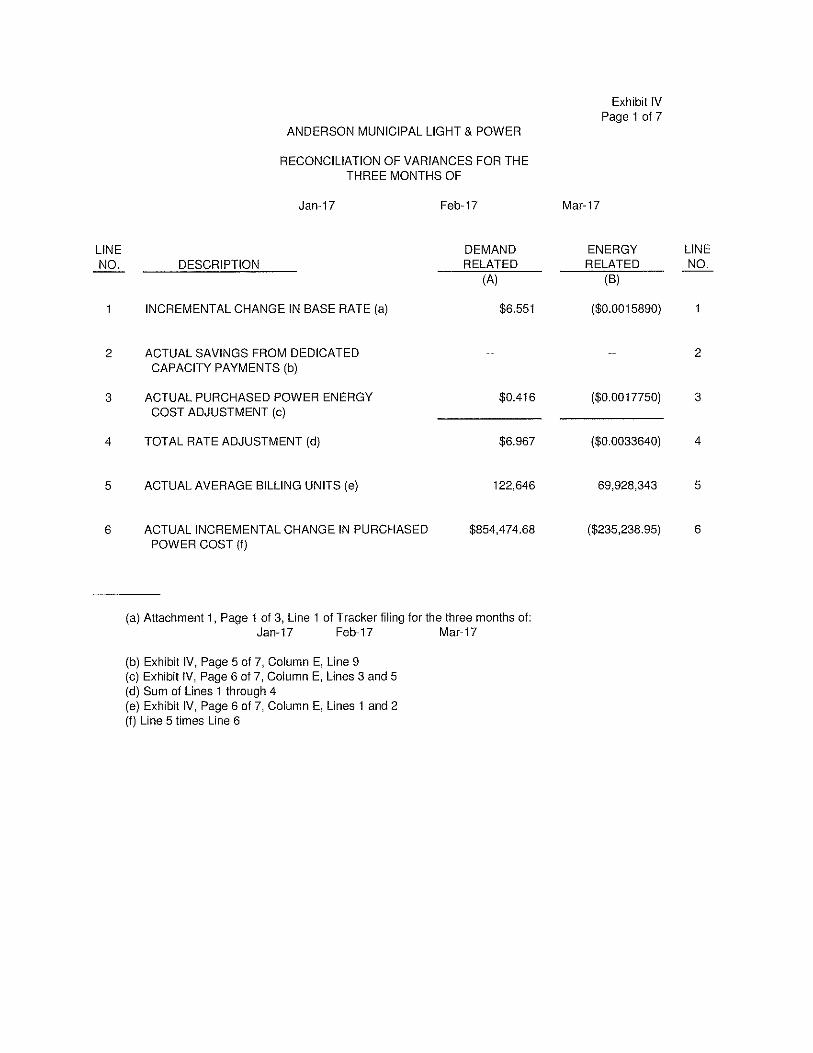
ANDERSON MUNICIPAL LIGHT & POWER
RECONCILIATION OF VARIANCES FOR THE THREE MONTHS OF
Jan-17 Feb-17
DEMAND DESCRIPTION RELATED
(A)
INCREMENTAL CHANGE IN BASE RATE (a) $6.551
ACTUAL SAVINGS FROM DEDICATED CAPACITY PAYMENTS (b)
ACTUAL PURCHASED POWER ENERGY $0.416 COST ADJUSTMENT (c)
TOTAL RATE ADJUSTMENT (d) $6.967
ACTUAL AVERAGE BILLING UNITS (e) 122,646
ACTUAL INCREMENTAL CHANGE IN PURCHASED $854,474.68 POWER COST (f)
(a) Attachment 1, Page 1 of 3, Line 1 of Tracker filing for the three months of: Jan-17 Feb-17 Mar-17
(b) Exhibit IV, Page 5 of 7, Column E, Line 9 (c) Exhibit IV, Page 6 of 7, Column E, Lines 3 and 5 (d) Sum of Lines 1 through 4 (e) Exhibit IV, Page 6 of 7, Column E, Lines 1 and 2 (f) Line 5 times Line 6
Exhibit IV Page 1 of 7
Mar-17
ENERGY LINE RELATED NO.
(B)
($0.0015890)
2
($0.0017750) 3
($0.0033640) 4
69,928,343 5
($235,238.95) 6
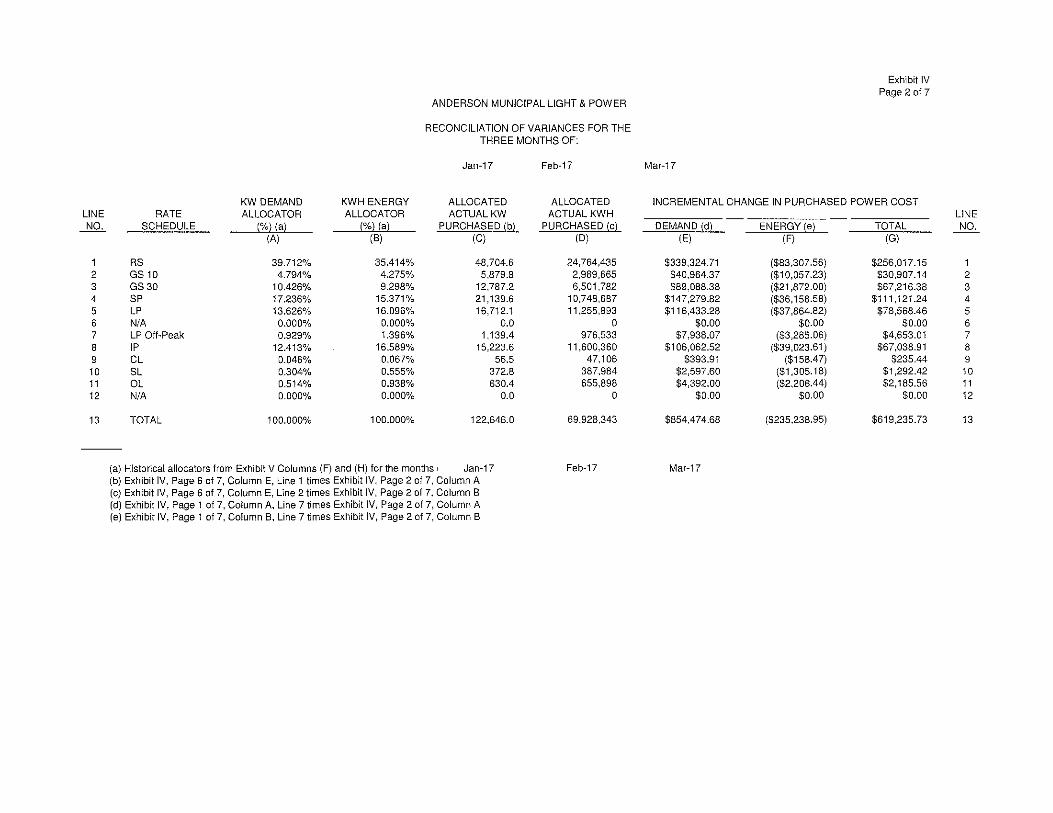
ANDERSON MUNICIPAL LIGHT & POWER
RECONCILIATION OF VARIANCES FOR THE THREE MONTHS OF:
Jan-17 Feb-17
KW DEMAND KWH ENERGY ALLOCATED ALLOCATED LINE RATE ALLOCATOR ALLOCATOR ACTUAL KW ACTUAL KWH NO. SCHEDULE ('Yo} (a} (
0/o} (a} PURCHASED (b) PURCHASED (c) (A) (8) (C) (D)
1 RS 39.712°/o 35.414°/o 48,704.6 24,764,435 2 GS10 4.794°/o 4.275o/o 5.879.8 2,989,665 3 GS30 1 0.426°/o 9.298°/o 12,787.2 6,501,782 4 SP 17.236°/o 15.371°/o 21,139.6 10.748,687 5 LP 13.626°/o 16.096°/o 16,712.1 11.255,893 6 N/A 0.000°/o 0.000°/o 0.0 0 7 LP Off-Peak 0.929°/o 1.396°/o 1,139.4 976,533 8 IP 12.413°/o 16.589°/o 15,223.6 11,600,360 9 CL 0.046°/o 0.067°/o 56.5 47,106
10 SL 0.304°/o 0.555°/o 372.8 387,984 11 OL 0.514°/o 0.938°/o 630.4 655,898 12 N/A 0.000°/o 0.000°/o 0.0 0
13 TOTAL 100.000°/o 100.000°/o 122,646.0 69,928,343
---
(a) Historical allocators from Exhibit V Columns (F) and (H) for the months' Jan-17 Feb-17 (b) Exhibit IV, Page 6 of 7, Column E, Line 1 times Exhibit IV, Page 2 of 7, Column A (c) Exhibit IV, Page 6 of 7, Column E, Line 2 times Exhibit IV, Page 2 of 7, Column B (d) Exhibit IV, Page 1 of 7, Column A, Line 7 times Exhibit IV, Page 2 of 7, Column A (e) Exhibit IV, Page 1 of 7, Column B, Line 7 times Exhibit IV, Page 2 of 7, Column B
Mar-17
Exhibit IV Page2of7
INCREMENTAL CHANGE IN PURCHASED POWER COST
DEMAND (d) ENERGY(e) TOTAL (E) (F) (G)
$339,324.71 ($83,307.56) $256,017.15 $40,964.37 ($10,057.23) $30,907.14 $89,088.38 ($21,872.00) $67,216.38
$147,279.82 ($36, 158.58) $111,121.24 $116,433.28 ($37,864.82) $78,568.46
$0.00 $0.00 $0.00 $7,938.07 ($3,285.06) $4,653.01
$106,062.52 ($39,023.61) $67,038.91 $393.91 ($158.47) $235.44
$2,597.60 ($1,305.18) $1,292.42 $4,392.00 ($2,206.44) $2,185.56
$0.00 $0.00 $0.00
$854,474.68 ($235,238.95) $619,235.73
Mar-17
LINE NO.
1 2 3 4 5 6 7 8 9
10 11 12
13
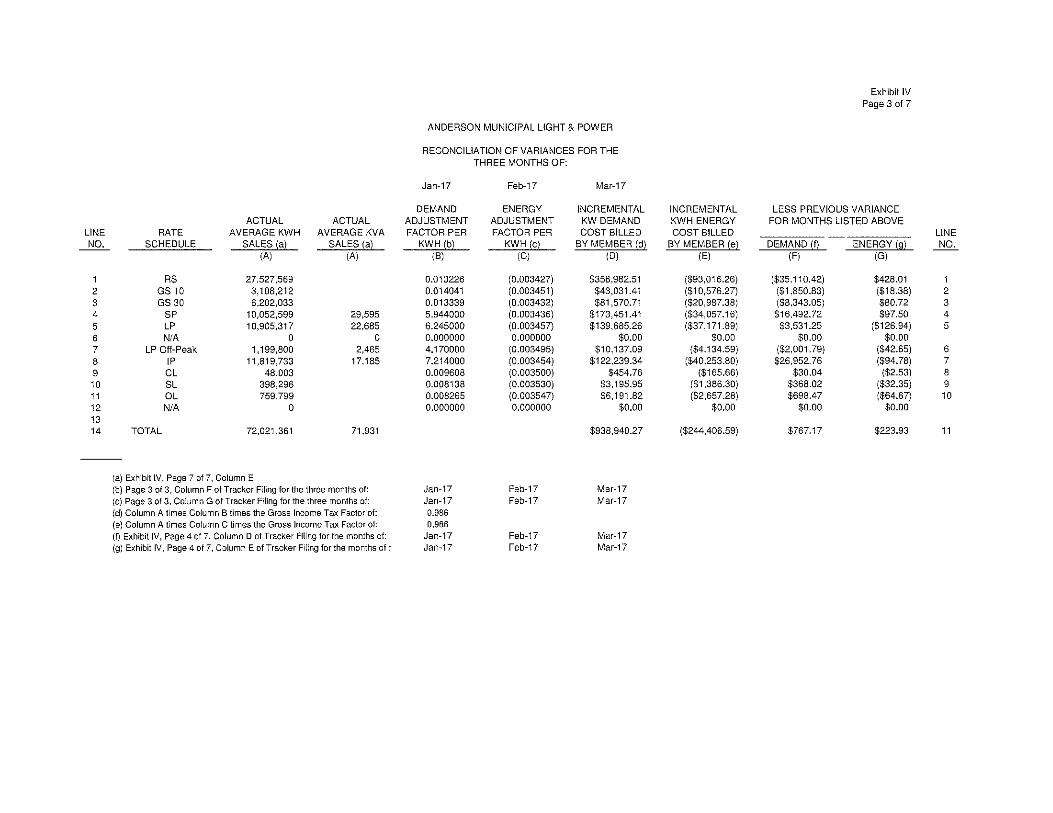
Exhibit IV Page3of7
ANDERSON MUNICIPAL LIGHT & POWER
RECONCILIATION OF VARIANCES FOR THE THREE MONTHS OF:
Jan-17 Feb-17 Mar-17
DEMAND ENERGY INCREMENTAL INCREMENTAL LESS PREVIOUS VARIANCE ACTUAL ACTUAL ADJUSTMENT ADJUSTMENT KW DEMAND KWH ENERGY FOR MONTHS LISTED ABOVE
LINE RATE AVERAGE KWH AVERAGE KVA FACTOR PER FACTOR PER COST BILLED COST BILLED LINE NO. SCHEDULE SALES (a) SALES (a) KWH (b) KWH(c) BY MEMBER (d) BY MEMBER (e) DEMAND If) ENERGY (g) NO.
(AJ (AJ (BJ (CJ (DJ (EJ (F) (G)
1 RS 27,527,569 0.013226 (0.003427) $358,982.51 ($93.016.26) ($35.110.42) $428.01 1 2 GS10 3, 108,212 0.014041 (0.003451) $43,031.41 ($10.576.27) ($1.850.83) ($18.38) 2 3 GS 30 6,202,033 0.013339 (0.003432) $81,570.71 ($20.987.38) ($8.343.05) $80.72 3 4 SP 10.052.599 29,595 5.944000 (0.003436) $173,451.41 ($34.057.16) $16,492.72 $97.50 4 5 LP 10,905,317 22.685 6.245000 (0.003457) $139.685.26 ($37.171.89) $3,531.25 ($126.94J 5 6 N/A 0 0 0.000000 0.000000 $0.00 $0.00 $0.00 $0.00 7 LP Off-Peak 1.199.800 2,465 4.170000 (0.003495) $10,137.09 ($4.134.59) ($2.001.79) ($42.65) 6 8 IP 11,819,733 17,185 7.214000 (0.003454) $122,239.34 ($40.253.80) $26,952.76 ($94.78) 7 9 CL 48,003 0.009608 (0.003500) $454.76 ($165.66) $30.04 ($2.53) 8
10 SL 398,296 0.008138 (0.003530) $3,195.95 ($1.386.30) $368.02 ($32.35) 9 11 OL 759,799 0.008265 (0.003547) $6,191.82 ($2.657.28) $698.47 ($64.67) 10 12 N/A 0 0.000000 0.000000 $0.00 $0.00 $0.00 $0.00 13 14 TOTAL 72,021,361 71,931 $938,940.27 ($244.406.59) $767.17 $223.93 11
(a) Exhibit IV, Page 7 of 7, Column E (b) Page 3 of 3, Column F of Tracker Filing for the three months of: Jan-17 Feb-17 Mar-17 (c) Page 3 of 3, Column G of Tracker Filing for the three months of: Jan-17 Feb-17 Mar-17 (d) Column A times Column B times the Gross Income Tax Factor of: 0.986 (e) Column A times Column C times the Gross Income Tax Factor of: 0.986 (f) Exhibit IV, Page 4 ol 7, Column D of Tracker Filing for the months of: Jan-17 Feb-17 Mar-17 (g) Exhibit IV, Page 4 of 7, Column E of Tracker Filing for the months of: Jan-17 Feb-17 Mar-17

LINE NO.
1 2 3 4 5 6 7 8 9 10 11 12 13 14
ANDERSON MUNICIPAL LIGHT & POWER
RECONCILIATION OF VARIANCES FOR THE THREE MONTHS OF:
Jan-17 Feb-17
RATE NET INCREMENTAL COST BILLED BY MEMBER SCHEDULE DEMAND (a) ENERGY (b)
(A) (B)
RS $394,092.93 ($93,444.27) GS10 $44,882.24 ($10,557.89) GS30 $89,913.76 ($21,068.10) SP $156,958.69 ($34, 154.66) LP $136,154.01 ($37,044.95) N/A $0.00 $0.00 LP Off-Peak $12,138.88 ($4,091.94) IP $95,286.58 ($40,159.02) CL $424.72 ($163.13) SL $2,827.93 ($1,353.95) OL $5,493.35 ($2,592.61) N/A $0.00 $0.00
TOTAL $938,173.10 ($244,630.52)
(a) Column D minus Column F from Exhibit IV, page 3 of 7 (b) Column E minus Column G from Exhibit IV, Page 3 of 7
TOTAL (C)
$300,648.66 $34,324.35 $68,845.66
$122,804.03 $99,109.06
$0.00 $8,046.93
$55,127.56 $261.59
$1,473.98 $2,900.75
$0.00
$693,542.57
(c) Columns E, F, and G from Exhibit IV, Page 2 of 7 minus Columns A, B, and C
Mar-17
DEMAND (c) (D)
($54,768.22) ($3,917.87)
($825.38) ($9,678.87)
($19,720.73) $0.00
($4,200.81) $10,775.94
($30.81) ($230.33)
($1,101.35) $0.00
($83.698.44)
Exhibit IV Page 4 of 7
VARIANCE LINE ENERGY (c) TOTAL (c) NO.
(E) (F)
$10,136.71 ($44,631.51) $500.66 ($3,417.21) 2
($803.90) ($1,629.28) 3 ($2,003.92) ($11,682. 79) 4
($819.87) ($20,540.60) 5 $0.00 $0.00 6
$806.88 ($3,393.92) 7 $1,135.41 $11,911.35 8
$4.66 ($26.15) 9 $48.77 ($181.56) 10
$386.17 ($715.19) 11 $0.00 $0.00 12
$9,391.57 ($74,306.86) 13
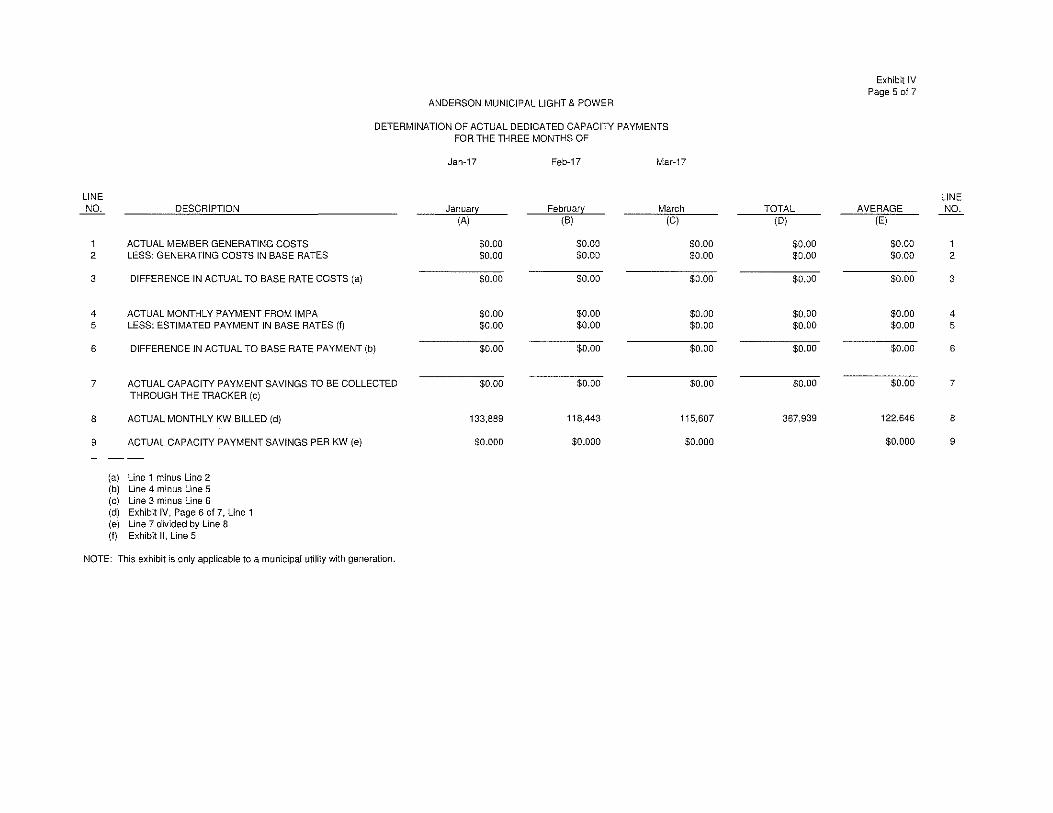
ANDERSON MUNICIPAL LIGHT & POWER
DETERMINATION OF ACTUAL DEDICATED CAPACITY PAYMENTS FOR THE THREE MONTHS OF
LINE NO. DESCRIPTION
ACTUAL MEMBER GENERATING COSTS 2 LESS: GENERATING COSTS IN BASE RATES
3 DIFFERENCE IN ACTUAL TO BASE RATE COSTS (a)
4 ACTUAL MONTHLY PAYMENT FROM IMPA 5 LESS: ESTIMATED PAYMENT IN BASE RATES (f)
6 DIFFERENCE JN ACTUAL TO BASE RATE PAYMENT (b)
7 ACTUAL CAPACITY PAYMENT SAVINGS TO BE COLLECTED THROUGH THE TRACKER (c)
8 ACTUAL MONTHLY KW BILLED (d)
9 ACTUAL CAPACITY PAYMENT SAVINGS PER KW (e)
(a) Line 1 minus Line 2 (b) Line 4 minus Line 5 (c) Line 3 minus Line 6 (d) Exhibit IV, Page 6 of 7, Line 1 (e) Line 7 divided by Line 8 (f) Exhibit II, Line 5
NOTE: This exhibit is only applicable to a municipal utility with generation.
Jan-17
Janua!}:'. (A)
$0.00 $0.00
$0.00
$0.00 $0.00
$0.00
$0.00
133,889
$0.000
Feb-17 Mar-17
February March (B) (C)
$0.00 $0.00 $0.00 $0.00
$0.00 $0.00
$0.00 $0.00 $0.00 $0.00
$0.00 $0.00
$0.00 $0.00
118,443 115,607
$0.000 $0.000
TOTAL
(DI
$0.00 $0.00
$0.00
$0.00 $0.00
$0.00
$0.00
367,939
Exhibit IV Page 5 of 7
AVERAGE (E)
$0.00 $0.00
$0.00
$0.00 $0.00
$0.00
$0.00
122,646
$0.000
LINE NO.
1 2
3
4 5
6
7
8
9
LINE NO.
2
3 4
5 6
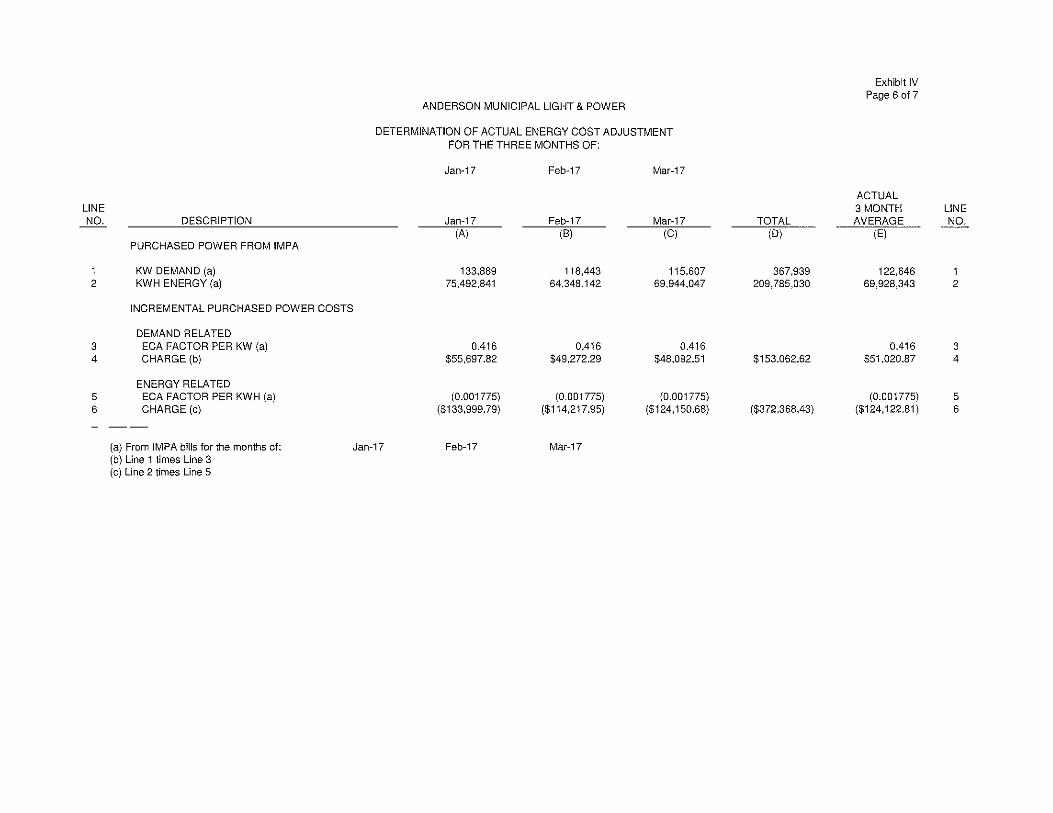
DESCRIPTION
PURCHASED POWER FROM IMPA
KW DEMAND (a) KWH ENERGY (a)
INCREMENTAL PURCHASED POWER COSTS
DEMAND RELATED ECA FACTOR PER KW (a) CHARGE (b)
ENERGY RELATED ECA FACTOR PER KWH (a) CHARGE (c)
ANDERSON MUNICIPAL LIGHT & POWER
DETERMINATION OF ACTUAL ENERGY COST ADJUSTMENT FOR THE THREE MONTHS OF:
Jan-17
Jan-17 (A)
133,889 75,492,841
0.416 $55,697.82
(0.001775) ($133,999.79)
Feb·17
Feb-17 (B)
118.443 64,348,142
0.416 $49,272.29
(0.001775) ($114,217.95)
Mar-17
Mar-17 (C)
115,607 69,944,047
0.416 $48,092.51
(0.001775) ($124, 150.68)
(a) From lMPA bills for the months of: (b) Line 1 times Line 3
Jan-17 Feb-17 Mar-17
(c) Line 2 times Line 5
TOTAL (D)
367.939 209,785,030
$153,062.62
($372,368.43)
Exhibit IV Page 6 of 7
ACTUAL 3 MONTH AVERAGE
(E)
122,646 69,928,343
0.416 $51,020.87
(0.001775) ($124,122.81)
LINE NO.
1 2
3 4
5 6

Exhibit IV Page 7 of 7
ANDERSON MUNICIPAL LIGHT & POWER
DETERMINATION OF ACTUAL AVERAGE KWH SALES FOR THE THREE MONTHS OF:
Jan-17 Feb-17 Mar-17
LINE RATE LINE NO. SCHEDULE Jan-17 Feb-17 Mar-17 TOTAL AVERAGE NO.
(A) (B) (C) (D) (E)
1 RS 30,879,028 28,648,120 23,055,560 82,582,708 27,527,569 1 2 GS10 3,279,499 3,265,407 2,779,730 9,324,636 3,108,212 2 3 GS 30 6,462,272 6,399,846 5,743,982 18,606, 1 OD 6,202,033 3 4 SP 10,328,278 10,134,796 9,694,723 30,157,797 10,052,599 4 5 LP 10,544,370 11,212,030 10,959,550 32,715,950 10,905,317 5 6 N/A 0 0 0 0 0 7 LP Off-Peak 1,264,200 1, 104,600 1,230,600 3,599,400 1, 199,800 6 8 IP 11,300,800 11,648,000 12,510,400 35,459,200 11,819,733 7 9 CL 48,003 48,003 48,003 144,009 48,003
10 SL 376,068 412,722 406,098 1, 194,888 398,296 11 OL 853,374 712,728 713,294 2,279,396 759,799 8 12 NIA 0 0 0
-- ---------- - ----
13 TOTAL 75,335,892 73,586,252 67,141,940 216,064,084 72,021,361 10
DETERMINATION OF ACTUAL AVERAGE KW/KVA SALES
Jan-17 Feb-17 Mar-17 TOTAL __ AVERAGE
14 15 16 GS3 32,544.35 31,631.78 31,150.55 95,326.68 31,775.56 17 SP NCF 30,771.04 29, 127.35 28,887.38 88,785.77 29,595.26 18 LP NCF 22,625.69 22,640.09 22,789.60 68,055.38 22,685.13 19 20 LP Off-Peak NCF 2,796.91 2,914.34 1,685.17 7,396.42 2,465.47 21 IP CP 18, 184.00 18,704.00 14,668.00 51,556.00 17,185.33 22 23 24 25 ISTP CP
------------ ------- ----------
26 TOTAL 106,921.99 105,017.56 99,180.70 311,120.25 103,706.75
Line
No.
2
3 4
5 6
7
8 9
10
11
12
13
14
15
16
17
18
19
20
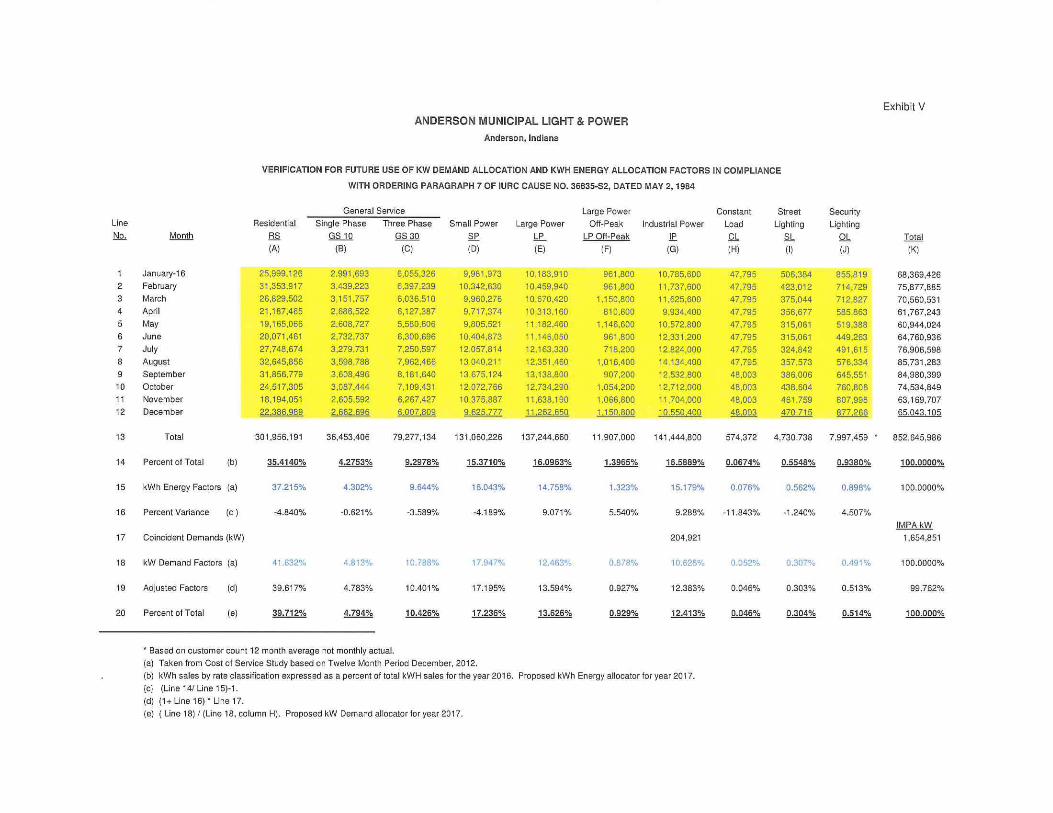
ANDERSON MUNICIPAL LIGHT & POWER
Anderson, Indiana
VERIFICATION FOR FUTURE USE OF KW DEMAND ALLOCATION AND KWH ENERGY ALLOCATION FACTORS IN COMPLIANCE
WITH ORDERING PARAGRAPH 7 OF IURC CAUSE NO. 36835·S2, DATED MAY 2, 1984
Month
January-16
February
March
April
May
June
July
August
September
October
November
December
Total
Percent of Total (b)
kWh Energy Factors (a)
Percent Variance (c)
Coincident Demands (kW)
kW Demand Factors (a)
Adjusted Factors (d)
Percent of Total (e)
Residential
RS
(A)
25,999.126
31,353.917
26,829.502
21,187,465
19,165.066
20,071.461
27,748.674
32,645.856
31 ,856,779
24,517.305
18.1 94.051
22 386.989
301,956.191
35.4140%
37.215%
-4.840%
41.632%
39.617%
39.712%
General Service
Single Phase Three Phase
GS 10 GS 30
(B) (C)
2.991,693
3.439.223
3, 151.757
2,686,522
2.608,727
2.732.737
3,279,731
3,598,788
3,608,496
3,087.444
2,605.592
2 662.696
36,453.406
4.2753%
4.302%
-0.621%
4.813%
4.783%
4.794%
6,055,326
6,397,239 6,036,510
6,127,387
5,580,606
6,300.696
7.250.597
7,962.466
8,t81,640
7.109.431
6.267.427
6 007.809
79,277,134
9.2978%
9.644%
-3.589%
10.788%
10.401%
10.426%
•Based on customer count 12 month average not monthly actual.
Small Power
SP
(D)
9,981,973
10,342.630
9.960.276
9.717.374
9.805.521
10.404.873 12,057,814
13,040.211
13,675,124
12,072.766
10.375.887
9 625 777
131,060,226
15.3710%
16.043%
-4.189%
17.947%
17.1 95%
17.236%
(a) Taken from Cost of Service Study based on Twelve Month Period December, 2012.
Large Power
.bE. (E)
10, 183,910
10.459,940
10.670.420
10.313.160
11 ,182,460
11.146.050
12.t63.330
12.351.460
13.138.800
t2.734,290
11,638.t90
1 t 262 650
137 ,244,660
16.0963%
14.758%
9.071%
t2.463%
13.594%
13.626%
Large Power
Off-Peak Industrial Power
LP Off-Peak J.E. (F) (G)
96t ,800
961,800
1, 150,800
810.600
1,146,600
961,800
718.200 1,016.400
907.200
1,054,200
1.066.800
1.150.800
11,907,000
1.3965%
1.323%
5.540%
0.878%
0.927%
0.929%
10,785,600
11 .737.600
11,625,600
9.934.400
10.572,800
12.33 1.200
12.824,000
14,134.400
12.532.800
12,712,000
11.704,000
10.550.400
141 ,444,800
16.5889%
15.179%
9.288%
204,921
10.628%
12.383%
12.413%
(b) kWh sales by rate classification expressed as a percent of total kWH sales for the year 2016. Proposed kWh Energy allocator for year 2017.
(c} (line 14/ Line 15)-1.
(d) (1+ Line 16) •Line 17.
(e) ( Line 18) I (line 18, column H). Proposed kW Demand allocator tor year 2017.
Constant
Load
CL
(H)
47,795
47.795
47 795
47,795
47.795
47.795
47.795
47,795
48,003
48,003
48,003
48.003
574,372
0.0674%
0.076%
-1 1.843%
0.052%
0.046%
0.046%
Street
Lighting
SL
(I)
506,384
423.012
375.044
356,677
315,061
315.061
324.842
357.573
386,006
438,604
461.759 470 715
4,730.738
0.5548%
0.562%
-1.240%
0.307°·.
0.303%
0.304%
Security
Lighting
OL
(J)
855,819
714,729
712,827
585.863
519.388
449,263
491.615
576.334
645,551
760,806
807.998
877 266
7.997,459
~
0.898%
4.507%
0.491%
0.513%
0.514%
Exhibit V
Total
(K)
68,369,426
75,877,885
70,560,531
61,767,243
60,944,024
64,760,936
76,906,598
85,731,283
84,980,399
74,534,849
63, 169,707
65,043,105
852,645,986
100.0000%
100.0000%
IMPA kW
1,654,851
100.0000%
99.762%
100.000%

IMPA's Energy Cost Adjustment
To develop these Energy Cost Adjustment factors, IMPA used the following estimated loads for ANDERSON
JUL
0.416
INDIANA MUNICIPAL POWER AGENCY ECA ESTIMATES FOR JULY, AUGUST and SEPTEMBER
2017 - 3RD QUARTER
AUG SEP JUL AUG SEP
$/kW-month $/kWh 0.416 0.416 (0.001775) (0.001775) (0.001775)
kW kWh 172,765 157,033 162,321 85,637,670 84,749,812 70,484,392
4/10/2017
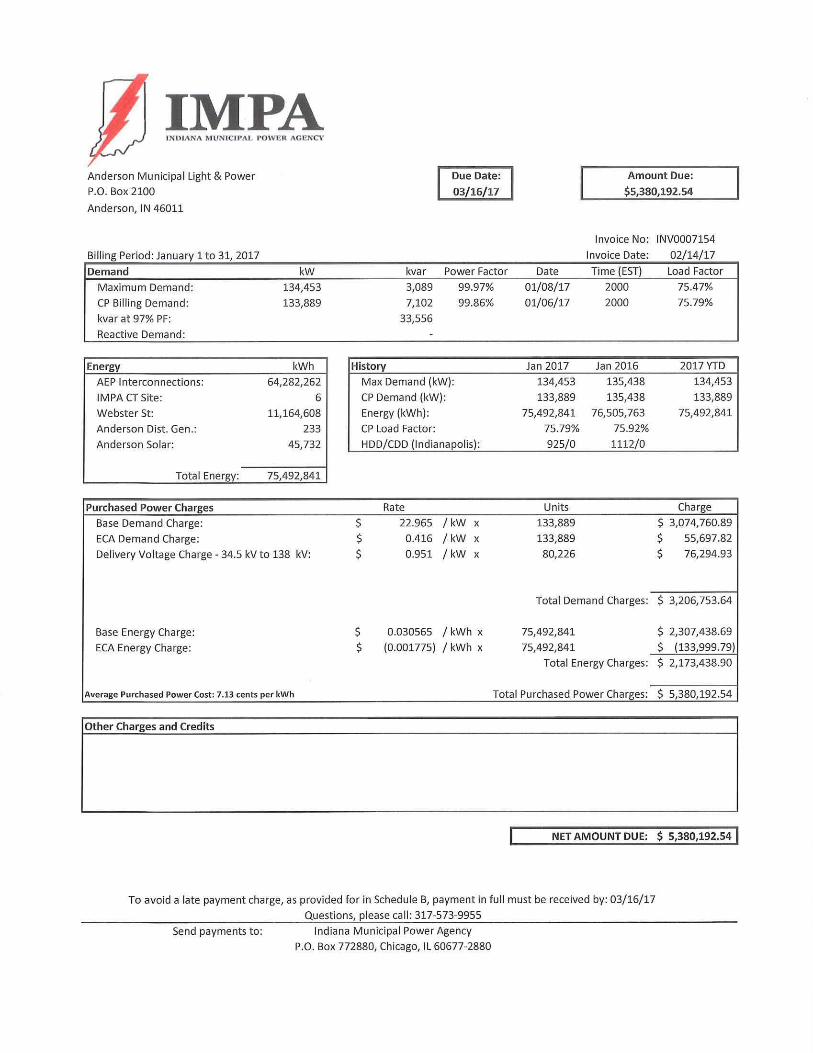
IMPA Th'l>lANA MUNICIPAL POWER AG ENCY
Anderson Municipal Light & Power
P.O. Box 2100
Anderson, IN 46011
Billing Period: January 1 to 31, 2017
Demand
Maximum Demand:
CP Billing Demand:
kvar at 97% PF:
Reactive Demand:
Energy
AEP Interconnections:
IMPACT Site:
Webster St:
Anderson Dist . Gen .:
Anderson Solar:
Total Energy:
Purchased Power Charges
Base Demand Charge:
ECA Demand Charge:
kW
134,453
133,889
kWh
64,282,262
6
11,164,608
233
45,732
75,492,841
Delivery Voltage Charge - 34.5 kV to 138 kV:
Base Energy Charge:
ECA Energy Charge:
kvar
3,089
7,102
33,556
Due Date:
03/16/17
Power Factor
99.97%
99.86%
History
Max Demand (kW):
CP Demand (kW):
Energy (kWh) :
CP Load Factor:
HDD/CDD (Indianapolis):
Rate
$ 22.965 I kW x
$ 0.416 /kW x
$ 0.951 /kW x
$ 0.030565 /kWh x
$ (0.001775) I kWh x
Amount Due:
$5,380,192.54
Invoice No: INV0007154
Invoice Date: 02/14/17
Date Time (EST) Load Factor
01/08/17 2000 75.47%
01/06/17 2000 75.79%
Jan 2017 Jan 2016 2017 YTD
134,453 135,438 134,453
133,889 135,438 133,889
75,492,841 76,505,763 75,492,841
75.79% 75.92%
925/0 1112/0
Units Charge
133,889 $ 3,074,760.89
133,889 $ 55,697.82
80,226 $ 76,294.93
Total Demand Charges: $ 3,206, 753.64
75,492,841 $ 2,307,438.69
75,492,841 $ (133,999.79)
Total Energy Charges: $ 2,173,438.90
Average Purchased Power Cost: 7.13 cents per kWh Total Purchased Power Charges: $ 5,380,192.54
Other Charges and Credits
NET AMOUNT DUE: $ 5,380,192.541
To avoid a late payment charge, as provided for in Schedule B, payment in full must be received by: 03/16/17
Questions, please call: 317-573-9955
Send payments to: Indiana Municipal Power Agency
P.O. Box 772880, Chicago, IL 60677-2880
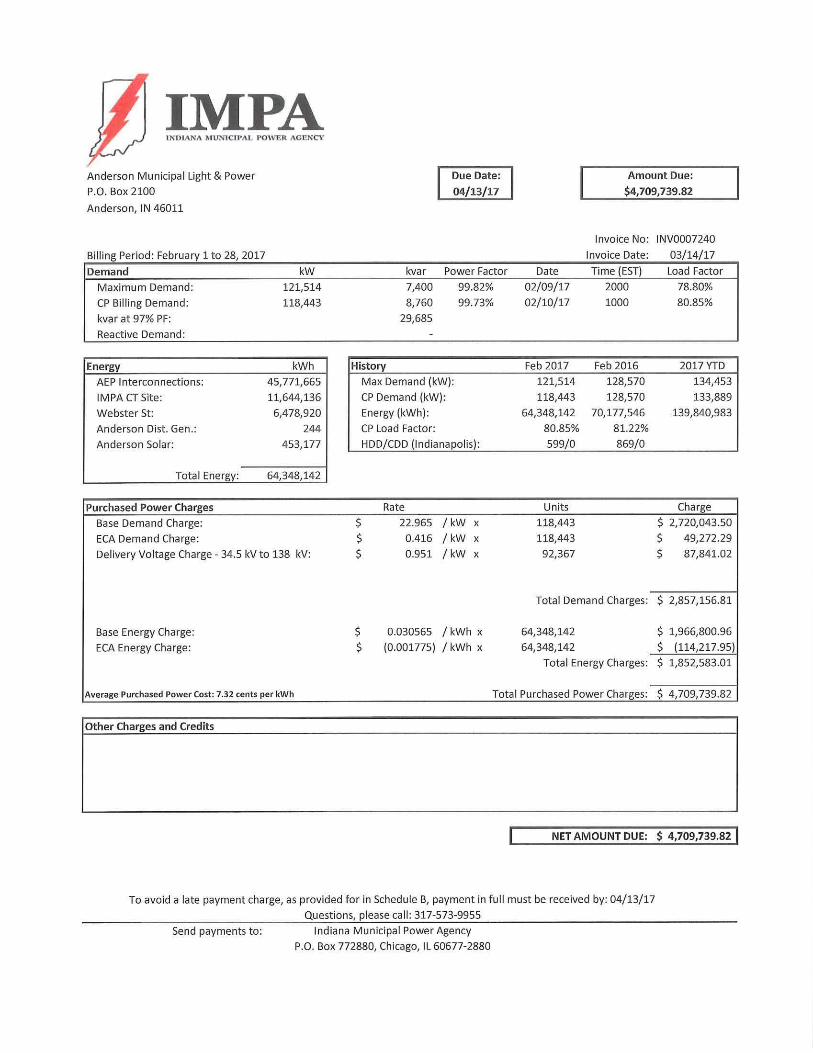
IMPA 11\ 0 IANI\ M lr.lllCIPAL POWER AGE1'CV
Anderson Municipal Light & Power
P.O. Box 2100
Anderson, IN 46011
Billing Period: February 1 to 28, 2017
Demand
Maximum Demand:
CP Billing Demand:
kvar at 97% PF:
Reactive Demand:
Energy
AEP Interconnections:
IMPACT Site:
Webster St:
Anderson Dist. Gen. :
Anderson Solar:
Total Energy:
Purchased Power Charges
Base Demand Charge:
ECA Demand Charge:
kW
121,514
118,443
kWh
45,771,665
11,644,136
6,478,920
244
453,177
64,348,142
Delivery Voltage Charge - 34.5 kV to 138 kV:
Base Energy Charge:
ECA Energy Charge:
Due Date:
04/13/17
kvar Power Factor
7,400 99.82%
8,760 99.73%
29,685
History
Max Demand (kW):
CP Demand (kW):
Energy (kWh):
CP Load Factor:
HOD/COD (Indianapolis):
Rate
$ 22.965 /kW x
$ 0.416 /kW x
$ 0.951 /kW x
$ 0.030565 /kWh x
$ (0.001775) I kWh x
Amount Due:
$4,709,739.82
Invoice No: INV0007240
Invoice Date: 03/14/17
Date Time (EST) Load Factor
02/09/17 2000 78.80%
02/10/17 1000 80.85%
Feb 2017 Feb 2016 2017 YTD
121,514 128,570 134,453
118,443 128,570 133,889
64,348,142 70,177,546 139,840,983
80.85% 81.22%
599/0 869/0
Units Charge
118,443 $ 2,720,043.50
118,443 $ 49,272.29
92,367 $ 87,841.02
Total Demand Charges: $ 2,857,156.81
64,348,142 $ 1,966,800.96
64,348,142 $ (114,217.95)
Total Energy Charges: $ 1,852,583.01
Average Purchased Power Cost: 7.32 cents per kWh Total Purchased Power Charges: $ 4,709,739.82
Other Charges and Credits
NET AMOUNT DUE: $ 4,709,739.82 I
To avoid a late payment charge, as provided for in Schedule B, payment in full must be received by: 04/13/17
Questions, please ca ll : 317-573-9955
Send payments to: Indiana Municipal Power Agency
P.O. Box 772880, Chicago, IL 60677-2880
IMPA INUIANA lllU'NlClrAJ. POWl!R ACE.°'CY
Anderson Municipal Light & Power
P.O. Box 2100
Anderson, IN 46011
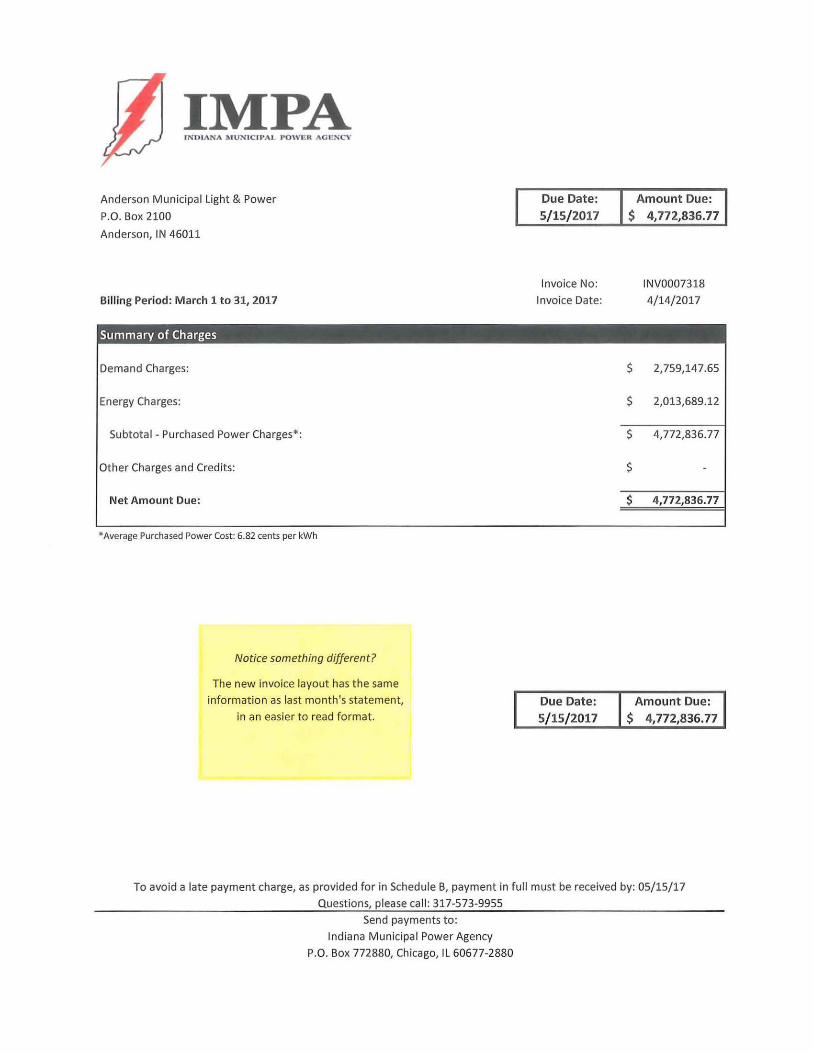
Billing Period: March 1to31, 2017
Summary of Charges
Demand Charges:
Energy Charges:
Subtotal - Purchased Power Charges*:
Other Charges and Credits:
Net Amount Due:
*Average Purchased Power Cost: 6.82 cents per kWh
Notice something different?
The new invoice layout has the same
information as last month's statement,
in an easier to read format.
Due Date: 5/15/2017
Invoice No:
Invoice Date:
Due Date: 5/ 15/ 2017
Amount Due: $ 4,772,836.77
$
$
$
$
$
INV0007318
4/14/2017
2, 759,147.65
2,013,689.12
4, 772,836. 77
4, 772,836. 77
Amount Due: $ 4,772,836.77
To avoid a late payment charge, as provided for in Schedule B, payment in full must be received by: 05/15/17
Questions, please call: 317-573-9955
Send payments to:
Indiana Municipal Power Agency
P.O. Box 772880, Chicago, IL 60677-2880
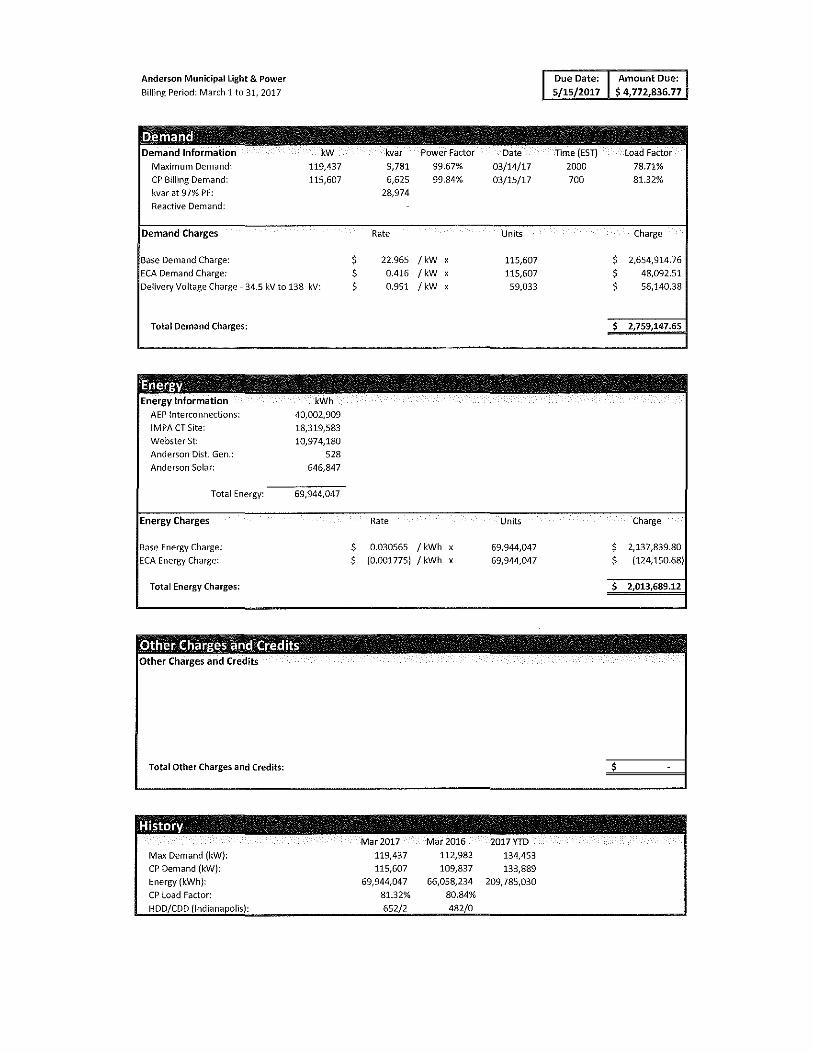
Anderson Municipal Light & Power
Billing Period: March 1to31, 2017
Demand Demand Information
Maximum Demand: CP Billing Demand: kvar at 97% PF: Reactive Demand:
Demand Charges
Base Demand Charge: ECA Demand Charge:
kw 119,437 115,607
Delivery Voltage Charge 34.5 kV to 138 kV:
Total Demand Charges:
Energy Energy Information
AEP Interconnections: IMPACT Site: Webster St: Anderson Dist. Gen.: Anderson Solar:
Total Energy:
Energy Charges
Base Energy Charge: ECA Energy Charge:
Total Energy Charges:
kWh 40,002,909 18,319,583 10,974,180
528 646,847
69,944,047
Other Charges and Credits Other Charges and Credits
Total Other Charges and Credits:
History
Max Demand (kW): CP Demand (kW): Energy (kWh): CP Load Factor: HDD/CDD (Indianapolis):
kv" Power Factor
9,781 99.67% 6,625 99.84%
28,974
Rate
$ 22.965 /kW x
$ 0.416 /kW x
$ 0.951 /kW x
Rate
$ 0.030565 I kWh x $ (0.001775) I kWh x
Mar 2017 Mar 2016
119,437 112,982 115,607 109,837
69,944,047 66,058,234 81.32% 80.84%
652/2 482/0
Date
03/14/17 03/15/17
Units
115,607 115,607 59,033
Units
69,944,047 69,944,047
2017YTD 134,453 133,889
209, 785,030
Due Date:
5/15/2017
Time (EST)
2000 700
Amount Due:
$ 4, 772,836. 77
Load Factor
78.71% 81.32%
Charge
$ 2,654,914.76
$ 48,092.51
$ 56,140.38
$ 2,759,147.65
Charge
$ 2,137,839.80 $ (124,150.68)
$ 2,013,689.12
$