Embed Size (px)
Citation preview

�
�
“main” — 2014/7/16 — 19:15 — page 347 — #1�
�
�
�
�
�
Pesquisa Operacional (2014) 34(2): 347-369© 2014 Brazilian Operations Research SocietyPrinted version ISSN 0101-7438 / Online version ISSN 1678-5142www.scielo.br/popedoi: 10.1590/0101-7438.2014.034.02.0347
A SUPPLIER SELECTION MODEL BASED ON CLASSIFYING ITS STRATEGICIMPACT FOR A COMPANY’S BUSINESS RESULTS
Thomas Edson Espındola Goncalo and Luciana Hazin Alencar*
Received January 9, 2013 / Accepted December 1, 2013
ABSTRACT. One of the most important aspects for companies’ success is the relationship between com-
panies and their suppliers. Consequently, the way that a supplier is selected is crucial to the outcome of
the business. Thus, we propose a multicriteria decision support model with two phases: the analysis of the
products/services from suppliers that need to be evaluated, using PROMSORT, and the analysis of the
suppliers of such products/services which is considered critical, using PROMETHEE II. The model was
applied to a Distribution Center of an important Brazilian retailer which serves stores in the North and
Northeast regions of Brazil. Using the proposed model, companies can focus their attention on those
products or services that have the greatest impact on their business results. The model predicts that differ-
ent decision-making processes should be applied, in accordance with the class of importance into
which the products or services are classified.
Keywords: supplier selection, Brazilian retail market, Promethee.
1 INTRODUCTION
According to Osman & Demirli (2010), improving the efficiency of supply chain partners hasbecome a major requirement of any supply chain due to the highly competitive nature of thecurrent marketplace. Due to this increase in competitiveness, companies are also adopting strate-gies to concentrate on their core business by outsourcing other activities related to the business.Therefore, the relationship between companies and their suppliers is gaining increasing impor-tance, as are the characteristics of the partnership necessary for the supply chain. Thus, the waythat a company selects its suppliers has an impact on the results of all companies in the chain.
This competitive environment points to the need to seek a closer relationship with suppliers thatwill improve the results for both parties. Ho, Xu & Dei (2010) show that the management of thesupply chain requires the maintenance of long-term partnerships with suppliers, and uses fewerand more efficient suppliers. Punniyamoorthy, Mathiyalagan & Parthiban (2011) explain that
*Corresponding authorManagement Engineering Department, Universidade Federal de Pernambuco, PE, Brazil.E-mails: [email protected]; [email protected]
�
�
“main” — 2014/7/16 — 19:15 — page 348 — #2�
�
�
�
�
�
348 MODEL BASED ON CLASSIFYING ITS STRATEGIC IMPACT FOR A COMPANY’S BUSINESS RESULTS
the selection of suppliers is one of the most important stages of the supply chain and has animportant impact on the success of any organization or supply chain.
According to Saen (2007), supplier selection is the process in which suppliers are inspected,evaluated and selected to eventually become part of the supply chain of an organization. Theselection and evaluation of suppliers is an area which has attracted the attention of most studies,and there are several approaches to support decision making on this issue.
To Vinodh, Ramiya & Gautham (2011), the supplier selection problem is a multicriteria decision-making problem in the presence of various criteria and sub-criteria, be they quantitative or qual-itative. Due to this characteristic, there arises the need to use more robust tools for decisionsupport.
Basnet & Weintraub (2009) assert that, in the current context of globalization, companies areincreasing the focus on their core business and outsourcing their other activities. This behaviorincreases the importance of the process for selecting suppliers. While small firms select partnersbased on criteria which determine the lowest costs, large companies must select their suppliersmore carefully, by considering different criteria that seek a long-term relationship with theirsuppliers.
This trend shows up in various areas of activity in the market, including in the retail market,which is characterized by a highly competitive and dynamic environment. The fact that thereare so many competitors in the market requires retailers to reduce their profit margins so theycan offer their products at a competitive price to customers. The environment described requiressupplier selection to be effective. All details have an important impact on the results producedby the supply chain.
In most cases, however, companies do not have an overview of the importance of the raw ma-terials and/or services that have been outsourced to their suppliers. In such cases, the companymay be focusing its attention on products or services that are not the most critical to its results.Thus, it is important that the company conducts an analysis of the importance of its raw materi-als and/or third party services, and then reviews the configuration of its suppliers. After havingassessed which products or services are most critical to it, the company can direct its effortstowards evaluating the aspects of the critical supply. And thereafter, it can proceed to selectingsuppliers for its most critical products or services.
Within this context, this paper aims to propose an integrated model for classifying suppliers inaccordance with decision makers’ preferences and for supplier selection, in accordance with theclass into which the supplier was sorted, taking into account the multiple criteria that should beconsidered when choosing a business partner. The model was applied in a distribution center ofa large retail chain, which sells a wide range of households and personal products, in Brazil.
In order to achieve the proposed goals, a step-by-step approach was undertaken, as follows.The first phase of the study consisted of a bibliographic research. From the results obtained, asupplier selection model was structured that can be applied to companies from different sectorsand considers issues related to outsourcing. Then the model was applied to selecting suppliers for
Pesquisa Operacional, Vol. 34(2), 2014

�
�
“main” — 2014/7/16 — 19:15 — page 349 — #3�
�
�
�
�
�
THOMAS EDSON ESPINDOLA GONCALO and LUCIANA HAZIN ALENCAR 349
a Distribution Center (DC). The model was applied on the Operations Manager of the companywho was deemed to be the decision maker (DM). Three interviews were conducted on the spot.In the first interview, data were obtained to characterize the DC. In the second step, the first phaseof the model was applied, which involves classifying the outsourced services. In the third step,the second phase of the model was applied. The supplier who was able to provide the transportalternatives in accordance with the DM’s needs was selected.
The paper is organized as follows: Section 2 discusses the issue of vendor selection as presentedin the literature, and emphasizes the tools used by the authors to deal with the problem. InSection 3, multicriteria approaches to support supplier selection decisions are discussed as isthe technique chosen to tackle the problem in this study. In Section 4, a model for supplier selec-tion is proposed that can be used in companies from various sectors. Section 5 gives the resultsobtained from applying the model in a DC of an important retailer in Brazil. Finally, there areclosing remarks in which the contributions and limitations of the study are pointed out as is theneed for further research on the topic.
2 SUPPLIER SELECTION PROBLEM
The problem of selecting suppliers has been extensively debated in the literature, as follows.
Several studies were developed using programming models for decision support. Aguezzou &Ladet (2007) propose a non-linear programming model for supplier selection that takes into ac-count the transport of materials in order to select the best supply configuration. Osman & Demirli(2010) proposed a model using bilinear programming goals to achieve a compromise solutionthat allocates the demands of the company among the suppliers, thus minimizing the distribu-tion cost. Wu et al. (2010) propose a multi-objective programming model for decision makingon selecting suppliers, taking into account risk factors. For this purpose, the authors designeda fuzzy multi-objective programming model to deal with this problem. Mansini, Savelsbergh &Tocchella (2012) proposed integer programming based heuristics to solve the problem of select-ing a set of suppliers to satisfy product demand at minimal total costs, taking purchasing andtransportation costs into account. A computational analysis was developed considering a singlepurchaser, 29 suppliers and 50 products.
Other researchers used the AHP (Analytic Hierarchy Process) method, on its own or combinedwith other methods, to support the supplier selection decision. Chan & Chan (2010) used anAHP model to solve the problem of supplier selection in the garment industry, which takes intoaccount the operational performance (flexibility, cost, delivery, etc.) in support of managing thesupply chain. Ramanathan (2007), taking a different approach, integrates the approaches of TotalCost of Ownership (TCO) and AHP to select the appropriate supplier for a firm. The objectiveand subjective information provided by these approaches are then combined by implementingthe Data Envelopment Analysis (DEA) method. El-Sawalhi, Eaton & Rustom (2007) proposeda model combining AHP, Neural Networks (NN) and a Genetic Algorithm (GA). The authorshope that the model they propose will overcome the limitations experienced by other methodsfound in the literature, particularly the accuracy of the results and the forecast performance of
Pesquisa Operacional, Vol. 34(2), 2014

�
�
“main” — 2014/7/16 — 19:15 — page 350 — #4�
�
�
�
�
�
350 MODEL BASED ON CLASSIFYING ITS STRATEGIC IMPACT FOR A COMPANY’S BUSINESS RESULTS
suppliers. Ishizaka (2012) proposed the use of clusters and pivots to facilitate the use of AHP usein supplier selection. This advance is useful when the numbers of pairwise comparisons becomesoverwhelming. The model was applied in the selection process by twelve suppliers based onthree criteria. Ting & Cho (2008) combine the AHP tool with a linear programming model withmultiple objectives and a set of system constraints. The programming model is developed tosolve the problem and allocate optimal orders quantities of resources to selected suppliers.
Gomes, Rangel & Leal Junior (2011) dealt with the supply selection problem, considering uncer-tainty, by using the MAUT method, combined with the Interval Smart/Swing Weighting Method.The second method was used in the weights definition process, when making judgments by in-tervals. The model was applied in the selection of a printing service supplier.
Schramm & Morais (2012) proposed a multi-criteria decision model for supplier selection inthe Brazilian construction industry. The model was based on the Simple Multi-Attribute RatingTechnique Exploiting Ranking method (SMARTER).
The ANP (Analytic Network Process) was the tool selected by other scholars to deal with theproblem. Gurpinar & Gencer (2007) used an ANP tool in order to evaluate the relationshipbetween the criteria for selecting suppliers in a company in the electronics field. Kirytopoulos,Leopoulos & Voulgaridou (2008) also used an ANP to support the selection of the best compro-mise solution in the environment of the pharmaceutical industry. Verdecho et al. (2012) presentan approach based on an ANP to manage collaborative relationships by considering not only theelements of inter-enterprise performance, but also the factors that influence collaboration. Theapproach was applied in a network of collaborating enterprises from the renewable energy sectorin Spain.
Basnet & Weintraub (2009) dealt with the problem of supplier selection where there are severalsuppliers with limited capabilities. To solve the problem, the authors propose a genetic algorithmbe used in the search for Pareto optimal solutions.
Alencar & Almeida (2010) used PROMETHEE VI method in order to select suppliers (projectteam members) based on group decision, considering the preference structure of each member.The model was applied in a construction environment.
A large number of other studies on this area have been published including those by: Kahraman,Cebeci & Ulukan (2003), Narasimhan, Talluri & Mahapatra (2006), Bansal, Karimi & Srinivasan(2007); Chen & Huang (2007); Yang et al. (2008); Ordoobadi (2009), Golmohammadi et al.(2009); Sawik (2010); Barker & Zabinsky (2011); Bai & Sarkis (2012), and Qin et al. (2012).
These studies include the following industries and markets: White good manufacturers, elec-tronic firm, widget manufacturer, computer industries, and civil construction. The models pro-posed range from those that use multi-objective programming to a neural network and geneticalgorithms and they also include the use of various members of the MCDA family. Note that nostudies were found in our review of the literature that rank suppliers according to the class towhich the product/service was allocated.
In the next section, the importance of using a multicriteria decision method as a tool to aidcompanies in finding a solution to the problem is discussed.
Pesquisa Operacional, Vol. 34(2), 2014

�
�
“main” — 2014/7/16 — 19:15 — page 351 — #5�
�
�
�
�
�
THOMAS EDSON ESPINDOLA GONCALO and LUCIANA HAZIN ALENCAR 351
3 MULTICRITERIA DECISION METHODS
In the field of decision support tools, multicriteria approaches are gaining attention because oftheir robustness and to facilitate the analysis of more complex cases in a very effective way.Vincke (1992) says that multicriteria decision analysis aims to give a decision maker (DM) thetools to solve decision problems where different, often contradictory points of view must be takeninto consideration.
Vincke (1992) points out there are three families of multicriteria methods:
• The first is characterized by aggregating different viewpoints into a single function. Themost important methods are MAUT, SMART, SMARTS and AHP.
• The second aims to start building what is deemed an outranking relationship and to explorethese relationships to assist the DM. The most widely known methods are ELECTRE andPROMETHEE.
• The third family, known as interactive methods, alternates calculation and dialogue steps.
The PROMETHEE method is the one used in the model proposed in this article. According toBrans et al. (1998), the PROMETHEE method is important because it involves concepts andparameters that have some physical or economical interpretation that is easy for most DMs tounderstand.
Brans & Vincke (1985) point out that assigned weights p j representing the degree of importanceof each criteria, the degree of outranking π(a, b) are computed in accordance with the equationbelow:
π(a, b) = 1
P
n∑j=1
p j Fj (a, b), where P =n∑
j=1
p j .
Where the function Fj (a, b) is a number between 0 and 1 that increases when the values ofg j (a) − g j (b) increases and is equal to zero if g j (a) = g j(b), where g j (a) is the evaluation ofthe alternative a in the criterion j . In order to find the value of the function Fj (a, b), the DM canchoose, for each criterion, one of six types of function as follows (Brans and Vincke, 1985):
• Usual criteria: No threshold needs to be defined;
• U-shape criteria: the q threshold should be defined;
• V-shape criteria: the p threshold should be defined;
• Level criteria: the q and p thresholds should be defined;
• Linear criteria: the q and p thresholds should be defined;
• Gaussian criteria: the standard deviation should be set.
Pesquisa Operacional, Vol. 34(2), 2014
�
�
“main” — 2014/7/16 — 19:15 — page 352 — #6�
�
�
�
�
�
352 MODEL BASED ON CLASSIFYING ITS STRATEGIC IMPACT FOR A COMPANY’S BUSINESS RESULTS
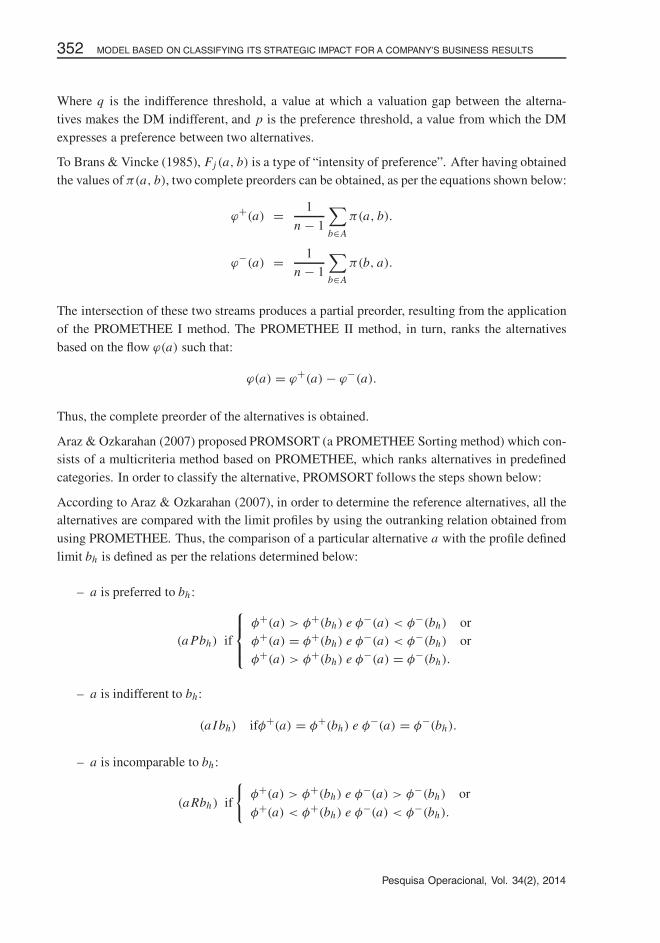
Where q is the indifference threshold, a value at which a valuation gap between the alterna-tives makes the DM indifferent, and p is the preference threshold, a value from which the DMexpresses a preference between two alternatives.
To Brans & Vincke (1985), Fj (a, b) is a type of “intensity of preference”. After having obtainedthe values of π(a, b), two complete preorders can be obtained, as per the equations shown below:
ϕ+(a) = 1
n − 1
∑b∈A
π(a, b).
ϕ−(a) = 1
n − 1
∑b∈A
π(b, a).
The intersection of these two streams produces a partial preorder, resulting from the applicationof the PROMETHEE I method. The PROMETHEE II method, in turn, ranks the alternativesbased on the flow ϕ(a) such that:
ϕ(a) = ϕ+(a) − ϕ−(a).
Thus, the complete preorder of the alternatives is obtained.
Araz & Ozkarahan (2007) proposed PROMSORT (a PROMETHEE Sorting method) which con-sists of a multicriteria method based on PROMETHEE, which ranks alternatives in predefinedcategories. In order to classify the alternative, PROMSORT follows the steps shown below:
According to Araz & Ozkarahan (2007), in order to determine the reference alternatives, all thealternatives are compared with the limit profiles by using the outranking relation obtained fromusing PROMETHEE. Thus, the comparison of a particular alternative a with the profile definedlimit bh is defined as per the relations determined below:
– a is preferred to bh :
(a Pbh) if
⎧⎪⎨⎪⎩
φ+(a) > φ+(bh) e φ−(a) < φ−(bh) orφ+(a) = φ+(bh) e φ−(a) < φ−(bh) orφ+(a) > φ+(bh) e φ−(a) = φ−(bh).
– a is indifferent to bh:
(a I bh) ifφ+(a) = φ+(bh) e φ−(a) = φ−(bh).
– a is incomparable to bh :
(a Rbh ) if
{φ+(a) > φ+(bh) e φ−(a) > φ−(bh) or
φ+(a) < φ+(bh) e φ−(a) < φ−(bh).
Pesquisa Operacional, Vol. 34(2), 2014

�
�
“main” — 2014/7/16 — 19:15 — page 353 — #7�
�
�
�
�
�
THOMAS EDSON ESPINDOLA GONCALO and LUCIANA HAZIN ALENCAR 353
The classification of the alternatives into certain categories is obtained by the direct use of out-ranking relations obtained in the previous step. The following steps should be followed to allo-cate the alternatives to the respective categories:
After this phase, some alternatives may not yet have been allocated to a category. In the thirdstage, the process of allocation uses the alternatives that have been allocated to a class as thereference point of the classes, in order to allocate the alternatives which have not yet been putinto some class. For an alternative a that has not been allocated to a class, the procedure fordoing so is as follows:
• Determine the distance from the cut-off point. The cutoff value of b can be set with thevalues 0 or 1 for optimism and pessimism, respectively. If the value of b is zero, thealternatives that were not allocated will be placed in categories according to their distancefunction. If b = 1, these unallocated alternatives will be placed in the lower classes.
dk = 1
ntd+
k − 1
nt+1d−
k .
where:d+
k measures the outranking character of a on all the alternatives allocated to category Ct ,and:
d+k =
∑x∈Xt
(�(a) − �(x)).
d−k measures the outranking character of a on all the alternatives allocated to category
Ct+1, and:d−
k =∑x∈Xt
(�(x) − �(a)).
nt is the number of reference alternatives in category Ct .
• Allocate the cutoff point b. If the distance is greater than the cutoff point b, the alternativea is allocated to category Ct+1; otherwise, it is allocated to category Ct . The cutoff pointb can be specified by the DM and reflects his/her point of view, whether this is pessimisticor optimistic.
In the next section, the model for supplier selection is proposed.
4 SUPPLIER SELECTION MODEL
The model for supplier selection proposed is divided into two phases: in the first, the productsor services being focused on and used by the agent are placed into classes; in the second, havingselected the most critical product or service, the best supplier can be chosen. The model is shownin Figure 1.
In the first phase, the alternatives (products supplied or outsourced services) are placed intoclasses as per the requirements and criteria set by the DM. The objective of this phase is to
Pesquisa Operacional, Vol. 34(2), 2014

�
�
“main” — 2014/7/16 — 19:15 — page 354 — #8�
�
�
�
�
�
354 MODEL BASED ON CLASSIFYING ITS STRATEGIC IMPACT FOR A COMPANY’S BUSINESS RESULTS
Figure 1 – Supplier selection model.
Pesquisa Operacional, Vol. 34(2), 2014

�
�
“main” — 2014/7/16 — 19:15 — page 355 — #9�
�
�
�
�
�
THOMAS EDSON ESPINDOLA GONCALO and LUCIANA HAZIN ALENCAR 355
classify the goods or services supplied in accordance with the level of their strategic impact onthe company’s business.
First of all, the focus of the analysis is defined, whether for products or services, given thecompany’s needs. After making this definition, the alternatives should be selected, i.e., the prod-ucts or services to be considered in the analysis. The next step involves applying a multicriteriamethod so as to classify the alternatives according to the DM’s preferences. Then, the alterna-tives have to be classified into one of the three pre-defined classes: a high, medium or low impacton the company’s strategic objectives.
In the second phase, one of three approaches is chosen which is suited to the respective classof products or services determined in the first phase.
Depending on the class, the approach to follow is different. For products or services of lesserstrategic impact, the selection can be performed more simply, by means of considering the costcriteria. For the products or services that are most important for the business results, a multicri-teria analysis for ranking suppliers is proposed.
The first class discussed is that of products or services that have a high impact. The products orservices that are arranged in this class have a direct impact on the company’s results and moreattention should be given to aspects of their supply. Initially, among the alternatives classified ashigh-impact, the product or service for which the analysis will be performed must be selected.Then the alternatives (suppliers) must be defined. The next step involves determining the criteriato be considered in the analysis. It is important to take into account the need for a partnershipbetween the company and the suppliers of the service or product considered. Then, as per busi-ness needs, the analyst has to determine the most appropriate issue to be considered: selection,sorting or classifying suppliers. In accordance with the nature of the problem, the characteristicsof the scenario, the profile of the issue and the DM’s views, the multicriteria decision supportmethod needs to be selected. The method chosen shall be applied, considering the various alter-natives with respect to the criteria selected.
The products or services of medium impact on business results will be allocated into the secondclass. Their level of importance is lower than those that were allocated to the high impact class,but they should also be considered carefully. The subsequent steps are similar to those for an-alyzing high-impact products, i.e.: all of the following must be done – selecting the product orservice that will be evaluated and defining who the potential suppliers will be, considering whichcriteria will be the most appropriate for the problematic, defining the multicriteria method and,finally, applying the method, and selecting, sorting or ranking such suppliers.
The third class allocates the products or services that have low impact on the business results,i.e., problems that arise in providing this type of service but which do not have a high impact onresults. So, maintaining a long or medium term relationship with these suppliers is not necessar-ily required. Thus, in accordance with the model, costs may be the only criteria that have to beconsidered when selecting such suppliers. Thus, the DM has to: select the product or service thatwill be considered; define the alternatives (suppliers) to be evaluated; obtain a price quotationfrom the suppliers who meet the minimum requirements, and finally the DM has to select thesupplier.
Pesquisa Operacional, Vol. 34(2), 2014
�
�
“main” — 2014/7/16 — 19:15 — page 356 — #10�
�
�
�
�
�
356 MODEL BASED ON CLASSIFYING ITS STRATEGIC IMPACT FOR A COMPANY’S BUSINESS RESULTS
5 APPLYING THE MODEL
The company studied is one of the most traditional retailers in Brazil. It was founded in the1930s, and it currently has over 600 stores in almost every state in the country and three distri-
bution centers: two in the Southeast and one in the region Northeast.
The company sells over 60,000 SKUs (Stock Keeping Units) from 4,000 different suppliers;this demonstrates the wide variety of products that are distributed by the company and the im-portance of its maintaining good relationships with all of its suppliers.
Currently, the company has adopted a very aggressive expansion strategy and opened new stores,
usually small ones, in line with the tendency to decentralize its outlets. This strategy, in turn,demands investing more in logistics and, at this point, the company’s distribution centers arethe key elements of its strategy for maintaining a good overall performance. It therefore needs
to pay greater attention to critical points related to the performance of its distribution centers,which includes its relationships with the various service providers it contracts.
Over the years, many methods have been proposed to address the problem of classifying alter-natives, amongst which are: ELECTRE TRI; the THESEUS method, proposed by Fernandez
& Navarro (2011); and the PROMSORT method, proposed by Araz & Ozkarahan (2007). Weselected PROMSORT as the tool for the first phase of the application. This uses the concepts ofboth “limit profiles” and a “reference alternative” to deal with the DM’s judgment, thus giving
the DM the flexibility to define his/her (optimistic or pessimistic) point of view, and guaranteesordered categories, as per Araz & Ozkarahan (2007). Thus, when there is some hesitation inallocating a certain alternative to a class, the method compares it to a reference alternative,
which has been allocated in a class based on comparison with the limit profiles. This processalso considers whether the DM is being optimistic or pessimistic. Moreover, the PROMSORTmethod uses the PROMETHEE structure to address the DM’s preferences with the support of the
preference functions. Therefore, the DM choose the function that best suits his/her preferencestructure, thereby facilitating the definition of the parameters for modeling the problem. Thesetechnical features facilitated the contact with the DM and the results proposed being achieved.
Furthermore, by having used the PROMSORT Method in the first step of the application, itbecame easier for the DM to understand the meaning of the method’s parameters in the secondphase.
For this second phase of the application, the PROMETHEE method was selected because it is
an outranking method and due to the flexibility it offers to the DM in choosing the weightsof the criteria and the generalized criteria for each weight. In other words, just the evaluationcriteria completed by his/her preference function – is important complementary information tohave. A set of six types of preference functions is proposed to the DM and the choice is made
taking into account his/her degree of preference on the basis of observed differences. In eachcase it is necessary to set a maximum of two parameters, indifference and preference thresholds,to deal with the DM’s hesitation (Mareschal & Brans, 1992). Besides, there is the possibility of
considering both qualitative and quantitative data.
Pesquisa Operacional, Vol. 34(2), 2014

�
�
“main” — 2014/7/16 — 19:15 — page 357 — #11�
�
�
�
�
�
THOMAS EDSON ESPINDOLA GONCALO and LUCIANA HAZIN ALENCAR 357
5.1 First Phase of the Application
First of all, the decision maker (DM) chooses to analyze the services outsourced by the distribu-tion center (DC). Thus, in the first phase, the classification of the services is obtained.
5.1.1 Defining alternatives
Several subcontractors carry out activities to support operations in the DC. The DM therefore
listed the services that are currently outsourced by the DC. So, the eight services that have beenoutsourced were considered and are shown in Table 1.
Table 1 – Characterization of the outsourced services in the company’s distribution center.
Service AttributionsNumber ofsuppliers
Cleaning Responsible for cleaning and maintenance of internal2
(A1) and external areas of the Distribution Center.
Armed securityResponsible for protecting the DC from the actions
1(A2)
of external agents. Work in the guardhouse and
do the rounds in external areas.
Property securityResponsible for internal security on the premises
2(A3)
of the DC. Perform rounds and oversee the receipt
and shipment of goods of high value.
Loading and unloading Responsible for loading and unloading of vehicles1
(A4) both in receiving and in dispatch
Separation of goods.Separation of the goods to be shipped to the stores. 2
(A5)
Maintenance Responsible for maintenance of the machinery1
(A6) used in the DC.
Maintenance of theResponsible for maintenance of the cameras
1monitoring systemmonitoring the DC.
(A7)
Transport Responsible for the transportation of goods7
(A8) from the DC to each store.
RefectoryResponsible for providing food for the employees. 1
(A9)
5.1.2 Defining criteria
The DM defined a set of criteria in order to consider how critical the outsourced services are
to the outcomes of the distribution center. Thus, five criteria were defined, which are given inTable 2.
For most of the criteria, a 9-point qualitative scale was adopted, since the DM was more com-fortable using this scale. This verbal scale was then translated into an ordinal scale. It should
Pesquisa Operacional, Vol. 34(2), 2014

�
�
“main” — 2014/7/16 — 19:15 — page 358 — #12�
�
�
�
�
�
358 MODEL BASED ON CLASSIFYING ITS STRATEGIC IMPACT FOR A COMPANY’S BUSINESS RESULTS
Table 2 – Characterization of the criteria.
Criteria Description Scale Min/Max
ImpactThis takes into account the DM’s evaluation of the
QualitativeMax
on sales
direct importance of that service to the company’s
(9 points)financial results, specifically in theperformance of stores.
CostThis takes into account the monthly cost
Monetary Maxof the service.
AlternativeThis takes into account the DM’s evaluation
Qualitativesuppliers
of the ease of finding alternative(9 points)
Minsuppliers in the market.
AvailabilityThis takes into account the DM’s evaluation
Qualitativeof resources
of the ease with which suppliers can supply inputs(9 points)
Min
(people, vehicles, equipment, etc.).
QualityThis takes into account the quality of services Qualitative
Minprovided by subcontractors. (9 points)
be noted also that the goal of analysis is to evaluate the impact that services have on businessresults. The DM directly assigned a weight to each criterion and was advised that a weight of 2xattributed to certain criteria means that these criteria are twice as important as any criteria which
are given a weight of x . Thus, the weight represents the DM’s preference for any given criterion.
In order to classify the outsourced services into categories that represent their importance to thebusiness, according to the DM’s needs, the PROMSORT method was chosen. The steps to obtainthe configuration of these classes are as follows.
5.1.3 Apply PROMSORT
Having determined the criteria and their weights, a table was drawn up and the DM evaluated thealternatives considered, based on the chosen scales. Table 3 gives the matrix of the evaluationsobtained and the weights assigned to each criterion.
The next steps involved defining the other parameters needed to perform the analysis. Thus,
the DM selects the functions based on the usual criteria for the alternatives evaluated by usinga qualitative scale. For the cost criteria, represented by the Brazilian unit of currency, the real(R$), the DM used a pseudocriterion function, for which the DM has adopted an indifference
threshold of R$ 3,000 and a preference threshold of R$ 10,000.
In accordance with the model proposed, however, the alternatives needed to be allocated intoclasses in line with the critical role that they have for the company. PROMSORT was, therefore,used to allocate the alternatives into classes, based on the DM’s preferences.
The DM stipulated the parameters that characterize the classes mentioned in the model. Thus,
the limits of the profiles b1 and b2 were defined, by setting the frontiers of the classes. These
Pesquisa Operacional, Vol. 34(2), 2014

�
�
“main” — 2014/7/16 — 19:15 — page 359 — #13�
�
�
�
�
�
THOMAS EDSON ESPINDOLA GONCALO and LUCIANA HAZIN ALENCAR 359
Table 3 – Evaluation matrix of the alternatives.
Criteria Impact Cost Alt. Suppliers Resources Quality
Weights 6 4 2 2 4
A1 1 R$ 5,000 9 9 7
A2 2 R$ 20,000 7 5 5
A3 3 R$ 30,000 9 7 7
A4 4 R$ 30,000 9 6 5
A5 9 R$ 40,000 6 6 5
A6 6 R$ 5,000 3 3 8
A7 7 R$ 120,000 5 3 7
A8 2 R$ 2,000 1 1 1
A9 3 R$ 18,000 6 5 2
limits may be regarded as fictitious alternative profiles used to determine the boundaries of theclasses.
It should be noted that the DM showed sufficient understanding of the meaning of the concepts
that underpin the model. He questioned the analyst during the elicitation process whenever hehad any doubts.
Table 4 gives the evaluation matrix in which the parameters determined for the PROMSORTapplication are included:
Table 4 – Matrix of the limit profiles.
Criteria Impact Cost Alt. suppliers Resources Quality
Limit Profile 1 3 R$ 10,000 7 7 7
Limit Profile 2 6 R$ 40,000 4 4 5
PROMETHEE I was applied and the values shown in Table 5 were obtained.
Following the application of the PROMSORT method, comparisons were made between the al-ternatives and the limit profiles of the classes. Thus, at the end of this stage, there is the followingconfiguration of the classes of critical services that the company outsourced:
After this step, hesitation in allocating the transport alternative was detected. This alternative
provided further input streams and output streams that were greater than the threshold profile b2.Thus, doubt arises as to whether the service should be allocated to the high impact or mediumimpact class.
To achieve this allocation, the second stage of PROMSORT is conducted. This involves using
the alternative reference to allocate the alternatives that could not be sorted. In this case, thereference alternative is alternative A5, which is allocated to the class of high impact services.Thereafter, the distance function between alternatives is calculated.
Pesquisa Operacional, Vol. 34(2), 2014

�
�
“main” — 2014/7/16 — 19:15 — page 360 — #14�
�
�
�
�
�
360 MODEL BASED ON CLASSIFYING ITS STRATEGIC IMPACT FOR A COMPANY’S BUSINESS RESULTS
Table 5 – Matrix of the values for ϕ, ϕ+ and ϕ−.
ϕ+ ϕ− ϕ
A1 0.7111 0.1778 0.5333
A2 0.7111 0.2111 0.5000
A3 0.4889 0.3889 0.1000
A4 0.4778 0.4000 0.0778
A5 0.4778 0.4333 0.0044
A6 0.4222 0.4778 -0.0556
A7 0.3222 0.5333 -0.2111
A8 0.2667 0.5444 -0.2778
A9 0.0222 0.8333 -0.8081
Limit Profile 1 0.2000 0.6000 -0.4000
Limit Profile 2 0.6889 0.1889 0.5000
Table 6 – Partial results of the classification process.
High impact Medium impact Low impactIncomparabilities
services services services
[A5] [A9] [A1] [A8]
[A4]
[A7]
[A6]
[A2]
[A3]
The calculations resulted in d+k = 3,3623 and d−
k = 0,0333. Thus, we have the distance functiondk = 0,527. The DM has identified his view as being optimistic. Therefore, the alternative wasallocated in accordance with the distance function. If dk > b = 0, the alternative of transport
is allocated to the class of services most critical to the company’s results, in line with the DM’spreferences. The final allocation is shown in Table 7.
Table 7 – Final results of the classification process.
High impact Medium impact Low impact
services services services
[A5] [A9] [A1]
[A8] [A4]
[A7]
[A6]
[A2]
[A3]
Pesquisa Operacional, Vol. 34(2), 2014

�
�
“main” — 2014/7/16 — 19:15 — page 361 — #15�
�
�
�
�
�
THOMAS EDSON ESPINDOLA GONCALO and LUCIANA HAZIN ALENCAR 361
5.1.4 Sensitivity analysis
A sensitivity analysis was conducted in order to assess the robustness of the results when smallvariations in the values of the parameters are considered.
For the sensitivity analysis, the authors adjusted the weights assigned to each criterion. There-
fore, the analysis took into account an increase of 15% in the weight of each of the criteria, anda proportionate reduction in the others. The results are shown in Figure 2. The color key showswhich alternative classes were allocated to each of the scenarios tested.
Figure 2 – Results of the Sensitivity analysis.
The sensitivity analysis was used to evaluate the robustness of the results arising from applyingthe method. For C1, C2, C3 and C4, increasing the values of the weight did not change the
configuration of the classes and the services remained in the positions observed in the optimalsolution. For criteria C5, however, the Freight service ended up being classified as a mediumstrategic impact, due to varying the values of the weights.
5.2 Applying the Second Phase
The results obtained from implementing the first phase of the model were shown to the DM andhe suggested that the second phase be applied to the service of transporting goods. Note that isthe manager interviewed who acts directly on the DC’s relationship with hauliers.
As previously assessed, transport is one of the most critical services to the performance of the
DC, as per the DM’ preferences. Thus, it became necessary to perform an analysis taking intoaccount important criteria with regard to selecting and improving the hauliers’ performance.
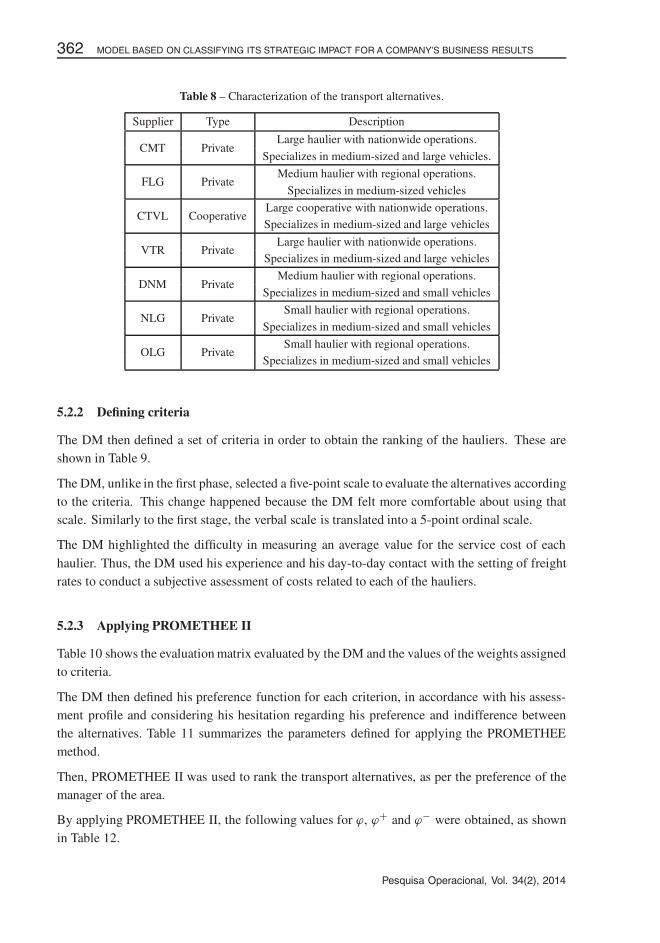
5.2.1 Defining alternatives
The DC works with seven haulage companies, each with its own characteristics and constraints,
to deliver goods to the stores. All of them were pre-selected and can be included in the day-to-dayplanning of the company’s shipments. Table 8 provides relevant information on the alternativesconsidered.
Pesquisa Operacional, Vol. 34(2), 2014
�
�
“main” — 2014/7/16 — 19:15 — page 362 — #16�
�
�
�
�
�
362 MODEL BASED ON CLASSIFYING ITS STRATEGIC IMPACT FOR A COMPANY’S BUSINESS RESULTS
Table 8 – Characterization of the transport alternatives.
Supplier Type Description
CMT PrivateLarge haulier with nationwide operations.
Specializes in medium-sized and large vehicles.
FLG PrivateMedium haulier with regional operations.
Specializes in medium-sized vehicles
CTVL CooperativeLarge cooperative with nationwide operations.Specializes in medium-sized and large vehicles
VTR PrivateLarge haulier with nationwide operations.
Specializes in medium-sized and large vehicles
DNM PrivateMedium haulier with regional operations.
Specializes in medium-sized and small vehicles
NLG PrivateSmall haulier with regional operations.
Specializes in medium-sized and small vehicles
OLG PrivateSmall haulier with regional operations.
Specializes in medium-sized and small vehicles
5.2.2 Defining criteria
The DM then defined a set of criteria in order to obtain the ranking of the hauliers. These areshown in Table 9.
The DM, unlike in the first phase, selected a five-point scale to evaluate the alternatives accordingto the criteria. This change happened because the DM felt more comfortable about using thatscale. Similarly to the first stage, the verbal scale is translated into a 5-point ordinal scale.
The DM highlighted the difficulty in measuring an average value for the service cost of each
haulier. Thus, the DM used his experience and his day-to-day contact with the setting of freightrates to conduct a subjective assessment of costs related to each of the hauliers.
5.2.3 Applying PROMETHEE II
Table 10 shows the evaluation matrix evaluated by the DM and the values of the weights assignedto criteria.
The DM then defined his preference function for each criterion, in accordance with his assess-ment profile and considering his hesitation regarding his preference and indifference betweenthe alternatives. Table 11 summarizes the parameters defined for applying the PROMETHEEmethod.
Then, PROMETHEE II was used to rank the transport alternatives, as per the preference of themanager of the area.
By applying PROMETHEE II, the following values for ϕ, ϕ+ and ϕ− were obtained, as shownin Table 12.
Pesquisa Operacional, Vol. 34(2), 2014

�
�
“main” — 2014/7/16 — 19:15 — page 363 — #17�
�
�
�
�
�
THOMAS EDSON ESPINDOLA GONCALO and LUCIANA HAZIN ALENCAR 363
Table 9 – Characterization of the criteria considered by the decision maker.
Criteria Description Scale Min/Max
Variety of areas Considers the states (stores) QualitativeMax
(C1) that can be served by the hauliers. (5 points)
Variety Considers the types of vehiclesQualitative
Maxof vehicles that can be offered to the DC(5 points)
(C2) for the transport of goods.
Rate Considers the frequency withQualitative
Maxof service which the hauliers meet the DC’s(5 points)
(C3) requests for supplies.
Speed in Considers how quickly the haulierQualitative
Maxattendance meets a request for a vehicle.(5 points)
(C4)
Capacity for Considers the conditions set by theQualitative
MaxReverse Logistics haulier for bringing materials(5 points)
(C5) back to the DC.
Quality of Evaluates the personal serviceQualitative
Maxpersonal service provided by hauliers to the(5 points)
(C6) contacts made by the DC.
Quality of Considers the physical conditionQualitative
Maxvehicles of the vehicles that are sent(5 points)
(C7) by the hauliers.
Supply of rawEvaluates the provision for materials
QualitativeMaxmaterials
that have to be sent with the vehicle,(5 points)
(C8)such as tarpaulins and other
protective equipment.
Cost ofAssesses the profile of the freight
QualitativeMaxfreight
rates charged by hauliers to(5 points)
(C9)transport goods to many
different areas.
Table 10 – Evaluation matrix of the alternatives.
Service/Criteria C1 C2 C3 C4 C5 C6 C7 C8 C9
Weight 20 10 15 10 5 5 10 5 30
CMT 5 5 4 4 3 5 3 4 2
FLG 4 4 5 4 4 3 3 3
CTVL 5 5 4 4 3 3 3 5
VTR 1 2 3 3 3 3 2 3
DNM 3 4 3 2 3 2 3 3
NLG 2 2 5 5 4 4 4 2
OLG 2 3 5 5 5 4 4 3
Pesquisa Operacional, Vol. 34(2), 2014

�
�
“main” — 2014/7/16 — 19:15 — page 364 — #18�
�
�
�
�
�
364 MODEL BASED ON CLASSIFYING ITS STRATEGIC IMPACT FOR A COMPANY’S BUSINESS RESULTS
Table 11 – PROMETHEE II parameters.
Function Criteria
Usual (any difference in valuationC1, C2, C3, C4, C7 and C9
is considered a preference)
Pseudo-criteria (with indifference thresholdsC5, C6 and C8
q = 1 and preference thresholds p = 2)
Table 12 – Matrix of the values for ϕ, ϕ+ and ϕ−.
ϕ+ ϕ− ϕ
CMT 0.3409 0.3939 -0.0530
FLG 0.3788 0.2348 0.1439
CTVL 0.6212 0.1136 0.5076
VTR 0.1515 0.5303 -0.3788
DNM 0.2273 0.4621 -0.2348
NLG 0.2576 0.4242 -0.1667
OLG 0.4091 0.2273 0.1818
The results were expressed in Figure 3. On analyzing the results obtained, it is observed that
haulier CTVL had the best performance in comparison with the other hauliers, followed byOLG and FLG. Then in descending order, come the suppliers CMT, NLG, DNM, and finally thehaulier VTR.
With these results, the DM has information regarding the performance of hauliers that work with
the Distribution Center and can take actions to intensify the relationship with the best hauliers,while looking for new suppliers of transport for the areas served by hauliers with the worstperformance and, more importantly, can take measures to improve their performance.
The DM found the results very satisfactory. He was surprised, however, with the performance
of haulier CMT, which meets most of the demand for vehicles and has an important history withthe company. But it is pointed out that there are problems in that supplier’s performance, whichjustifies the result.
5.2.4 Sensitivity analysis
In order to assess the consistency of results achieved, the sensitivity analysis was conducted usingthe walking weights methods. The weight of each criterion, in turn, was increased by 15% andthus the overall importance of the others was reduced.
6 DISCUSSION
The model proposed can be applied to the problem of selecting suppliers of products (raw ma-terials) or selecting providers of services that companies require. The model is divided into two
Pesquisa Operacional, Vol. 34(2), 2014

�
�
“main” — 2014/7/16 — 19:15 — page 365 — #19�
�
�
�
�
�
THOMAS EDSON ESPINDOLA GONCALO and LUCIANA HAZIN ALENCAR 365
Figure 3 – Representation of the PROMETHEE II results.
phases. In the first phase, an important analysis of the critical aspects of the various products orservices is conducted. Thus, companies can obtain an overview of the impact that these have on
their business results and this can be used when designing the company’s strategy. Therefore, theclassification of products or services was proposed so that the company would then pay greaterattention to those products/services that are the most critical ones for their results.
In order to determine what the best results might be, PROMSORT and PROMETHEE were used.
These are outranking methods that have parameters which have a more tangible meaning for the
Pesquisa Operacional, Vol. 34(2), 2014
�
�
“main” — 2014/7/16 — 19:15 — page 366 — #20�
�
�
�
�
�
366 MODEL BASED ON CLASSIFYING ITS STRATEGIC IMPACT FOR A COMPANY’S BUSINESS RESULTS
DM. Other methods can be used in the model, but the problem analysis demands a lot of infor-
mation and the method to be used should facilitate the analysis. During the process of assigningweights, the DM understood the importance of weights for the results and sought to determinethem in the most faithful way as to his preference structure At this point, the information that a
certain alternative, which was assigned a weight 2x , is twice as important as another alternative,with weight x , facilitated the assignment process. There was no great difficulty with the otherparameters of the methods used. The DM, in turn, always requested examples to understand the
meaning of each parameter for both PROMSORT, and for PROMETHEE.
For the case described in this study, the DM proved to be very interested in the benefits thatthe application could yield with regard to results. Furthermore, it was pointed out that the DMunderstood the concepts involved in applying the methods.
The results somewhat surprised the manager as to the performance of some suppliers. These
partners had an inferior performance when compared to the size of the share in outsourced ser-vices that they have. Thus, the DM stated that the results obtained will be used to draw up thecompany’s strategy, by increasing partnerships with those vendors with the best performance,
while seeking while seeking to negotiate improvements from those whose performance waslower than expected and to seek new suppliers to fill the gaps detected in this study.
In particular, the situation of the carrier CMT was the most critical one for the DM. This wasthe only carrier when the distribution center began operations but, over the years, it had been
losing share to other carriers that were emerging. In the past, CMT alone had transport for someregions, but the retailer is seeking to diversify the delivery destinations of the other hauliers toensure its stores are supplied, especially in periods of high demand.
7 CONCLUSIONS AND FURTHER RESEARCH
The retail market is characterized by the strong competition between the various entities. There-fore, companies are increasingly reducing their profit margins, thus offering products at a lowerprice to their customers. This trend requires the efficiency of the retailer’s supply chain to be
increased which requires a better relationship between the various agents in the supply chain.
Thus, it is important to consider how retailers select their suppliers. This paper proposed a modelto address the problem of supplier selection, taking into account the DM’s preferences. It con-siders the strategic role that the product or service offered plays in the success of a supply chain.
The proposed model can be adapted to companies from different sectors and is applicable to
both products and services. The model was applied to the distribution center of one of the largestretailers in Brazil.
With regard to the specific results of the selection of suppliers, the company should intensifyits relationship with the supplier ranked first by the analysis and seek improvements in perfor-
mance by the other suppliers. Thus, this tool can lead to guidelines for the relationship betweencompanies and their suppliers being produced.
Pesquisa Operacional, Vol. 34(2), 2014

�
�
“main” — 2014/7/16 — 19:15 — page 367 — #21�
�
�
�
�
�
THOMAS EDSON ESPINDOLA GONCALO and LUCIANA HAZIN ALENCAR 367
In this paper, a model for supplier selection in a real situation was applied. In this context, the
proposed model has been shown to be well suited to this case, providing an interesting toolfor decision support in that environment. It was also observed that the methods used can beapplied in real situations without the need for more resources, but rather all that is required
is greater interaction with the decision maker. The application of the PROMETHEE methodis given by software. Otherwise, the application of PROMSORT was undertaken without anysoftware support, but was nevertheless conducted quite satisfactorily.
As to suggestions for future studies, investigations should be made of how the distribution centre
could apply the proposed model to selecting suppliers of products and evaluating other serviceproviders it uses, ranging from those assessed as most critical to those with less impact, whererelevant. Furthermore, how the model could be extended to the stores should be examined as it
is the stores which are the points of interface between the company and the customer, and theyshould seek partnerships with various service providers.
More generally, further studies should explore how the model proposed can be applied to compa-nies in other sectors, not only the retail one, thus leading to the same benefits that were observed
to arise from compiling the model proposed in this study.
ACKNOWLEDGMENTS
This study is part of a research program funded by the Brazilian Research Council (CNPq).
REFERENCES
[1] ALENCAR LH & ALMEIDA AT. 2010. A model for selecting project team members using multicri-
teria group decision making. Pesqui. Oper., 30: 221–236.
[2] AGUEZZOU A & LADET P. 2007. A nonlinear multi-objective approach for the supplier selection,
integrating transportation policies. J. Model. Manag., 2: 157–169.
[3] ARAZ C & OZKARAHAN I. 2007. Supplier evaluation and management system for strategic sourcingbased on a new multicriteria sorting procedure. Int. J. of Prod Econ., 106: 585–606.
[4] BAI C & SARKIS J. 2007. Integrating sustainability into supplier selection with grey system and
rough set methodologies. Int. J. Prod. Econ., 124: 252–264.
[5] BANSAL M, KARIMI IA & SRINIVASAN R. 2007. Optimal Contract Selection for the Global Supply
and Distribution of Raw Materials. Ind. Eng. Chem. Res., 46: 6522–6539.
[6] BARKER T & ZABINSKY ZB. 2011. A multicriteria decision making model for reverse logisticsusing Analytical Hierarchy Process. Omega, 39: 558–573.
[7] BASNET C & WEINTRAUB A. 2009. A genetic algorithm for a bicriteria supplier selection problem.
Int. Trans. Oper. Res., 16: 173–187.
[8] BRANS JP & VINCKE P. 1985. A preference ranking organization method: The PROMETHEE
method. Manag. Sci., 31: 647–656.
[9] BRANS JP ET AL. 1998. Combining multicriteria decision aid and system dynamics for the controlof socio-economic processes: An iterative real-time procedure. Eur. J. Oper. Res., 109: 428–441.
Pesquisa Operacional, Vol. 34(2), 2014

�
�
“main” — 2014/7/16 — 19:15 — page 368 — #22�
�
�
�
�
�
368 MODEL BASED ON CLASSIFYING ITS STRATEGIC IMPACT FOR A COMPANY’S BUSINESS RESULTS
[10] CHAN F & CHAN HK. 2010. An AHP model for selection of suppliers in the fast changing fashion
market. Int. J. of Adv. Manuf. Technol., 51: 1195–1207.
[11] CHEN YM & HUANG P. 2007. Bi-negotiation integrated AHP in suppliers selection. Int. J. of Oper.
Prod. Manag., 27: 1254–1274.
[12] EL-SAWALHI N, EATON D & RUSTOM R. 2007. Contractor pre-qualification model: State-of-the-art. Int. J. of Proj Manag., 25: 465–474.
[13] FERNANDEZ E & NAVARRO J. 2011. A new approach to multi-criteria sorting based on fuzzy out-
ranking relations: The THESEUS method. Euro. J. of Oper. Res., 213: 405–413.
[14] GENCER C & GURPINAR D. 2007. Analytic network process in supplier selection: A case study in
an electronic firm. Appl. Math. Model, 31: 2475–2486.
[15] GOLMOHAMMADI D ET AL. 2009. Supplier Selection based on a Neural Network Model UsingGenetic Algorithm. Trans. on neural netw., 20: 1504–1519.
[16] GOMES LFAM, RANGEL LAD & LEAL JUNIOR MR. 2011. Treatment of uncertainty through theinterval smart/swing weighting method: a case study. Pesqui. Oper., 31(3): 467–485.
[17] HO W, XU X & DEY PK. 2010. Multi-criteria decision making approaches for supplier evaluation
and selection: a literature review. Eur. J. of Oper. Res., 202: 16–24.
[18] ISHIZAKA A. 2012. Clusters and pivots for evaluating a large number of alternatives in AHP. Pesqui.
Oper., 32: 87–101.
[19] KAHRAMAN C, CEBECI U & ULUKAN Z. 2003. Multi-criteria supplier selection using Fuzzy AHP.Logist Inf. Manag., 16: 382–394.
[20] KIRYTOPOULOS K, LEOPOULOS V & VOULGARIDOU D. 2008. Supplier selection in the pharma-
ceutical industry: An analytic network process approach. Benchmark: An. Int. J., 15: 494–516.
[21] MANSINI R, SAVELSBERG M & TOCCHELLA B. 2012. The supplier selection problem with quantitydiscounts and truckload shipping. Omega, 40: 445–455.
[22] ORDOOBADI SM. 2009. Application of Taguchi loss functions for supplier selection. Supply Chain
Manag: An. Int. J., 14: 22–30.
[23] OSMAN H & DEMIRLI K. 2010. A bilinear goal programming model and a modified Benders de-
composition algorithm for supply chain reconfiguration and supplier selection. Int. J. of Prod. Econ.,124: 97–105.
[24] NARASIMHAN R, TALLURI S & MAHAPATRA SK. 2006. Multiproduct, Multicriteria Model forSupplier Selection with Product Life-Cycle Considerations. Decis. Sci., 37: 577–603.
[25] PUNNIYAMOORTHY M, MATHIYALAGAN P & PARTHIBAN P. 2011. A strategic model using struc-
tural equation modeling and fuzzy logic in supplier selection. Expert Syst. with Appl., 38: 458–474.
[26] QIN H ET AL. 2012. The freight allocation problem with all-units quantity-based discount: A heuris-tic algorithm. Omega, 40: 415–423.
[27] RAMANATHAN R. 2007. Supplier selection problem: integrating DEA with the approaches of totalcost of ownership and AHP. Supply Chain Manag., 12: 258–261.
[28] SAEN RF. 2007. A new mathematical approach for suppliers selection: accounting for non-
homogeneity is important. Appl. Math. and Comput., 185: 84–95.
Pesquisa Operacional, Vol. 34(2), 2014

�
�
“main” — 2014/7/16 — 19:15 — page 369 — #23�
�
�
�
�
�
THOMAS EDSON ESPINDOLA GONCALO and LUCIANA HAZIN ALENCAR 369
[29] SAEN RF. 2010. Developing a new data envelopment analysis methodology for supplier selection
in the presence of both undesirable outputs and imprecise data. Int. J. Adv. Manuf. Technol., 51:1243–1250.
[30] SAWIK T. 2010. Single vs. multiple objective supplier selection in a make-to-order environment.Omega, 38: 203–212.
[31] SCHRAMM F & MORAIS DC. 2012. Decision support model for selecting and evaluating suppliers
in the construction industry. Pesqui. Oper., 32(3): 643–662.
[32] TING S & CHO D. 2008. An integrated approach for supplier selection and purchasing decisions.
Supply Chain Manag., 13: 116–127.
[33] VERDECHO M ET AL. 2012. A multi-criteria approach for managing inter-enterprise collaborativerelationships. Omega, 40: 249–263.
[34] VINCKE P. 1992. Multicriteria decision aid. John Wiley and Sons, New York.
[35] VINODH S, RAMIYA RA & GAUTHAM SG. 2011. Application of fuzzy analytic network processfor supplier selection in a manufacturing organization. Expert Syst. Appl., 38: 272–280.
[36] WU D ET AL. 2010. Fuzzy multi-objective programming for supplier selection and risk modeling:
A possibility approach. Eur. J. Oper. Res., 200: 774–787.
[37] YANG Z ET AL. 2008. An Applied Study on the Method for Supplier Selection with PCA and
ELECTRE. Serv. Oper. Logist Inf., 2151–2156.
Pesquisa Operacional, Vol. 34(2), 2014