Embed Size (px)
Citation preview
Extracorporeal Gas Exchange and Spontaneous Breathing for the Treatment of ARDS:
an Alternative to Mechanical Ventilation?
Thomas Langer, MD; Vittoria Vecchi, MD; Slava M. Belenkiy,
MD; Jeremy W. Cannon, MD; Kevin K. Chung, MD; Leopoldo C. Cancio, MD;
Luciano Gattinoni, MD, FRCP; Andriy I. Batchinsky, MD.
SUPPLEMENTAL DIGITAL CONTENT
The opinions or assertions contained herein are the private views of the authors, and are not to be construed
as official or as reflecting the views of the Department of the Army or the Department of Defense.
Langer et al., Online Supplement, page 2
ADDITIONAL METHODS
Sheep were housed under standard environmental conditions (air-conditioned room 20°C, 50 %
relative humidity) for at least 1 week prior to each study. Animals were fed standard chow and hay
and fasted for 24 hours with free access to water before the experiments.
Anesthesia, instrumentation and ECGE connection
Anesthesia was induced with an intramuscular injection of 6 mg/kg of tiletamine-zolazepam
(Telazol, Fort Dodge, IA ) and 0.01 mg/kg of buprenorphine hydrochloride (Buprenex, Reckitt
Benckiser, Richmond, VA ) followed by Isoflurane 2-4% delivered via mask. Subsequently, sheep
were orotracheally intubated in the prone position with an 8 mm ID endotracheal tube. A balloon
catheter (Ackrad Labs, Cooper Surgical, CT) was placed through a nostril in the lower part of the
esophagus and secured (E1). A Foley catheter (16 Ch) was placed transurethrally in the bladder.
Sheep were thereafter moved to the Computed Tomography (CT) room for chest image acquisition
(see below). Thereafter, sheep were instrumented in supine position. A tracheostomy was
performed (Shiley, Single Cannula Low Pressure Cuffed, 10 mm ID). Next, the right carotid artery
was surgically exposed and cannulated with a 5 Fr Catheter (Arrow International, Reading, PA).
Sheath introducers (8.5 Fr) (Arrow International, Inc., Reading, PA) were percutaneously placed
both in the right and left internal jugular veins. After a bolus (150 U/kg) of unfractionated heparin
(APP Pharmaceuticals, LCC Schamburg, IL) a bicaval dual-lumen catheter (Avalon®
, Maquet
Cardiopulmonary, Rastatt, Germany) was placed as previously described (E2) and connected to the
ECGE system which was primed with Lactated Ringer’s solution to avoid dilution related acid-base
alterations (E3).
Surgical incisions were infiltrated with bupivacaine 2% (Hospira, Lake Forest, IL). Animals
were then turned prone, moved to the metabolic cage and allowed to recover from anesthesia.
Mechanical ventilatory support (Evita XL, Dräger Medical, Lübeck, Germany) was progressively
Langer et al., Online Supplement, page 3
reduced. Sheep were kept on continuous positive airway pressure (CPAP) of 8 cmH2O with FiO2 of
0.5. Blood flowing through the membrane lung was actively heated at a constant temperature of
38°C (Medi-Therm II, Gaymar Industries, Pittsburgh, PA). Unfractionated heparin was infused as
needed to achieve an Activated Clotting Time (ACT) > 160 seconds (Hemochron Junior,
International Technidyne, Piscataway, NJ). Sedation and analgesia were performed with i.m.
buprenorphine 0.01 mg/kg (administered every 4-6 hours) and an infusion of 0.05-0.20 mg/kg/h of
midazolam (Hospira, Lake Forest, IL). For each sheep, at the beginning of the study, an appropriate
level of sedation was found. Thereafter the rate of infusion of midazolam was kept constant
throughout the study.
Management of sheep during the experiment
Lactated Ringer’s solution was infused at a rate of 200 ml/h during instrumentation and between
150-200 ml/h during the study. During ARDS induction (see below), boluses of 250 ml of lactated
Ringer’s (on average 750 ml) were administered to avoid hypotension and to assure an even
distribution of the acid (see below). Moreover, after the injury, the rate of lactated Ringer’s was
usually increased to 250-300 ml/min to avoid severe hypovolemia due to the massive plasma
leakage caused by oleic acid.
Pressure-Volume Curve measurement
At baseline, i.e. with healthy lungs, static inspiratory respiratory system and lung pressure-volume
(PV) curves were recorded and analyzed with a dedicated software (Pulmodyne, Hugo Sachs
Elektronics, March-Hugstetten, Germany). Deeply anesthetized, non paralyzed sheep, placed in the
prone position, were pre-oxygenated, shortly hyperventilated through a recruitment maneuver (20
breaths in Pressure-controlled mode with inspiratory pressure of 30 cmH2O, PEEP 0 cmH2O,
respiratory rate of 10 and a 1:1 ratio of inspiration to expiration) and disconnected from the
ventilator for complete expiration up to functional residual capacity (FRC). A glass syringe was
Langer et al., Online Supplement, page 4
connected to the endotracheal tube and room air was inflated in steps of 100 ml. Airway pressure
(Paw) and esophageal pressure (Pes) were recorded at the end of each step until Paw of ~40
cmH2O. Animals were then disconnected from the syringe to permit complete exhalation.
Thereafter mechanical ventilation was restarted.
Individual respiratory system and lung PV curves were constructed by plotting Paw
variations and transpulmonary (Paw-Pes) pressure variations versus the volume of inflated gas.
Individual curves were fitted with the most appropriate equation and a mean pressure-volume curve
of the whole study population was obtained averaging the volumes computed at pressure intervals
of 0.5 cmH2O using individual fittings as previously described (E4).
Measurements of esophageal pressure variations
During the study, at each sweep gas flow setting, a measurement of esophageal pressure variation
(∆Pes), (estimate of pleural pressure variation [∆Ppl]) was performed. The esophageal balloon,
previously introduced through a nostril (correct position checked on CT-scan) was inflated with 1
ml of air and connected to a differential pressure transducer (MPX, 399/2, Hugo Sachs Elektroniks,
March-Hugstetten, Germany). The waveform was recorded for 3 minutes and an average of 6
pressure variations was computed.
Cytokine measurement
Blood was drawn at baseline, right after induction of anesthesia and at the end of study before
anesthesia was induced again. Samples were anticoagulated with citrate 3.2% (Vacutainer, BD,
USA) and centrifuged at 3000 x g for 10 minutes at a controlled temperature of 4°C. Plasma was
collected, aliquoted, flash frozen and stored at -80 °C for subsequent analysis. Prior to analysis
samples were brought to room temperature. Plasma concentrations of IL-1 beta (MBS734810,
Mybiosource, San Diego, CA), TNF-alpha (MBS735607, Mybiosource, San Diego, CA) IL-6
(MBS738671, Mybiosource, San Diego, CA), IL-8 (MBS743903, Mybiosource, San Diego, CA)
Langer et al., Online Supplement, page 5
and IL-10 (MBS704435, Mybiosource, San Diego, CA) were measured with sheep specific
enzyme-linked immunosorbent assay (ELISA) kits.
Computed Tomography and lung quantitative analysis
CT scans (Toshiba Aquilion 64-slice Medical System, Tustin, CA) were acquired with the
following setting: tube current 60 mAs, voltage 120 kVp, pitch factor 0.85, collimation 0.5x32 mm,
rotation time 0.5 seconds. The entire lung was imaged. Images were reconstructed at 5 mm
thickness with an interval of 5 mm. Chest CT was performed at 0 and at 30 cmH2O of airway
pressure by clamping the endotracheal tube during an expiratory and inspiratory hold, respectively
(Servo 300, Siemens Elema, Solna, Sweden). Immediately before each CT scan acquisition a
recruitment maneuver was performed (20 breaths in Pressure-controlled mode with inspiratory
pressure of 30 cmH2O, PEEP 0 cmH2O, respiratory rate of 10 and a 1:1 ratio of inspiration to
expiration).
Lung images were analyzed with a dedicated image-analysis software (Maluna, Göttingen,
Germany), as previously described (E5). Briefly, lung boundaries were semi-automatically drawn
on each baseline image and manually drawn on each CT image acquired at the end of the study.
Hilar vessels and main bronchi were excluded from the analysis. The frequency distribution of CT
numbers (expressed in Hounsfield Units (HU)) was thereafter analyzed by the software and lung
compartments were quantified according to different degrees of aeration, applying usual thresholds
adopted in literature (E6). Non-aerated lung tissue (density between -100 and +200 HU); poorly-
aerated lung tissue (density between -101 and -500); normally-aerated lung tissue (density between
-501 and -900) and hyper-inflated lung tissue (density between -901 and -1000) were therefore
quantified.
The total lung volume was calculated as follows:
voxelofVolumevoxelsofNumbervolumeLung tot ][ Eq. 1
Langer et al., Online Supplement, page 6
Where “Lung volume [tot]” defines the total volume of the lung (expressed in milliliters), “Number
of voxels” represents the total number of voxels included in the regions of interest and “Volume of
voxel” represents the volume of the voxel (0.001953 ml).
The volumes of the differently aerated lung compartments (hyperinflated, normally aerated, poorly
aerated and non aerated) were computed similarly:
voxelofVolumevoxelsofNumbervolumeLung tcompartmentcompartmen ][][ Eq. 2
Where “Lung volume [compartment]” represents the volume of a specific compartment (expressed in
milliliters) and “Number of voxels [compartment]” represents the number of voxels included in the
considered compartment.
The total lung tissue mass (Lung weight) was calculated as follows:
10001][][
meantottot
CTvolumeLungmasstissueLung Eq. 3
Where “Lung tissue mass [tot]” represents the total mass of the lung (expressed in grams), “Lung
volume [tot]” represents the total lung volume (expressed in milliliters) (see Equation 1) and
“CTmean” represents the mean CT number of the whole lung (expressed in Hounsfield Units).
The mass of tissue of the four different lung compartments was computed as:
10001
][
][][
tcompartmenmean
tcompartmentcompartmen
CTvolumeLungmassTissue Eq. 4
Where “Tissue mass [compartment]” represents the mass of tissue of a specific compartment (expressed
in grams), “Lung volume [compartment]” represents the lung volume of the considered compartment
Langer et al., Online Supplement, page 7
(see Equation 2) and “CTmean [compartment]” represents the mean CT number of the considered
compartment (expressed in Hounsfield Units).
Calculation of physiological variables
The following equations were used for the computation of physiological variables.
Measurements of gas exchange across the membrane lung
Throughout the study, gas concentrations of CO2 entering and exiting the membrane lung were
analyzed (VMax Encore 29 system, VIASYS Healthcare Inc, Yorba Linda, CA). Sweep Gas Flow
(L/min) was set with a flowmeter/air-oxygen mixer (Model 3500 CP-G, Sechrist, Anaheim, CA);
FiO2 was set at 0.5 and kept constant throughout the study to allow accurate measurement of
extracorporeal CO2 (VMCO2) via indirect calorimetry (E7). The accuracy of the flowmeter was
periodically checked (S-110 Flo Meter, McMillan Co., Georgetown, TX, USA). The additional gas
outlet port of the respiratory membrane (HLS Module Advanced 7.0, Maquet, Cardiopulmonary
AG, Hirrlingen, Germany) was sealed in order to avoid gas leakage.
The amount of CO2 removed by the membrane lung (VMCO2) was calculated as reported in
equation 5 and expressed in ml/min.
VECOFCOF IE )(COV 222M Eq. 5
Where FECO2 and FICO2 are respectively the fractions of CO2 of the gas exiting and entering the
membrane (expressed as percentages), VE is the Gas Flow ventilating the membrane expressed at
standard temperature pressure dry (STPD) in L/min.
Langer et al., Online Supplement, page 8
Oxygen delivery through the membrane lung (VMO2) was computed as described in equation 6 and
expressed in ml/min.
BFCpreOCpostO )(OV 222M Eq. 6
Where CpostO2 represents the oxygen content of the blood exiting the membrane lung (see equation
7); CpreO2 represents the oxygen content of the blood entering the membrane lung (see equation 8)
and BF represents the blood flow through the membrane lung.
]003.0[39.1][ 222 PpostOSpostOHbCpostO
Eq. 7
Where [Hb] is concentration of hemoglobin expressed in g/dL, SpostO2 is the oxygen Saturation of
Hemoglobin in the blood exiting the membrane lung, PpostO2 is the partial pressure of oxygen in
the blood exiting the membrane lung.
]003.0[39.1][ 222 PpreOSpreOHbCpreO
Eq. 8
Where footnote pre defines blood entering the membrane lung.
Measurements of gas exchange across the native lung
The amount of CO2 removed by the native lung (VLCO2) was measured with the CO2SMO plus
(CO2SMO Model 8100, Novametrix Medical System Inc., Wallingford, CT) and expressed as
ml/min.
Langer et al., Online Supplement, page 9
The oxygen uptake through the native lung (VLO2) was calculated from the Fick equation as
described below:
10)(OV 222L CvOCaOQ Eq. 9
Where VLO2 is expressed in ml/min; represents cardiac output (L/min) measured via
thermodilution (Vigilance II, Edwards Life Science, Irvine, CA); CaO2 is the oxygen content of
arterial blood (see equation 10) , CvO2 is the oxygen content of mixed venous blood (see equation
11) and 10 is the factor to convert oxygen content from ml/dL to ml/L. Of note, for cardiac output
assessment (average of three consecutive measurements) BF pumped through the membrane lung
was temporarily set to 0 L/min in order to avoid overestimation by indicator loss into the
extracorporeal circuit (E8).
The oxygen content of arterial blood (CaO2) was computed as:
]003.0[39.1][ 222 PaOSaOHbCaO
Eq. 10
Where footnote a represents arterial blood.
The oxygen content of mixed venous blood (CvO2) was calculated as:
]003.0[39.1][ 222 PvOSvOHbCvO
Eq. 11
Where footnote v represents mixed venous blood.
Langer et al., Online Supplement, page 10
The total amount of removed CO2 was calculated as described in equation 12.
2L2M2TOT COVCOVCOV Eq.12
Where VTOTCO2 is the total amount of CO2 removed expressed in ml/min. VMCO2 is the amount of
CO2 removed by the membrane lung (as described in equation 6) and VLCO2 is the amount of CO2
removed by the native lung as measured by the CO2SMO.
Accordingly, the percentage amount of CO2 removed by the membrane lung (VMCO2 %) was
calculated as follows:
100
COV
COV%COV
2TOT
2M
2M Eq. 13
The total amount of oxygen uptake (VTOTO2) was calculated as:
2L2M2TOT OVOVOV Eq. 14
As VMO2 was not measured for every step (see Table E1), but did not change significantly between
different steps, an average was calculated for each sheep in each study phase and used for the
computation of VTOTO2.
Physiologic dead space fraction ( physVt
Vd) was calculated as reported in equation 15.
2
22
PaCO
PECOPaCOphys
Vt
Vd Eq. 15
Langer et al., Online Supplement, page 11
Where PaCO2 is the arterial partial pressure of carbon dioxide and PECO2 is the mixed expired
partial pressure of carbon dioxide measured with the CO2SMO (Novametrix Medical System Inc.,
Wallingford, CT). Physiologic dead space is expressed as a fraction of tidal volume.
Minute alveolar ventilation (Valv) was calculated as expressed in equation 16:
physVt
VdVV totalv 1 Eq. 16
Where Vtot is minute ventilation expressed in L/min measured by the ventilator (Evita XL, Dräger
Medical, Lübeck, Germany) and physVt
Vdis the physiologic dead space calculated as described in
equation 15.
Percentage decrease in minute ventilation (∆MV) was computed as:
100
controlVM
actualVMcontrolVMVM Eq. 17
Where MV control is the minute ventilation measured at 0 L/min of GF and MV actual is the
minute ventilation measured at the time point, i.e. with various amounts of VMCO2. The ∆MV is
expressed as percentage of control minute ventilation. Percentage decrease in alveolar ventilation
(∆Valv) was calculated similarly.
Pulmonary Shunt fraction ( s/ t) was calculated as described in equation 18.
22
22
CvOCcO
CaOCcO
Qt
sQ
Eq. 18
Langer et al., Online Supplement, page 12
Where CaO2 and CvO2 are the contents of oxygen for arterial and mixed venous blood (Equations
10 and 11) and CcO2 is the oxygen content of capillary blood, calculated as:
]003.0[139.1][ 22 PAOHbCcO
Eq. 19
Where PAO2 is the alveolar partial pressure of oxygen expressed in mmHg and calculated as:
RQ
PaCOPatmFiOPAO 2
22 )47( Eq. 20
Where Patm is the atmospheric pressure, 47 is water vapor pressure, PaCO2 is the partial pressure of
CO2 in arterial blood and RQ is the respiratory quotient as calculated in Equation 21.
2
2
OV
COVRQ
L
L
Eq. 21
Induction of ARDS
Buprenorphine 0.01 mg/kg was injected i.m. approximately 30 minutes before oleic acid injection;
FiO2 of inspiratory gas of the ventilator was increased to 1 and the infusion rate of Lactated
Ringer’s was increased to 1000 ml/h in order to favor the distribution of oleic acid (E9) and to avoid
the abrupt hypotension during the injury due to the pulmonary chemoreflex (E10, E11). Fifteen ml
of blood were withdrawn from the arterial line into a 20 ml syringe and heparinized with 300 U of
heparin. Oleic acid (0.1 ml/kg) (cis-9-Octadecenoic acid, Sigma-Aldrich) was added to the syringe
and emulsified by vigorous shaking (E12).The emulsion was thereafter injected through the
proximal port of the Swan-Ganz catheter into the right atrium in boluses of 2.5 ml. After each
injection the catheter was flushed with 15 ml of normal saline. The total amount of 20 ml was
injected over a period of 20-25 minutes. Blood flow of the ECGE was set at 0 L/min during the
injection of the emulsion to avoid the entrance of undiluted, highly concentrated oleic acid into the
membrane. If PaO2 did not drop below 200 mmHg while on FiO2 of 1 (with GF = 0 L/min) after 90
Langer et al., Online Supplement, page 13
minutes from the end of injection, time at which edema formation was shown to be complete (E13),
an additional dose of 0.05ml/kg was administered as described above. Measurements were started
once PaO2 dropped below 200 and 90 minutes had passed from the last oleic acid injection.
As oleic acid is known to bind to calcium and therefore reduce plasma calcium
concentration (E14), calcium was replaced with calcium chloride (0.5 g) in case ionized calcium
dropped below 0.95 mmol/L.
Statistical Analysis
Data are expressed as mean ± standard deviation unless otherwise specified.
Langer et al., Online Supplement, page 14
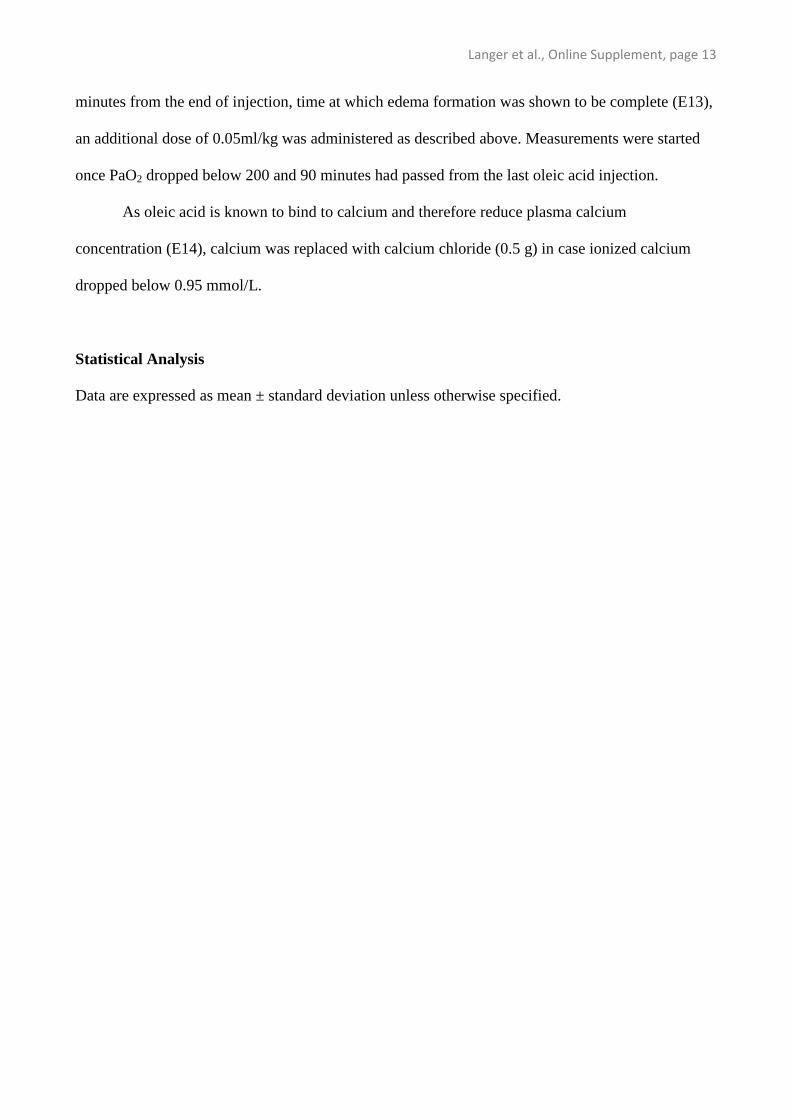
Time [Hours]
0 2 4 6 8 10 12 14 16 18 20 22
Surgical Preparation, CT, PV, Lab exams, Cytokines
Stabilization period
Study: “Healthy lungs”
ARDS induction
Study: “ARDS”
Study end: Lab exams, Cytokines, CT
ADDITIONAL FIGURES AND TABLES
Figure E1.
Figure E1. Schematic representation of the experimental timeline divided in the most relevant
study phases. For more details see the Materials and Methods section. Definition of abbreviations:
CT = Computed Tomography; PV = Pressure Volume Curve of the respiratory system; Lab exams
= collection of blood samples for laboratory examination; Cytokines = collection of plasma samples
for subsequent cytokine analysis.
Langer et al., Online Supplement, page 15
CT numbers [HU]
-1000 -800 -600 -400 -200 0 200
Fre
quency d
istr
ibution [%
]
0
10
20
30
40
Hyperinflate
d
Norm
ally
aera
ted
Poorly a
era
ted
Non a
era
ted
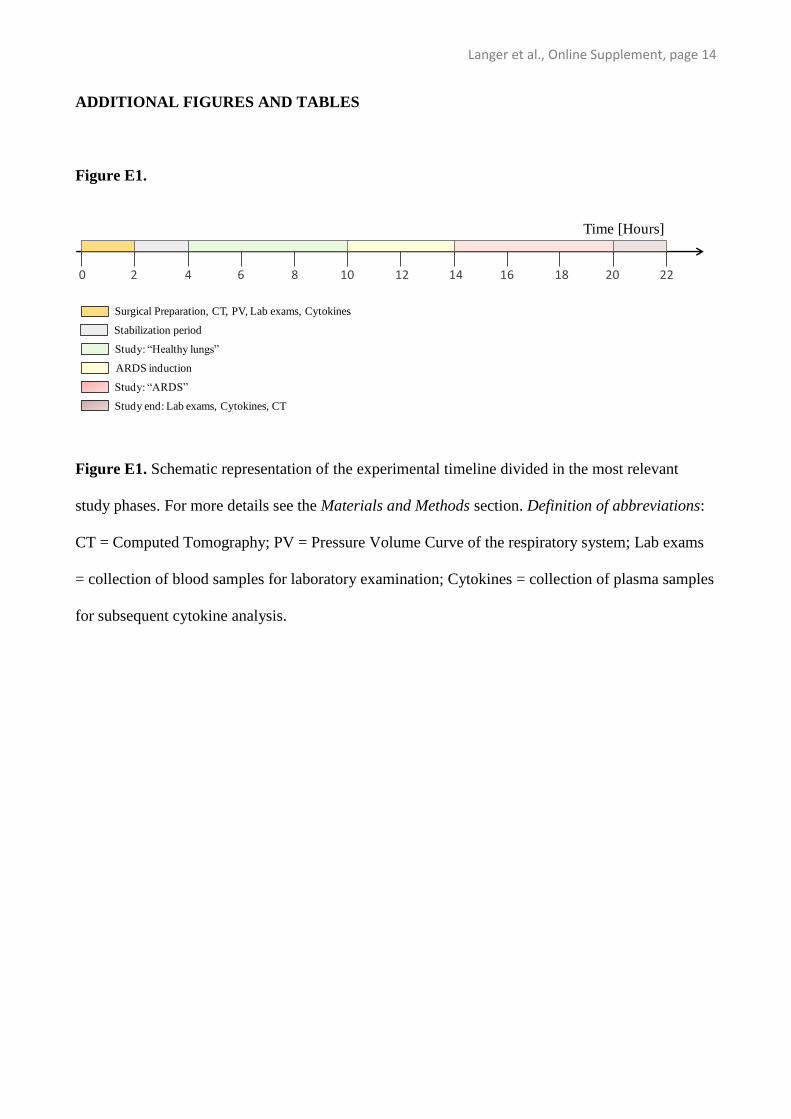
Figure E2
Figure E2. Mean frequency distribution of CT numbers of scans performed on healthy sheep
expressed as percentage of tissue mass and grouped into intervals of 50 HU. Data are presented as
mean ± standard deviation. Black bars represent results obtained at 0 cmH2O of airway pressure
(functional residual capacity), while gray bars represent results obtained during an inspiratory hold
performed at 30 cmH2O of airway pressure (considered close to total lung capacity). Vertical
dashed lines define different lung compartments as described in the “Computed Tomography and
lung quantitative analysis” section in the additional methods.
Langer et al., Online Supplement, page 16
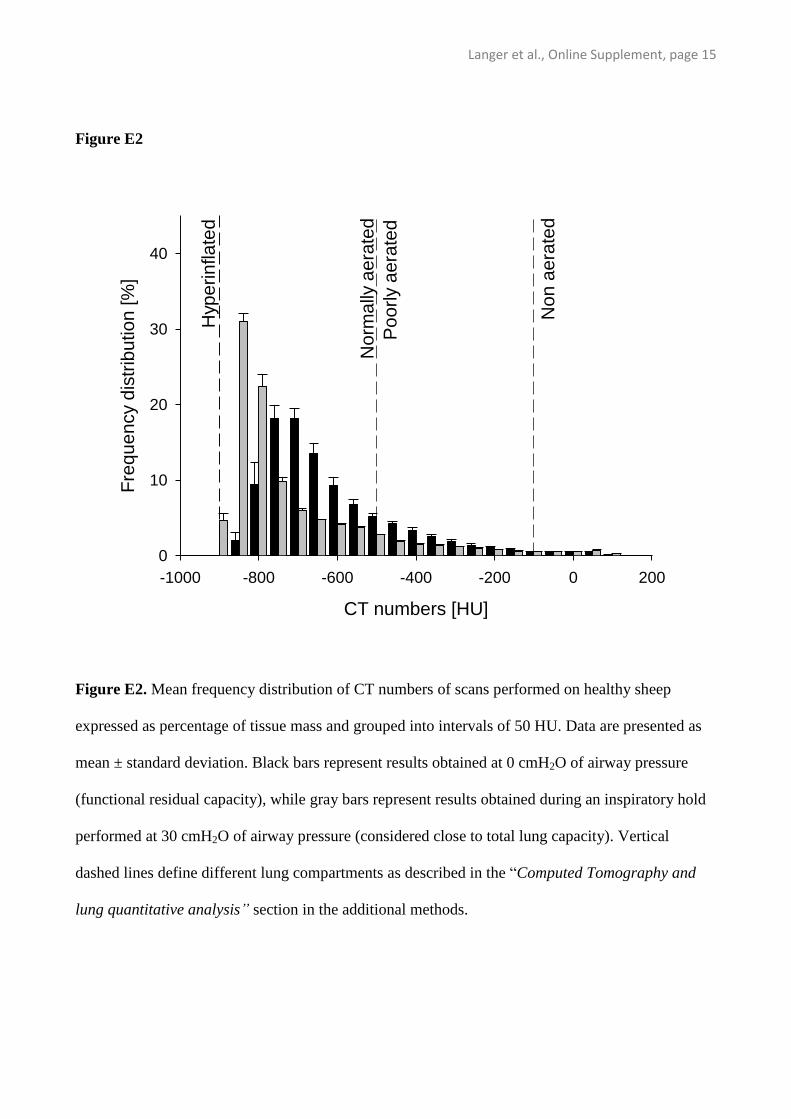
Figure E3
-1000 -800 -600 -400 -200 0 200
0
10
20
30
40
Fre
quency d
istr
ibu
tion [%
]
CT numbers [HU]
Hyperi
nflate
d
Norm
ally
aera
ted
Poorl
y a
era
ted
Non a
era
ted
Figure E3. Mean frequency distribution of CT numbers of scans performed on animals with ARDS
expressed as percentage of tissue mass and grouped into intervals of 50 HU. Data are presented as
mean ± standard deviation. Black bars represent results obtained at 0 cmH2O of airway pressure
(functional residual capacity), while gray bars represent results obtained during an inspiratory hold
performed at 30 cmH2O of airway pressure (considered close to total lung capacity). Vertical
dashed lines define different lung compartments as described in the “Computed Tomography and
lung quantitative analysis” section in the additional methods.
0 10 20 30 40 50
0
200
400
600
Esophageal Pressure Variation [cmH2O]
Tid
al V
olu
me
[m
L]
A
Esophageal Pressure Variation [cmH2O]
0 10 20 30 40 50
Tid
al V
olu
me
[m
L]
0
200
400
600
B
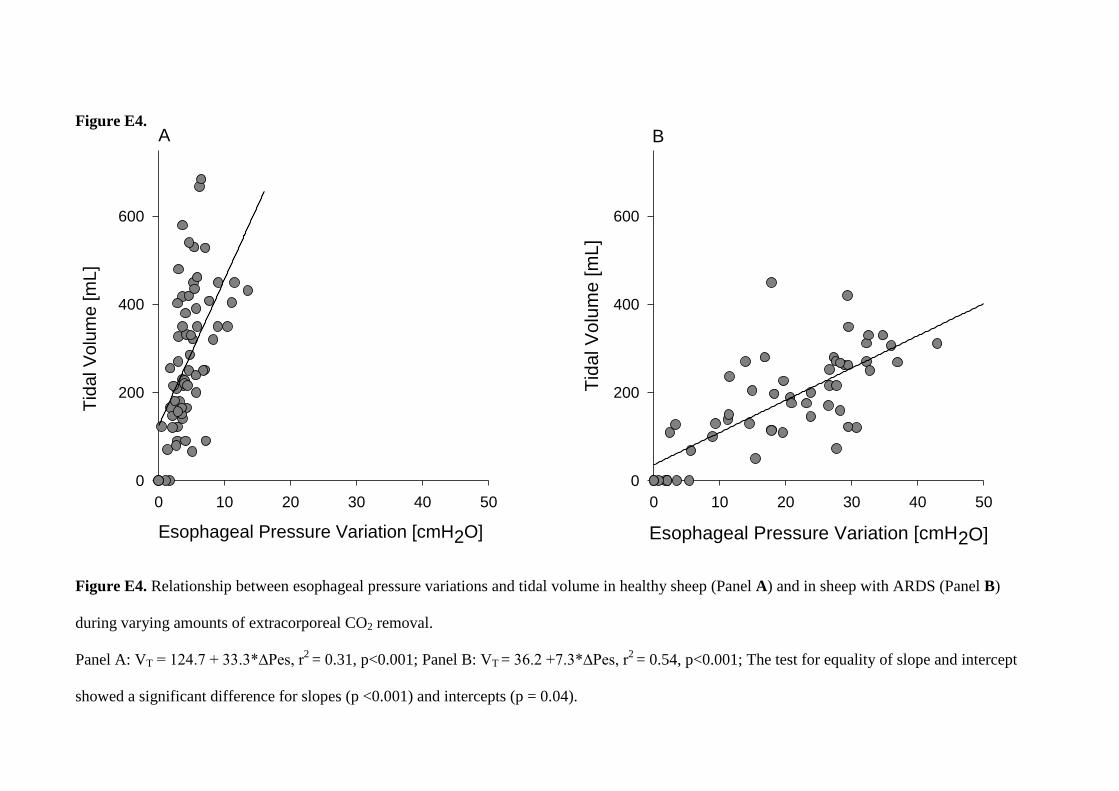
Figure E4.
Figure E4. Relationship between esophageal pressure variations and tidal volume in healthy sheep (Panel A) and in sheep with ARDS (Panel B)
during varying amounts of extracorporeal CO2 removal.
Panel A: VT = 124.7 + 33.3*∆Pes, r2
= 0.31, p<0.001; Panel B: VT = 36.2 +7.3*∆Pes, r2
= 0.54, p<0.001; The test for equality of slope and intercept
showed a significant difference for slopes (p <0.001) and intercepts (p = 0.04).
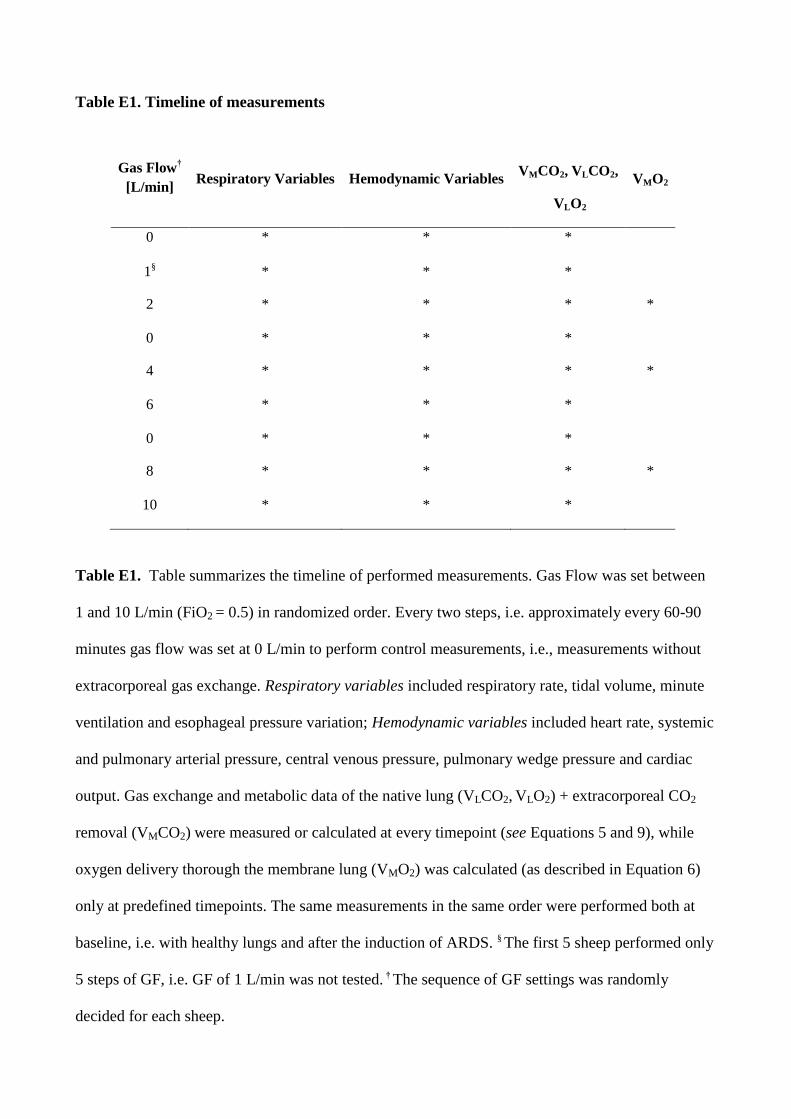
Table E1. Timeline of measurements
Gas Flow†
[L/min] Respiratory Variables Hemodynamic Variables
VMCO2, VLCO2,
VLO2
VMO2
0 * * *
1§ * * *
2 * * * *
0 * * *
4 * * * *
6 * * *
0 * * *
8 * * * *
10 * * *
Table E1. Table summarizes the timeline of performed measurements. Gas Flow was set between
1 and 10 L/min (FiO2 = 0.5) in randomized order. Every two steps, i.e. approximately every 60-90
minutes gas flow was set at 0 L/min to perform control measurements, i.e., measurements without
extracorporeal gas exchange. Respiratory variables included respiratory rate, tidal volume, minute
ventilation and esophageal pressure variation; Hemodynamic variables included heart rate, systemic
and pulmonary arterial pressure, central venous pressure, pulmonary wedge pressure and cardiac
output. Gas exchange and metabolic data of the native lung (VLCO2, VLO2) + extracorporeal CO2
removal (VMCO2) were measured or calculated at every timepoint (see Equations 5 and 9), while
oxygen delivery thorough the membrane lung (VMO2) was calculated (as described in Equation 6)
only at predefined timepoints. The same measurements in the same order were performed both at
baseline, i.e. with healthy lungs and after the induction of ARDS. § The first 5 sheep performed only
5 steps of GF, i.e. GF of 1 L/min was not tested. † The sequence of GF settings was randomly
decided for each sheep.
Langer et al., Online Supplement, page 19
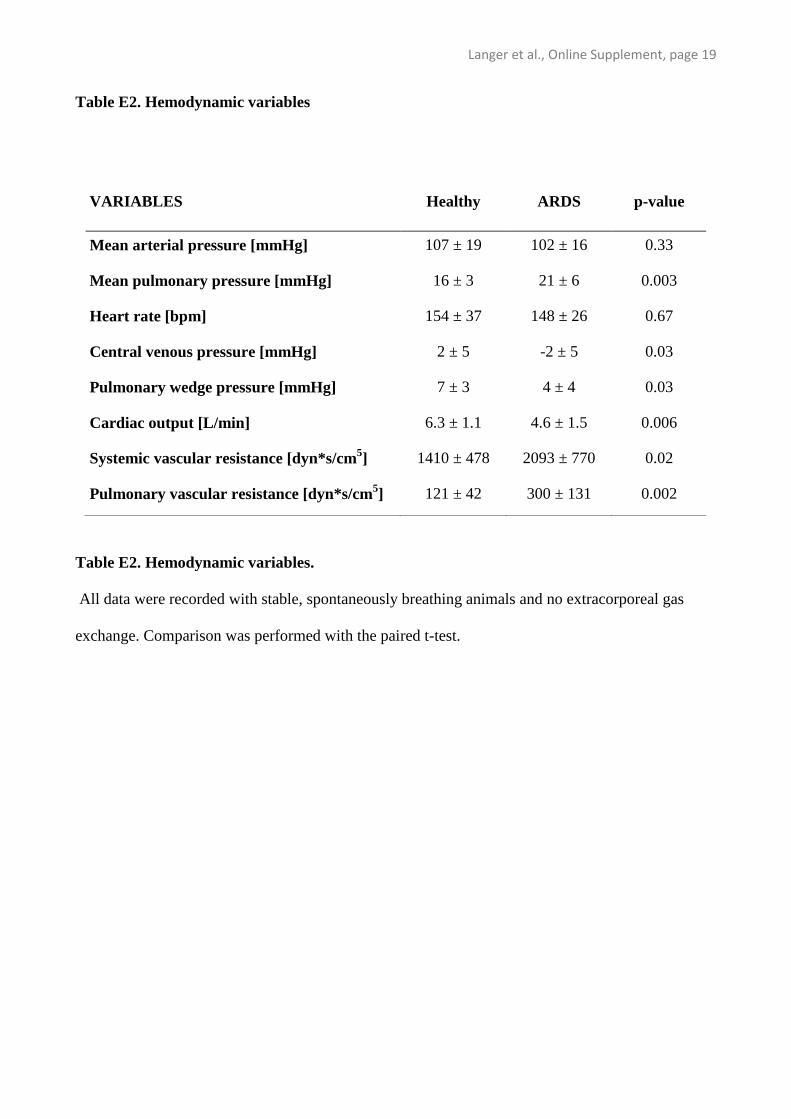
Table E2. Hemodynamic variables
Table E2. Hemodynamic variables.
All data were recorded with stable, spontaneously breathing animals and no extracorporeal gas
exchange. Comparison was performed with the paired t-test.
VARIABLES Healthy ARDS p-value
Mean arterial pressure [mmHg] 107 ± 19 102 ± 16 0.33
Mean pulmonary pressure [mmHg] 16 ± 3 21 ± 6 0.003
Heart rate [bpm] 154 ± 37 148 ± 26 0.67
Central venous pressure [mmHg] 2 ± 5 -2 ± 5 0.03
Pulmonary wedge pressure [mmHg] 7 ± 3 4 ± 4 0.03
Cardiac output [L/min] 6.3 ± 1.1 4.6 ± 1.5 0.006
Systemic vascular resistance [dyn*s/cm5] 1410 ± 478 2093 ± 770 0.02
Pulmonary vascular resistance [dyn*s/cm5] 121 ± 42 300 ± 131 0.002
Langer et al., Online Supplement, page 20
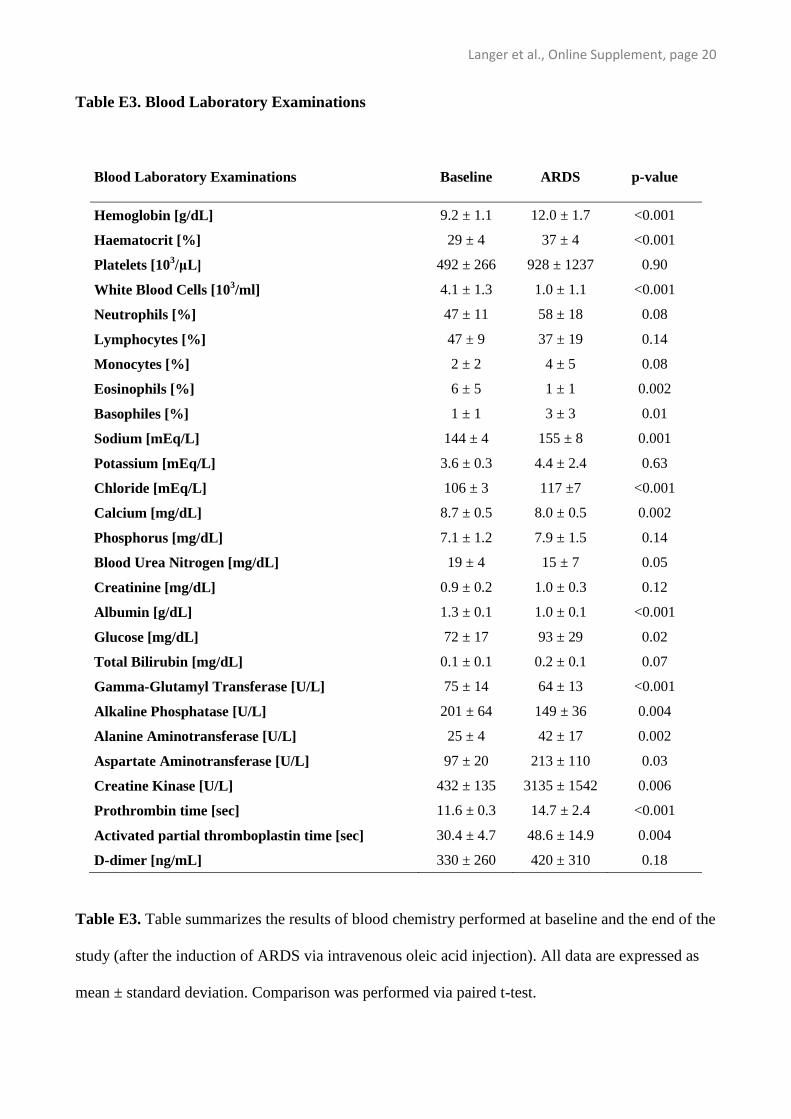
Table E3. Blood Laboratory Examinations
Table E3. Table summarizes the results of blood chemistry performed at baseline and the end of the
study (after the induction of ARDS via intravenous oleic acid injection). All data are expressed as
mean ± standard deviation. Comparison was performed via paired t-test.
Blood Laboratory Examinations Baseline ARDS p-value
Hemoglobin [g/dL] 9.2 ± 1.1 12.0 ± 1.7 <0.001
Haematocrit [%] 29 ± 4 37 ± 4 <0.001
Platelets [103/μL] 492 ± 266 928 ± 1237 0.90
White Blood Cells [103/ml] 4.1 ± 1.3 1.0 ± 1.1 <0.001
Neutrophils [%] 47 ± 11 58 ± 18 0.08
Lymphocytes [%] 47 ± 9 37 ± 19 0.14
Monocytes [%] 2 ± 2 4 ± 5 0.08
Eosinophils [%] 6 ± 5 1 ± 1 0.002
Basophiles [%] 1 ± 1 3 ± 3 0.01
Sodium [mEq/L] 144 ± 4 155 ± 8 0.001
Potassium [mEq/L] 3.6 ± 0.3 4.4 ± 2.4 0.63
Chloride [mEq/L] 106 ± 3 117 ±7 <0.001
Calcium [mg/dL] 8.7 ± 0.5 8.0 ± 0.5 0.002
Phosphorus [mg/dL] 7.1 ± 1.2 7.9 ± 1.5 0.14
Blood Urea Nitrogen [mg/dL] 19 ± 4 15 ± 7 0.05
Creatinine [mg/dL] 0.9 ± 0.2 1.0 ± 0.3 0.12
Albumin [g/dL] 1.3 ± 0.1 1.0 ± 0.1 <0.001
Glucose [mg/dL] 72 ± 17 93 ± 29 0.02
Total Bilirubin [mg/dL] 0.1 ± 0.1 0.2 ± 0.1 0.07
Gamma-Glutamyl Transferase [U/L] 75 ± 14 64 ± 13 <0.001
Alkaline Phosphatase [U/L] 201 ± 64 149 ± 36 0.004
Alanine Aminotransferase [U/L] 25 ± 4 42 ± 17 0.002
Aspartate Aminotransferase [U/L] 97 ± 20 213 ± 110 0.03
Creatine Kinase [U/L] 432 ± 135 3135 ± 1542 0.006
Prothrombin time [sec] 11.6 ± 0.3 14.7 ± 2.4 <0.001
Activated partial thromboplastin time [sec] 30.4 ± 4.7 48.6 ± 14.9 0.004
D-dimer [ng/mL] 330 ± 260 420 ± 310 0.18
Langer et al., Online Supplement, page 21
ADDITIONAL REFERENCES
E1. Abraham WM, Watson H, Schneider A, et al: Noninvasive ventilatory monitoring by
respiratory inductive plethysmography in conscious sheep. J Appl Physiol 1981; 51:1657-
1661.
E2. Langer T, Vecchi V, Belenkiy SM, et al: Pressure-guided positioning of bicaval dual-lumen
catheters for venovenous extracorporeal gas exchange. Intensive Care Med 2013; 39:151-154.
E3. Langer T, Carlesso E, Protti A, et al: In vivo conditioning of acid-base equilibrium by
crystalloid solutions: an experimental study on pigs. Intensive Care Med 2012; 38:686-693.
E4. Protti A, Cressoni M, Santini A, et al: Lung stress and strain during mechanical ventilation:
any safe threshold? Am J Respir Crit Care Med 2011; 183:1354-1362.
E5. Rouby JJ, Puybasset L, Nieszkowska A, et al: Acute respiratory distress syndrome: lessons
from computed tomography of the whole lung. Crit Care Med 2003; 31:S285-S295.
E6. Gattinoni L, Caironi P, Pelosi P, et al: What has computed tomography taught us about the
acute respiratory distress syndrome? Am J Respir Crit Care Med 2001; 164:1701-1711.
E7. Shanbhogue LK, Vernooij JE, Molenaar JC, et al: Gas exchange across native lungs and
extracorporeal membrane in neonates and pigs during extracorporeal membrane oxygenation.
J Pediatr Surg 1994; 29:1016-1019.
E8. Haller M, Zollner C, Manert W, et al: Thermodilution cardiac output may be incorrect in
patients on venovenous extracorporeal lung assist. Am J Respir Crit Care Med 1995;
152:1812-1817.
Langer et al., Online Supplement, page 22
E9. Trawoger R, Cereda M, Kolobow T: A standardized method of oleic acid infusion in
experimental acute respiratory failure. Scand J Clin Lab Invest 2001; 61:75-81.
E10. Coleridge HM, Coleridge JC, Green JF, et al: Pulmonary C-fiber stimulation by capsaicin
evokes reflex cholinergic bronchial vasodilation in sheep. J Appl Physiol 1992; 72:770-778.
E11. Kubin L, Alheid GF, Zuperku EJ, et al: Central pathways of pulmonary and lower airway
vagal afferents. J Appl Physiol 2006; 101:618-627.
E12. Hirschl RB, Parent A, Tooley R, et al: Liquid ventilation improves pulmonary function, gas
exchange, and lung injury in a model of respiratory failure. Ann Surg 1995; 221:79-88.
E13. Quintel M, Pelosi P, Caironi P, et al: An increase of abdominal pressure increases pulmonary
edema in oleic acid-induced lung injury. Am J Respir Crit Care Med 2004; 169:534-541.
E14. Gemer M, Dunegan LJ, Lehr JL, et al: Pulmonary insufficiency induced by oleic acid in the
sheep: a model for investigation of extracorporeal oxygenation. J Thorac Cardiovasc Surg
1975; 69:793-799.