Embed Size (px)
Citation preview
Divergence Trading
Workshop
Day One
presented by
Thomas Wood | MicroQuantSM
Divergence and Momentum Trading
Risk Disclaimer
Trading or investing carries a high level of risk, and is not suitable for all persons. Before deciding to trade or invest you should carefully consider your investment objectives, level of experience, and ability to tolerate risk. This content is subject to change at any time without notice, and is provided for the sole purpose of education and assistance in making independent investment decisions. ValueCharts.com has taken reasonable measures to ensure the accuracy of the information contained herein; however, ValueCharts.com does not guarantee its accuracy and is not liable for any loss or damage which may result directly or indirectly from such content or from an inability to access such information or any delay in or failure of the transmission or the receipt of any instruction or notification in connection therewith. Any past performance results are shown for illustration and example only, are hypothetical and as such have many inherent limitations. No representation is being made that any account will or is likely to achieve profits or losses similar to those shown. Past performance is not necessarily indicative of future results.
CFTC Rule 4.41 (Hypothetical Disclaimer)
U.S. Government Required Disclaimer - Commodity Futures Trading Commission Futures and Options trading has large potential rewards, but also large potential risk. You must be aware of the risks and be willing to accept them in order to invest in the futures and options markets. Don't trade with money you can't afford to lose. This is neither a solicitation nor an offer to Buy/Sell futures, stocks or options on the same. No representation is being made that any account will or is likely to achieve profits or losses similar to those discussed on this web site. The past performance of any trading system or methodology is not necessarily indicative of future results.
CFTC RULE 4.41 - HYPOTHETICAL OR SIMULATED PERFORMANCE RESULTS HAVE CERTAIN LIMITATIONS. UNLIKE AN ACTUAL PERFORMANCE RECORD, SIMULATED RESULTS DO NOT REPRESENT ACTUAL TRADING. ALSO, SINCE THE TRADES HAVE NOT BEEN EXECUTED, THE RESULTS MAY HAVE UNDER-OR-OVER COMPENSATED FOR THE IMPACT, IF ANY, OF CERTAIN MARKET FACTORS, SUCH AS LACK OF LIQUIDITY. SIMULATED TRADING PROGRAMS IN GENERAL ARE ALSO SUBJECT TO THE FACT THAT THEY ARE DESIGNED WITH THE BENEFIT OF HINDSIGHT. NO REPRESENTATION IS BEING MADE THAT ANY ACCOUNT WILL OR IS LIKELY TO ACHIEVE PROFIT OR LOSSES SIMILAR TO THOSE SHOWN.
NO REPRESENTATION IS BEING MADE THAT ANY ACCOUNT WILL, OR IS LIKELY TO ACHIEVE PROFITS OR LOSSES SIMILAR TO THOSE DISCUSSED WITHIN THIS SITE, SUPPORT AND TEXTS. OUR COURSE(S), PRODUCTS AND SERVICES SHOULD BE USED AS LEARNING AIDS ONLY AND SHOULD NOT BE USED TO INVEST REAL MONEY. IF YOU DECIDE TO INVEST REAL MONEY, ALL TRADING DECISIONS SHOULD BE YOUR OWN.
Workshop Outline
• Psychology of Trading – Getting Your Mind Right • Reading Overall Market Momentum Using MQ
Momentum and MACD • Intro to Divergences • The Four Types of Divergences and What Has the
Best Probability of Success • How to Enter Divergences to Maximize Success • Understanding a Trend Reversal vs. Consolidation • Momentum Based Trade Setups

Psychology of Trading – Getting Your
Mind Right
Psychology of Trading
• Lack of Trading Awareness – Why Are You Losing When Trading?
• Not Treating Your Trading Account Objectively – Risk Averse with Winning Trades, Risk Seeking on Losing Trades
• Becoming Emotional About Wins and Losses • Fear of Losing • Becoming Addicted to the Anticipation of Success • The Desire/Need to Be Right on Your Trade • Lack of Consistency – Never Sticking to a System
Psychology of Trading
• Overconfidence leads to too much risk, which leads to loosening
up rules, leads to not following plan, leads to greed, which leads to
losing money.
• Greed leads to denial, dismissing losses and a “I’ll make that back
on the next one attitude”
• Denial leads to Revenge/Catch up trading, which leads to a lack of
confidence in yourself and your system, which leads to more
aggressive trading to make up for losses.
• EVERY TRADE SHOULD STAND ON IT’S OWN!
Psychology of Trading
• Not Treating Your Trading Account Objectively – Risk Averse with Winning Trades, Risk Seeking on Losing Trades • You take 100% of your losers (Market Hits Stop) but you only
take a piece of your winners (Scared it is going to move against you)
• Know how far you are expecting a market to move. Once you know how far a market should move, you should know when a market is just making noise and when it is potentially reversing.
• People go from being very successful trading simulated, to losing money live and they cannot figure out why. Emotions, or not trading objectively, is normally the cause.
Psychology of Trading
• Fear of Losing and the Desire to be Right
• You need to understand that no trading plan is right 100%
of the time. Once you accept this as fact, you can move on
to treating your strategy as probabilities.
• We all want to be correct with our analysis, but one of the
biggest things that cause failure is traders not admitting
when they are wrong. Go back and look at all historical
signals you can find for a specific strategy, how did the
really good ones work out? Most will have moved
immediately.
Psychology of Trading
• Allowing Emotions to Come Into Your Trading
• Becoming Addicted to Dopamine – Studies show that
almost winning causes more dopamine to be released than
winning does, over time*
• Are you subconsciously addicted to “almost winning?” This
is why casinos make so much money even though people
normally lose. Never worry about “I could have made
this!” Each trade should be taken on its own credibility
*http://www.findcasinobonus.com/blog/2013/10/30/rat-casino-studies-link-addiction-to-dopamine/
Psychology of Trading
• Lack of Trading Awareness
• Create a Trading Plan – Should include: Markets
Traded, Position Sizing, Entry Logic, Exit Logic, Stop
Placement
• Keep a Trade Log: Should have a record of why a
trade was placed (what setup), when you entered,
where you stop was, time of day you entered and
time of day you exited.
Psychology of Trading
• Not Having Discipline and Consistency
• One thing that causes traders to fail is lack of
discipline and not sticking to a system. They create
a trading plan, then change it a week later because
it did not make money. All trading plans are going
to have periods of drawdown.
• Once you understand that nothing works 100% of
the time, it is easier to stick to a strategy for a long
period of time.

Questions on Psychology of Trading?

Reading Market Momentum with MQ
Momentum and MACD
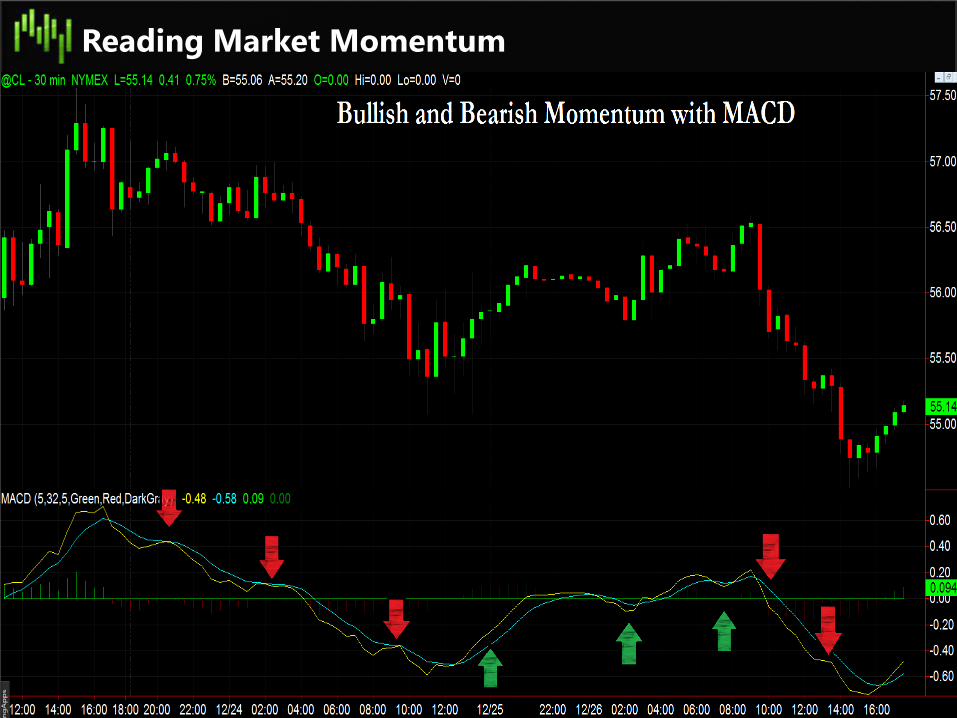
Reading Market Momentum
• The MQ Momentum and MACD indicator are designed very similarly, although the algorithms are completely different
• They both have a “fast line” and a “slow line” as well as a “histogram”
• The histogram displays the spread between the fast and slow indicator lines
• When you are reading momentum, you are watching the fast line and the histogram equally
• The slow line can be used to confirm, but is not always needed
Reading Market Momentum
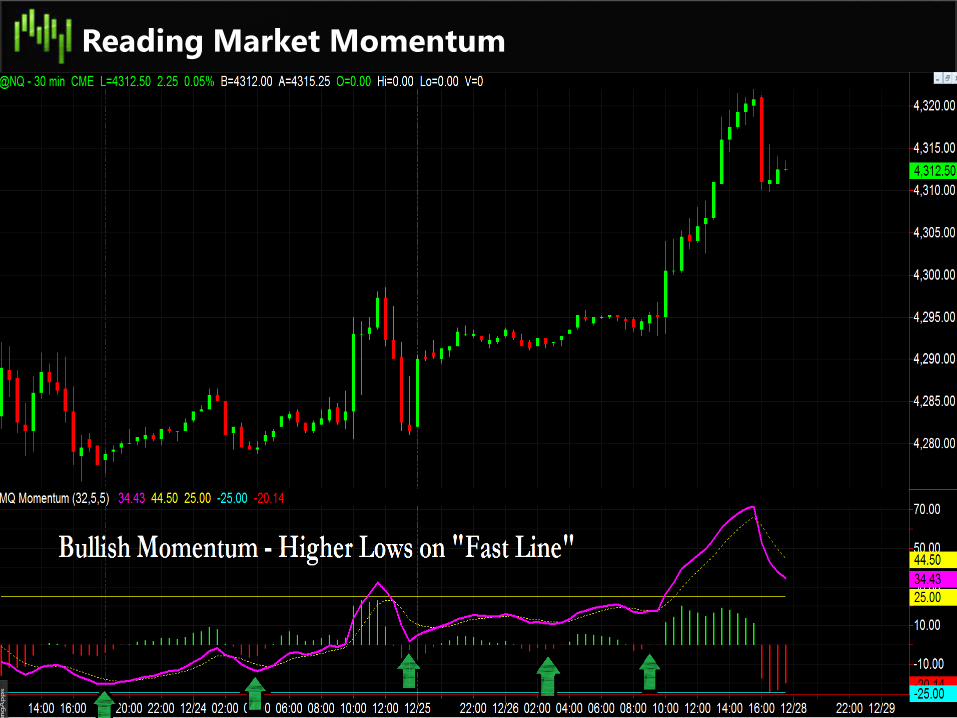
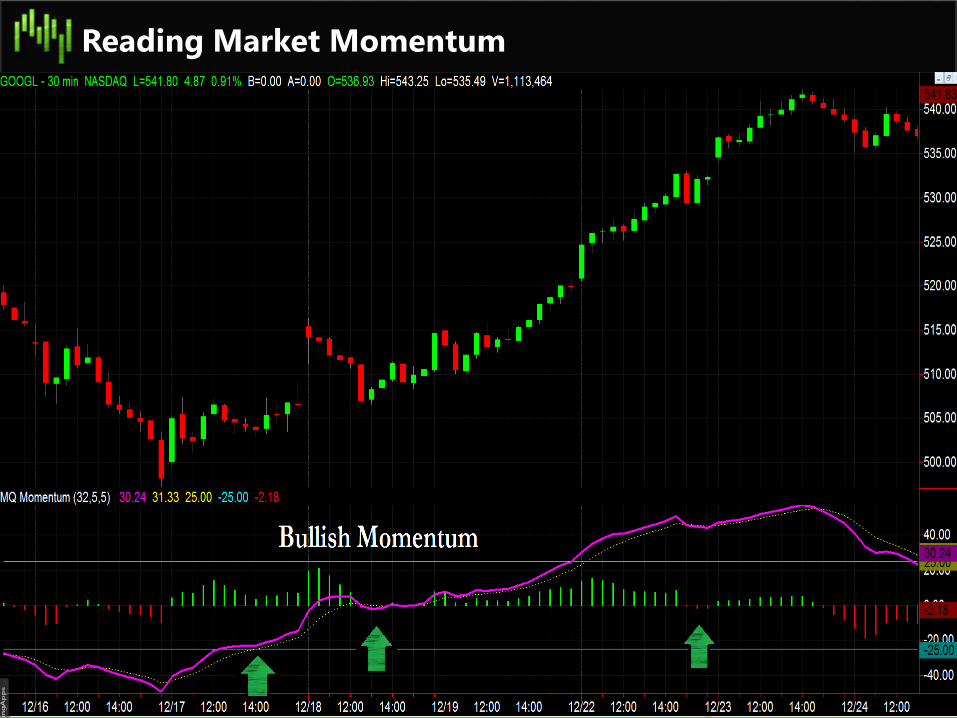
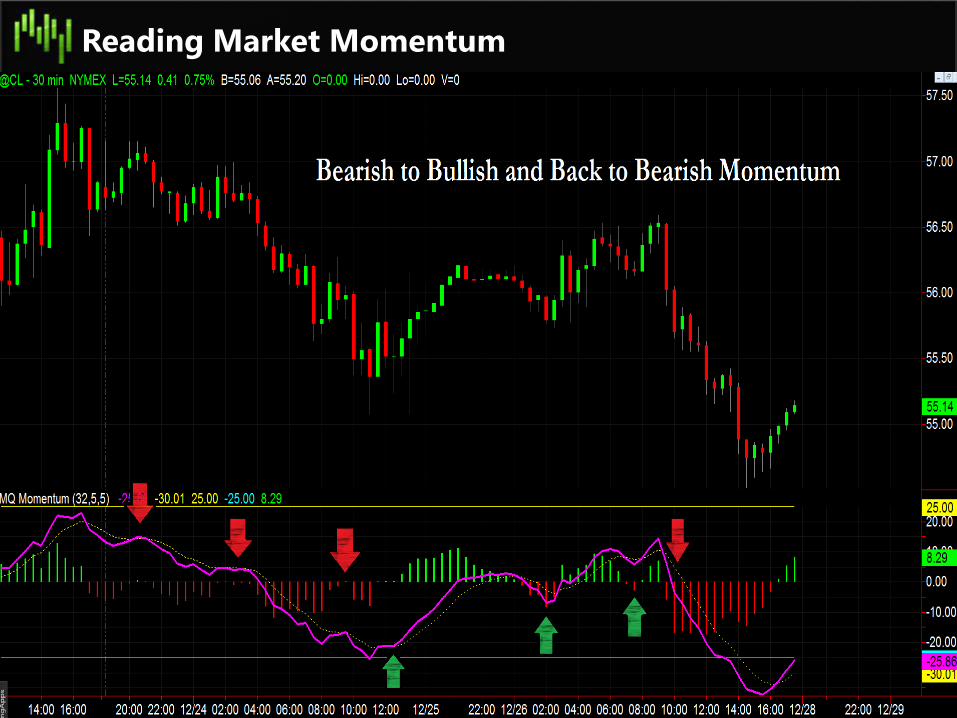
• When you are looking for overall market direction, watch for the trend of the fast line on the indicator. Then look at the histogram levels and see the strength of the “counter trend moves”
• Of you are putting in lower highs lower lows on the indicator line, then momentum is weak
• If you are putting in higher high higher lows on the indicator line, then momentum is strong
Reading Market Momentum
• If momentum is bullish, watch for the “down histogram sections” are those lows lower than the previous lows? If not, then momentum is still bullish
• If momentum is bearish, watch for the “up histogram sections” are these highs higher than the previous highs? If not, then momentum is still bearish
Reading Market Momentum
• Normally I will look for a previous swing high or swing low to place my stop above/below
• If the previous swing high on your time based chart is too far away, find one on a shorter timeframe that is closer
• This previous high/low is a resistance level that the market would have to break through to hit your stop

Questions on Reading Market
Momentum?
Intro to Divergences – What is a
Divergence?
Intro to Divergences
•Divergences are used for a number of different trading strategies.
•Used to identify and enter tops or bottoms of markets •Used to know when to close an open position •Used to know when markets are entering consolidation •Used to confirm a breakout trade •Confirming tool for double tops/double bottoms
Intro to Divergences
•Divergences occur on all market types (FOREX, Futures, Equities) •Divergences can be used on any timeframe
Intro to Divergences
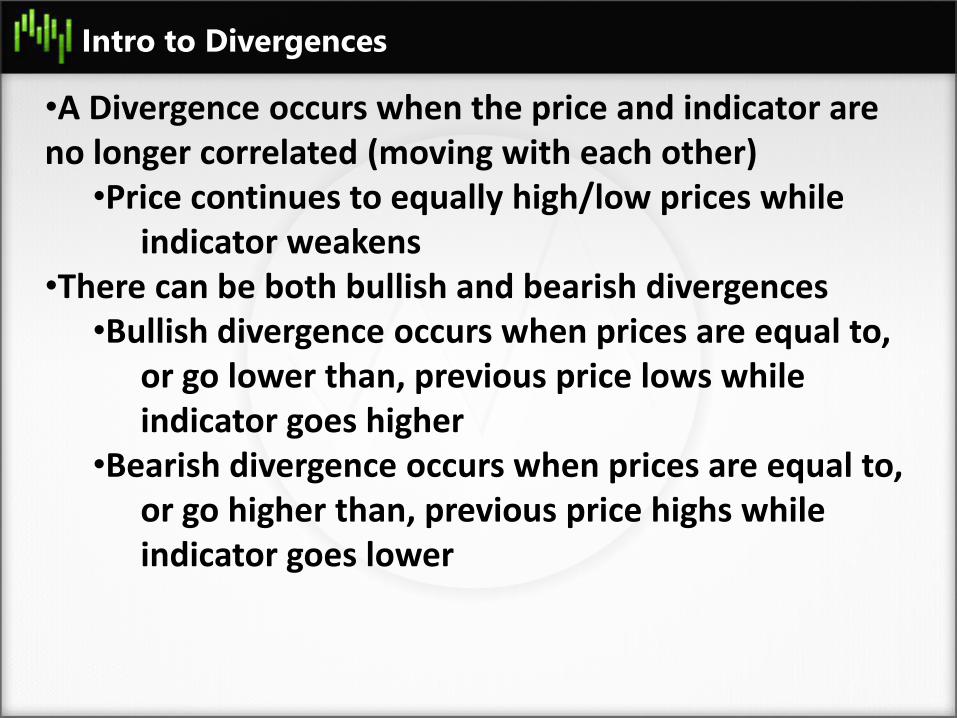
•A Divergence occurs when the price and indicator are no longer correlated (moving with each other)
•Price continues to equally high/low prices while indicator weakens
•There can be both bullish and bearish divergences •Bullish divergence occurs when prices are equal to, or go lower than, previous price lows while indicator goes higher •Bearish divergence occurs when prices are equal to, or go higher than, previous price highs while indicator goes lower
Intro to Divergences
•What is a divergence telling us? •Just because you have a divergence, it does not mean that the market is going to reverse trend •Divergences show us when a market is trying to push to new highs or lows, without the momentum the original move had •When a divergence occurs, we are essentially seeing the last “hoorah” that a market makes before taking a breather or reversing
Intro to Divergences
•What indicators can you use to see divergences?
•You can use most momentum oscillators. •My favorite are MQ Momentum and MACD. •You can use ValueCharts for value divergences •You can use stochastics for divergences
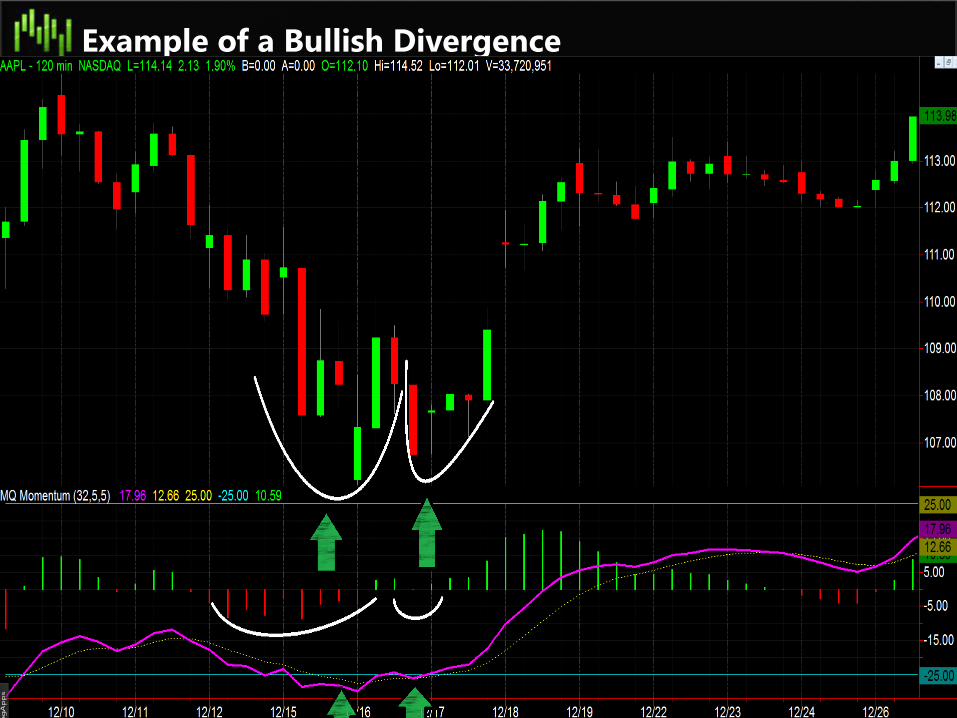
Example of a Bullish Divergence
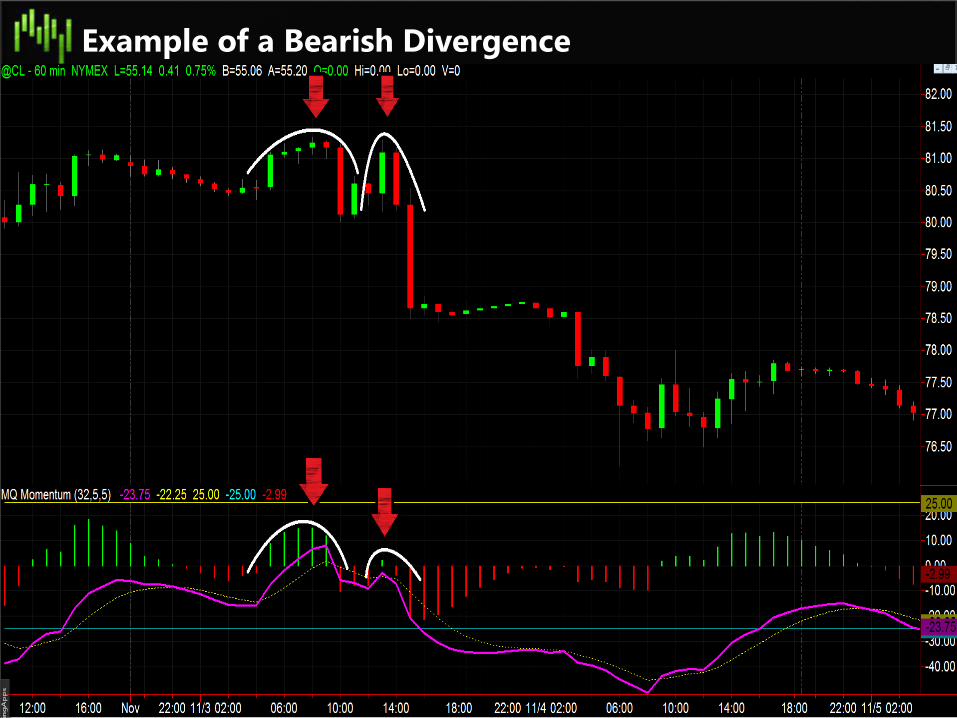
Example of a Bearish Divergence
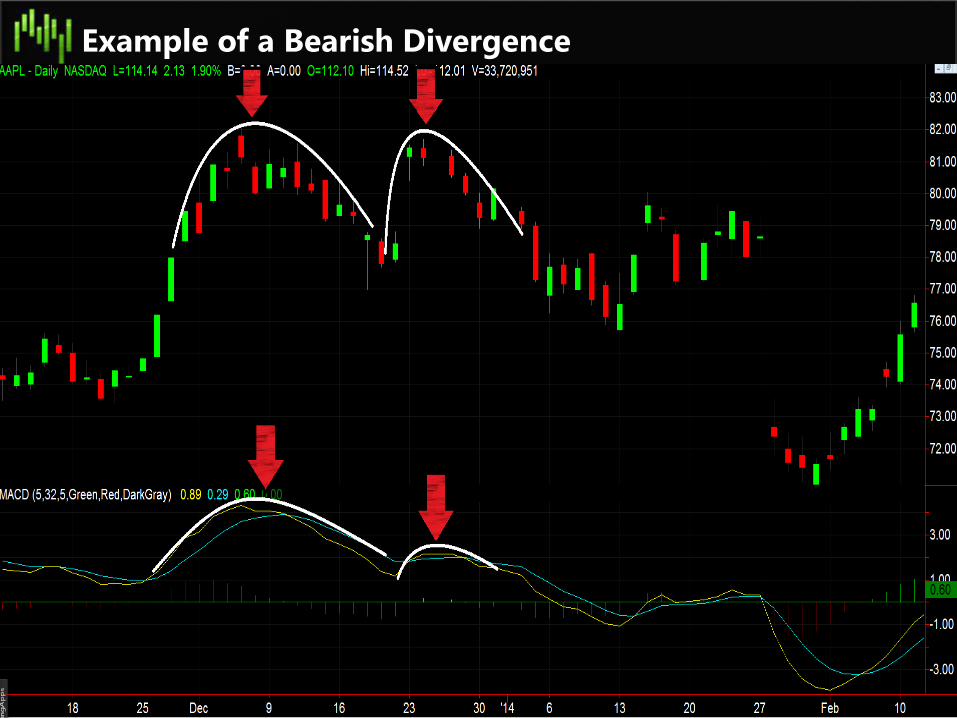
Example of a Bearish Divergence

Questions on Intro to Divergences?

The Four Types of Divergences and
What Has the Highest Probability of
Success
Four Types of Divergences
• There are four major types of divergences that we trade
• Each type of divergence has both advantages and disadvantages
• Some types of divergences give a higher success rate than others
Four Types of Divergences
• Histogram Divergence
• Connected Divergence
• Broken Divergence
• No Return Divergence
Four Types of Divergences
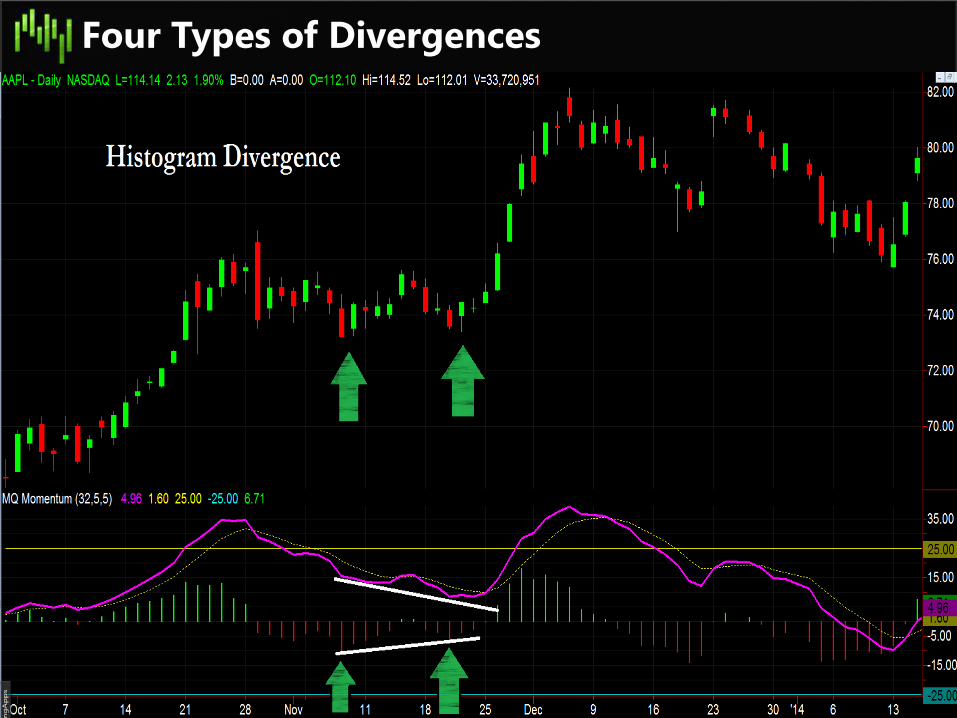
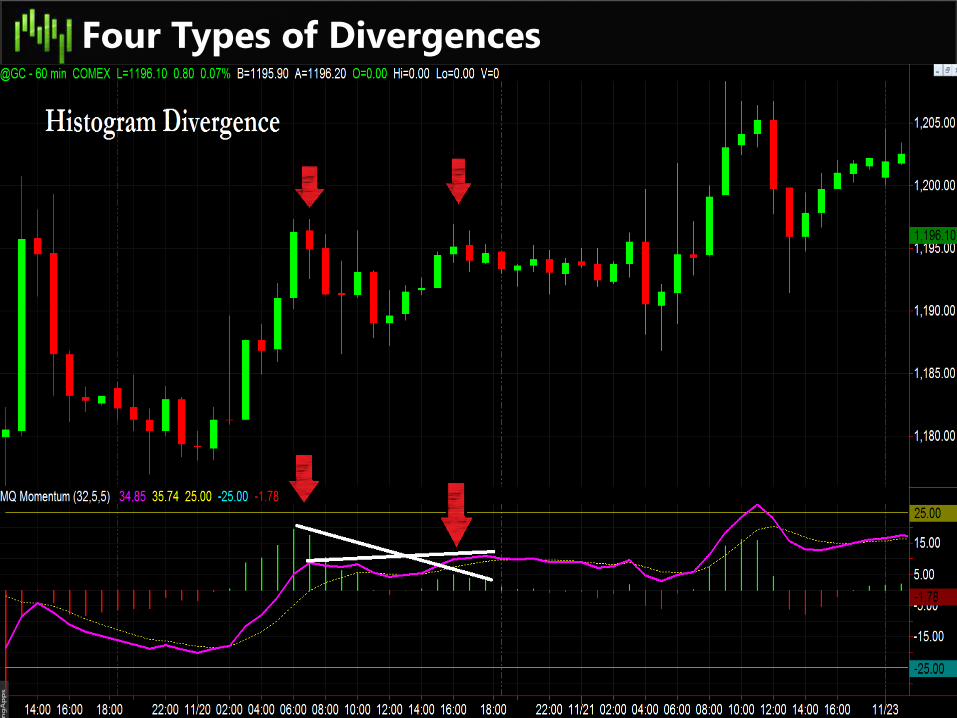
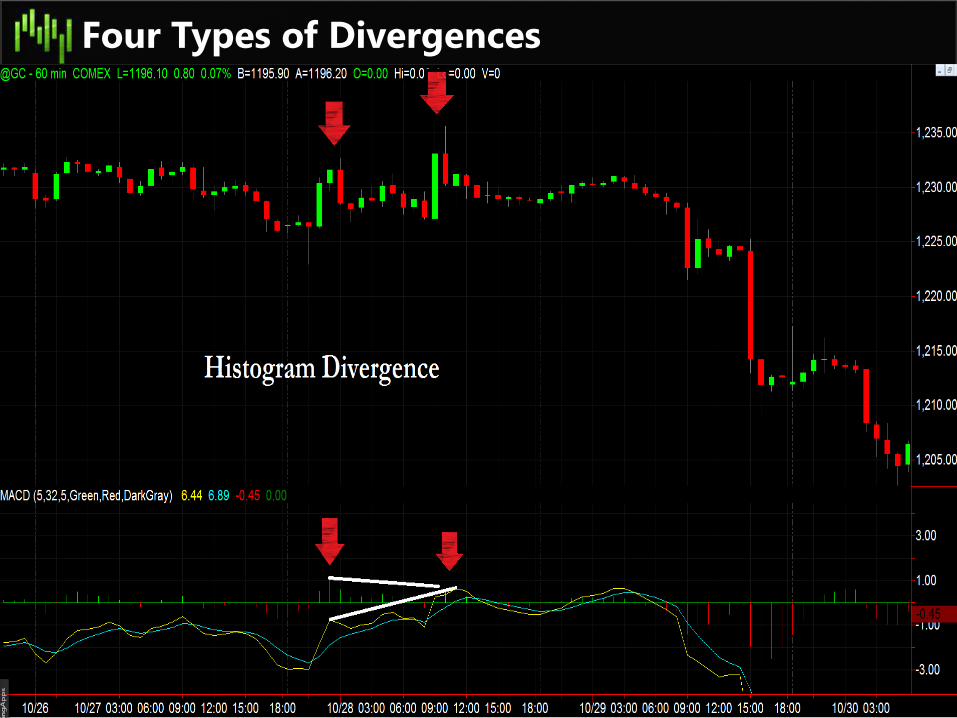
• Histogram Divergence – Divergence Where Histogram alone is weaker or
stronger
– A Histogram Divergence has the lowest probability of success, but occurs quite often
– The indicator line does not agree with the divergence for a histogram divergence
– Normally does not signify a trend reversal, but a consolidation period
Four Types of Divergences
• A Pennant Pattern is formed when the range of a market becomes narrower and narrower
• You trade the breakout of a pennant the same way you would a consolidation breakout. The Trender should confirm the move within 2-3 price bars
Four Types of Divergences
• A Pennant Pattern is formed when the range of a market becomes narrower and narrower
• You trade the breakout of a pennant the same way you would a consolidation breakout. The Trender should confirm the move within 2-3 price bars
Four Types of Divergences
• A Pennant Pattern is formed when the range of a market becomes narrower and narrower
• You trade the breakout of a pennant the same way you would a consolidation breakout. The Trender should confirm the move within 2-3 price bars
Four Types of Divergences
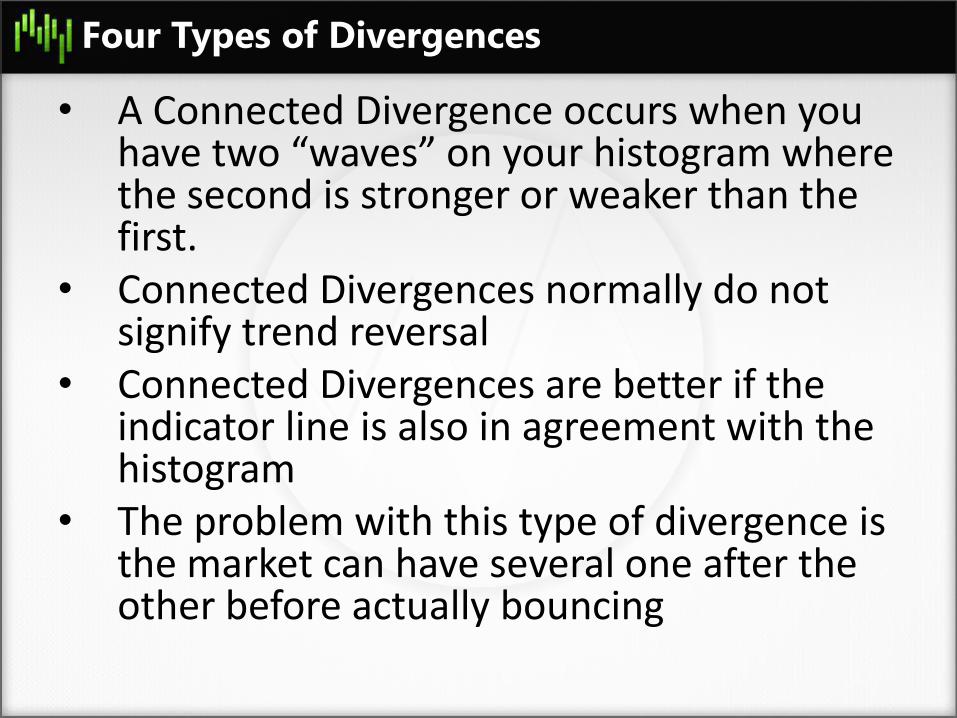
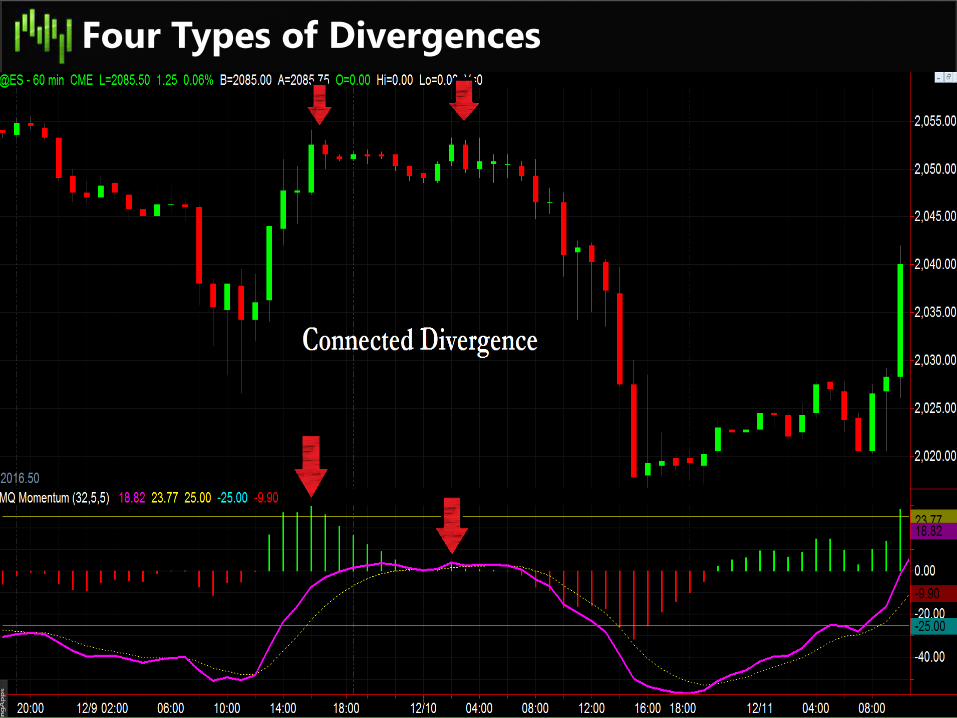
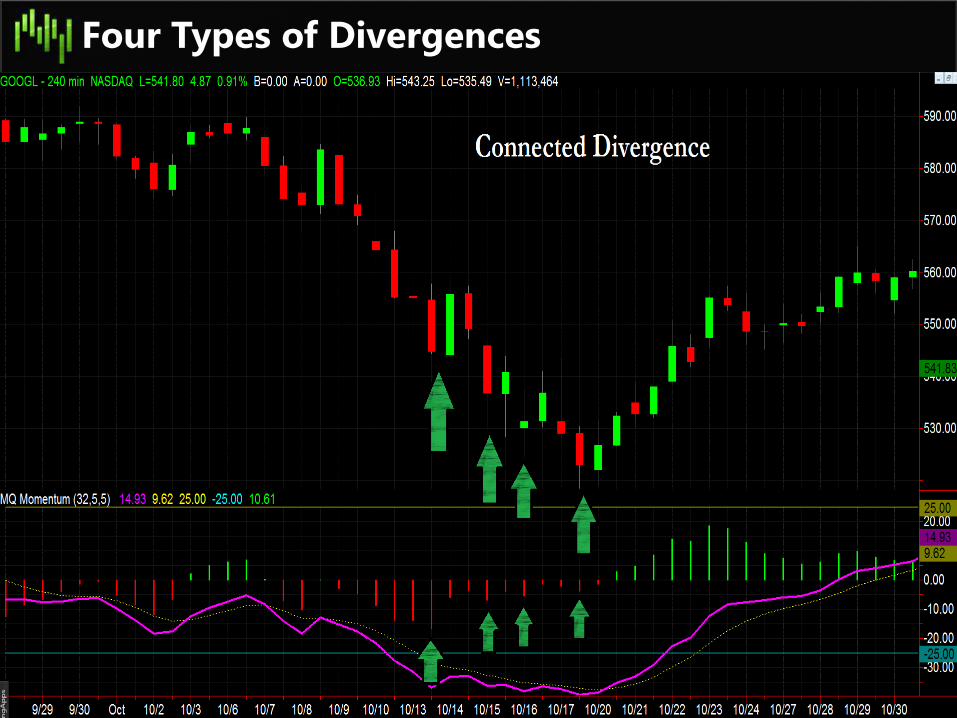
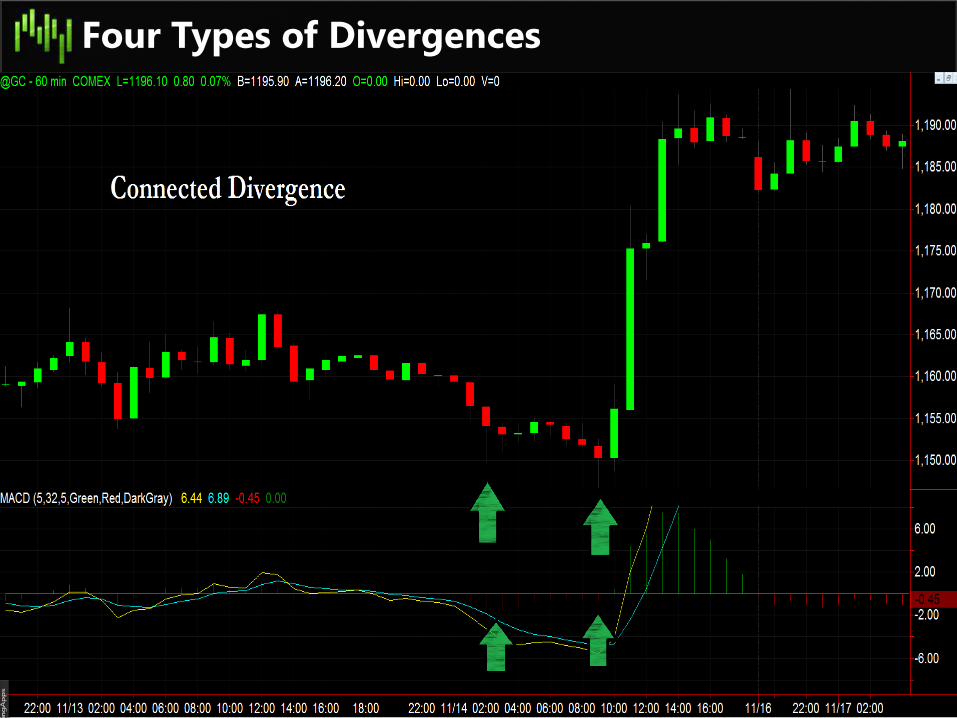
• A Connected Divergence occurs when you have two “waves” on your histogram where the second is stronger or weaker than the first.
• Connected Divergences normally do not signify trend reversal
• Connected Divergences are better if the indicator line is also in agreement with the histogram
• The problem with this type of divergence is the market can have several one after the other before actually bouncing
Four Types of Divergences
• A Pennant Pattern is formed when the range of a market becomes narrower and narrower
• You trade the breakout of a pennant the same way you would a consolidation breakout. The Trender should confirm the move within 2-3 price bars
Four Types of Divergences
• A Pennant Pattern is formed when the range of a market becomes narrower and narrower
• You trade the breakout of a pennant the same way you would a consolidation breakout. The Trender should confirm the move within 2-3 price bars
Four Types of Divergences
• A Pennant Pattern is formed when the range of a market becomes narrower and narrower
• You trade the breakout of a pennant the same way you would a consolidation breakout. The Trender should confirm the move within 2-3 price bars
Four Types of Divergences
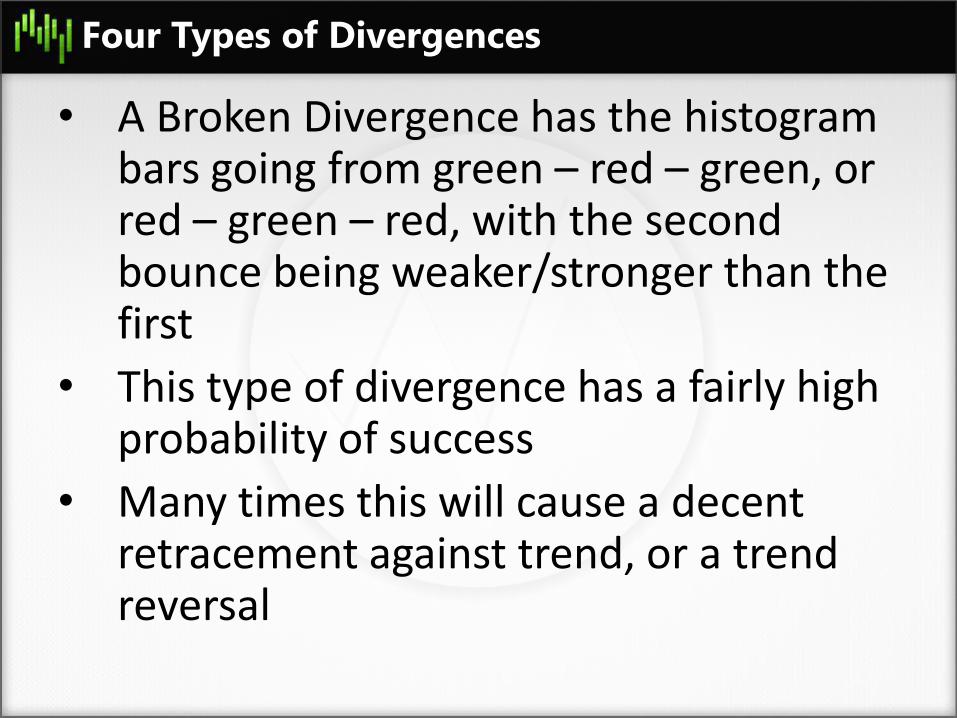
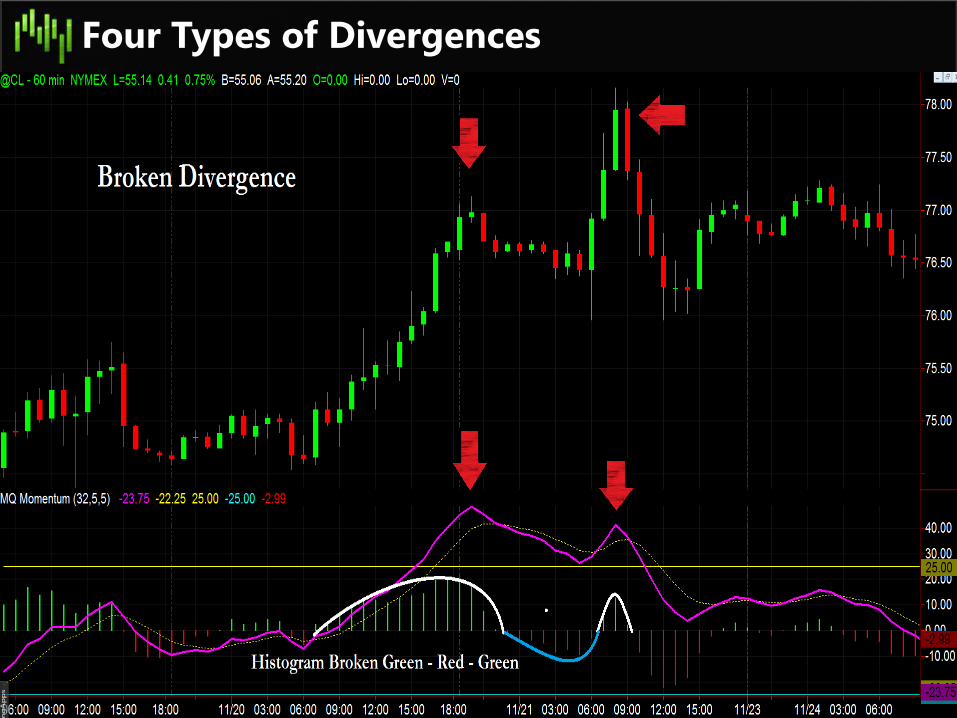
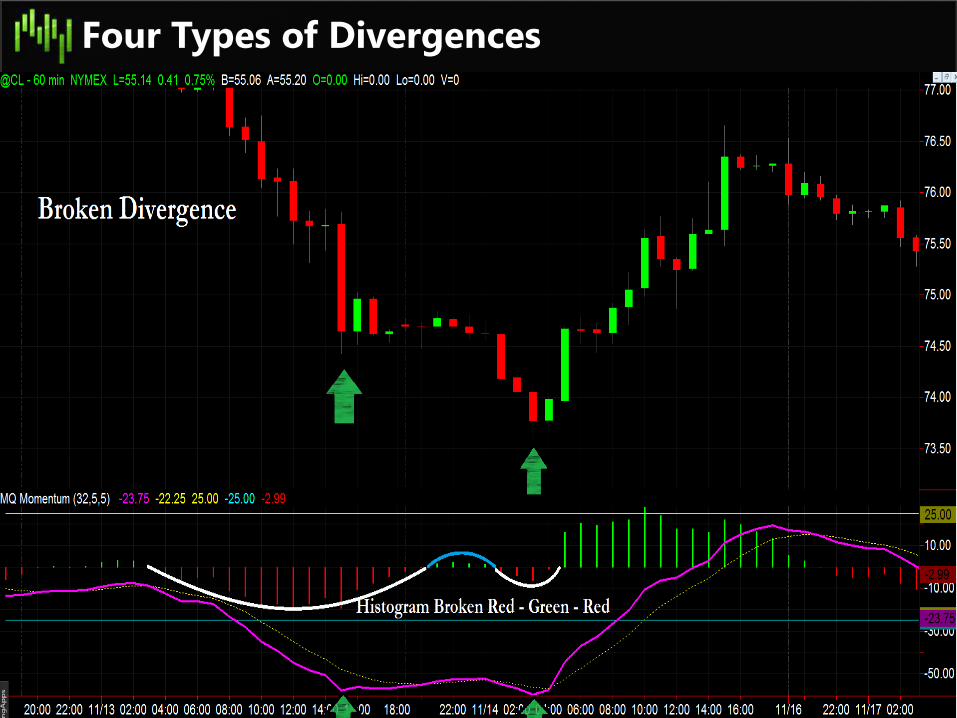
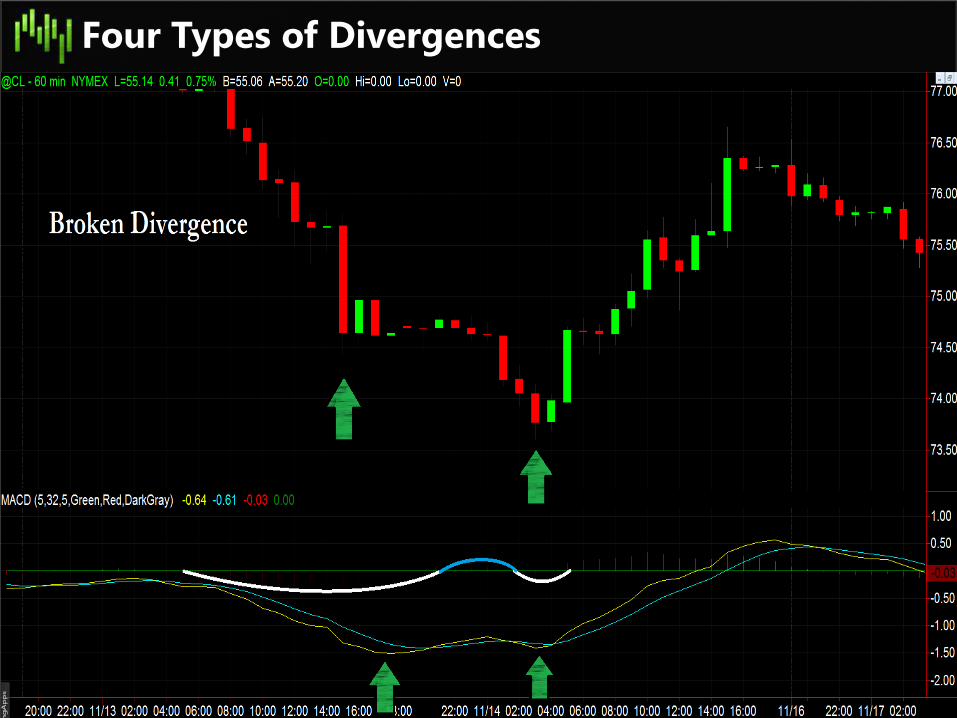
• A Broken Divergence has the histogram bars going from green – red – green, or red – green – red, with the second bounce being weaker/stronger than the first
• This type of divergence has a fairly high probability of success
• Many times this will cause a decent retracement against trend, or a trend reversal
Four Types of Divergences
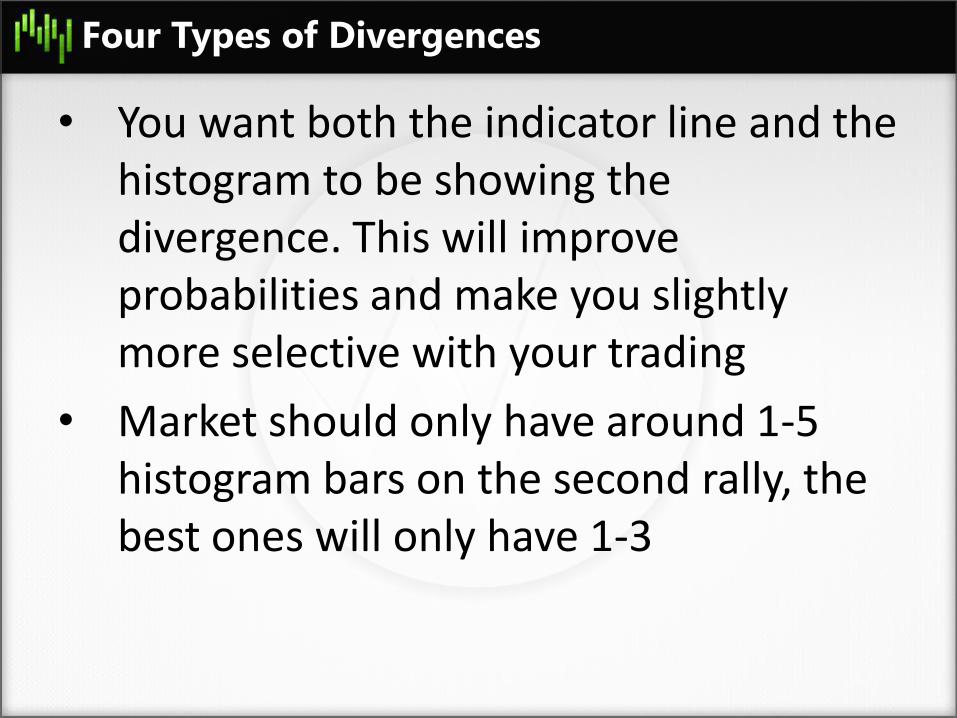
• You want both the indicator line and the histogram to be showing the divergence. This will improve probabilities and make you slightly more selective with your trading
• Market should only have around 1-5 histogram bars on the second rally, the best ones will only have 1-3
Four Types of Divergences
• A Pennant Pattern is formed when the range of a market becomes narrower and narrower
• You trade the breakout of a pennant the same way you would a consolidation breakout. The Trender should confirm the move within 2-3 price bars
Four Types of Divergences
• A Pennant Pattern is formed when the range of a market becomes narrower and narrower
• You trade the breakout of a pennant the same way you would a consolidation breakout. The Trender should confirm the move within 2-3 price bars
Four Types of Divergences
• A Pennant Pattern is formed when the range of a market becomes narrower and narrower
• You trade the breakout of a pennant the same way you would a consolidation breakout. The Trender should confirm the move within 2-3 price bars
Four Types of Divergences
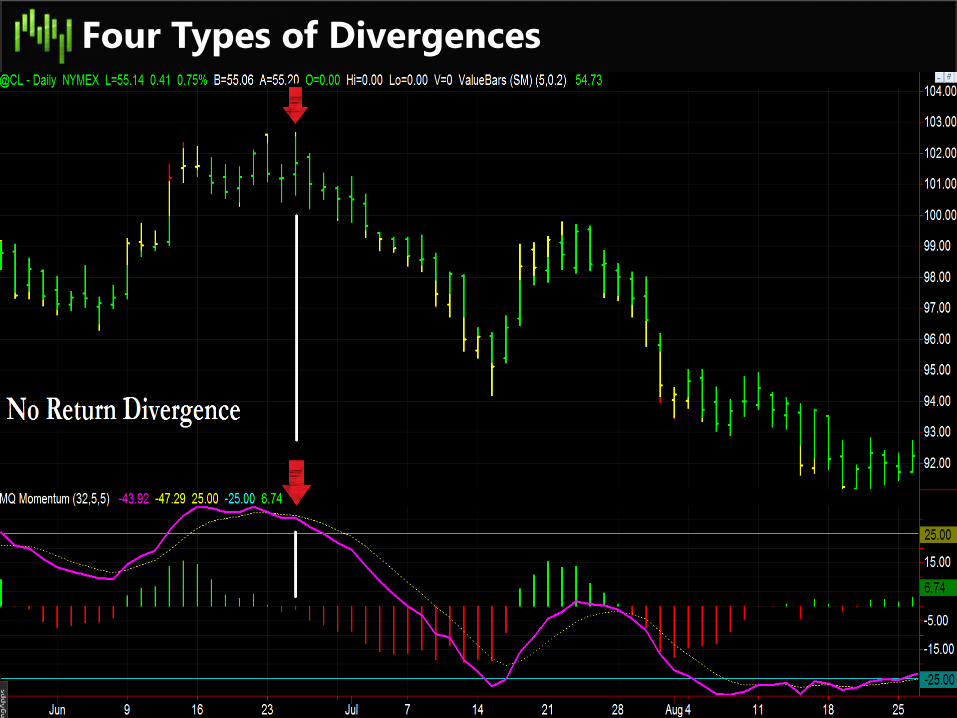
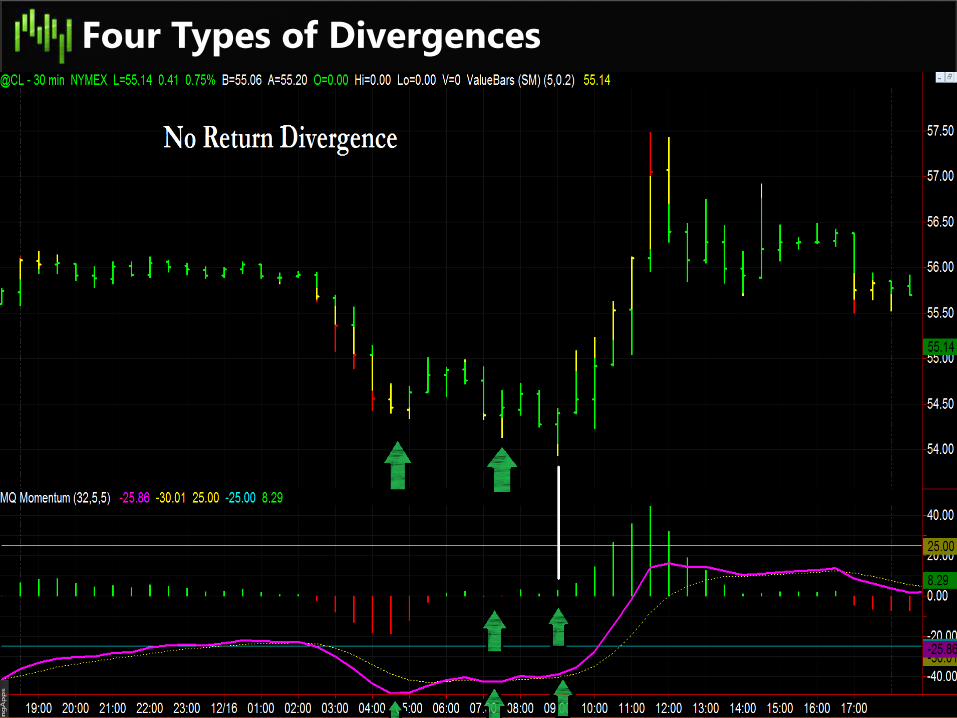
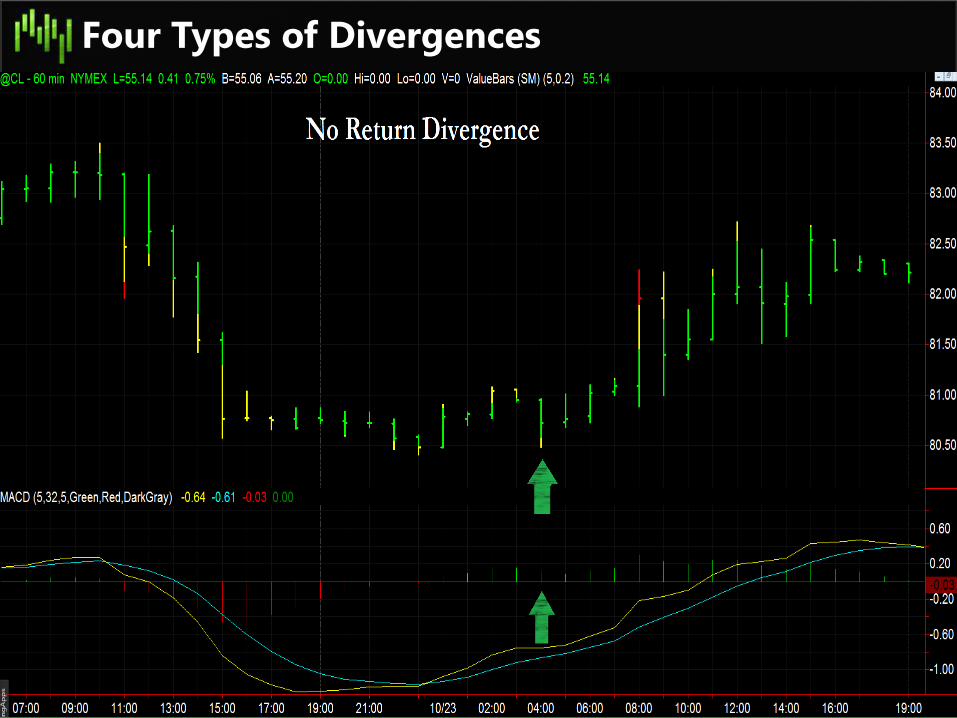
• A No Return Divergence is one of the highest probability divergences. It shows that the second bounce lost so much momentum, it could not cause the histogram bars to get back into upside/downside momentum
• It is essentially a broken divergence but instead of going red-green-red, the histogram goes red-green….
Four Types of Divergences
• If you do not have the ValueCharts/ValueBars indicator, you are delayed in knowing when the no return divergence is occurring
• If a market goes green – red – overvalued (while still red) then you have a no return bearish divergence
• If you do not have ValueBars/ValueCharts, watch for the second rally to almost reach previous highs, then break the previous bars low
Four Types of Divergences
• A Pennant Pattern is formed when the range of a market becomes narrower and narrower
• You trade the breakout of a pennant the same way you would a consolidation breakout. The Trender should confirm the move within 2-3 price bars
Four Types of Divergences
• A Pennant Pattern is formed when the range of a market becomes narrower and narrower
• You trade the breakout of a pennant the same way you would a consolidation breakout. The Trender should confirm the move within 2-3 price bars
Four Types of Divergences
• A Pennant Pattern is formed when the range of a market becomes narrower and narrower
• You trade the breakout of a pennant the same way you would a consolidation breakout. The Trender should confirm the move within 2-3 price bars

Questions on The Five Types of
Divergences?

How to Enter Divergences to Maximize
Success
How to Enter Divergences
• There are several ways to enter a divergence. Drill down entries are always going to be the best way to enter
• An example of drilldown is finding a bearish divergence on a daily chart. Then entering the trade based on a 30 minute chart
• You can use any timeframe to drilldown to, the smaller the timeframe the smaller the risk. However, the lower the timeframe the more false signals you will receive
How to Enter Divergences
• When entering a trade, never trade the wrong side of the mountain. Meaning, wait for it to start moving your direction. Never sell on an up bar or buy on a down bar
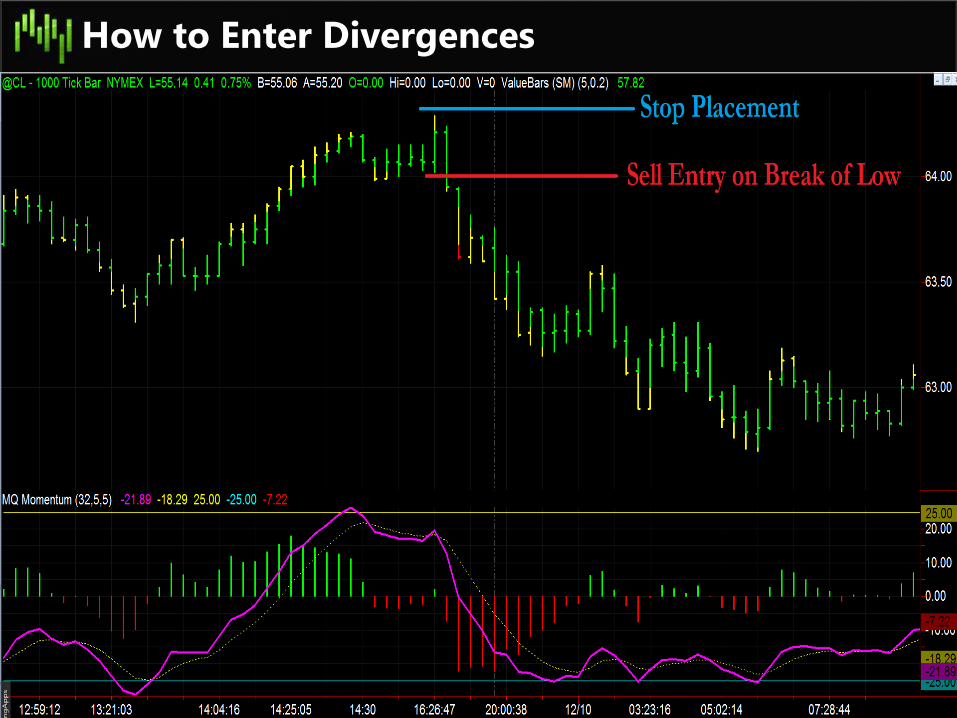
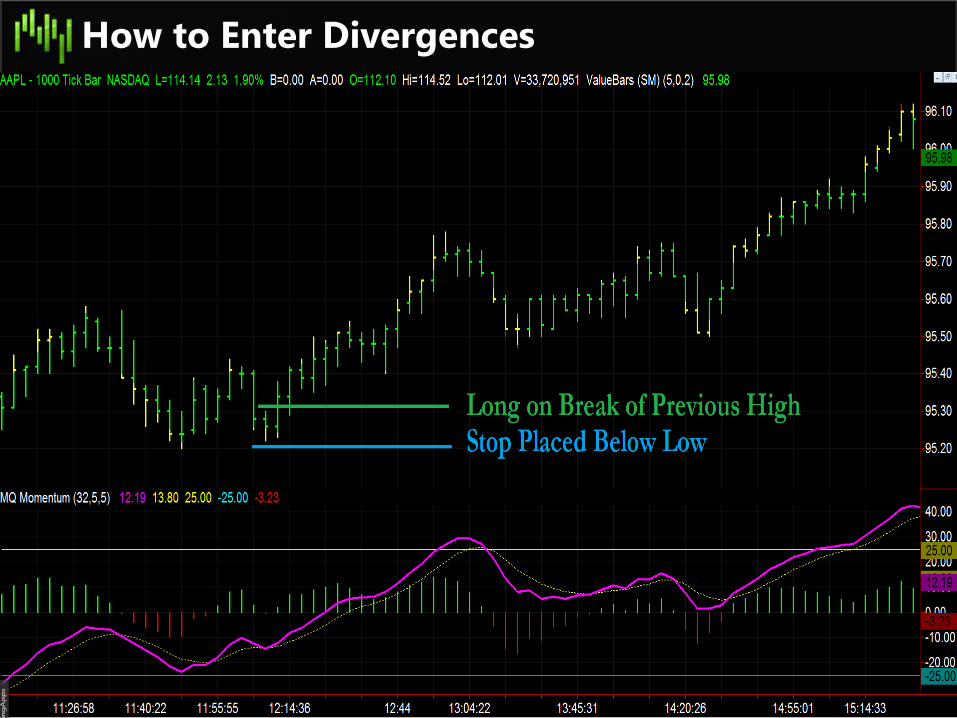
• If you are going short, wait for the break of the previous 1-2 bars lows (on your drilldown timeframe) or, if you are going long, wait for the break of the previous 1-2 bars highs before you enter
How to Enter Divergences
• If you are selling short on the break of the previous bars low (on your drilldown timeframe) then your stop is placed above the drilldown swing high
• If you are going long on the break of the previous bars high (on your drilldown timeframe) then your stop is placed below the drilldown swing low
How to Enter Divergences
• If you are drilling down to enter the trade, your profit target is still the target from the original timeframe you identified the divergence on
• The reason you drilldown like this is to increase your reward risk ratio. The better your reward risk ratio is, the better the probabilities of being a profitable trader
How to Enter Divergences
• You do not have to use a divergence for your entry on the drilldown timeframe, you can also use the SS Momentum Trender PRO or the Hedge Fund Trader, or breakout entries, etc.
• The goal of drilldown entries is to minimize the risk on your trades, not to find the turning points of major moves. Those are found on the higher timeframes
How to Enter Divergences
• We expect a divergence to move 1-3 bars in our direction. So if we find a divergence on a 30 minute chart, we expect a move of 30 minutes – 1.5 hours
• If you want to catch larger moves, increase the timeframe you are looking at for the divergence. If you find one on a daily, then you expect at least 1-3 days of a move in your direction
How to Enter Divergences
• A “Blue Squeeze” setup occurs when the market suddenly loses a lot of volatility and the trender changes to neutral.
• You watch for a break above the highest high or the lowest low bar
• Trender should confirm the breakout by the 2nd bar and should be in the money very quickly
Questions on How to Enter
Divergences?
Understanding and Trading Trend
Reversal vs. Consolidation
Trend Reversal vs. Consolidation
• In order to know if a divergence has caused the trend to reverse, you need to know the definition of a trend – Up Trends – Higher High and Higher Low
– Down Trends – Lower High and Lower Low
• You cannot have a trend without one of the two things listed above
Trend Reversal vs. Consolidation
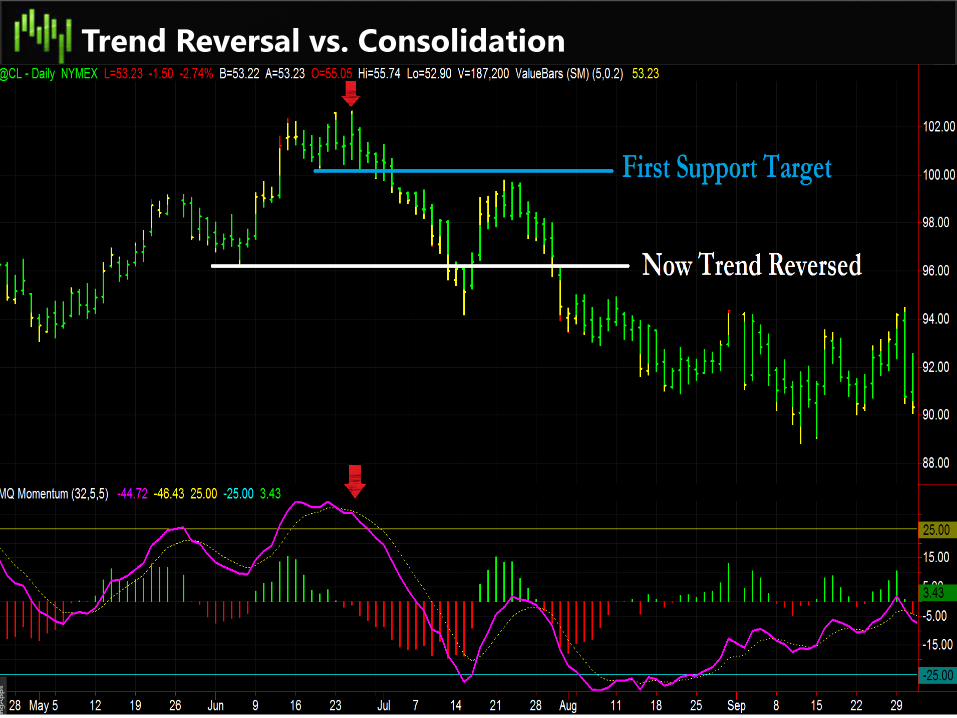
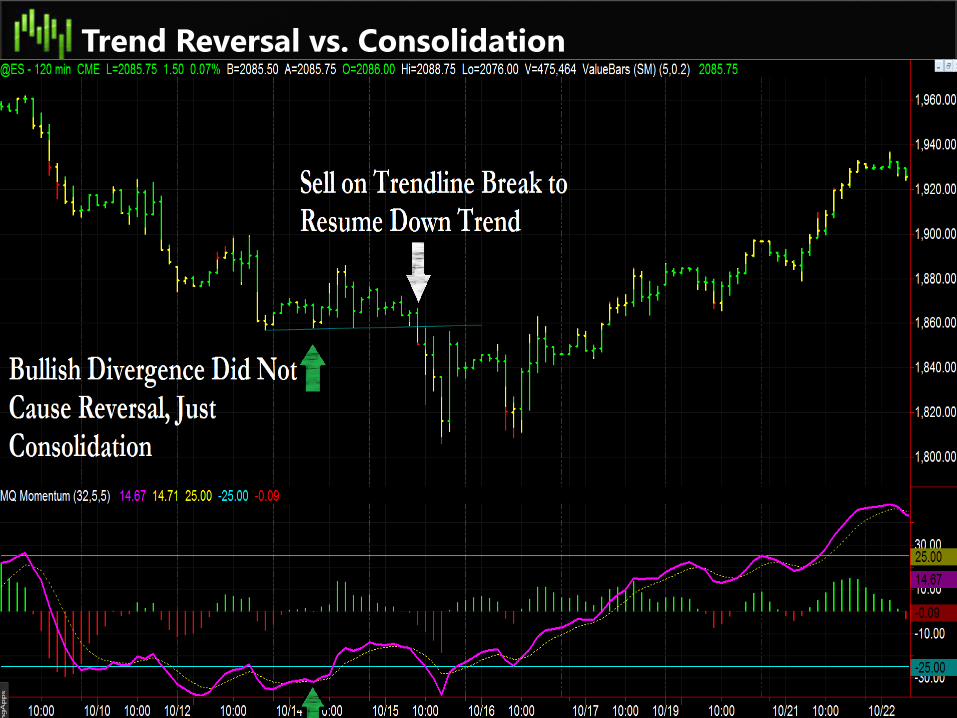
Trend Reversal vs. Consolidation
Trend Reversal vs. Consolidation
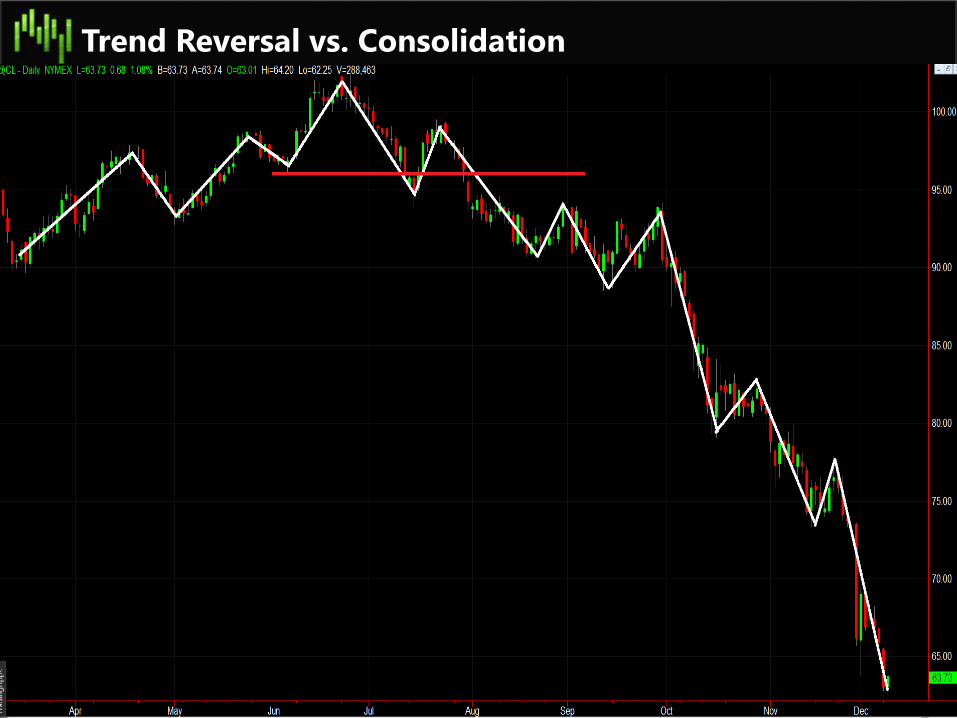
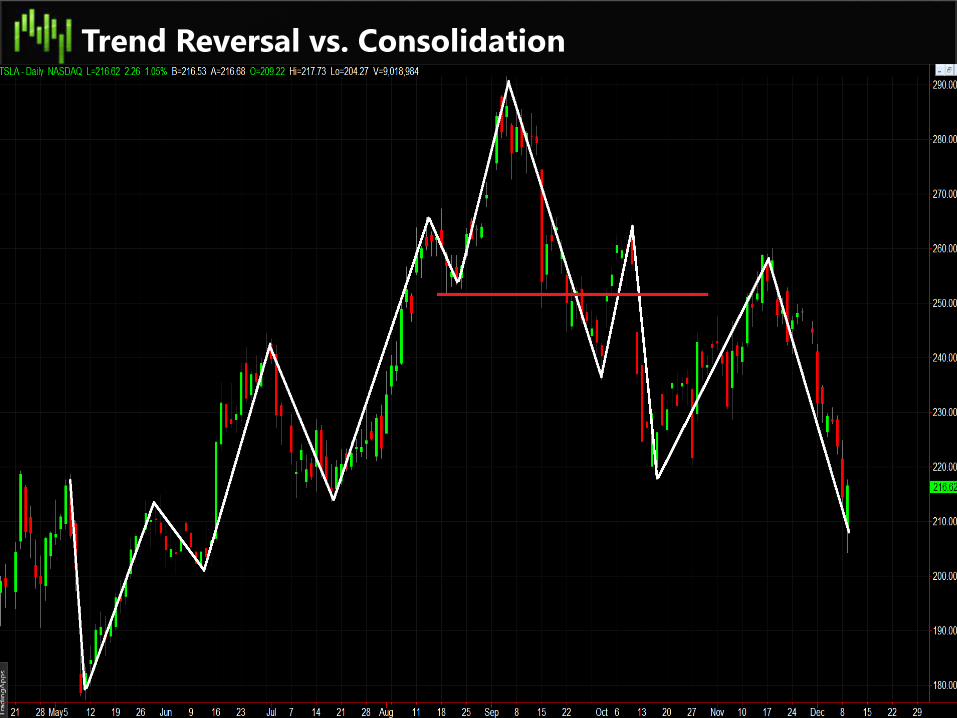
• Treat every divergence as if it is just consolidation. IF we break the previous swing low/swing high, THEN we can assume that the trend has reversed and we can be looking for longer term moves to the downside
• IF we bounce off of the previous swing low/swing high, THEN we know it is consolidation and we can close trade to enter on trendline break resuming trend
Trend Reversal vs. Consolidation
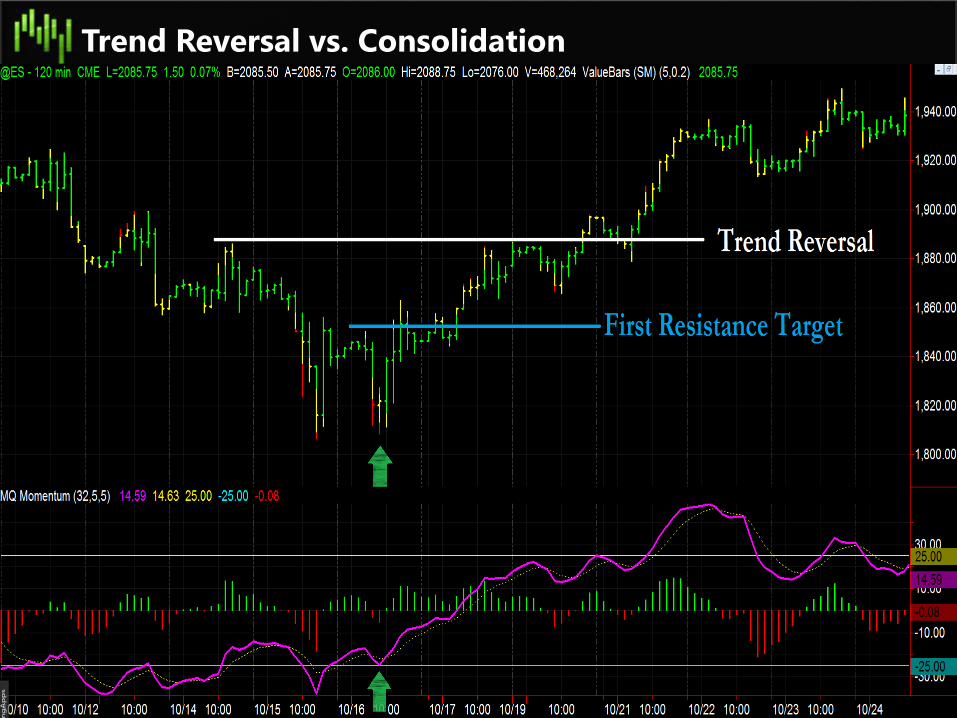
Trend Reversal vs. Consolidation
Trend Reversal vs. Consolidation
• If the trend does not reverse, then you are looking for a breakout entry to jump back in on the direction of underlying trend
• Look to draw a trendline connecting two or more points for the consolidation breakout point
• Enter on trendline BREAK, not on close above/below said trendline
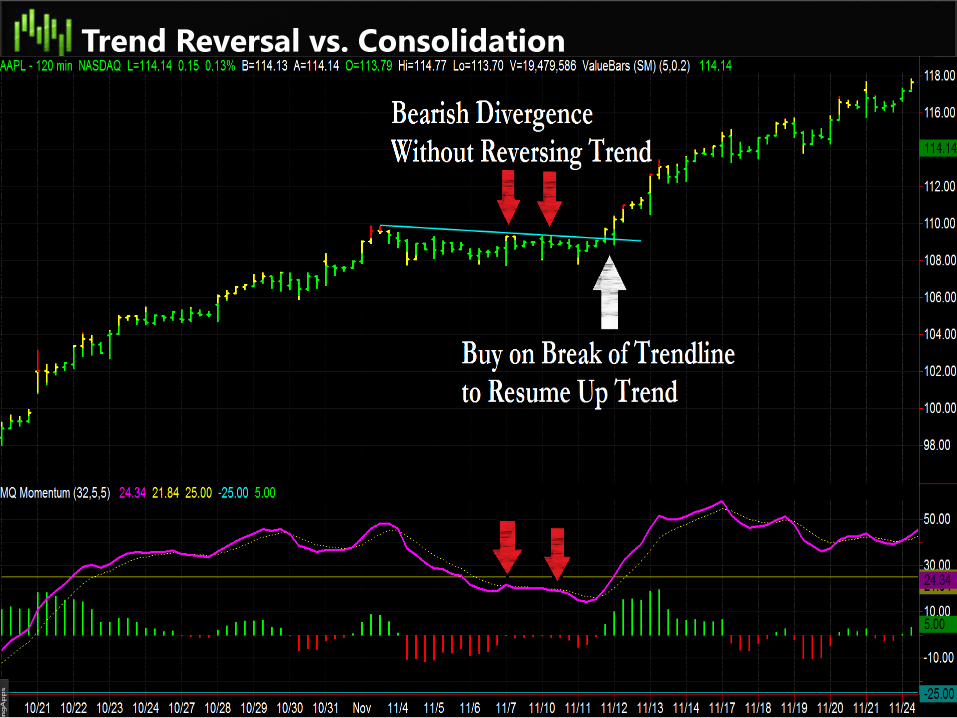
Trend Reversal vs. Consolidation
Trend Reversal vs. Consolidation
Questions on Trading Trend Reversal vs.
Consolidation?
Momentum Based Trade Setups
Momentum Based Trade Setups
• There are several great trade setups you can see using the MQ Momentum or MACD indicators, two that have high probability of success are: – Momentum Inflections (Using Histogram)
– One Green/One Red Finger Setups
Momentum Based Trade Setups
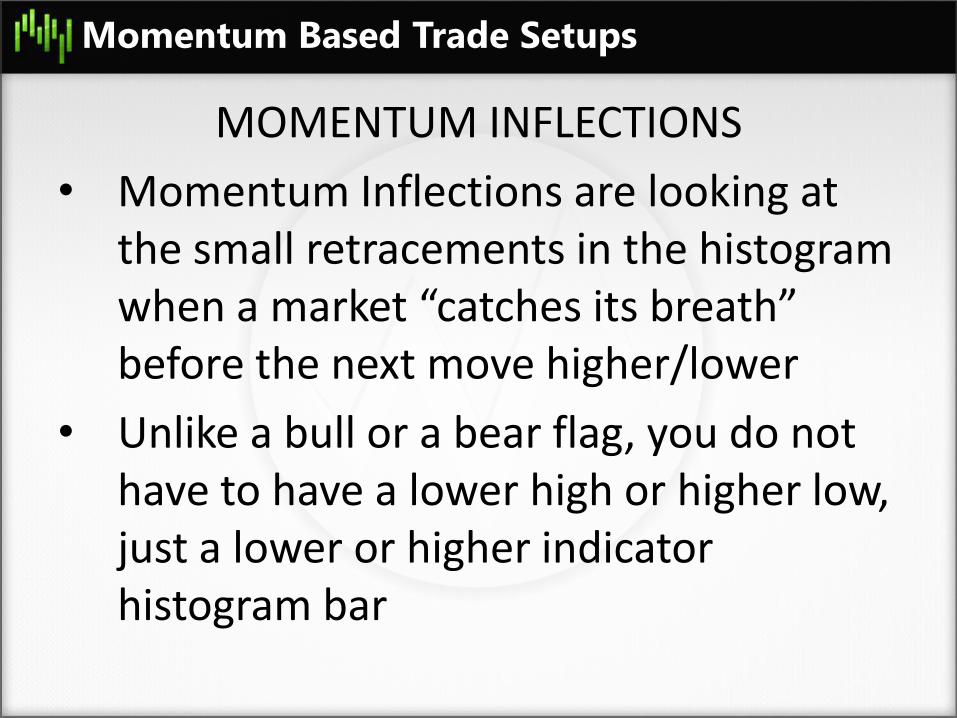
MOMENTUM INFLECTIONS
• Momentum Inflections are looking at the small retracements in the histogram when a market “catches its breath” before the next move higher/lower
• Unlike a bull or a bear flag, you do not have to have a lower high or higher low, just a lower or higher indicator histogram bar
Momentum Based Trade Setups
• If the retracement is more than a few ticks/cents, then you trade it like a bull/bear flag, on the break of the previous bars high/low
• If it is just a small retracement or even just a consolidation bar, you trade the break of the high/low of the highest or lowest bar
Momentum Based Trade Setups
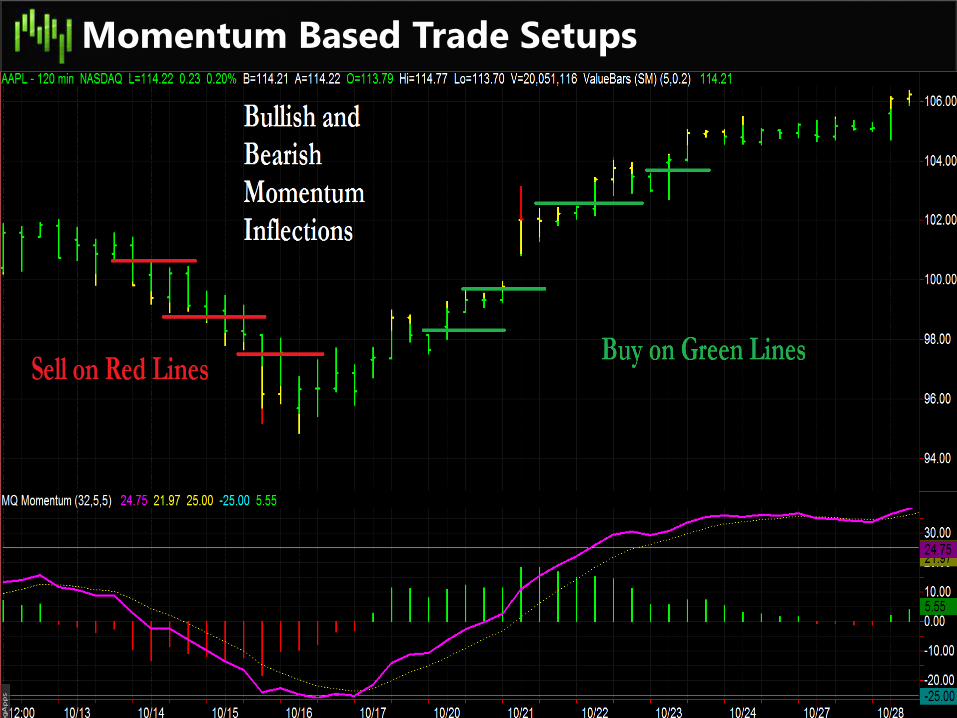
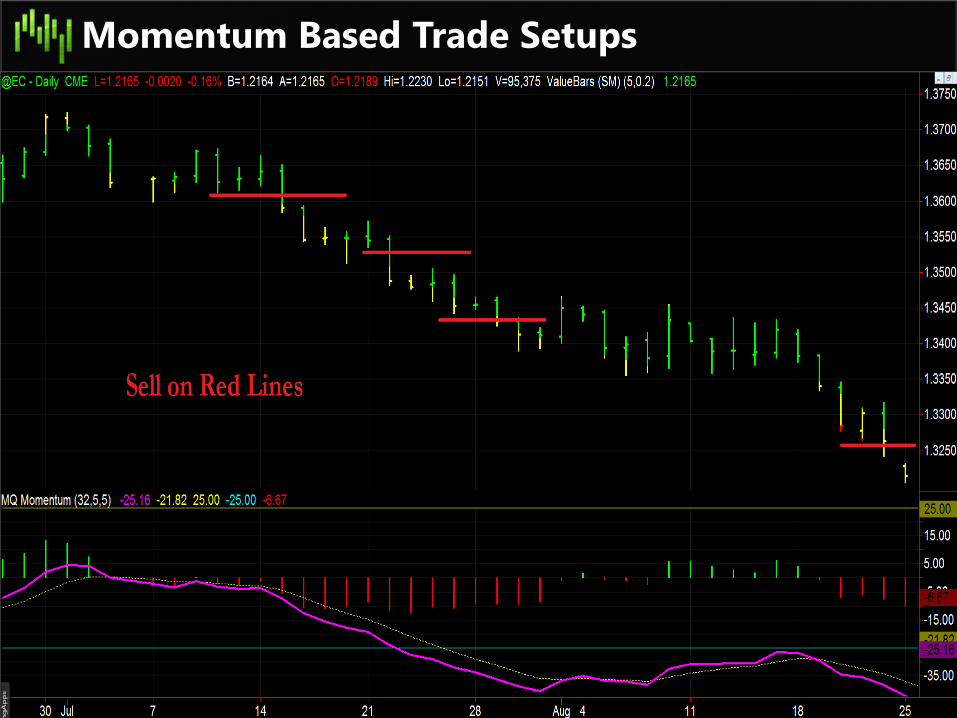
• Enter trade on break of previous bars high/low after under/overvalued has been reached
• Trender should confirm move and should resume your direction within the next few bars
• Only take the first 2-3 over/undervalued bounces once a trend changes
Momentum Based Trade Setups
• Enter trade on break of previous bars high/low after under/overvalued has been reached
• Trender should confirm move and should resume your direction within the next few bars
• Only take the first 2-3 over/undervalued bounces once a trend changes
Momentum Based Trade Setups
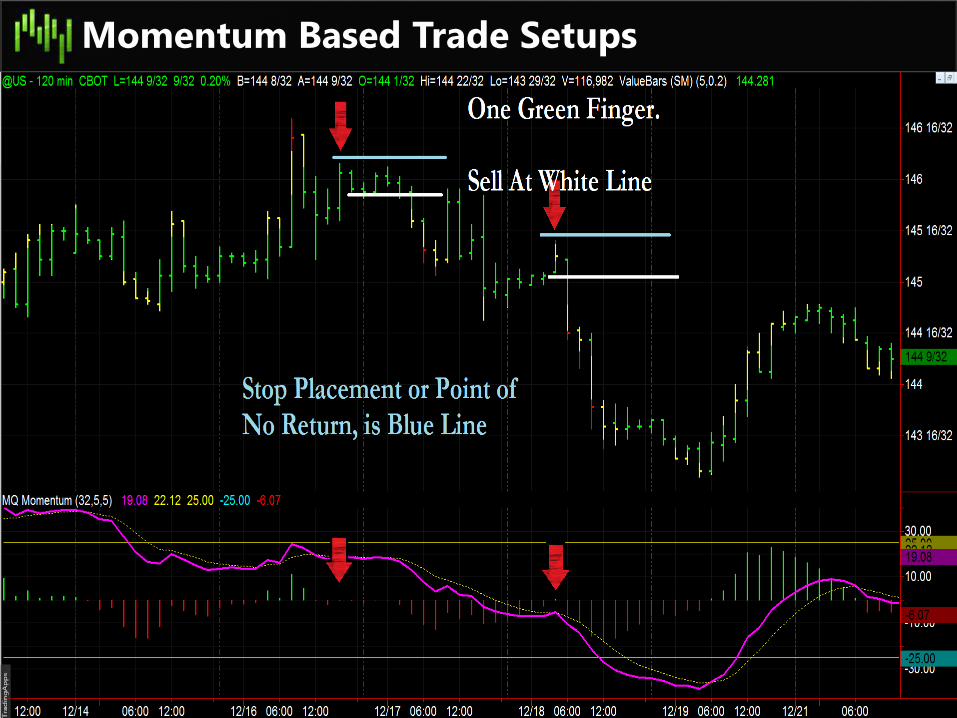
One Green/Red Finger
• Similar to a momentum inflection, a one green/red finger setup is identified by looking at the MQ Momentum or MACD histogram.
• A one green finger setup is formed when you have red histogram bars broken by a single green histogram bar, this is a bearish setup showing extremely weak momentum on the rally
Momentum Based Trade Setups
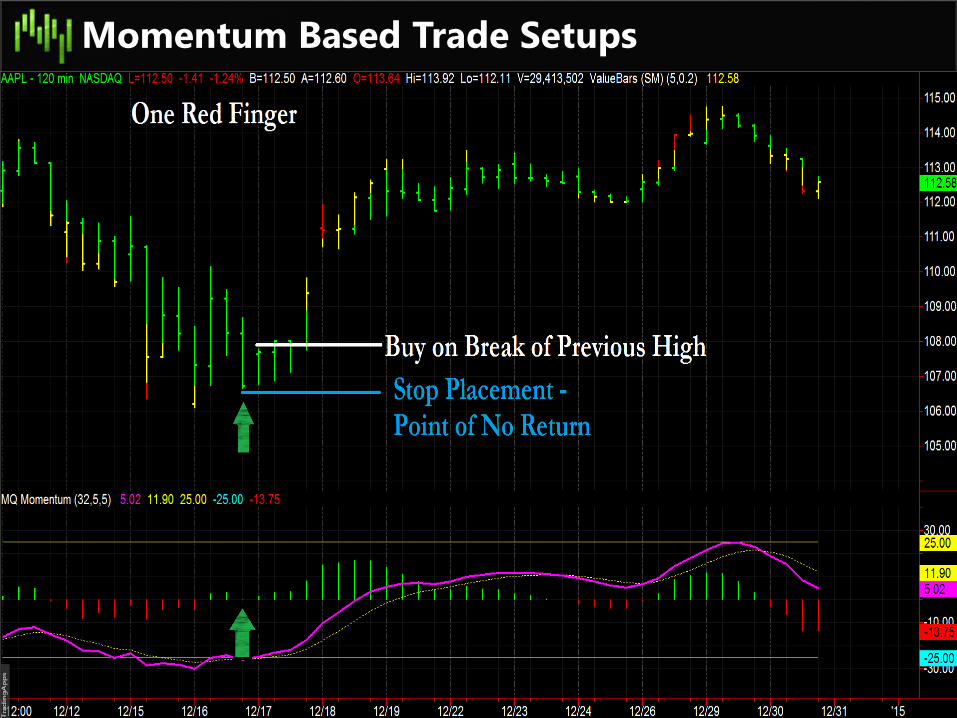
• A one red finger setup is the exact opposite of one green finger. It is identified by a series of green histogram bars, broken by one red histogram bar. This is a bullish setup showing extremely weak momentum by the sellers
• A one green/red finger setup is somewhat of a delayed setup. Meaning, we do not know if it is going to stay with one green/red finger until the bar closes.
Momentum Based Trade Setups
• You enter the trade using drilldown analysis or on the break of the previous bars high/low
• The market should follow through your direction immediately. Only trade these setups if there is going to be enough volume to actually move the market. If the market is not moving, you can get “chopped up” with buy/sell signals
Momentum Based Trade Setups
• These types of setups are not necessarily topping or bottoming patterns, many times they offer great entries into a market that is already moving down or up
• Similar to all the other setups we have discussed, the distance you expect the market to move after the setup occurs, depends on the timeframe you are watching. The longer the timeframe, the larger the move
Momentum Based Trade Setups
• Enter trade on break of previous bars high/low after under/overvalued has been reached
• Trender should confirm move and should resume your direction within the next few bars
• Only take the first 2-3 over/undervalued bounces once a trend changes
Momentum Based Trade Setups
• Enter trade on break of previous bars high/low after under/overvalued has been reached
• Trender should confirm move and should resume your direction within the next few bars
• Only take the first 2-3 over/undervalued bounces once a trend changes

Questions on Momentum Based Trade
Setups?
Things to Remember!
• When you enter a trade, long or short, the momentum should agree on direction, no matter what strategy you are using
• The best trades are going to work out right away, if it is taking too long to move, then it may be worth going ahead and getting out of the trade early
• Watch for the really well defined setups, then use drilldown entries to increase your reward risk ratio
Things to Remember!
• Be patient waiting for trades, do not go “searching” for a trade opportunity, you will see the opportunity when it shows up
• We are not looking for “good trades” we are looking for “excellent trades” do not feel as if you HAVE to trade every day, quite simply you do not
• Learn to have expectations on how a trade should play out, if it is not behaving the way you believe it should, then do not take the trade