Embed Size (px)
Citation preview
NEWLY EXPANDED OFFERING HELPS YOU OUTPERFORM WITH MORE INFORMED DECISIONS.
DEEPER INSIGHT AND ANALYSIS TO STAND OUT FROM THE COMPETITIONI/B/E/S Key Performance Indicators are a powerful, and rapidly expanding new suite of forecast content. To give you that extra edge, this industry-specific content is available alongside existing estimates data like EPS & Recommendations, and is available on over 216 key metrics, across 12 industries.
• Estimates and Actuals provided together with derivedSurprise data, enable you to analyze brokerexpectations against reported results.
• Consensus and Detail forecasts are available on anAnnual and Interim basis. Same Store Sales (SSS)data is available on a monthly and quarterly basis.
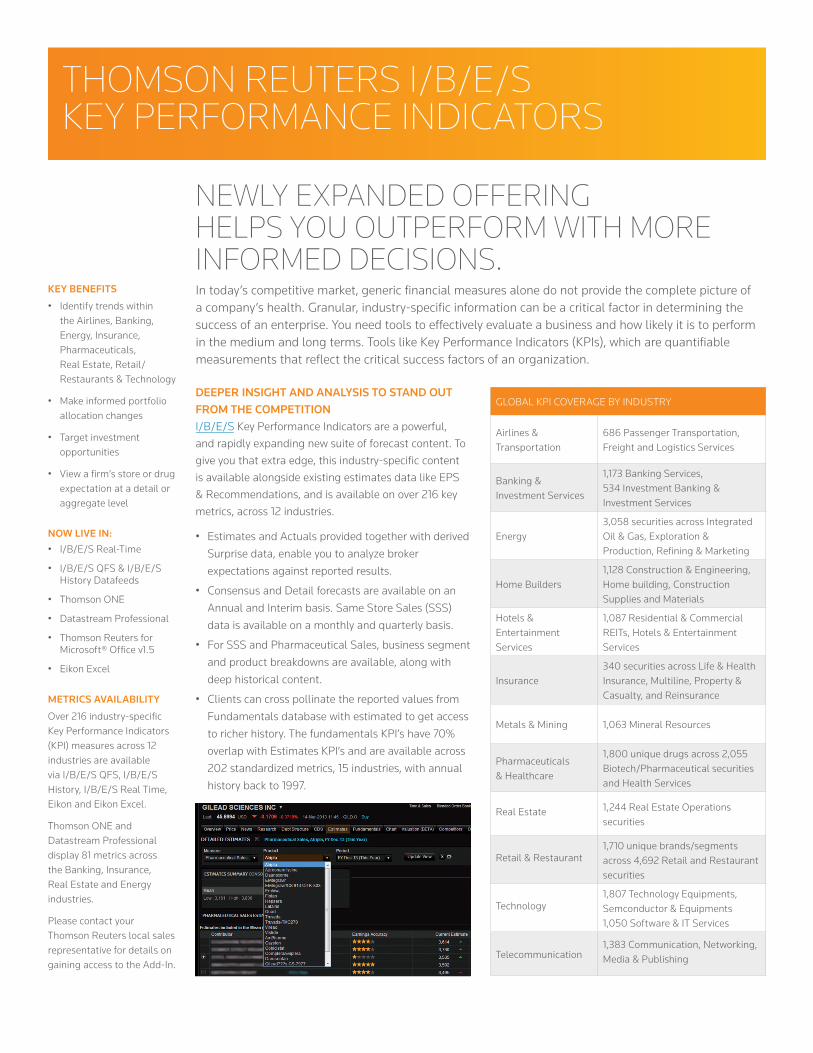
• For SSS and Pharmaceutical Sales, business segmentand product breakdowns are available, along withdeep historical content.
• Clients can cross pollinate the reported values fromFundamentals database with estimated to get accessto richer history. The fundamentals KPI’s have 70%overlap with Estimates KPI’s and are available across202 standardized metrics, 15 industries, with annualhistory back to 1997.
In today’s competitive market, generic financial measures alone do not provide the complete picture of a company’s health. Granular, industry-specific information can be a critical factor in determining the success of an enterprise. You need tools to effectively evaluate a business and how likely it is to perform in the medium and long terms. Tools like Key Performance Indicators (KPIs), which are quantifiable measurements that reflect the critical success factors of an organization.
KEY BENEFITS
• Identify trends within the Airlines, Banking, Energy, Insurance, Pharmaceuticals, Real Estate, Retail/Restaurants & Technology
• Make informed portfolio allocation changes
• Target investment opportunities
• View a firm’s store or drug expectation at a detail or aggregate level
NOW LIVE IN:• I/B/E/S Real-Time
• I/B/E/S QFS & I/B/E/S History Datafeeds
• Thomson ONE
• Datastream Professional
• Thomson Reuters forMicrosoft® Office v1.5
• Eikon Excel
METRICS AVAILABILITY
Over 216 industry-specific Key Performance Indicators (KPI) measures across 12 industries are available via I/B/E/S QFS, I/B/E/S History, I/B/E/S Real Time, Eikon and Eikon Excel.
Thomson ONE and Datastream Professional display 81 metrics across the Banking, Insurance, Real Estate and Energy industries.
Please contact your Thomson Reuters local sales representative for details on gaining access to the Add-In.
GLOBAL KPI COVERAGE BY INDUSTRY
Airlines & Transportation
686 Passenger Transportation, Freight and Logistics Services
Banking & Investment Services
1,173 Banking Services, 534 Investment Banking & Investment Services
Energy3,058 securities across Integrated Oil & Gas, Exploration & Production, Refining & Marketing
Home Builders1,128 Construction & Engineering, Home building, Construction Supplies and Materials
Hotels & Entertainment Services
1,087 Residential & Commercial REITs, Hotels & Entertainment Services
Insurance340 securities across Life & Health Insurance, Multiline, Property & Casualty, and Reinsurance
Metals & Mining 1,063 Mineral Resources
Pharmaceuticals & Healthcare
1,800 unique drugs across 2,055 Biotech/Pharmaceutical securities and Health Services
Real Estate 1,244 Real Estate Operations securities
Retail & Restaurant1,710 unique brands/segments across 4,692 Retail and Restaurant securities
Technology1,807 Technology Equipments, Semconductor & Equipments 1,050 Software & IT Services
Telecommunication1,383 Communication, Networking, Media & Publishing
THOMSON REUTERS I/B/E/S KEY PERFORMANCE INDICATORS
Thomson Reuters links these drugs on multiple levels depending on the business relationship, chemical ingredients and purpose associated with each - allowing not only specific forecast data for each separate drug but also aggregate sales of generic ingredients and instances where global revenues are shared as a joint venture between companies.
REAL ESTATE
30 measures collected, notably 3 flavours of Funds from Operations; including NAREIT-Defined, Cash Available for Distribution, Development Costs and Net Operating Income, EBITDAR and NAV per Share.
Real Estate Investment Trust (REITs) are corporate entities that own, operate, acquire, develop and manage real estate assets on behalf of its shareholders. The KPIs for REITs will give an improved picture of cash flow from operations compared to net income, including non-cash related expenses such as depreciation and amortization.
RETAIL / RESTAURANTS
Same Store Sales (SSS) for retailers and restaurants are collected across over 130 stores and restaurants and 242 unique brands/segments in North America. On a monthly, quarterly and annual basis, this content can be viewed on a consolidated company basis, geographic and individual store banner level segments, when available.
To help you differentiate your strategy, the Thomson Reuters Proprietary Research team offers a series of unique Indices Reports, which are regularly cited in major media outlets.
TECHNOLOGY
8 measures collected notably: Compensation Ratio, Net Revenue, SG&A Expense and R&D Expense. 7 measures are now considered Generic.
The Technology Sector includes companies that are involved in the manufacture and sale of technological goods and services. The KPIs relevant to this sector give you the opportunity to perform highly detailed analysis of forecasted and historical performance of income and expenditure.
TELECOMMUNICATION
7 measures collected notably includes Subscriber Acquisition Cost (SAC), Subscribers, Net Subscriber Additions, Churn (%) and Access Line.
The Telecommunication Sector includes companies that are involved in Communication & Networking and Telecommunication Services. The KPIs relevant to this sector give you the opportunity to perform highly detailed analysis of forecasted and historical performance of income and expenditure.
GENERIC33 Generic Measures were introduced - where new measures were added and existing measures were expanded in coverage scope. New measures introduced include Depreciation and Amortization, Cash Flow from Financing, Cash Flow from Investing and Cash Flow from Operations. Existing KPIs are now expanded to other sectors, this includes Total Assets, Operating Expenses and Stock Based Compensation.
AIRLINES11 measures collected, notably Available Seat Kilometres (ASK), Available Seat Miles (ASM), Cost per ASK, Cost per ASM, Passenger Load Factor, Revenue Passenger Kilometres and Revenue per ASM.
The Airline Sector includes companies whose business interests are involved in air transport services for paying passengers and freight.
BANKING/FINANCE31 measures collected, including Loan Loss Provision, Net Interest Income, Deposits and Assets Under Management. Over 30 KPIs are collected for this sector so you can perform highly detailed analysis of forecasted and historical performance across income, expenditure, assets and liabilities.
ENERGY30 measures collected, notably various types of Production Per Day (Oil, Gas, etc.), Upstream / Downstream Income, Exploration Expense, Distributable Cash Flow and Maintenance Capex.
The Energy Sector includes companies whose business interests are involved in the production, refining and supply of all any form of energy. This also includes the exploration, transportation, marketing and research involved in energy creation and supply. Analysis of this sector requires a significant level of knowledge and understanding as it is particularly sensitive to changes (or the perception of changes) to supply and demand. The KPIs relevant to this sector are designed to allow analyses which can take into account changes in supply on several different levels.
INSURANCE19 measures collected, including Net Premiums (both Written and Earned), Embedded Value and Combined Ratio. Includes companies, which provide any type of Insurance, including Life & Health Insurance, Multiline Insurance, Property and Casualty Insurance and Reinsurance. The relevant KPIs give you the opportunity to perform highly detailed analysis of forecasted and historical performance of income, expenditure, assets and liabilities.
PHARMACEUTICALSPharmaceutical Drug Unit Sales are collected across 120+ companies and on 1,800 unique drugs. Data includes revenue associated with individual drug brands, across an aggregate and geographic level.
financial.tr.com/ibes
© 2016 Thomson Reuters 141108/02-16
To learn more about the newly expanded I/B/E/S Key Performance Indicators offering, contact your local sales representative.
+1 877 365 1455
THOMSON REUTERS I/B/E/S KEY PERFORMANCE INDICATORS