Embed Size (px)
Citation preview
Thorvaldur GylfasonEduard Hochreiter
Since collapse of Soviet Union in 1991Three Baltic states, now EU members, have fared
significantly better than other FSU states Aim is to apply standard growth economics
to a comparison of Estonia and GeorgiaExtensive vs. intensive growth
SimilaritiesSmall, poorly endowed with natural resourcesProsperous in past golden ageAnnexed by Russia in 1721 (Estonia), 1801
(Georgia) Independent 1918-40 (Estonia), 1918-21
(Georgia) Difference
Estonia embarked on ambitious reformsGeorgia did not, was torn by civil war
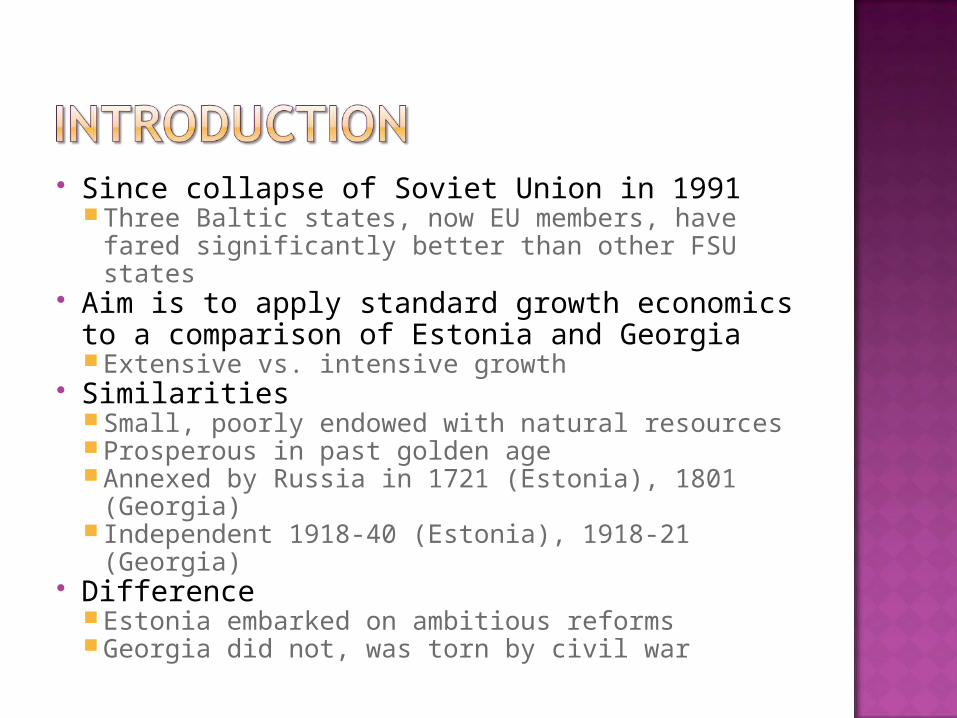
Estonia’s per capita GDP sank from rough parity with Finland in 1940 to a third of Finland’s in 1991 …
… then rose to half of Finland’s per capita GDP in 2005
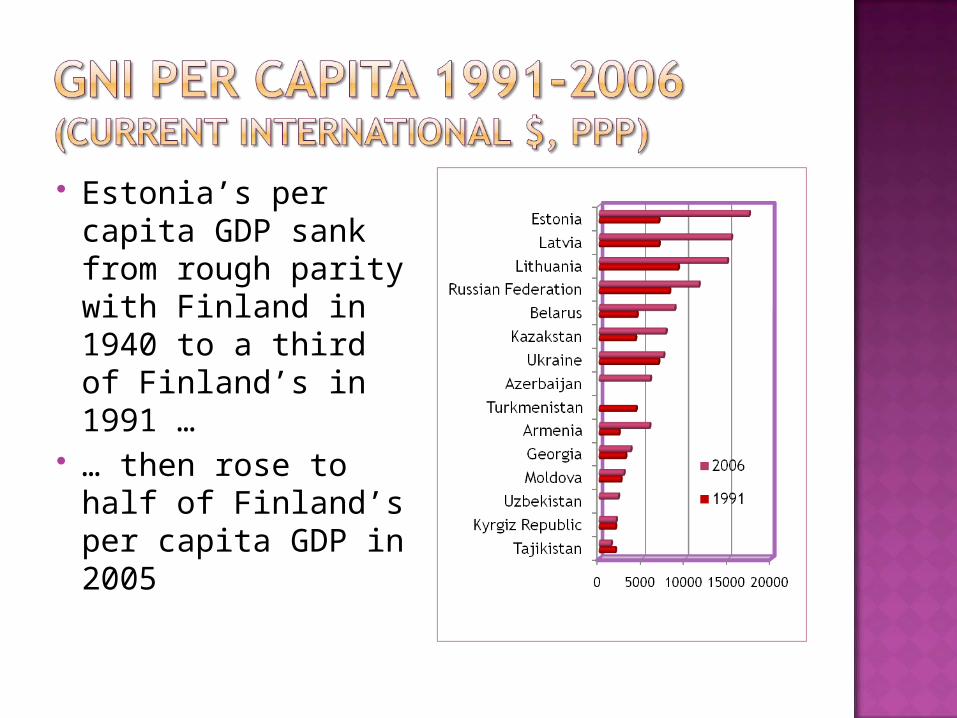
Georgia’s per capita GDP fell from almost half of Estonia’s in 1991 to one-fifth in 2005 …
… and also declined relative to Russia, from 38% to 32%
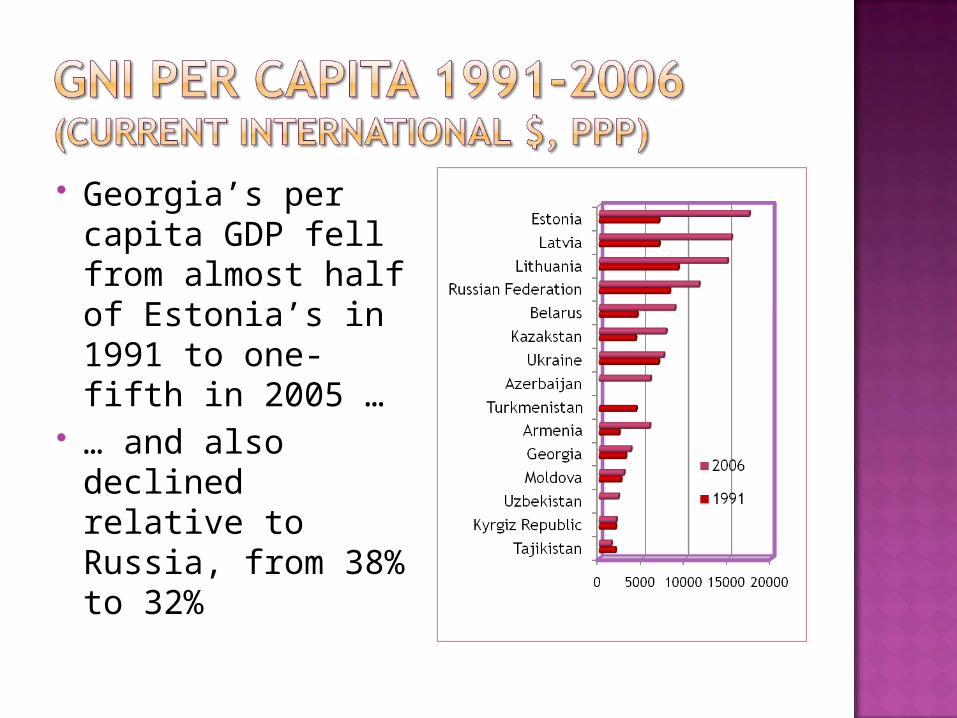
Georgia took a deeper and longer lasting plunge: its per capita GDP contracted by almost 80% 1988-94
Estonia’s per capita GDP contracted by 33% 1989-93
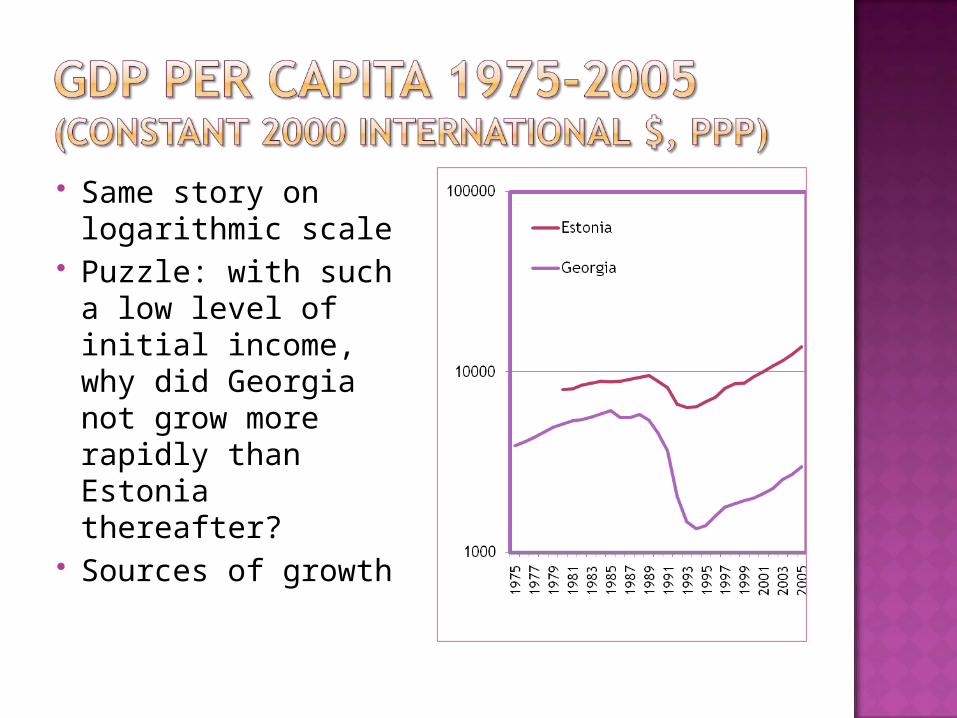
Same story on logarithmic scale
Puzzle: with such a low level of initial income, why did Georgia not grow more rapidly than Estonia thereafter?
Sources of growth
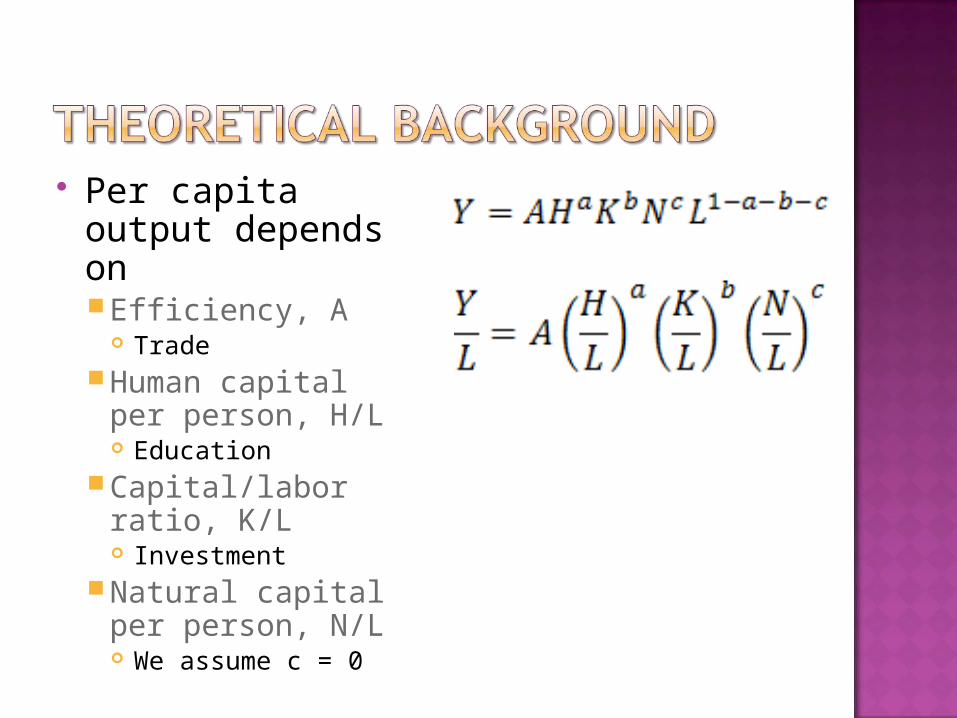
Per capita output depends onEfficiency, A
Trade Human capital per
person, H/L Education
Capital/labor ratio, K/L Investment
Natural capital per person, N/L We assume c = 0
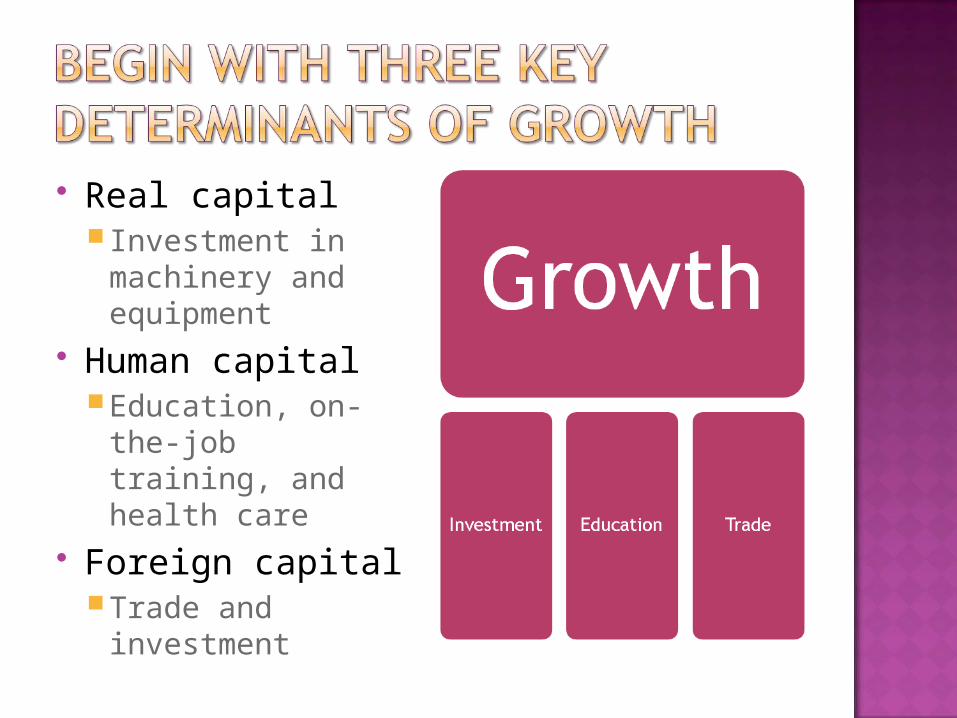
Real capital Investment in
machinery and equipment
Human capitalEducation, on-the-
job training, and health care
Foreign capitalTrade and
investment
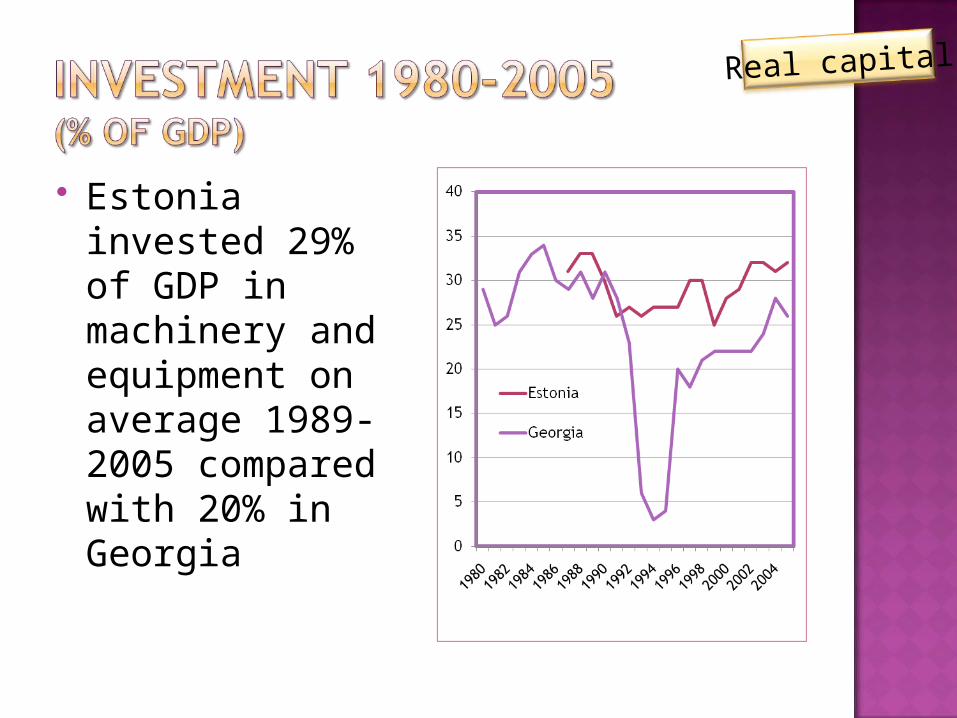
Estonia invested 29% of GDP in machinery and equipment on average 1989-2005 compared with 20% in Georgia
Real capital
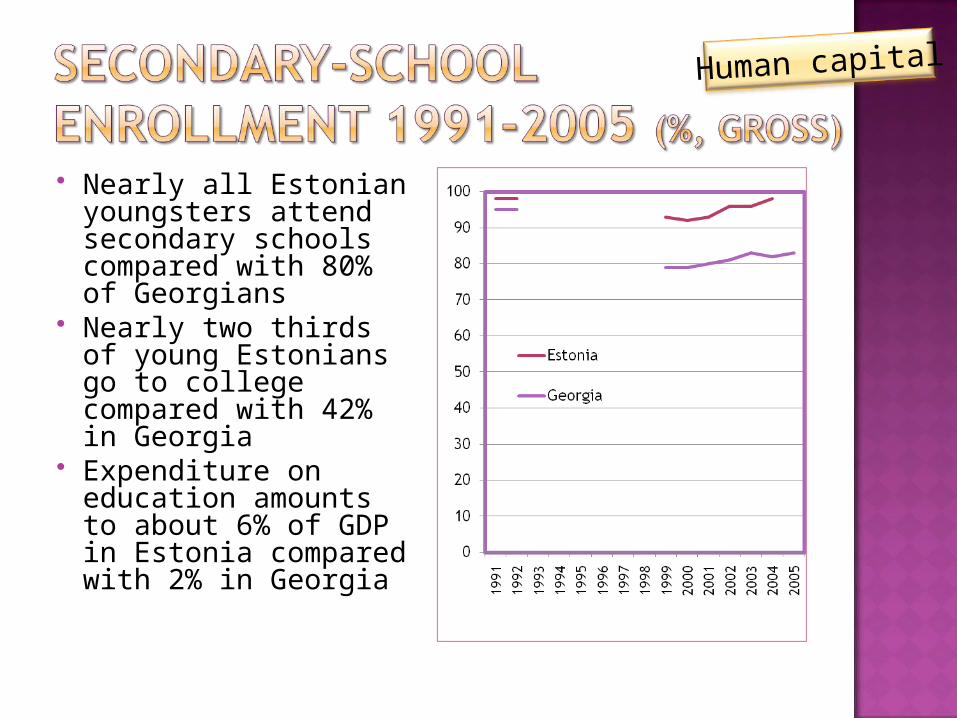
Nearly all Estonian youngsters attend secondary schools compared with 80% of Georgians
Nearly two thirds of young Estonians go to college compared with 42% in Georgia
Expenditure on education amounts to about 6% of GDP in Estonia compared with 2% in Georgia
Human capital
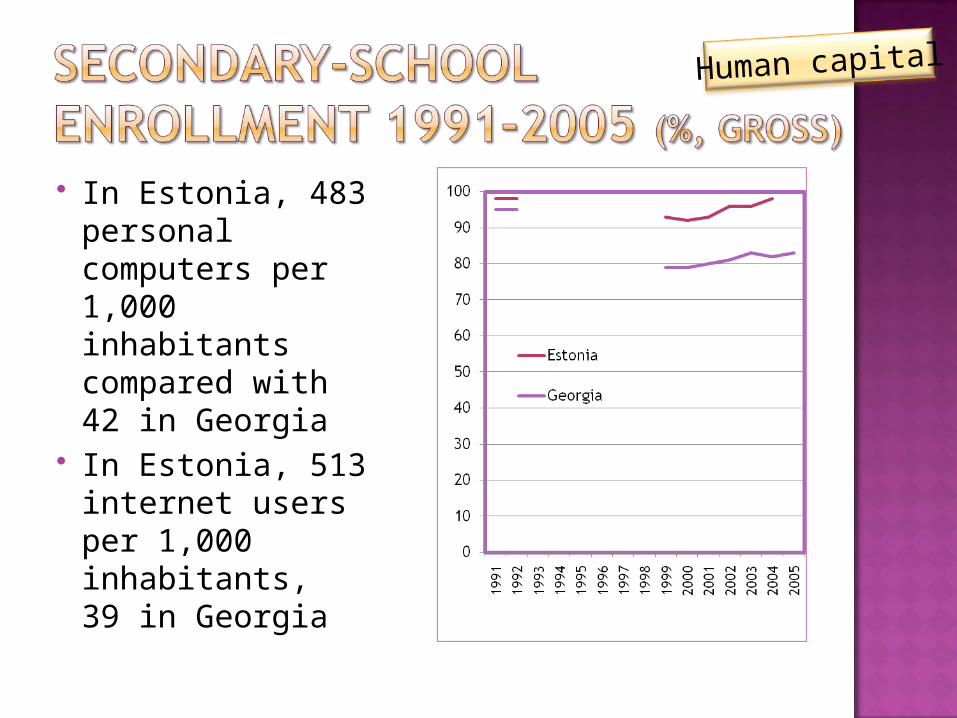
In Estonia, 483 personal computers per 1,000 inhabitants compared with42 in Georgia
In Estonia, 513 internet users per 1,000 inhabitants,
39 in Georgia
Human capital
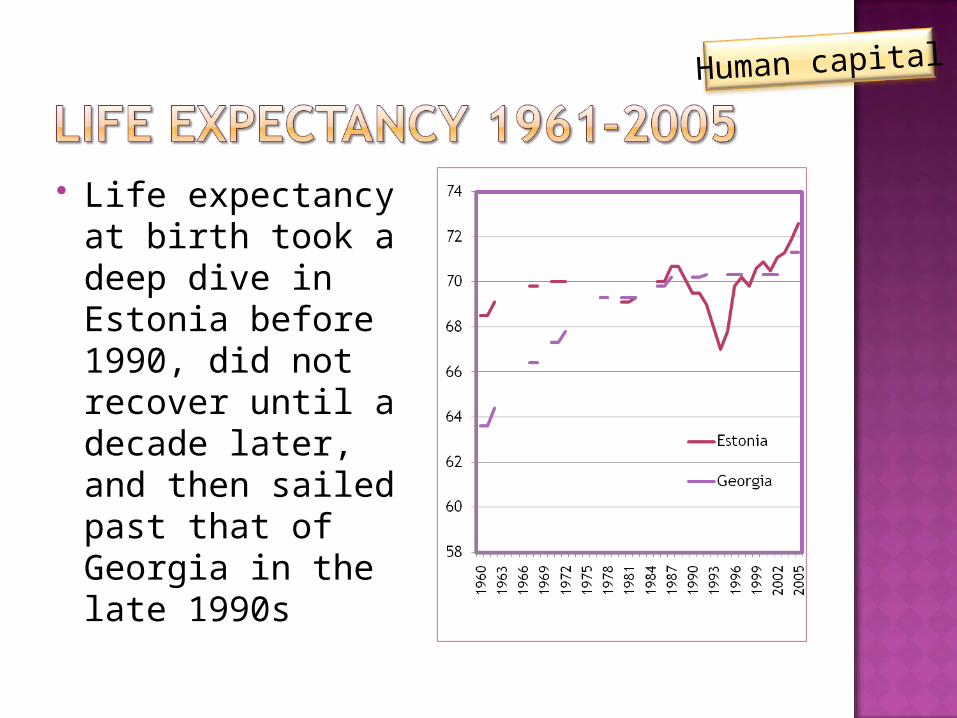
Life expectancy at birth took a deep dive in Estonia before 1990, did not recover until a decade later, and then sailed past that of Georgia in the late 1990s
Human capital
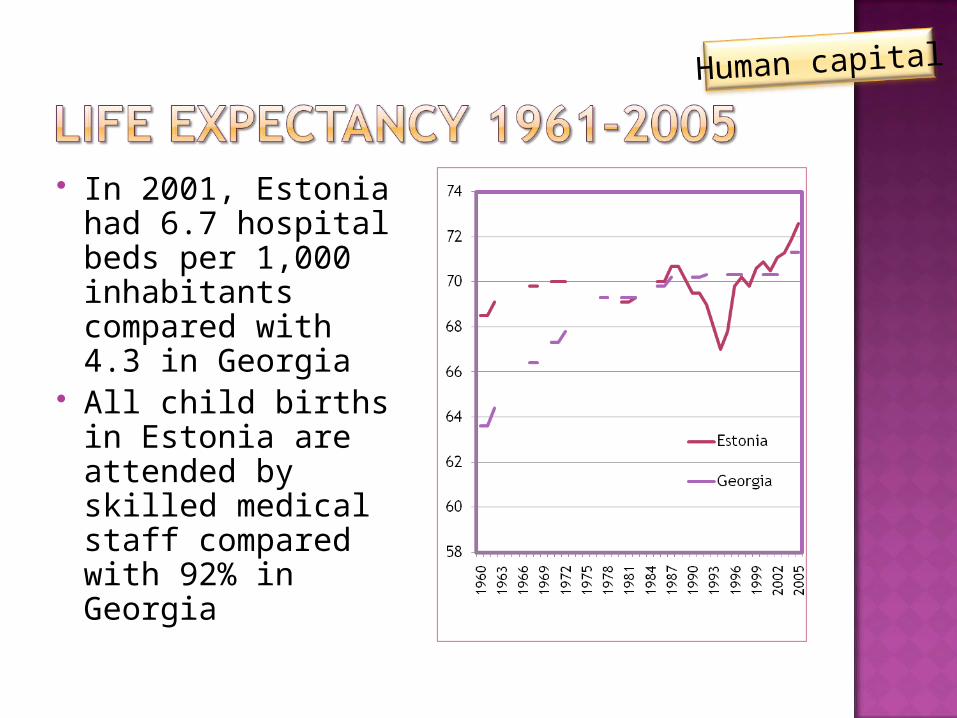
In 2001, Estonia had 6.7 hospital beds per 1,000 inhabitants compared with 4.3 in Georgia
All child births in Estonia are attended by skilled medical staff compared with 92% in Georgia
Human capital
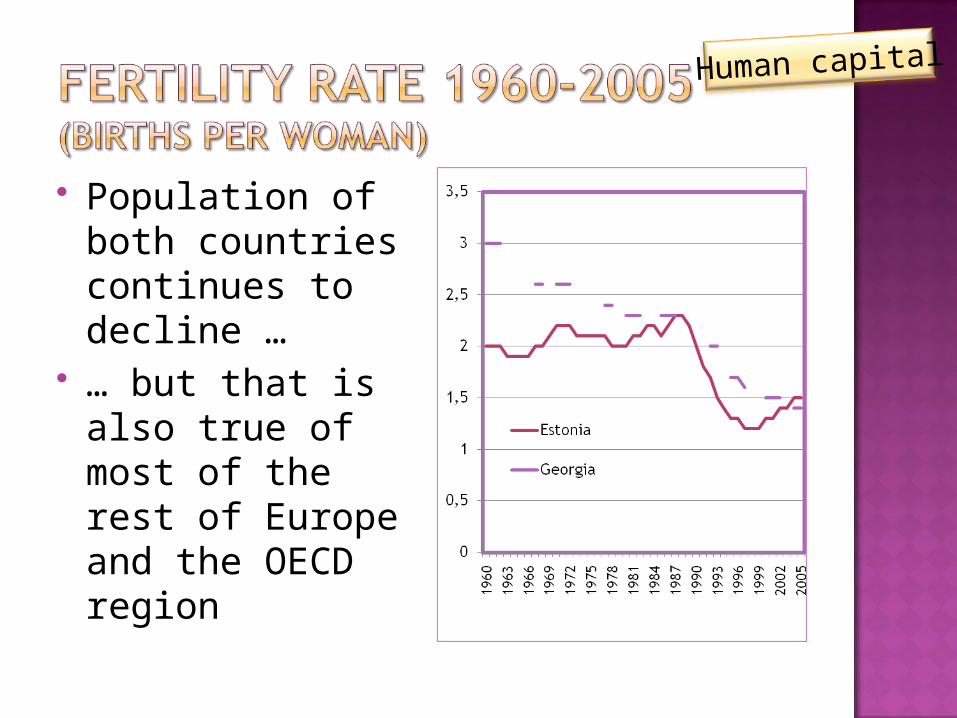
Population of both countries continues to decline …
… but that is also true of most of the rest of Europe and the OECD region
Human capital
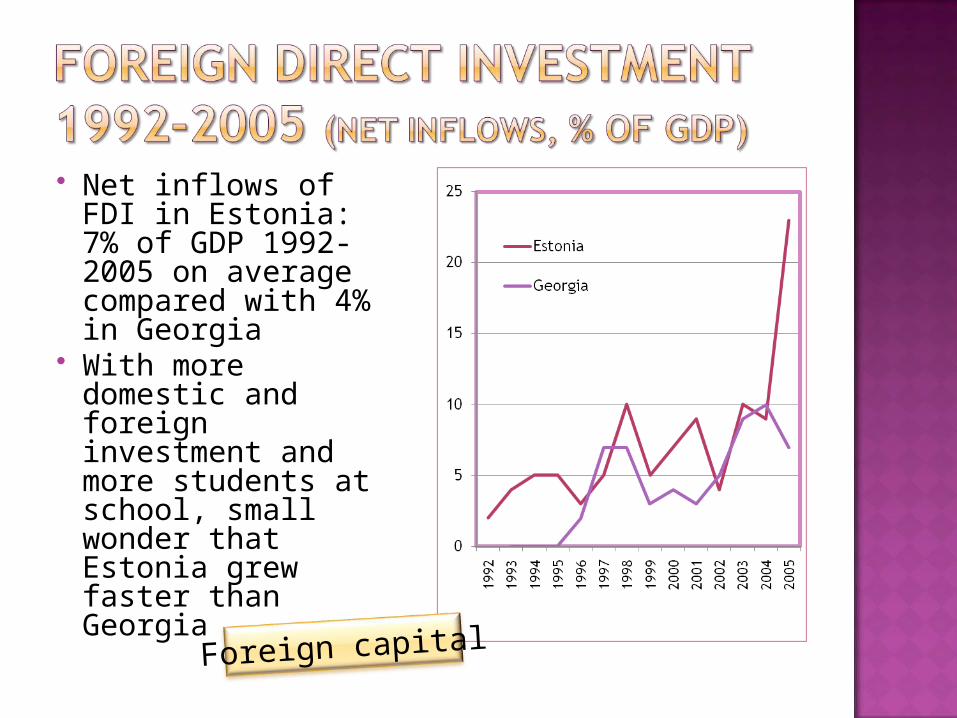
Net inflows of FDI in Estonia: 7% of GDP 1992-2005 on average compared with 4% in Georgia
With more domestic and foreign investment and more students at school, small wonder that Estonia grew faster than Georgia
Foreign capital
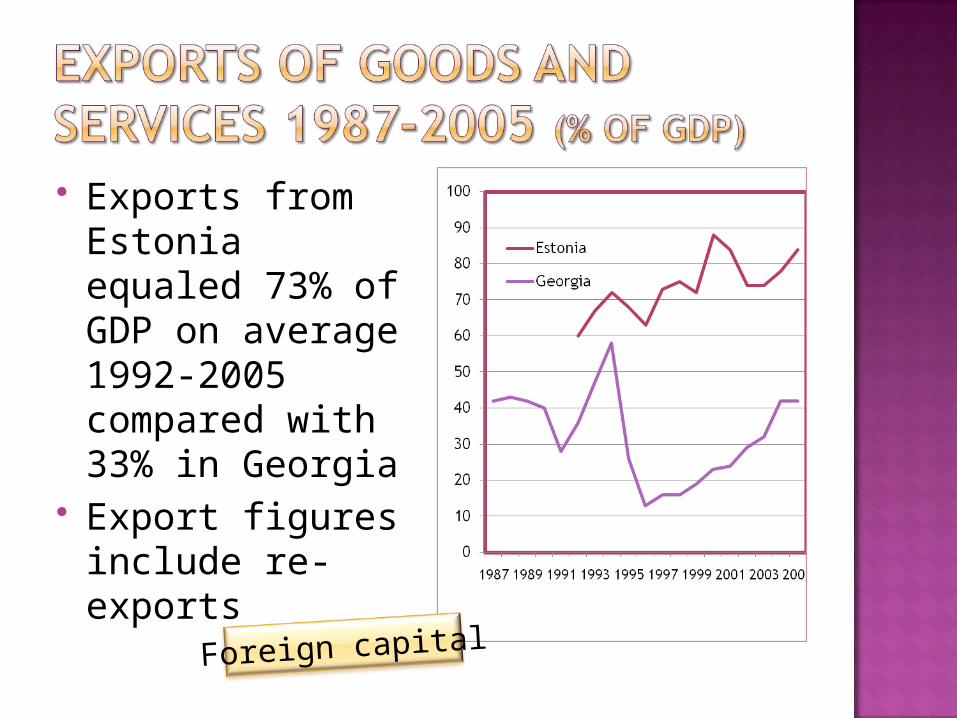
Exports from Estonia equaled 73% of GDP on average 1992-2005 compared with 33% in Georgia
Export figures include re-exports
Foreign capital
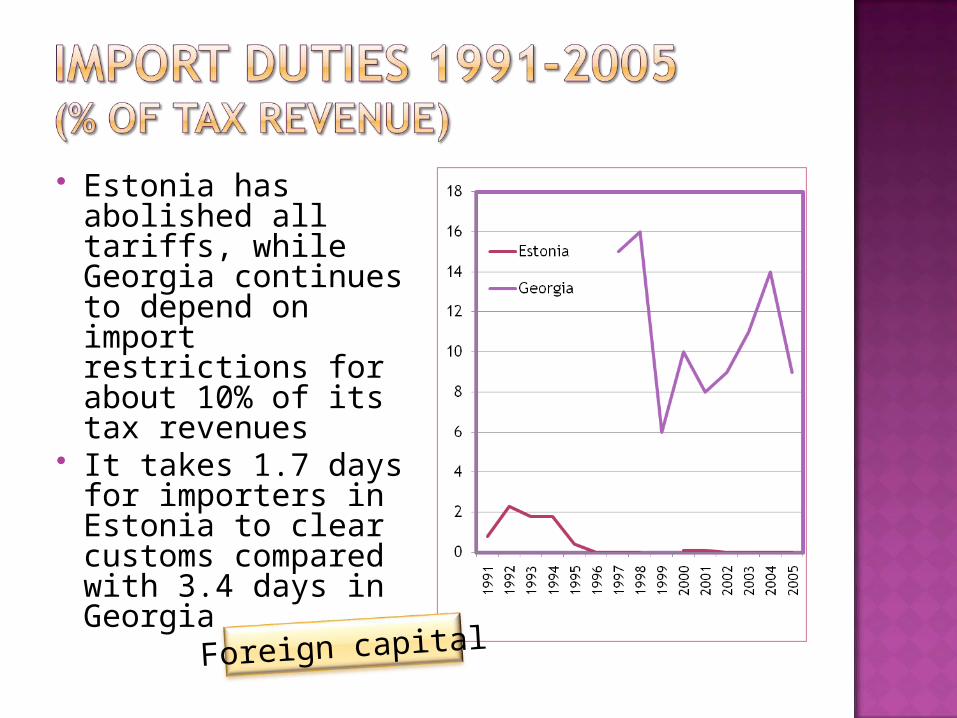
Estonia has abolished all tariffs, while Georgia continues to depend on import restrictions for about 10% of its tax revenues
It takes 1.7 days for importers in Estonia to clear customs compared with 3.4 days in Georgia
Foreign capital
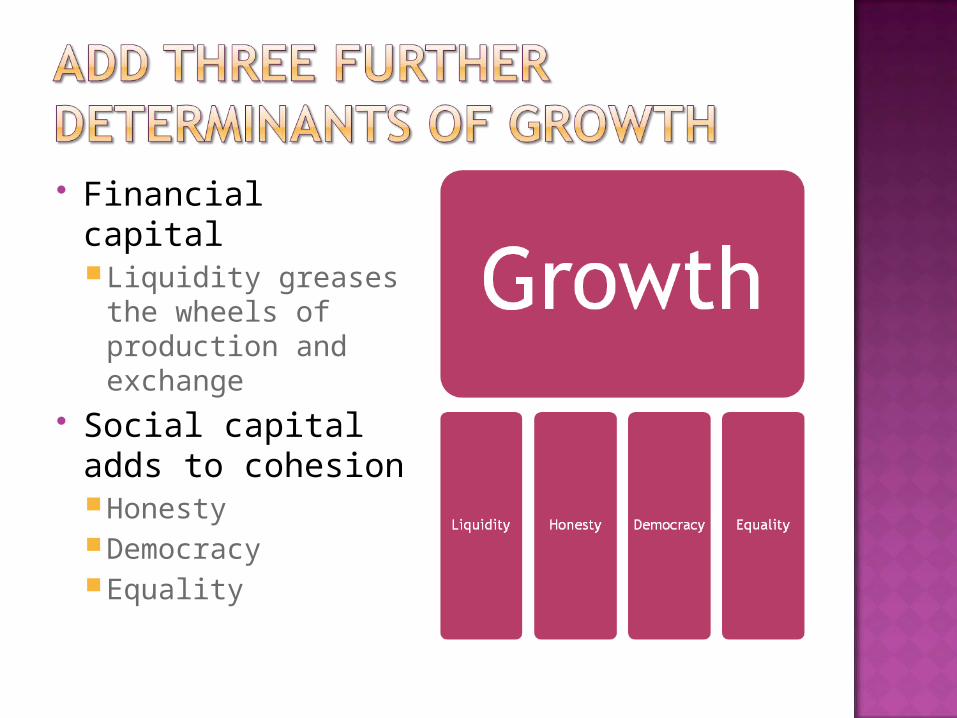
Financial capitalLiquidity greases
the wheels of production and exchange
Social capital adds to cohesionHonestyDemocracyEquality
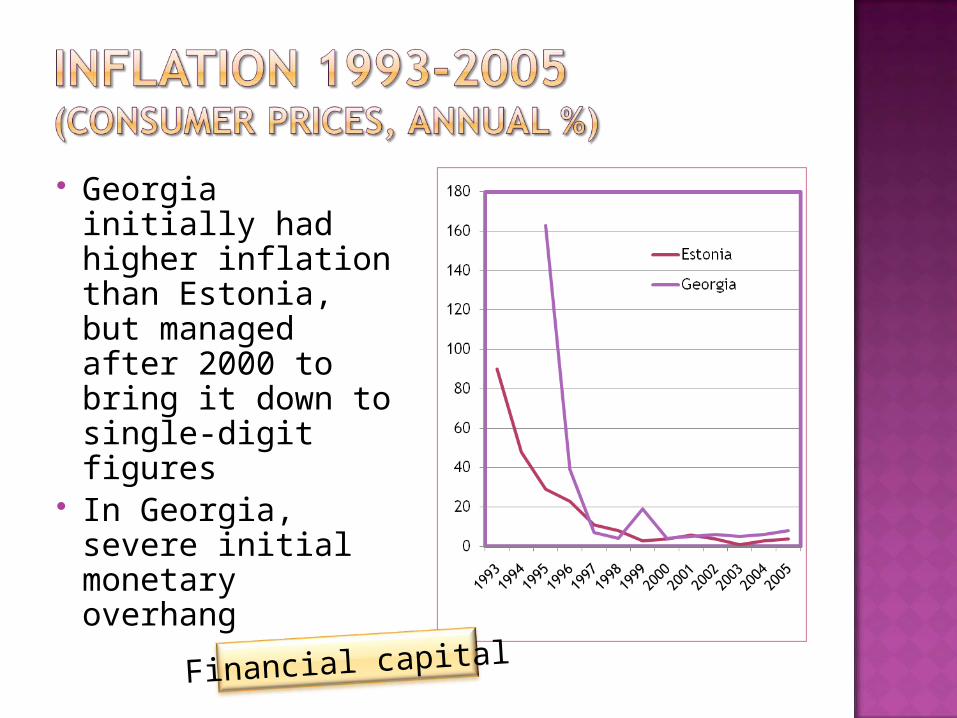
Georgia initially had higher inflation than Estonia, but managed after 2000 to bring it down to single-digit figures
In Georgia, severe initial monetary overhang
Financial capital
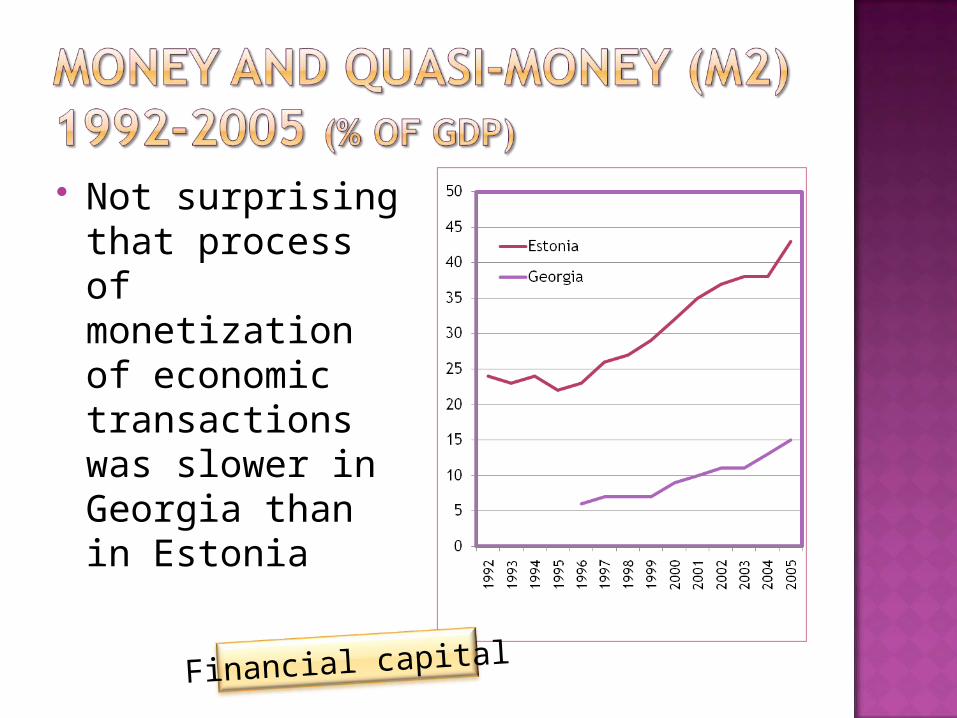
Not surprising that process of monetization of economic transactions was slower in Georgia than in Estonia
Financial capital
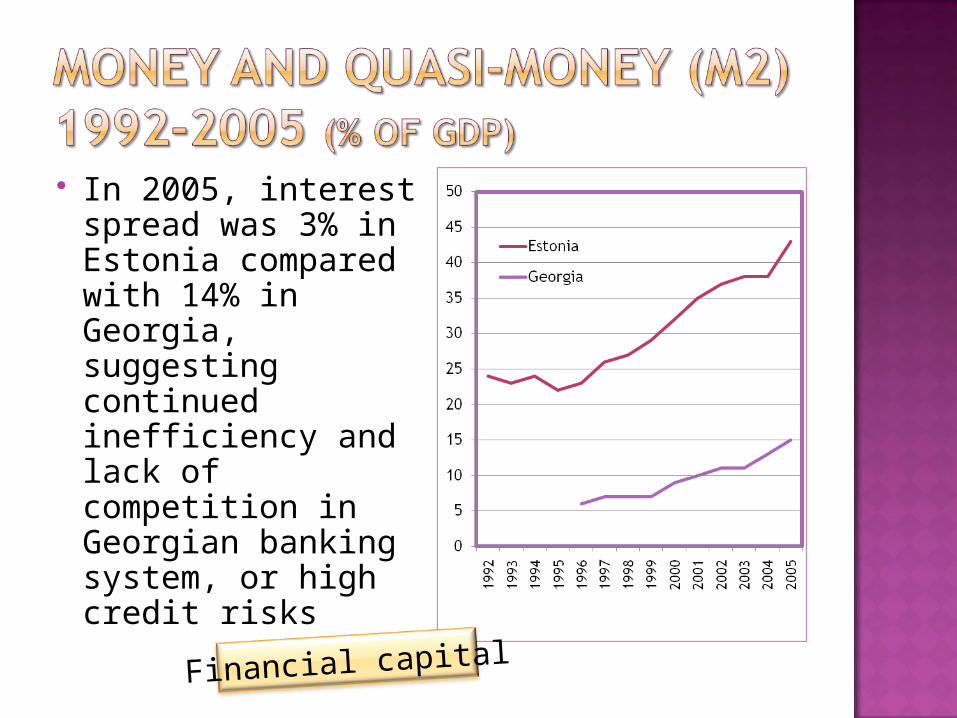
In 2005, interest spread was 3% in Estonia compared with 14% in Georgia, suggesting continued inefficiency and lack of competition in Georgian banking system, or high credit risks
Financial capital
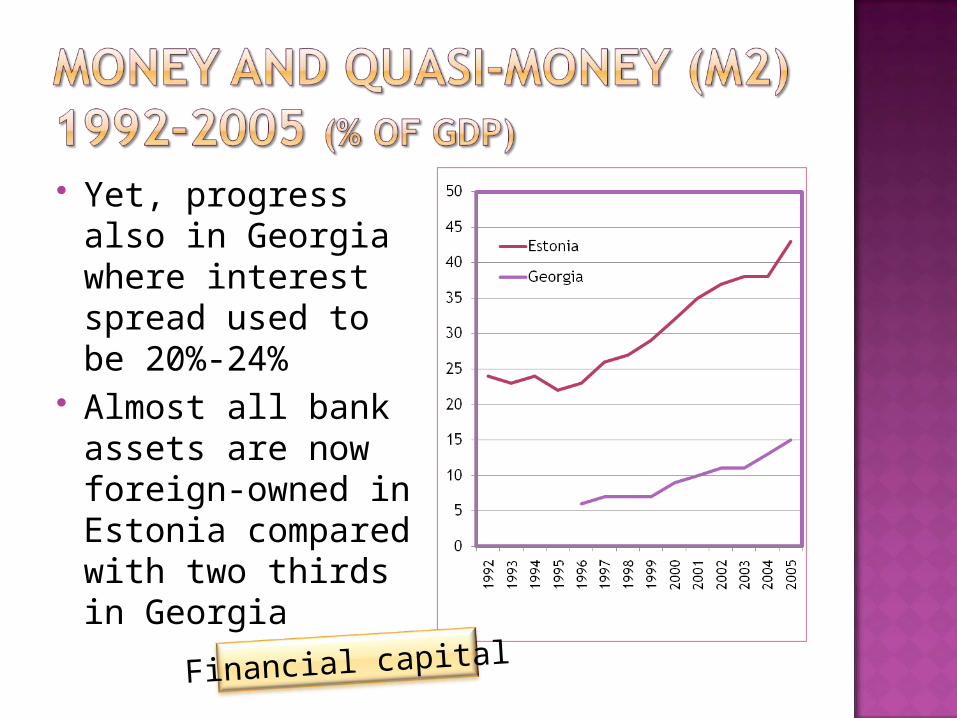
Yet, progress also in Georgia where interest spread used to be 20%-24%
Almost all bank assets are now foreign-owned in Estonia compared with two thirds in Georgia
Financial capital
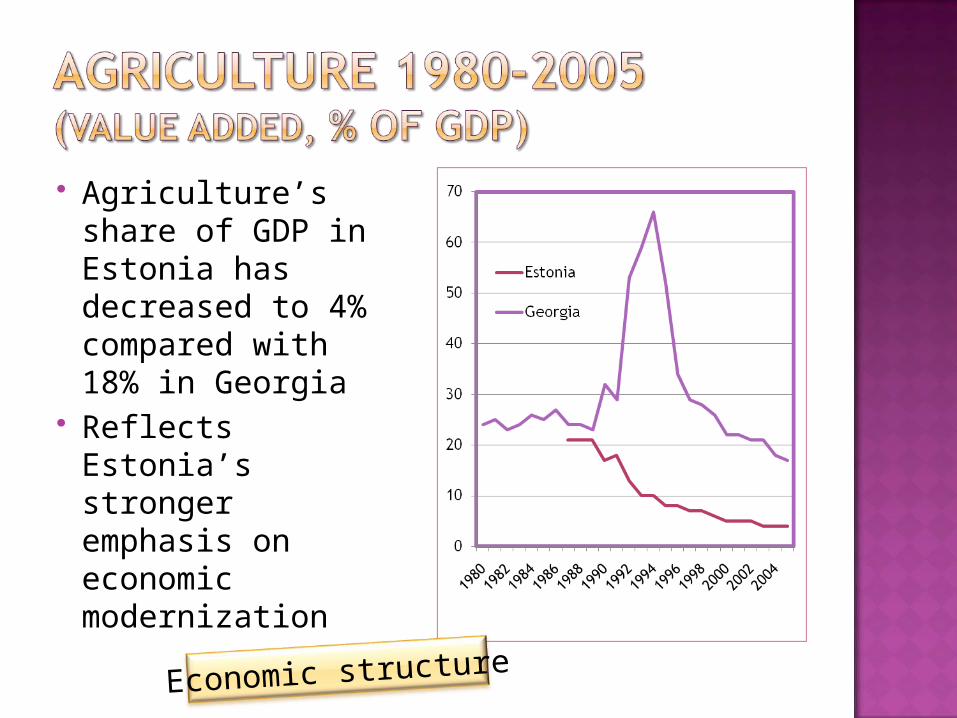
Agriculture’s share of GDP in Estonia has decreased to 4% compared with 18% in Georgia
Reflects Estonia’s stronger emphasis on economic modernization
Economic structure
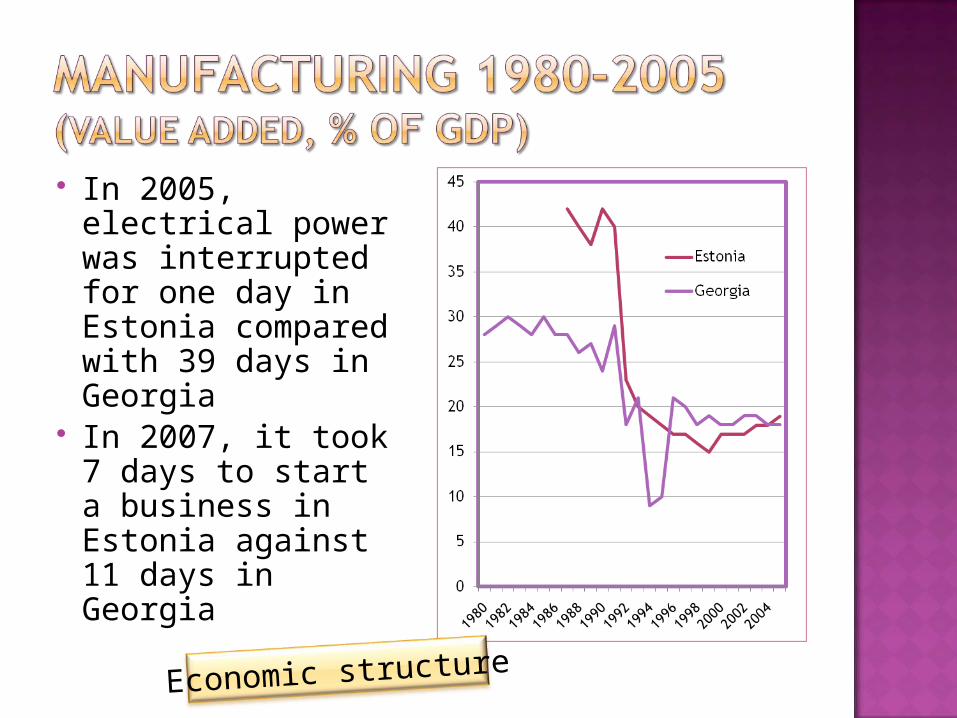
In 2005, electrical power was interrupted for one day in Estonia compared with 39 days in Georgia
In 2007, it took 7 days to start a business in Estonia against 11 days in Georgia
Economic structure
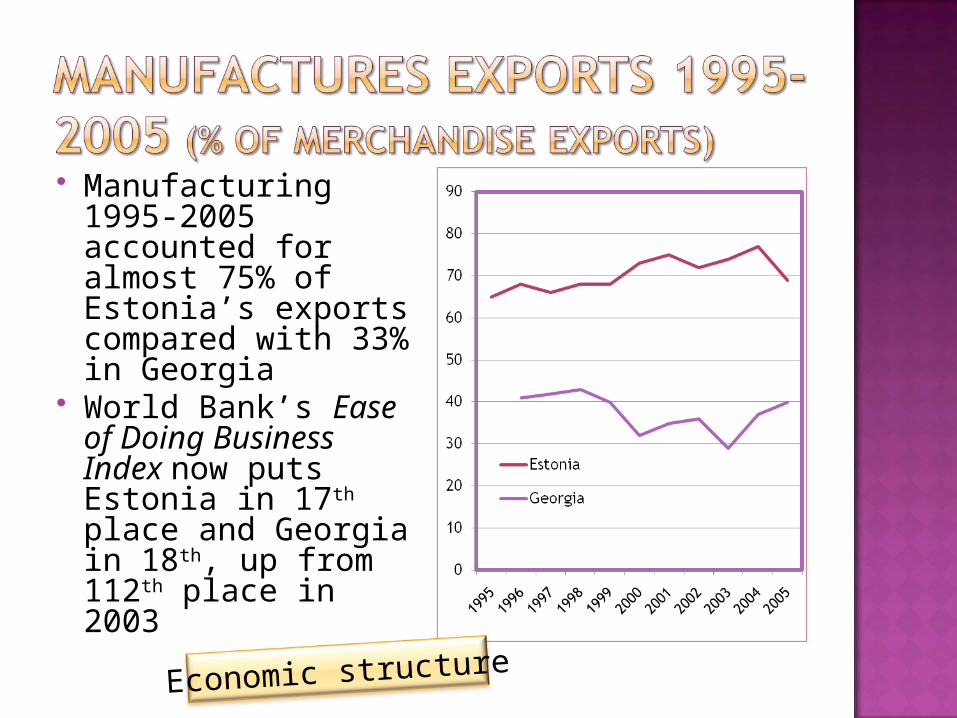
Manufacturing 1995-2005 accounted for almost 75% of Estonia’s exports compared with 33% in Georgia
World Bank’s Ease of Doing Business Index now puts Estonia in 17th place and Georgia in 18th, up from 112th place in 2003
Economic structure
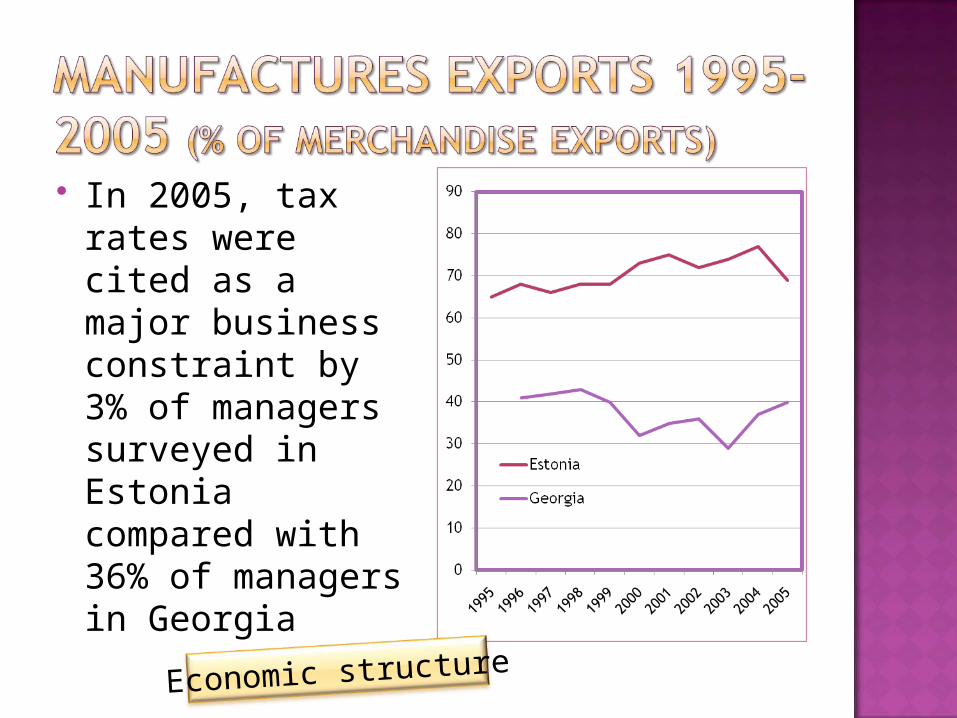
In 2005, tax rates were cited as a major business constraint by 3% of managers surveyed in Estonia compared with 36% of managers in Georgia
Economic structure
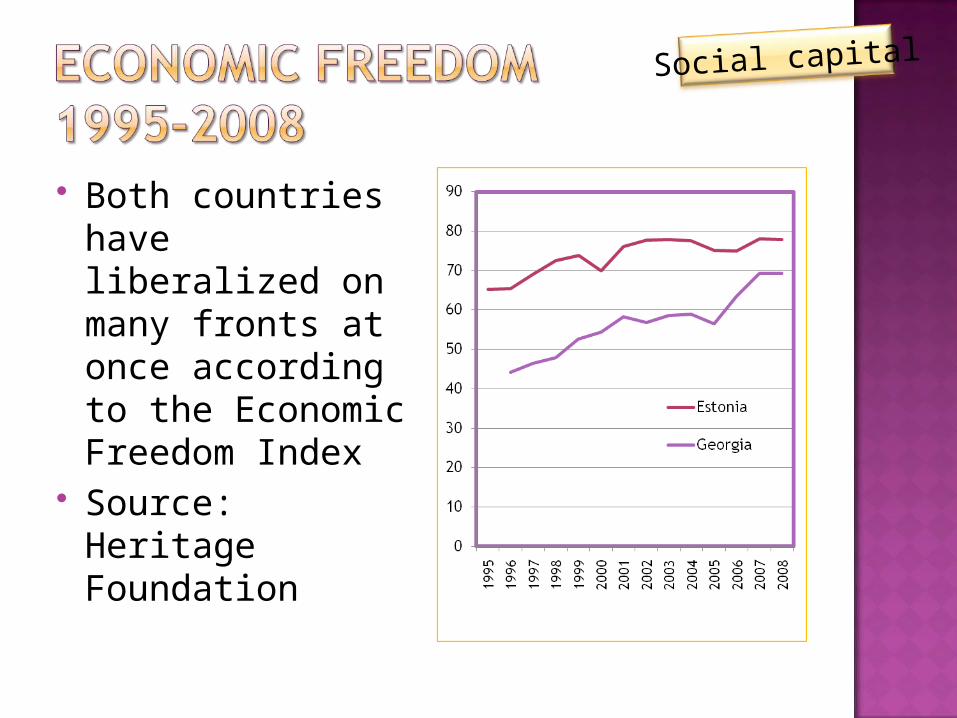
Both countries have liberalized on many fronts at once according to the Economic Freedom Index
Source: Heritage Foundation
Social capital
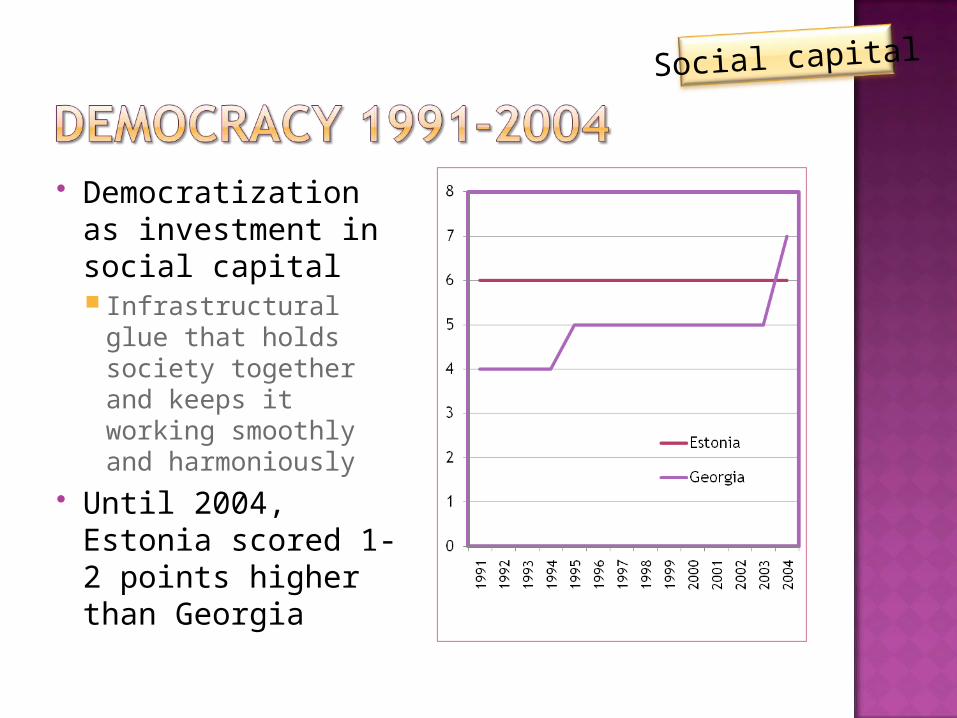
Democratization as investment in social capital Infrastructural glue
that holds society together and keeps it working smoothly and harmoniously
Until 2004, Estonia scored 1-2 points higher than Georgia
Social capital
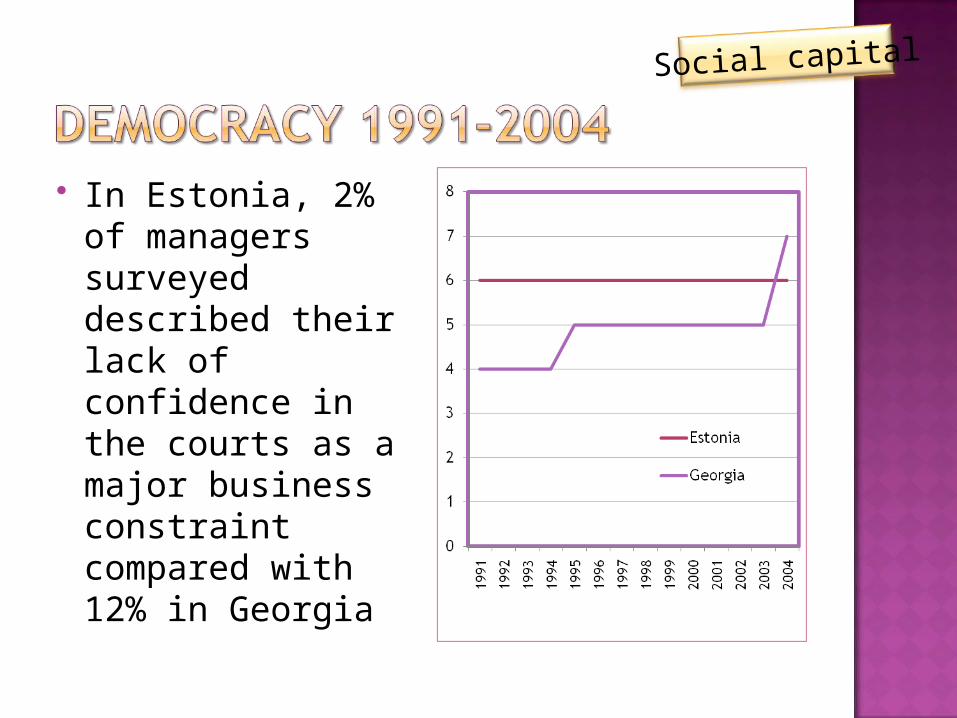
In Estonia, 2% of managers surveyed described their lack of confidence in the courts as a major business constraint compared with 12% in Georgia
Social capital

In Estonia, 2% of the managers surveyed described crime as a major business constraint compared with 24% in Georgia
Social capital
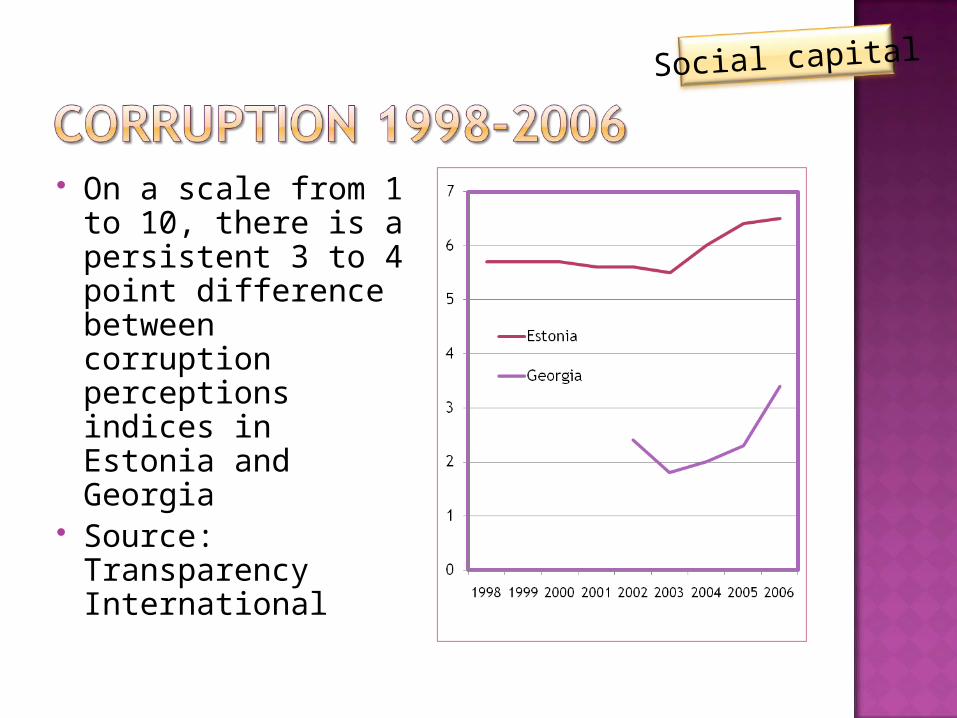
On a scale from 1 to 10, there is a persistent 3 to 4 point difference between corruption perceptions indices in Estonia and Georgia
Source: Transparency International
Social capital
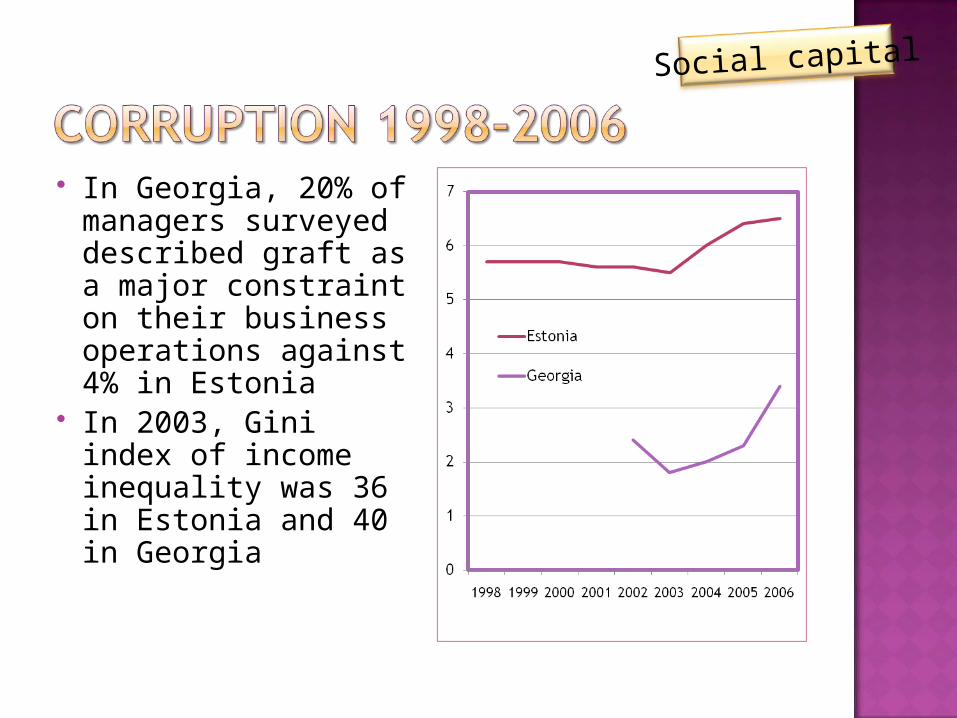
In Georgia, 20% of managers surveyed described graft as a major constraint on their business operations against 4% in Estonia
In 2003, Gini index of income inequality was 36 in Estonia and 40 in Georgia
Social capital
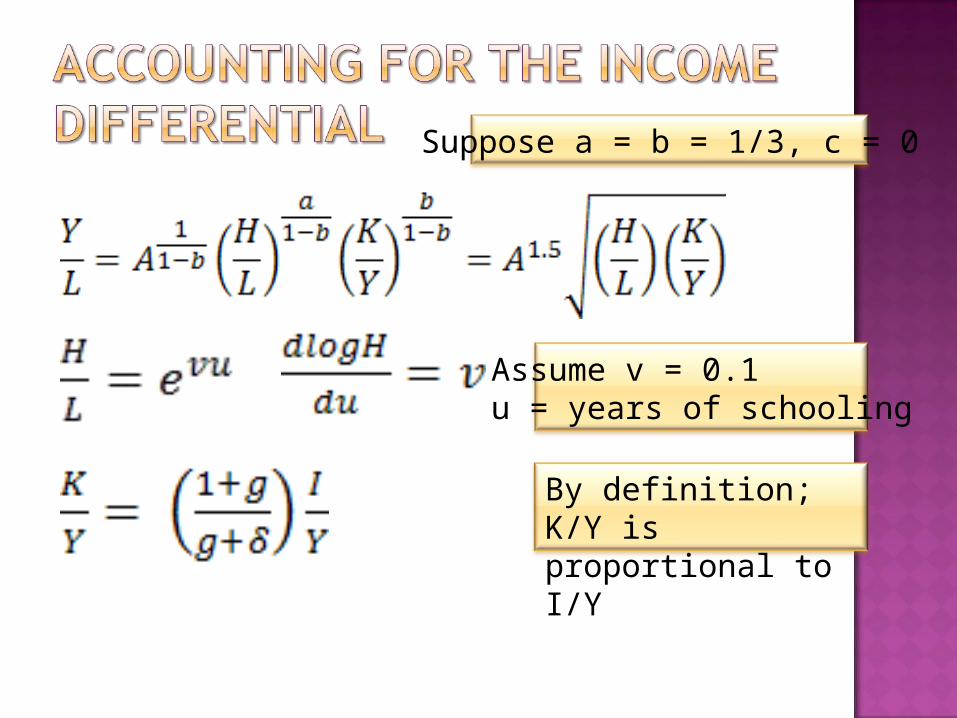
Suppose a = b = 1/3, c = 0
Assume v = 0.1u = years of schooling
By definition; K/Y is proportional to I/Y
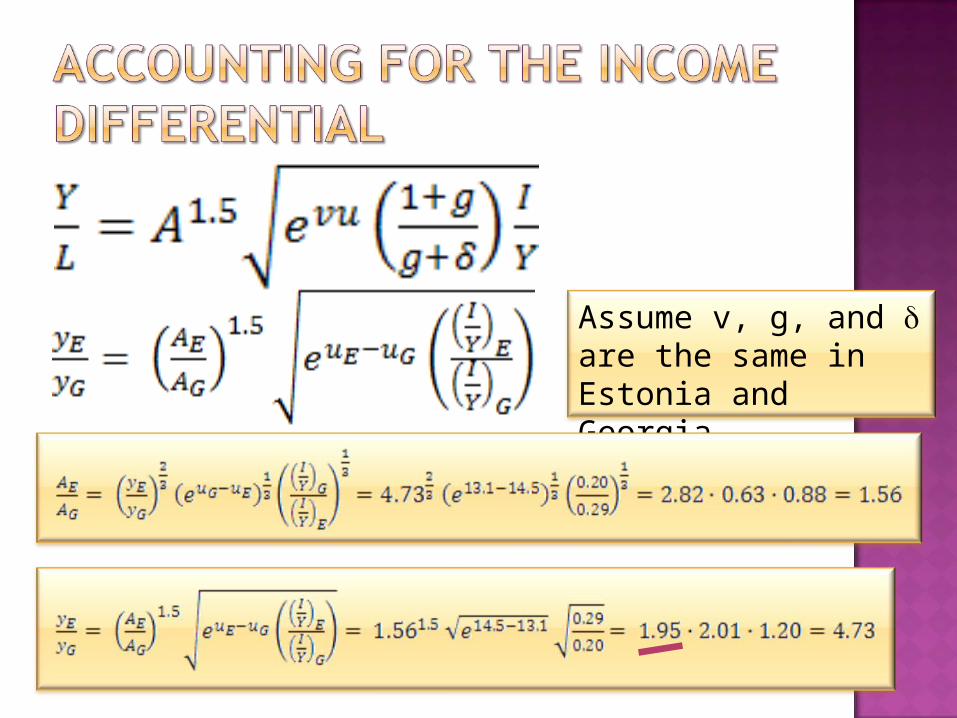
Assume v, g, and are the same in Estonia and Georgia
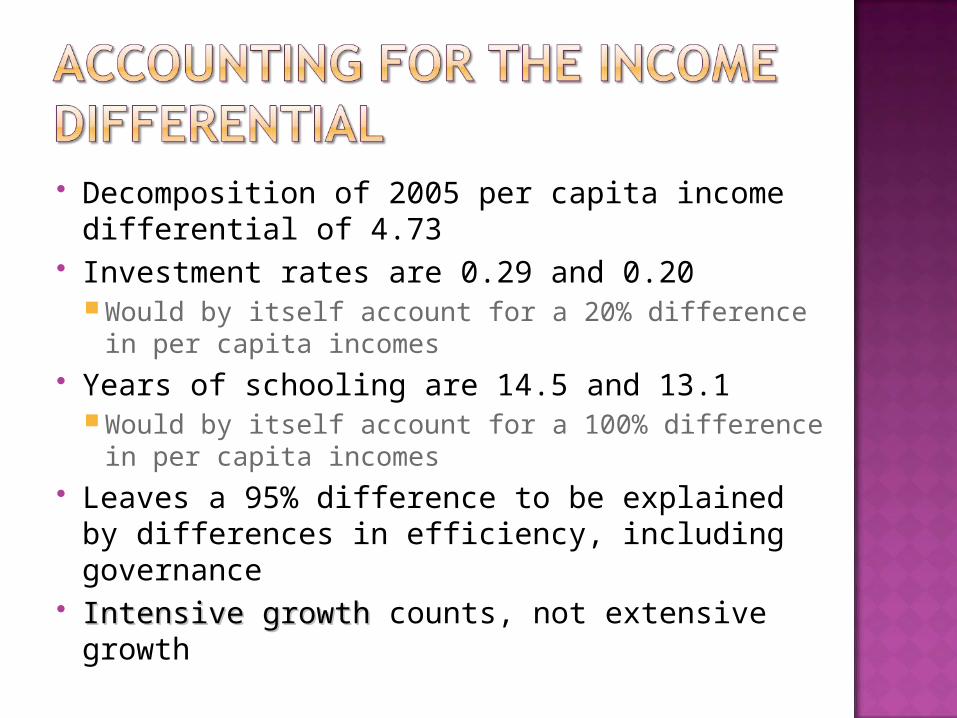
Decomposition of 2005 per capita income differential of 4.73
Investment rates are 0.29 and 0.20 Would by itself account for a 20% difference in per
capita incomes Years of schooling are 14.5 and 13.1
Would by itself account for a 100% difference in per capita incomes
Leaves a 95% difference to be explained by differences in efficiency, including governance
Intensive growthIntensive growth counts, not extensive growth
Estonia invested more relative to GDP than Georgia, and also attracted more FDI
Estonia sends more young people to secondary schools as well as to colleges and universities than Georgia
Estonia has done more than Georgia to increase economic efficiency LiberalizeLiberalize trade StabilizeStabilize prices, stem corruption PrivatizePrivatize its banks and other state enterprises
Estonia has moved farther and faster in a growth-friendly direction