Embed Size (px)
Citation preview

Proceedings of the 6th International Conference on the Application
of Physical Modelling in Coastal and Port Engineering and Science
(Coastlab16)
Ottawa, Canada, May 10-13, 2016
Copyright ©: Creative Commons CC BY-NC-ND 4.0
1
THOUGHTS ON THE FUTURE OF PHYSICAL MODELS IN COASTAL ENGINEERING
BILL BAIRD1, SETH LOGAN2, WIM VAN DER MOLEN3, TREVOR ELLIOTT4, DON ZIMMER5
1 Baird & Associates, Canada, [email protected]
2 Baird & Associates, Canada, [email protected]
3 Baird & Associates, Canada, [email protected]
4 Baird & Associates, Canada, [email protected]
5 Baird & Associates, Canada, [email protected]
ABSTRACT
This paper considers the future of physical models, relative to numerical models, as a tool to assist in the design of
coastal structures. Three case histories are examined in which both physical and numerical models were used to define the
hydrodynamic loads on a pile supported coastal structure, the response of a moored vessel to hydrodynamic forces, and the
stability of a breakwater. It is concluded that, while the ongoing development of numerical models will show significant
progress in the next few years, the physical model will continue to have a significant role in many coastal engineering
projects. For breakwater design in particular, the physical model will be the standard of care for at least the next 10 years.
KEWORDS: Physical Models, Numerical Models, Breakwaters, Hydrodynamic Loading, Ship Response, Validation.
1 INTRODUCTION
The design of many coastal structures has not followed typical, physics based engineering design methods or
procedures, as is the case for most civil engineering structures. The reason for this is that historically, the interaction of
waves with coastal structures has defied analysis due to its complexity. It has been suggested that it is easier to put a man
on the moon than to design a breakwater, implying that we know more about the forces on a rocket travelling from the earth
to the moon than we do about wave forces on a breakwater.
Until the 1930s coastal structures were largely designed by trial and error. If a structure was damaged in a storm it was
rebuilt to be stronger. The failures of coastal structures were discussed at conferences and engineers learned from the
experiences of others. This approach had limitations, particularly when two project sites were dissimilar. In other words,
the lessons learned on one project might not be sufficient to ensure a safe and stable design for another project.
In the 1930s, civil engineers started to use physical models to allow the trial and error process to continue, but at a
lower cost. Rules of thumb were developed, but the documentation and interpretation of results were limited by the lack of
knowledge about the physics and statistics of surface waves. In these early years laboratories generated regular, sinusoidal
waves with plunging type wave generators. The USACE Vicksburg laboratory was a prime example of this. It was there
that Robert Hudson developed his basic equation that defined breakwater stability based on regular wave tests in a
laboratory flume. This equation was the classical formulation that is still used today for preliminary breakwater design,
(Hudson, 1953). Until Hudson’s work was repeated with irregular waves, interpretation of Hudson’s results was
problematic.
It was not until the 1960s and 1970s, when wave recorders provided the opportunity to develop long-term wave
statistics and define the irregular characteristics of sea states, that physical models became a reliable tool for coastal
engineers. With the available wave data, laboratories developed the capacity to generate irregular waves and eventually
multi-directional sea states. It was at this point that the physical model became an invaluable tool, allowing a coastal
engineer to develop designs in complex situations where the simplistic equations (such as Hudson’s equation) were clearly
insufficient. Laboratories continued to build better wave generators, more accurate measurement apparatus and larger wave
basins and flumes in order to reduce scale effects.
Little has changed in the 40-50 years since physical modelling became the accepted tool for the design of coastal
structures. Laboratory capabilities have become more robust, data management digital, wave generators more sophisticated,

2
measurement techniques more precise and data logging and analyses almost entirely automated. Today the use of a physical
model represents an accepted standard of care for the design of most coastal structures. Physical models remain an
irreplaceable tool, and are as essential for coastal engineers today as they were 40 years ago.
Over the past 30 years or so, with the development of the modern computer, the capability to numerically simulate
wave action on structures has come a very long way. Most recently, the development of numerical wave flumes has coastal
engineers questioning if this numerical tool could eventually replace the physical model in the coastal engineer’s toolbox.
Clearly numerical analysis of wave action has enormous potential and it will continue to be developed by researchers for
many years to come. The question is asked; at what point, if ever, will numerical modelling replace the physical model for
the coastal engineer?
This question does not have a simple answer. In some areas such as wave generation, wave propagation and nearshore
wave transformation, numerical models are extremely advanced and are already an acceptable alternative to physical
models. In other areas, such as in the design of a breakwater armour unit, numerical modelling has many challenges to
overcome before being a useful tool for the coastal engineer.
This paper presents a comparative analysis of three recent case studies in which Baird has been involved, all of which
present challenges that were once addressed by physical modelling alone. This paper discusses the advantages and
disadvantages of physical and numerical modelling for each case. The topics are the hydrodynamic loading on a pile
supported coastal structure, moored ship response and breakwater stability. Following an examination of the three case
studies, the topic of future computational power is addressed as it pertains to numerical modelling. Finally, the future of
physical modelling in coastal engineering is reviewed.
2 CASE STUDIES
2.1 Hydrodynamic Loading on a Pile Supported Coastal Structure
Figure 1 is an example of a project where both a physical and a numerical model were used to support the design of a
pile-supported wharf structure for a port expansion project. The proposed wharf was to be located in relatively shallow
water and exposed to large cyclonic waves (Hmax = 14 m, THmax = 11 s). The physical and numerical models were used to
simulate wave crest interactions with the wharf structure and to estimate impact loads and pressures on key elements of the
wharf deck and dolphin structures. Details of the two model studies are summarized as follows:
The 3D physical model tests were undertaken in the 63 m x 14 m Coastal Wave Basin (CWB) at the National
Research Council’s facilities in Ottawa, Canada. The 1:36.5 scale model was instrumented with
approximately forty sensors for measuring water levels, hydrodynamic pressures, and impact forces at various
locations on the dolphins and wharf deck structure. Most tests were conducted with 3 hour realizations of
irregular long crested waves for a range of water levels, wave conditions, wave directions, and deck
elevations;
Numerical modelling was undertaken using the commercial software package FLOW-3D® to simulate wave-
structure interactions for a 90 second irregular long crested wave group (including the maximum wave) for a
similar range of water levels, wave conditions, wave directions, and deck elevations. FLOW-3D® is a volume
of fluid computational fluid dynamics (CFD) model that solves the fundamental equations of fluid motion
with few simplifying assumptions. It includes a sophisticated free-surface tracking method that allows wave
runup, fluid splashing and jetting to be modelled. The model also includes a variety of wave generation and
wave absorption boundary conditions. In order to minimize scale effects, the numerical model was setup at
prototype scale. The model included a series of 4 nested grids, with the innermost grid (encompassing the
structure) having a cell resolution of 0.5 m. Additional details are included in Elliott & Fullarton (2014).

3
Figure 1. Model Setup (Physical Model – Left, and Numerical Model – Right)
A summary of the cost and time required for the physical and numerical modelling studies is presented below in Table
1. The scope of work for the two models was slightly different, making a like-for-like comparison difficult and
universal selection of one over the other for future studies dependent on the specific study needs, which vary from
project to project. The following comparisons and observations are made:
The physical model, although taking longer to set up and more costly, once running, completed tests much
more quickly and ultimately produced many more runs – establishing it as the primary tool for the study;
The numerical model was faster to set up and less costly, but could not produce the large number of
production runs quickly enough to meet the project requirements for detailed design. This was largely
dependent on the selected domain size and grid resolution (0.5 m cubic cells surrounding the structure). Had
the model been set up with a coarser grid, the computational time would have been reduced. However, given
the complexity and number of small structural features in the wharf that had to be simulated, a coarser grid
was not acceptable. Similarly, a finer grid would have resulted in a more accurate simulation due to the
improved resolution of air entrainment, turbulence, viscous effects, etc. However a finer grid would have
resulted in additional computational time. Therefore, the selected model resolution represented a compromise
between model accuracy and computational time;
Both types of models are permitted by DNV (2010), and both proved to be useful over the course of the
project;
Both the physical model and published findings from other studies were used to calibrate the numerical model
parameters. For example, benchmarking against 2D and 3D test cases documented in the technical literature
were used in selection of the turbulence model along with other numerical parameters and computational
settings;
Waves generated in the numerical model were validated against physical model measurements produced
during wave calibration testing without the structure in place;
Due to challenges associated with achieving stable, and actively breaking wave conditions at the structure
location, the physical model was used to define target (design) wave crest heights for the numerical model;
With the faster setup of the numerical model, and having benchmarked wave generation against physical
model measurements, impact loads predicted by the CFD model were used to guide load cell selection for the
physical model instrumentation.

4
Table 1. Comparison of Modelling Approaches
Physical Model CFD Model
Total Cost (incl. all fees)
(2011 dollars)
1.0 M USD
over 7 months
0.25 M USD
over 5 months
Setup & Testing Construction
& wave calibration
Initial benchmarking
& validation
Time to First Run 3 months 2 months
Time per Run 30 minutes a
Simulating 3 h of waves
2½ days b
Simulating 90 s of waves
Number
of Runs
~400
over 4 months
~20
over 3 months (intermittent) a At geometric Froude scale of 1:36.5. b For 8 million computational cells on 4-core CPU, 3.2 & 3.4Ghz Core i7 processors.
A comparison of measured and predicted wave loads is shown in Figure 2. The upper panel shows the water surface
elevations measured in the physical model in blue (WP4 and WP6), with numerical model predictions shown in red (NM).
Associated wave force time series are shown in the lower panel. The left panel compared vertical uplift loads on the deck of
one of the leading dolphins, whereas the right panel shows the force time series for a large downward (suction) load that
occurs on the front slab of the wharf deck. These comparisons indicate that the numerical model predicts peak impact loads
within approximately 15 percent of the physical model measurements. In both examples, the numerical model appears to
slightly underestimate compared to the physical model. Scale effects in the physical model (e.g. air entrainment, surface
tension, etc.) do not appear to be significant, as indicated by the similarity in the numerical and physical model results. The
successful validation against the physical model also indicates that the grid size selected in the numerical model is sufficient
to resolve the critical processes for this particular application. This implies that grid convergence is achieved, meaning that
a finer grid would not have produced significantly different results.
Figure 2. Force Time Histories from Numerical (NM) & Physical Models (PM) (mooring dolphin – left, and deck slab – right)
Based on the preceding evaluation, it was concluded that the CFD model could be used for preliminary design of this
project where physical model results were not available, or to supplement physical model results for elements and structure
locations where measurements were not obtained, or for subsequent tests where specific conditions were not tested. The
physical model, however, was the primary tool, producing an extensive database that included hundreds of runs to support
detailed design.
Nevertheless, CFD is becoming more common, especially as an initial design tool or for projects where budget and
schedule cannot support extensive physical modelling but where numerical model predictions can provide an initial
assessment more quickly and at relatively low cost. Both approaches are data rich and provide excellent visualization of
free-surface impacts, which is invaluable for understanding the physical processes.

5
Looking to the future, as affordable computing power increases (as discussed in Section 3 below), it is envisioned that
CFD modelling of wave loads on pile supported coastal structures such as the decks and piles of marine structures will
become common place for most projects of this type. However, the value of the physical model endures, both in the
generation of calibration data for these numerical models, and as a more efficient production tool for detailed design studies.
2.2 Moored Ship Response
Physical modelling of moored ships in waves has historically progressed along two tracks. The first tack has focused
on modelling of offshore moorings in the open ocean, particularly in deep water. This has mostly been undertaken at
maritime laboratories that specialize in testing for ship design. The second track has focused on modelling of ships moored
in coastal areas and protected harbours. This work has mostly been conducted at coastal laboratories and is the focus of this
section.
In moored ship response, second-order long waves are often more important than primary waves. This is because the
natural periods in surge, sway and yaw of large moored ships are much longer than the primary wave periods. These long
waves, with periods ranging from 30 s to 300 s, are generated as short wave groups propagate into shallow water.
There are many challenges related to the physical modelling of long waves:
Correct generation of long waves at the wave generator: If second-order effects are not properly
accounted for, a spurious free long wave will be generated at the wave generator. Pioneering work in the
1970s and 1980s led to improved wave generator driver algorithms that eliminated the generation of these
spurious free long waves (Barthel et al., 1983).
Model domain size and model scale: A trade-off often exists between the area required to simulate long
wave transformation (refraction, reflection) and an acceptable model scale (usually between 1:100 and 1:40).
Wave breaking in the surf zone and reflection of long waves from the shore: These processes contribute
to the amplification of long waves. Short waves break at the shore and long waves may partially reflect (Van
Dongeren et al., 2007) and can travel into the area of concern. Scale effects can distort the effects of long
wave reflection in physical models, especially at very small scales, due to relatively large bottom friction in
the swash zone.
Reflection from revetments and transmission through breakwaters: These processes need to be scaled
according to Reynolds scaling instead of Froude scaling. This needs careful consideration, particularly when
simulating the transmission of long waves through the core of porous breakwaters.
Reflection at other “open” boundaries and at the wave generator: Unwanted reflections can create
spurious oscillations in the laboratory basin, which are difficult to suppress due to the small velocities in the
long waves. Wave absorption beaches need to be carefully designed, which can present a challenge when
modelling a variety of water levels. Active reflection compensation at the wave generator is not always
accurate for very small wave heights and long wave periods.
Accurate measurement of long waves: Considering the small scale at which these models are operated and
the second order nature of the long waves, the low frequency wave height is typically in the order of a
millimetre. Electronic drift effects in probes can cause erroneous long wave readings. Capacitance gauges
are preferred over resistance probes, although the former can be prone to drift over time.
Laboratories have made significant improvements to address the challenges listed above. Long waves can now be
generated accurately at the wave generator and, to some extent, absorbed. The processes of wave transmission and wave
absorption are also better understood. However, given that most models are tested at a very small scale, there are scale
effects in the surf and swash zones, and the accurate measurement of very small long waves remains a significant challenge.
Similarly, over the past two decades several advancements have also been made in the numerical modelling of moored
ships in coastal waters (Bingham, 2000; Van der Molen, 2006; Van der Hout et al., 2015). These methods are generally
composed of the following three components:
1. A wave model to compute the wave propagation into the area of interest;
2. A ship motion simulation model that models the movements of the moored ship in six degrees of freedom in
time-domain with forcing due to waves, wind and current; and
3. A tool to couple the above models and calculate the wave forces on the ship considering the shape of the hull.
Boussinesq models are commonly used to determine the wave conditions. The present low-order Boussinesq models
can handle domains that are much larger than a physical model (10 km x 10 km), but have strict water depth restrictions
(h/L < approx. 0.5). However, modelling the surf and swash zones for long wave reflection is not yet practical for very
large domains. Improved higher order models are under development (Madsen & Fuhrman, 2010). These models are still
very computationally intensive, but this is expected to improve in the near future.
Dedicated long wave models, such as XBeach (Roelvink et al., 2009), are good alternatives considering present day
computational capabilities. The long waves and short wave groups are phase resolved in Xbeach, thus the individual short
6
waves are not modelled. This means that the model grid can be much coarser than for a Boussinesq model. Long wave
growth and dissipation processes around the surf and swash zones are also well represented in Xbeach. The limitation of
this type of model is that short-wave diffraction is not simulated and it is not possible to retrieve the exact short-wave
surface elevations from the short-wave energy records.
Coupling of wave models to ship motion models is most commonly done using panel models. This provides a way to
conveniently link a complex three dimensional shape, such as a ship hull, to a 2D (depth-averaged) wave model. The main
limitation of panel models is that they are based on potential flow. There are methods by which viscous damping can be
included using, for example, a free surface lid. But as these methods are not based on the modelling of actual physical
processes, careful calibration is required.
Application of CFD models in ship hydrodynamics has grown significantly in recent years, especially for hull design.
All potential and viscous flow phenomena around the hull can be modelled accurately with CFD models. However, the
application of CFD models in large coastal areas is not practical at present, both because of the required computational
power and complexity of the model set-up. However, considering the above discussion, using a CFD model to simulate the
processes around the hull, coupled to a wave model for large coastal areas, is likely to become the standard procedure for
these types of projects in the near future. In that way, large coastal areas can be represented, the hull shape accurately
represented and the viscous effects between the ship and other structures properly taken into account. There are, however,
still several challenges that need to be addressed to properly link the wave models to the boundaries of the CFD model. The
prescribed conditions on the CFD model boundaries would be a complex multi-directional wave pattern, and this boundary
should also be open (non-reflective) to pass reflected waves from the ship.
A specific project example, which features both physical and numerical modelling of moored ship response in coastal
waters, is presented here for an offshore bulk terminal. The offshore terminal was designed for deep draft vessels and
includes a long navigation channel and basin dredged in shallow waters. A wharf is featured in the center of the dredged
basin, designed to accommodate bulk carriers. The mooring configuration is fairly standard with the ship moored to the
fendered wharf by synthetic mooring lines. The dredged basin layout is illustrated in Figure 3.
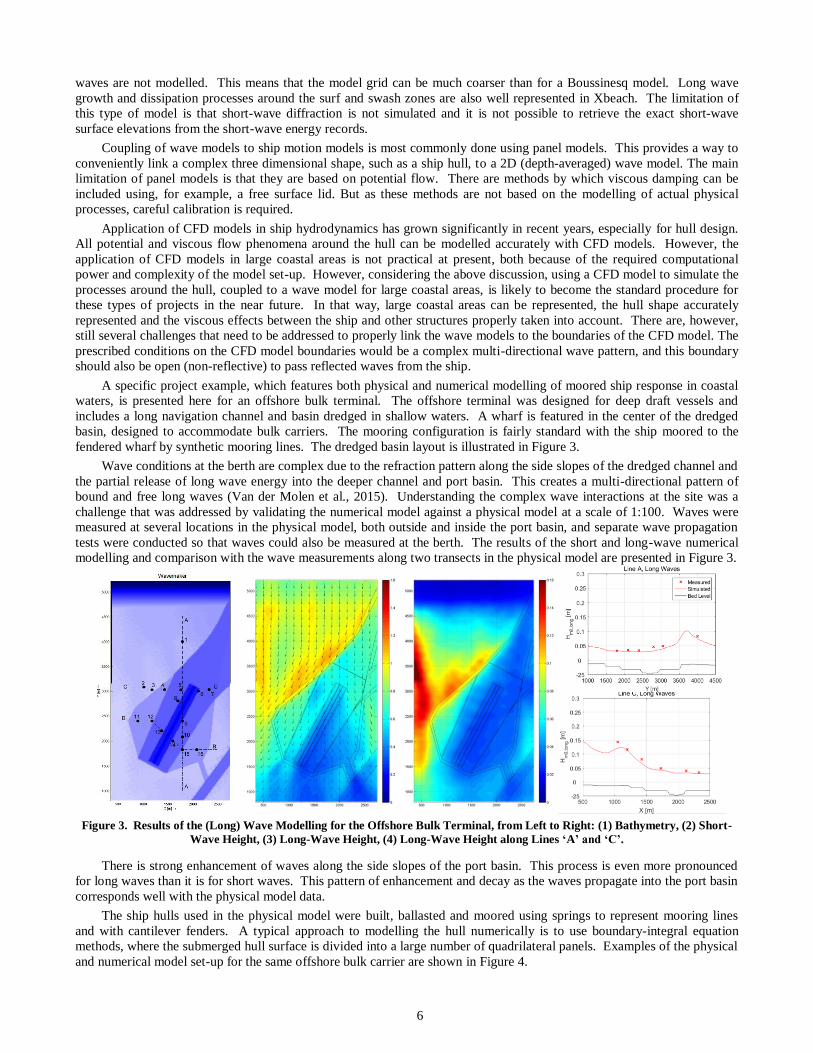
Wave conditions at the berth are complex due to the refraction pattern along the side slopes of the dredged channel and
the partial release of long wave energy into the deeper channel and port basin. This creates a multi-directional pattern of
bound and free long waves (Van der Molen et al., 2015). Understanding the complex wave interactions at the site was a
challenge that was addressed by validating the numerical model against a physical model at a scale of 1:100. Waves were
measured at several locations in the physical model, both outside and inside the port basin, and separate wave propagation
tests were conducted so that waves could also be measured at the berth. The results of the short and long-wave numerical
modelling and comparison with the wave measurements along two transects in the physical model are presented in Figure 3.
Figure 3. Results of the (Long) Wave Modelling for the Offshore Bulk Terminal, from Left to Right: (1) Bathymetry, (2) Short-
Wave Height, (3) Long-Wave Height, (4) Long-Wave Height along Lines ‘A’ and ‘C’.
There is strong enhancement of waves along the side slopes of the port basin. This process is even more pronounced
for long waves than it is for short waves. This pattern of enhancement and decay as the waves propagate into the port basin
corresponds well with the physical model data.
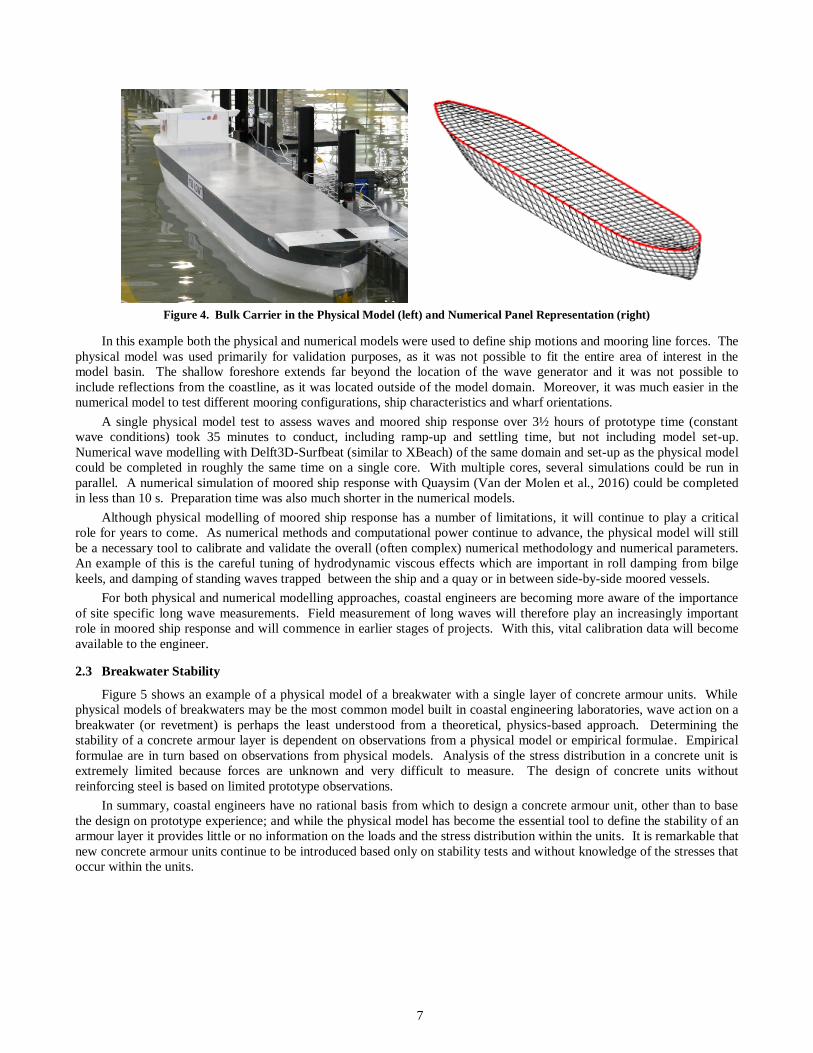
The ship hulls used in the physical model were built, ballasted and moored using springs to represent mooring lines
and with cantilever fenders. A typical approach to modelling the hull numerically is to use boundary-integral equation
methods, where the submerged hull surface is divided into a large number of quadrilateral panels. Examples of the physical
and numerical model set-up for the same offshore bulk carrier are shown in Figure 4.
7
Figure 4. Bulk Carrier in the Physical Model (left) and Numerical Panel Representation (right)
In this example both the physical and numerical models were used to define ship motions and mooring line forces. The
physical model was used primarily for validation purposes, as it was not possible to fit the entire area of interest in the
model basin. The shallow foreshore extends far beyond the location of the wave generator and it was not possible to
include reflections from the coastline, as it was located outside of the model domain. Moreover, it was much easier in the
numerical model to test different mooring configurations, ship characteristics and wharf orientations.
A single physical model test to assess waves and moored ship response over 3½ hours of prototype time (constant
wave conditions) took 35 minutes to conduct, including ramp-up and settling time, but not including model set-up.
Numerical wave modelling with Delft3D-Surfbeat (similar to XBeach) of the same domain and set-up as the physical model
could be completed in roughly the same time on a single core. With multiple cores, several simulations could be run in
parallel. A numerical simulation of moored ship response with Quaysim (Van der Molen et al., 2016) could be completed
in less than 10 s. Preparation time was also much shorter in the numerical models.
Although physical modelling of moored ship response has a number of limitations, it will continue to play a critical
role for years to come. As numerical methods and computational power continue to advance, the physical model will still
be a necessary tool to calibrate and validate the overall (often complex) numerical methodology and numerical parameters.
An example of this is the careful tuning of hydrodynamic viscous effects which are important in roll damping from bilge
keels, and damping of standing waves trapped between the ship and a quay or in between side-by-side moored vessels.
For both physical and numerical modelling approaches, coastal engineers are becoming more aware of the importance
of site specific long wave measurements. Field measurement of long waves will therefore play an increasingly important
role in moored ship response and will commence in earlier stages of projects. With this, vital calibration data will become
available to the engineer.
2.3 Breakwater Stability
Figure 5 shows an example of a physical model of a breakwater with a single layer of concrete armour units. While
physical models of breakwaters may be the most common model built in coastal engineering laboratories, wave act ion on a
breakwater (or revetment) is perhaps the least understood from a theoretical, physics-based approach. Determining the
stability of a concrete armour layer is dependent on observations from a physical model or empirical formulae. Empirical
formulae are in turn based on observations from physical models. Analysis of the stress distribution in a concrete unit is
extremely limited because forces are unknown and very difficult to measure. The design of concrete units without
reinforcing steel is based on limited prototype observations.
In summary, coastal engineers have no rational basis from which to design a concrete armour unit, other than to base
the design on prototype experience; and while the physical model has become the essential tool to define the stability of an
armour layer it provides little or no information on the loads and the stress distribution within the units. It is remarkable that
new concrete armour units continue to be introduced based only on stability tests and without knowledge of the stresses that
occur within the units.

8
Figure 5. Example of a Single Layer Concrete Armour Unit Breakwater being Tested in a Physical Model
The development of numerical technology to address this challenge has been ongoing for over a decade. Researchers
are able to simulate the flow within an armour layer as a result of irregular wave action. The resulting movement and
interaction of the armour units can be numerically predicted and the loads on each of the individual units can be determined.
The capability also exists to include the deformable properties of the concrete units and to calculate the stress distribution in
each unit. With this information, a fracturing model can be implemented allowing individual units to break.
The primary challenge faced by researchers is to have the computing power to allow all of these processes to take place
in a coupled manner and in a single model. If this combined model could simulate the action of a significant number of
extreme waves, both the performance of the armour layer and statistics of forces and stress within units, as well as breakage
of units can be defined. A breakwater could be designed using standard civil engineering methods. Further, this capability
could be used to revisit the classical equations on which preliminary armour sizing is typically based, and to expand these
equations using a much broader dataset to cover a variety of additional input conditions and geometries. New units could be
developed based on considerations of both layer stability and internal stresses in the units.
For many years a research team at Imperial College London, sponsored by Baird and Artelia, has attempted to address
this problem with considerable success from a numerical perspective (Xiang et al., 2012; Latham et al., 2013). In one of the
methodologies being developed at Imperial College, a finite element, discrete element (FEMDEM) solids model is used to
construct stone filter and concrete armour layers on a section of breakwater. The constructed armour layer is then imported
as a complex solids mesh into the two-phase flow solver IHFOAM (Higuera, 2015). Within IHFOAM a time series of
waves is simulated and the hydrodynamic forces are integrated over the surface of the concrete armour units. The time
history of wave-induced pressures and water particle velocities can subsequently be extracted from IHFOAM and input
back into the FEMDEM solids model as uplift and drag forces to drive motion and destabilization within the concrete
armour layer itself. The entire process, from construction of the layer in FEMDEM, to hydrodynamic simulations in
IHFOAM, and back to destabilization in FEMDEM, is illustrated in Figure 6.
Figure 6. Details of the Imperial College Process for Numerical Modelling of Single Layer Concrete Armour Units under Wave
Attack showing Unit Placement in FEMDEM (left), Wave Simulations in IHFOAM (center) and Destabilization of the Layer in
FEMDEM (right).
Using the robust FEMDEM deformable solids code, the destabilized armour layer can be scrutinized in a numerical
setting to determine a variety of critical factors such as the displacement and motion of individual units, contact points and
contact forces between units, the underlayer and the stresses and strains experienced within each individual unit. As noted,
even the complex fracturing of individual units can be simulated in theory. The amount of information and data that can be
output from a numerical model such as the one described above is almost limitless, with every node in the model capable of

9
producing data at every computational time step.
This research has great potential to make numerical modelling a viable alternative to physical modelling for coastal
engineers in the design of breakwaters. However, there are a number of challenges that must first be addressed before this
technology is accessible to the coastal engineer, namely:
Computational Time: The above process of constructing a realistic section of breakwater complete with a
rough underlayer and single layer of concrete armour units can be achieved in a day or two. However,
simulating the 3-dimensional hydrodynamic forces on the layer using IHFOAM is extremely time consuming.
A recent test conducted at Imperial College London showed that 65 seconds of regular waves (approximately
6 waves with Tp = 10 s and Hs = 6.5 m) took over 5 days to simulate using 96 processors. Extrapolating on
this, one could assume that the simulation of a 3-hour storm would take approximately 830 days on 96
processors. Extrapolating further, this same simulation might take upwards of 20 years on a more typical and
accessible computer with 8 processors.
Two-Way Coupling: The numerical process described above has presently only been developed as a one-
way coupled model. Hydrodynamic forces are passed from IHFOAM to the solids model to drive
displacements and instabilities in FEMDEM; however these items are not passed back to IHFOAM in a two-
way coupled manner. Once a unit has shifted even slightly, the hydrodynamic forces it experiences are no
longer precisely valid.
Deformability: Testing of the FEMDEM solids model to date has been largely limited to the ‘rigid’ version
of the code as opposed to the ‘deformable’ version. When using the ‘rigid’ version of the model the internal
stresses within the units are not resolved. Although a ‘deformable’ version of the model has been developed,
the numerical complexity is significantly larger. Therefore, although obtaining stresses and strains within the
units themselves can presently be done in theory, the cost is a substantial amount of additional computational
time. The same can also be said of the numerical fracturing of units, which is possible in theory, though not
presently implemented (Guo, L. et al., 2014).
Complex Breakwater Geometries: To date, the development of this technology has been limited to
relatively simple, single layer concrete armour unit construction over a narrow and homogenous section of
breakwater trunk. The ability to simulate a spatially variable design such as a curved breakwater, breakwater
roundhead or stability on the leeward side of a structure has not yet been addressed in the context of this
research.
Validation: Setting aside the above points, even if the numerical modelling process described above could be
run in a time efficient manner, we would have little confidence in the results due to the lack of validation that
has been completed on the technology to date. And since the precise details of unit displacement, rocking,
contact forces, fracturing, wave loading and the like are rarely if ever documented in prototype, there is not a
great deal of data from which to validate. A robust and targeted physical model validation study is clearly
required to support the ongoing research in this area. To address this, a study of this nature is currently being
conducted by Baird and partners at the University of Ottawa and the National Research Council of Canada,
with oversight provided by J.P. Latham and his team at Imperial College London.
As a workaround to the immense challenge of overcoming computational time, the team at AMCG (Imperial College
Applied Modelling and Computation Group) has developed a method by which the 3D hydrodynamics captured in
IHFOAM can be approximated in 2D using the numerical wave flume IH2VOF (Lara, 2005). Although it is a one-way
coupling approach, the early stages of instability appear to be predictable by this method and in relatively short simulation
times of several days. This method has obvious limitations relating to the two-dimensional approximation and over-
simplification of a highly complex three-dimensional physical process. Although the results of this method appear
promising, added levels of complexity are introduced for the modeller and the validity of the numerical model results
becomes increasingly difficult to assess.
Let us now consider the physical counterpart to the above described numerical process. Coastal engineers routinely
construct scaled sections of breakwater trunks in a matter of hours in a laboratory setting. Although the data that can be
extracted from the physical model is not without significant limitations (contrary to numerical data extraction), the section
can be tested under a variety of storm conditions ranging in length from minutes to hours, analyzed, rebuilt and retested
multiple times in a matter of days. All of this is very hands on, easy to understand and can be performed by a coastal
engineer with the help of a trained technician. The cost is directly related to the number of iterations the designer wishes to
test, the length of the wave signals under consideration and the level of optimization the designer is seeking. In other
words, the cost is predictable and can generally be well justified. However the physical model does not address the issue of
the loads on the individual armour units and this is a severe limitation to the development of improved and more efficient
armour unit designs.
This discussion is not meant to detract from the immense amount of excellent research that has been conducted by the
Imperial College team and others addressing the numerical modelling of breakwaters. The advances that have been

10
achieved in this area over the past decade are substantial and invaluable. Rather, this discussion is meant to illustrate the
immense complexity of fully understanding the processes that occur inside a breakwater, and the even more complex task of
simulating these processes with a numerical model.
It is the opinion of the authors that numerical models, such as the model discussed above, will one day become critical
components of the breakwater design process. These models will give the designer the ability to refine and optimize
structures, concrete armour units and other coastal building materials to a higher standard than has ever before been
possible. Most importantly, these models will provide the designer with the ability to take a proven engineering approach to
breakwater design that includes the full analysis of loads and structural response, as would be done in a non-coastal, civil
engineering project. This technology is, however, many years from being fully accessible to the coastal engineer. As such,
physical models will remain an essential component of breakwater design for many years to come.
3 COMPUTING POWER
The above examples illustrate the importance of numerical models in support of a physical model and as a stand-alone
tool for coastal engineers. The principal limitation of the numerical model in these examples is computational power. It is
therefore reasonable to ask when the required computational power will be available.
To start to address this question we revisit Moore’s law, which has seen multiple revisions over time:
1965: The number of transistors in an integrated circuit doubles every year,
1975: The number of transistors in an integrated circuit doubles every two years,
2015: The number of transistors in an integrated circuit doubles every two and a half years.
The most recent iteration of Moore’s law reflects the current pace of progress since approximately 2012. There is
however a physical limit to how small we can make transistors using current processes, a limit which we are likely to reach
within the next decade given the current roadmap for silicon-based processor design. However, there are other factors,
besides transistor-count, that have a role in computational power, such as clock speed, caching, speculative execution and
vectorization to name a few. If we are purely to consider single-thread floating-point performance improvement in CPUs
then we see that there has been a slowing of progress since 2004, when the current push towards multi-core processing
began. Recent increases in floating-point performance have been on the order of doubling once every 4 to 5 years.
The case presented in Section 2.3, in which 65 seconds of regular waves impacting a concrete armour layer, simulated
using IHFOAM, was run at Imperial College London’s Cx2 cluster (96 processors). This represents the work of eight Intel
Xeon X5670 2.93 GHz processors (8 x 6-cores x 2-hyperthreads = 96 logical processors). These processors were
introduced in 2010 and are of 32nm design. The simulation took 5 days to complete.
How this simulation would scale is difficult to determine, but based on prior examples using IHFOAM we can estimate
that the model has a serial fraction of 24%. From this information we can estimate that the minimum theoretical run time
achievable by adding more logical processors (of 2010 vintage) would be 29 hours. This value would of course never be
reached due to various factors of diminishing returns. Regardless, applying the simplistic formula we arrive at run times of
37 and 33 hours for 1024 and 2048 logical processors respectively.
We can make some conservative predictions using current and near future top of the line Xeon processors, maximizing
the number of logical processors on a single quad-socket motherboard. These systems would cost on the order of $45,000
to $50,000 USD. For this prediction, we are only considering improvements in floating-point performance over the cluster
at Imperial College, and adjusting for the number of logical processors.
CPU DESIGN LCPU LCPU scale FP scale RUN TIME (h)
Xeon X5670 2.93 GHz 32nm 96 100% 100% 120
Xeon E7-8890V3 2.50 GHz 22nm 144 134% 221% 41
Xeon (release Q2 2016) 14nm 192 161% 250% 30
Xeon (release Q3 2017) 14nm 192 161% 270% 28
Extrapolation beyond this point is difficult. Moore’s Law is just one driving force in the exponential growth of
computing power, with other factors being much more difficult to predict. Certainly, the performance/price ratio will
continue to increase, making it highly likely that a high-end single server with several hundred logical processors could be
purchased for under $20,000 USD by the end of the decade (2020). Perhaps then our simulation would complete in half a
day.
As an additional example, the use of a high-end computing cluster, parallelization, and linked mesh blocks was shown
to have significant performance improvements in the FLOW-3D® simulation of wave loads on the pile supported structure

11
(Section 2.1). For example, the base-case run (see Section 2.1, Table 1) which had a run duration of 60 hours on a standard
4 core (8-cores with hyper-threading) desktop computer, was reduced to 6 hours on a 128 core “super” cluster (16 sockets, 8
nodes each), a speedup of ten times. Note, however, that the shorter 6 hour run duration, although now taking less than a
standard working day, was still twelve times slower than the production rate in the physical model and produced only 90 s
of waves compared to a 3 hour run duration in the physical model.
The case was made in Section 2.2 that simulating long wave propagation over a large domain using a Boussinesq
model could provide accurate wave conditions from which to run a moored ship response model. The primary limitation of
this approach is that in order to accurately capture long wave reflections in the surf and swash zones, breaking waves must
be simulated. To do so requires the use of higher-order Boussinesq equations and a very fine grid, both of which are
presently not computationally feasible over very large domains. It is not possible to estimate when this might be feasible,
though it is surely many years from now.
4 DISCUSSION
4.1 Pile Supported Structures
CFD modelling of wave loads on pile supported coastal structures is becoming commonplace for most projects.
Computational power is generally available today in a consulting engineer’s office to support the simulation of an irregular
wave train impacting a structure in 1-2 days with a reasonably high spatial resolution of 0.5 m. Larger domains or projects
requiring high spatial resolution will benefit from the use of a physical model as well as a numerical model as a more
efficient production tool for detailed design. This is expected to remain the case for many years.
In the case study presented in Section 2.1, both the physical and numerical models were tested with unidirectional sea
states. Many laboratories have the capabilities to test similar structures with multidirectional sea states, however, this was
not deemed to be necessary for this particular project. Numerical models using multidirectional sea states are not widely
available at this point in time; however this is expected to change in the coming years.
4.2 Moored Ship Response
The future role of physical models in moored ship response is difficult to define. Although numerical ship motion
models are computationally efficient and accessible to the engineer, the numerical CFD modelling of a moored ship in a
complex wave field requires further development. Modelling the propagation of waves over a large area, including wave
breaking and shoreline reflection using a phase resolving model (e.g. Boussinesq), is an issue of computational time that is
not likely to be resolved in the immediate future. Physical models provide the engineer with a higher level of certainty in
the propagation and transformation of long waves and complex sea states for the purpose of assessing ship motion.
However, physical models have limitations of their own with respect to long wave reflection and absorption, domain
limitations and scaling. As such, the current standard of care for moored ship design involves using both numerical and
physical models in a complimentary fashion, and this standard is unlikely to change in the foreseeable future.
4.3 Breakwater Stability
Numerical models will one day allow the coastal engineer to design breakwaters and concrete armour units with a
conventional, physics based approach, accounting for hydrodynamic loading and stresses and strains within each individual
unit. However, due to computational time, this approach is not likely to be available to practising engineers for 10 years or
more. In the meantime, the physical model will remain the best available tool for defining the stability of breakwaters and
designing concrete armour units.
4.4 Sediment Transport
An additional topic of interest to coastal engineers, which is not discussed in this paper, is the modelling of sediment
transport. Sediment transport is a very complex coastal process, which, much like breakwater stability, has historically been
assessed by means of empirical formulations and physical model studies. Physical models can be reasonably good
indicators of sediment pathways in the coastal zone, and can provide the designer with a useful indication of accretion and
erosion zones. It is, however, not reasonable to obtain quantitative sediment transport and beach morphology data from a
physical model, unless the physical model scale is very large or the prototype sediment is very coarse. The use of
lightweight sediments in the laboratory can help alleviate scale effects, but this approach has problems above the waterline
(i.e. in the swash zone).
Numerical sediment transport models are, typically, hydrodynamic models equipped with sediment transport
formulations that predict mobilization and demobilization of sediment and the related morphologic changes. The accuracy
of the model is largely dependent on the availability and quality of hydrodynamic and morphologic calibration data,
including sediment characteristics, the spatial distribution of sediment, and the volume and location of sources and sinks.
Unfortunately this data is difficult to obtain, thereby limiting the accuracy of numerical sediment transport models.

12
Much like moored ship response; sediment transport is an excellent example of a practice area where both numerical
and physical models have an important role depending on the specific project. Both have benefits and limitations, and both
involve uncertainty and approximation. In some sediment transport projects, the use of a physical and numerical model in
combination will represent the best available design approach for the coastal engineer. Physical models will continue to
play an important role in the development of an improved understanding of the physical processes associated with sediment
transport, given the greater control of conditions available to the investigator compared to prototype.
4.5 Validation
Validation is important to both physical and numerical model studies. However, obtaining validation data in the time
frame of a project is often difficult, if not impossible. In order to validate a physical model, prototype data is required.
Large data sets covering a sufficiently long period of time to accommodate statistical analyses are required at the project
site. Given that this data is, typically, not available, the engineer is often tasked with deploying instruments to capture a
small amount of data in a few critical areas from which to validate the model. This prototype data may not be statistically
accurate, and may prove to be difficult to obtain. As such, physical models are often subjected to little validation, and on
occasion are assumed to be accurate with no validation at all.
Validation of a numerical model often involves an added level of complexity and uncertainty, in that many numerical
models may be validated using physical model data in the absence of prototype data. This can be done by replicating the
physical model characteristics in the numerical model (equal scale, freshwater, same material characteristics, etc.).
However, by following this procedure the numerical model inherently has the same uncertainties and approximations as the
physical model. In the absence of prototype data validating against a physical model is better than no validation.
Validation is an important component of the physical modelling process; however it is even more critical to a
numerical model. One could argue that the error bands associated with a physical model which has not been validated, are
considerably smaller than those of an equivalent numerical model. As such, given the lack of prototype data available in
many coastal projects, the physical model will remain an essential component of the validation process for even the most
trusted numerical models.
An additional value provided by a physical model is that it represents a physical source of calibration information for a
numerical model. Numerical models typically contain an abundance of parameters that are selected or ‘tuned’ by the user.
It can be difficult to determine the appropriate selection of parameters in the absence of physical data. This information can
often be interpreted from a physical model, thereby reinforcing its importance in the absence of prototype data.
4.6 Model Scale
In physical models it is common practice to maximize the size of the model (minimize the scale) taking into account
the physical area that requires simulating and the dimensions of the model basin. This is done because it is assumed that a
1:25 scale for example is more accurate than a 1:30 scale. By making this assumption we are inherently admitting that
scaling effects are significant, and that a 1:25 scale is not an accurate representation of a 1:1 scale. This fact further
highlights the importance of validating physical models against prototype data. It also suggests that in the absence of
prototype data, numerical and physical model results should be validated at multiple scales. In some instances breakwaters
have been tested at, for example, scales of 1:5 and 1:25 and a reasonable comparison of performance at both scales has been
used to validate the 1:25 scale.
4.7 Additional benefits of physical models
Research and Development: As illustrated in this paper, physical models provide data to support the calibration and
validation of numerical models. As numerical models are advanced, they will continually require the support of physical
data. The type of data required for this task is often difficult, if not impossible, to obtain in prototype. As such, there will
continue to be a significant role for physical modelling alongside the development of new numerical technology.
Client Engagement and Interaction: An often overlooked advantage of physical modelling is that physical models can be
understood, in a broad sense, by those who are not experts in coastal engineering. Bringing a non-technical client to view a
physical model allows them to see the impacts and performance of a concept or design first hand, in the physical world.
This allows the client to be more engaged in the project and often serves to alleviate their concerns and anxiety over
something that they may not otherwise fully understand.
5 CONCLUSIONS
From the case studies presented in this paper, it is clear that both physical and numerical models have a very important
place in coastal engineering today. It is shown that numerical models have enormous potential due to their ability to capture
complex processes and generate high-resolution outputs of forces, pressures, and other parameters which cannot be
achieved from physical modelling alone. This data will one day provide coastal engineers with the information necessary to

13
design coastal structures using physics-based civil engineering procedures. However, many numerical models, such as
those discussed in this paper, are limited by computational power. Until that limitation is overcome, physical models will
remain the standard of care for the design of coastal structures.
ACKNOWLEDGEMENT
The authors wish to acknowledge the various Baird engineers who participated on the projects described herein,
namely Mike Fullarton, Doug Scott, Dave Anglin and Graham Frank. We also wish to thank Andrew Cornett and OCRE-
NRC. Finally, the authors would like to acknowledge the work of John-Paul Latham, Jiansheng Xiang and Pablo Higuera
of Imperial College London.
REFERENCES
Barthel, V., Mansard, E. P. D., Sand, S. E. and Vis, F.C. 1983. Group Bounded Long Waves in Physical Models. Ocean Engineering. 10,
261-294.
Bingham, H. B. 2000. A Hybrid Boussinesq-Panel Method for Predicting the Motion of a Moored Ship. Coastal Engineering. 40, 21-38.
DNV. 2010. Recommended Practice – Environmental Conditions and Environmental Loads. DNV-RP-C205. Det Norske Veritas.
October 2010.
Elliott, T. and Fullarton, M. 2014. Cyclone Wave Loads on Wharf Structure using the New Wave Approach. 2014 FLOW-3D Americas
Users Conference. Toronto, Canada.
Guo, L., Latham, J.-P. & Xiang, J. 2014. Numerical Simulation of Breakages of Concrete Armour Units using a Three-Dimensional
Fracture Model in the Context of the Combined Finite-Discrete Element Method. Computers and Structures, 146, 117-142.
Higuera, P. C. 2015. Application of Computational Fluid Dynamics to Wave Action on Structures – IHFOAM. University of Cantabria., Cantabria, Spain.
Hudson, R.Y. (1953). “Wave Forces on Breakwaters”. Transactions of the American Society of Civil Engineers, ASCE, Vol. 118, pp.
653.
Lara, J. L. 2005. A Numerical Wave Flume to Study the Functionality and Stability of Coastal Structures. Journal of the International Navigation Association, PIANC, 121: 5-29
Latham, J.-P., Anastasaki, E., and Xiang, J. 2013. New Modelling and Analysis Methods for Concrete Armour Unit Systems using
FEM/DEM. Coastal Engineering, 77(Jul), 151-166.
Madsen, P.A. and Fuhrman, D.R. 2010. High-order Boussinesq-type modelling of nonlinear wave phenomena in deep and shallow water. Advances in Numerical Simulation of Nonlinear Water Waves, pp. 245-285.
Roelvink, D., Reniers, A., Van Dongeren, A., Van Thiel de Vries, J., McCall, R. and Lescinski, J. 2009. Modelling storm impact on
beaches, dunes and barrier islands. Coastal Engineering, 56, 1133-1152.
Van Dongeren, A., Battjes, J., Janssen, T., Van Noorloos, J., Steenhauer, K., Steenbergen, G. and Reniers, A. 2007. Shoaling and Shoreline Dissipation of Low-Frequency Waves. J. Geophys. Res., 112, C02011.
Van der Hout, A. J., De Jong, M. P. C., Jaouen, F. and Waals, O. J. 2015. Long Waves in Intermediate Depths and their Influence on the
Design of Nearshore Terminals. Proc. 36th IAHR World Congress, 28 June – 3 July, 2015, The Hague, The Netherlands.
Van der Molen, W. 2006. Behaviour of Moored Ships in Harbours. PhD Thesis, Delft University of Technology, The Netherlands.
Van der Molen, W., Scott, D. and Taylor, D. 2015. Long Wave Propagation into Dredged Areas. Proc. 36th IAHR World Congress, 28
June – 3 July, 2015, The Hague, The Netherlands.
Van der Molen, W., Scott, D., Taylor, D. and Elliott, T. 2016. Improvement of Mooring Configurations in Geraldton Harbour. J. Mar.
Sci. Eng., 4, 3.
Xiang, J., Latham, J.-P., Vire, A., Anastasaki, E., & Pain, C.C. 2012. Coupled Fluidity/Y3D Technology and Simulation Tools for
Numerical Breakwater Modelling. Coastal Engineering Proceedings, Vol. 1.