Embed Size (px)
Citation preview
THREATLANDSCAPEREPORTQ1 2018
2
TABLE OF CONTENTS
Introduction and Key Findings . . . . . . . . . . . . . . . . . . . . . . . . . . . . . . . . . . 3
Exploit Trends . . . . . . . . . . . . . . . . . . . . . . . . . . . . . . . . . . . . . . . . . . . . . . 4
Mini Focus: Operational Technology Exploits . . . . . . . . . . . . . . . . . . . 8
Malware Trends . . . . . . . . . . . . . . . . . . . . . . . . . . . . . . . . . . . . . . . . . . . . . 9
Mini Focus: The Maturizing Zero-Day Market . . . . . . . . . . . . . . . . . . . 14
Botnet Trends . . . . . . . . . . . . . . . . . . . . . . . . . . . . . . . . . . . . . . . . . . . . . . . 15
Mini Focus: Communing with Dead Botnets . . . . . . . . . . . . . . . . . . . . . . 19
Conclusions and Recommendations . . . . . . . . . . . . . . . . . . . . . . . . . . . . . 20
Sources and Measures . . . . . . . . . . . . . . . . . . . . . . . . . . . . . . . . . . . . . . . 23
TABLE OF CONTENTS
3
Q1 2018 HIGHLIGHTS AND KEY FINDINGS
Q1 2018 INTRODUCTION AND KEY FINDINGS
WE’RE HEADED INTO OT. As in “operational technology.” But overtime works too
since malicious actors are working extra to reach the OT side of the network these days.
We review which types of industrial control systems are targeted the most and how those
exploits differ by region.
FLAWS OF SUPPLY AND DEMAND. Zero-day markets are growing and maturing for all
“hats.” It’s getting easier to obtain these exploits, and that has both positive and negative
implications.
WHERE’S ALL THE MALWARE? It’s not like malware disappeared in Q1, but we did
see a noticeable drop in the total number of variants and their prevalence across our
sensors. Where did all the malware go and what are those sneaky criminals up to? You’ll
know soon enough.
IT’S ALL JACKED UP. We covered the explosion of cryptojacking (aka cryptomining)
attacks across the threat landscape in our last report. Things got even more jacked up from
there, and we are now detecting cryptomining malware in nearly 30% of firms.
FALSE START. The 2018 PyeongChang Olympics had a false start when the Olympic
Destroyer malware played havoc with IT systems during the opening ceremonies. Cyber
criminals aren’t known to stand on ceremony, but c’mon people—is nothing sacred?
A LITTLE TOO PERSISTENT. We did some digging and learned that 58% of botnet
infections last one day. About 5% last more than a week. If that’s longer than you want
them hanging around, then you might want to bump this up your reading list.
DOWN BUT NOT OUT. The Andromeda botnet was taken down in the last quarter of
2017, but its network of infected hosts hasn’t been stamped out. Do those hosts hold an
important lesson for us about security hygiene? Read on to find out.
In the first quarter of 1918, the great master of illusion, Harry Houdini, made a full-grown
elephant vanish in front of an astounded live audience at the New York Hippodrome. What
does that factoid have to do with the cyber threat landscape 100 years later in Q1 2018?
Well, not much, to be honest, but it’s a good opener for a report that aims to do
the opposite of what Houdini did. There’s an old parable about blind men trying to
describe an elephant. They all touch different parts, which leads them to very different
conclusions about what the elephant looks like.
Like the elephant, the vast cyber threat landscape cannot be fully described from one
touch point. That’s why we maintain millions of touch points across the Internet that
allow us to analyze many different threats from many different angles. In short, we make
the elephant visible so you can manage security more fully.
Q1 2018 BY THE NUMBERS:Exploits
§ 6,623 unique detections (+11%)
§ 238 detections per firm (-13%)
§ 73% saw severe exploits (+1%)
§ <1% recorded ICS-related exploits
Malware
§ 15,071 unique variants (-15%)
§ 3,078 different families (-2%)
§ 3 variants spread to ≥1/10 firms (-67%)
§ 28% saw cryptojacking malware (+15%)
Botnets
§ 1.8 active botnets per firm (0%)
§ 2.8% saw ≥10 botnets (-1%)
§ 58% of botnet infections last 1 day
§ 5% of botnet infections last >1 week
EXPLOIT TRENDS

5
EXPLOIT TRENDS
Exploit trends grant a view into adversary attempts to identify and compromise vulnerable systems. Triggering one of the multibillion detections recorded this quarter doesn’t mean the attack succeeded or even that the targeted vulnerabilities existed in the environment. Because exploit activity tends to be rather noisy, we focus analysis on critical and high-severity detections for this section.
FIGURE 1: DAILY EXPLOIT ACTIVITY FOR Q1 2018
EXPLOIT TRENDS
QUICK STATS:
n 6,623 unique detections (+11%)
n 238 detections per firm (-13%)
n 73% saw severe exploits (+1%)
n Microsoft is the #1 target for exploits
n <1% recorded ICS-related exploits
n Siemens is the #1 target for ICS exploits
More so than most other types of threats, analyzing exploit trends is a painstaking game of extracting signal from noise. Figure 1 is a perfect example of this. Nearly all exploit activity falls among the lower tiers (“Info” through “Medium”) of severity. The higher-severity detections (“High” and “Critical”) barely even register at the bottom of the figure. Any attack can inflict harm under the right conditions, but wisdom suggests dealing with those representing the greatest danger first is generally a good idea.
We can improve the signal-to-noise ratio by isolating only high and critical detections in an alternate version of Figure 1 below. The y-axis informs us that we’re looking at only the top 5% of exploits in Figure 2, but at least it’s more than an indiscernible baseline now. We will further unpack this activity in a moment.
0%
25%
50%
75%
100%
Jan Feb Mar
Perc
ent o
f Det
ectio
ns
Info Low Medium High Critical
0%
1%
2%
3%
4%
Jan Feb Mar
Perc
ent o
f Det
ectio
ns
High Critical
FIGURE 2: DAILY EXPLOIT ACTIVITY FOR Q1 2018 (FILTERED TO HIGH AND CRITICAL SEVERITY)
6
First though, let’s address the large spectre that dominated the headlines early in 2018 and threatened to melt down even the most hardened defenses. We’re talking, of course, about the tandem of side channel attacks dubbed Meltdown and Spectre1 that exploit vulnerabilities found in most microprocessors, which allow rogue processes to read kernel memory without authorization. The potential for exploitation represented by these attacks is mind boggling, but thankfully, they remain more “potential” than “potent” at present. Proof-of-concept exploits exist, but nothing impactful has been picked up yet in the wild.
The FortiGuard detection for Meltdown/Spectre peaked on January 30 with a trigger rate of 1 in 5,200 organizations (0.02%). Overall, related activity was observed by 0.07% of all firms—a blip on Figure 2’s already-narrowed radar. All of these attacks are proofs of concept at present. It’s worth noting, however, that criminals leveraged the opportunity for a range of other Meltdown-
and Spectre-themed attacks. In one example, a website purporting to offer official guidance on Meltdown and Spectre from the German Federal Office for Information Security offered instead a “patch” that turned out to be a backdoor Trojan. This will undoubtedly continue, so don’t be duped by Spectre’s ghost.
Sticking with the theme of processor woes, Q1 saw the announcement of multiple critical security vulnerabilities and manufacturer back doors affecting AMD’s Zen architecture chipsets. These flaws, which bear the ominous-sounding names of RYZENFALL, FALLOUT, CHIMERA, and MASTERKEY, enable malicious code to be installed within the processor, steal network credentials guarded by Microsoft’s Credential Guard technology to allow for lateral movement, bypass key security features such as Secure Encrypted Virtualization, access physical memory, and perform malicious code execution.
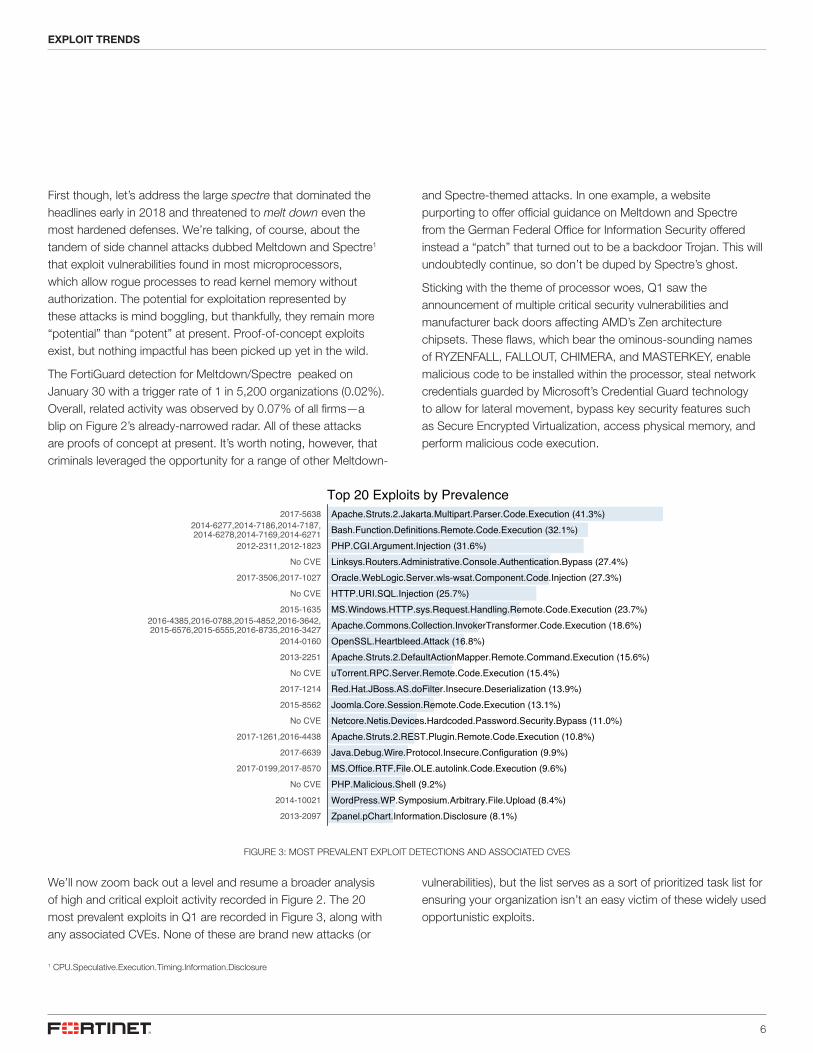
FIGURE 3: MOST PREVALENT EXPLOIT DETECTIONS AND ASSOCIATED CVES
EXPLOIT TRENDS
1 CPU.Speculative.Execution.Timing.Information.Disclosure
Zpanel.pChart.Information.Disclosure (8.1%)WordPress.WP.Symposium.Arbitrary.File.Upload (8.4%)PHP.Malicious.Shell (9.2%)MS.Office.RTF.File.OLE.autolink.Code.Execution (9.6%)Java.Debug.Wire.Protocol.Insecure.Configuration (9.9%)Apache.Struts.2.REST.Plugin.Remote.Code.Execution (10.8%)Netcore.Netis.Devices.Hardcoded.Password.Security.Bypass (11.0%)Joomla.Core.Session.Remote.Code.Execution (13.1%)Red.Hat.JBoss.AS.doFilter.Insecure.Deserialization (13.9%)uTorrent.RPC.Server.Remote.Code.Execution (15.4%)Apache.Struts.2.DefaultActionMapper.Remote.Command.Execution (15.6%)OpenSSL.Heartbleed.Attack (16.8%)Apache.Commons.Collection.InvokerTransformer.Code.Execution (18.6%)MS.Windows.HTTP.sys.Request.Handling.Remote.Code.Execution (23.7%)HTTP.URI.SQL.Injection (25.7%)Oracle.WebLogic.Server.wls-wsat.Component.Code.Injection (27.3%)Linksys.Routers.Administrative.Console.Authentication.Bypass (27.4%)PHP.CGI.Argument.Injection (31.6%)Bash.Function.Definitions.Remote.Code.Execution (32.1%)Apache.Struts.2.Jakarta.Multipart.Parser.Code.Execution (41.3%)
2013-20972014-10021
No CVE2017-0199,2017-8570
2017-66392017-1261,2016-4438
No CVE2015-85622017-1214
No CVE2013-22512014-0160
2016-4385,2016-0788,2015-4852,2016-3642,2015-6576,2015-6555,2016-8735,2016-3427
2015-1635No CVE
2017-3506,2017-1027No CVE
2012-2311,2012-1823
2014-6277,2014-7186,2014-7187,2014-6278,2014-7169,2014-6271
2017-5638
Top 20 Exploits by Prevalence
We’ll now zoom back out a level and resume a broader analysis of high and critical exploit activity recorded in Figure 2. The 20 most prevalent exploits in Q1 are recorded in Figure 3, along with any associated CVEs. None of these are brand new attacks (or
vulnerabilities), but the list serves as a sort of prioritized task list for ensuring your organization isn’t an easy victim of these widely used opportunistic exploits.

7
PRIME TARGETS FOR EXPLOITATION
The specificity of Figure 3 is handy, but its brevity may cause us to lose sight of the bigger picture. To help with that important perspective, Figure 4 presents the technologies most targeted by exploits in Q1.
FIGURE 4: TOP TECHNOLOGIES TARGETED BY EXPLOITS
EXPLOIT TRENDS
Meltdown and Spectre may have dominated the headlines in Q1, but our sensors were dominated by more mundane exploits we’ve known about for a long time against common technologies. Microsoft may be the apex software prey in the exploit landscape, but a pack of web-oriented technologies—SSL, Telnet, SSH, HTTP, Bash, PHP, and Apache—are heavily hunted as well. WordPress and Joomla, two of the most popular web content management systems (CMS), make our list as well. Drupal, another CMS, is not labeled in Figure 3 but worthy of mention because of a highly critical remote code execution (RCE) vulnerability (CVE-2018-7600)
Adobe
Apache
Apple
ASUS
AWStats
Backdoor
BashChina
DNSEthereal
HPHTTP
IMAPISAPI
Java
Joomla
Linksys
MS
MySQL
Netcore
Ntpd
OpenSSL
Oracle PHP
POP3
Red
Robot
SMB
SSHSSL Telnet
uTorrent
Wordpress
All CPU Attacks(Spectre/Meltdown)
Dlink
10
100
1k
10k
100k
1m
10m
100m
1b
1 in10k
1 in1k
1 in100
1 in10
Prevalence
Volum
e
disclosed in late March. This vulnerability has massive security implications because it allows any user of any privilege to access, modify, or delete all data on a Drupal-enabled website.
Netcore occupied the No. 2 spot behind Microsoft in total attack volume, while a particular exploit targeting D-Link devices2 gained more ground than any other technology on the prevalence axis in Q1. This demonstrates that attackers continue to probe far and wide for IoT vulnerabilities. Overall, both Figure 3 and 4 remind us to be careful about losing the signal amid the noise, which is a constant danger in the clamor of information security.
2 DLink.Devices.UPnP.SOAP.Command.Execution
8
MINI FOCUS: OPERATIONAL TECHNOLOGY EXPLOITS
MINI FOCUS: OPERATIONAL TECHNOLOGY EXPLOITS
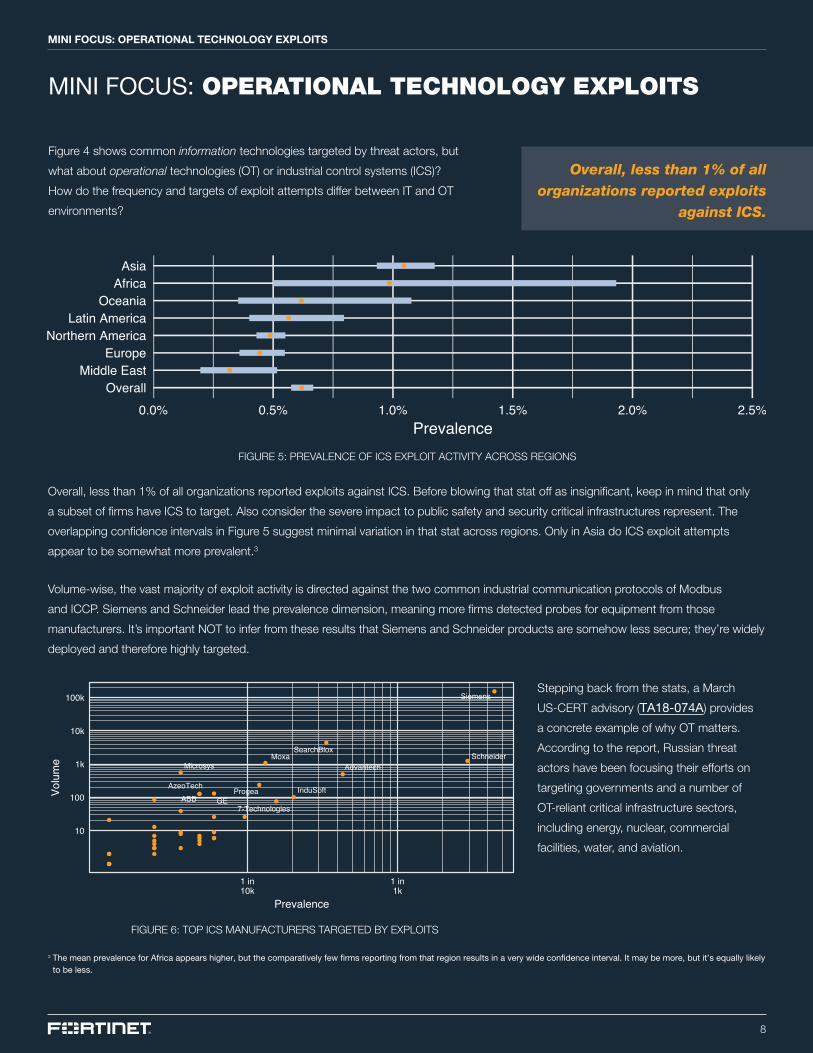
Figure 4 shows common information technologies targeted by threat actors, but
what about operational technologies (OT) or industrial control systems (ICS)?
How do the frequency and targets of exploit attempts differ between IT and OT
environments?
FIGURE 5: PREVALENCE OF ICS EXPLOIT ACTIVITY ACROSS REGIONS
Overall, less than 1% of all organizations reported exploits
against ICS.
Overall, less than 1% of all organizations reported exploits against ICS. Before blowing that stat off as insignificant, keep in mind that only
a subset of firms have ICS to target. Also consider the severe impact to public safety and security critical infrastructures represent. The
overlapping confidence intervals in Figure 5 suggest minimal variation in that stat across regions. Only in Asia do ICS exploit attempts
appear to be somewhat more prevalent.3
Volume-wise, the vast majority of exploit activity is directed against the two common industrial communication protocols of Modbus
and ICCP. Siemens and Schneider lead the prevalence dimension, meaning more firms detected probes for equipment from those
manufacturers. It’s important NOT to infer from these results that Siemens and Schneider products are somehow less secure; they’re widely
deployed and therefore highly targeted.
3 The mean prevalence for Africa appears higher, but the comparatively few firms reporting from that region results in a very wide confidence interval . It may be more, but it’s equally likely to be less .
7-TechnologiesABB
Advantech
AzeoTech
GEInduSoft
MicrosysMoxa
Progea
SchneiderSearchBlox
Siemens
10
100
1k
10k
100k
1 in10k
1 in1k
Prevalence
Volu
me
Stepping back from the stats, a March
US-CERT advisory (TA18-074A) provides
a concrete example of why OT matters.
According to the report, Russian threat
actors have been focusing their efforts on
targeting governments and a number of
OT-reliant critical infrastructure sectors,
including energy, nuclear, commercial
facilities, water, and aviation.
FIGURE 6: TOP ICS MANUFACTURERS TARGETED BY EXPLOITS
MALWARE TRENDS
10
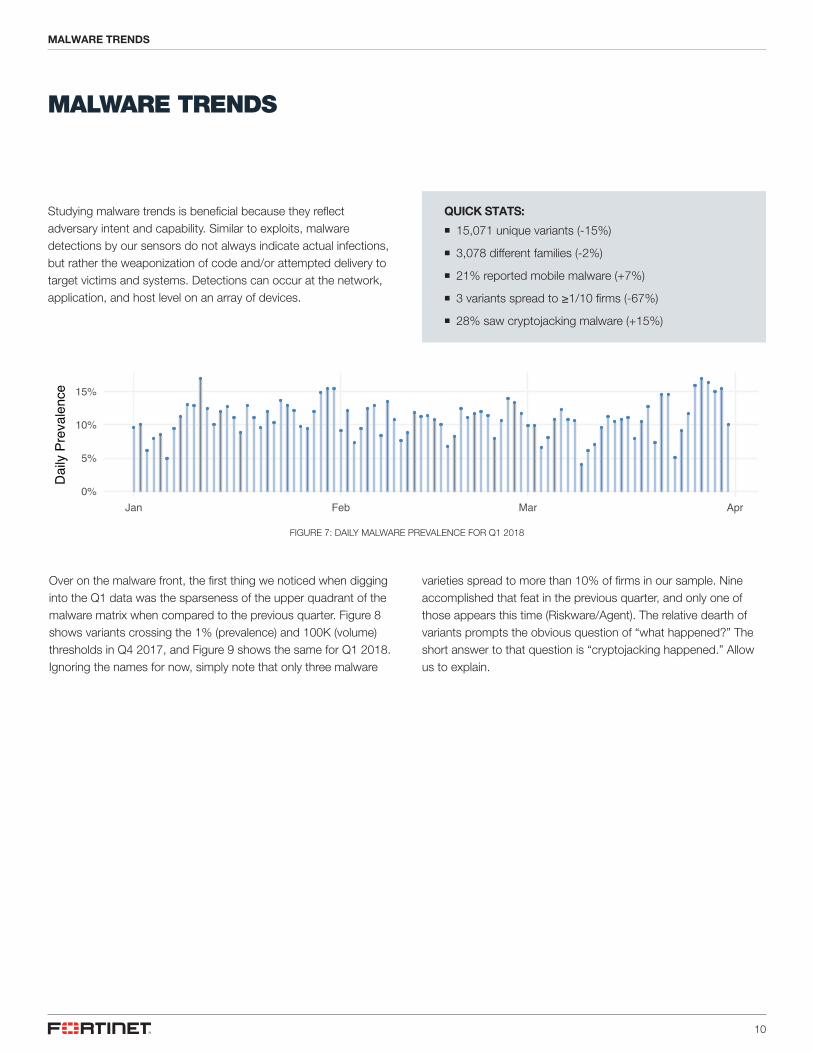
Studying malware trends is beneficial because they reflect adversary intent and capability. Similar to exploits, malware detections by our sensors do not always indicate actual infections, but rather the weaponization of code and/or attempted delivery to target victims and systems. Detections can occur at the network, application, and host level on an array of devices.
FIGURE 7: DAILY MALWARE PREVALENCE FOR Q1 2018
MALWARE TRENDS
QUICK STATS:
n 15,071 unique variants (-15%)
n 3,078 different families (-2%)
n 21% reported mobile malware (+7%)
n 3 variants spread to ≥1/10 firms (-67%)
n 28% saw cryptojacking malware (+15%)
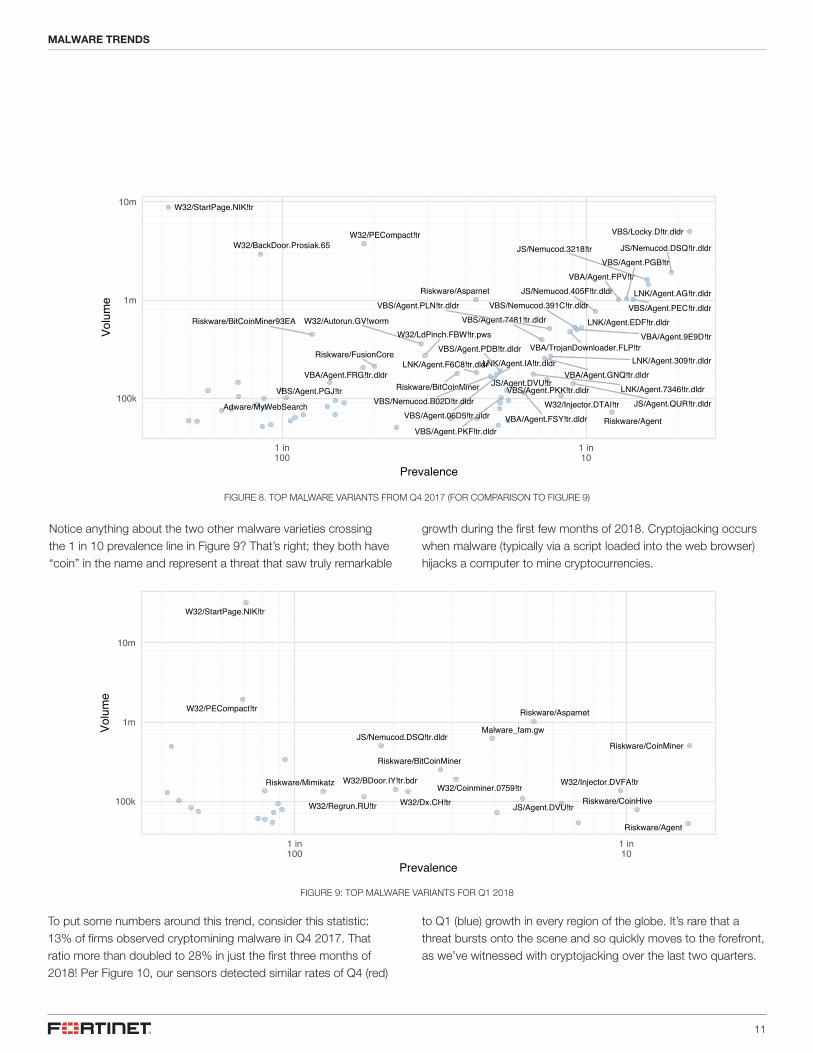
Over on the malware front, the first thing we noticed when digging into the Q1 data was the sparseness of the upper quadrant of the malware matrix when compared to the previous quarter. Figure 8 shows variants crossing the 1% (prevalence) and 100K (volume) thresholds in Q4 2017, and Figure 9 shows the same for Q1 2018. Ignoring the names for now, simply note that only three malware
varieties spread to more than 10% of firms in our sample. Nine accomplished that feat in the previous quarter, and only one of those appears this time (Riskware/Agent). The relative dearth of variants prompts the obvious question of “what happened?” The short answer to that question is “cryptojacking happened.” Allow us to explain.
0%
5%
10%
15%
Jan Feb Mar Apr
Daily
Pre
valen
ce
MALWARE TRENDS
11
MALWARE TRENDS
FIGURE 8. TOP MALWARE VARIANTS FROM Q4 2017 (FOR COMPARISON TO FIGURE 9)
Notice anything about the two other malware varieties crossing the 1 in 10 prevalence line in Figure 9? That’s right; they both have “coin” in the name and represent a threat that saw truly remarkable
FIGURE 9: TOP MALWARE VARIANTS FOR Q1 2018
Adware/MyWebSearch
JS/Agent.DVU!tr
JS/Agent.QUR!tr.dldr
JS/Nemucod.3218!tr
JS/Nemucod.405F!tr.dldr
JS/Nemucod.DSQ!tr.dldr
LNK/Agent.309!tr.dldr
LNK/Agent.7346!tr.dldr
LNK/Agent.AG!tr.dldr
LNK/Agent.EDF!tr.dldr
LNK/Agent.F6C8!tr.dldrLNK/Agent.IA!tr.dldr
Riskware/Agent
Riskware/Asparnet
Riskware/BitCoinMiner
Riskware/BitCoinMiner93EA
Riskware/FusionCore
VBA/Agent.9E9D!tr
VBA/Agent.FPV!tr
VBA/Agent.FRG!tr.dldr
VBA/Agent.FSY!tr.dldr
VBA/Agent.GNQ!tr.dldr
VBA/TrojanDownloader.FLP!tr
VBS/Agent.06D5!tr.dldr
VBS/Agent.7481!tr.dldr
VBS/Agent.PDB!tr.dldr
VBS/Agent.PEC!tr.dldr
VBS/Agent.PGB!tr
VBS/Agent.PGJ!tr
VBS/Agent.PKF!tr.dldr
VBS/Agent.PKK!tr.dldr
VBS/Agent.PLN!tr.dldr
VBS/Locky.D!tr.dldr
VBS/Nemucod.391C!tr.dldr
VBS/Nemucod.B02D!tr.dldr
W32/Autorun.GV!worm
W32/BackDoor.Prosiak.65
W32/Injector.DTAI!tr
W32/LdPinch.FBW!tr.pws
W32/PECompact!tr
W32/StartPage.NIK!tr
100k
1m
10m
1 in100
1 in10
Prevalence
Volum
e
JS/Agent.DVU!tr
JS/Nemucod.DSQ!tr.dldrMalware_fam.gw
Riskware/Agent
Riskware/Asparnet
Riskware/BitCoinMiner
Riskware/CoinHive
Riskware/CoinMiner
Riskware/Mimikatz W32/BDoor.IY!tr.bdrW32/Coinminer.0759!tr
W32/Dx.CH!tr
W32/Injector.DVFA!tr
W32/PECompact!tr
W32/Regrun.RU!tr
W32/StartPage.NIK!tr
100k
1m
10m
1 in100
1 in10
Prevalence
Volum
e
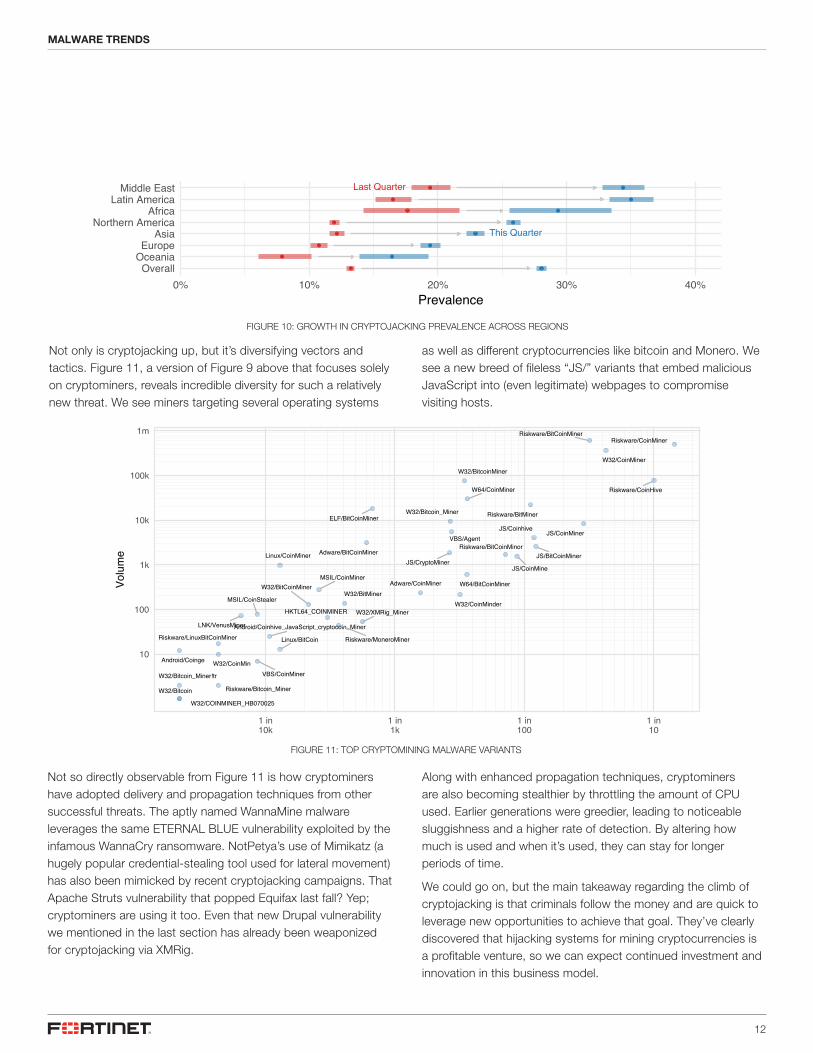
To put some numbers around this trend, consider this statistic: 13% of firms observed cryptomining malware in Q4 2017. That ratio more than doubled to 28% in just the first three months of 2018! Per Figure 10, our sensors detected similar rates of Q4 (red)
growth during the first few months of 2018. Cryptojacking occurs when malware (typically via a script loaded into the web browser) hijacks a computer to mine cryptocurrencies.
to Q1 (blue) growth in every region of the globe. It’s rare that a threat bursts onto the scene and so quickly moves to the forefront, as we’ve witnessed with cryptojacking over the last two quarters.
12
FIGURE 10: GROWTH IN CRYPTOJACKING PREVALENCE ACROSS REGIONS
MALWARE TRENDS
Not only is cryptojacking up, but it’s diversifying vectors and tactics. Figure 11, a version of Figure 9 above that focuses solely on cryptominers, reveals incredible diversity for such a relatively new threat. We see miners targeting several operating systems
Not so directly observable from Figure 11 is how cryptominers have adopted delivery and propagation techniques from other successful threats. The aptly named WannaMine malware leverages the same ETERNAL BLUE vulnerability exploited by the infamous WannaCry ransomware. NotPetya’s use of Mimikatz (a hugely popular credential-stealing tool used for lateral movement) has also been mimicked by recent cryptojacking campaigns. That Apache Struts vulnerability that popped Equifax last fall? Yep; cryptominers are using it too. Even that new Drupal vulnerability we mentioned in the last section has already been weaponized for cryptojacking via XMRig.
Last Quarter
This Quarter
OverallOceaniaEurope
AsiaNorthern America
AfricaLatin America
Middle East
0% 10% 20% 30% 40%Prevalence
Along with enhanced propagation techniques, cryptominers are also becoming stealthier by throttling the amount of CPU used. Earlier generations were greedier, leading to noticeable sluggishness and a higher rate of detection. By altering how much is used and when it’s used, they can stay for longer periods of time.
We could go on, but the main takeaway regarding the climb of cryptojacking is that criminals follow the money and are quick to leverage new opportunities to achieve that goal. They’ve clearly discovered that hijacking systems for mining cryptocurrencies is a profitable venture, so we can expect continued investment and innovation in this business model.
as well as different cryptocurrencies like bitcoin and Monero. We see a new breed of fileless “JS/” variants that embed malicious JavaScript into (even legitimate) webpages to compromise visiting hosts.
FIGURE 11: TOP CRYPTOMINING MALWARE VARIANTS
Adware/BitCoinMiner
Adware/CoinMiner
Android/Coinge
Android/Coinhive_JavaScript_cryptocoin_Miner
ELF/BitCoinMiner
HKTL64_COINMINER
JS/BitCoinMiner
JS/Coinhive
JS/CoinMine
JS/CoinMiner
JS/CryptoMiner
Linux/BitCoin
Linux/CoinMiner
LNK/VenusMiner
MSIL/CoinMiner
MSIL/CoinStealer
Riskware/Bitcoin_Miner
Riskware/BitCoinMiner
Riskware/BitCoinMinor
Riskware/BitMiner
Riskware/CoinHive
Riskware/CoinMiner
Riskware/LinuxBitCoinMiner Riskware/MoneroMiner
VBS/Agent
VBS/CoinMiner
W32/Bitcoin
W32/Bitcoin_Miner
W32/Bitcoin_Miner!tr
W32/BitcoinMiner
W32/BitCoinMinerW32/BitMiner
W32/CoinMin
W32/CoinMinder
W32/CoinMiner
W32/COINMINER_HB070025
W32/XMRig_Miner
W64/BitCoinMiner
W64/CoinMiner
10
100
1k
10k
100k
1m
1 in10k
1 in1k
1 in100
1 in10
Volum
e
13
DESTRUCTIVE AND DESIGNER ATTACKS ON DISPLAY
MALWARE TRENDS
SamSam first appeared in late 2015 and, until recently, has been a fairly low-profile threat. But its developers have been on a tear in Q1, targeting a wide range of organizations from healthcare and educational institutions to local governments. This focused deployment of destructive capabilities has proven highly effective. In March, SamSam hammered (and hampered) the city of Atlanta hard enough for the mayor to call it a “hostage situation.” Though this event only targeted online bill paying and court-scheduling services, the message of “we can cause you major problems” was heard loud and clear.
The Olympics are supposed to be an event where people around the world set aside their conflicts and engage instead in contests of speed, strength, skill, etc. The actors behind Olympic Destroyer had different plans, however, when they unleashed an attack that temporarily took down IT systems just before the opening ceremonies of the 2018 PyeongChang Olympics. Despite the shaky takeoff, the Olympic team managed to stick the landing and complete the ceremonies. But how many more times can we successfully skate around disaster?
This combination of design specification and destructive tendencies exemplified by the malware events above foreshadows an ominous future. As strange as it sounds, the stealthy, command-and-control objectives of most malware over the last decade have caused many firms to let their defensive guard down. Detection and response became the key challenge. With worms and destructive malware back in the forefront, it’s time to get that guard back up.
Despite the relative sparseness of Figure 9 and surge in cryptojacking, we musn’t be lured into assuming cyber criminals ceased all their other antics in Q1. Quite a few noteworthy events occurred that combined designer attacks with destructive payloads, in fact, and we’ll highlight some of those in this section.
The GandCrab emerged in January and has the distinction of being the first ransomware to use Dash cryptocurrency as a payment. According to Europol, it claimed 50,000 victims in less than one month. A tool for decrypting files held hostage by GandCrab was soon released, but the authors—who purportedly use Agile development approaches—soon responded with GandCrab 2.0. Alongside stronger antidecryption mechanisms, the authors took time to update the GandCrab ransomlock interface. How’s that for service?
BlackRuby is another ransomware that added a clever monetization scheme when it hit in February. Upon execution, BlackRuby obtains the location of the victim machine by utilizing the freegeoip.com API (to establish better decryption pricing) and also initiates the aforementioned XMRig mining component to make additional revenue from the victim. A Monero here, a Monero there, right?
U.S. government agencies released joint malware analysis reports identifying malware variants attributed to the North Korean government threat group known as HIDDEN COBRA. These variants are known as HARDRAIN and BADCALL and contain innovative functionality for proxy servers (HARDRAIN/BADCALL), remote access tools (RATs), an ELF ARM binary (HARDRAIN) that can run on Android, and a native Android APK binary (BADCALL).
14
MINI FOCUS: THE MATURING ZERO-DAY MARKET
MINI FOCUS: THE MATURING ZERO-DAY MARKET
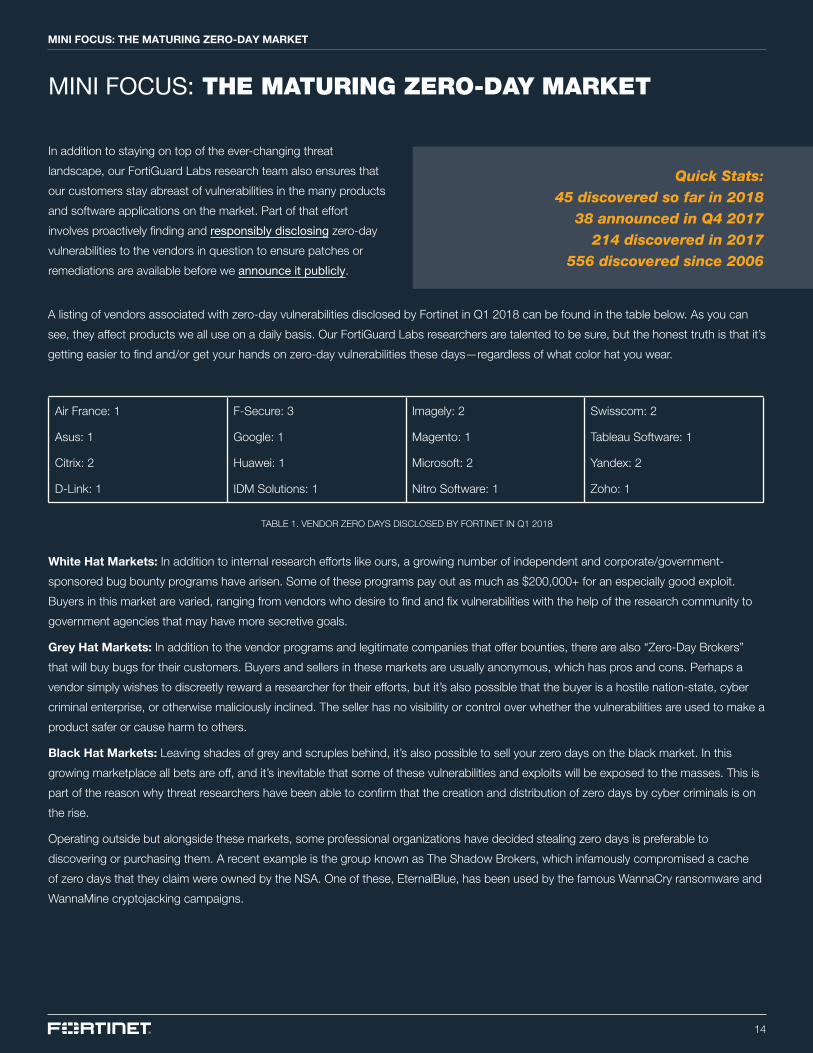
In addition to staying on top of the ever-changing threat
landscape, our FortiGuard Labs research team also ensures that
our customers stay abreast of vulnerabilities in the many products
and software applications on the market. Part of that effort
involves proactively finding and responsibly disclosing zero-day
vulnerabilities to the vendors in question to ensure patches or
remediations are available before we announce it publicly.
A listing of vendors associated with zero-day vulnerabilities disclosed by Fortinet in Q1 2018 can be found in the table below. As you can
see, they affect products we all use on a daily basis. Our FortiGuard Labs researchers are talented to be sure, but the honest truth is that it’s
getting easier to find and/or get your hands on zero-day vulnerabilities these days—regardless of what color hat you wear.
Quick Stats: 45 discovered so far in 2018
38 announced in Q4 2017214 discovered in 2017
556 discovered since 2006
White Hat Markets: In addition to internal research efforts like ours, a growing number of independent and corporate/government-
sponsored bug bounty programs have arisen. Some of these programs pay out as much as $200,000+ for an especially good exploit.
Buyers in this market are varied, ranging from vendors who desire to find and fix vulnerabilities with the help of the research community to
government agencies that may have more secretive goals.
Grey Hat Markets: In addition to the vendor programs and legitimate companies that offer bounties, there are also “Zero-Day Brokers”
that will buy bugs for their customers. Buyers and sellers in these markets are usually anonymous, which has pros and cons. Perhaps a
vendor simply wishes to discreetly reward a researcher for their efforts, but it’s also possible that the buyer is a hostile nation-state, cyber
criminal enterprise, or otherwise maliciously inclined. The seller has no visibility or control over whether the vulnerabilities are used to make a
product safer or cause harm to others.
Black Hat Markets: Leaving shades of grey and scruples behind, it’s also possible to sell your zero days on the black market. In this
growing marketplace all bets are off, and it’s inevitable that some of these vulnerabilities and exploits will be exposed to the masses. This is
part of the reason why threat researchers have been able to confirm that the creation and distribution of zero days by cyber criminals is on
the rise.
Operating outside but alongside these markets, some professional organizations have decided stealing zero days is preferable to
discovering or purchasing them. A recent example is the group known as The Shadow Brokers, which infamously compromised a cache
of zero days that they claim were owned by the NSA. One of these, EternalBlue, has been used by the famous WannaCry ransomware and
WannaMine cryptojacking campaigns.
Air France: 1
Asus: 1
Citrix: 2
D-Link: 1
F-Secure: 3
Google: 1
Huawei: 1
IDM Solutions: 1
Imagely: 2
Magento: 1
Microsoft: 2
Nitro Software: 1
Swisscom: 2
Tableau Software: 1
Yandex: 2
Zoho: 1
TABLE 1. VENDOR ZERO DAYS DISCLOSED BY FORTINET IN Q1 2018

BOTNET TRENDS
16
BOTNET TRENDS
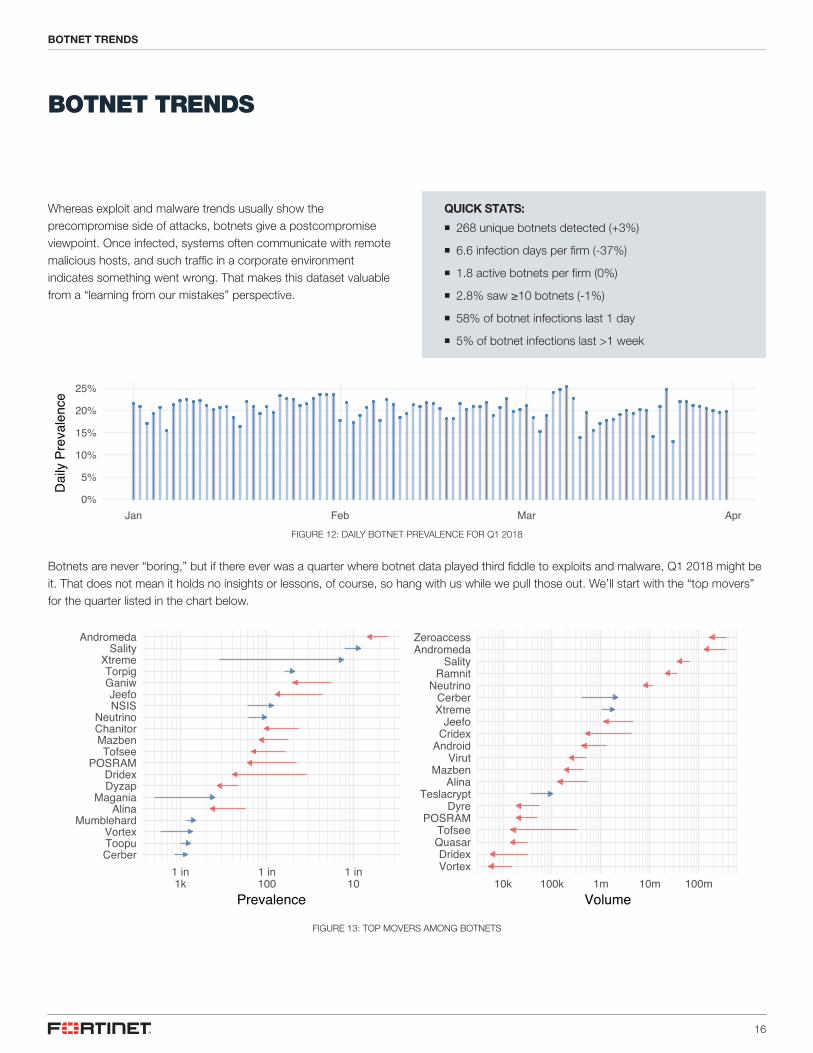
Whereas exploit and malware trends usually show the precompromise side of attacks, botnets give a postcompromise viewpoint. Once infected, systems often communicate with remote malicious hosts, and such traffic in a corporate environment indicates something went wrong. That makes this dataset valuable from a “learning from our mistakes” perspective.
FIGURE 12: DAILY BOTNET PREVALENCE FOR Q1 2018
BOTNET TRENDS
QUICK STATS:
n 268 unique botnets detected (+3%)
n 6.6 infection days per firm (-37%)
n 1.8 active botnets per firm (0%)
n 2.8% saw ≥10 botnets (-1%)
n 58% of botnet infections last 1 day
n 5% of botnet infections last >1 week
0%
5%
10%
15%
20%
25%
Jan Feb Mar Apr
Daily
Pre
valen
ce
Botnets are never “boring,” but if there ever was a quarter where botnet data played third fiddle to exploits and malware, Q1 2018 might be it. That does not mean it holds no insights or lessons, of course, so hang with us while we pull those out. We’ll start with the “top movers” for the quarter listed in the chart below.
CerberToopuVortex
MumblehardAlina
MaganiaDyzapDridex
POSRAMTofsee
MazbenChanitorNeutrino
NSISJeefo
GaniwTorpig
XtremeSality
Andromeda
1 in1k
1 in100
1 in10
Prevalence
VortexDridex
QuasarTofsee
POSRAMDyre
TeslacryptAlina
MazbenVirut
AndroidCridexJeefo
XtremeCerber
NeutrinoRamnit
SalityAndromedaZeroaccess
10k 100k 1m 10m 100mVolume
FIGURE 13: TOP MOVERS AMONG BOTNETS
17
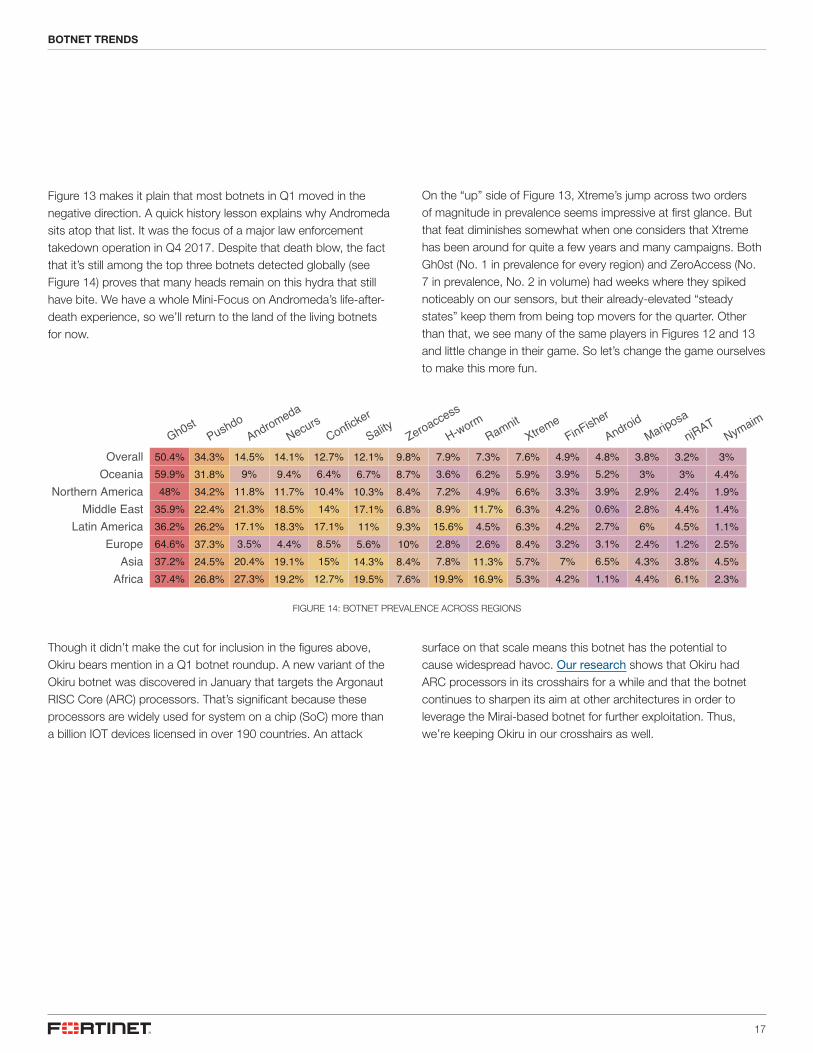
Figure 13 makes it plain that most botnets in Q1 moved in the negative direction. A quick history lesson explains why Andromeda sits atop that list. It was the focus of a major law enforcement takedown operation in Q4 2017. Despite that death blow, the fact that it’s still among the top three botnets detected globally (see Figure 14) proves that many heads remain on this hydra that still have bite. We have a whole Mini-Focus on Andromeda’s life-after-death experience, so we’ll return to the land of the living botnets for now.
FIGURE 14: BOTNET PREVALENCE ACROSS REGIONS
BOTNET TRENDS
On the “up” side of Figure 13, Xtreme’s jump across two orders of magnitude in prevalence seems impressive at first glance. But that feat diminishes somewhat when one considers that Xtreme has been around for quite a few years and many campaigns. Both Gh0st (No. 1 in prevalence for every region) and ZeroAccess (No. 7 in prevalence, No. 2 in volume) had weeks where they spiked noticeably on our sensors, but their already-elevated “steady states” keep them from being top movers for the quarter. Other than that, we see many of the same players in Figures 12 and 13 and little change in their game. So let’s change the game ourselves to make this more fun.
1.1%6.5%3.1%2.7%0.6%3.9%5.2%
27.3%20.4%3.5%
17.1%21.3%11.8%
9%
12.7%15%8.5%
17.1%14%
10.4%6.4%
4.2%7%
3.2%4.2%4.2%3.3%3.9%
37.4%37.2%64.6%36.2%35.9%48%
59.9%
19.9%7.8%2.8%
15.6%8.9%7.2%3.6%
4.4%4.3%2.4%6%
2.8%2.9%3%
19.2%19.1%4.4%
18.3%18.5%11.7%9.4%
6.1%3.8%1.2%4.5%4.4%2.4%3%
2.3%4.5%2.5%1.1%1.4%1.9%4.4%
26.8%24.5%37.3%26.2%22.4%34.2%31.8%
16.9%11.3%2.6%4.5%
11.7%4.9%6.2%
19.5%14.3%5.6%11%
17.1%10.3%6.7%
5.3%5.7%8.4%6.3%6.3%6.6%5.9%
7.6%8.4%10%9.3%6.8%8.4%8.7%
4.8%14.5% 12.7% 4.9%50.4% 7.9% 3.8%14.1% 3.2% 3%34.3% 7.3%12.1% 7.6%9.8%Gh0st
PushdoAndromeda
NecursConficker
Sality Zeroaccess
H-wormRamnit
XtremeFinFisher
AndroidMariposa
njRATNymaim
AfricaAsia
EuropeLatin America
Middle EastNorthern America
OceaniaOverall
Though it didn’t make the cut for inclusion in the figures above, Okiru bears mention in a Q1 botnet roundup. A new variant of the Okiru botnet was discovered in January that targets the Argonaut RISC Core (ARC) processors. That’s significant because these processors are widely used for system on a chip (SoC) more than a billion IOT devices licensed in over 190 countries. An attack
surface on that scale means this botnet has the potential to cause widespread havoc. Our research shows that Okiru had ARC processors in its crosshairs for a while and that the botnet continues to sharpen its aim at other architectures in order to leverage the Mirai-based botnet for further exploitation. Thus, we’re keeping Okiru in our crosshairs as well.
18
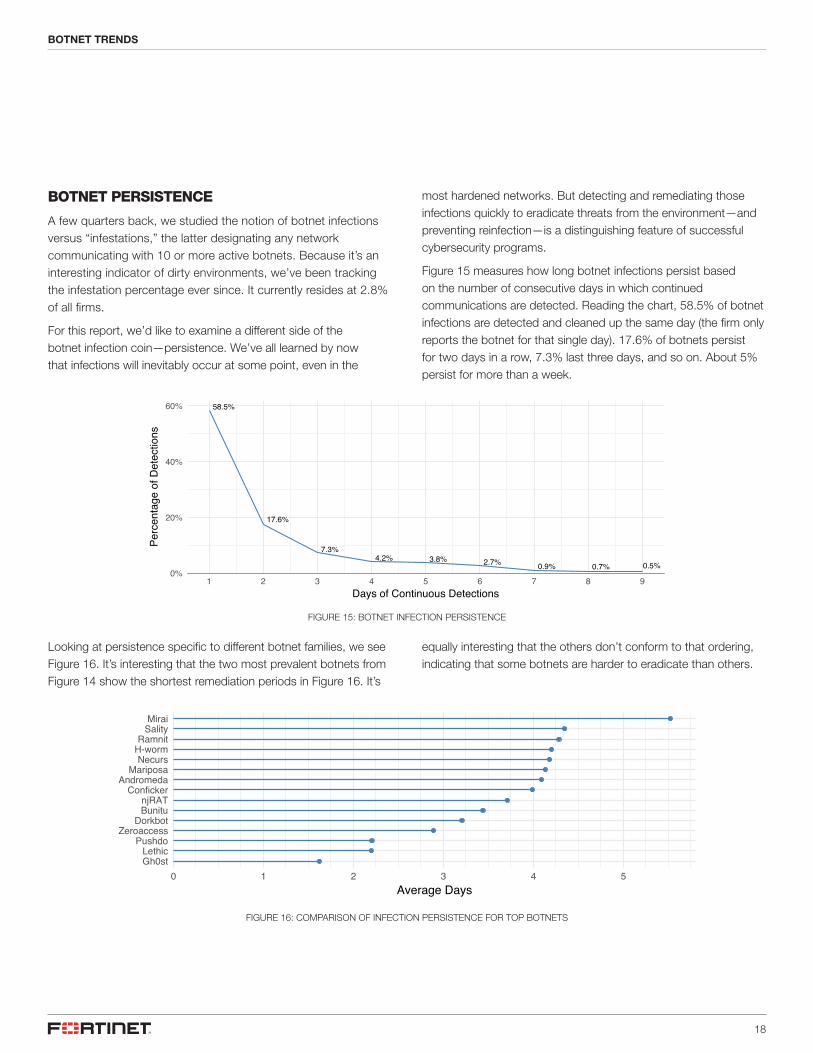
BOTNET PERSISTENCE
A few quarters back, we studied the notion of botnet infections versus “infestations,” the latter designating any network communicating with 10 or more active botnets. Because it’s an interesting indicator of dirty environments, we’ve been tracking the infestation percentage ever since. It currently resides at 2.8% of all firms.
For this report, we’d like to examine a different side of the botnet infection coin—persistence. We’ve all learned by now that infections will inevitably occur at some point, even in the
BOTNET TRENDS
most hardened networks. But detecting and remediating those infections quickly to eradicate threats from the environment—and preventing reinfection—is a distinguishing feature of successful cybersecurity programs.
Figure 15 measures how long botnet infections persist based on the number of consecutive days in which continued communications are detected. Reading the chart, 58.5% of botnet infections are detected and cleaned up the same day (the firm only reports the botnet for that single day). 17.6% of botnets persist for two days in a row, 7.3% last three days, and so on. About 5% persist for more than a week.
58.5%
17.6%
7.3%4.2% 3.8% 2.7% 0.9% 0.7% 0.5%
0%
20%
40%
60%
1 2 3 4 5 6 7 8 9Days of Continuous Detections
Perc
enta
ge o
f Det
ectio
ns
FIGURE 15: BOTNET INFECTION PERSISTENCE
Looking at persistence specific to different botnet families, we see Figure 16. It’s interesting that the two most prevalent botnets from Figure 14 show the shortest remediation periods in Figure 16. It’s
equally interesting that the others don’t conform to that ordering, indicating that some botnets are harder to eradicate than others.
Gh0stLethic
PushdoZeroaccess
DorkbotBunitunjRAT
ConfickerAndromeda
MariposaNecurs
H-wormRamnit
SalityMirai
0 1 2 3 4 5Average Days
FIGURE 16: COMPARISON OF INFECTION PERSISTENCE FOR TOP BOTNETS
19
MINI FOCUS: COMMUNING WITH DEAD BOTNETS
MINI FOCUS: COMMUNING WITH DEAD BOTNETS
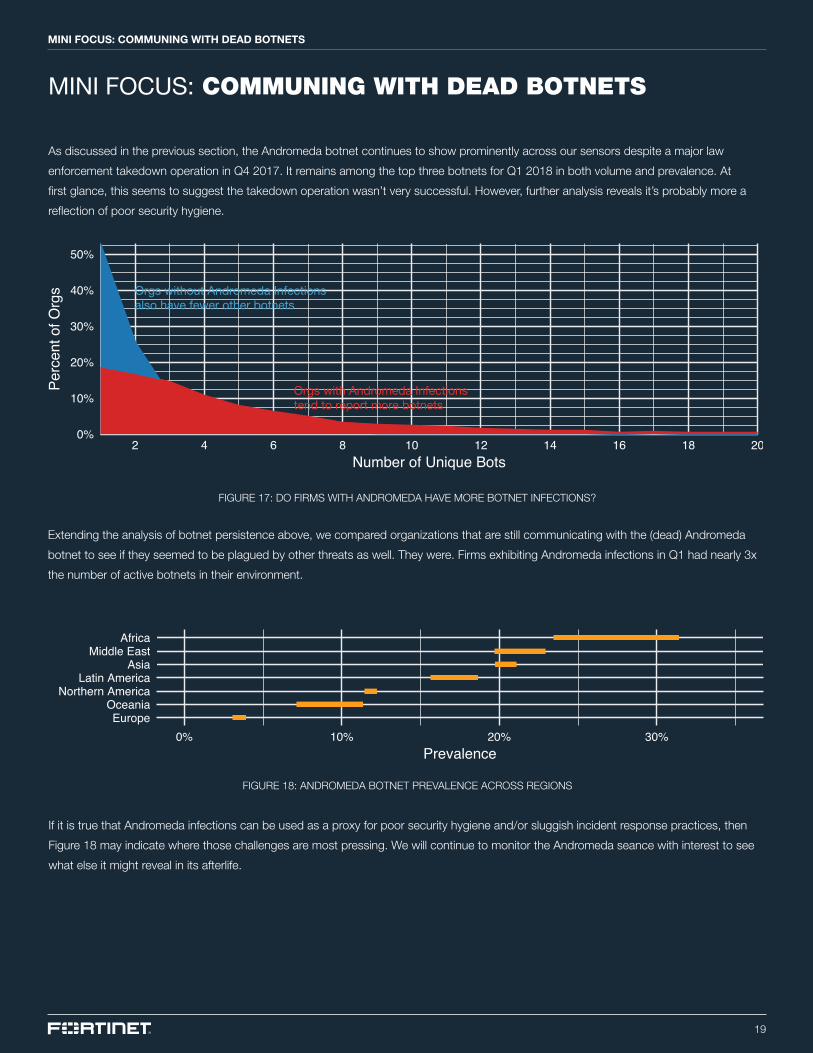
As discussed in the previous section, the Andromeda botnet continues to show prominently across our sensors despite a major law
enforcement takedown operation in Q4 2017. It remains among the top three botnets for Q1 2018 in both volume and prevalence. At
first glance, this seems to suggest the takedown operation wasn’t very successful. However, further analysis reveals it’s probably more a
reflection of poor security hygiene.
FIGURE 17: DO FIRMS WITH ANDROMEDA HAVE MORE BOTNET INFECTIONS?
Extending the analysis of botnet persistence above, we compared organizations that are still communicating with the (dead) Andromeda
botnet to see if they seemed to be plagued by other threats as well. They were. Firms exhibiting Andromeda infections in Q1 had nearly 3x
the number of active botnets in their environment.
If it is true that Andromeda infections can be used as a proxy for poor security hygiene and/or sluggish incident response practices, then
Figure 18 may indicate where those challenges are most pressing. We will continue to monitor the Andromeda seance with interest to see
what else it might reveal in its afterlife.
FIGURE 18: ANDROMEDA BOTNET PREVALENCE ACROSS REGIONS
EuropeOceania
Northern AmericaLatin America
AsiaMiddle East
Africa
0% 10% 20% 30%Prevalence
CONCLUSION ANDRECOMMENDATIONS
21
CONCLUSION AND RECOMMENDATIONS
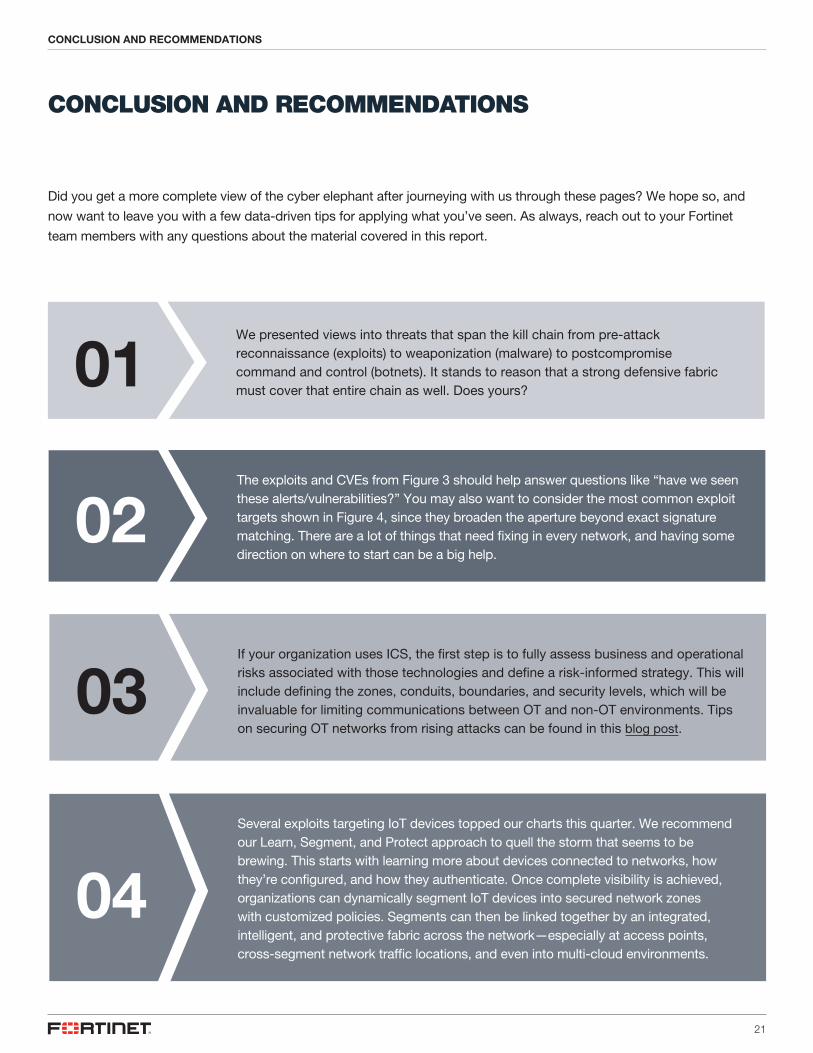
Did you get a more complete view of the cyber elephant after journeying with us through these pages? We hope so, and
now want to leave you with a few data-driven tips for applying what you’ve seen . As always, reach out to your Fortinet
team members with any questions about the material covered in this report .
01We presented views into threats that span the kill chain from pre-attack reconnaissance (exploits) to weaponization (malware) to postcompromise command and control (botnets) . It stands to reason that a strong defensive fabric must cover that entire chain as well . Does yours?
02The exploits and CVEs from Figure 3 should help answer questions like “have we seen these alerts/vulnerabilities?” You may also want to consider the most common exploit targets shown in Figure 4, since they broaden the aperture beyond exact signature matching . There are a lot of things that need fixing in every network, and having some direction on where to start can be a big help .
03If your organization uses ICS, the first step is to fully assess business and operational risks associated with those technologies and define a risk-informed strategy . This will include defining the zones, conduits, boundaries, and security levels, which will be invaluable for limiting communications between OT and non-OT environments . Tips on securing OT networks from rising attacks can be found in this blog post .
04Several exploits targeting IoT devices topped our charts this quarter . We recommend our Learn, Segment, and Protect approach to quell the storm that seems to be brewing . This starts with learning more about devices connected to networks, how they’re configured, and how they authenticate . Once complete visibility is achieved, organizations can dynamically segment IoT devices into secured network zones with customized policies . Segments can then be linked together by an integrated, intelligent, and protective fabric across the network—especially at access points, cross-segment network traffic locations, and even into multi-cloud environments .
CONCLUSION AND RECOMMENDATIONS
22
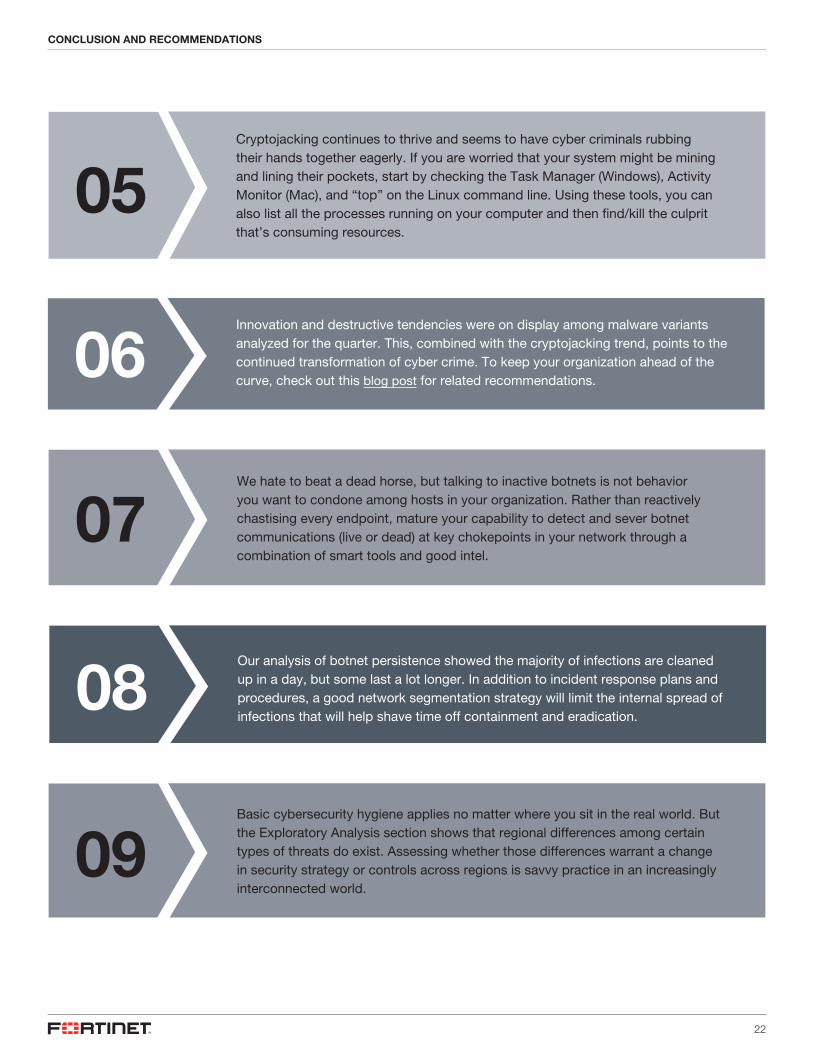
06Innovation and destructive tendencies were on display among malware variants analyzed for the quarter . This, combined with the cryptojacking trend, points to the continued transformation of cyber crime . To keep your organization ahead of the curve, check out this blog post for related recommendations .
07We hate to beat a dead horse, but talking to inactive botnets is not behavior you want to condone among hosts in your organization . Rather than reactively chastising every endpoint, mature your capability to detect and sever botnet communications (live or dead) at key chokepoints in your network through a combination of smart tools and good intel .
08Our analysis of botnet persistence showed the majority of infections are cleaned up in a day, but some last a lot longer . In addition to incident response plans and procedures, a good network segmentation strategy will limit the internal spread of infections that will help shave time off containment and eradication .
09Basic cybersecurity hygiene applies no matter where you sit in the real world . But the Exploratory Analysis section shows that regional differences among certain types of threats do exist . Assessing whether those differences warrant a change in security strategy or controls across regions is savvy practice in an increasingly interconnected world .
CONCLUSION AND RECOMMENDATIONS
05Cryptojacking continues to thrive and seems to have cyber criminals rubbing their hands together eagerly . If you are worried that your system might be mining and lining their pockets, start by checking the Task Manager (Windows), Activity Monitor (Mac), and “top” on the Linux command line . Using these tools, you can also list all the processes running on your computer and then find/kill the culprit that’s consuming resources .
23
SOURCES AND MEASURES
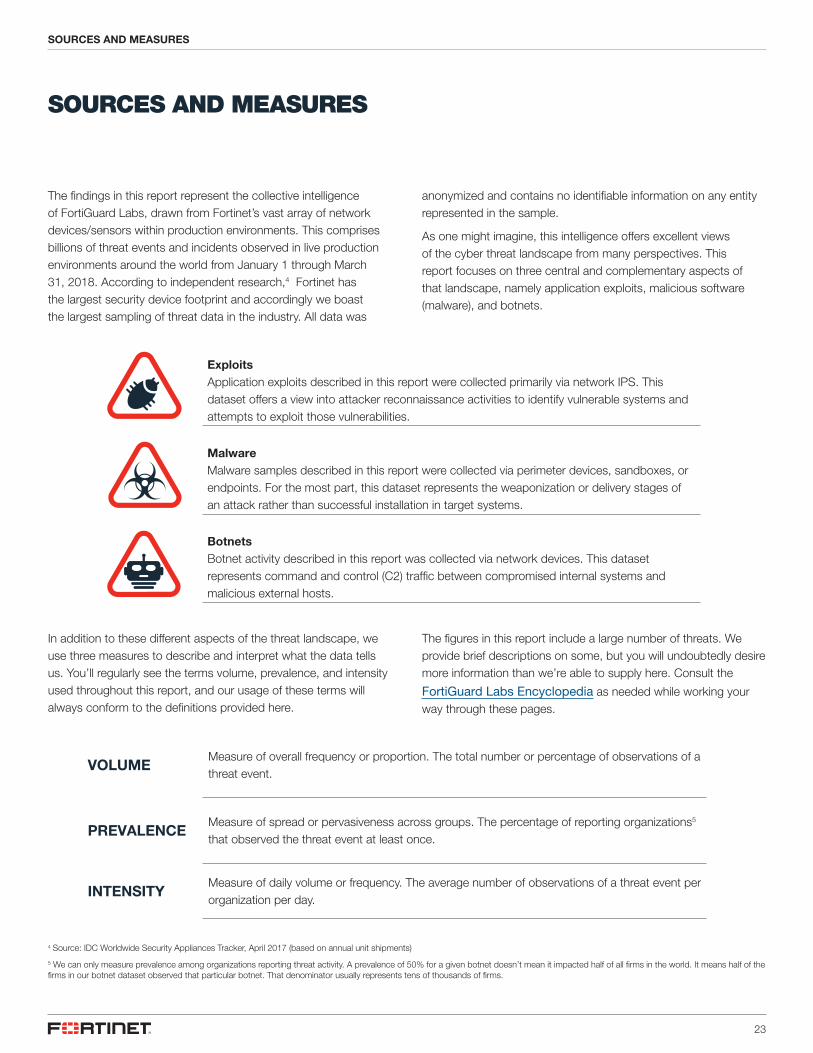
The findings in this report represent the collective intelligence of FortiGuard Labs, drawn from Fortinet’s vast array of network devices/sensors within production environments. This comprises billions of threat events and incidents observed in live production environments around the world from January 1 through March 31, 2018. According to independent research,4 Fortinet has the largest security device footprint and accordingly we boast the largest sampling of threat data in the industry. All data was
Exploits Application exploits described in this report were collected primarily via network IPS. This dataset offers a view into attacker reconnaissance activities to identify vulnerable systems and attempts to exploit those vulnerabilities.
Malware Malware samples described in this report were collected via perimeter devices, sandboxes, or endpoints. For the most part, this dataset represents the weaponization or delivery stages of an attack rather than successful installation in target systems.
Botnets Botnet activity described in this report was collected via network devices. This dataset represents command and control (C2) traffic between compromised internal systems and malicious external hosts.
VOLUMEMeasure of overall frequency or proportion. The total number or percentage of observations of a threat event.
PREVALENCEMeasure of spread or pervasiveness across groups. The percentage of reporting organizations5 that observed the threat event at least once.
INTENSITYMeasure of daily volume or frequency. The average number of observations of a threat event per organization per day.
SOURCES AND MEASURES
anonymized and contains no identifiable information on any entity represented in the sample.
As one might imagine, this intelligence offers excellent views of the cyber threat landscape from many perspectives. This report focuses on three central and complementary aspects of that landscape, namely application exploits, malicious software (malware), and botnets.
4 Source: IDC Worldwide Security Appliances Tracker, April 2017 (based on annual unit shipments)
5 We can only measure prevalence among organizations reporting threat activity. A prevalence of 50% for a given botnet doesn’t mean it impacted half of all firms in the world. It means half of the firms in our botnet dataset observed that particular botnet. That denominator usually represents tens of thousands of firms.
In addition to these different aspects of the threat landscape, we use three measures to describe and interpret what the data tells us. You’ll regularly see the terms volume, prevalence, and intensity used throughout this report, and our usage of these terms will always conform to the definitions provided here.
The figures in this report include a large number of threats. We provide brief descriptions on some, but you will undoubtedly desire more information than we’re able to supply here. Consult the
FortiGuard Labs Encyclopedia as needed while working your way through these pages.

Copyright © 2018 Fortinet, Inc. All rights reserved. Fortinet®, FortiGate®, FortiCare® and FortiGuard®, and certain other marks are registered trademarks of Fortinet, Inc., and other Fortinet names herein may also be registered and/or common law trademarks of Fortinet. All other product or company names may be trademarks of their respective owners. Performance and other metrics contained herein were attained in internal lab tests under ideal conditions, and actual performance and other results may vary. Network variables, different network environments and other conditions may affect performance results. Nothing herein represents any binding commitment by Fortinet, and Fortinet disclaims all warranties, whether express or implied, except to the extent Fortinet enters a binding written contract, signed by Fortinet’s General Counsel, with a purchaser that expressly warrants that the identified product will perform according to certain expressly-identified performance metrics and, in such event, only the specific performance metrics expressly identified in such binding written contract shall be binding on Fortinet. For absolute clarity, any such warranty will be limited to performance in the same ideal conditions as in Fortinet’s internal lab tests. Fortinet disclaims in full any covenants, representations, and guarantees pursuant hereto, whether express or implied. Fortinet reserves the right to change, modify, transfer, or otherwise revise this publication without notice, and the most current version of the publication shall be applicable. Fortinet disclaims in full any covenants, representations, and guarantees pursuant hereto, whether express or implied. Fortinet reserves the right to change, modify, transfer, or otherwise revise this publication without notice, and the most current version of the publication shall be applicable.
GLOBAL HEADQUARTERSFortinet Inc.899 Kifer RoadSunnyvale, CA 94086United StatesTel: +1.408.235.7700www.fortinet.com/sales
EMEA SALES OFFICE905 rue Albert Einstein06560 ValbonneFranceTel: +33.4.8987.0500
APAC SALES OFFICE300 Beach Road 20-01The ConcourseSingapore 199555Tel: +65.6513.3730
LATIN AMERICA HEADQUARTERSSawgrass Lakes Center13450 W. Sunrise Blvd., Suite 430Sunrise, FL 33323Tel: +1.954.368.9990
May 14, 2018