Embed Size (px)
Citation preview

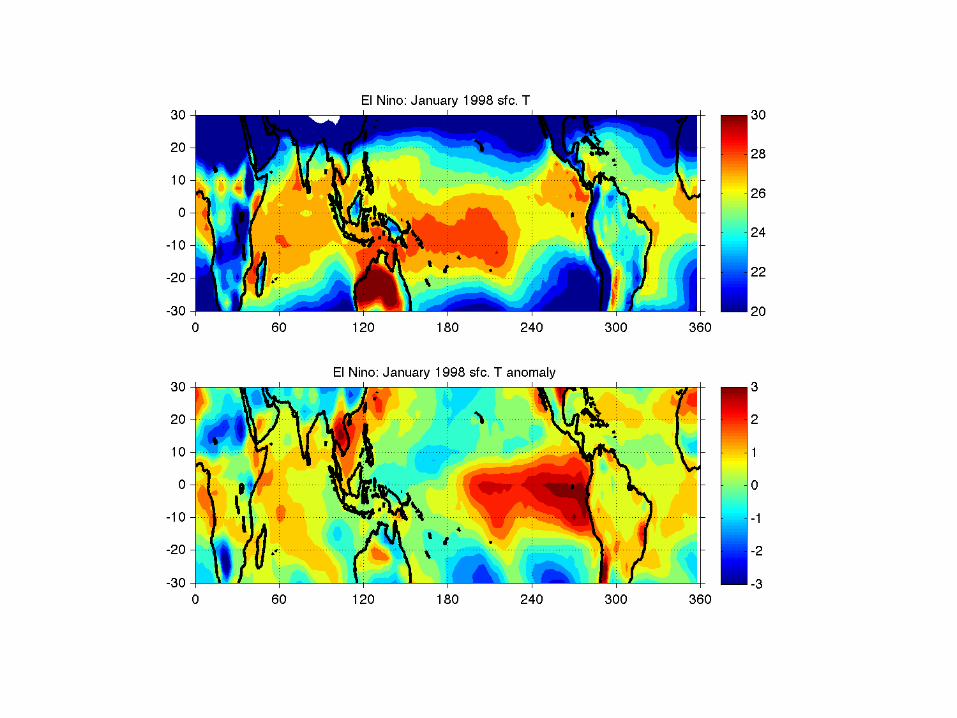
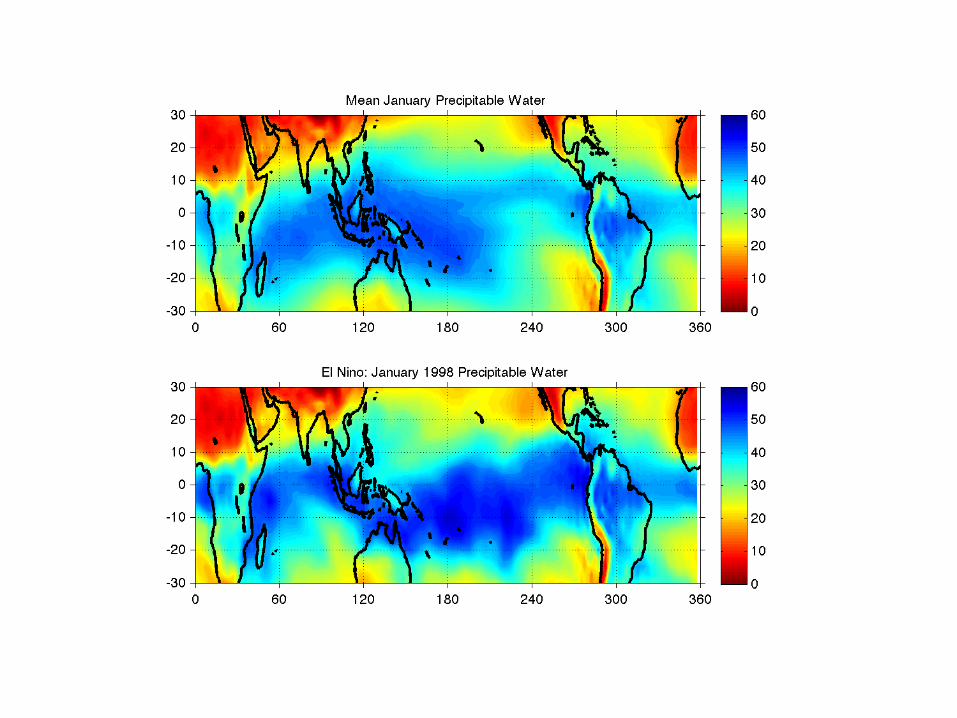
Three cases:(1) La Nina event in 1989(2) A strong El Nino in 1998(3) A moderate El Nino in 1987
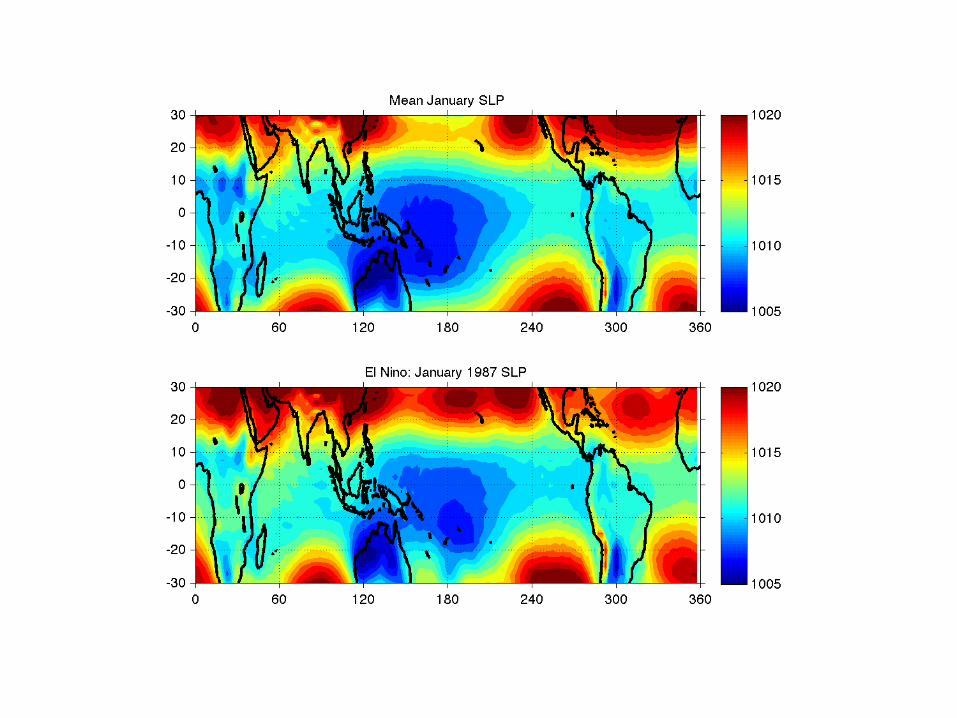
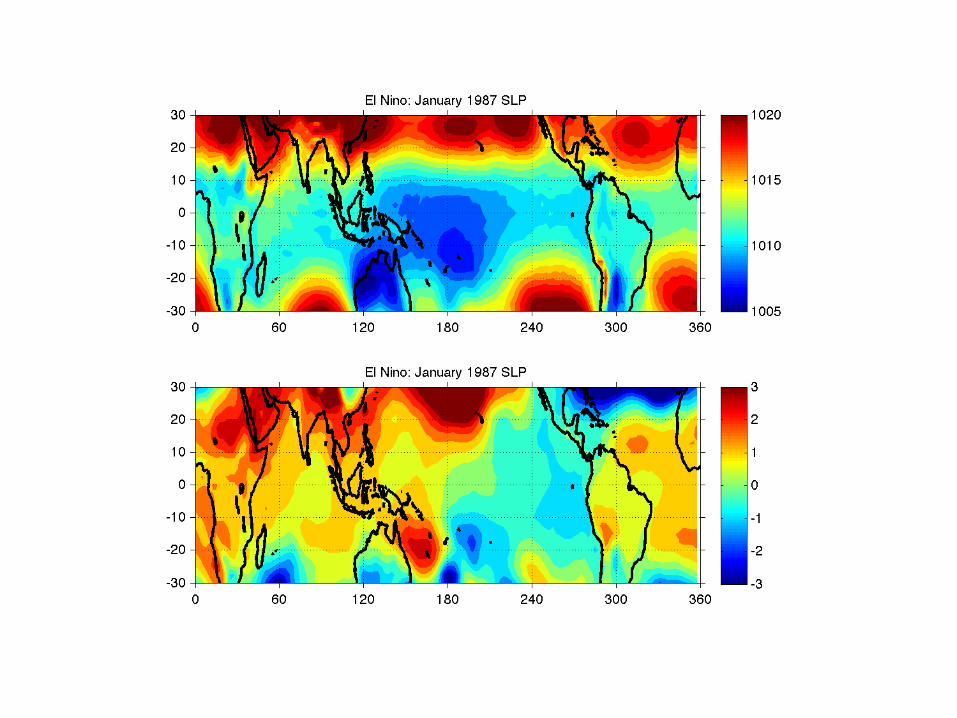
Three fields:(a) Surface temperatures and anomalies(b) Sea level pressure and anomalies(c) Precipitable water and anomalies
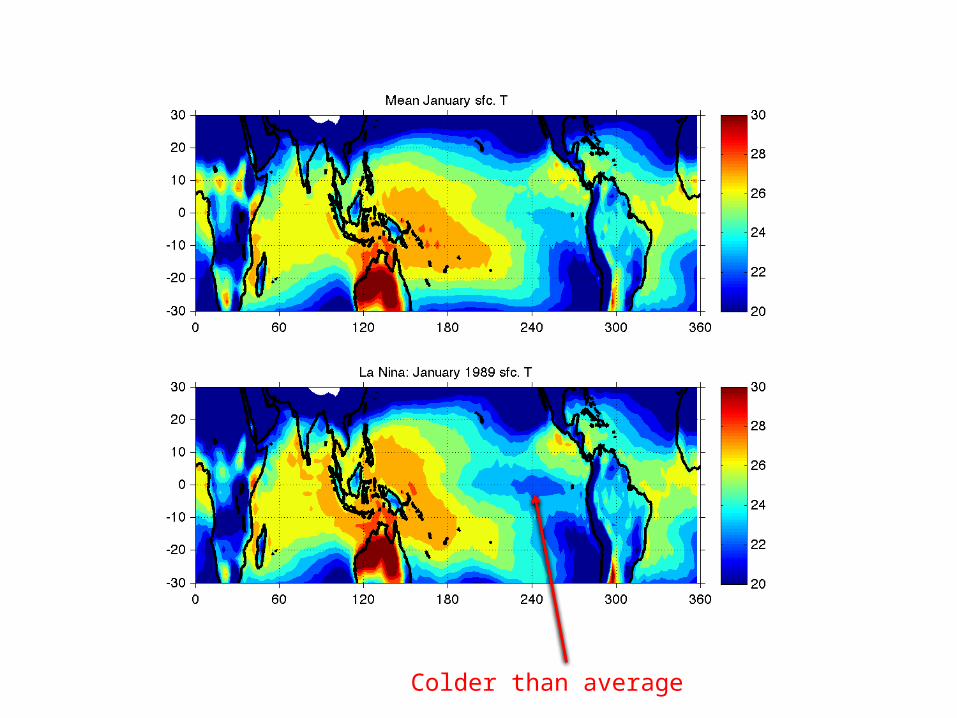
Colder than average

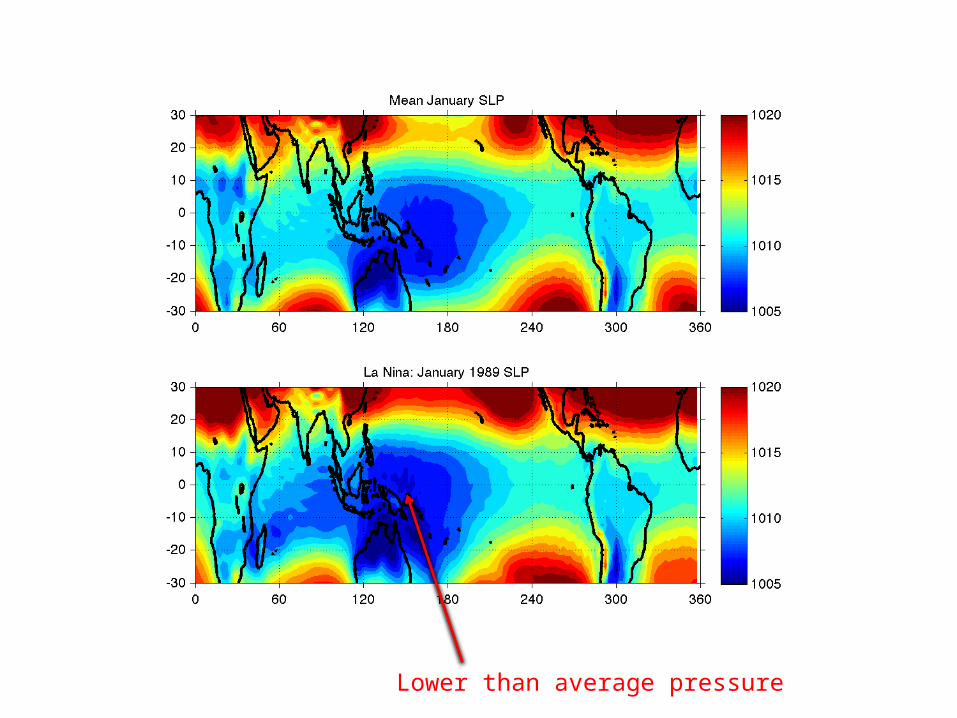
Lower than average pressure

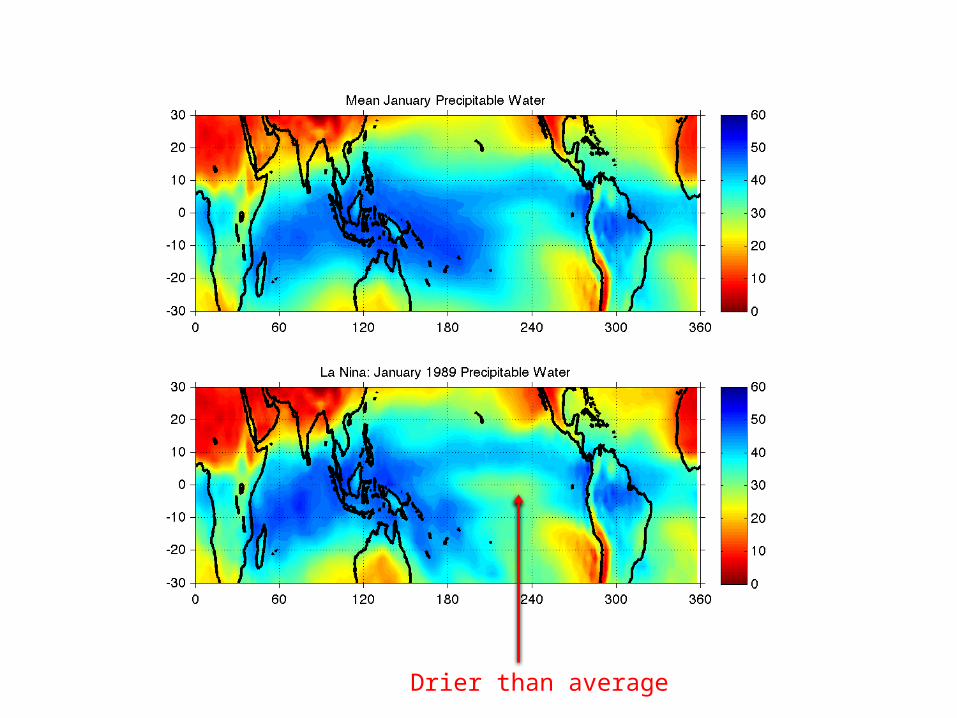
Drier than average


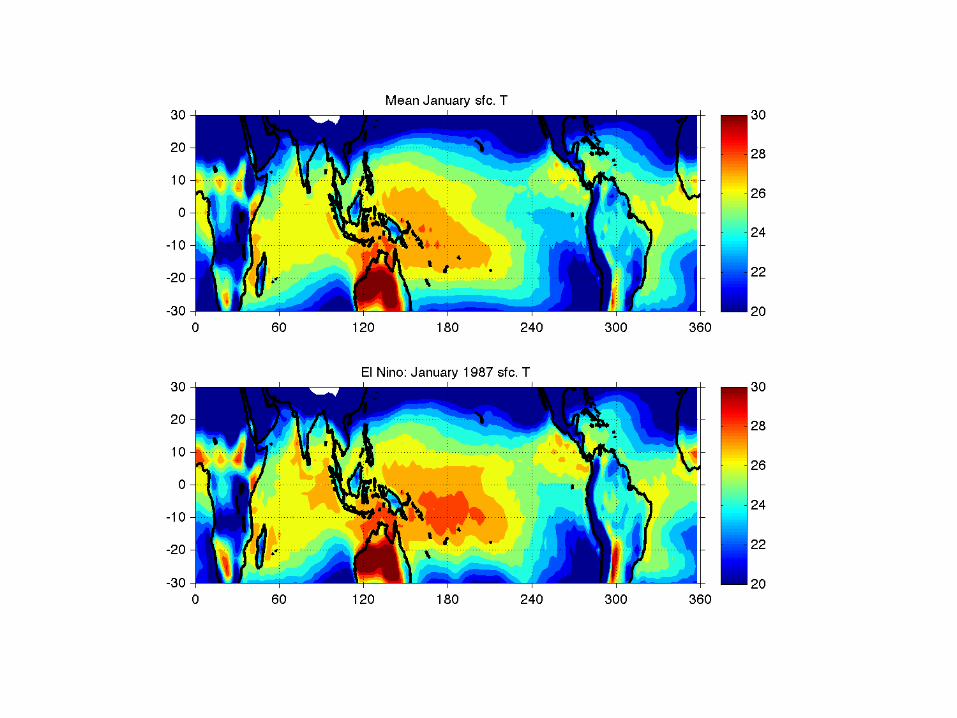


Not all events have same amplitude…best to think of an analogy between El Nino and La Nina and summer and winter: there are things common to each winter to make it a useful concept, but each one is different owing to different weather, different amplitudes of temperature extremes, etc.
El Ninos, particularly strong ones, are generally confined to a single 12 month interval. La Ninas may persist for a few consecutive years, so there the oscillation is not linear in nature.

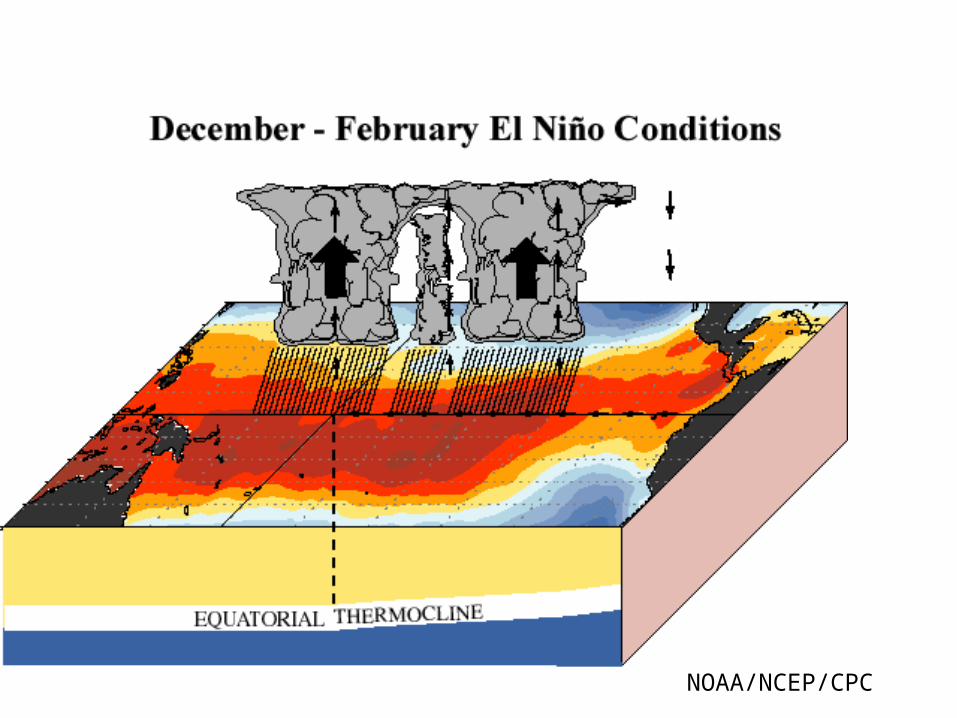
NOAA/NCEP/CPC
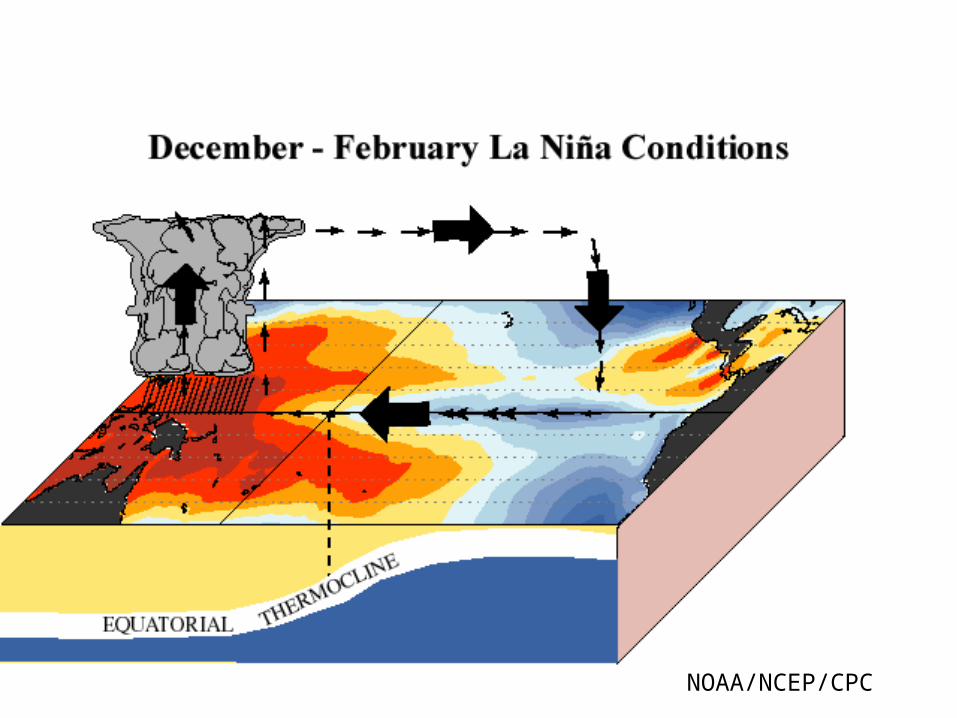
NOAA/NCEP/CPC
NOAA/NCEP/CPC

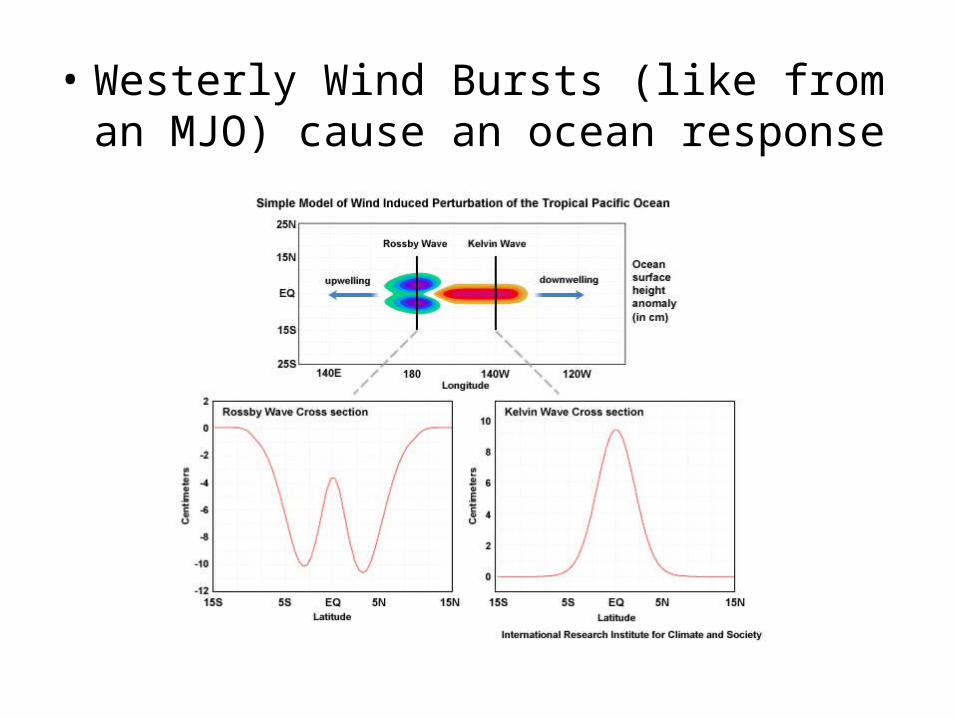
• Westerly Wind Bursts (like from an MJO) cause an ocean response

Delayed Oscillator Theory• Initially, Kelvin is
downwelling (bringing warmer SSTs), and Rossby is upwelling
• Rossby is much slower than Kelvin
• At reflection, wave type shift
• Key: The reflected Rossby from maritime continent becomes an UPWELLING Kelvin
• “Seeds of its own demise”
• If this were the only thing happening, would get a very regular oscillation
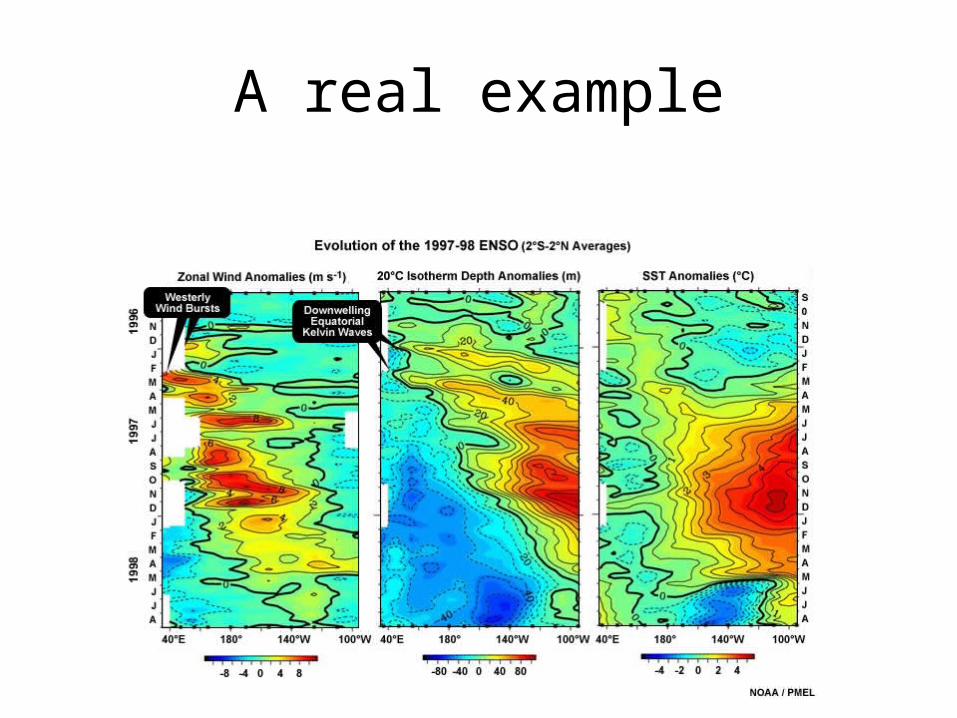
A real example

There must be more…
• Clearly there must be other companion mechanisms, with input from atmosphere, to get us to 3-5 (2-7) year irregular cycles– The original feedback theory– Recharge/discharge theory – Heat builds up in the
equatorial region, discharged eastward and poleward during El Niño
• Lots of other theories (text), and active research

Monitoring
• 3.4 is frequently used because of signal of both convection and SST
• 1&2 warm first!

SOI = Tahiti - Darwin (normalized)
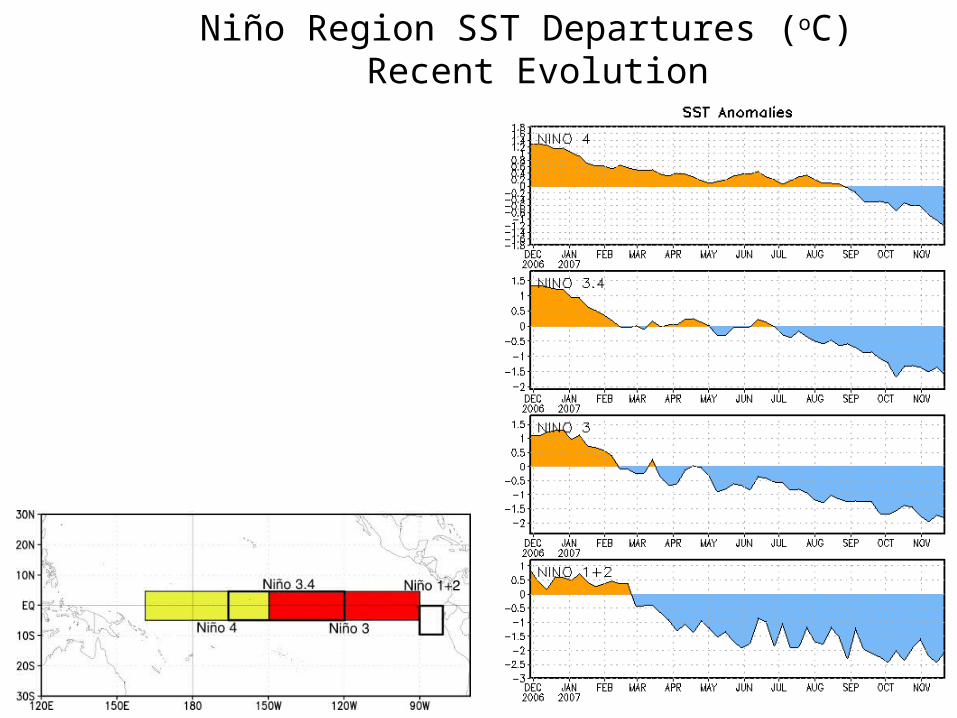
Niño Region SST Departures (oC) Recent Evolution
The latest weekly SST departures are:
Niño 4 -1.2ºC
Niño 3.4 -1.6ºC
Niño 3 -1.8ºC
Niño 1+2 -2.0ºC

SOI and Nino 3-4 index

Jet stream configur-
ations

Global Effects

Mean number of days per season (November - March 1948 through 1993) in which precipitation exceeded 0.50 inches for Neutral years (top). Lower left map is the difference in this quantity between El Niño years and Neutral years. Lower right map is the difference in this quantity between La Niña years and Neutral years.
North American
Effects