Embed Size (px)
Citation preview

HAL Id: hal-01386666https://hal.archives-ouvertes.fr/hal-01386666
Submitted on 24 Oct 2016
HAL is a multi-disciplinary open accessarchive for the deposit and dissemination of sci-entific research documents, whether they are pub-lished or not. The documents may come fromteaching and research institutions in France orabroad, or from public or private research centers.
L’archive ouverte pluridisciplinaire HAL, estdestinée au dépôt et à la diffusion de documentsscientifiques de niveau recherche, publiés ou non,émanant des établissements d’enseignement et derecherche français ou étrangers, des laboratoirespublics ou privés.
Three differentiation stages of a single magma at Pitonde la Fournaise volcano (Reunion hot spot)
Vincent Famin, Benoît Welsch, Satoshi Okumura, Patrick Bachèlery, SatoruNakashima
To cite this version:Vincent Famin, Benoît Welsch, Satoshi Okumura, Patrick Bachèlery, Satoru Nakashima. Three differ-entiation stages of a single magma at Piton de la Fournaise volcano (Reunion hot spot). Geochemistry,Geophysics, Geosystems, AGU and the Geochemical Society, 2009, 10 (1), �10.1029/2008GC002015�.�hal-01386666�
Three differentiation stages of a single magma at Piton de laFournaise volcano (Reunion hot spot)
Vincent Famin and Benoıt WelschLaboratoire Geosciences Reunion, Institut de Physique du Globe de Paris, Universite de la Reunion, UMR 7154, CNRS,15 avenue Rene Cassin, BP 7151, F-97715 Saint Denis messag CEDEX 9, La Reunion, France([email protected])
Satoshi OkumuraDepartment of Earth and Planetary Materials Science, Graduate School of Science, Tohoku University, Sendai980-8578, Japan
Patrick BacheleryLaboratoire Geosciences Reunion, Institut de Physique du Globe de Paris, Universite de la Reunion, UMR 7154, CNRS,15 avenue Rene Cassin, BP 7151, F-97715 Saint Denis messag CEDEX 9, La Reunion, France
Satoru NakashimaDepartment of Earth and Space Science, Graduate School of Science, Osaka University, 1-1 Machikaneyama-cho, Osaka560-0043, Japan
[1] We present major element and volatile concentration analyses in melt and gas inclusions from tworecent picrite eruptions (February 2005 and December 2005) at Piton de la Fournaise volcano (La ReunionIsland, Indian Ocean). Combined with literature data, our new data show that the large variability of majorelement compositions in Piton de la Fournaise lavas may be explained by three depth-dependentdifferentiation stages of a single transitional parental magma (9–11 wt% MgO; 0.5–0.8 wt% K2O, and10–12 wt% CaO). The deepest differentiation (>7.5 km) is controlled by the fractional crystallization ofclinopyroxene + plagioclase and yields gabbros and basalts enriched in K and depleted in Ca relative to theparental magma. In a shallower storage zone (<2.5 km), differentiation of the transitional parental magmais dominated by the fractionation/accumulation of Fo83–85 olivine phenocrysts, yielding Mg-poor basalts atthe top of the reservoir and picrites at the base. In cooling dykes and subsurface pockets (<0.6 km), Mg-poor basalts may themselves evolve into more differentiated melts by clinopyroxene + plagioclasefractionation. The incorporation of dunitic xenocrysts or other xenoliths is not necessary to explain themajor element chemical diversity of the volcano. The same superposition of differentiation mechanismsmay occur at similar depths in other shield volcanoes.
Components: 11,313 words, 8 figures, 4 tables.
Keywords: melt inclusion; magmatic differentiation; ocean island basalt; Reunion hot spot; olivine; major element.
Index Terms: 1036 Geochemistry: Magma chamber processes (3618); 1065 Geochemistry: Major and trace element
geochemistry; 1043 Geochemistry: Fluid and melt inclusion geochemistry.
G3G3GeochemistryGeophysics
Geosystems
Published by AGU and the Geochemical Society
AN ELECTRONIC JOURNAL OF THE EARTH SCIENCES
GeochemistryGeophysics
Geosystems
Article
Volume 10, Number 1
29 January 2009
Q01007, doi:10.1029/2008GC002015
ISSN: 1525-2027
Copyright 2009 by the American Geophysical Union 1 of 18

Received 3 March 2008; Revised 18 August 2008; Accepted 27 August 2008; Published 29 January 2009.
Famin, V., B. Welsch, S. Okumura, P. Bachelery, and S. Nakashima (2009), Three differentiation stages of a single magma at
Piton de la Fournaise volcano (Reunion hot spot), Geochem. Geophys. Geosyst., 10, Q01007, doi:10.1029/2008GC002015.
1. Introduction
[2] A key to understanding hot spot dynamics andEarth’s mantle heterogeneity is to study the chem-ical evolution of ocean island basaltic magmas ontheir way up to the surface [e.g., Hauri, 1992].Knowing how, where, and when these magmas areaffected by differentiation, contamination, or mix-ing is important to constrain the number and depthof magmatic reservoirs, the composition of thecrust hosting those reservoirs, and the compositionof the mantle source. The largest chemical vari-ability of ocean island basalts (OIB) is found in theshield-building stage of the volcanoes [Macdonaldand Katsura, 1964], during which picrites (basaltscontaining more than 20 volume % olivine), alkalibasalts, and silica-rich lavas can erupt simulta-neously or in short time intervals. Whether thesecompositional variations are entirely due to ashallow magmatic evolution, to a mixing betweendifferent components, or to a heterogeneous mantlesource remains debated [Hauri, 1992; Ren et al.,2005; Sobolev et al., 2005]. The way how OIBmagmatic evolution can yield such a large range ofcompositions deserves further clarification.
[3] In this paper, we investigate the major elementgeochemical evolution of OIBs from Piton de laFournaise, the active volcano of Reunion Island,Indian Ocean (Figure 1). After 6 years of repose,this volcano is now yielding more than one erup-tion every 8 months since 1998, providing anextensive record of present-day magmatic prod-ucts. We analyzed major and volatile elementconcentrations in olivine-hosted melt inclusions(i.e., droplets of magma trapped in minerals) fromtwo recent picrite eruptions (17 February to 2 May2005 and 26 December 2005 to 18 January 2006;Figure 1a). Melt inclusions are useful because theyprovide ‘‘snapshots’’ on the composition of themelt at different stages of the magmatic evolution[e.g., Sours-Page et al., 2002] and not only on thefinal state of the magma as does bulk rock chem-istry. This study uses three ‘‘snapshots’’: primarymelt inclusions (trapped during the crystallizationof the host olivines), secondary melt inclusions(trapped in deformation microstructures of theminerals after crystallization), and residual matrix
glasses (in the groundmass). We also analyzedsecondary gas inclusions (i.e., secondary inclusionsthat trapped volatiles instead of melt) to investigatethe composition of the gas phase in the magma. Bycomparing our analyses with published data onReunion bulk rock, melt inclusion, and matrixglasses, we show that the large range of eruptedlavas may be explained by successive, depth-de-pendent crystal fractionations from a single homo-geneous magma. Because the geochemical anderuptive pattern of Piton de la Fournaise bearsmany similarities with other ocean shield volca-noes, these results contribute to a better under-standing of OIB evolution worldwide.
2. Previous Work on MagmaCompositions at Piton de la Fournaise
[4] The overall volcanic evolution of ReunionIsland [e.g., Upton and Wadsworth, 1965; Ludden,1978; Albarede et al., 1997] is similar to that ofHawaii [e.g., Macdonald and Katsura, 1964; Chenand Frey, 1983], even though Reunion magmas aretransitional between the alkalic and tholeiitic fieldswhereas those in Hawaii are tholeiitic on an alka-line versus silica diagram. Reunion Island is madeof two main volcanoes (Figure 1), the now extinctPiton des Neiges and the Piton de la Fournaisecurrently in the shield building stage (i.e., rapidgrowth and emission of basaltic products [Petersonand Moore, 1987]). The two volcanoes are rathersimilar in major, trace element and isotopic com-positions [Oversby, 1972; Zielinski, 1975; Ludden,1978; Fisk et al., 1988], except for some discretevariations in radiogenic isotopes [Luais, 2004;Bosch et al., 2008]. Piton de la Fournaise hasyielded a large range of magmatic products overthe past 0.5 Ma, classified into four groups basedon their bulk major element composition [Uptonand Wadsworth, 1965, 1972a; Ludden, 1978;Albarede and Tamagnan, 1988; Albarede et al.,1997]:
[5] 1. Steady state basalts (SSB), which are tran-sitional basalts of little compositional variability(5–8 wt% MgO; 0.5–1 wt% K2O; 10–12 wt%CaO, Figure 1b), constitute the most frequentlyerupted products of the volcano. These magmas
GeochemistryGeophysicsGeosystems G3G3
famin et al.: three differentiation stages at piton de la fournaise 10.1029/2008GC002015
2 of 18

mostly erupt near the summit area from dykesrooted at depths of 2 km or shallower [Peltier etal., 2008].
[6] 2. Olivine rich basalts and picrites (5–50 vol%olivine at Fo83–85; 8–28 wt% MgO; 0.4–0.7 wt%K2O; 5–11 wt% CaO, Figure 1b) are the secondmost abundant rocks (referred to as ‘‘oceanites’’ inthe work of Lacroix [1936]). Picrite eruptions aremost often associated with high eruption rates andlarge volumes of products [Kornprobst et al.,1979]. These lavas are more frequently eruptedoutside of the summit zone in the lower parts of thevolcano. In particular, the two picrite eruptionsinvestigated here (February 2005 and December2005) occurred more than 4 km away from thesummit, on the northeastern side of Piton de laFournaise (Figure 1a). The elevation of the ventsranged from 1650 to 500 m during the February2005 eruption and from 2025 to 1600 m during theDecember 2005 eruption. On the basis of grounddeformation modeling and the location of earth-quake swarms, dykes were estimated to originatefrom a depth of 2–2.5 km for these two eruptions[Peltier et al., 2008].
[7] 3. Differentiated, alkaline lavas (1–5 wt%MgO;1–4 wt% K2O; 1.8–10 wt% CaO, Figure 1b) are
found mostly in the early stages of Piton de la Four-naise building history and correspond to very rareshallowmagmatic activity [Albarede et al., 1997].
[8] 4. In addition, an abnormal group (AbG) oflavas (7.5–10 wt% MgO; 0.9–1.2 wt% K2O; 8.5–10 wt% CaO), enriched in Mg, Fe, Ti, Na, K, anddepleted in Ca, Si relative to SSB (Figure 1b), isrepresented by a few eruptions on the distal flanksof the edifice and by the recent central eruption ofthe Hudson vent in 1998 (Figure 1a). Both geo-chemistry and the location of earthquake swarmsindicate that these magmas rise from a depthgreater than 7.5 km [Bureau et al., 1998b, 1999;Battaglia et al., 2005b].
[9] Crystalline intrusive products are limited onPiton de la Fournaise and consist of gabbroic ordunitic cumulates. These cumulates are found asxenoliths in lavas [Upton and Wadsworth, 1972b]or in ashes from the 4.7 ka Bellecombe explosiveeruption [Mohamed-Abchir et al., 1998; Upton etal., 2000], and as larger bodies sampled by drillingin the Grand Brule slope [Rancon et al., 1988]. It isworth noting that on the more eroded Piton desNeiges, a kilometer-scale gabbro crops out in thecirque of Salazie [Upton and Wadsworth, 1972b;Chevallier and Vatin-Perignon, 1982].
Figure 1. (a) Map of 2005 picrite (basalt containing more than 20 volume % olivine) eruptions on Piton de laFournaise volcano, Reunion island (Indian Ocean). (b) Bulk-rock major element composition of 1998–2007 eruptiveproducts at Piton de la Fournaise, shown in MgO-CaO/Al2O3 space. SSB stands for steady state basalts, AbG forabnormal group basalts, and Diff. Lavas for bennmoreites and mugearites.
GeochemistryGeophysicsGeosystems G3G3
famin et al.: three differentiation stages at piton de la fournaise 10.1029/2008GC002015famin et al.: three differentiation stages at piton de la fournaise 10.1029/2008GC002015
3 of 18

[10] Whole rock compositions define two trends inbinary diagrams of MgO versus CaO/Al2O3 orcompatible versus incompatible major elements(Figure 1b), as observed on other ocean shieldvolcanoes [e.g., Rhodes, 1988]: The low MgO(<7 wt%) trend is controlled by differentiation ofthe SSB into bennmoreites and mugearites, con-sisting in the removal of 0–70% in volume of agabbroic cumulate composed of 20–40% plagio-clase, 50–70% clinopyroxene, and �10% olivine[Albarede et al., 1997]. The second higher MgO(>7 wt%) trend is due to variable olivine contentfrom SSB (�5%) to picrites (up to 50%). Usingmass balance calculation, early workers have inter-preted this trend to be caused by fractionation of5–10% of olivine (Fo84) from a parental magma at9–11 wt% MgO; 0.5–0.8 wt% K2O; 10–12 wt%CaO [Tilley et al., 1971; Ludden, 1978], yieldingSSB by depletion on one side and picrites byaccumulation on the other side [Clocchiatti et al.,1979]. This parental magma would itself be de-rived from a primitive magma with 15–17 wt%MgO; 0.4 wt% K2O; 8–9 wt% CaO issued frompartial melting of mantle peridotites [Fisk et al.,1988]. More recently, a xenocryst origin has beenproposed for the olivines [Albarede and Tamagnan,1988; Albarede et al., 1997] because crystals aredeformed and their Mg/Fe is in disequilibrium withthe groundmass (olivines precipitated from thegroundmass melt should have a Fo78–81 composi-tion, which is only observed on the rim of crystals).In this interpretation, the olivine trend would bedue to the incorporation of genetically unrelateddunites into the SSB during their ascent. The AbG,which lie outside of the two trends, have beeninterpreted to result from wehrlitic fractionation[Kornprobst et al., 1979].
[11] Recently, some minor variations in trace ele-ment concentrations and Pb isotopes have beenevidenced in SSB and picrites from the period1998–2006, indicating some contamination of themagmas by the oceanic crust [Vlastelic et al., 2005;Vlastelic et al., 2007].
3. Sample Description
[12] Samples were taken on 25 February 2005 and6 January 2006, 9 and 15 days after the beginningof the February and December eruptions, respec-tively. The samples were collected from the lavaflows at �1100�C (measured with a thermocoupledipped in the flows) and quenched in water.
[13] The samples display the typical petrographicfeatures of picrites erupted on the Piton de laFournaise, already described in previous studies[Clocchiatti et al., 1979; Albarede and Tamagnan,1988; Bureau et al., 1998a, 1998b]. They contain15–40 volume % of polyhedral olivine macrocrys-tals 0.5–5 mm in diameter, embedded in a ground-mass of plagioclase + clinopyroxene ± olivinemicrolithes and residual matrix glass.
[14] Olivine macrocrystals contain brown, spheri-cal, or ovoid melt inclusions 5–150 mm in diam-eter (Figure 2a), occurring alone or in randomclusters within the crystals. These features indicatethat the melt inclusions are primary in origin, i.e.,trapped during the crystallization of the host oliv-ine [Roedder, 1979]. Faure and Schiano [2005]have shown that such primary inclusions in poly-hedral macrocrystals are trapped in chemical equi-librium with their host olivine. The primary meltinclusions show no evidence for postentrapmentmodification such as leaking (i.e., loss of matter) ornecking down (i.e., change of shape) [Roedder,1984; Schiano et al., 2006]. These primary meltinclusions contain no visible daughter mineral butoccasionally show a shrinkage bubble devoid ofany detectable volatiles (see below). In addition,chromium spinels may be observed filling somemelt inclusions in variable proportion with the meltor as solid inclusions within the olivines(Figure 2a). These features confirm that spinelswere trapped as solid minerals and were notprecipitated from the melt inclusions after entrap-ment as true daughter minerals [Roedder, 1984].
[15] Olivine macrocrystals occasionally displayhealed cracks and undulose extinction in cross-polarized light, indicating intracrystalline deforma-tion. Healed cracks are microfractures filled withfluids (melt and/or volatiles) and sealed by recrys-tallization on the walls of the crack, leaving a planeof fluid inclusions. These inclusions are thereforesecondary in origin, i.e., trapped after the crystal-lization of the host olivine. The secondary inclu-sions are <5–100 mm in diameter and have anoblong or irregular shape (Figure 2b). These sec-ondary inclusions contain pure CO2 (i.e., gasinclusions) or a mixture of brown glass + CO2
gas ± spinel (i.e., melt inclusions) in variable gas/melt volume proportions. This indicates that themagma was multiphase and supersaturated in CO2
at the time of olivine deformation and entrapment.
[16] Embayments filled with brown glass are oc-casionally observed at the edges of olivine macro-crystals (Figure 2a). The matrix glass between
GeochemistryGeophysicsGeosystems G3G3
famin et al.: three differentiation stages at piton de la fournaise 10.1029/2008GC002015
4 of 18

microlithes is also brown and contains no visiblemicrocrystals under the microscope.
4. Analytical Methods
[17] Major element analyses of minerals and meltinclusions were carried out on polished thin sec-tions using an electron probe microanalyzer(EPMA) during two analytical sessions. The sameoperating conditions were used for olivine, spinel,and glass analyses. In the first session, 11 elementsanalyses were performed on a JEOL JXA-733(University of Osaka), tuned at 15 kV, 12 nA,
focused beam, 10 s counting times. The followingminerals and oxides were used as standards for theelements cited in brackets: albite (Na), orthoclase(K), Fe2O3 (Fe), MnO (Mn), quartz (Si), Al2O3
(Al), wollastonite (Ca), MgO (Mg), Cr2O3 (Cr),NiO (Ni), TiO2 (Ti). The focused beam allowed theanalysis of small (�15 mm) melt inclusions, withthe drawback of alkali loss [e.g., Morgan andLondon, 1996]. In the second session, 12 elementsanalyses were performed on a CAMECA SX100(Service Camparis, Paris VI University) tuned at15 kV, 10 nA, beam defocused at 10 mm, with a 5 scounting time for Na (measured first) and 10–20 scounting times for other elements. The CAMECAset of standards (synthetic and natural minerals oroxides) was used for calibration. In both sessions,the correction methods of Bence and Albee [1968]were used to convert the raw intensity data toweight percent oxides. Analytical uncertainty is1–2% for major elements, 5–15% for minor ele-ments, and 50–100% for trace elements (average1s analytical uncertainty over the two sessions inwt%: 0.58 on SiO2, 0.25 on Al2O3, 0.77 on FeOtot,0.32 on MgO, 0.24 on CaO; 0.29 on TiO2, 0.16Na2O, 0.11 on K2O, 0.05 on P2O5; 0.16 on MnO,0.09 on NiO, 0.08 on Cr2O3). Each composition ofminerals and melt inclusions was averaged fromfive measurements on nonoverlapping spots aftercheck of the homogeneity of the analyses. Formajor and minor elements, the 1s error on the fivemeasurements was within the analytical uncertain-ty, except for three melt inclusions that were is thiscase discarded. Replicate measurements on thesame repolished melt inclusions and host olivines(analyses OlE1bIF1 and OlE8IF1 in Table 1)during the two sessions also fell within analyticaluncertainty, except for P that was not measured andNa that was probably underestimated by �1 wt%in glasses with the JEOL JXA-733.
[18] After major element analysis, the sampleswere doubly polished to a final thickness of 30–100 mm in order to make the melt inclusions standout from their host olivine on both sides of the thinsection. Water and carbon concentration measure-ments were performed on a FTIR microspectrom-eter (JASCO MFT-2000, University of Osaka),equipped with a MCT detector and a Ge-coatedKBr beam splitter. Spectra were measured bycollecting 100 scans in the range 6000–700 cm�1
with a 4 cm�1 resolution, a 10 � 10 to 20 � 20 mmwindow aperture and a background air correction.Water and carbon concentrations were determinedfrom the absorbances (i.e., intensities) of the O–Hband at 3450 cm�1 and the CO3
2� bands at 1530
Figure 2. Optical microphotographs (plain light) ofolivine-hosted inclusions and matrix glasses in picritesfrom the 2005 eruptions at Piton de la Fournaise. (a)Several objects are shown on this picture: 1. sphericalprimary inclusion containing brown melt and ashrinkage bubble; 2. euhedral spinels trapped as solidinclusions (slightly out of focus); 3. spinel inclusionwith a rim of brown melt; 4. embayment containingspinels and brown melt; 5. brown matrix glass. (b) Planeof secondary inclusions containing CO2 ± melt ± spinelin variable gas/melt proportions.
GeochemistryGeophysicsGeosystems G3G3
famin et al.: three differentiation stages at piton de la fournaise 10.1029/2008GC002015
5 of 18

Table1
(Sample).MajorElementandVolatile
CompositionofPrimaryMeltInclusionsin
Olivines
From
PicriteEruptionsin
2005[ThefullTable1isavailable
intheHTMLversionofthisarticle]
REU050225JEOLJX
A-733
CAMECA
SX100
Inclusion
OlA2IF1OlB1IF1OlA3IF1OlD1IF1OlE5IF1OlE1IF1OlE4IF1OlD4IF1OlD1IF1OlC1IF1OlC4IF1OlE1bIF1OlE1bIF2OlE6IF1OlE6IF2OlE8IF1OlE8IF2
Diameter
(mm)
25
55
15
90
120
130
130
115
20
145
55
45
35
60
40
55
85
AnalyzedComposition(wt%
)SiO
250.14
51.38
49.15
51.27
50.39
51.24
51.44
51.99
50.99
50.75
50.47
49.94
49.88
50.53
50.94
49.70
49.27
TiO
23.01
2.83
3.11
2.87
3.09
2.58
2.70
2.66
2.29
2.89
2.75
2.84
3.18
2.76
3.12
2.79
2.72
Al 2O3
15.40
15.47
15.31
15.34
15.47
15.57
15.64
14.94
15.12
15.49
15.48
15.15
15.32
14.97
15.38
15.17
14.37
Cr 2O3a
0.04
0.05
0.05
0.05
0.04
0.03
0.05
0.07
0.06
0.06
0.09
0.02
0.62
0.05
0.00
0.04
0.03
FeO
tot
9.83
9.23
9.16
11.53
9.64
10.14
9.54
10.04
8.75
10.35
8.79
10.66
11.50
11.11
9.63
10.94
12.15
MnOa
0.20
0.19
0.13
0.17
0.20
0.21
0.15
0.20
0.19
0.15
0.17
0.18
0.18
0.22
0.05
0.19
0.11
MgO
4.91
5.25
5.08
5.13
5.27
4.28
5.62
5.40
4.82
5.46
4.80
5.64
5.48
5.61
4.72
5.81
6.22
NiO
a0.01
0.03
0.03
0.01
0.00
0.01
0.03
0.04
0.01
0.06
0.03
0.04
0.07
0.00
0.04
0.02
0.00
CaO
12.07
12.43
12.05
11.54
11.60
12.38
11.79
11.20
12.16
11.92
12.23
13.94
11.61
12.66
14.39
13.50
13.08
Na 2O
0.99
1.15
0.96
1.55
1.03
1.11
1.37
1.28
1.67
1.32
1.35
2.56
2.68
2.82
2.68
2.80
2.54
K2O
0.76
0.66
0.83
0.78
0.93
0.73
0.74
0.70
0.73
0.75
0.78
0.84
0.75
0.74
0.75
1.02
0.80
P2O5a
n.a.
n.a.
n.a.
n.a.
n.a.
n.a.
n.a.
n.a.
n.a.
n.a.
n.a.
0.42
0.32
0.32
0.77
0.27
0.32
H2Oa
0.51
0.26
n.a.
0.09
0.34
0.44
0.74
0.62
n.a.
0.77
0.51
0.36
n.a.
n.a.
n.a.
0.80
n.a.
CO2(ppm)a
66
39
n.a.
b.d.l.
41
b.d.l.
73
64
n.a.
88
40
27
n.a.
n.a.
n.a.
77
n.a.
Total(w
t%)
97.88
98.94
95.87
100.33
97.99
98.70
99.80
99.14
96.77
99.99
97.46
102.60
101.58
101.80
102.47
103.06
101.61
CompositionoftheHostOlivine
Cr 2O3a
0.07
0.04
0.08
0.06
0.06
0.05
0.12
0.00
0.03
0.01
0.05
0.00
0.00
0.00
0.00
0.01
0.01
NiO
a0.20
0.25
0.29
0.33
0.25
0.29
0.29
0.31
0.30
0.23
0.33
0.16
0.16
0.23
0.23
0.23
0.23
Fo(m
ol%
)b85.3
85.0
85.0
85.1
84.8
84.1
84.4
84.4
84.6
84.3
84.8
84.0
84.0
84.7
84.7
84.4
84.4
Ol/Sp/liq
Equilibrium
Mg#sp
c0.55
0.55
0.55
0.55
0.54
0.533
0.51
0.539
0.544
0.53
0.535
0.514
0.514
0.547
0.547
0.529
0.529
Fe2
+/Fe3
+sp
d1.96
1.94
1.94
1.95
1.92
1.86
1.81
1.89
1.91
1.88
1.92
1.85
1.85
1.92
1.92
1.89
1.89
aValues
inbold
arebelowthedetectionlimitofEPMAmeasurementsontraceelem
ents,whichis0.14wt%
onMnO,0.22wt%
onNiO
and0.15wt%
onCr 2O3in
averageover
thetwoanalyticalsessions.
Hereb.d.l.isconcentrationsbelow
thedetectionlimitoftheFTIR
technique(20ppm
forCO2and100ppm
forH2O)that
aretreatedas
zero
values
incomputations,andn.a.isnotanalyzed.
bForsterite
contentofthehostolivine=100�
[Mg]/[M
g+Fe2
+].
cMgnumber
ofspinel
inclusions=100�
[Mg]/[M
g+Fe2
+].
dMolarratioofdivalentover
trivalentironin
thespinel,calculatedusingtheSpincalc
Excelsheet[Barnes
andRoeder,2001].
eMolarratioofdivalentover
trivalentironin
themelt,computedusingthemethodofMaurelandMaurel[1982].
fUncorrectedMgnumber
ofmeltinclusions=100�
[Mg]/[M
g+Fe2
+].
gFractionofolivinecrystallizedontheinclusionwalls
afterentrapment,computedas
thequantity
ofhostolivine(atagiven
Fo)that
mustbeadded
tothemeltinclusionto
satisfytheconditionKD=
MgO=F
eOð
Þ melt
MgO=F
eOð
Þ Olivine=0.306[Fisket
al.,1988].See
Bureauet
al.[1998b]foracomplete
descriptionofthemethod.
hRecalculatedMgnumber
ofmeltinclusionsaftercorrectionforepitaxialcrystallizationofolivine=100�
[Mg]/[M
g+Fe2
+].
i CrystallizationtemperatureofthehostolivineusingtheHelzandThornber
[1987]geothermometer,based
ontheMgOcontentoftheliquid.ThethermometeriscalibratedonKilauea
lavas
thataresimilarin
majorandvolatile
elem
entcompositionsto
thepicritesofPitondela
Fournaise.
j Pressure
ofmeltinclusionentrapmentbased
onthepressure
andtemperature
dependence
ofH2O-CO2solubilityandestimated
usingtheVolatileCalcsoftware[New
manandLowenstern,2002].
GeochemistryGeophysicsGeosystems G3G3
famin et al.: three differentiation stages at piton de la fournaise 10.1029/2008GC002015
6 of 18

and 1430 cm�1, after linear baseline correction.The Beer-Lambert law was used to calculate theconcentrations from the absorbances:
C ¼ 100:A:M= e:r:dð Þ;
where C is the concentration (wt%), A is theabsorbance (dimensionless), M is the molar mass(g mol�1), e is the molar absorptivity (L mol�1
cm�1), r is the density of the glass (g cm�3),and d is the thickness of the melt inclusion (cm).The value of e was taken equal to 64 L mol�1
cm�1 for H2O and 398 L mol�1 cm�1 for CO32�
[Ihinger et al., 1994]. The value of d was takenequal to 2.8 g cm�3 in order to be consistentwith previous melt inclusion studies on Piton dela Fournaise [Bureau et al., 1998a; Bureau et al.,1998b; Bureau et al., 1999]. The value of d wasmeasured by Laser scanning confocal microscope(KEY-ENCE, Color Laser 3D Profile MicroscopeVK-8500 and VK 8510, University of Osaka)with a precision of ±1 mm. The uncertainty onconcentration estimates is of about 10%. Thedetection limit for H2O and CO2 is of 100 ppmand 20 ppm, respectively.
[19] Because an olivine rim may have crystallizedon the walls of melt inclusions after entrapment,the composition of primary melt inclusions wascorrected for possible epitaxial olivine crystalliza-tion using the olivine-spinel-melt chemical equilib-rium, a procedure outlined by Bureau et al.[1998b]. Results are therefore presented both be-fore and after correction. This procedure was notapplied to secondary melt inclusions because theassumption of melt-olivine chemical equilibrium isnot valid in their case.
[20] The composition and density of volatiles insecondary gas inclusions and in the bubble ofprimary and secondary melt inclusions were deter-mined using a Raman spectrometer (University ofOsaka), equipped with an optical microscope(Olympus BX60) and an Ar+ ion laser (514.5 nm,40 mW). A 1200 lines/mm was used. The Ramanshift was calibrated using a standard sample ofnaphthalene. The spectral resolution was 1.5 cm�1.The density of secondary gas inclusions was de-termined using the technique of Kawakami et al.[2003] based on the dependence of the CO2 Ramanspectrum on its density. The two Fermi diad bandsof CO2 (n+ at about 1388 and n – at 1285 cm�1)were fitted to a Lorentzian curve to determine theirpeak position (no smoothing was applied to thespectra prior to peak fitting). The density of the
CO2 in gas inclusions (g cm�3) was then computedusing the empirical relationship
d ¼ � 0:03238697D3 þ 10:08428D2 � 1046:189D
þ 36163:67
where D designates the Fermi resonance splittingbetween the upper and lower bands of CO2 (D =n+ � n�). The uncertainty on D and on thecoefficients of the empirical relationship propa-gates a 1s error on density estimates of about0.03 g cm�3 [Kawakami et al., 2003].
5. Results
[21] The composition of olivines, spinel inclusions,melt inclusions, and interstitial glasses is reportedin Tables 1, 2, and 3. Major element concentrationsin glasses are also plotted on Figure 3. Olivinesfrom the February 2005 eruption (Fo84–85.5, peakat Fo84.5) and from the December 2005 eruption(Fo82–84.5, peak at Fo84) are similar in compositionto those in previously erupted picrites from Pitonde la Fournaise [Clocchiatti et al., 1979; Albaredeand Tamagnan, 1988; Bureau et al., 1998a; Bureauet al., 1998b]. Chromium spinel inclusions fromthe February 2005 eruption (Mg # = 0.51 to 0.56)are enriched in Mg relative to those from theDecember 2005 eruption (Mg # = 0.48 to 0.54).The positive correlation between the Mg content ofspinel inclusions and the forsterite content of theirhost olivines indicate that they are in chemicalequilibrium (Table 1). Since primary melt inclu-sions are trapped together with spinels duringolivine crystallization, it is likely that primary meltinclusions are also in equilibrium with the hostolivines. This is supported by the polyhedral tex-ture of olivines that have been shown to trapequilibrium melt compositions [Faure andSchiano, 2005]. Primary melt inclusions of botheruptions show a transitional basaltic compositionat 8.4–11.1 wt% MgO, 0.40–1.08 wt% K2O, and9.8–13.6 wt% CaO, after correction of epitaxialolivine crystallization (8 to 14 mol%) on theinclusion walls (Table 1 and Figure 3). Secondarymelt inclusions display a more evolved and scat-tered composition at 3.3–6.9 wt% MgO, 0.15–1.42 wt% K2O, and 10.5–14.1 wt% CaO (Table 2and Figure 3). Note, however, that secondary meltinclusions might appear more evolved than theytruly are because epitaxial olivine crystallizationmight have occurred on their walls but cannot becorrected. No relationship between the size and thecomposition of melt inclusions is observed(Table 1). Interestingly, the composition of second-
GeochemistryGeophysicsGeosystems G3G3
famin et al.: three differentiation stages at piton de la fournaise 10.1029/2008GC002015
7 of 18

Figure 3. Major element composition of olivine-hosted melt inclusions from the February and December 2005eruptions. Diamond and squares are for the February 2005 and December 2005 eruptions, respectively. Emptysymbols represent primary melt inclusions prior to correction for epitaxial olivine crystallization. Blue symbols areused for primary melt inclusions after correction. Red symbols are for secondary melt inclusions (without correction),and yellow crossed symbols for matrix glasses. Pin points represent the bulk rock composition of Piton de laFournaise magmatic products [Upton and Wadsworth, 1965; Tilley et al., 1971; Upton and Wadsworth, 1972a;Ludden, 1978; Albarede and Tamagnan, 1988; Fisk et al., 1988; Rancon et al., 1988; Albarede et al., 1997;Mohamed-Abchir et al., 1998; Peltier et al., 2008].
GeochemistryGeophysicsGeosystems G3G3
famin et al.: three differentiation stages at piton de la fournaise 10.1029/2008GC002015
8 of 18

Table
2.
MajorElementandVolatile
Concentrationsin
SecondaryMeltInclusionsTrapped
inOlivines
From
the2005Picrite
Eruptions
Inclusion
OlA3IF5
OlA3bisIF3
OlE3IF1
OlE4IF2
OlE4IF3
OlD4IF6
OlD4IF4
OlD1IF5
OlC1IF2
OlC4IF5
OlC4IF3
OlC1IF4
OlE4IF4
OlC4IF2
OlC4IF4
Diameter
(mm)
40
20
85
80
45
35
60
15
70
60
50
80
45
65
60
SiO
250.99
51.23
50.61
46.59
51.22
50.74
51.59
51.46
50.20
51.59
49.43
TiO
23.13
3.22
2.45
5.82
2.58
3.46
2.57
2.68
2.31
2.71
3.38
Al 2O3
16.03
16.73
15.48
15.12
15.78
15.60
15.61
15.37
15.18
15.16
16.28
Cr 2O3a
0.03
0.05
0.05
0.10
0.07
0.04
0.02
0.03
0.05
0.03
0.06
FeO
tot
9.44
7.77
10.53
10.61
8.91
9.55
9.37
8.90
9.39
9.97
9.85
MnOa
0.17
0.14
0.18
0.15
0.20
0.17
0.14
0.14
0.18
0.22
0.09
MgO
5.45
3.60
4.98
5.13
4.63
5.13
4.63
5.22
5.09
5.46
4.96
NiO
a0.01
0.03
0.04
0.06
0.03
0.03
0.05
0.03
0.03
0.03
0.01
CaO
11.92
11.98
11.98
12.57
12.83
11.06
12.21
12.00
12.16
11.73
11.25
Na 2O
0.92
1.11
1.79
1.58
1.47
1.43
1.33
1.70
1.62
1.33
1.52
K2O
0.81
0.90
0.75
0.75
0.66
1.10
0.64
0.70
0.70
0.64
1.19
P2O5a
n.a.
n.a.
n.a.
n.a.
n.a.
n.a.
n.a.
n.a.
n.a.
n.a.
n.a.
H2Oa
n.a.
n.a.
0.05
0.12
0.23
0.07
0.21
n.a.
0.37
n.a.
0.03
0.21
0.03
0.07
0.10
CO2a(ppm)
n.a.
n.a.
b.d.l.
b.d.l.
45
b.d.l.
71
n.a.
b.d.l.
n.a.
b.d.l.
b.d.l.
b.d.l.
b.d.l.
53
Total(w
t%)
98.89
96.74
98.89
98.61
98.61
98.39
98.38
98.23
97.29
98.87
98.07
Cr 2O3a
0.08
0.08
0.01
0.12
0.12
0.00
0.00
0.06
0.01
0.05
0.05
0.01
0.12
0.05
0.05
NiO
a0.29
0.29
0.20
0.29
0.29
0.31
0.31
0.33
0.23
0.33
0.33
0.23
0.29
0.33
0.33
Fob(m
ol%
)85.0
84.9
85.4
84.4
84.4
84.4
84.4
84.6
84.3
84.8
84.8
84.3
84.4
84.8
84.8
Inclusion
OlB3IF2
OlB4IF1
OlB5IF3
OlB5IF2
OlB5IF1
OlB12IF2
OlB12IF3
OlC3IF3
OlC4IF2
OlC6IF1
OlC7IF1
OlD2IF1
OlD2IF2
OlD4IF1
OlD4IF2
OlB8IF3
Diameter
(mm)
60
35
50
50
55
90
70
50
40
60
80
35
45
70
85
60
SiO
247.39
49.74
49.19
48.42
50.38
48.48
48.80
54.89
48.89
49.16
49.22
49.36
49.46
47.99
47.98
TiO
24.39
2.73
3.99
3.69
2.96
3.04
3.45
2.40
2.68
3.05
2.80
3.02
3.28
2.82
2.59
Al 2O3
15.21
14.55
16.18
14.94
14.57
14.36
15.84
14.56
14.88
14.09
13.93
15.04
15.09
13.62
13.90
Cr 2O3a
0.03
0.03
0.06
0.04
0.03
0.05
0.01
0.02
0.08
0.07
0.12
0.09
0.07
0.11
0.12
FeO
tot
12.03
11.72
10.77
11.57
11.20
12.38
11.40
9.58
11.83
11.49
11.39
11.30
10.96
12.64
12.92
MnOa
0.15
0.25
0.18
0.17
0.14
0.19
0.26
0.13
0.22
0.09
0.14
0.22
0.20
0.23
0.22
MgO
4.67
5.88
3.27
4.51
6.00
6.00
4.49
4.80
4.86
6.03
6.61
4.46
3.87
6.89
6.03
NiO
a0.04
0.08
0.02
0.01
0.08
0.05
0.05
0.02
0.01
0.00
0.00
0.04
0.06
0.00
0.05
CaO
12.32
12.62
14.17
12.88
13.92
13.64
12.92
10.52
12.33
10.99
11.48
12.30
12.78
11.29
11.80
Na 2O
2.48
2.72
2.52
2.56
2.82
2.63
2.97
2.85
2.79
2.58
2.58
2.70
2.64
2.43
2.61
K2O
0.95
1.11
1.42
1.02
0.74
0.88
0.89
0.15
0.88
1.05
0.67
0.84
0.78
0.80
0.70
P2O5a
0.44
0.31
0.24
0.37
0.33
0.42
0.41
0.17
0.35
0.45
0.31
0.36
0.52
0.36
0.33
H2Oa
n.a.
n.a.
n.a.
n.a.
0.08
0.10
n.a.
n.a.
n.a.
0.41
0.30
n.a.
0.16
0.26
n.a.
0.72
CO2a(ppm)
n.a.
n.a.
n.a.
n.a.
b.d.l.
b.d.l.
n.a.
n.a.
n.a.
b.d.l.
b.d.l.
n.a.
b.d.l.
b.d.l.
n.a.
b.d.l.
Total(w
t%)
100.10
101.75
101.99
100.18
103.25
102.21
101.48
100.09
99.81
99.46
99.55
99.73
99.86
99.44
99.25
Cr 2O3a
0.00
0.00
0.00
0.00
0.00
0.01
0.01
0.04
0.07
0.05
0.00
0.00
0.00
0.05
0.05
0.00
NiO
a0.29
0.21
0.26
0.26
0.26
0.24
0.24
0.30
0.23
0.26
0.21
0.27
0.27
0.27
0.27
0.21
Fob(m
ol%
)84.1
83.8
84.0
84.0
84.0
83.1
83.1
83.5
83.1
84.1
84.0
84.4
84.4
83.0
83.0
83.6
aValues
inbold
arebelow
thedetectionlimitofEPMA
measurements(see
Table
1).Hereb.d.l.isconcentrationsbelow
thedetectionlimitoftheFTIR
techniqueandn.a.isnotanalyzed.
bForsterite
contentofthehostolivine=100�
[Mg]/[M
g+Fe2
+].
GeochemistryGeophysicsGeosystems G3G3
famin et al.: three differentiation stages at piton de la fournaise 10.1029/2008GC002015
9 of 18

ary melt inclusions is similar to the raw composi-tion of primary melt inclusions before epitaxialolivine correction. The most evolved melts arefound in matrix glasses and embayments at 4.0–5.1 wt% MgO, 0.86–1.13 wt% K2O, and 8.7–11.5wt% CaO (Table 3 and Figure 3).
[22] It has been shown that the major elementcomposition of melt inclusions may be modifiedafter entrapment by Fe-Mg exchange with the hostolivine [Danyushevsky et al., 2000; Gaetani andWatson, 2000; Gaetani and Watson, 2002;Danyushevsky et al., 2004]. The result is a signif-icant decrease in FeO and increase in MgO in thetrapped melt. However, the total iron content ofprimary and secondary melt inclusions withoutcorrection (8.8–13.4 wt% FeOtot) falls within thescatter of the whole rock FeOtot concentrations, andno evidence for Fe2+ loss is observed (Figure 3).
[23] H2O and CO2 concentrations in melts arelisted in Tables 1, 2, and 3 and reported on Figure4. The glass phase of primary melt inclusions fromthe February 2005 eruption contain 0.07–0.67wt% H2O and <20–80 ppm CO2, while that fromthe December 2005 primary melt inclusions con-tain 0.06–0.70 wt% H2O and <20–170 ppm CO2,after correction for epitaxial olivine crystallization.Neither water nor CO2 was detected by micro-Raman in the occasional shrinkage bubble ofprimary melt inclusions. Because the volume ofthis bubble is less than 5% of the volume of theinclusion, we assume that water and CO2 concen-trations measured in the glass phase are relevant ofthe melt composition at the time of inclusionentrapment. Secondary melt inclusions from theFebruary 2005 eruption contain 0.03–0.35 wt%H2O and <20–70 ppm CO2 while those from theDecember 2005 eruption contain 0.08–0.67 wt%H2O and no detectable CO2. Matrix glasses andembayments contain <0.01–0.08 wt% H2O and nodetectable CO2. As a general rule, the most waterrich melt inclusions are also the most CO2 rich.Primary melt inclusions contain more H2O andCO2 than secondary melt inclusions, which them-selves contain more volatiles than matrix andembayment glasses. Note also that primary andsecondary melt inclusions become less abundantwith increasing H2O and CO2 concentration.
[24] Results of micro-Raman spectroscopy arereported on Figure 5. Raman spectra indicate thatsecondary gas inclusions contain pure CO2 withoutany other detectable volatile compound. In the 28analyzed gas inclusions, the Fermi resonance split-ting between the two CO2 peaks ranges from 102
Table
3.
MajorElementCompositionofEmbayments
andInterstitial
Glass
inthePicritesFrom
theFebruaryandDecem
ber
2005Eruptions
Inclusion
Matrix62
Matrix63
Matrix64
Matrix65
Matrix66
Fracture67
Matrix83
Matrix84
Matrix85
Gl106
GL109
GL64/3
GL64/4
GL64/5
GL64/6
GL64/7
GL64/2
GL37/1
GL33/1
GL104
GL105
SiO
250.18
51.02
50.71
50.58
49.59
51.11
50.26
49.83
50.23
49.54
49.81
49.37
49.15
49.46
49.10
49.10
49.92
49.03
48.79
50.07
49.30
TiO
23.99
4.18
3.88
3.50
3.56
2.95
2.23
2.23
2.08
2.95
3.06
3.06
3.07
3.02
3.02
3.02
2.94
3.00
3.01
2.91
2.98
Al 2O3
13.68
13.74
13.56
13.15
12.05
13.07
13.50
13.01
12.95
13.71
13.59
14.02
13.53
13.81
13.62
13.80
14.29
13.67
13.51
14.19
13.68
Cr 2O3a
0.00
0.00
0.04
0.01
0.00
0.06
0.08
0.00
0.07
0.06
0.02
0.00
0.00
0.03
0.03
0.01
0.00
0.00
0.01
0.03
0.05
FeO
tot
13.82
13.05
13.97
15.96
17.01
11.78
10.95
11.00
10.52
11.27
11.12
11.68
11.86
12.01
11.12
11.93
11.34
11.54
11.17
11.10
11.46
MnOa
0.19
0.16
0.23
0.25
0.24
0.23
0.21
0.25
0.17
0.15
0.18
0.00
0.20
0.11
0.08
0.13
0.13
0.21
0.20
0.20
0.12
MgO
4.58
4.76
4.98
4.46
4.02
4.85
5.09
4.96
5.11
6.30
6.03
5.80
6.01
6.12
6.09
5.85
5.61
6.29
6.37
5.88
5.98
NiO
a0.00
0.03
0.00
0.00
0.00
0.08
0.00
0.00
0.02
0.02
0.00
0.00
0.00
0.09
0.00
0.00
0.00
0.20
0.17
0.00
0.00
CaO
9.56
9.66
9.79
8.84
8.75
11.49
11.26
11.13
11.23
11.37
11.18
10.62
11.06
11.04
11.21
11.45
10.60
11.21
11.03
11.38
10.83
Na 2O
1.21
1.26
1.24
1.62
2.43
1.45
1.82
1.89
1.76
2.69
2.79
2.78
2.62
2.66
2.66
2.66
2.76
2.87
2.56
2.74
2.69
K2O
1.10
1.06
1.03
1.13
1.07
0.94
0.94
0.86
0.91
0.78
0.79
0.88
0.85
0.68
0.80
0.83
0.96
0.74
0.86
0.80
0.84
P2O5a
n.a.
n.a.
n.a.
n.a.
n.a.
n.a.
n.a.
n.a.
n.a.
0.27
0.28
0.34
0.30
0.27
0.35
0.31
0.31
0.34
0.28
0.34
0.34
H2Oa
0.08
0.08
0.08
0.08
0.08
n.a.
n.a.
n.a.
n.a.
0.07
0.07
n.a.
n.a.
n.a.
n.a.
n.a.
n.a.
n.a.
n.a.
n.a.
n.a.
CO2a(ppm)
b.d.l.
b.d.l.
b.d.l.
b.d.l.
b.d.l.
n.a.
n.a.
n.a.
n.a.
b.d.l.
b.d.l.
n.a.
n.a.
n.a.
n.a.
n.a.
n.a.
n.a.
n.a.
n.a.
n.a.
Total(w
t%)
98.37
99.00
99.50
99.56
98.80
98.07
96.39
95.24
95.13
99.17
98.92
98.61
98.71
99.36
98.14
99.15
98.93
99.19
98.02
99.69
98.34
aValues
inbold
arebelow
thedetectionlimitofEPMA
measurements(see
Table
1).Hereb.d.l.isconcentrationsbelow
thedetectionlimitoftheFTIR
techniqueandn.a.isnotanalyzed.
GeochemistryGeophysicsGeosystems G3G3
famin et al.: three differentiation stages at piton de la fournaise 10.1029/2008GC002015
10 of 18

to 103.2 cm�1, or a CO2 density of 0 to 0.29 gcm�3. Note also that the abundance of gas inclu-sions decreases with increasing CO2 density.
6. Discussion
6.1. Depth of Olivine Crystallizationin Picrites
[25] Because water and carbon saturation in silicatemelts is pressure and temperature dependent, thedepth of entrapment of melt inclusions may beestimated from their H2O and CO2 concentration.Using the VolatileCalc software [Newman andLowenstern, 2002] and temperatures given by theHelz and Thornber [1987] thermometer, primarymelt inclusions from the two 2005 picrite eruptionsare estimated to crystallize in a similar range ofdepths from �0 to 1600 m (Figures 5 and 6). Withthe same approach, secondary melt inclusions areestimated to be entrapped at a maximum of 600 mdepth (the depth of entrapment of secondary meltinclusions may be overestimated because of uncor-rected olivine epitaxial crystallization). Note thatfor both primary and secondary melt inclusions, theabundance of data decreases with increasing depth.
[26] The depth of entrapment of secondary CO2 gasinclusions may also be estimated from the density ofCO2, assuming a 2.8 g cm�3 magma density and a1200�C ambient temperature (the uncertainty ontemperature yields only minor error on pressureestimates of CO2). Consequently, Raman data yielda depth range of 0 to 2200 m for the entrapment ofsecondary gas inclusions, with one datum at 2600 mdepth (Figure 6). Gas inclusions appear to yieldslightly greater depths than melt inclusions. Note,however, that the uncertainty of depth estimatesfrom both techniques is about 500 m. In the caseof gas inclusions also, the abundance of measure-ment decreases with increasing depth.
[27] Overall, the two independent data sets bothsuggest that the growth of olivines in picrites andtheir transport proceeds at a very shallow depth,limited to a zone shallower than 2600 m below thesurface. Our estimate is consistent with the depthof picrite olivine crystallization proposed byBureau et al. [1998b] and also consistent withthe depth of picrite dykes modeled from grounddeformation [Peltier et al., 2008]. Olivine enrich-ment in picrites is a shallow process; hence MgOincrease in bulk rock should not be taken as anevidence for reservoir recharge by deep magmassuch as proposed by Vlastelic et al. [2007]. Inaddition, the decreasing frequency of data withincreasing depth indicates that olivines crystallizedat shallow level are more abundant in the eruptiveproducts than deeper ones (Figure 6). It is possiblethat the frequency of data might represent a bias inthe incorporation of olivines into the erupted lavas.Another possibility is that the frequency of datarepresents true abundances in the magma reservoir.In this case, the picrites would collect more oli-vines crystallized from the (cooler) top of the
Figure 4. H2O versus CO2 concentration in olivine-hosted melt inclusions from the February and December2005 eruptions. Diamonds represent February 2005eruption. Squares represent December 2005 eruption.Empty symbols are used for primary melt inclusionswithout correction, blue symbols for primary meltinclusions after correction for epitaxial olivine crystal-lization, red symbols for secondary melt inclusions(without correction), and yellow crossed symbols formatrix glasses.
Figure 5. Density of CO2-bearing secondary gasinclusions in olivines from the February 2005 eruption.Data are represented as a function of the Fermiresonance splitting (shown by D) between the twoRaman peaks of CO2 and also as a frequency histogram.
GeochemistryGeophysicsGeosystems G3G3
famin et al.: three differentiation stages at piton de la fournaise 10.1029/2008GC002015
11 of 18

reservoir than from the lower parts. This would beconsistent with the interpretation that picrites comefrom a chemically stratified reservoir [Vlastelic etal., 2005], depleted in Mg at the top by olivinefractionation and proportionally enriched at thebase by accumulation.
6.2. Source of Picritesand Steady State Basalts
[28] In Figure 7, the composition of melt inclusionsfrom the two 2005 picrite eruptions is comparedwith whole rock data on Piton de la Fournaise.Primary melt inclusions from this study show thatthe most frequently entrapped melts during olivinegrowth have the composition of the parentalmagma (9–11 wt% MgO, 0.5–0.8 wt% K2O,and 10–12 wt% CaO) proposed by Ludden[1978]. Fo83–85 olivines from picrite lavas are inequilibrium with primary melt inclusions (Table 1)and therefore with this parental magma. On theother hand, primary melt inclusions after epitaxialolivine crystallization (i.e., without compositioncorrection) and secondary melt inclusions lie inthe range of more differentiated SSB (Figures 3and 7), and would be in equilibrium with Fo78–81olivines such as found on the rims of Fo83–85macrocrystals. Consequently, the composition ofSSB and rimmed macrocrystals may be entirelyexplained by the fractional crystallization of 8–14 mol% of picrite olivines (Fo83–85) from theparental magma. Fo83–85 olivines in picrites are
phenocrysts as proposed by Clocchiatti et al.[1979] and not xenocrysts derived from the disag-gregation of earlier cumulates and incorporatedinto SSB, as interpreted later [Albarede and Tama-gnan, 1988; Albarede et al., 1997]. We thereforeconcur with the interpretation that SSB and picritesmay evolve from a common magma storage zone(or a complex of connected storage zones) simplyby fractional crystallization of Fo83–85 olivines[Tilley et al., 1971; Ludden, 1978; Clocchiatti etal., 1979; Kornprobst et al., 1979]. Olivine rims atFo78–81 are in equilibrium with SSB and thereforedevelop in the differentiated liquid after most of thecrystal fractionation. The fact that all the fluidinclusions (primary and secondary, melt or gas)are trapped at a similar shallow depth range(Figure 6), and that secondary melt inclusions havean SSB composition (Figure 7), suggests that picriteolivines grow, travel, and are deformed within asingle storage system. This reservoir has the bulkcomposition of the parental magma [Tilley et al.,1971; Ludden, 1978], but is vertically stratified(between recharge periods) due to fractional crystal-lization, with a top of SSB composition at a fewhundreds meter depth and a bottom of picrite com-position at a maximum depth of 2600 m.
6.3. Three Differentiation Historiesof a Single Magma
[29] Previously published melt inclusion and ma-trix glass data have been compiled in Figure 7.Overall, three trends may be observed instead oftwo:
[30] 1. A first trend (Line 1) is defined by primarymelt inclusions (i.e., the parental magma), AbGwhole rocks and secondary inclusions trapped inolivines from AbG eruptions (Figures 7a and 7b).In the light of Line 1, AbG may be explained as anevolution of the parental magma by crystal frac-tionation of a cumulate composed of 20–40 vol%plagioclase, 50–70% clinopyroxene, and �10%olivine. No gabbroic cumulates of such composi-tion have been found on Piton de la Fournaise. Onthe more eroded Piton des Neiges (Figure 1),however, the composition of the Salazie gabbrobody falls on the trend (Figures 7a and 7b). Sincerock chemistry is quite similar at both volcanoes, agabbro such as found on Piton des Neiges mayrepresent the cumulative counterpart of AbG dif-ferentiation (Figures 7c and 8). According to thedeep origin of abnormal eruptions [Bureau et al.,1998b; Battaglia et al., 2005a], gabbro accumula-tion should proceed in a reservoir located at depth
Figure 6. Depth of melt and gas inclusion entrapmentin olivines from the February and December 2005eruptions, estimated using two different types of data:(1) H2O–CO2 concentrations in the melt inclusionsassuming vapor saturation (blue histogram for February2005 primary melt inclusions, dotted blue histogram forDecember 2005 primary melt inclusions, red histogramfor secondary melt inclusions); (2) CO2 density ofsecondary gas inclusions assuming a 1200�C tempera-ture of entrapment (yellow histogram).
GeochemistryGeophysicsGeosystems G3G3
famin et al.: three differentiation stages at piton de la fournaise 10.1029/2008GC002015
12 of 18

greater than 7.5 km (Figure 8). Differentiatedsecondary melt inclusions are likely trapped alongLine 1 after the fractionation of plagioclase +clinopyroxene ± olivine.
[31] 2. The second trend (Line 2) is defined byprimary melt inclusions, by secondary melt inclu-
sions from the two 2005 picrite eruptions and bymost of the whole rock data on Piton de la Four-naise (Figures 7a and 7b). As discussed above,Line 2 is the result of both fractionation andaccumulation of Fo83–85 olivines, yielding SSBon the low MgO side of Ludden’s [1978] parental
Figure 7. (a–b) Compilation of K2O and CaO concentrations versus MgO in magmas from Piton de la Fournaisevolcano. Pin points represent published whole rock data [Upton and Wadsworth, 1965; Tilley et al., 1971; Upton andWadsworth, 1972a; Ludden, 1978; Albarede and Tamagnan, 1988; Fisk et al., 1988; Rancon et al., 1988; Albarede etal., 1997; Mohamed-Abchir et al., 1998; Peltier et al., 2008]. Black squares represent the whole rock composition ofgabbros from Piton de la Fournaise and Piton des Neiges [Upton and Wadsworth, 1972b; Rancon et al., 1988; Uptonet al., 2000]. Blue symbols represent primary melt inclusions, red symbols represent secondary melt inclusions, andyellow symbols represent embayments and matrix glasses. Diamonds and squares represent melt data from theFebruary and December 2005 eruptions, respectively. Circles are used for previously published melt inclusion andinterstitial glass data. In this literature data set, primary and secondary melt inclusions were analyzed in picrite andAbG eruptions [Bureau et al., 1998a; Bureau et al., 1998b; Bureau et al., 1999]; interstitial glasses were analyzed inthe AbG eruption of Hudson 1998 [Villeneuve, 2000]. The empty box is the parental magma suggested by [Tilley etal., 1971; Ludden, 1978]. Solid lines represent numerical simulations of fractional crystallization from the parentalmagma based on the MELTS software [Ghiorso and Sack, 1995; Asimow and Ghiorso, 1998]. Input parameters andresults are given in Table 4. (c) Interpretative sketch of differentiation sequence at Piton de la Fournaise volcano. Line1 is explained by plagioclase + clinopyroxene fractionation/accumulation of parental magmas (in blue), yielding‘‘abnormal magmas’’ (in yellow) and possibly gabbros (in black) of the Piton des Neiges type. Line 2 is explained byolivine fractionation/accumulation of parental magmas, yielding picrites (in green) and steady state basalts (in red).Line 3 is explained by plagioclase + clinopyroxene fractionation/accumulation of steady state basalts, yieldingdifferentiated magmas (in yellow) and gabbroic cumulates (in black) of the Piton de la Fournaise type.
GeochemistryGeophysicsGeosystems G3G3
famin et al.: three differentiation stages at piton de la fournaise 10.1029/2008GC002015
13 of 18
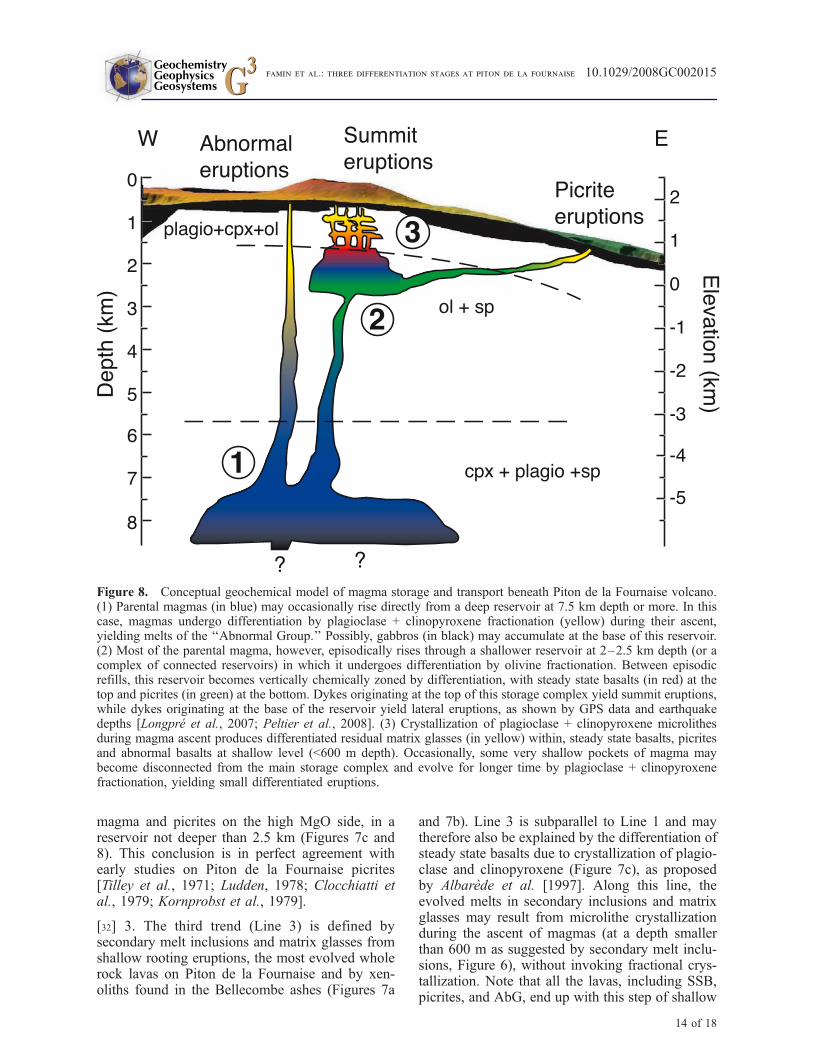
magma and picrites on the high MgO side, in areservoir not deeper than 2.5 km (Figures 7c and8). This conclusion is in perfect agreement withearly studies on Piton de la Fournaise picrites[Tilley et al., 1971; Ludden, 1978; Clocchiatti etal., 1979; Kornprobst et al., 1979].
[32] 3. The third trend (Line 3) is defined bysecondary melt inclusions and matrix glasses fromshallow rooting eruptions, the most evolved wholerock lavas on Piton de la Fournaise and by xen-oliths found in the Bellecombe ashes (Figures 7a
and 7b). Line 3 is subparallel to Line 1 and maytherefore also be explained by the differentiation ofsteady state basalts due to crystallization of plagio-clase and clinopyroxene (Figure 7c), as proposedby Albarede et al. [1997]. Along this line, theevolved melts in secondary inclusions and matrixglasses may result from microlithe crystallizationduring the ascent of magmas (at a depth smallerthan 600 m as suggested by secondary melt inclu-sions, Figure 6), without invoking fractional crys-tallization. Note that all the lavas, including SSB,picrites, and AbG, end up with this step of shallow
Figure 8. Conceptual geochemical model of magma storage and transport beneath Piton de la Fournaise volcano.(1) Parental magmas (in blue) may occasionally rise directly from a deep reservoir at 7.5 km depth or more. In thiscase, magmas undergo differentiation by plagioclase + clinopyroxene fractionation (yellow) during their ascent,yielding melts of the ‘‘Abnormal Group.’’ Possibly, gabbros (in black) may accumulate at the base of this reservoir.(2) Most of the parental magma, however, episodically rises through a shallower reservoir at 2–2.5 km depth (or acomplex of connected reservoirs) in which it undergoes differentiation by olivine fractionation. Between episodicrefills, this reservoir becomes vertically chemically zoned by differentiation, with steady state basalts (in red) at thetop and picrites (in green) at the bottom. Dykes originating at the top of this storage complex yield summit eruptions,while dykes originating at the base of the reservoir yield lateral eruptions, as shown by GPS data and earthquakedepths [Longpre et al., 2007; Peltier et al., 2008]. (3) Crystallization of plagioclase + clinopyroxene microlithesduring magma ascent produces differentiated residual matrix glasses (in yellow) within, steady state basalts, picritesand abnormal basalts at shallow level (<600 m depth). Occasionally, some very shallow pockets of magma maybecome disconnected from the main storage complex and evolve for longer time by plagioclase + clinopyroxenefractionation, yielding small differentiated eruptions.
GeochemistryGeophysicsGeosystems G3G3
famin et al.: three differentiation stages at piton de la fournaise 10.1029/2008GC002015
14 of 18

differentiation. Whole rock data suggest, however,that cooling dykes or small subsurface pockets ofmagma may occasionally become disconnectedfrom the main storage complex and yield fraction-ation of an assemblage composed of 20–40%plagioclase, 50–70% clinopyroxene, and �10%olivine, and small volumes of more differentiatedmagmas (Figure 8). The cumulative counterpart ofthis differentiation may correspond to the gabbroxenoliths found in the Bellecombe ashes.
[33] The change from one differentiation line to thenext is likely pressure, temperature and composi-tionally dependent, yet experimental data are tooscarce for quantitative phase diagrams to be estab-lished. Using published experimental data on SSB[Green and Ringwood, 1967; Fisk et al., 1988],Albarede et al. [1997] have placed the crossoverbetween clinopyroxene-dominant and olivine-dominant crystallization at 0.9 ± 0.2 GPa [Albaredeet al., 1997, Figure 21]. However, since the parentalmagma affected by the first clinopyroxene + plagio-clase fractionation (Line 1) is more primitive thanthe starting magma used in their experimental work,the clinopyroxene-olivine crossover is very likelymuch shallower than 0.9 ± 0.2 GPa (30 km). Indeedusing the MELTS software [Ghiorso and Sack,1995; Asimow and Ghiorso, 1998], simulations offractional crystallization from the parental magmaabove 300 MPa yield an assemblage 69–92 vol%
clinopyroxene + 7–20% feldspar + 1–16% spinel(Table 4). This assemblage is consistent with theaverage mineral composition of the Salazie gabbro[Upton and Wadsworth, 1972b]. It is only from280 MPa (10 km) and below that olivine becomes asignificant (i.e., >5 vol%) phase in the solid. InMgO-CaO space (Figure 7a), Line 1 is bestsimulated by liquid lines of descents in the range200–500 MPa, with the oxygen fugacity set at thequartz-fayalite-magnetite buffer (QFM) + 3 in logunit. These simulations also fit well SiO2, TiO2,MnO, Na2O, and P2O5 data but do not fit FeO,Fe2O3, Al2O3, and K2O data (Figure 7b). The misfitof FeO and Fe2O3 may be caused by a decrease ofthe redox state at shallow level. Note that for therange of liquid compositions considered here (44–49 wt% SiO2; 6–10 wt% MgO), the few experi-mental basaltic liquids available in the calibrationdatabase of MELTS at 200–500 MPa are muchmore aluminous (i.e., 17.29–20.06 wt% Al2O3)than our parental magma (at 13.5 wt% Al2O3).Therefore, a possible cause of the Al2O3 and K2Omisfit is that feldspar crystallizes earlier than pre-dicted by MELTS because the software calibratedon Al2O3-rich basaltic liquids underestimates thetemperature at which feldspar crystallization beginsin Al2O3-depleted liquids.
[34] For all the major elements, Line 2 and Line 3are best fitted by MELTS simulations in the range
Table 4. Numerical Simulations of Fractional Crystallization Using the MELTS Softwarea
Pressureb
(MPa)log fO2
BuffercVolume % of Solid
Crystallized at 1050�CMineral Composition of the Solid (vol%)
in Order of Crystallizationd
500 QFM+3 52.1 75 cpx + 13 sp + 12 fs300 QFM+3 48.47 69 cpx + 16 sp + 15 fs200 QFM+3 45.99 66 cpx + 18 sp +16 fs100 QFM+3 43.16 61 cpx + 20 sp + 17 fs + 2 ol75 QFM+3 42.61 3 ol + 60 cpx + 20 sp + 17 fs50 QFM+3 45.94 3 ol + 59 cpx + 21 sp + 17 fs25 QFM+3 40.99 (+19 % H2O) 3 ol + 49 cpx + 18 sp + 30 fs0.1 QFM+3 0.44 (+99.4 % H2O) 1 ol + 41 cpx + 48 fs + 10 sp500 QFM 57.61 92 cpx + 1 sp + 7 fs300 QFM 54.16 4 ol + 72 cpx + 4 sp + 20 fs200 QFM 50.79 12 ol + 60 cpx + 6 sp + 22 fs100 QFM 47.41 18 ol + 50 cpx + 25 fs + 7 sp75 QFM 46.69 19 ol + 49 cpx + 25 fs + 7 sp50 QFM 45.94 20 ol + 48 cpx + 25 fs + 7 sp25 QFM 45.27 (+25 % H2O) 16 ol + 38 cpx + 39 fs + 7 sp0.1 QFM 0.5 (+99.46 % H2O) 6 ol + 50 fs + 38 cpx + 6 sp
aFrom Ghiorso and Sack [1995] and Asimow and Ghiorso [1998].
bAll the runs were performed with a temperature decrease from 1300 to 1050�C. Orthopyroxene was excluded of the possible crystallizing
phases because it is not observed in volcanic rocks of Reunion Island. The composition of the initial liquid undergoing fractional crystallization wasadapted from Ludden’s [1978] parental magma, with a volatile concentration taken equal to the maximum concentration found in Piton de laFournaise melt inclusions [Bureau et al., 1998b, 1999]: 47.7 wt% SiO2; 2.7 wt% TiO2; 13.25 wt% Al2O3; 1.6 wt% Fe2O3; 10.1 wt% FeO; 0.17 wt%MnO; 9.5 wt% MgO; 0.05 wt% NiO; 10.5 wt% CaO; 2.45 wt% Na2O; 0.67 wt% K2O; 0.3 wt% P2O5; 1 wt% H2O; 0.1 wt% CO2.
cOxygen fugacity was set at two buffers: Quartz–Fayalite–Magnetite (QFM) and QFM+3 (in log unit).
dAbbreviations: olivine (ol); clinopyroxene (cpx); spinel (sp); feldspar (fs).
GeochemistryGeophysicsGeosystems G3G3
famin et al.: three differentiation stages at piton de la fournaise 10.1029/2008GC002015
15 of 18

0.1–100 MPa with the oxygen fugacity set at theQFM buffer (Figures 7a and 7b). The maximumvolume of olivine crystallization (18–19 vol%,Table 4) is obtained at 50–100 MPa (1.8 –3.5 km), in good consistency with our depthestimate of Line 2 differentiation. Below 25 MPa(0.9 km), the dominant crystallizing phases arefeldspar (39 – 50 vol%) and clinopyroxene(39 vol%), in consistency with Line 3 (Table 4)and with the mineral composition of the gabbroicxenoliths within the Bellecombe ashes [Upton et al.,2000]. The results of MELTS simulations are there-fore in general agreement with our interpretation ofsuperimposed differentiation lines. The successionof differentiation mechanisms and liquid majorelements composition is mostly controlled by thedepth of the magma storage zones.
[35] An essential implication of our findings is thatcompositional heterogeneities at Piton de la Four-naise may all stem from superimposed differentia-tion stages of a single homogeneous parentalmagma. The incorporation of olivine xenocrystsand/or other xenoliths does not likely account formajor element variations in lavas. The crustalassimilation evidenced by isotopes and trace ele-ments [Vlastelic et al., 2005; Vlastelic et al., 2007]probably involves small volumes of wall rock thatdo not affect the chemical diversity of Piton de laFournaise products and hence cannot be resolvedusing our major element data.
[36] The recognition of three differentiation zonesis in general agreement with geophysical andseismological studies that proposed the existenceof three main reservoirs beneath Piton de la Four-naise; a shallow complex of sills and dykes at a fewhundreds meter beneath the summit [Lenat andBachelery, 1990]; a reservoir at 2–2.5 km depthfrom which SSB and picrite dykes root [Peltier etal., 2008]; and the starting point of earthquakeswarms at 7.5 km depth suggesting deeper magmastransfers [Battaglia et al., 2005a]. Magma ascentbeing driven by the lower density of the liquid thanthe wall rock, storage zones probably representhalts of the magma at levels of neutral buoyancyin the crust and upper mantle [Lister and Kerr,1991]. Beneath Hawaii and Canary islands, Ryan[1988] and Hansteen et al. [1998] have proposedthat magmas accumulate at two levels of neutralbuoyancy, a deep level at 6–10 km depth and ashallower level at 2–4 km. Our study suggests thatthe two deepest of the three storage zonesevidenced at Piton de la Fournaise also lie withinthe same depth ranges (Figure 8). Because Piton
des Neiges and Mauritius volcanic products aresimilar in major element composition to those ofPiton de la Fournaise [Upton and Wadsworth,1972a; Debajyoti et al., 2007], it is very likely thata similar superposition of differentiation lines oc-curred at the same depths (above 7.5 km, below2.5 km and at the subsurface) during the pastactivity of these two extinct volcanoes. This rein-forces the idea that the depth of storage zones is aconstant parameter in OIB dynamics and that twolevels of neutral buoyancy are reached beneathshield volcanoes. The deeper level would be con-trolled by the density of the upper oceanic crust,and the shallower level would be controlled by thedensity of the volcanic edifice.
7. Conclusion
[37] Our major element and volatile analyses ofmelt and gas inclusions from recent picrite erup-tions, together with data from the literature, pro-vide new constraints on OIB dynamics at LaReunion hot spot. Three depth-dependent magmat-ic differentiation stages of a single transitionalparental magma (9–11 wt% MgO and 0.5–0.8 wt% K2O) may account for the entire rangeof major element compositions in products fromthe Piton de la Fournaise volcano. The deepestdifferentiation (>7.5 km) consists in the fractionalcrystallization of clinopyroxene + plagioclase,explaining occurrences of ‘‘abnormal eruptions’’and gabbros throughout the island. The most abun-dant volcanic products are formed at shallowerdepth (<2.5 km), by olivine-controlled differentia-tion of the transitional parental magma. Olivinefractional crystallization yields a vertical chemicalstratification of the magma storage zone, withdifferentiated basalts at the top and picrites at thebase of the reservoir. Differentiated basalts maythemselves evolve beneath the surface (<0.6 km)into more differentiated melts by clinopyroxene +plagioclase fractionation. This superposition ofthree differentiation processes is consistent withthe existence of three magmatic systems interpretedfrom geophysical studies. Unlike previous studies,we suggest that magma mixing or incorporation ofdunite xenoliths are not necessary to explain themajor element chemical diversity of Piton de laFournaise rocks. Because the major element com-position of Piton de la Fournaise products isrepresentative of other OIBs in the Indian Ocean,successive differentiation stages of a single homo-geneous magma at >7.5 km,<2.5 km, and under-neath the surface might be the rule rather than the
GeochemistryGeophysicsGeosystems G3G3
famin et al.: three differentiation stages at piton de la fournaise 10.1029/2008GC002015
16 of 18

exception. Our study shows that combining wholerock, melt inclusion, gas inclusion and matrix glassdata is critical to constrain the full range of magmadifferentiation processes. Taken separately, eachdata set only yields an incomplete history, whereastaken together, they provide a more robust frame-work for interpreting the complete evolution of avolcanic edifice.
Acknowledgments
[38] We thank Glenn Gaetani, Stephanie Ingle, and an anon-
ymous reviewer for greatly improving the quality of the
manuscript. This work was supported by grants from the
Conseil Regional de la Reunion. This is IPGP contribution
2423.
References
Albarede, F., and V. Tamagnan (1988), Modelling the recentgeochemical evolution of the Piton de la Fournaise volcano,Reunion Island, J. Petrol., 29, 997–1030.
Albarede, F., B. Luais, G. Fitton, M. P. Semet, E. Kaminski,B. G. J. Upton, P. Bachelery, and J. L. Cheminee (1997), Thegeochemical regimes of Piton de la Fournaise Volcano(Reunion) during the last 530,000 years, J. Petrol., 38,171–201, doi:10.1093/petrology/38.2.171.
Asimow, P. D., and M. S. Ghiorso (1998), Algorithmicmodifications extending MELTS to calculate subsolidusphase relations, Am. Mineral., 83, 1127–1131.
Barnes, S. J., and P. L. Roeder (2001), The range of spinel com-positions in terrestrial mafic and ultramafic rocks, J. Petrol., 42,2279–2302, doi:10.1093/petrology/42.12.2279.
Battaglia, J., K. Aki, and V. Ferrazzini (2005a), Location oftremor source and estimation of lava output using tremorsource amplitude on the Piton de La Fournaise volcano: 1.Location of tremor sources, J. Volcanol. Geotherm. Res.,147(3–4), 268–290, doi:10.1016/j.jvolgeores.2005.04.005.
Battaglia, J., V. Ferrazzini, T. H. Staudacher, K. Aki, and J. L.Cheminee (2005b), Pre-eruptivemigration of earthquakes at thePitonde laFournaisevolcano (Reunion Island),Geophys. J. Int.,161, 549–558, doi:10.1111/j.1365-246X.2005.02606.x.
Bence, A. E., and A. L. Albee (1968), Empirical correctionfactors for the electron microanalysis of silicates and oxides,J. Geol., 76, 382–403.
Bosch, D., J. Blichert-Toft, F. Moynier, B. K. Nelson,P. Telouk, P.-Y. Gillot, and F. AlbarEde (2008), Pb, Hf and Ndisotope compositions of the two Reunion volcanoes (IndianOcean): A tale of two small-scale mantle ‘‘blobs’’?, EarthPlanet. Sci. Lett., 265(3 – 4), 748–768, doi:10.1016/j.epsl.2007.11.018.
Bureau, H., N. Metrich, F. Pineau, and M. P. Semet (1998a),Magma-conduit interaction at Piton de la Fournaisevolcano (Reunion Island): A melt and fluid inclusion study,J. Volcanol. Geotherm. Res., 84, 39–60, doi:10.1016/S0377-0273(98)00029-8.
Bureau, H., F. Pineau, N. Metrich, M. P. Semet, and M. Javoy(1998b), A melt and fluid inclusion study of the gas phase atPiton de la Fournaise volcano (Reunion Island), Chem.Geol. , 147(1 – 2), 115 – 130, doi:10.1016/S0009-2541(97)00176-9.
Bureau, H., N. Metrich, M. P. Semet, and T. Staudacher(1999), Fluid-magma decoupling in a hot-spot volcano, Geo-
phys. Res. Lett., 26(23), 3501 – 3504, doi:10.1029/1999GL005422.
Chen, C.-Y., and F. A. Frey (1983), Origin of Hawaiian tho-leiite and alkalic basalt, Nature, 302, 785–789, doi:10.1038/302785a0.
Chevallier, L., and N. Vatin-Perignon (1982), Volcano-struc-tural evolution of Piton des Neiges, Reunion Island, IndianOcean, Bull. Volcanol., 45(4), 285–298, doi:10.1007/BF02597253.
Clocchiatti, R., A. Havette, and P. Nativel (1979), Relationspetrogenetiques entre les basaltes transitionnels et les ocea-nites du Piton de la Fournaise (ıle de la Reunion, OceanIndien) a partir de la composition chimique des inclusionsvitreuses des olivines et des spinelles, Bull. Mineral., 102,511–525.
Danyushevsky, L. V., F. N. Della-Pasqua, and S. Sokolov(2000), Re-equilibration of melt inclusions trapped by mag-nesian olivine phenocrysts from subduction-related magmas:Petrological implications, Contrib. Mineral. Petrol., 138,68–83, doi:10.1007/PL00007664.
Danyushevsky, L. V., R. A. J. Leslie, A. J. Crawford, andP. Durance (2004), Melt inclusions in primitive olivinephenocrysts: The role of localized reaction processes in theorigin of anomalous compositions, J. Petrol., 45, 2531–2553,doi:10.1093/petrology/egh080.
Debajyoti, P., V. S. Kamenetsky, A. W. Hofmann, andA. Stracke (2007), Compositional diversity among primitivelavas of Mauritius, Indian Ocean: Implications for mantlesources, J. Volcanol. Geotherm. Res., 164, 76 – 94,doi:10.1016/j.jvolgeores.2007.04.004.
Faure, F., and P. Schiano (2005), Experimental investigation ofequilibration conditions during forsterite growth and meltinclusion formation, Earth Planet. Sci. Lett., 236(3–4),882–898, doi:10.1016/j.epsl.2005.04.050.
Fisk, M. R., B. G. J. Upton, C. E. Ford, and W. M. White(1988), Geochemical and experimental study of the genesisof magmas of Reunion Island, Indian Ocean, J. Geophys.Res., 93(B5), 4933–4950, doi:10.1029/JB093iB05p04933.
Gaetani, G. A., and E. B. Watson (2000), Open system behaviorof olivine-hosted melt inclusions, Earth Planet. Sci. Lett.,183(1–2), 27–41, doi:10.1016/S0012-821X(00)00260-0.
Gaetani, G. A., and E. B. Watson (2002), Modeling the major-element evolution of olivine-hosted melt inclusions, Chem.Geol., 183, 25–41, doi:10.1016/S0009-2541(01)00370-9.
Ghiorso, M. S., and R. O. Sack (1995), Chemical mass transferin magmatic processes. IV. A revised and internallyconsistent thermodynamic model for the interpolation andextrapolation of liquid-solid equilibria in magmatic systemsat elevated temperatures and pressures, Contrib. Mineral.Petrol., 119, 197–212, doi:10.1007/BF00307281.
Green, D. H., and A. E. Ringwood (1967), The genesis ofbasaltic magmas, Contrib. Mineral. Petrol., 15, 103–190,doi:10.1007/BF00372052.
Hansteen, T. H., A. Klugel, and H.-U. Schmincke (1998),Multi-stage magma ascent beneath the Canary Islands:Evidence from fluid inclusions, Contrib. Mineral. Petrol.,132(1), 48–64, doi:10.1007/s004100050404.
Hauri, E. H. (1992), Major-element variability in the Hawaiianmantle plume, Nature, 382, 415 –419, doi:10.1038/382415a0.
Helz, R. T., and C. R. Thornber (1987), Geothermometry ofKilauea Iki lava lake Hawaii, Bull. Volcanol., 49, 651–668,doi:10.1007/BF01080357.
Ihinger, P. D., R. L. Hervig, and P. F. McMillan (1994),Analytical methods for volatiles in glasses, Rev. Mineral.Geochem., 30(1), 67–121.
GeochemistryGeophysicsGeosystems G3G3
famin et al.: three differentiation stages at piton de la fournaise 10.1029/2008GC002015
17 of 18

Kawakami, Y., J. Yamamoto, and K. Hiroyuki (2003), Micro-Raman densimeter for CO2 inclusions in mantle-derivedminerals, Appl. Spectrosc. , 57(11), 1333 – 1339,doi:10.1366/000370203322554473.
Kornprobst, J., P. Boivin, and P. Bachelery (1979), L’alimentationdes eruptions recentes du Piton de la Fournaise (Ile de laReunion, Ocean Indien): Degre d’evolution et niveau de segre-gationdeslavesemises,C.R.Acad.Sci.,288D(29), 1691–1694.
Lacroix, A. (1936), Le Volcan Actif de l’ıle de la Reunion et sesProduits, Gauthier-Villard, Paris.
Lenat, J. F., and P. Bachelery (1990), Structure et fonctionnementde la zone centrale du Piton de La Fournaise, in Le Volcanismede La Reunion, edited by J. F. Lenat, pp. 257–296, Cent. deRech. Volcanol., Clermont-Ferrand, France.
Lister, J. R., and R. C. Kerr (1991), Fluid-mechanical modelsof crack propagation and their application to magma trans-port in dykes, J. Geophys. Res., 96(B6), 10,049–10,077,doi:10.1029/91JB00600.
Longpre, M.-A., T. Staudacher, and J. Stix (2007), The November2002eruptionatPitondelaFournaisevolcano,LaReunionIsland:Ground deformation, seismicity, and pit crater collapse, Bull.Volcanol., 69, 511–525, doi:10.1007/s00445-006-0087-0.
Luais, B. (2004), Temporal changes in Nd isotopic composi-tion of Piton de la Fournaise magmatism (Reunion Island,Indian Ocean), Geochem. Geophys. Geosyst., 5, Q01008,doi:10.1029/2002GC000502.
Ludden, J. N. (1978), Magmatic evolution of the basalticshield volcanoes of Reunion Island, J. Volcanol. Geotherm.Res., 4, 171–198, doi:10.1016/0377-0273(78)90035-5.
Macdonald, G. A., and T. Katsura (1964), Chemical composi-tion of Hawaiian lavas, J. Petrol., 5, 82–133.
Maurel, C., and P. Maurel (1982), Etude experimentale del’equilibre Fe2+-Fe3+ dans les spinelles chromiferes et lesliquides silicates basiques coexistants a l atm., C. R. Acad.Sci., 295(II), 209–212.
Mohamed-Abchir, A., M. P. Semet, G. Boudon, P. Ildefonse,P. Bachelery, and R. Clocchiatti (1998), Huge hydrothermalexplosive activity on Piton de la Fournaise, Reunion Island:The Bellecombe Ash Member, 2700 BC, in The EuropeanLaboratory Volcanoes, Proceedings of the Second Workshop,2 to 4 May 1996, pp. 447–455, Luxembourg Off. for Off.Publ. of the Eur. Communities, Santorini, Greece.
Morgan, G. B.VI, and D. London (1996), Optimizing the elec-tron microprobe analysis of hydrous alkali aluminosilicateglasses, Am. Mineral., 81, 1176–1185.
Newman, S., and J. B. Lowenstern (2002), VOLATILECALC:A silicate melt-H2O-CO2 solution model written in VisualBasic for Excel, Comput. Geosci., 28, 597 – 604,doi:10.1016/S0098-3004(01)00081-4.
Oversby, V. M. (1972), Genetic relations among the volcanicrocks of Reunion: Chemical and lead isotopic evidence,Geochim. Cosmochim. Acta, 36, 1167–1179, doi:10.1016/0016-7037(72)90097-X.
Peltier, A., V. Famin, P. Bachelery, V. Cayol, Y. Fukushima,and T. H. Staudacher (2008), Cyclic magma transports atPiton de La Fournaise volcano (La Reunion hotspot) inferredfrom deformation and geochemical data, Earth Planet. Sci.Lett., 270(3–4), 180–188.
Peterson, D. W., and R. B. Moore (1987), Geologic history andevolution of geologic concepts, island of Hawaii, U. S. Geol.Surv. Prof. Pap., 1350, 149–189.
Rancon, J. P., P.Rocher, T.Auge, andP.Nativel (1988), Petrologiede deux complexes intrusifs lites de l’ıle de la Reunion, Implica-tions volcano-structurales,Geol. Fr., 2–3, 135–156.
Ren, Z.-Y., S. Ingle, E. Takahashi, N. Hirano, and T. Hirata(2005), The chemical structure of the Hawaiian mantleplume, Nature, 436, 837–840, doi:10.1038/nature03907.
Rhodes, J. M. (1988), Geochemistry of the 1984 Mona Loaeruption: Implication for magma srorage and supply, J. Geo-phys. Res., 93, 4453–4466, doi:10.1029/JB093iB05p04453.
Roedder, E. (1979), Origin and significance of magmaticinclusions, Bull. Mineral., 102, 457–510.
Roedder, E. (1984), Fluid Inclusions, Rev. in Mineral., vol. 12,644 pp., Mineral. Soc. of Am., Chantilly, Va.
Ryan, M. P. (1988), The mechanics and three-dimensionalinternal structure of active magmatic systems: KilaueaVolcano, Hawaii, J. Geophys. Res., 93(B5), 4213–4248,doi:10.1029/JB093iB05p04213.
Schiano, P., A. Provost, R. Clocchiatti, and F. Faure (2006),Transcrystalline melt migration and Earth’s mantle, Science,314, 970–974, doi:10.1126/science.1132485.
Sobolev, A., A.W. Hofmann, S. V. Sobolev, and I. K. Nikogosian(2005), An olivine-free mantle source of Hawaiian shieldbasalts, Nature, 434, 590–597, doi:10.1038/nature03411.
Sours-Page, R., R. L. Nielsen, and R. Batiza (2002), Meltinclusions as indicators of parental magma diversity on thenorthern East Pacific Rise, Chem. Geol., 183, 237–261,doi:10.1016/S0009-2541(01)00384-9.
Tilley, C. E., R. N. Thompson, W. J. Wadsworth, and B. G. J.Upton (1971), Melting relations of some lavas of ReunionIsland, Indian Ocean, Mineral. Mag., 38, 344–352,doi:10.1180/minmag.1971.038.295.09.
Upton, B. G. J., and W. J. Wadsworth (1965), Geology ofReunion Island, Indian Ocean, Nature, 207, 151–154,doi:10.1038/207151a0.
Upton, B. G. J., and W. J. Wadsworth (1972a), Aspects ofmagmatic evolution on Reunion Island, Philos. Trans. R.Soc. London, Ser. A, 271, 105–130.
Upton, B. G. J., and W. J. Wadsworth (1972b), Peridotitic andgabbroic rocks associated with the Shield-Forming lavas ofReunion, Contrib. Mineral. Petrol., 35, 139 – 158,doi:10.1007/BF00370925.
Upton, B. G. J., M. P. Semet, and J.-L. Joron (2000), Cumulateclasts in the Bellecombe Ash Member, Piton de la Fournaise,Reunion Island, and their bearing on cumulative processes inthe petrogenesis of the Reunion lavas, J. Volcanol.Geotherm. Res., 104(1–4), 297–318, doi:10.1016/S0377-0273(00)00212-2.
Villeneuve, N. (2000), Apports multi-sources a une meilleurecomprehension de la mise en place des coulees de lave et desrisques associes au Piton de la Fournaise, Ph.D. thesis, Univ.Pierre et Marie Curie, Paris.
Vlastelic, I., T. Staudacher, and M. Semet (2005), Rapidchange of lava composition from 1998 to 2002 at Piton deLa Fournaise (Reunion) inferred from Pb isotopes and traceelements: Evidence for variable crustal contamination,J. Petrol., 46, 79–107, doi:10.1093/petrology/egh062.
Vlastelic, I., A. Peltier, and T. Staudacher (2007), Short-term(1998–2006) fluctuations of Pb isotopes at Piton de la Four-naise volcano (Reunion Island): Origins and constrains on thesize andshapeof themagmareservoir,Chem.Geol.,244, 202–220, doi:10.1016/j.chemgeo.2007.06.015.
Zielinski, R. A. (1975), Trace element evaluation of a suite ofrocks from Reunion island, Indian Ocean, Geochim. Cosmo-ch im. Ac ta , 39 , 713 – 734 , do i :10 .1016/0016-7037(75)90012-5.
GeochemistryGeophysicsGeosystems G3G3
famin et al.: three differentiation stages at piton de la fournaise 10.1029/2008GC002015
18 of 18