Embed Size (px)
Citation preview
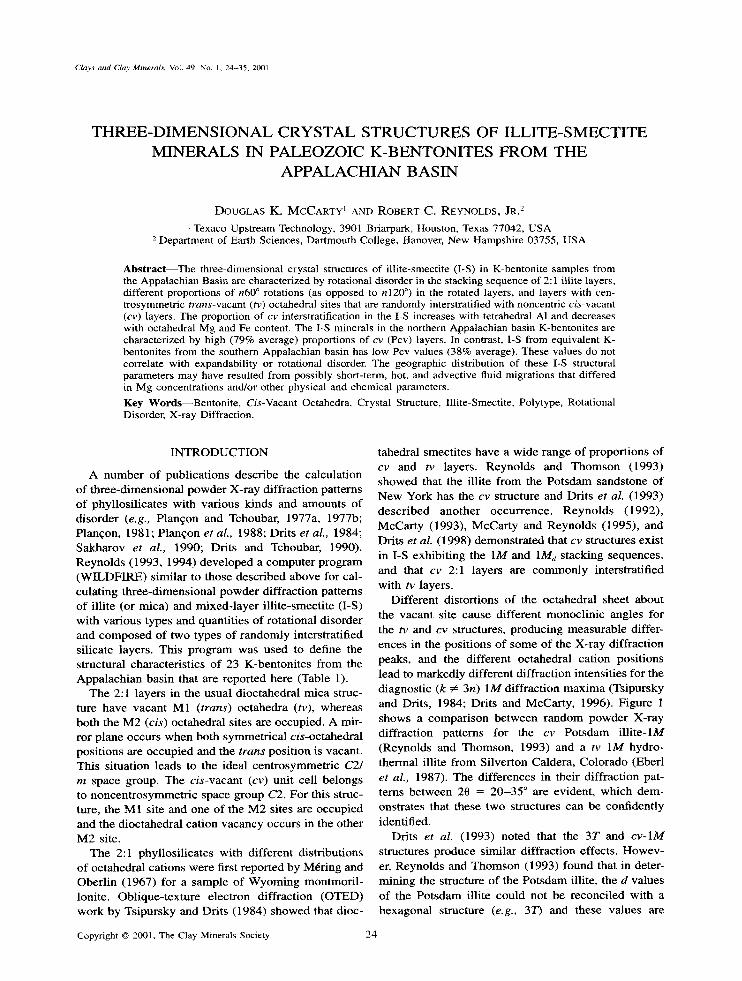
Clays and Clay Minerals. Vol. 49, No. 1, 24-35. 2001.
T H R E E - D I M E N S I O N A L CRYSTAL STRUCTURES OF ILLITE-SMECTITE MINERALS IN PALEOZOIC K-BENTONITES FROM THE
APPALACHIAN BASIN
DOUGLAS K. MCCARTY l AND ROBERT C. REYNOLDS, JR. 2
t Texaco Upstream Technology, 3901 Briarpark, Houston, Texas 77042, USA 2 Department of Earth Sciences, Dartmouth College, Hanover, New Hampshire 03755, USA
A b s t r a c t - - T h e three-dimensional crystal structures of illite-smectite (I-S) in K-bentonite samples from the Appalachian Basin are characterized by rotational disorder in the stacking sequence of 2:1 illite layers, different proportions of n60 ~ rotations (as opposed to n120 ~ in the rotated layers, and layers with cen- trosymmetric trans-vacant (tv) octahedral sites that are randomly interstratified with noncentric cis-vacant (cv) layers. The proportion of cv interstratification in the I-S increases with tetrahedral A1 and decreases with octahedral Mg and Fe content. The I-S minerals in the northern Appalachian basin K-bentonites are characterized by high (79% average) proportions of cv (Pcv) layers. In contrast, I-S from equivalent K- bentonites from the southern Appalachian basin has low Pcv values (38% average). These values do not correlate with expandability or rotational disorder. The geographic distribution of these I-S structural parameters may have resulted from possibly short-term, hot, and advective fluid migrations that differed in Mg concentrations and/or other physical and chemical parameters.
Key Words--Bentonite, Cis-Vacant Octahedra, Crystal Structure, Illite-Smectite, Polytype, Rotational Disorder, X-ray Diffraction.
I N T R O D U C T I O N
A n u m b e r of publ ica t ions descr ibe the ca lcula t ion o f th ree -d imens iona l p o w d e r X- ray di f f rac t ion pat terns of phyl los i l ica tes wi th var ious k inds and amount s of d i sorder (e .g. , Planqon and Tchoubar, 1977a, 1977b; Plan~on, 1981; P lanqon et al., 1988; Dri ts et al., 1984; Sakha rov e t al. , 1990; Drits and Tchoubar, 1990). Reyno lds (1993, 1994) deve loped a compu te r p rog ram ( W I L D F I R E ) s imi lar to those descr ibed above for cal- cu la t ing th ree -d imens iona l p o w d e r d i f f rac t ion pat terns of ill i te (or mica ) and mixed- laye r i l l i te-smect i te (I-S) wi th var ious types and quant i t ies of rota t ional d isorder and c o m p o s e d of two types of r andomly interstrat if ied si l icate layers. This p r og r am was used to define the s t ructural character is t ics of 23 K-ben ton i tes f rom the Appa l ach i an bas in tha t are repor ted here (Table 1).
The 2:1 layers in the usual d ioc tahedra l mica struc- ture have vacan t M1 ( t rans ) oc tahedra (tv), whereas bo th the M 2 (c i s ) octahedra l sites are occupied. A mir- ror p lane occurs w h e n bo th symmet r ica l c i s - o c t a h e d r a l
pos i t ions are occupied and the t r a n s pos i t ion is vacant . This s i tuat ion leads to the ideal cen t rosymmet r i c C2/ m space group. The c i s - v a c a n t (cv) uni t cell be longs to noncen t ro symmet r i c space group C2. For this struc- ture, the M1 site and one of the M 2 sites are occupied and the d ioc tahedra l cat ion vacancy occurs in the o ther M 2 site.
The 2:1 phyl los i l ica tes wi th d i f ferent d is t r ibut ions of oc tahedra l ca t ions were first repor ted by M r r i n g and Ober l in (1967) for a sample of W y o m i n g mon tmor i l - lonite. Obl ique- tex ture e lec t ron di f f rac t ion (OTED) work by Ts ipursky and Drits (1984) s h o w e d that dioc-
tahedral smect i tes have a wide range of propor t ions of c v and tv layers. Reynolds and T h o m s o n (1993) showed that the illite f rom the Po t sdam sands tone of New York has the cv structure and Drits et al. (1993) d e s c r i b e d a n o t h e r occu r r ence . R e y n o l d s (1992) , McCar ty (1993), McCar ty and Reyno lds (1995), and Dri ts e t al. (1998) demons t ra t ed tha t c v s t ructures exis t in I-S exhib i t ing the 1M and 1Md s tacking sequences , and that c v 2:1 layers are c o m m o n l y interstrat if ied wi th tv layers.
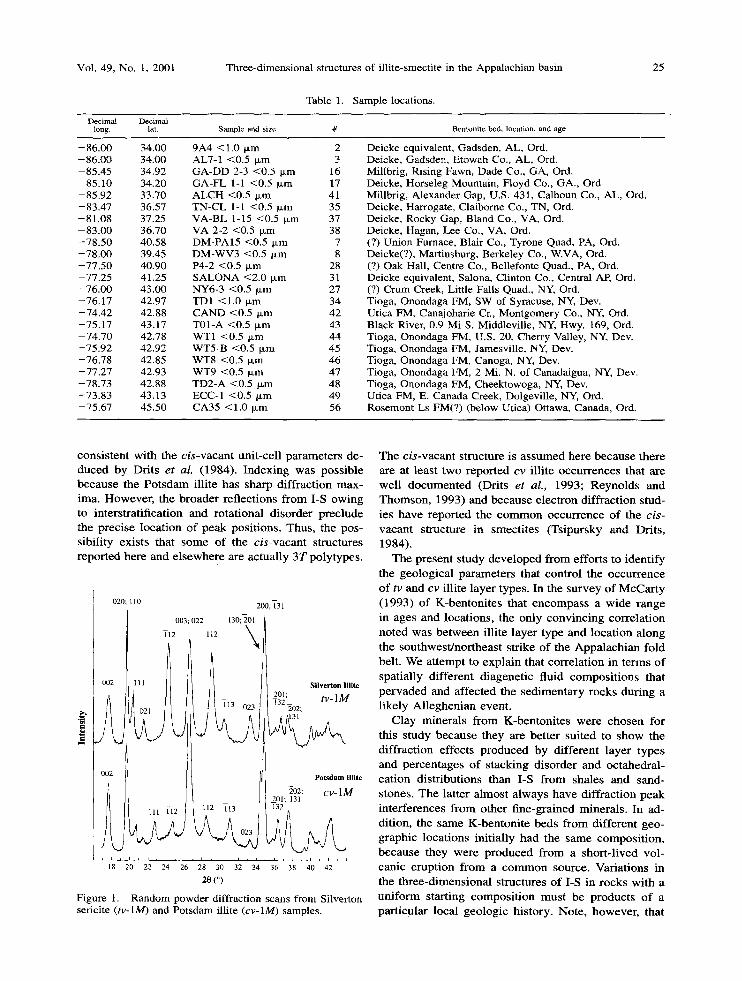
Dif ferent d is tor t ions of the oc tahedra l shee t abou t the vacan t site cause di f ferent monoc l in ic angles for t he tv and c v structures, p roduc ing measu rab le differ- ences in the posi t ions of some of the X-ray diffract ion peaks, and the di f ferent oc tahedra l ca t ion posi t ions lead to marked ly di f ferent dif f ract ion in tensi t ies for the diagnost ic (k # 3n) 1M diff ract ion m a x i m a (Tsipursky and Drits, 1984; Drits and McCar ty , 1996). F igure 1 shows a compar i son be tween r a n d o m powder X-ray di f f ract ion pat terns for the c v P o t s d a m i l l i t e - l M (Reynolds and Thomson , 1993) and a tv 1M hydro- the rmal ill i te f rom Si lver ton Caldera, Colorado ( E b e d e t al., 1987). The di f ferences in thei r d i f f ract ion pat- terns be tween 20 = 2 0 - 3 5 ~ are evident , wh ich dem- onst ra tes that these two structures can be conf ident ly
identified. Drits et al. (1993) no ted that the 3T and c v - l M
s t ructures produce s imi lar d i f f ract ion effects. H o w e v - er, Reynolds and T h o m s o n (1993) found that in deter- min ing the structure of the P o t s d a m illite, the d values of the Po t sdam illite could not be reconc i led wi th a hexagona l s t ructure (e.g. , 337) and these values are
Copyright �9 2001, The Clay Minerals Society 24
Vol. 49, No. 1, 2001 25 Three-dimensional structures of illite-smectite in the Appalachian basin
Table 1. Sample locations.
Decimal Decimal long. lat. Sample and size # Bentonite bed, location, and age
-86 .00 34.00 9A4 <1.0 p.m 2 -86 .00 34.00 AL7-1 <0.5 Ixm 3 -85.45 34.92 GA-DD 2-3 <0.5 ~m 16 -85.10 34.20 GA-FL 1-1 <0.5 p~m 17 -85.92 33.70 ALCH <0.5 Ixm 41 -83.47 36.57 TN-CL 1-1 <0.5 p,m 35 -81.08 37.25 VA-BL 1-15 <0.5 txm 37 -83 .00 36.70 VA 2-2 <0.5 p.m 38 -78.50 40.58 DM-PA15 <0.5 ~Lm 7 --78.00 39.45 DM-WV3 <0.5 tLm 8 -77 .50 40.90 P4-2 <0.5 Ixm 28 -77.25 41.25 SALONA <2.0 Ixm 31 -76.00 43.00 NY6-3 <0.5 p,m 27 -76.17 42.97 TD1 <1.0 p,m 34 -74.42 42.88 CAND <0.5 p.m 42 -75.17 43.17 T01-A <0.5 ixm 43 -74 .70 42.78 WT1 <0.5 lxm 44 -75 .92 42.92 WT5-B <0.5 p~m 45 -76.78 42.85 WT8 <0.5 p.m 46 -77.27 42.93 WT9 <0.5 p,m 47 -78.73 42.88 TD2-A <0.5 ~m 48 -73.83 43.13 ECC-I <0.5 Ixm 49 -75.67 45.50 CA35 <1.0 Ixm 56
Deicke equivalent, Gadsden, AL, Ord. Deicke, Gadsden, Etowah Co., AL, Ord. Millbrig, Rising Fawn, Dade Co., GA, Ord. Deicke, Horseleg Mountain, Floyd Co., GA., Ord Millbrig, Alexander Gap, U.S. 431, Calhoun Co., AL, Ord. Deicke, Harrogate, Claiborne Co., TN, Ord. Deicke, Rocky Gap, Bland Co., VA, Ord. Deicke, Hagan, Lee Co., VA, Ord. (?) Union Furnace, Blair Co., Tyrone Quad, PA, Ord. Deicke(?), Martinsburg, Berkeley Co., W.VA, Ord. (?) Oak Hall, Centre Co., Bellefonte Quad., PA, Ord. Deicke equivalent, Salona, Clinton Co., Central AP, Ord. (?) Crum Creek, Little Falls Quad., NY, Ord. Tioga, Onondaga FM, SW of Syracuse, NY, Dev. Utica FM, Canajoharie Cr., Montgomery Co., NY, Ord. Black River, 0.9 Mi S. Middleville, NY, Hwy. 169, Ord. Tioga, Onondaga FM, U.S. 20, Cherry Valley, NY, Dev. Tioga, Onondaga FM, Jamesville, NY, Dev. Tioga, Onondaga FM, Canoga, NY, Dev. Tioga, Onondaga FM, 2 Mi. N. of Canadaigua, NY, Dev. Tioga, Onondaga FM, Cheektowoga, NY, Dev. Utica FM, E. Canada Creek, Dolgeville, NY, Ord. Rosemont Ls FM(?) (below Utica) Ottawa, Canada, Ord.
cons i s ten t wi th the cis-vacant uni t -cel l pa rameters de- duced by Drits et aL (1984). Index ing was poss ib le because the P o t s d a m illite has sharp d i f f rac t ion max- ima. However , the b roader ref lect ions f rom I-S owing to inters t ra t i f icat ion and rota t ional d isorder p rec lude the precise loca t ion o f peak posi t ions. Thus , the pos- sibi l i ty exists tha t some of the cis-vacant structures repor ted here and e l sewhere are actual ly 3T polytypes.
020; 110 200; ~31
003; 022 130;201
112 112
l 111 Silvertan lllite 2Ol; tv- lM 132_
202;
P o t s d a m lllae
~o2; cv- 1M _ 201; 131
111 112 J t 1)2 113 132
i , , i , i , i , 21 , i , i , , i , 3 8 ' i , i ~ 18 20 22 24 26 8 30 32 34 36 40 42
2o (o)
Figure 1. Random powder diffraction scans from Silverton sericite (tv-lM) and Potsdam illite (cv-lM) samples.
T h e c is -vacant structure is a s sumed here because there are at least two repor ted cv i l l i te occur rences tha t are wel l d o c u m e n t e d (Drits et al., 1993; Reyno lds and Thomson , 1993) and because e lec t ron diffract ion stud- ies have repor ted the c o m m o n occur rence of the cis-
vacan t s t ructure in smect i tes (Tsipursky and Drits , 1984),
The present s tudy deve loped f rom effor ts to ident i fy the geological pa ramete r s that cont ro l the occur rence of tv and cv i l l i te layer types. In the su rvey of M c C a r t y (1993) of K-benton i tes tha t e n c o m p a s s a wide range in ages and locat ions , the only c o n v i n c i n g cor re la t ion no ted was be tween il l i te layer type and loca t ion a long the sou thwes t /nor theas t strike o f the Appa l ach i an fold belt . We a t tempt to expla in that cor re la t ion in t e rms of spatial ly di f ferent d iagenet ic fluid compos i t ions tha t pe rvaded and affected the s ed imen ta ry rocks dur ing a l ikely A l l eghen ian event .
Clay minera ls f rom K-benton i tes were c h o s e n for this s tudy because they are be t te r sui ted to show the di f f ract ion effects p roduced b y dif ferent layer types and percen tages of s tacking d isorder and oc tahedra l - ca t ion dis t r ibut ions than I-S f rom shales and sand- stones. The lat ter a lmos t a lways h a v e di f f rac t ion peak in ter ferences f rom other f ine-gra ined minera ls . In ad- dit ion, the same K-ben ton i t e beds f rom dif ferent geo- graphic locat ions ini t ial ly had the same compos i t ion , because they were p roduced f rom a shor t - l ived vol- canic erupt ion f rom a c o m m o n source. Var ia t ions in the th ree -d imens iona l s t ructures of I-S in rocks wi th a un i fo rm star t ing compos i t ion mus t be produc ts o f a par t icular local geo logic his tory. Note, however , tha t
26 McCarty and Reynolds Clays and Clay Minerals
the systematics of illite-smectite in bentonites might be different from that in shales and mudstones.
GEOLOGICAL SETTING
Ordovician volcanic ash layers deposited in epeiric seas presently occur over an area of --1.3 million km 2 of eastern North America and are distributed through- out thick sequences of carbonate and clastic rocks (Kolata et al., 1986). The source volcanoes that pro- duced the original ash beds probably existed in an is- land arc system in the Appalachian orogenic belt as shown by more numerous and thicker beds in or ad- jacent to the Appalachian mountains. This is in con- trast to more western areas where bentonite beds are thinner and less abundant (Kay, 1935; Kolata et al., 1986). Ordovician K-bentonites reported on here are the Deicke and Milbrig Bentonites or their equivalents.
The Tioga Bentonite is the best known and wide- spread volcanic ash layer in the middle Devonian rocks of the Appalachian basin and probably covered all of the northeastern United States during Middle Devonian time (Dennison and Textoris, 1970; Droste and Vitaliano, 1973). The volcanic vent or vents that produced the Tioga ash were probably located in cen- tral Virginia (Droste and Vitaliano, 1973). The De- vonian K-bentonite samples in this study are from the Tioga or Tioga equivalent bentonite beds.
This study and others (e.g., Pytte and Reynolds, 1989; Eberl and Hower, 1976; Huang et al., 1993) demonstrate that the illitization of smectite is a kinet- ically controlled process that occurs during diagenesis. Huang et al. (1993) developed a kinetic scheme based on laboratory synthesis and field studies, and they found that at any specific temperature, the illite reac- tion rate depends on the activity of K in the pore fluid. The position of a given composition of I-S in the in- terstratification series thus depends on temperature, K activity in the associated pore fluids, and time.
I-S diagenesis in the distal Appalachian basin, par- ticularly in the north, cannot be explained by the "tra- ditional" model of burial diagenesis because apparent burial depths are too shallow (Harris, 1979). The I-S clays in Appalachian basin K-bentonites are long- range ordered (stacking order) structures (Reichweite > 1) with low to medium expandability similar to those found in deeply buried diagenetic sequences. However, most of these northern Appalachian clays occur in geologic areas that show no evidence of deep burial depths (Huff and Ttirkrnenoglu, 1981; Elliott and Aronson, 1987).
Elliott and Aronson (1987) documented illitic K- bentonites with uniform expandability from middle Ordovician strata throughout the southern Appalachian basin regardless of burial depth. They interpreted the narrowly confined K/At ages of illitization between 272-300 Ma (late Pennsylvanian to early Permian) as evidence for a short-lived diagenetic episode caused
by the Alleghanian orogeny. Additional work by EI- liott and Aronson (1993) supports the contention that the iUite formed during the Alleghanian Orogeny.
Other studies suggest that mineralizing fluids ad- vectively penetrated the rocks of the eastern United States (e.g., Viets et al., 1984; Oliver, 1986; Leach and Rowan, 1986; Hearn et aL, 1987; Bethke and Mar- shak, 1990). Data are much more limited for the north- ern Appalachians, but Johnsson (1984) reported a par- tially annealed zircon from the Tioga Bentonite that indicates temperatures (> 175~ much higher than can be explained by most acceptable models for maximum burial depths and a reasonable geothermal gradient. Roden et al. (1992, 1993) also found partially an- nealed zircon fission tracks throughout the southern Appalachian basin indicating temperatures of -175~ They suggested that these temperatures were main- tained for < 1 Ma, but these temperatures are difficult to reach with the estimated burial depth. Siedemann and Isachsen (unpubl. data; personal communication) obtained a K/Ar age of 290 Ma on I-S from a bentonite in the Ordovician Utica formation of New York, thus suggesting an origin similar to that of the much better studied I-S from the southern Appalachians.
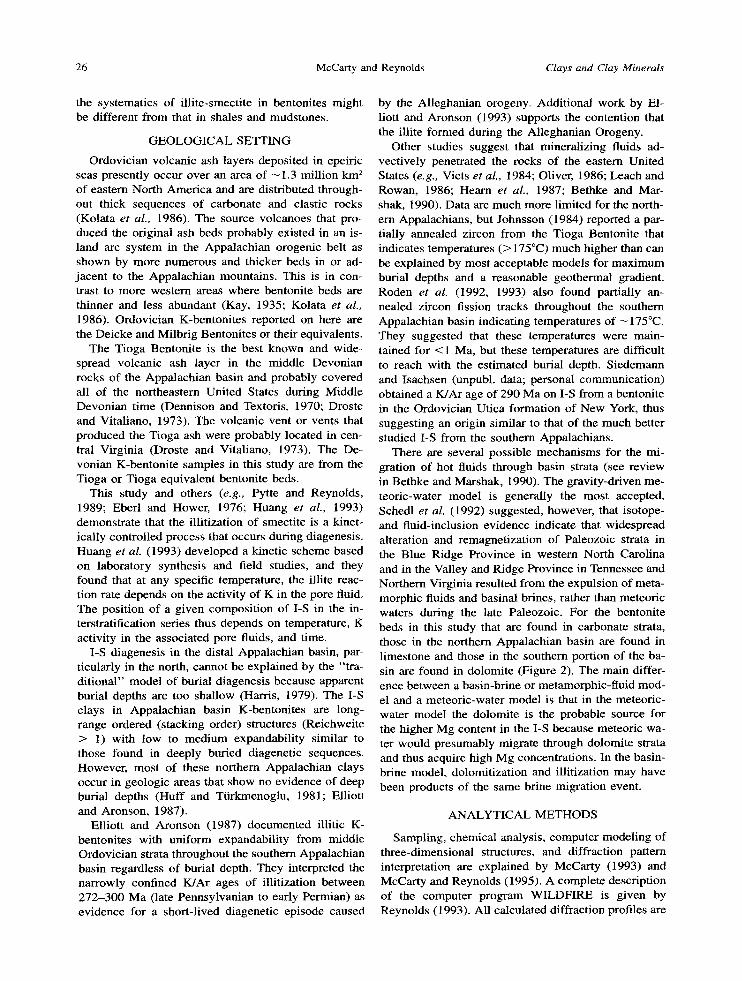
There are several possible mechanisms for the mi- gration of hot fluids through basin strata (see review in Bethke and Marshak, 1990). The gravity-driven me- teoric-water model is generally the most accepted. Schedl et al. (1992) suggested, however, that isotope- and fluid-inclusion evidence indicate that widespread alteration and remagnetization of Paleozoic strata in the Blue Ridge Province in western North Carolina and in the Valley and Ridge Province in Tennessee and Northern Virginia resulted from the expulsion of meta- morphic fluids and basinal brines, rather than meteoric waters during the late Paleozoic. For the bentonite beds in this study that are found in carbonate strata, those in the northern Appalachian basin are found in limestone and those in the southern portion of the ba- sin are found in dolomite (Figure 2). The main differ- ence between a basin-brine or metamorphic-fluid mod- el and a meteoric-water model is that in the meteoric- water model the dolomite is the probable source for the higher Mg content in the I-S because meteoric wa- ter would presumably migrate through dolomite strata and thus acquire high Mg concentrations. In the basin- brine model, dolomitization and illitization may have been products of the same brine migration event.
A N A L Y T I C A L METHODS
Sampling, chemical analysis, computer modeling of three-dimensional structures, and diffraction pattern interpretation are explained by McCarty (1993) and McCarty and Reynolds (1995). A complete description of the computer program WILDFIRE is given by Reynolds (1993). All calculated diffraction profiles are
Vol. 49, No. 1, 2001
S o u t h e r n
Three-dimensional structures of illite-smectite in the Appalachian basin
C e n t r a l N o r t h e r n
27
Northern A G E Alabama
DEV.
si .
M - U ,
O R D .
K O R D .
PC. :~,'~ ,'~,'~,'~'
Figure 2, central, and southern Appalachians (adapted from Milici and
N e w
A G E York
DEV.
SIL. ::'::~:i~;:! I'':~%(::::~:''::~:
M - U o ~ "
O R D . ~
F_. O R D . '~
CAMB. ::::::::::::::::::::::::::::::::::::::::::
PC. /~.~t/~.-I1,..I..
K-bentonite
-.,- . . . . . . . . - i . , , : j
..,-, Sandstone ' , ' 4 ~ Dolomite
Limestone
Shale
~ Unconformity
,"}, ~" "d ," ~ Basement
Generalized geologic columns showing lithologies and relative positions of the K-bentonites from the northern, de Witt, 1988 and Thomas, 1988).
based on atomic coordinates and unit-cell parameters for cv and tv layers from Drits et aL (1984).
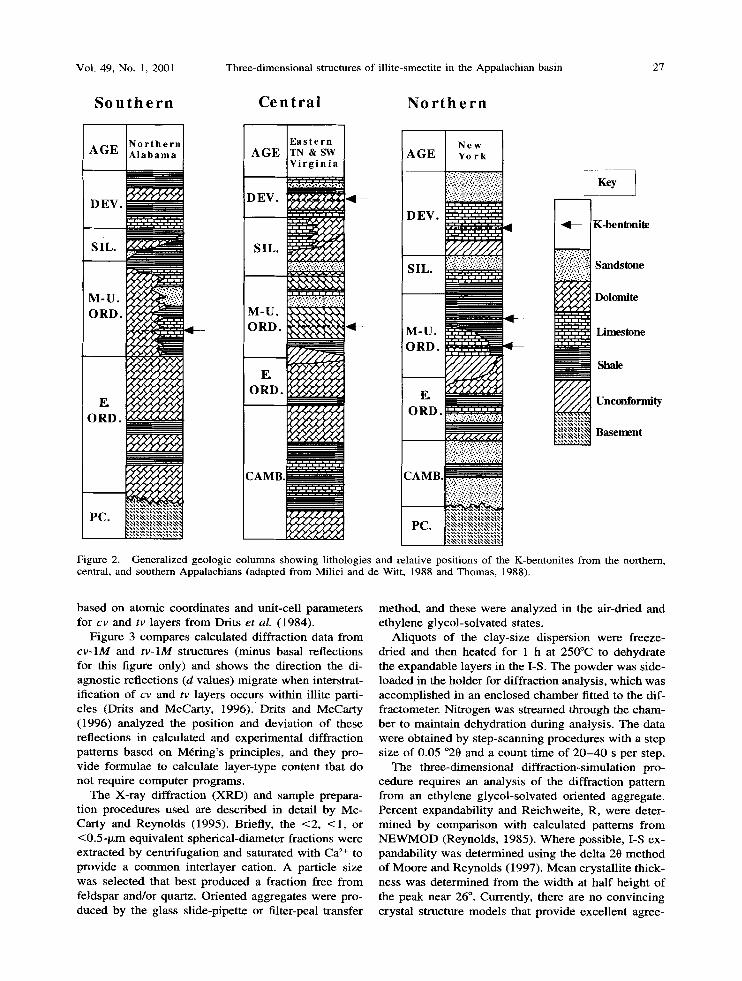
Figure 3 compares calculated diffraction data from c v - l M and tv-lM structures (minus basal reflections for this figure only) and shows the direction the di- agnostic reflections (d values) migrate when interstrat- ification of cv and tv layers occurs within illite parti- cles (Drits and McCar ty , 1996). Drits and McCarty (1996) analyzed the position and deviation of these reflections in calculated and experimental diffraction patterns based on M6ring's principles, and they pro- vide formulae to calculate layer-type content that do not require computer programs.
The X-ray diffraction (XRD) and sample prepara- tion procedures used are described in detail by Mc- Carty and Reynolds (1995). Briefly, the <2, <1, or <0.5-p~m equivalent spherical-diameter fractions were extracted by centrifugation and saturated with Ca 2§ to provide a common interlayer cation. A particle size was selected that best produced a fraction free from feldspar and/or quartz. Oriented aggregates were pro- duced by the glass slide-pipette or filter-peal transfer
method, and these were analyzed in the air-dried and ethylene glycol-solvated states.
Aliquots of the clay-size dispersion were freeze- dried and then heated for 1 h at 250~ to dehydrate the expandable layers in the I-S. The powder was side- loaded in the holder for diffraction analysis, which was accomplished in an enclosed chamber fitted to the dif- fractometer. Nitrogen was streamed through the cham- ber to maintain dehydration during analysis. The data were obtained by step-scanning procedures with a step size of 0.05 ~ and a count time of 20-40 s per step.
The three-dimensional diffraction-simulation pro- cedure requires an analysis of the diffraction pattern from an ethylene glycol-solvated oriented aggregate. Percent expandability and Reichweite, R, were deter- mined by comparison with calculated patterns from NEWMOD (Reynolds, 1985). Where possible, I-S ex- pandability was determined using the delta 20 method of Moore and Reynolds (1997). Mean crystallite thick- ness was determined from the width at half height of the peak near 26 ~ . Currently, there are no convincing crystal structure models that provide excellent agree-
28 McCarty and Reynolds Clays and Clay Minerals
020 ; 110
~
I 1 1 1 1 2 022 112 112 023
,*i a,i ~i : :4 :4' r :
�9 -<i : .< i
c v- l M
tv-lM
\
~ _ 2~0 , 212 214 216 2t8 310 312 314 i
20 C)
Figure 3. Comparison between calculated cv - lM and tv-lM structures. Arrows show the migration direction of the indi- cated reflections (d values) where interstratification of the oth- er layer type occurs.
m e n t be tween o b s e r v e d and ca lcula ted basal X R D pat- terns for (R > 2) I-S. Despi te s ignif icant d iscrepancies be tween theory and exper iment , a lmos t all o f the sam- ples in this s tudy are c lus tered near the ill i te e n d - m e m - ber of the compos i t i ona l range. For such minerals , dif- fe rences of < 5 % expandabi l i ty have litt le or no mea- surable effect on the accurate de te rmina t ion of the key th ree -d imens iona l pa ramete r s P0, Pcv, and P60 where these pa ramete r s represen t the propor t ions of layers wi th 0 ~ rotat ions, cv occupancy, or 60 ~ rotat ions, re- spect ively; see below. Consequent ly , the fai lure to de- duce the detai ls of I-S layer inters trat i f icat ion does not c o m p r o m i s e our results.
Percen t expandabi l i ty , Reichwei te , and crystal l i te th ickness are input pa ramete r s for W I L D F I R E . Basa l ref lect ions were ca lcula ted us ing these pa ramete r s for an interstrat i f ied i l l i te-smect i te in wh ich the smect i te layers were a s sum ed to be dehydra ted wi th a spacing o f 9.7 ,~. The expandab le in ter layers had a fixed com- pos i t ion o f 0.15 Ca ions, the illite in ter layer con ta ined 0.7 K, and b o t h layer types had Fe fixed at 0.15 ions per Si4Ol0. The X and Y crystal l i te d imens ions were 60 and 30 uni t cells, respect ively.
The th ree -d imens iona l d i f f ract ion pat terns were not c o m p u t e d f rom the m e a n crystal l i te th ickness , bu t in- stead, a crysta l l i te th ickness d is t r ibut ion was used that represents the f r equency o f occur rence of ill i te fun- damen ta l par t ic les (Nadeau et al. 1984). All poss ib le comb ina t i ons and pe rmuta t ions of ill i te and smect i te inter layers , cons i s ten t wi th the Reichwei te , were gen- erated. F r o m these, the th icknesses of the stacks of con t iguous il l i te layers were counted and summed.
I
A /I I l l 112 112 113 131 201; , 132
PO =60%
p = 80% c~
P~0 =35%
T i o g a NY <l.O-p.m
18 20 22 24 26 28 30 32 34 36 38 40 42
20 (~
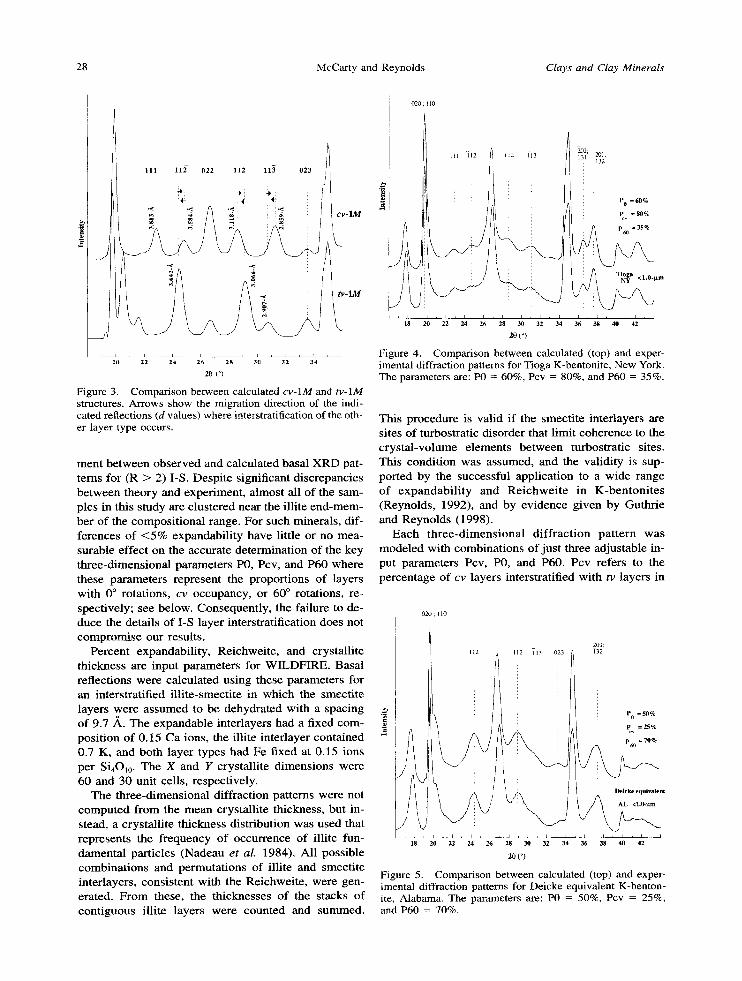
Figure 4. Comparison between calculated (top) and exper- imental diffraction patterns for Tioga K-bentonite, New York. The parameters are: P0 = 60%, Pcv = 80%, and P60 = 35%.
This p rocedure is val id i f the smect i te in ter layers are sites o f turbostra t ic d isorder that l imi t cohe rence to the c rys ta l -vo lume e lements be tween turbostra t ic sites. This condi t ion was assumed, and the val idi ty is sup- por ted by the successful appl ica t ion to a wide range of e x p a n d a b i l i t y and R e i c h w e i t e in K - b e n t o n i t e s (Reynolds , 1992), and by ev idence g iven by Guthr ie and Reynolds (1998).
E a c h t h r e e - d i m e n s i o n a l d i f f r ac t i on pa t t e rn was mode led wi th combina t ions of jus t three adjus table in- pu t parameters Pcv, P0, and P60. Pcv refers to the percen tage of cv layers interstrat if ied wi th tv layers in
020 ; 110
20L 112 ~ 112 113 023 ~ ~32
PO = 5 0 %
Pv =25%
P6O = 7 0 %
Deicke equiva lent
AL <1.0-~'n
18 20 22 24 26 28 30 32 34 36 38 40 42
20 (~
Figure 5. Comparison between calculated (top) and exper- imental diffraction patterns for Deicke equivalent K-benton- ite, Alabama. The parameters are: P0 = 50%, Pcv = 25%, and P60 = 70%.
Vol. 49, No. 1, 2001 Three-dimensional structures of illite-smectite in the Appalachian basin 29
Group I. P c v V a l u e s
60 = M i n i m u m 98 = M a x i m u m 79 = A v e r a g e 38 = D i f f e r e n c e
Composition A v e r a g e s
M g O wt. % = 3.04 Al203 wt. % = 27.29
F e 2 0 3 wt. % = 1.46
K 2 0 wt. % = 5.72
R b p p m = 172
Ratios
M g / F e = 2.08 K / R b = 333
Group II. P c v V a l u e s
25 = Minimum 55 = M a x i m u m 38 = A v e r a g e 30 = D i f f e r e n c e
Composition A v e r a g e s
M g O wt. % = 4.08 A l 2 0 3 wt . % = 23.05
F e 2 0 3 wt. % = 3.35
K 2 0 wt . % = 6.03
R b p p m = 148 I Ratios
0 240 M g / F e = 1.22 k m K f R b = 407
�9 = samples wi th chemica l analysis
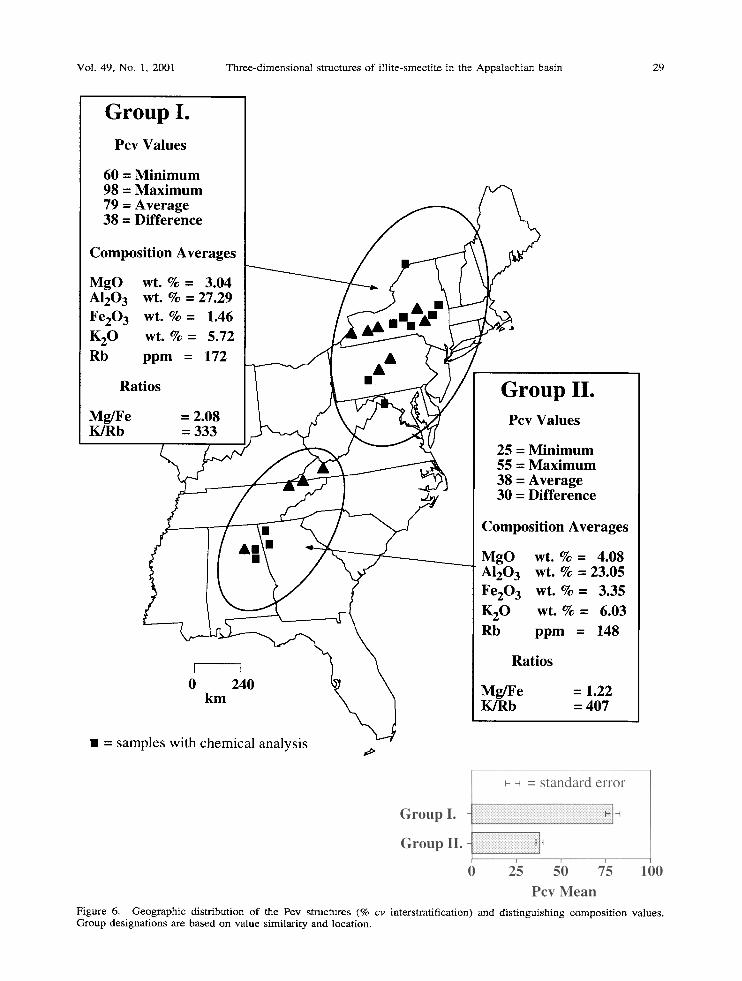
Figure 6. Geographic distribution o f the Pcv structures (% c v interstratification) and dis t inguishing composi t ion values. Group designations are based on value similarity and location.
30 McCarty and Reynolds Clays and Clay Minerals
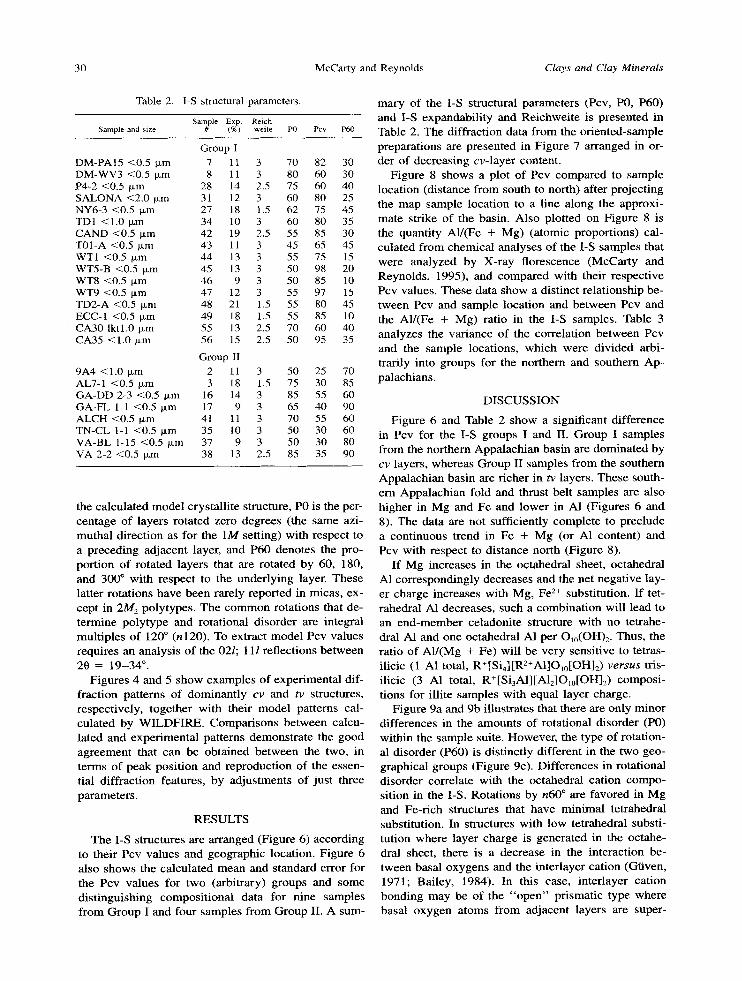
Table 2. I-S structural parameters.
Sample Exp. Reich- Sample and size # (%) weite PO Pcv P60
Group I DM-PAt5 <0.5 Ixm 7 11 3 70 82 30 DM-WV3 <0.5 Ixm 8 11 3 80 60 30 P4-2 <0.5 Ixm 28 14 2.5 75 60 40 SALONA <2.0 ixrn 31 12 3 60 80 25 NY6-3 <0.5 I~m 27 18 1.5 62 75 45 TD1 <1.0 txm 34 10 3 60 80 35 CAND <0.5 txm 42 19 2.5 55 85 30 T01-A <0.5 ixrn 43 11 3 45 65 45 WT1 <0.5 I~m 44 13 3 55 75 15 WT5-B <0.5 p~m 45 13 3 50 98 20 WT8 <0.5 Ixm 46 9 3 50 85 10 WT9 <0.5 p~m 47 12 3 55 97 15 TD2-A <0.5 ~zm 48 21 1.5 55 80 45 ECC-1 <0.5 ~zm 49 18 1.5 55 85 10 CA30 lktl.0 ~m 55 13 2.5 70 60 40 CA35 < l . 0 izrn 56 15 2.5 50 95 35
Group II 9A4 < 1.0 I~m 2 11 3 50 25 70 AL7-1 <0.5 &m 3 18 1.5 75 30 85 GA-DD 2-3 <0.5 Ixm 16 14 3 85 55 60 GA-FL 1-1 <0.5 I~m 17 9 3 65 40 90 ALCH <0.5 Izrn 41 11 3 70 55 60 TN-CL 1-1 <0.5 p~rn 35 10 3 50 30 60 VA-BL 1-15 <0.5 /xm 37 9 3 50 30 80 VA 2-2 <0.5 txm 38 13 2.5 85 35 90
the ca lcula ted mode l crysta l l i te structure, P0 is the per- cen tage of layers ro ta ted zero degrees ( the same azi- mu tha l d i rec t ion as for the 1M sett ing) with respect to a p reced ing ad jacent layer, and P60 denotes the pro- por t ion o f ro ta ted layers that are rotated by 60, 180, and 300 ~ wi th respect to the under ly ing layer. These lat ter ro ta t ions have been rare ly repor ted in micas , ex- cept in 2/I,/2 polytypes . T he c o m m o n rota t ions that de- t e rmine po ly type and rota t ional d isorder are integral mul t ip les o f 120 ~ (n120). To extract mode l Pcv values requires an analys is of the 02l; 1 II ref lect ions be tween 20 = 1 9 - 3 4 ~
F igures 4 and 5 show examples of exper imenta l dif- f rac t ion pa t te rns of dominan t ly cv and tv structures, respect ively, toge ther wi th thei r model pa t te rns cal- cula ted by W I L D F I R E . Compar i sons be tween calcu- la ted and exper imen ta l pa t te rns demons t ra t e the good ag reemen t tha t can be ob ta ined be t w een the two, in t e rms of peak pos i t ion and reproduc t ion of the essen- tial d i f f rac t ion features, by ad jus tments of jus t three parameters .
R E S U L T S
The I-S s t ructures are a r ranged (Figure 6) accord ing to thei r Pcv values and geographic locat ion. Figure 6 also shows the ca lcu la ted m e a n and s tandard error for the Pcv values for two (arbi t rary) groups and some d i s t ingu i sh ing compos i t iona l data for n ine samples f rom G r o u p I and four samples f rom Group II. A sum-
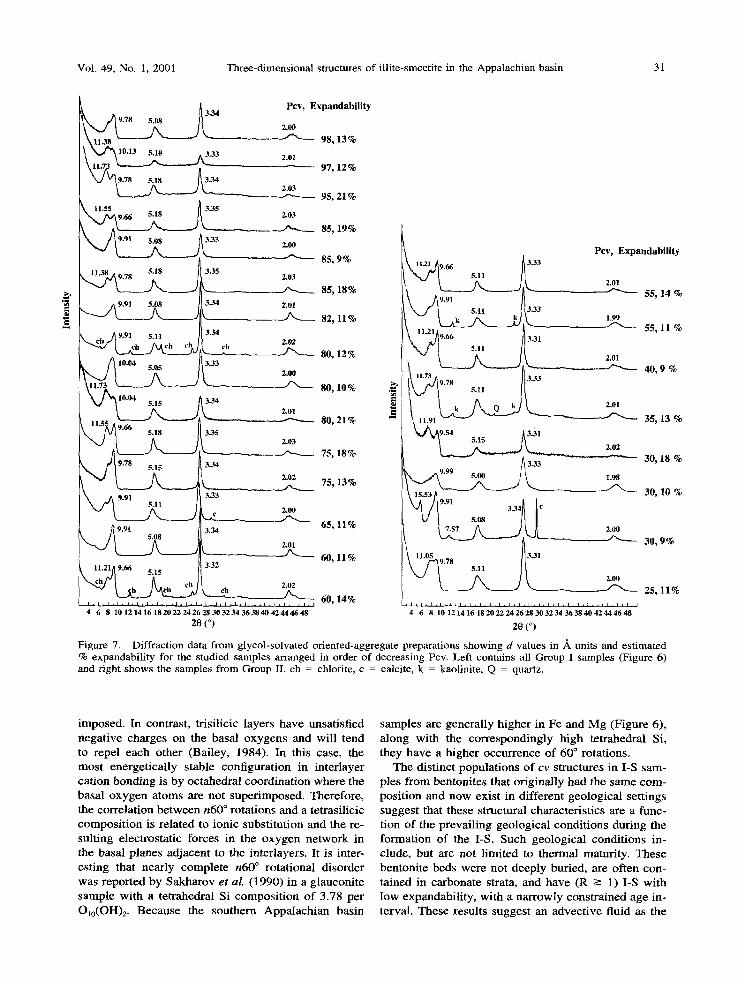
mary of the I-S structural pa ramete r s (Pcv, P0, P60) and I-S expandabi l i ty and Re ichwei t e is p resen ted in Table 2. The di f f ract ion data f rom the o r ien ted-sample prepara t ions are presen ted in F igure 7 a r ranged in or- der of decreas ing cv-layer content .
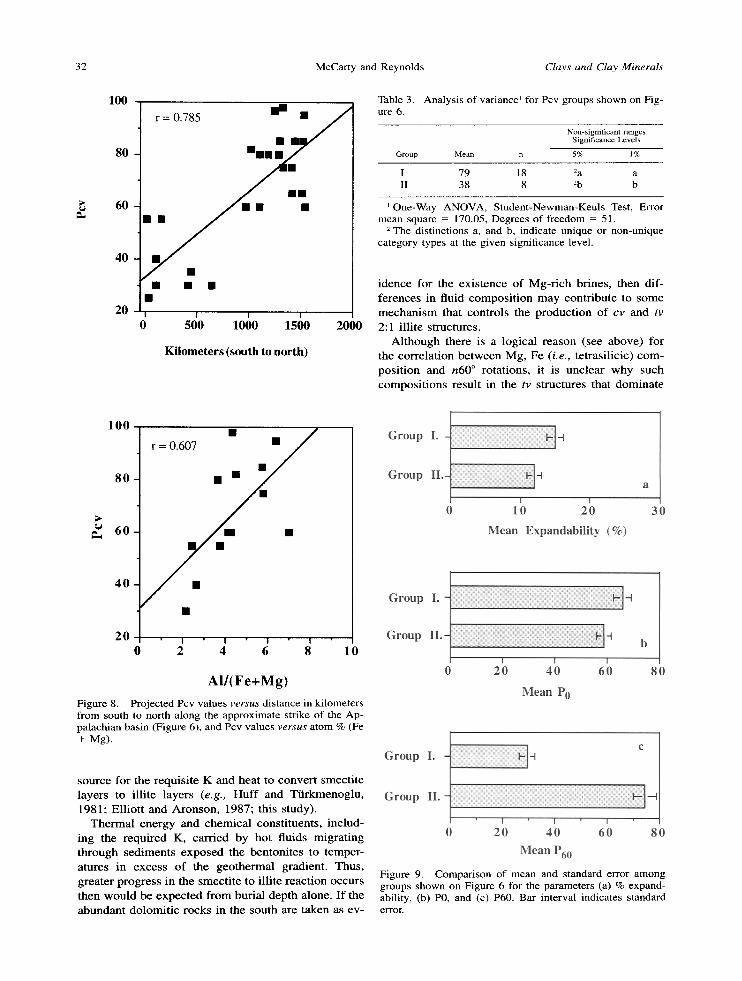
F igure 8 shows a plot of Pcv c o m p a r e d to sample locat ion (dis tance f rom south to nor th) after pro jec t ing the map sample loca t ion to a l ine a long the approxi- mate strike of the basin. Also plot ted on Figure 8 is the quant i ty A1/(Fe + Mg) (a tomic propor t ions) cal- cula ted f rom chemica l analyses of the I-S samples tha t were ana lyzed by X-ray f lorescence (McCar ty and Reynolds , 1995), and compared wi th thei r respec t ive Pcv values. These data show a dis t inct re la t ionship be- tween Pcv and sample loca t ion and be tween Pcv and the A1/(Fe + Mg) rat io in the I-S samples . Table 3 analyzes the var iance of the corre la t ion be tween Pcv and the sample locat ions, w h i c h were d iv ided arbi- trarily into groups for the nor the rn and southern Ap- palachians .
D I S C U S S I O N
Figure 6 and Table 2 show a s ignif icant d i f ference in Pcv for the I-S groups I and II. G r o u p I samples f rom the nor the rn Appa lach i an bas in are domina t ed by cv layers, whereas Group II samples f rom the southern Appa lach i an bas in are r icher in tv layers. These south- ern Appa lach i an fold and thrus t be l t samples are also h igher in M g and Fe and lower in A1 (Figures 6 and 8). The data are not suff iciently comple te to prec lude a con t inuous t rend in Fe + M g (or A1 content ) and Pcv wi th respect to d is tance nor th (Figure 8).
I f M g increases in the oc tahedra l sheet, oc tahedral A1 cor responding ly decreases and the net nega t ive lay- er charge increases wi th Mg, Fe 2+ subst i tut ion. I f tet- rahedral A1 decreases , such a comb ina t i on will lead to an e n d - m e m b e r ce ladoni te s tructure wi th no te t rahe- dral A1 and one octahedra l A1 per O10(OH)2. Thus , the rat io of AI / (Mg + Fe) will be ve ry sens i t ive to tetras- ilicic (1 A1 total, R+[Si4][R2+A1]OI0[OH]z) v e r s u s tr is-
i l icic (3 A1 total, R+[Si3A1][A12]O10[OH]2) compos i - t ions for ill i te samples wi th equal layer charge.
F igure 9a and 9b i l lustrates tha t there are only mino r d i f ferences in the amounts of ro ta t ional d i sorder (P0) wi th in the sample suite. However , the type of rotat ion- al d isorder (P60) is dis t inct ly d i f ferent in the two geo- graphical groups (Figure 9c). Di f fe rences in ro ta t ional d isorder corre la te wi th the oc tahedra l ca t ion compo- s i t ion in the I-S. Rota t ions by n60 ~ are favored in M g and Fe-r ich s t ructures that have min ima l te t rahedral subst i tut ion. In s t ructures wi th low te t rahedra l subst i- tu t ion where layer charge is genera ted in the oc tahe- dral sheet , there is a decrease in the in terac t ion be- tween basal oxygens and the in ter layer ca t ion (Gtiven, 1971; Bailey, 1984). In this case, in ter layer ca t ion bond ing may be of the " o p e n " pr i smat ic type where basal oxygen a toms f rom adjacent layers are super-
Vol. 49, No. 1,2001 Three-dimensional structures of illite-smectite in the Appalachian basin 31
~ i 4 3
.78 5.18 3.
\ 11.55 3.35 ~ 9 ~ 5~8 ~ _ _
" - 3.33
�9 . . 3.35
~ 3.34
3.34 ch,J ~ 9.91 5.11
~ 10.04 5.05 3.33
x.2 " ~ 3.34
11.55 A 2 , ~ ~ ~ " ~ 3.35
~ ~ 3.34
~ _
P e v , E x p a n d a b i l i t y
2.00 98, 13%
2.01 " ~ 97, 12%
2.03
J 3.33 2.00 �9 . c ~ _ j ~ . _ _ _
9.91 508 3.34 65, 11%
~11.21~9.~ 515 / 3.32 60, 11%
�9 . ? 5 . , . ~ 60, 14% I , I , I , I , I
4 6 8 1012141618202224262830323436384042444648 20 (~
- - I " - - - - - - - 95, 21%
2.03 85, 1 9 %
2.00
85, 9 %
2.03 85, 18%
2.01 82, 11%
2.02
�9 ~ 80, 12%
2.00
' ~ 80 , 10%
2.01 80,21%
2.03 75, 18%
2.0~ 75, 13%
P e v , E x p a n d a b i l i t y
~ 3 2.01
55, 14 % \ A TM 5.11 .33 - ~ L / , L 1~9
55, 11% 1121A9.66 [
= - ~ ~ 4 0 , 9 % 1.73 I[ 3.53 ~' I S,ll II
~ k ~ Q ~k ~ k Q k 2.01 11,91 ~ ~ _ , _ ~ r ~ _ ~ ~ 35,13 %
9.54 5.15 A 3-31
~ ' - ' ~ ' ~ " ~ ~ ' ~ " - ~ ' ~ 30,18% 3.33 1.98
30, 9 %
t . 0 5 9, 8 113.31
.oo
A 25, 11% , I . I , I , I , I , l , I , r , I , t , l . I . I . t . [ 1 1 , I , I . t , I , [ L I , I
4 6 8 10 12 14 16 18 20 22 24 26 28 30 32 34 30 38 40 42 44 40 48
20 (~
Figure 7. Diffraction data from glycol-solvated oriented-aggregate preparations showing d values in h, units and estimated % expandability for the studied samples arranged in order of decreasing Pcv. Left contains all Group I samples (Figure 6) and right shows the samples from Group II. ch = chlorite, c = calcite, k = kaolinite, Q = quartz.
imposed. In contrast, trisilicic layers have unsatisfied negat ive charges on the basal oxygens and will tend to repel each other (Bailey, 1984). In this case, the most energetical ly stable configuration in interlayer cation bonding is by octahedral coordination where the basal oxygen atoms are not superimposed. Therefore, the correlation be tween n60 ~ rotations and a tetrasilicic composi t ion is related to ionic substitution and the re- suiting electrostatic forces in the oxygen network in the basal planes adjacent to the interlayers. It is inter- esting that nearly complete n60 ~ rotational disorder was reported by Sakharov e t aL (1990) in a glauconite sample with a tetrahedral Si composi t ion o f 3.78 per O10(OH)2. Because the southern Appalachian basin
samples are general ly higher in Fe and M g (Figure 6), along with the correspondingly high tetrahedral Si, they have a higher occurrence of 600 rotations.
The distinct populations of c v structures in I-S sam- ples f rom bentonites that originally had the same com- posit ion and now exist in different geological settings suggest that these structural characteristics are a func- tion o f the prevai l ing geological condit ions during the formation of the I-S. Such geological condit ions in- clude, but are not l imited to thermal maturity. These bentonite beds were not deeply buried, are often con- tained in carbonate strata, and have (R -> 1) I-S with low expandabiIity, with a narrowly constrained age in- terval. These results suggest an advect ive fluid as the
32 McCarty and Reynolds Clays and Clay Minerals
100 r = 0.785 mm �9 /
80 mm~ mm ""
20 I , ,
0 500 1000 1500 2000
K i l o m e t e r s ( south to north)
Table 3. Analysis of variance j for Pcv groups shown on Fig- ure 6.
Non-significant ranges Significance Levels
Group Mean n 5% 1%
I 79 18 2a a II 38 8 2b b
~One-Way ANOVA, Student-Newman-Keuls Test, Error mean square = 170.05, Degrees of freedom = 51.
z The distinctions a, and b, indicate unique or non-unique category types at the given significance level.
idence for the exis tence of Mg-r ich brines, then dif- ferences in fluid composi t ion may contribute to some mechan i sm that controls the product ion of cv and tv
2:1 illite structures. Al though there is a logical reason (see above) for
the correlation be tween Mg, Fe (i.e., tetrasilicic) com- posi t ion and n60 ~ rotations, it is unclear why such composi t ions result in the tv structures that dominate
1 0 0 /
r = 0.607 i / /
80 i ~
60 / m m �9 m �9
40
20 I I I I
0 2 4 6 8 10
AI/(Fe+Mg) Figure 8. Projected Pcv values versus distance in kilometers from south to north along the approximate strike of the Ap- palachian basin (Figure 6), and Pcv values versus atom % (Fe + Mg).
source for the requisite K and heat to conver t smecti te layers to illite layers (e.g., Huff and Ttirkmenoglu, 1981; Elliott and Aronson, 1987; this study).
Thermal energy and chemical consti tuents, includ- ing the required K, carried by hot fluids migrat ing through sediments exposed the bentoni tes to temper- atures in excess of the geothermal gradient. Thus, greater progress in the smecti te to illite react ion occurs then would be expec ted f rom burial depth alone. I f the abundant dolomit ic rocks in the south are taken as ev-
Figure 9. Comparison of mean and standard error among groups shown on Figure 6 for the parameters (a) % expand- ability, (b) P0, and (c) P60. Bar interval indicates standard error.
Vol. 49, No. 1, 2001 Three-dimensional structures of illite-smectite in the Appalachian basin 33
the southern Appa lach i an Bas in samples or w h y the tr isi l icic compos i t ions adopt the cv structure. McC ar ty and Reyno lds (1995) discuss a poss ib le c ry ta l lograph- ic exp lana t ion for w hy trisil icic compos i t ions favor a cv structure.
There are ma jo r d i f ferences in tectonic processes be tween the cis-dominated samples and trans-domi- ha ted samples go ing f rom nor th to sou th in the bas in (i.e., Groups I and II, F igures 6 and 8). The w-domi- na ted Group II samples are f rom imbr ica ted over thurs t sheets and s t rongly fo lded strata. However , the sam- ples f rom the nor the rn bas in were ob ta ined f rom flat laying and essent ia l ly u n d e f o r m e d strata. Such a dis- t inct ive tec tonic and l i thological d i f ference be t ween sample loca t ion and the obse rved di f ferences in the I- S f rom ben ton i te tha t or ig inal ly had the same bu lk compos i t i on is intr iguing. Unfor tunate ly , the exact phys ica l pa ramete r s and crys ta l chemica l m e c h a n i s m s that cont ro l led the cv-tv charac ter in these samples are not k n o w n at present .
Fluid source
Figure 6 shows that I-S in G r o u p I has average val- ues for Mg, A1, and Fe o f 3.04, 27.29, and 1.46 wt. % compared , respect ively, to 4.08, 23.05, and 3.35 wt. % for the Group II samples . These data together wi th the a b u n d a n c e of do lomi te sugges t tha t the minera l - iz ing fluids in the southern Appa lach i an bas in were r ich in M g rela t ive to the nor thern samples .
Reyno lds (1963) found that P r ecam br i an and Phan- erozoic 1Ma illi tes and glauconi tes , as wel l as crustal igneous rocks have cons i s ten t K / R b ratios be tween 2 4 0 - 2 7 0 . The K /Rb rat io in the I-S descr ibed in this s tudy ranges f rom 333 to 407 (Figure 6). These results sugges t tha t i l l i t izat ion of the K-benton i tes occur red in the p resence of fluids that were deple ted in Rb, com- pared to conna te waters tha t were present dur ing the fo rma t ion o f ill i te in the shales and l imes tones as re- por ted on by Reyno lds (1963). Such a Rb-dep le ted source may reflect the drop in K /Rb that occurs i f the i l l i t izing fluids migra ted over a large distance. Alter- nat ively, admix tu re o f fluids f rom evapora tes m ay also p roduce waters wi th abnorma l ly h igh K /Rb ratios.
C O N C L U S I O N S
The data ob ta ined in this s tudy and prev ious s tudies are cons i s ten t wi th the in terpre ta t ion that i l l i t izat ion in the Appa lach i an bas in ben ton i t e beds was cont ro l led by hea t and K der ived f rom advec t ive fluid flow.
In the A p p a l a c h i a n basin, I-S s t ructure in K-ben ton- ites was cont ro l led by wes tward fluid migra t ion f rom the AUeghan ian orogeny. I-S s t ructures in the southern Appa l ach i an bas in were cont ro l led by fluids r icher in M g than the fluids p reva len t in the north. The struc- tural features of the Mg, Fe- r ich I-S samples f rom the sou thern Appa lach i an bas in K-benton i tes are domina t - ed by tv layers wi th 60 ~ rotat ions. The more Al- r ich
samples conta in cv- layer types wi th 120 ~ rotat ions. The phys ica l pa ramete r s and c rys ta l - chemica l m e c h a - n i sms cont ro l l ing the respec t ive cv-tv layer con ten t in these samples are no t known. At present , d i f ferences in ben ton i te I-S cv-tv layer con ten t in this s tudy are on ly associa ted in some way wi th genera l d i f ferences in the tec tonic processes and l i tho logy or sys tem com- posi t ion, because it is l ikely tha t the ini t ial compos i - t ion of these K-ben ton i tes was similar.
A C K N O W L E D G M E N T S
This research was supported in part by the American Chemical Society Grant 23613-AC2; Dartmouth College Earth Sciences Department, Hanover, New Hampshire; and the United States Geological Survey, Water Resources Divi- sion, Boulder, Colorado. Many of the samples in this study were generously donated by W.C. Elliott, W.D. Huff, R.L. Hay, M. J. Johnnson and A. Chagnon who deserve special thanks. In addition, the writers are indebted to J.W. Delano, J.B. Droste, and S.P. Altaner for supplying other samples. We also thank D.D. Eberl, V.A. Drits, and D.R. Pevear for help and support. The manuscript was significantly improved with the help of B. Lanson, S. Tsipursky, and S. Guggenheim.
R E F E R E N C E S
Bailey, S.W. (1984) Crystal chemistry of the true micas. In Micas, Reviews in Mineralogy, Volume 13, S.W. Bailey, ed., Mineralogical Society of America, Washington, D.C., 13-60.
Bethke, C.M. and Marshak, S. (1990) Brine migrations across North America--the plate tectonics of groundwater. Annual Review Earth Planetary Science, 18, 287-315.
Dennison, J.M. and Textoris, D.A. (1970) Devonian Tioga tuff in northeastern United States. Bulletin Volcanogenique, 34, 289-293.
Drits, V.A. and McCarty, D.K. (1996) The nature of diffrac- tion effects from illite and illite-smectite consisting of in- terstratified trans-vacant and cis-vacant 2:1 layers: A semi- quantitative technique for determination of layer-type con- tent. American Mineralogist, 81, 852-863.
Drits, V.A. and Tchoubar, C. (1990) X-ray Diffraction by Dis- ordered Lamellar Structures. Springer-Verlag, New York, 371 pp.
Drits, V.A., Plan~on B.A., Sakharov, B.A., Besson, G., Tsi- pursky, S.I., and Tchoubar, C. (1984) Diffraction effects calculated for structural models of K-saturated montmoril- lonite containing different types of defects. Clay Minerals, 19, 541-561.
Drits, V.A., Weber, E, Salyn, A.L., and Tsipursky, S.I. (1993) X-ray identification of one-layer illite varieties: Application to the study of illites around uranium deposits of Canada. Clays and Clay Minerals. 41, 389-398.
Drits, V.A., Lindgreen, H., Salyn, A.L., Ylagan, R., and McCarty, D.K. (1998) Semiquantitative determination of trans-vacant and cis-vacant 2:1 layers in illites and illite- smectites by thermal analysis and X-ray diffraction. Amer- ican Mineralogist, 83~ 1188-1198.
Droste, J.B., and Vitiliano, C.J. (1973) Tioga bentonite (Mid- dle Ordovician) of Indiana. Clays and Clay Minerals, 21, 9-13.
Elliott, W.C. and Aronson, J.L. (1987) Alleghanian episode of K-bentonite illitization in the southern Appalachian Ba- sin. Geology, 15, 735-739.
Elliott, W.C. and Aronson, J.L. (1993) The timing and extent of illite formation in Ordovician K-bentonites at the Cin-
34 McCarty and Reynolds Clays and Clay Minerals
cinnati Arch, Nashville Dome and north-eastern Illinois ba- sin. Basin Research, 5, 125-135.
Eberl, D.D. and Hower, J. (1979) Kinetics of illite formation. GeologicalSociety of America Bulletin, 87, 1326-1330.
Eberl, D.D., Srodofi, J., Lee, M., Nadeau, P.H., and Northrup, H.R. (1987) Sericite from the Silverton caldera, Colorado: Correlation among structure, composition, origin, and par- t ide thickness. American Mineralogist, 72, 914-934.
Guthrie, G.D., Jr. and Reynolds, R.C., Jr. (1998) A coherent TEM- and XRD-description of mixed-layer illite/smectite. The Canadian Mineralogist, 36, 1421-1434.
Giiven, N (1971) Structural factors controlling stacking se- quences in dioctahedral micas. Clays and Clay Minerals, 134, 159-165.
Harris, A.G. (1979) Conodont color alteration, an organo- mineral metamorphic index and its application to Appala- chian Basin geology. In Aspects ofDiagenesis, PA. Scholle and P.R. Schluger, eds., Society of Economic Paleontolo- gists and Mineralogists Special Publication 26, Tulsa, Oklahoma, 3-16.
Hearn, P.E, Sutter, J.E, and Belkin, H.E. (1987) Evidence for Late-Paleozoic brine migration in Cambrian carbonate rocks of the central and southern Appalachians: Implica- tions for Mississippi Valley-type sulfide mineralization. Geochimica et Cosmochimica Acta, 51, 1323-1334.
Huang, W.L., Longo, J.M., and Pevear, D.R. (1993) An ex- perimentally derived kinetic model for smectite-to-illite conversion and its use as a geothermometer. Clays and Clay Minerals, 41, 162-177.
Huff, W.D. and Ttirkmenoglu, A.G. (1981) Chemical char- acteristics and origin of Ordovician K-bentonites along the Cincinnati Arch. Clays and Clay Minerals, 29, 113-123.
Johnnson, M.J. (1984) The thermal and burial history of south central New York: Evidence from vitrinite reflectance, clay mineral diagenesis and fission track dating of apatite and zircon. Masters thesis, Dartmouth College, Hanover, New Hampshire.
Kay, G.M. (1935) Distribution of Ordovician altered volcanic materials and related clays. Bulletin o f the Geological So- ciety o f America, 46, 225-244.
Kolata, D.R., Frost, J.K., and Huff, W.D. (1986) K-Bentonites o f the Ordovician Decorah Subgroup, Upper Mississippi Valley: Correlation by Chemical Fingerprinting. Illinois State Geological Survey, Circular 537, 30 pp.
Leach, D.L. and Rowan, E.L. (1986) Genetic link between Ouachita foldbelt tectonism and Mississippi Valley-type lead-zinc deposits of the Ozarks. Geology, 14, 931-936.
McCarty, D.K. (1993) The three-dimensional crystal structure of rotationally disordered illite-smectite from Devonian and Ordovician K-bentonites in and around the Appalachian ba- sin. Ph.D. thesis, Dartmouth College, Hanover, New Hamp- shire.
McCarty, D.K. and Reynolds, R.C. (1995) Rotationally dis- ordered illite-smectite in Paleozoic K-bentonites. Clays and Clay Minerals, 43, 271-284.
Mrring, J. and Oberlin, A. (1967) Electron-optical study of smectites. Clays and Clay Minerals, 17th National Confer- ence, Pergamon Press, 3-25.
Milici, R.C. and de Witt, W., Jr. (1988) The Appalachian Ba- sin. In The Geology o f North America, Volume D-2, Sedi- mentary Cover-North American Craton: U.S.. The Geolog- ical Society of America, Boulder, Colorado, 427-469.
Moore, D.M. and Reynolds, R.C., Jr. (1997) X-Ray Diffrac- tion and the Identification and Analysis of Clay Minerals, 2nd edition. Oxford University Press, New York, 270-276.
Nadeau, P.H., Wilson, M.J., McHardy, W_J., and Tait, J. (1984) Interparticle diffraction: A new concept for intersta- tiffed clays. Clay Minerals, 19, 757-769.
Oliver, J. (1986) Fluids expelled tectonically from orogenic belts: Their role in hydrocarbon migration and other geo- logic phenomena. Geology, 14, 99-102.
Planqon, A. (1981) Diffraction by layer structures containing different kinds of layers and stacking faults. Journal of Ap- plied Crystallography, 14, 300-304.
Planqon, A. and Tchoubar, C. (1977a) Determination of struc- tural defects in phyllosilicates by X-ray powder diffrac- tion--I. Principle of calculation of the diffraction phenom- enon. Clays and Clay Minerals, 25, 430-435.
Planqon, A. and Tchoubar, C. (1977b) Determination of struc- tural defects in phytlosilicates by X-ray powder diffrac- tion--II. Nature and proportion of defects in natural kao- linite. Clays and Clay Minerals, 25, 436-450.
Plan~on, A., Giese, R.E, and Snyder, R (1988) The Hinckley index for kaolinites. Clay Minerals, 23, 249-260.
Pytte, A.M. and Reynolds, R.C., Jr. (1989) The thermal trans- formation of smectite to illite. In Thermal History o f Sed- imentary Basins, Methods and Case Histories, N.D. Naeser and T.H. McCulloh, eds., Springer-Verlag, New York, 133- 140.
Reynolds, R.C. (1963) Potassium-rubidium ratios and poly- morphism in illites and microclines from the clay size frac- tions of Proterozoic carbonate rocks. Geochimica et Cos- mochimica Acta, 27, 1097-1112.
Reynolds, R.C. (1985) NEWMOD: A Computer Program For The Calculation Of One-dimensional Diffraction Patterns of Mixed-layered Clays. R.C. Reynolds, 8 Brook Rd., Han- over, New Hampshire.
Reynolds, R.C. (1992) X-ray diffraction studies of illite- smectite from rocks, < 1 p,m randomly oriented powders, and < 1 Ixm oriented powder aggregates: The absence of laboratory-induced artifacts. Clays and Clay Minerals, 40, 387-396.
Reynolds, R.C. (1993) Three-dimensional powder X-ray dif- fraction from disordered illite: Simulation and interpreta- tion of the diffraction patterns. In CMS Workshop Lectures, Volume 5, Computer Applications to X-ray Powder Dif-
fraction Analysis of Clay Minerals, R.C. Reynolds, Jr. and J.R. Walker, eds., The Clay Minerals Society, Boulder, Col- orado, 43-77.
Reynolds, R.C. (1994) Wildfire: A Computer Program For The Calculation Of Three-dimensional Powder X-ray Dif- fraction Patterns for Mica Polytypes and their Disordered Variations. R.C. Reynolds, 8 Brook Rd., Hanover, New Hampshire.
Reynolds, R.C. and Thomson, C.H. (1993) Illite from the Potsdam Sandstone of New York: A probable noncentro- symmetric mica structure. Clays and Clay Minerals, 41, 66-72.
Roden, M.K., Miller, D.S., Elliott, W.C., and Aronson, J.L. (1992) The thermal history of the distal margin and interior of the southern Appalachian basin from combined fission- track and K/Ar studies of K-bentonites. Abstract, 27th An- nual Northeastern Section of the Geological Society o f America Meeting 24, no 3, 49.
Roden, M.K., Elliott, W.C., Aronson, J.L., and Miller, D.S. (1993) A comparison of fission-track ages of apatite and zircon to the K/Ar ages of illite-smectite (I-S) from Ordo- vician K-bentonites, southern Appalachian basin. Journal of Geology, 101, 633-641.
Sakharov, B.A., Besson, G., Drits, V.A., Kamenava, M.Yu., Salyn, A.L., and Smoliar, B.B. (1990) X-ray study of the nature of stacking faults in the structure of glauconites. Clay Minerals, 25, 419-435.
Schedl, A., McCabe, C., Montanez, I.E, Fullagar, P.D., and Valley, J.W. (1992) Alleghanian regional diagenesis: A re- sponse to the migration of modified metamorphic fluids

Vol. 49, No. 1, 2001 Three-dimensional structures of illite-smectite in the Appalachian basin 35
derived from beneath the Blue Ridge-Piedmont thrust sheet. Journal o f Geology, 100, 339-352.
Thomas, W.A. (1988) The Black Warrior Basin. In The Ge- ology o f North America, Volume D-2, Sedimentary Cover-- North American Craton: U.S., The Geological Society of America, Boulder, Colorado, 471-492.
Tsipursky, S.I. and Drits, V.A. (1984) The distribution of oc- tahedral cations in the 2:1 layers of dioctahedral smectites studied by oblique-texture electron diffraction. Clay Min- erals, 19, 177-193.
Viets, J.G., Rowan, E.L., and Leach, D.L. (1984) Composi- tion of fluids extracted from sphalerite, galena, and dolo- mite in Mississippi Valley-type deposits in the mid-conti- nent: Implications for the origin of the fluid. Geological Society o f America Abstracts with Programs 16, 682.
E-mail of corresponding author: mccardkl @texaco.com (Received 20 December 1999; accepted 2 August 2000;
Ms. 412; A.E. Stephen Altaner)