Embed Size (px)
Citation preview
Progress In Electromagnetics Research C, Vol. 8, 13–25, 2009
THREE-DIMENSIONAL IMAGE OF THE HUMAN TOOTHBASED ON OPTICAL COHERENCE TOMOGRAPHY
Y. Liang, X. S. Yao, and S. Lan
Key Laboratory of Opto-electronics Informationand Technical Science of MOECollege of Precision Instrument & Opto-electronics EngineeringTianjin UniversityTianjin 300072, China
H. Yao
Research Center at Tianjin Stomatological HospitalTianjin 300041, China
T. Liu, M. Wan, and Y. Liang
Key Laboratory of Opto-electronics Informationand Technical Science of MOECollege of Precision Instrument & Opto-electronics EngineeringTianjin UniversityTianjin 300072, China
Y. Li
Research Center at Tianjin Stomatological HospitalTianjin 300041, China
B. Shi
Key Laboratory of Opto-electronics Informationand Technical Science of MOECollege of Precision Instrument & Opto-electronics EngineeringTianjin UniversityTianjin 300072, China
G. Wang
Research Center at Tianjin Stomatological HospitalTianjin 300041, China
Corresponding author: Y. Liang (liangyan1120 [email protected]).
14 Liang et al.
Abstract—A method of acquiring clear three-dimensional image ofhuman tooth in vitro, which is based on optical coherence tomography,is described. The background noise of the cross-section imageis eliminated by image preprocessing algorithms, then the three-dimensional image is reconstructed by ray-casting algorithm and givesthe whole view of dental crown which contains dentin and enamel. Aplane can be used to cut the tooth interactively to observe the innertissue. This image is convenient for doctors to locate lesions and hasa great potential for the clinical diagnosis of early dental caries.
1. INTRODUCTION
Dental health is an important part of human health. Traditionally,dentists evaluate the oral health of a patient through three mainmethods: visual/tactile examination, periodontal probing, andradiographic imaging. The method of the probes can be painful,and the diagnosis is influenced by variations on insertion force,inflammatory statues of tissue, diameter of probe tips, and anatomicaltooth contours. Radiographies have several limitations in identifyingperiodontal diseases as they provide no information about soft issue.Also they are two dimensional, and finding the precise position ofa caries lesion is very difficult or even impossible and harmful topatients [1, 2]. Optical coherence tomography (OCT) has attractedextensive research as a non-contact high resolution technique forobtaining cross-section images of the internal microstructure of livingtissues. Since Huang et al. [3] obtained the first OCT image of the tinystructure of human retina in 1991, many research groups have obtainedclear OCT images of both normal and decayed dental tissues [4–8, 18, 19] and proved its usefulness in diagnosis.
But the dental images of those researches [4–8, 18] are basicallytwo-dimensional, which is called B-scan (tomograms). These B-scansare obtained at sites presumptively chosen during the examinations.Obviously, more comprehensive information is desirable if we wantto detect disease at early stage or monitor response to therapy inclinical practice. The ability to acquire three-dimensional or volumetricinformation is attractive because it can provide complete structuralinformation [20]. The three-dimensional image in [1] is just the dentalmicrostructure, which is inconvenient in clinical practice, becausedoctors need to locate lesions from the whole view of the teeth.Another different application is the three-dimensional recording inbiological tissues for personal identification [21].
The goal of this work is to acquire three-dimensional image
Progress In Electromagnetics Research C, Vol. 8, 2009 15
of human tooth based on all-fiber OCT system. It contains morecomprehensive structure information than the cross-section imageand is convenient for doctors to locate lesions exactly. It gives thewhole view of dental crown and enamel, and dentin can be seenclearly. The three-dimensional image is reconstructed by ray-castingalgorithm. Ray-casting is a volume rendering method, which omits theintermediate geometric representation and involves direct projection ofthe entire 3D dataset onto a 2D display [14]. The image preprocessingmethods are chosen to eliminate the background noise of the cross-section image. A cutting plane is interactively used to cut the toothtissue for observing the inner structure.
2. THE ALL-FIBER OCT SYSTEM
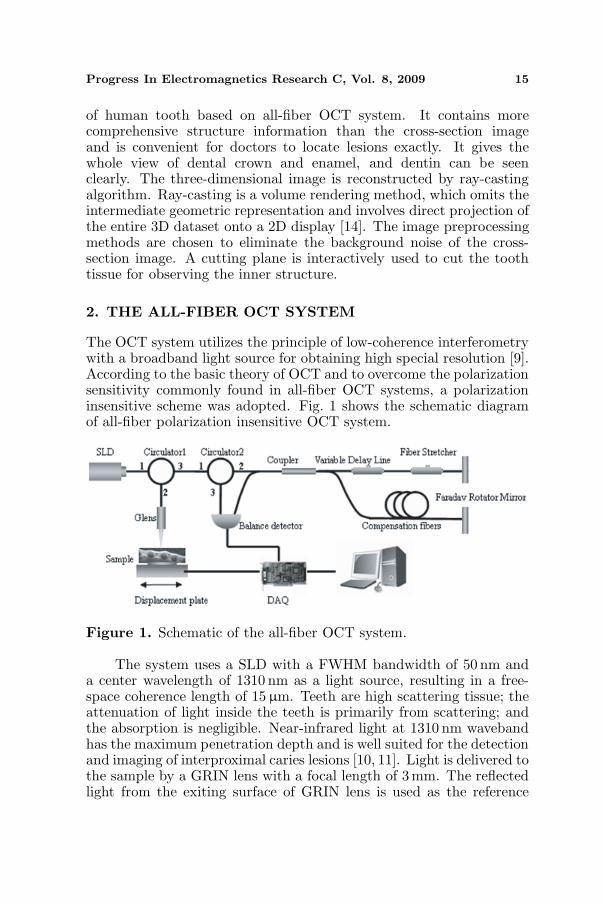
The OCT system utilizes the principle of low-coherence interferometrywith a broadband light source for obtaining high special resolution [9].According to the basic theory of OCT and to overcome the polarizationsensitivity commonly found in all-fiber OCT systems, a polarizationinsensitive scheme was adopted. Fig. 1 shows the schematic diagramof all-fiber polarization insensitive OCT system.
Figure 1. Schematic of the all-fiber OCT system.
The system uses a SLD with a FWHM bandwidth of 50 nm anda center wavelength of 1310 nm as a light source, resulting in a free-space coherence length of 15 µm. Teeth are high scattering tissue; theattenuation of light inside the teeth is primarily from scattering; andthe absorption is negligible. Near-infrared light at 1310 nm wavebandhas the maximum penetration depth and is well suited for the detectionand imaging of interproximal caries lesions [10, 11]. Light is delivered tothe sample by a GRIN lens with a focal length of 3mm. The reflectedlight from the exiting surface of GRIN lens is used as the reference
16 Liang et al.
signal. One arm of the interferometer consists of a fiber stretcherbased on scanning optical delay line with 3mm delay range and avariable delay line (VDL) for matching the optical length between thetwo interferometer arms. A Faraday rotator mirror is placed at eachend of the interferometer arms for eliminating polarization fluctuationsin the single mode fiber. Note that such an arrangement completelyeliminates polarization sensitivity, even when the sample arm and theinterferometer arms are perturbed. The balanced detector receivesthe interference signal, and it can eliminate the common mode noisesand the DC signal. The DAQ card collects the data to the computer.A two-dimensional displacement stage driven by the stepper motor isused for the transverse scans of the sample.
3. THE CROSS-SECTION IMAGE OF HUMAN TOOTH
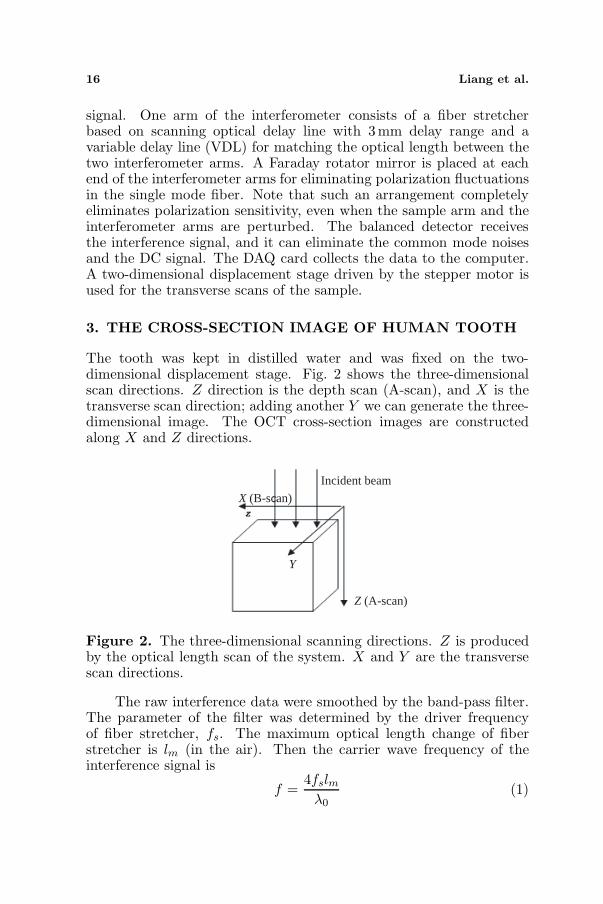
The tooth was kept in distilled water and was fixed on the two-dimensional displacement stage. Fig. 2 shows the three-dimensionalscan directions. Z direction is the depth scan (A-scan), and X is thetransverse scan direction; adding another Y we can generate the three-dimensional image. The OCT cross-section images are constructedalong X and Z directions.
Incident beam
Z (A-scan)
Y
X (B-scan)
Figure 2. The three-dimensional scanning directions. Z is producedby the optical length scan of the system. X and Y are the transversescan directions.
The raw interference data were smoothed by the band-pass filter.The parameter of the filter was determined by the driver frequencyof fiber stretcher, fs. The maximum optical length change of fiberstretcher is lm (in the air). Then the carrier wave frequency of theinterference signal is
f =4fslm
λ0(1)
Progress In Electromagnetics Research C, Vol. 8, 2009 17
where λ0 is the center wave length of broadband light source. Theinterference signal bandwidth is [12]
Δf =Δλ
λ0f (2)
where Δλ is the bandwidth of the light source. We extracted theinterference signal envelope based on Hilbert transformation.
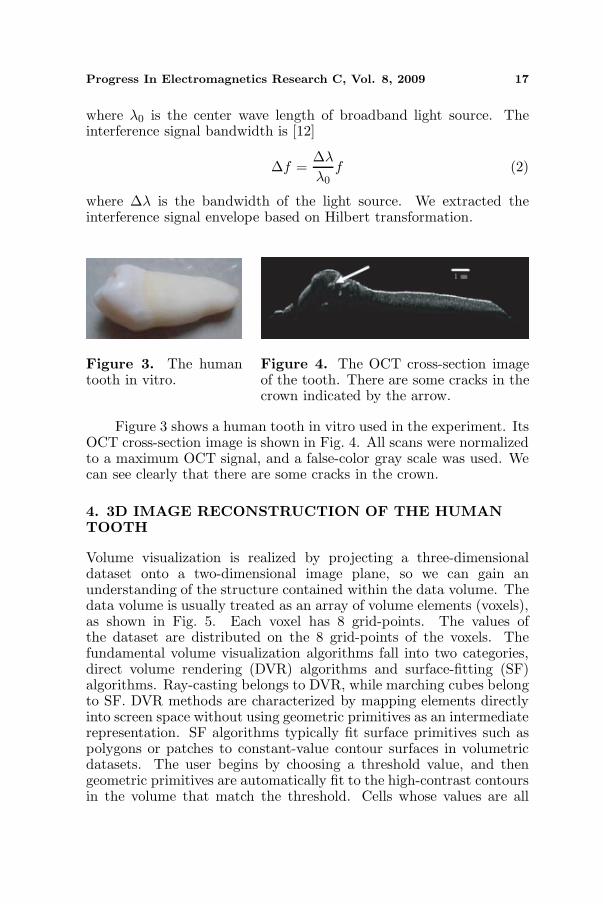
Figure 3. The humantooth in vitro.
Figure 4. The OCT cross-section imageof the tooth. There are some cracks in thecrown indicated by the arrow.
Figure 3 shows a human tooth in vitro used in the experiment. ItsOCT cross-section image is shown in Fig. 4. All scans were normalizedto a maximum OCT signal, and a false-color gray scale was used. Wecan see clearly that there are some cracks in the crown.
4. 3D IMAGE RECONSTRUCTION OF THE HUMANTOOTH
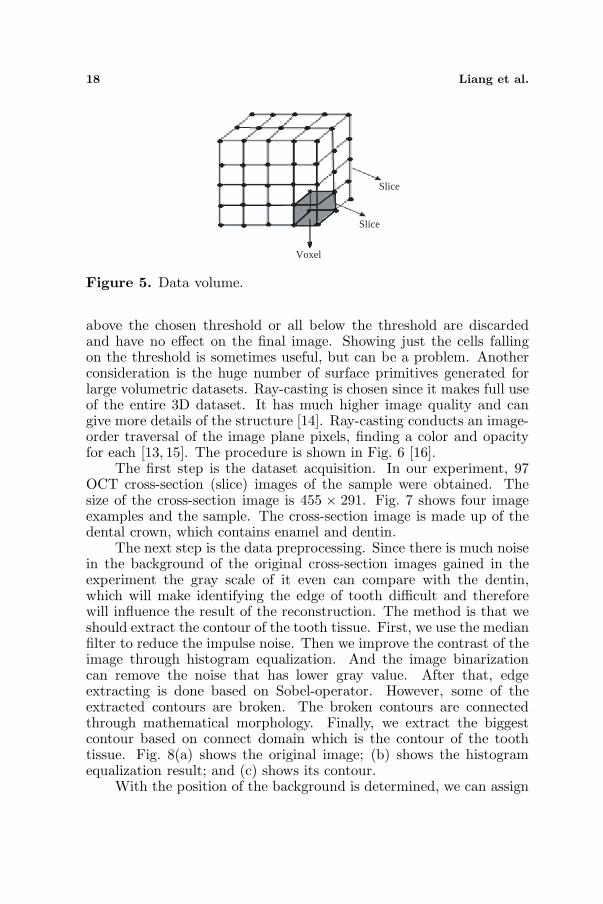
Volume visualization is realized by projecting a three-dimensionaldataset onto a two-dimensional image plane, so we can gain anunderstanding of the structure contained within the data volume. Thedata volume is usually treated as an array of volume elements (voxels),as shown in Fig. 5. Each voxel has 8 grid-points. The values ofthe dataset are distributed on the 8 grid-points of the voxels. Thefundamental volume visualization algorithms fall into two categories,direct volume rendering (DVR) algorithms and surface-fitting (SF)algorithms. Ray-casting belongs to DVR, while marching cubes belongto SF. DVR methods are characterized by mapping elements directlyinto screen space without using geometric primitives as an intermediaterepresentation. SF algorithms typically fit surface primitives such aspolygons or patches to constant-value contour surfaces in volumetricdatasets. The user begins by choosing a threshold value, and thengeometric primitives are automatically fit to the high-contrast contoursin the volume that match the threshold. Cells whose values are all
18 Liang et al.
Slice
Voxel
Slice
Figure 5. Data volume.
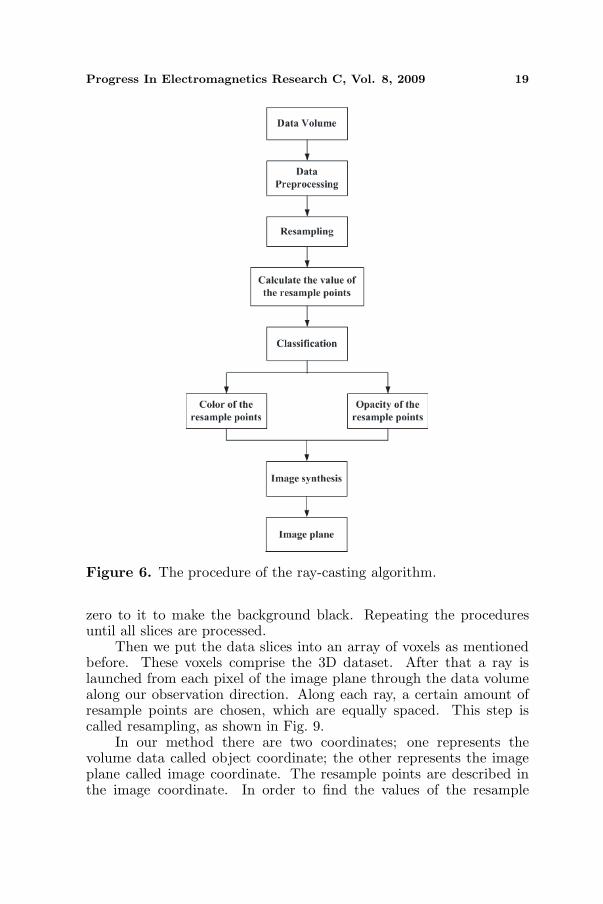
above the chosen threshold or all below the threshold are discardedand have no effect on the final image. Showing just the cells fallingon the threshold is sometimes useful, but can be a problem. Anotherconsideration is the huge number of surface primitives generated forlarge volumetric datasets. Ray-casting is chosen since it makes full useof the entire 3D dataset. It has much higher image quality and cangive more details of the structure [14]. Ray-casting conducts an image-order traversal of the image plane pixels, finding a color and opacityfor each [13, 15]. The procedure is shown in Fig. 6 [16].
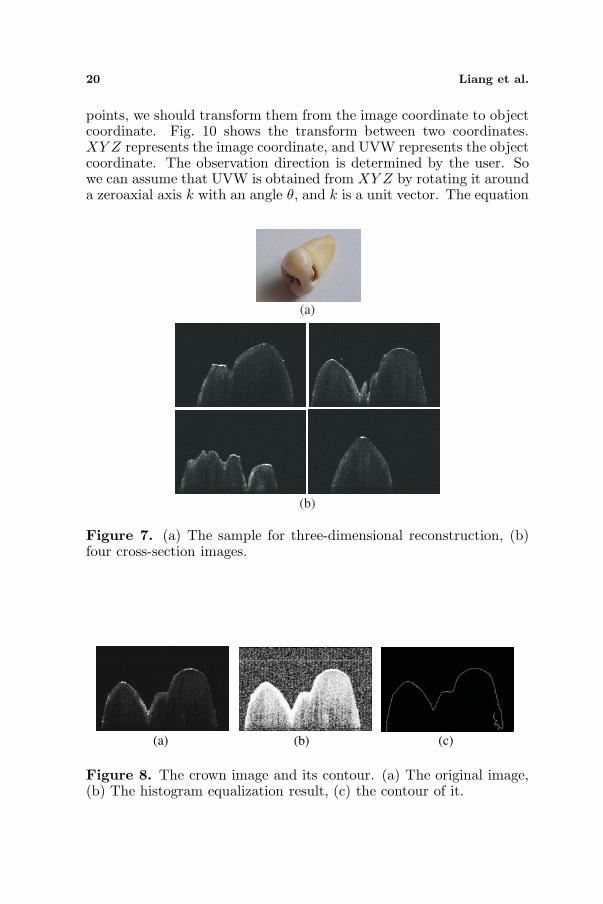
The first step is the dataset acquisition. In our experiment, 97OCT cross-section (slice) images of the sample were obtained. Thesize of the cross-section image is 455 × 291. Fig. 7 shows four imageexamples and the sample. The cross-section image is made up of thedental crown, which contains enamel and dentin.
The next step is the data preprocessing. Since there is much noisein the background of the original cross-section images gained in theexperiment the gray scale of it even can compare with the dentin,which will make identifying the edge of tooth difficult and thereforewill influence the result of the reconstruction. The method is that weshould extract the contour of the tooth tissue. First, we use the medianfilter to reduce the impulse noise. Then we improve the contrast of theimage through histogram equalization. And the image binarizationcan remove the noise that has lower gray value. After that, edgeextracting is done based on Sobel-operator. However, some of theextracted contours are broken. The broken contours are connectedthrough mathematical morphology. Finally, we extract the biggestcontour based on connect domain which is the contour of the toothtissue. Fig. 8(a) shows the original image; (b) shows the histogramequalization result; and (c) shows its contour.
With the position of the background is determined, we can assign
Progress In Electromagnetics Research C, Vol. 8, 2009 19
Figure 6. The procedure of the ray-casting algorithm.
zero to it to make the background black. Repeating the proceduresuntil all slices are processed.
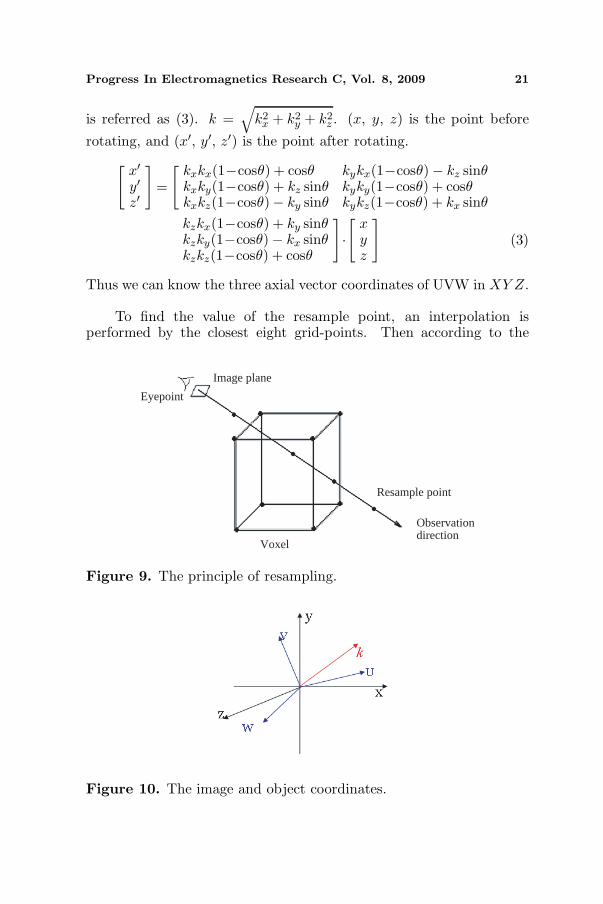
Then we put the data slices into an array of voxels as mentionedbefore. These voxels comprise the 3D dataset. After that a ray islaunched from each pixel of the image plane through the data volumealong our observation direction. Along each ray, a certain amount ofresample points are chosen, which are equally spaced. This step iscalled resampling, as shown in Fig. 9.
In our method there are two coordinates; one represents thevolume data called object coordinate; the other represents the imageplane called image coordinate. The resample points are described inthe image coordinate. In order to find the values of the resample
20 Liang et al.
points, we should transform them from the image coordinate to objectcoordinate. Fig. 10 shows the transform between two coordinates.XY Z represents the image coordinate, and UVW represents the objectcoordinate. The observation direction is determined by the user. Sowe can assume that UVW is obtained from XY Z by rotating it arounda zeroaxial axis k with an angle θ, and k is a unit vector. The equation
(a)
(b)
Figure 7. (a) The sample for three-dimensional reconstruction, (b)four cross-section images.
(a) (b) (c)
Figure 8. The crown image and its contour. (a) The original image,(b) The histogram equalization result, (c) the contour of it.
Progress In Electromagnetics Research C, Vol. 8, 2009 21
is referred as (3). k =√
k2x + k2
y + k2z . (x, y, z) is the point before
rotating, and (x′, y′, z′) is the point after rotating.[x′y′z′
]=
[kxkx(1−cosθ) + cosθ kykx(1−cosθ) − kz sinθkxky(1−cosθ) + kz sinθ kyky(1−cosθ) + cosθkxkz(1−cosθ)− ky sinθ kykz(1−cosθ) + kx sinθ
kzkx(1−cosθ) + ky sinθkzky(1−cosθ) − kx sinθkzkz(1−cosθ) + cosθ
]·[
xyz
](3)
Thus we can know the three axial vector coordinates of UVW in XY Z.
To find the value of the resample point, an interpolation isperformed by the closest eight grid-points. Then according to the
Image plane
Eyepoint
Resample point
Observationdirection
Voxel
Figure 9. The principle of resampling.
Figure 10. The image and object coordinates.
22 Liang et al.
Figure 11. The front-to-back image synthesis.
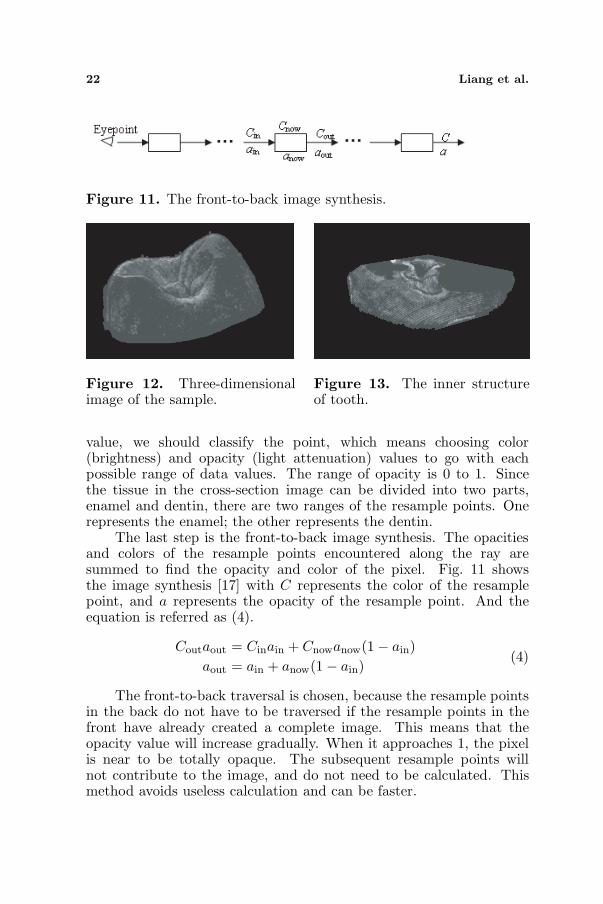
Figure 12. Three-dimensionalimage of the sample.
Figure 13. The inner structureof tooth.
value, we should classify the point, which means choosing color(brightness) and opacity (light attenuation) values to go with eachpossible range of data values. The range of opacity is 0 to 1. Sincethe tissue in the cross-section image can be divided into two parts,enamel and dentin, there are two ranges of the resample points. Onerepresents the enamel; the other represents the dentin.
The last step is the front-to-back image synthesis. The opacitiesand colors of the resample points encountered along the ray aresummed to find the opacity and color of the pixel. Fig. 11 showsthe image synthesis [17] with C represents the color of the resamplepoint, and a represents the opacity of the resample point. And theequation is referred as (4).
Coutaout = Cinain + Cnowanow(1 − ain)aout = ain + anow(1 − ain)
(4)
The front-to-back traversal is chosen, because the resample pointsin the back do not have to be traversed if the resample points in thefront have already created a complete image. This means that theopacity value will increase gradually. When it approaches 1, the pixelis near to be totally opaque. The subsequent resample points willnot contribute to the image, and do not need to be calculated. Thismethod avoids useless calculation and can be faster.
Progress In Electromagnetics Research C, Vol. 8, 2009 23
Each pixel of the image plane can be shown with its color andopacity. Then the three-dimensional image is reconstructed.
The result is shown in Fig. 12. It gives the whole view of dentalcrown. The brighter part represents the enamel, and the darker partis the dentin.
In order to observe the inner tissue interactively, a cutting planedetermined by the mouse is used to cut the tooth. The resample pointsabove the cutting plane need not to be calculated. The result is shownin Fig. 13. The middle of the image is enamel, which is brighter.
5. DISCUSSION AND CONCLUSION
We developed a method to acquire three-dimensional image of thehuman tooth in vitro based on all-fiber OCT system. The image wasreconstructed by ray-casting algorithm. There are many advantages ofthe algorithm. The image shows the entire dataset, not just a collectionof thin surfaces as in SF, and its quality is much higher. It can alsoshow the details of the structure. Ray-casting can be parallelized atpixel level since rays from all the pixels in the image plane can becast independently. The disadvantages of ray-casting are that it isslower than SF and the entire dataset must be traversed each time animage is rendered. In the experiment, three-dimensional image wasreconstructed using 97 cross-section images. The size of the cross-section image is 455 × 291 pixels. The depth scan (A-scan) of theOCT system is 3 mm, and the transverse scan (B-scan) is 7.5 mm.So the cross-section images are large enough to observe the dentalcrown tissue. The three-dimensional image, Fig. 12, clearly shows thegeneral view of dental crown, including enamel and dentin. It will beconvenient for doctors to locate lesions exactly. Before reconstruction,we did the image processing to eliminate the background noise of thecross-section images. The front-to-back image synthesis can acceleratethe calculation. We also provided an interactive function, i.e., a cuttingplane can be used to cut the tooth tissue for observing the innerstructure, as shown in Fig. 13. This method will be of great benefit tothe clinical diagnosis of early dental caries.
ACKNOWLEDGMENT
The work is supported by National Nature Science Foundation of Chinaunder Grant No. 30770597 and New Faculty Fund for the DoctoralProgram of Higher EducationMinistry of Education of China (grant200800561020).
24 Liang et al.
REFERENCES
1. Freitas, A. Z., D. M. Zezell, and N. D. Vieira, Jr., “Imaging carioushuman dental tissue with optical coherence tomography,” Journalof Applied Physis, Vol. 99, No. 024906, 1–6, 2006.
2. Mayfield, L., G. Bratthall, and R. Attstrom, “Periodontalprobe precision using four different periodontal probes,” J. Clin.Periodontology, Vol. 23, No. 76, 76–82, 1996.
3. Huang, D., C. P. Swanson, J. S. Lin, et al., “Optical coherencetomography,” Science, Vol. 254, No. 5035, 178–1181, 1991.
4. Colston, B. W., M. J. Everett, U. S. Sathyam, et al., “Imagingof the oral cavity using optical coherence tomography,” Monogr.Oral Sci., Vol. 17, 32–55, 2000.
5. Baumgartner, A., S. Dichtl, C. K. Hitzenberger, et al.,“Polarization-sensitive optical coherence tomography of dentalstructures,” Caries Res., Vol. 34, No. 1, 59–69, 2000.
6. Amaechi, B. T., S. M. Higham, A. G. Podoleanu, et al., “Useof optical coherence tomography for assessment of dental caries:Quantitative procedure,” J. Oral Rehabil., Vol. 28, No. 12, 1092–1093, 2001.
7. Closton, B. W., Jr., M. J. Everett, et al., “Imaging of hard-and soft-tissue structure in the oral cavity by optical coherencetomography,” Applied Optics, Vol. 37, No. 16, 3582–3585, 1998.
8. Colston, B. W., Jr., U. S. Sathyam, et al., “Dental OCT,” OpticsExpress, Vol. 3, No. 6, 230–238, 1998.
9. Schmitt, J. M., “Optical coherence tomography (OCT): Areview,” IEEE Journal of Selected Topics in Quantum Electronics,Vol. 5, No. 4, 1205–1215, 1999.
10. Jones, R. S., G. D. Huynh, G. C. Jones, et al., “Near infraredtransillumination at 1310 nm for the imaging of early dentaldecay,” Optics Express, Vol. 11, No. 18, 2259–2265, 2003.
11. Fried, D., R. E. Glena, J. D. B. Featherstone, et al., “Nature oflight scattering in dental enamel and dentin at visible and near-infrared wavelengths,” Applied Optics, Vol. 34, No. 7, 1278–1285,1995.
12. Yun, S. H., G. J. Tearney, J. F. Boer, et al., “High-speed opticalfrequency-domain imaging,” Optics Express, Vol. 11, No. 22,2953–2963, 2003.
13. Levoy, M., “Display of surfaces from volume data,” IEEEComputer Graphics and Application, Vol. 8, No. 3, 29–37, 1988.
14. Elvins, T. T., “A survey of algorithms for volume visualization,”
Progress In Electromagnetics Research C, Vol. 8, 2009 25
Computer Graphics, Vol. 26, No. 3, 194–201, 1992.15. Ray, H., H. Pfister, D. Silver, et al., “Ray casting architectures
for volume,” IEEE Transactions on Visualization and ComputerGraphics, 1999.
16. Tang, Z. and J. Yuan, “Visualization of 3D data sets withimage order volume rendering techniques,” Chinese J. Computers,Vol. 17, No. 11, 801–808, 1994.
17. Levoy, M., “Efficient ray tracing of volume data,” ACMTransactions on Graphics, Vol. 9, No. 3, 245–261, 1990.
18. Chen, Y., L. Otis, D. Piao, et al., “Characterization of dentin,enamel, and carious lesions by a polarization-sensitive opticalcoherence tomography system,” Applied Optics, Vol. 44, No. 11,2041–2048, 2005.
19. Jones, R. S., C. L. Darling, J. D. B. Featherstone, et al., “Imagingartificial caries on the occlusal surfaces with polarization-sensitiveoptical coherence tomography,” Caries Res., Vol. 40, 81–89, 2006.
20. Drexler, W. and J. G. Fujimoto, “State-of-the-art retinal opticalcoherence tomography,” Progress in Retinal and Eye Research,Vol. 27, No. 1, 45–88, 2008.
21. Hayasaki, Y., “Holographic femtosecond laser processing andthree-dimensional recording in biological tissues,” Progress InElectromagnetics Research Letters, Vol. 2, 155–123, 2008.