Embed Size (px)
Citation preview
HAL Id: hal-00614338https://hal.archives-ouvertes.fr/hal-00614338
Submitted on 11 Aug 2011
HAL is a multi-disciplinary open accessarchive for the deposit and dissemination of sci-entific research documents, whether they are pub-lished or not. The documents may come fromteaching and research institutions in France orabroad, or from public or private research centers.
L’archive ouverte pluridisciplinaire HAL, estdestinée au dépôt et à la diffusion de documentsscientifiques de niveau recherche, publiés ou non,émanant des établissements d’enseignement et derecherche français ou étrangers, des laboratoirespublics ou privés.
Three-dimensional modelling of arc behaviour and gasshield quality in tandem gasmetal arc welding using
anti-phase pulse synchronizationM Schnick, G Wilhelm, M Lohse, U Füssel, a B Murphy
To cite this version:M Schnick, G Wilhelm, M Lohse, U Füssel, a B Murphy. Three-dimensional modelling of arc be-haviour and gas shield quality in tandem gasmetal arc welding using anti-phase pulse synchronization.Journal of Physics D: Applied Physics, IOP Publishing, 2011, 44 (18), pp.185205. �10.1088/0022-3727/44/18/185205�. �hal-00614338�
1
Three-dimensional modelling of arc behaviour and gas shield quality
in tandem gas–metal arc welding using anti-phase pulse
synchronization
M. Schnicka1, G. Wilhelm2, M. Lohse1, U. Füssel1, A.B. Murphy3
1 Institute of Surface and Manufacturing Technology, Dresden University of Technology, Dresden,
Germany2 Linde Gas Division, Unterschleißheim, Germany3 CSIRO Materials Science and Engineering, PO Box 218, Lindfield NSW 2070, Australia
Abstract
The paper presents a transient three-dimensional model of an anti-phase-synchronized pulsed tandem gas–
metal arc welding process, which is used to analyze arc interactions and their influence on the gas shield
flow. The shielding gases considered are pure argon and a mixture of argon with 18% CO2. Comparison of
the temperature fields predicted by the model with high-speed images indicates that the essential features
of the interactions between the arcs are captured. The paper demonstrates strong arc deflection and
kinking, especially during the low-current phase of the pulse, in agreement with experimental observa-
tions. These effects are more distinct for the argon mixture with 18% CO2. The second part of the paper
demonstrates the effects of arc deflection and instabilities on the shielding gas flow and the occurrence of
air contamination in the process region. The results allow an improved understanding of the causes of
periodic instabilities and weld seam imperfections such as porosity, spatter, heat-tint oxidation and fume
deposits.
Keywords: arc welding, tandem welding, GMAW, MHD arc modelling, arc interaction, gas shield quality
Confidential: not for distribution. Submitted to IOP Publishing for peer review 28 February 2011
2
1. Introduction
Gas–metal arc welding (GMAW; also known at metal–inert-gas or metal–active-gas welding) is a process
that is very widely used in industry to join metals. An electric arc is struck between a continuously-fed
metal wire electrode (the anode, usually referred to as simply ‘the wire’) and the workpiece (the cathode).
Droplets of molten metal detach and fall to the workpiece, which is partially melted by the arc to form the
weld pool. A shielding gas, usually argon or a mixture of argon and another gas, is fed around the wire in
order to optimize the arc properties and to protect the hot areas of the weld pool from the ambient air. If
air reaches this region, then weld imperfections can result. These include porosity of the weld, spatter
(small droplets of molten metal), heat-tint oxidation (formation of coloured oxide layers on stainless steel
that decrease corrosion resistance) and the deposition of fume (nano- and micro-particles formed from
nucleation of metal vapour).
Tandem gas–metal arc welding (T-GMAW) has been developed in order to increase the productivity of
the GMAW process. Compared to a single-wire process with similar welding parameters, it enables a
doubling of the welding speed and sometimes an even greater increase in the deposition rate. T-GMAW is
used in heavy steel industries, e.g. in shipbuilding or in pipeline production, for which high welding
speeds are of strong economic importance.
In the T-GMAW process, two electrically-isolated wires are fed through a single welding torch, which
controls the flow of shielding gas around the wires and into the arc. Thus two arcs are established into a
single weld pool. Technical improvements of the welding torch design, the current waveforms, the power
control and the arc synchronization in the last two decades have improved the process stability and
applicability. However, compared to a single-wire process, there is an increased number of process
parameters that have to be taken into account.
Optimization of the torch design and the welding parameters has so far been done experimentally. Recent
publications demonstrate the strong influence of the angles of wires and the distance between the tips of
the wires [1,2,3,4]. A large spacing between the wire tips promotes a large weld pool and a stable process.
A low spacing is used in order to obtain small weld pools. In this case, the arc attraction forces increase
and synchronized pulsed arcs are indispensable in order to stabilize the system of arcs and to avoid waves
in the weld pool that cause heavy activity in the built-in arc length control [5]. The effects of weld pool
waves can be minimized by short pulse lengths of about 1 ms [5].
The most frequently-used approach is anti-phase pulse synchronization [6]. In this mode, the base current
is present on one electrode while the second is in the pulse current phase and vice versa. However,
3
abnormal increases of arc voltage and the arc interruptions occur sporadically, especially while one wire
is in the base current phase and the other wire is at the beginning of the pulse current phase [7]. These
effects occur particularly for welding with a shielding gas containing 10% or more CO2.
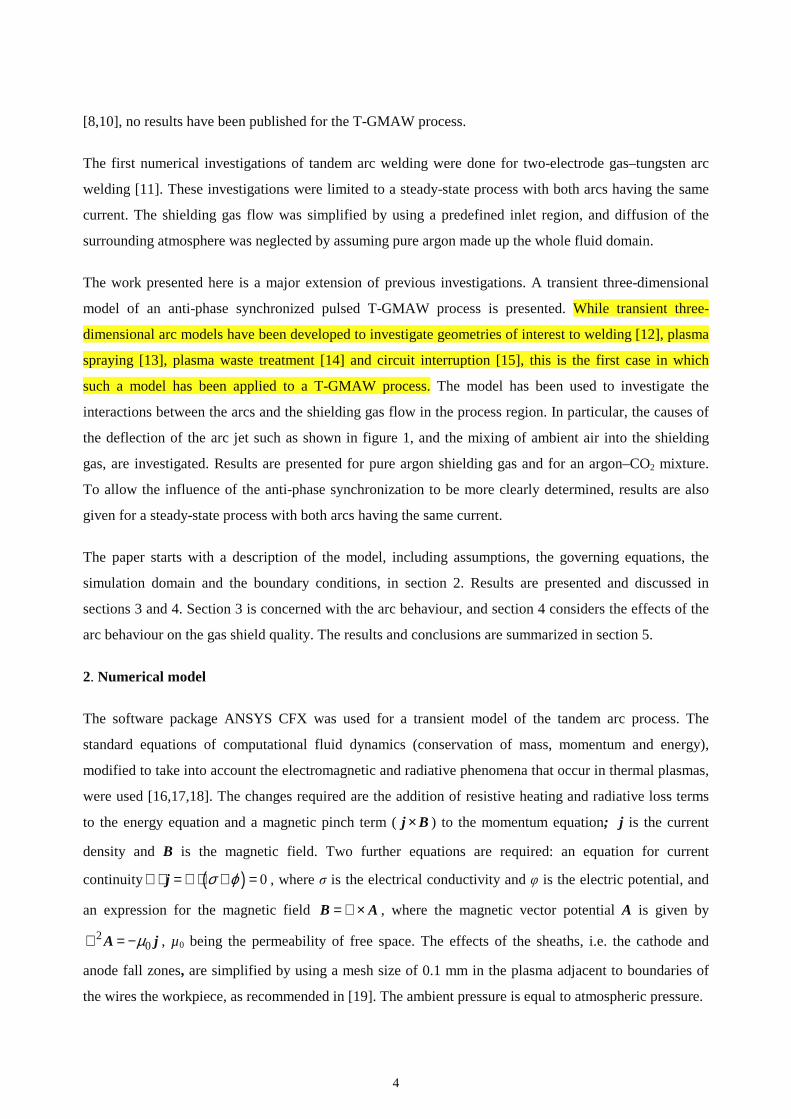
During T-GMAW with anti-phase pulse synchronization, strong interactions between the arcs can be
observed, as shown in figure 1. The attractive forces deflect the arc that is in the base phase. The high-
speed image demonstrates that the arc jet can be oriented perpendicular to the wire axis. During the pulse
phase the arc is stabilized due to the strong plasma jet that driven by the magnetic pinch force (i.e. the
j × B or Lorentz force) that results from the high current density at the top of the arc). This strong plasma
jet can disturb the other arc that is in the base phase. Thus, the flow of the shielding gas will be affected
and the flow field is expected to differ strongly from the shielding gas flow of single-wire GMAW
processes, which has been investigated previously [8]. Nevertheless, the gas supply of T-GMAW torches
corresponds to that in standard GMAW torches, with the exception that an oval gas nozzle, rather than a
circular nozzle, is used in T-GMAW in order to accommodate the two wires.
Figure 1. High-speed image of the interaction between the arcs during anti-phase synchronized pulsed T-GMAW.
The arc on the left is in the pulse phase, and the arc on the right is in the base phase.
The interactions between the arcs in T-GMAW have been investigated mainly experimentally
[1,2,3,4,5,6,7]. High speed cinematography was used to visualize the shape of the arc columns, but the
images do not permit conclusions to be drawn about the arc temperature and flow field distributions
[3,4,5,7,9]. It is possible to visualize the shielding gas flow field by Schlieren photography or particle
image velocimetry (PIV) measurements, but while this has been done for standard single-wire GMAW
4
[8,10], no results have been published for the T-GMAW process.
The first numerical investigations of tandem arc welding were done for two-electrode gas–tungsten arc
welding [11]. These investigations were limited to a steady-state process with both arcs having the same
current. The shielding gas flow was simplified by using a predefined inlet region, and diffusion of the
surrounding atmosphere was neglected by assuming pure argon made up the whole fluid domain.
The work presented here is a major extension of previous investigations. A transient three-dimensional
model of an anti-phase synchronized pulsed T-GMAW process is presented. While transient three-
dimensional arc models have been developed to investigate geometries of interest to welding [12], plasma
spraying [13], plasma waste treatment [14] and circuit interruption [15], this is the first case in which
such a model has been applied to a T-GMAW process. The model has been used to investigate the
interactions between the arcs and the shielding gas flow in the process region. In particular, the causes of
the deflection of the arc jet such as shown in figure 1, and the mixing of ambient air into the shielding
gas, are investigated. Results are presented for pure argon shielding gas and for an argon–CO2 mixture.
To allow the influence of the anti-phase synchronization to be more clearly determined, results are also
given for a steady-state process with both arcs having the same current.
The paper starts with a description of the model, including assumptions, the governing equations, the
simulation domain and the boundary conditions, in section 2. Results are presented and discussed in
sections 3 and 4. Section 3 is concerned with the arc behaviour, and section 4 considers the effects of the
arc behaviour on the gas shield quality. The results and conclusions are summarized in section 5.
2. Numerical model
The software package ANSYS CFX was used for a transient model of the tandem arc process. The
standard equations of computational fluid dynamics (conservation of mass, momentum and energy),
modified to take into account the electromagnetic and radiative phenomena that occur in thermal plasmas,
were used [16,17,18]. The changes required are the addition of resistive heating and radiative loss terms
to the energy equation and a magnetic pinch term ( ×j B ) to the momentum equation; j is the current
density and B is the magnetic field. Two further equations are required: an equation for current
continuity ( ) 0σ ϕ∇ ⋅ = ∇ ⋅ ∇ =j , where σ is the electrical conductivity and φ is the electric potential, and
an expression for the magnetic field = ∇ ×B A , where the magnetic vector potential A is given by
20µ∇ = −A j , µ0 being the permeability of free space. The effects of the sheaths, i.e. the cathode and
anode fall zones, are simplified by using a mesh size of 0.1 mm in the plasma adjacent to boundaries of
the wires the workpiece, as recommended in [19]. The ambient pressure is equal to atmospheric pressure.
5
The plasma is assumed to be in local thermodynamic equilibrium (LTE), as is usual for models of
welding arcs. This has been shown to be a valid assumption in the main body of the arc, both
experimentally [20,21] and theoretically [22]. Deviations from LTE can occur close to the cathode [23]
and the anode [24,25], and also in the fringes in the arc [26]. To take all the effects into account would
require treating the transport and reactions of each plasma species separately. This would inevitably
introduce inaccuracies because of the lack of available reaction data and uncertainties about appropriate
calculation of thermodynamic and transport properties [27,28].
The thermodynamic and transport properties of the plasma were approximated using the pure gas
properties of argon, CO2 and air, taken from the work of Murphy and co-workers [29,30,31] and then
interpolating using the mixing laws of Gleizes et al [17]. The mixture of argon to CO2 is assumed to
remain fixed at 82% argon and 18% CO2 by volume, while the air fraction is variable. The presence of
metal vapour and its influence on the arc properties and behaviour is neglected, as is the influence of the
formation of metal droplets at the wires and their passage through the arc. Radiation is considered using
the net emission coefficient model. For mixtures of argon and CO2, the net emission coefficient is
calculated as a mole-fraction weighted average as recommended by Cressault et al [32]. The net emission
coefficients were calculated including self-absorption by assuming an isothermal cylinder of plasma of
radius 1 mm, surrounded by a transparent environment. Data for argon were given by Cram [33], and
Cram’s method was used to calculate data for carbon and oxygen.
The model implements the mixing of the shielding gas (argon or argon–CO2) and air through turbulence
as well as laminar diffusion. Turbulence was included using the shear stress transport turbulence model
[34]. This approach combines the K–ω model in regions near walls and the K–ε model in regions away
from the walls. It has been rated the most accurate turbulence model compared to two other two-equation
models and a one-equation model for a wide range of flows [35]. The diffusion of air into the shielding
gas was modelled due to an additional transport equation for the air component. The laminar diffusion
coefficient data was that given in [30] for diffusion of argon through air.
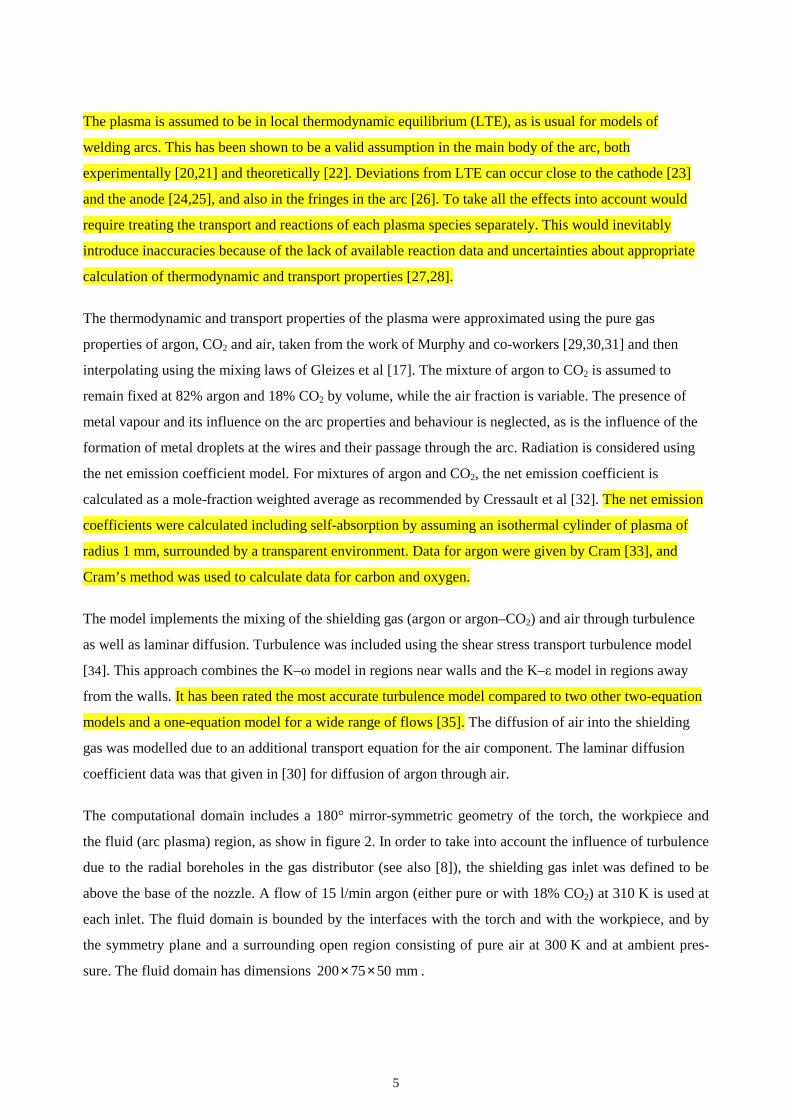
The computational domain includes a 180° mirror-symmetric geometry of the torch, the workpiece and
the fluid (arc plasma) region, as show in figure 2. In order to take into account the influence of turbulence
due to the radial boreholes in the gas distributor (see also [8]), the shielding gas inlet was defined to be
above the base of the nozzle. A flow of 15 l/min argon (either pure or with 18% CO2) at 310 K is used at
each inlet. The fluid domain is bounded by the interfaces with the torch and with the workpiece, and by
the symmetry plane and a surrounding open region consisting of pure air at 300 K and at ambient pres-
sure. The fluid domain has dimensions 200 75 50 mm× × .
6
Figure 2. Schematic showing the simulation domain of the two torches, the gas nozzle, the workpiece and the fluid
region
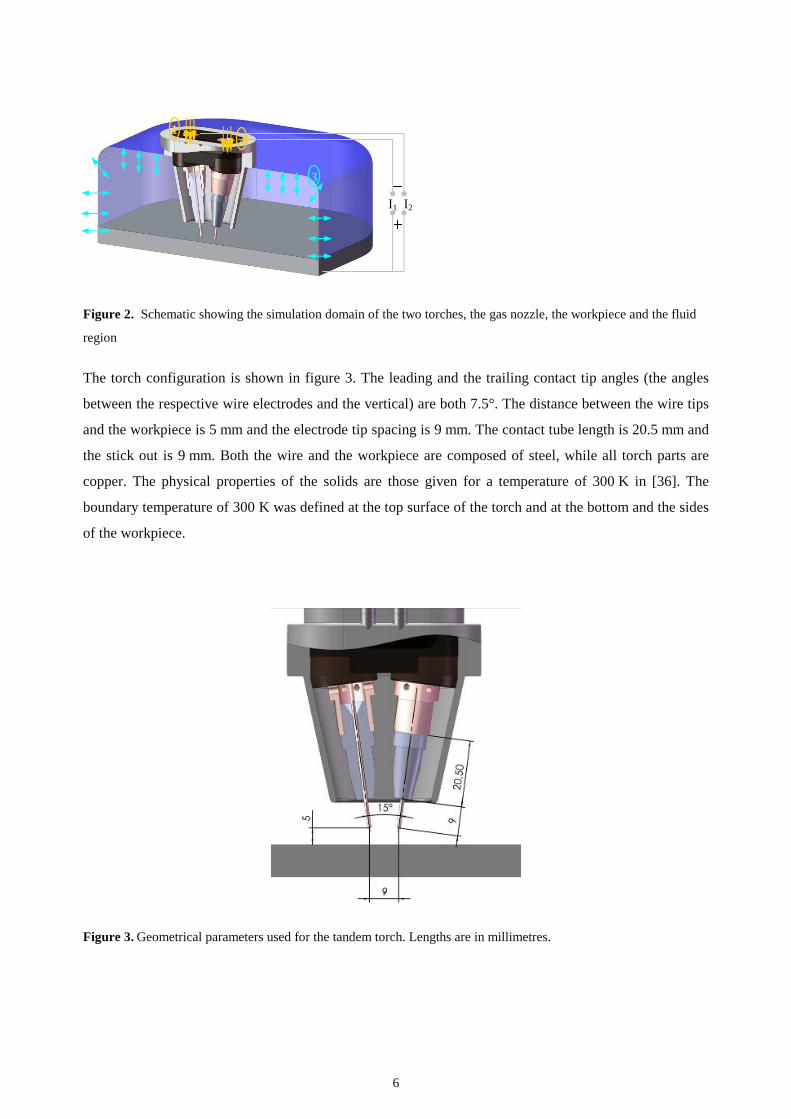
The torch configuration is shown in figure 3. The leading and the trailing contact tip angles (the angles
between the respective wire electrodes and the vertical) are both 7.5°. The distance between the wire tips
and the workpiece is 5 mm and the electrode tip spacing is 9 mm. The contact tube length is 20.5 mm and
the stick out is 9 mm. Both the wire and the workpiece are composed of steel, while all torch parts are
copper. The physical properties of the solids are those given for a temperature of 300 K in [36]. The
boundary temperature of 300 K was defined at the top surface of the torch and at the bottom and the sides
of the workpiece.
Figure 3. Geometrical parameters used for the tandem torch. Lengths are in millimetres.
21
3
I1 I2
7
A non-uniform hexahedral mesh is used for all regions of the computational domain. The mesh is refined
inside the torch and between the nozzle and the workpiece, in particular in the arc region, where the mesh
size is 0.1 to 0.2 mm. The mesh contains approximately 1 900 000 nodes, of which about 1 400 000 nodes
are in the fluid region.
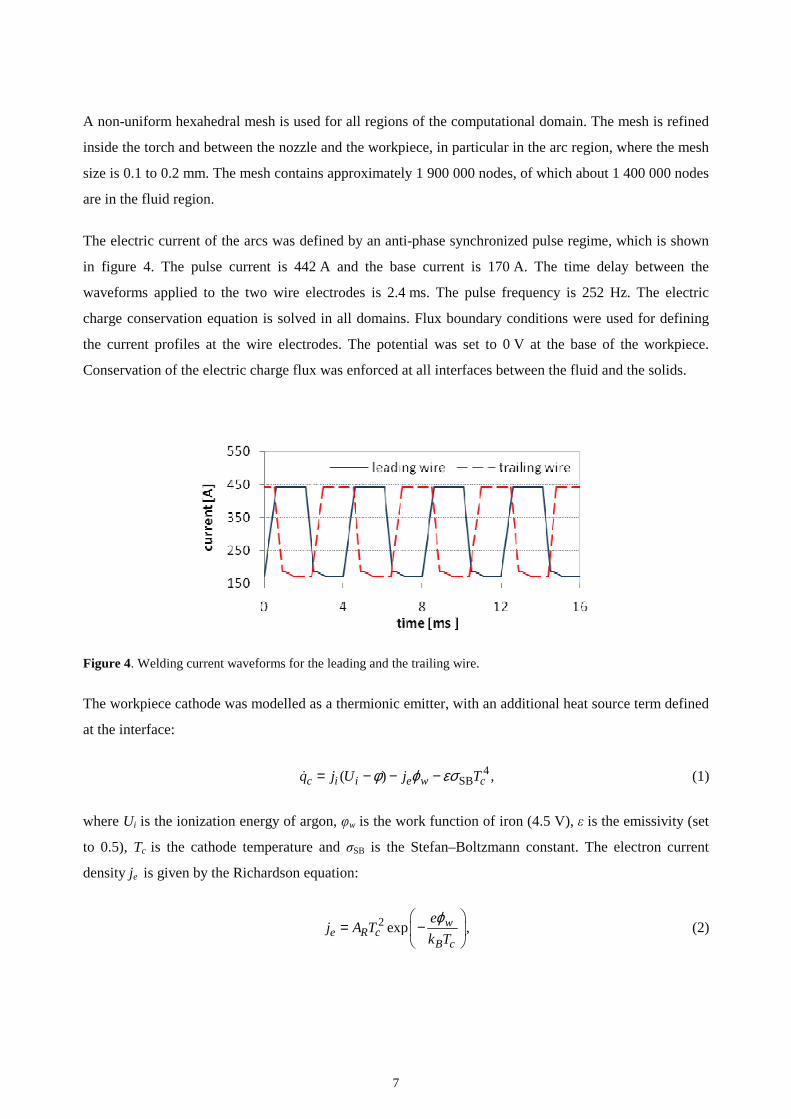
The electric current of the arcs was defined by an anti-phase synchronized pulse regime, which is shown
in figure 4. The pulse current is 442 A and the base current is 170 A. The time delay between the
waveforms applied to the two wire electrodes is 2.4 ms. The pulse frequency is 252 Hz. The electric
charge conservation equation is solved in all domains. Flux boundary conditions were used for defining
the current profiles at the wire electrodes. The potential was set to 0 V at the base of the workpiece.
Conservation of the electric charge flux was enforced at all interfaces between the fluid and the solids.
Figure 4. Welding current waveforms for the leading and the trailing wire.
The workpiece cathode was modelled as a thermionic emitter, with an additional heat source term defined
at the interface:
4SB( ) ,c i i e w cq j U j Tφ ϕ εσ= − − −& (1)
where Ui is the ionization energy of argon, φw is the work function of iron (4.5 V), ε is the emissivity (set
to 0.5), Tc is the cathode temperature and σSB is the Stefan–Boltzmann constant. The electron current
density je is given by the Richardson equation:
2 exp ,we R c
B c
ej A T
k T
ϕ = −
(2)
8
where AR is the Richardson constant, e is the electronic charge and kB is Boltzmann’s constant, and ji is
the ion current density, which is equated to the difference between the total current density and the
electron current density.
At the wire anodes, the heat source due electron absorption at the surface was defined by
4,a w SB aq j Tϕ εσ= −& (3)
where Ta is the anode temperature. The heat source and sink terms due to vaporization, condensation and
the electron velocity are neglected. The ohmic heating and the cooling due to the wire feed rate of
12.5 m/min are considered in the energy balance of the wires. The relative motion between the torch and
the workpiece is neglected. Note that blackbody cooling terms in (1) and (3) are negligible compared to
the other terms, so the use of a constant value of the emissivity will not cause a significant error.
The transient simulation was initialized by a steady-state solution for the tandem torch with 150 A in both
wires, which allows the gas shield to be established. To investigate the transient arc and gas shield
behaviour, a total simulation time of 16.1 s was used, with a constant time step of 52 10 s−× . The
following discussion only refers to the last pulse of four that were simulated, extending from 12.0 to
16.1 s. The results for this pulse were nearly identical to those for the preceding pulse.
3. Arc behaviour and interactions
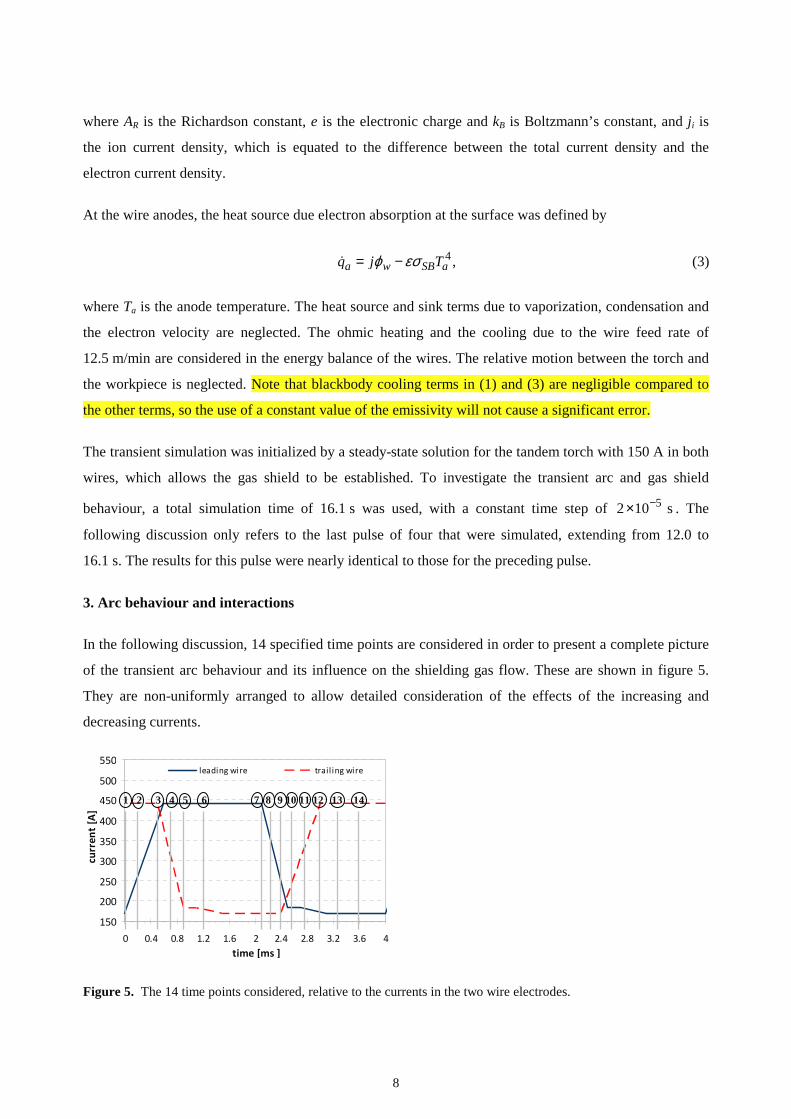
In the following discussion, 14 specified time points are considered in order to present a complete picture
of the transient arc behaviour and its influence on the shielding gas flow. These are shown in figure 5.
They are non-uniformly arranged to allow detailed consideration of the effects of the increasing and
decreasing currents.
150
200
250
300
350
400
450
500
550
0 0.4 0.8 1.2 1.6 2 2.4 2.8 3.2 3.6 4time [ms ]
curr
ent
[A]
leading wire trail ing wire
Figure 5. The 14 time points considered, relative to the currents in the two wire electrodes.
1 2 3 4 5 6 7 8 9 10 11 12 13 14
arc temperature [K] wire temperature [K]
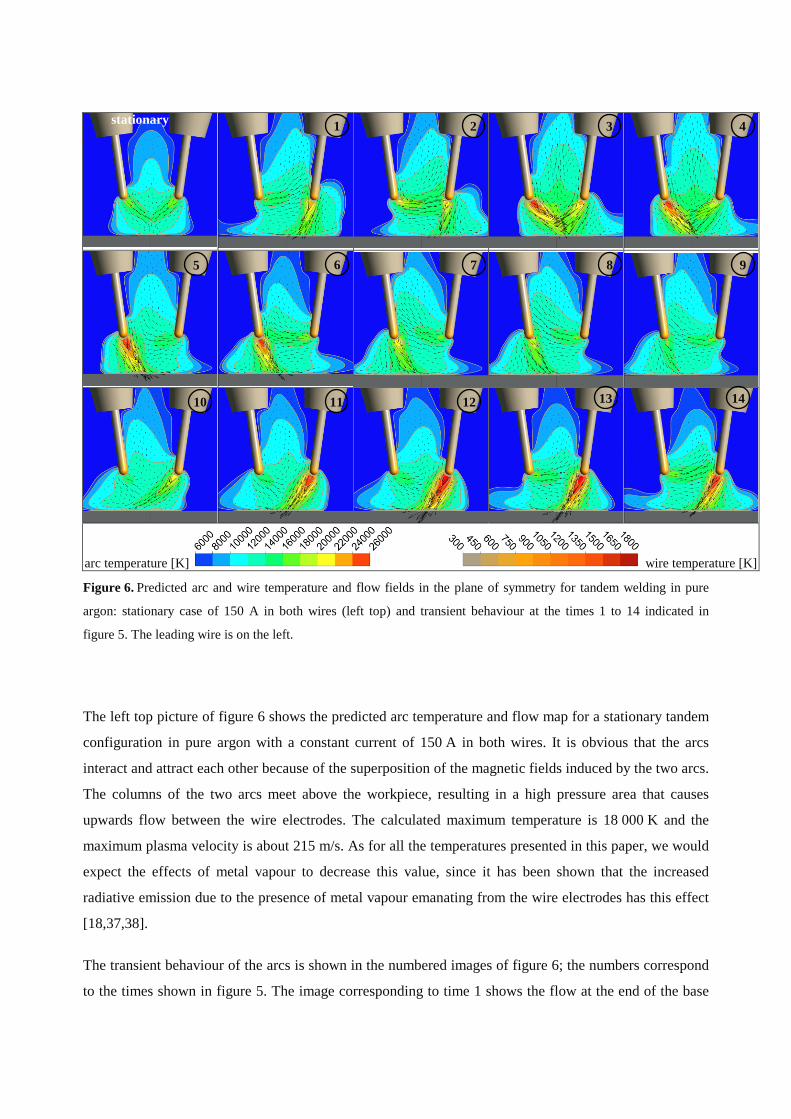
Figure 6. Predicted arc and wire temperature and flow fields in the plane of symmetry for tandem welding in pure
argon: stationary case of 150 A in both wires (left top) and transient behaviour at the times 1 to 14 indicated in
figure 5. The leading wire is on the left.
The left top picture of figure 6 shows the predicted arc temperature and flow map for a stationary tandem
configuration in pure argon with a constant current of 150 A in both wires. It is obvious that the arcs
interact and attract each other because of the superposition of the magnetic fields induced by the two arcs.
The columns of the two arcs meet above the workpiece, resulting in a high pressure area that causes
upwards flow between the wire electrodes. The calculated maximum temperature is 18 000 K and the
maximum plasma velocity is about 215 m/s. As for all the temperatures presented in this paper, we would
expect the effects of metal vapour to decrease this value, since it has been shown that the increased
radiative emission due to the presence of metal vapour emanating from the wire electrodes has this effect
[18,37,38].
The transient behaviour of the arcs is shown in the numbered images of figure 6; the numbers correspond
to the times shown in figure 5. The image corresponding to time 1 shows the flow at the end of the base
1 2 3 4
6 7 8 95
11 12 13 1410
stationary
10
phase of the left (leading) wire and during the pulse phase of the right (trailing) wire. The arc temperature
of the left arc is about 16 000 K. The flow direction of the left arc is nearly horizontal. The predicted
maximum temperature of the right arc during its pulse phase is about 24 000 K. The flow of this arc is
directed along the axis of the wire. During the upswing of the current in the left wire (times 1 to 4), the
temperature and the plasma flow velocity increase rapidly and the flow direction shifts slowly back
towards the direction of the wire axis. In general, the temperature and the plasma flow velocity change
much more rapidly than does the direction of the plasma flow.
The waveform of the welding current (see figure 5) has two different downswing and upswing
characteristics. In phase-shift mode 1, the upswing of the current in the left wire occurs while the right
wire is in the pulse phase (figures 5 and 6: times 1 to 3). In contrast, in phase-shift mode 2, the upswing of
the current in the right wire occurs while the current in the left wire is close to its base level (figures 5 and
6: times 10 to 12). This difference is found to have an important influence on the arcs.
In phase-shift mode 1, the maximum temperature of the arc with the increasing current is 1500 K lower
and the plasma flow velocity is about 100 m/s less than in phase-shift mode 2. Further, in phase-shift
mode 1, the arc properties are less steady in time and the radius of the arc near the workpiece is larger.
It was further found that the maximum temperature and plasma flow velocity of the left arc during its
pulse phase (times 4 to 7) remain within narrow ranges of width 800 K and 100 m/s respectively. The
maximum values were reached after the current of the right arc reached the base phase (time 5). In
contrast, in phase-shift mode 2, the maximum values of temperature and plasma flow velocity were
reached directly upon reaching the peak current (image 12), and then decreased slowly.
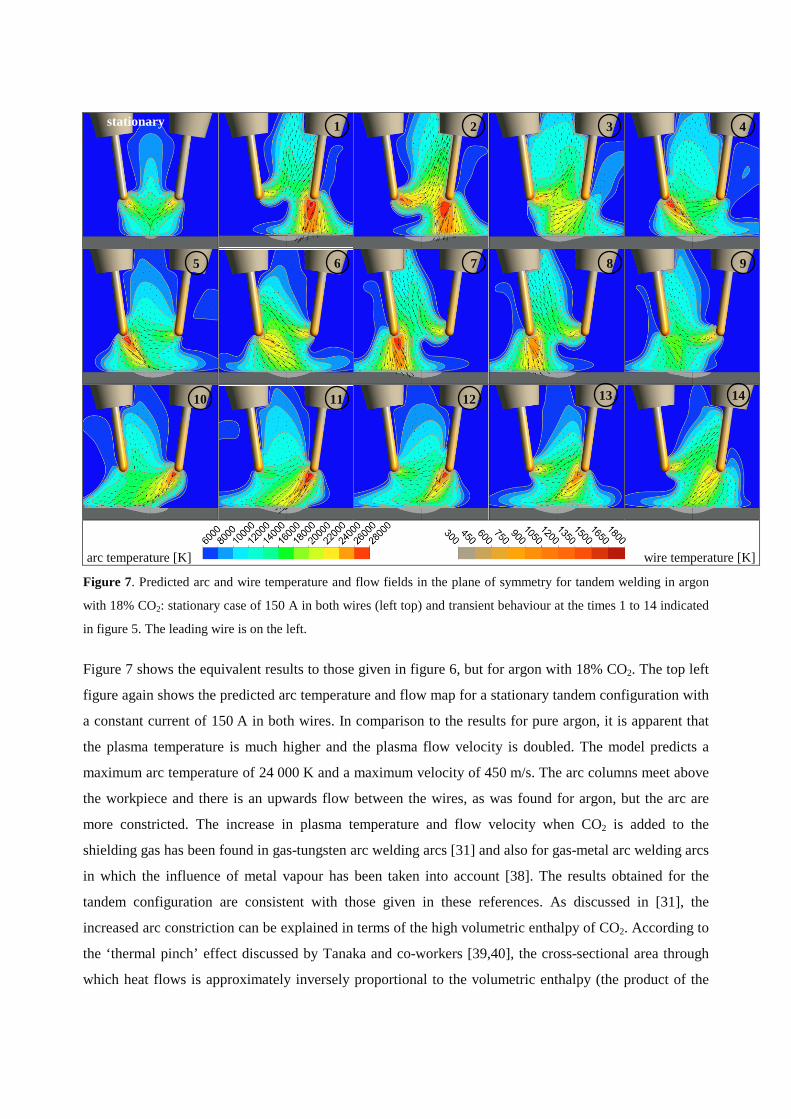
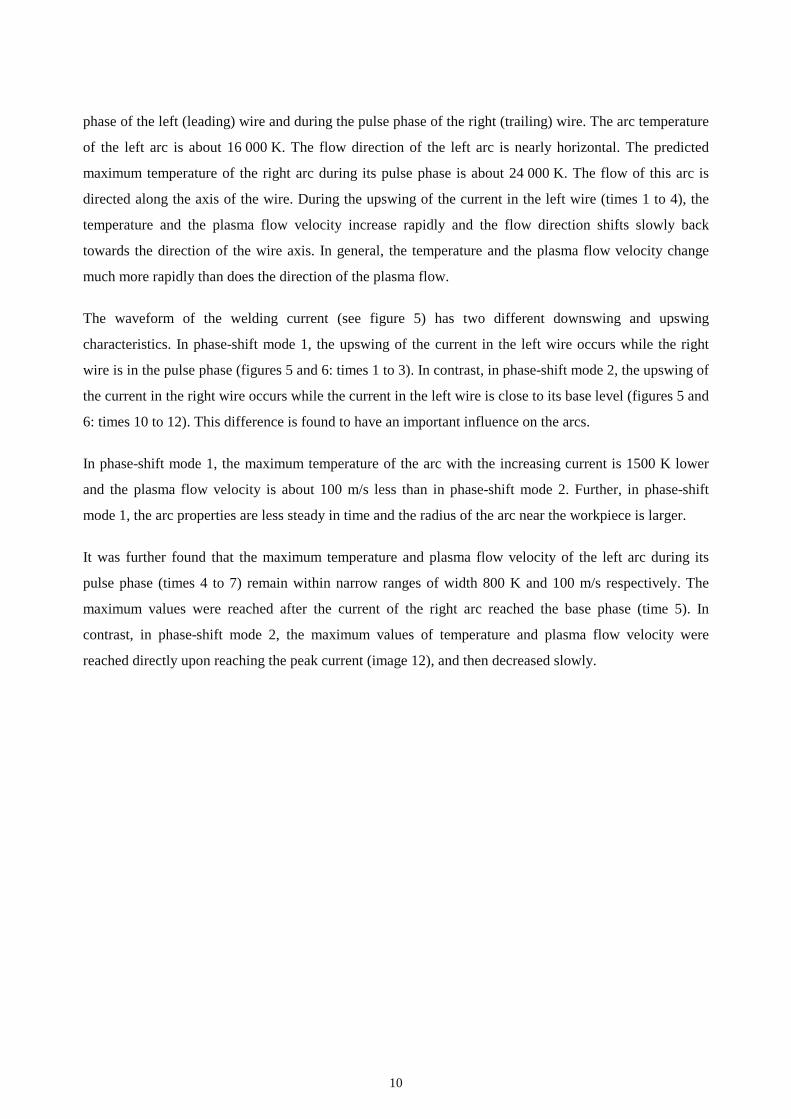
arc temperature [K] wire temperature [K]
Figure 7. Predicted arc and wire temperature and flow fields in the plane of symmetry for tandem welding in argon
with 18% CO2: stationary case of 150 A in both wires (left top) and transient behaviour at the times 1 to 14 indicated
in figure 5. The leading wire is on the left.
Figure 7 shows the equivalent results to those given in figure 6, but for argon with 18% CO2. The top left
figure again shows the predicted arc temperature and flow map for a stationary tandem configuration with
a constant current of 150 A in both wires. In comparison to the results for pure argon, it is apparent that
the plasma temperature is much higher and the plasma flow velocity is doubled. The model predicts a
maximum arc temperature of 24 000 K and a maximum velocity of 450 m/s. The arc columns meet above
the workpiece and there is an upwards flow between the wires, as was found for argon, but the arc are
more constricted. The increase in plasma temperature and flow velocity when CO2 is added to the
shielding gas has been found in gas-tungsten arc welding arcs [31] and also for gas-metal arc welding arcs
in which the influence of metal vapour has been taken into account [38]. The results obtained for the
tandem configuration are consistent with those given in these references. As discussed in [31], the
increased arc constriction can be explained in terms of the high volumetric enthalpy of CO2. According to
the ‘thermal pinch’ effect discussed by Tanaka and co-workers [39,40], the cross-sectional area through
which heat flows is approximately inversely proportional to the volumetric enthalpy (the product of the
1 2 3 4
6 7 8 95
11 12 13 1410
stationary
12
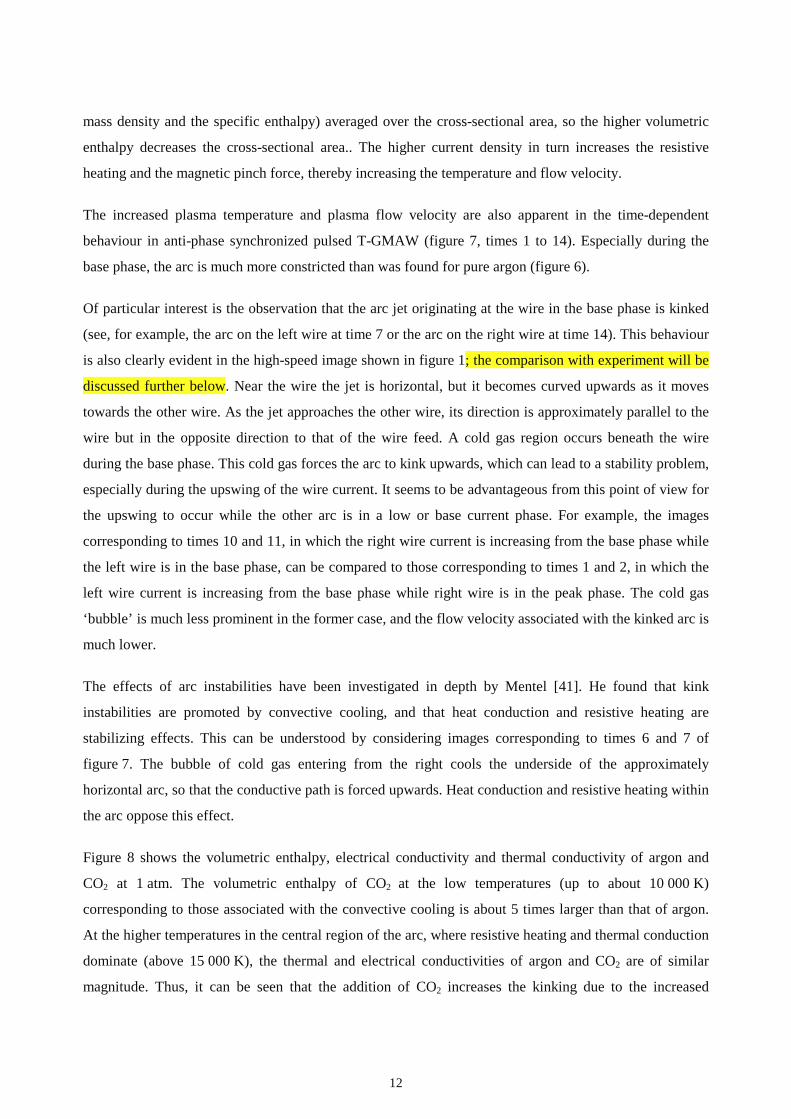
mass density and the specific enthalpy) averaged over the cross-sectional area, so the higher volumetric
enthalpy decreases the cross-sectional area.. The higher current density in turn increases the resistive
heating and the magnetic pinch force, thereby increasing the temperature and flow velocity.
The increased plasma temperature and plasma flow velocity are also apparent in the time-dependent
behaviour in anti-phase synchronized pulsed T-GMAW (figure 7, times 1 to 14). Especially during the
base phase, the arc is much more constricted than was found for pure argon (figure 6).
Of particular interest is the observation that the arc jet originating at the wire in the base phase is kinked
(see, for example, the arc on the left wire at time 7 or the arc on the right wire at time 14). This behaviour
is also clearly evident in the high-speed image shown in figure 1; the comparison with experiment will be
discussed further below. Near the wire the jet is horizontal, but it becomes curved upwards as it moves
towards the other wire. As the jet approaches the other wire, its direction is approximately parallel to the
wire but in the opposite direction to that of the wire feed. A cold gas region occurs beneath the wire
during the base phase. This cold gas forces the arc to kink upwards, which can lead to a stability problem,
especially during the upswing of the wire current. It seems to be advantageous from this point of view for
the upswing to occur while the other arc is in a low or base current phase. For example, the images
corresponding to times 10 and 11, in which the right wire current is increasing from the base phase while
the left wire is in the base phase, can be compared to those corresponding to times 1 and 2, in which the
left wire current is increasing from the base phase while right wire is in the peak phase. The cold gas
‘bubble’ is much less prominent in the former case, and the flow velocity associated with the kinked arc is
much lower.
The effects of arc instabilities have been investigated in depth by Mentel [41]. He found that kink
instabilities are promoted by convective cooling, and that heat conduction and resistive heating are
stabilizing effects. This can be understood by considering images corresponding to times 6 and 7 of
figure 7. The bubble of cold gas entering from the right cools the underside of the approximately
horizontal arc, so that the conductive path is forced upwards. Heat conduction and resistive heating within
the arc oppose this effect.
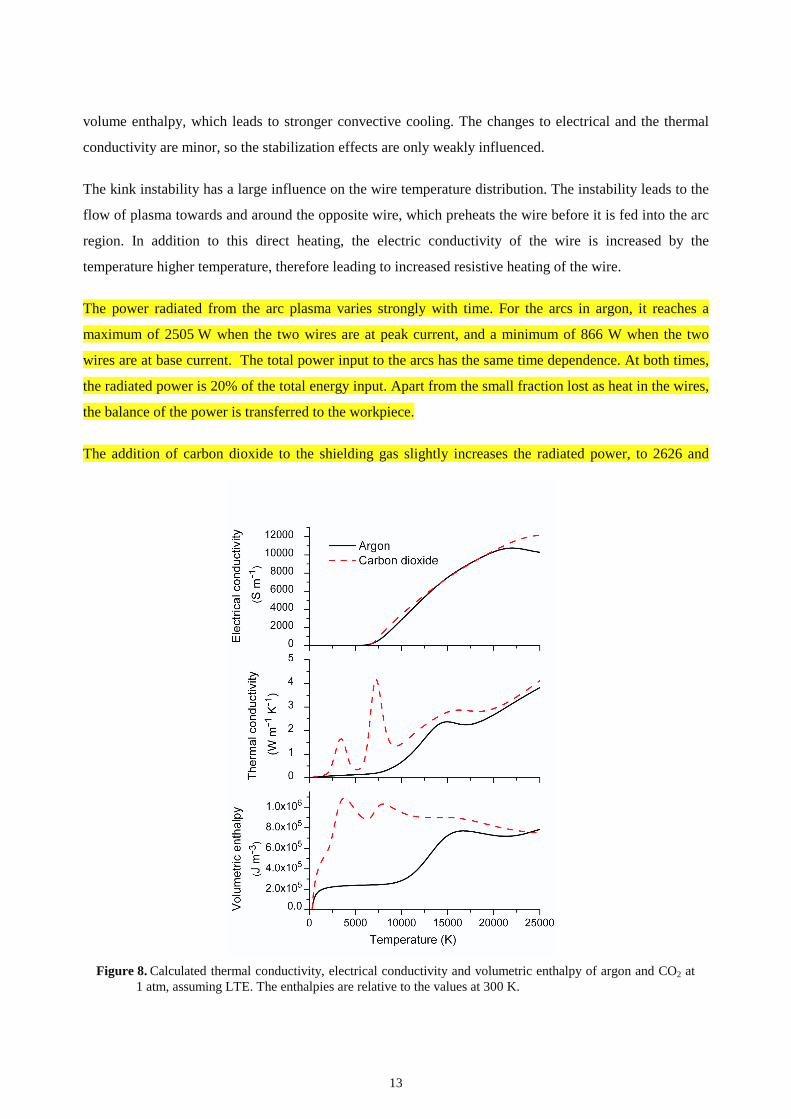
Figure 8 shows the volumetric enthalpy, electrical conductivity and thermal conductivity of argon and
CO2 at 1 atm. The volumetric enthalpy of CO2 at the low temperatures (up to about 10 000 K)
corresponding to those associated with the convective cooling is about 5 times larger than that of argon.
At the higher temperatures in the central region of the arc, where resistive heating and thermal conduction
dominate (above 15 000 K), the thermal and electrical conductivities of argon and CO2 are of similar
magnitude. Thus, it can be seen that the addition of CO2 increases the kinking due to the increased
13
volume enthalpy, which leads to stronger convective cooling. The changes to electrical and the thermal
conductivity are minor, so the stabilization effects are only weakly influenced.
The kink instability has a large influence on the wire temperature distribution. The instability leads to the
flow of plasma towards and around the opposite wire, which preheats the wire before it is fed into the arc
region. In addition to this direct heating, the electric conductivity of the wire is increased by the
temperature higher temperature, therefore leading to increased resistive heating of the wire.
The power radiated from the arc plasma varies strongly with time. For the arcs in argon, it reaches a
maximum of 2505 W when the two wires are at peak current, and a minimum of 866 W when the two
wires are at base current. The total power input to the arcs has the same time dependence. At both times,
the radiated power is 20% of the total energy input. Apart from the small fraction lost as heat in the wires,
the balance of the power is transferred to the workpiece.
The addition of carbon dioxide to the shielding gas slightly increases the radiated power, to 2626 and
Figure 8. Calculated thermal conductivity, electrical conductivity and volumetric enthalpy of argon and CO2 at1 atm, assuming LTE. The enthalpies are relative to the values at 300 K.
14
1084 W when the two wires are at peak and base current respectively. The increase is mainly attributable
to the higher arc temperatures, rather greater net emission coefficient for the carbon dioxide. The net
emission coefficient for the argon–CO2 mixture is larger than that for argon for temperatures above about
19 000 K, and smaller for lower temperatures, but the difference is at most 10%. The total power input to
the arcs increases by a larger factor, due the increased voltage associated with the greater arc constriction.
The radiated power is then 19% and 17% of the total power input at the two times.
It should be noted that the calculated arc voltages, which are in the range 14 to 19 V, do not include the
sheath voltage, so the calculated input powers also neglect this factor. The measured arc voltage is 8 to
10 V higher; the discrepancy is partly due to the neglect of the sheath voltage, and partly due to the
neglect of metal vapour in the calculation. It has been found that the presence of metal vapour leads to
increased radiative losses in gas–metal arc welding, and this is sufficient to reduce the arc temperature
and thereby increase the arc voltage [18,37,38].
The Mach numbers are highest when both wires are near base current; although the velocities are lower at
this stage because of the smaller Lorentz forces, the speed of sound is also smaller because of the lower
temperature. The maximum Mach number is 0.234 for pure argon, and 0.248 for the argon–CO2 case.
This indicates that the assumption of incompressible flow used in the model is a reasonable
approximation.
The maximum Reynolds number is around 100, which means that the flow is laminar. Therefore the use
of a turbulence model is in fact not necessary, and will not influence our results; this is in accordance
with the findings for modelling of a single gas–metal arc [37].
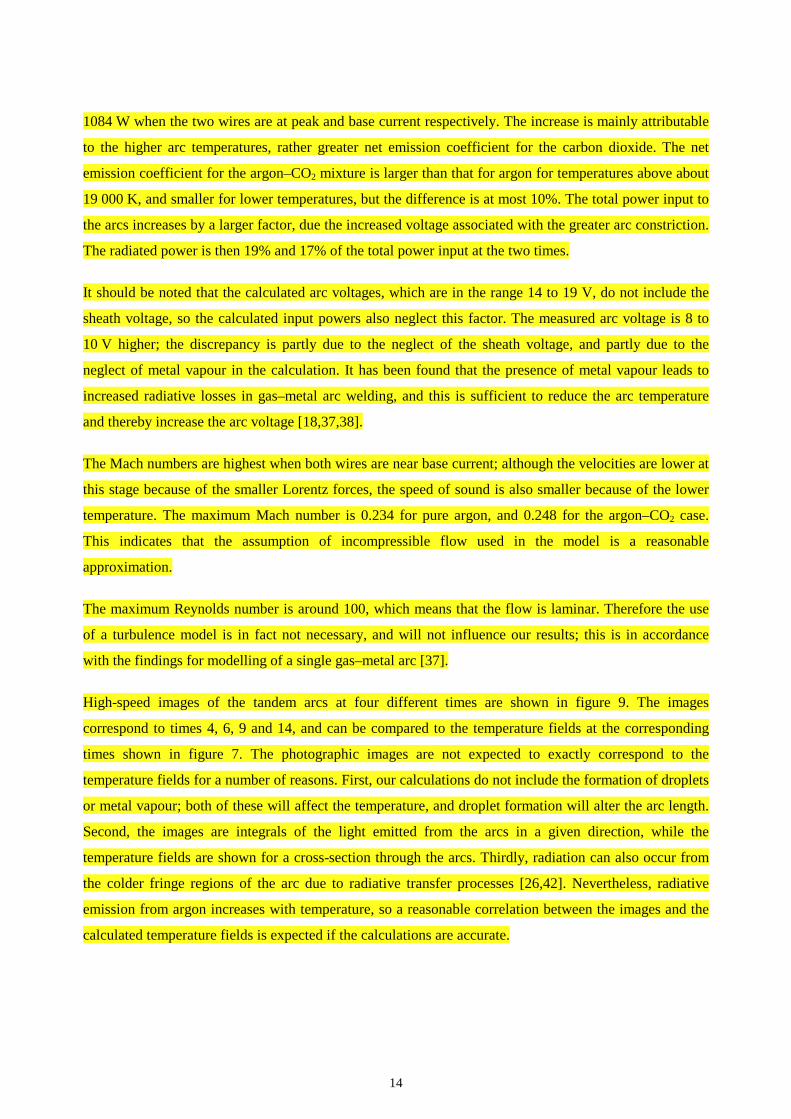
High-speed images of the tandem arcs at four different times are shown in figure 9. The images
correspond to times 4, 6, 9 and 14, and can be compared to the temperature fields at the corresponding
times shown in figure 7. The photographic images are not expected to exactly correspond to the
temperature fields for a number of reasons. First, our calculations do not include the formation of droplets
or metal vapour; both of these will affect the temperature, and droplet formation will alter the arc length.
Second, the images are integrals of the light emitted from the arcs in a given direction, while the
temperature fields are shown for a cross-section through the arcs. Thirdly, radiation can also occur from
the colder fringe regions of the arc due to radiative transfer processes [26,42]. Nevertheless, radiative
emission from argon increases with temperature, so a reasonable correlation between the images and the
calculated temperature fields is expected if the calculations are accurate.
15
Figure 9. High-speed images of the arcs for tandem welding in argon with 18% CO2, corresponding to the following
time points in figure 5: (a) time 4 (both wires near peak current); (b) time 6 (left wire in pulse phase, right wire in
base phase); time 9 (both wires near base current); (d) time 14 (left wire in base phase, right wire in peak phase).
The image shown in figure 9(a) shows that both arcs are directed downwards when the two wires are near
peak current. This in agreement with the temperature field at time 4 in figure 7. The bright region below
the right arc is a consequence of a droplet being formed, leading to a much shorter arc than assumed in
the calculations. Figure 9(b) shows the case when the left wire is at peak current (pulse phase) and the
right wire at base current (base phase), while figure 9(d) is for the opposite polarity. The predicted
upward kinking of the arc from the base-phase wire, shown at times 6 and 14, respectively, in figure 7, is
16
apparent in both images. When both wires are near base current, the radiation is relatively weak owing to
the low temperature. The upward kinking of the arc from the right wire predicted in calculations (time 9
of figure 7) is clearly visible in the image (figure 9(c)).
The predicted temperature fields show a strong correlation with the high-speed images, particularly when
the intrinsic discrepancies are taken into account. This gives confidence that the most important
processes, in particular those responsible for the interactions between the two arcs, have been included in
the computational model.
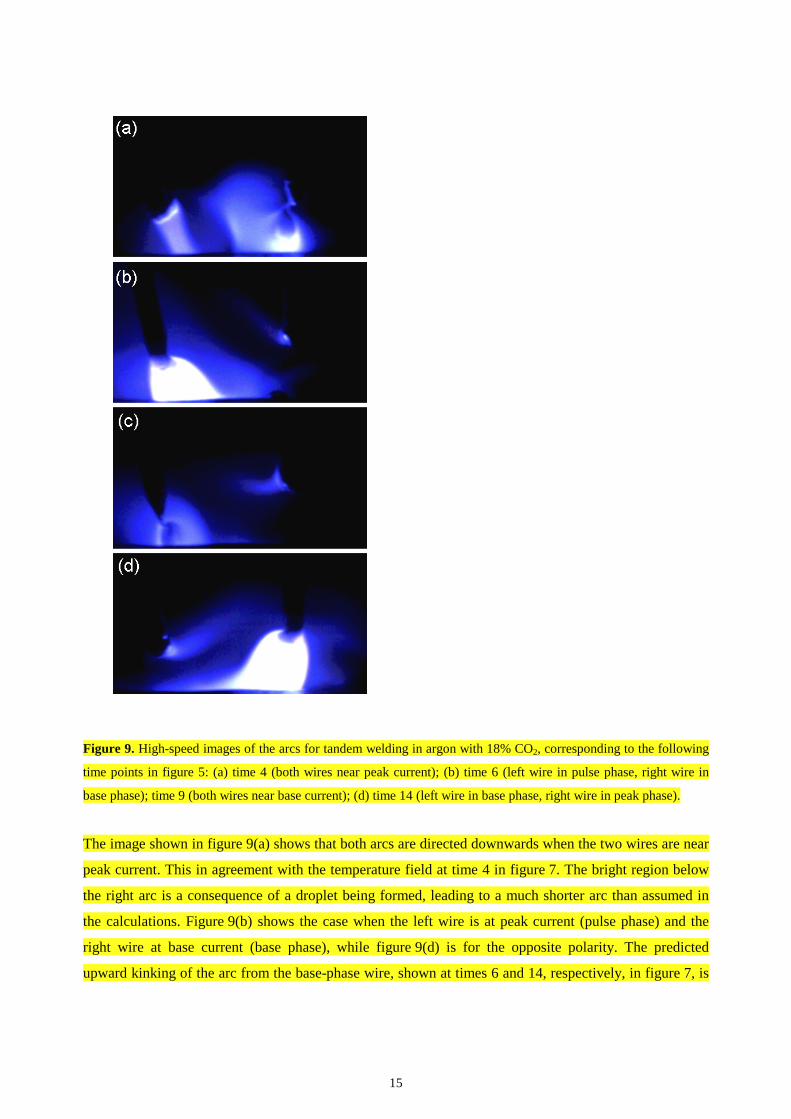
air molar fraction velocity
Figure 10. Predicted mole fraction of air and flow fields in the plane of symmetry for tandem welding in argon with
18% CO2: stationary case of 150 A in both wires (left top) and transient behaviour at the times 1 to 14 indicated in
figure 5. The leading wire is on the left. Velocities are in m/s.
stationary 1 2
3 4
6 7 8
9
5
11
12 13 14
10
4. Shielding gas flow and gas shield quality
The effect of the arc interactions on the gas shield quality is illustrated in figure 10. The air concentration
is shown by the colour using a logarithmic scale, while the flow velocity is indicated by the colour of the
arrows, using a linear scale. The length of the vectors is constant; shorter arrows result from vectors with
a component perpendicular to the vertical plane. The arc temperature is indicated by the contour lines,
which are the same as used in figure 7 (starting from 6000 K with a spacing of 2000 K).
The best gas shield quality (i.e. minimum air concentration in the vicinity of the wires and workpiece)
was found for the configuration with 150 A applied to both wires (top left). The nozzle design and the
magnetic pinch forces resulting from the current flowing through the two arcs induce the flow of
shielding gas between the arcs. The hot plasma is dispersed radially outwards and upwards. As a
consequence, the flow field inside the torch and the gas nozzle is very different from the gas flow for
single-wire torches. Hot gas is forced upwards between the wires and contact tubes while fresh cold gas
flows downwards in the outer regions of the gas nozzle, particularly at the curved ends of the nozzle. The
highest air concentration in the arc region was calculated to occur between the two wires. Air enters this
region by diffusion from the sides parallel to the welding direction. However, the calculated air mass
fraction is below 10 ppm, which is still very small and probably negligible in practice.
The use of anti-phase pulse synchronization decreases the gas shield quality considerably. The air mass
fraction increases to more than 600 ppm in the process region. This level is sufficient to cause weld seam
imperfections such as porosity, spatter and fume deposition.
The high level of contamination is caused by the convective flow in the shielding gas, and by diffusion
and turbulent mixing. The air diffusion flux ,D airm& is given by
,air eff air ,xDm D C= − ∇& (4)
where Cair is the air mass fraction and Dxeff is the effective diffusion coefficient of air in argon, given by
eff air ,Sc
x x t
tD D
µρ= + (5)
where ρ is the density of air, Dxair is the ordinary diffusion coefficient, which is a function of temperature
and air concentration, µt is the eddy viscosity and Sct is the turbulent Schmidt number, which is set to 0.9.
It is found that the diffusion velocity is everywhere less than 0.2 m/s and everywhere at least an order of
18
magnitude less than the flow velocity. This indicates that diffusion and turbulent mixing do not play a
dominant role in determining the gas shield quality.
Figure 10 demonstrates further that the presence of air in the welding zone is mainly related to the flow
associated with the base current arc. The horizontal flow associated with the upward-kinked arc leads to a
horizontal intake of air into the arc. However, the flow field in the vertical plane through both wires that
is given in figure 10 shows only relatively low flow velocities toward the base current arc, especially at
the beginning of the base current phase. For a fuller picture of the flow field, it is necessary to consider
other planes.
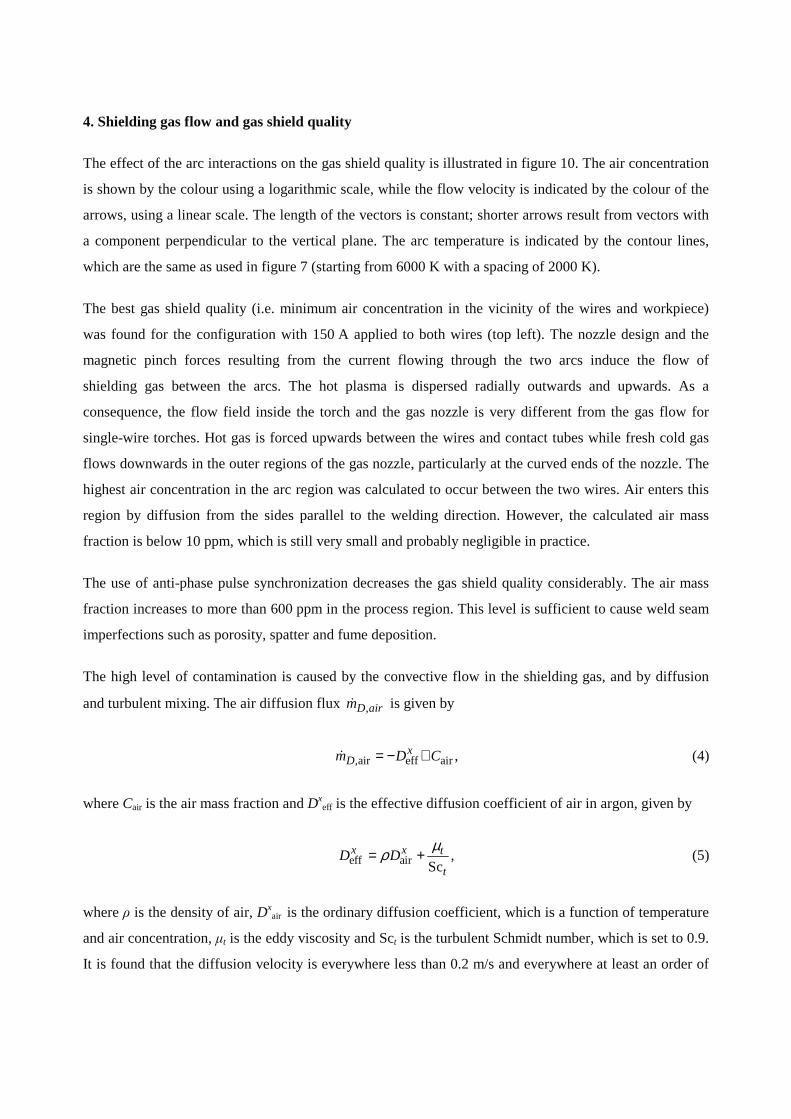
Figure 11 shows a plot of the flow vectors in three horizontal planes at the beginning of the base current
phase of the left wire (time 6 in figure 5). The view is from above, and the contact tubes were rendered
invisible in order to allow a full picture of the flow map. The absolute velocity value of the vectors is
indicated by the colour scale, and the length of the vectors is constant. Shorter arrows result from vectors
with a component perpendicular to the horizontal plane.
Consistent with the flow fields shown in figures 7 and 10, it is apparent that the flow field in the region
above the arc is determined by the base current arc, while the peak current arc determines the flow close
to the workpiece. The horizontal plane (a) is positioned 3 mm above the tips of the wires. The highest
flow velocity is predicted to occur near the wire (1), which is in the pulse phase. This flow is induced by
the horizontal base-current arc of the right wire. It is interesting to note that while this arc determines the
flow field in the inner region, the flow in the outer region of the gas nozzle, especially the right side (2),
continues to flow in the opposite direction, towards the right side. This flow is a result of the previous
base phase of the left wire.
The horizontal plane (b) is positioned at the tips of the wires. The flow is mainly determined by the gas
intake at the arc attachment to the wires. While the flow vectors near the left wire (in the pulse phase) are
mainly directed downwards, the direction of the right arc (in the base phase) is horizontally to the left.
The main flow of the gas that is taken into this horizontal arc is coming from the sides (3). Thus, air from
the outer nozzle region is drawn into the process region of the arc and the weld pool. The contaminating
air remains in the gas shield flow for a long time, since it is transported upwards due to the arc deflection
and then moves back and forth due to periodic changes corresponding to base and pulse current phases.
The horizontal plane (c) is positioned 2 mm above the workpiece and 3 mm below the tips of the wires.
The highest velocities are obtained near the pulse current arc (4). The flow field is pear-shaped. Below
the right arc (5) the magnetic pinch force causes strong flow and kinking.
19
Figure 11. Predicted flow field at time 6 in figure 5 for tandem welding with argon and 18% CO2 at horizontal
planes (a) 3 mm above the tips of the wires, (b) level with the tips of the wires and (c) 2 mm above the workpiece.
The schematic diagram shows the point of view from which the horizontal planes are viewed.
a
b
c
3
1 2
4 5
20
4. Conclusions
A three-dimensional MHD model of a tandem GMAW arc welding process has been developed for
numerical studies of the interactions between the arcs and the resulting arc deflection, as well as to
investigate air contamination within the gas shield. The model takes into account the complex geometry
of the welding torch. An anti-phase pulse synchronization of the electric current was considered. The arc
interactions and deflection were studied for pure argon and a mixture of argon with 18% CO2.
A complete model would take into account the production and transport of metal vapour, and its influence
on the transport and radiative properties of the plasma. The influence of the formation of metal droplets
would also be included. The emphasis here is, however, on the interactions between the two arcs, and
high-speed photographs of the tandem arcs confirm that the essential features of these interactions are
captured by the model.
The model demonstrates a strong deflection of the arc, especially during the base current phase. During
the pulse current phase, the arc is stabilized due to the arc constriction at the wire. The arc deflection is
increased by the addition of CO2 in the shielding gas. This has been discussed in the context of kink
instabilities, and has been attributed to the higher volumetric enthalpy of CO2.
Two different modes of phase shift were investigated: (1) the upswing of the current in the first arc while
the second arc is still in the pulse phase and (2) the upswing of the first arc when the second arc has
reached the base current phase. Phase shift mode 1 causes oscillations of the arc properties but also a
large-radius arc above the workpiece. Phase shift mode 2 causes a smaller arc radius above the workpiece
but steady arc temperature and flow velocity. The most distinct arc kinking was predicted for the phase
shift mode 1.
The effects of arc interactions, especially the kinking of the base current arc, seem to play an important
role in the introduction of air contaminations into the gas shield. Compared to GMAW tandem welding
with two arcs of equal and constant current, the anti-phase pulse synchronization of the electric current
causes a significant degrading of quality of the gas shield.
The deflection (kinking) of the arc in the base current phase is particularly responsible for high levels of
air contamination in the process region between the arcs and the hot regions of the workpiece. The main
flow of gas into the horizontal arc originates from the flat sides of the nozzle. This flow leads to ambient
air from outer nozzle region being taken into the process region. This contaminating air remains in the gas
shield flow for a long time since it is transported upwards due to the arc deflection and then oscillates due
to periodic changes of base and pulse current phases of the wires.
21
On this basis, it appears that decreasing the arc deflection is a promising approach to improve the quality
of the gas shield and to avoid weld seam imperfections such as porosity, spatter, heat-tint oxidation and
fume deposits beside the weld seam, all of which are exacerbated by the presence of air in the process
region. Several different approaches could be considered. The first, which has been clearly indicated by
the work presented here, is to decrease the CO2 concentration in the shielding gas. A second approach
would be to decrease the arc length, in order to increase the stabilization of the arc due to constriction at
the wire. Finally, the separation of the wires could be increased to decrease the interactions between the
arcs.
22
References
[1] Hedegård J, Andersson J, Tolf E, Weman K and Lundin M 2004 Enhanced prospects for tandem-
MIG/MAG welding Document No XII-1808-04, International Institute of Welding
[2] Hedegård J, Andersson J and Tolf E 2006 The fundamental stability mechanism in tandem-MIG/MAG
welding and how to perform implementation Document No IXII-1895-06, International Institute of
Welding
[3] Hedegård J, Andersson J and Tolf E 2007 High penetration tandem-MIG/MAG welding Document No
XII-1918-07, International Institute of Welding
[4] Tanaka M and Ueyama T 2007 Effects of torch configuration and welding current on weld bead
formation in high speed tandem pulsed GMA welding of steel sheets Document No 212-1081-05,
International Institute of Welding
[5] Goecke S, Hedegård J and Lundin M 2001 Tandem MIG/MAG welding Svetsaren No. 2-3 24–8
[6] Trommer G 2009 Tandem wire process improves ship panel production Weld. J. 88 (9) 42–9
[7] Tanaka M and Ueyama T 2006 Occurrence of arc interference and interruption in tandem pulsed
GMA welding Document No XII-1883-06, International Institute of Welding
[8] Dreher M, Füssel U and Schnick M 2010 Numerical optimization of gas metal arc welding torches
using ANSYS CFX, Proc. 63rd Annual Assembly & International Conference of the International
Institute of Welding, Istanbul
[9] Yudodibroto B Y B, Hermans M J M and Richardson I M 2006 Process stability analysis during
tandem wire arc welding Document No XII-1876-06, International Institute of Welding
[10] Schnick M, Dreher M, Fuessel U and Spille-Kohoff A 2009 Visualization and optimization of
shielding gas flows by arc welding Document No XII-1954-09, International Institute of Welding
23
[11] Ogino Y, Nomura K, Hirata Y 2010 Numerical analysis on heat source characteristics of two-
electrodes TIG arc Document No 212-1179-10, International Institute of Welding
[12] Kaddani A, Zahrai S, Delalondre C and Simonin O 1995 Three-dimensional modelling of unsteady
high-pressure arcs in argon J. Phys. D: Appl. Phys. 28 2294–305
[13] Trelles J P, Pfender E and Heberlein J 2006 Multiscale finite element modeling of arc dynamics in a
DC plasma torch Plasma Chem. Plasma Process. 26 557–75
[14] Colombo V, Concetti A and Ghedini E 2008 Three-dimensional time-dependent modeling of a DC
transferred arc twin-torch system IEEE Trans. Plasma Sci. 36 1038–9
[15] Yang F, Rong M, Wu Y, Murphy A B, Pei J, Wang L, Liu Z and Liu Y 2010 Numerical analysis of
the influence of splitter-plate erosion on an air arc in the quenching chamber of a low-voltage circuit
breaker J. Phys. D: Appl. Phys. 43 434011
[16] Murphy A B 2001 Thermal plasmas in gas mixtures J. Phys. D: Appl. Phys. 34 R151–73
[17] Gleizes A, Gonzalez J J and Freton P 2005 Thermal plasma modelling J. Phys. D: Appl. Phys. 38
R153–83
[18] Murphy A B 2010 The effects of metal vapour in welding arcs J. Phys. D: Appl. Phys. 43 434001
[19] Lowke J J and Tanaka M 2006 ‘LTE-diffusion approximation’ for arc calculations J. Phys. D: Appl.
Phys. 39 3634–43
[20] Murphy A B, Farmer A J D and Haidar J 1992 Laser-scattering measurement of temperature profiles
of a free-burning arc Appl. Phys. Lett. 60 1304–6
[21] Murphy A B 2002 Electron heating in the measurement of electron temperature by Thomson
scattering: Are thermal plasmas thermal Phys. Rev. Lett. 89 025002
[22] Griem H R 1964 Plasma Spectroscopy (New York: McGraw-Hill)
24
[23] Haidar J 1999 Non-equilibrium modelling of transferred arcs J. Phys. D: Appl. Phys. 32 263–72
[24] Jenista J, Heberlein J V R and Pfender E 1997 Numerical model of the anode region of high-current
electric arcs IEEE Trans. Plasma Sci. 25 883–90
[25] Yang G and Heberlein J 2007 Anode attachment modes and their formation in a high intensity argon
arc Plasma Sources Sci. Technol. 16 529–42
[26] Cram L E, Poladian L and Roumeliotis G 1988 Departures from equilibrium in a free-burning argon
arc J. Phys. D: Appl. Phys. 21 418–25
[27] Rat V, Murphy A B, Aubreton J, Elchinger M-F and Fauchais P 2008 Treatment of non-equilibrium
phenomena in thermal plasma flows J. Phys. D: Appl. Phys. 41 183001
[28] Murphy A B, Boulos M I, Colombo V, Fauchais P, Ghedini E, Gleizes A, Mostaghimi J, Proulx P
and Schram D C 2008 High Temp. Mater. Process. 12 255–336
[29] Murphy A B and Arundell C J 1994 Transport coefficients of argon, nitrogen, oxygen, argon–
nitrogen, and argon–oxygen plasmas Plasma Chem. Plasma. Process.14 451–90
[30] Murphy A B 1995 Transport coefficients of air, argon–air, nitrogen–air, and oxygen–air plasmas
Plasma Chem. Plasma Process. 15 279–307
[31] Tashiro S, Tanaka M, Ushio M, Murphy A B and Lowke J J 2006 Prediction of energy source
properties of free-burning arcs Vacuum 80 1190–4
[32] Cressault Y, Teulet P and Gleizes A 2008 Thermal plasma properties in gas or gas-vapour mixtures
Proc. 17th Int. Conf. on Gas Discharges and their Applications (Cardiff, 7–12 September 2008) ed. J E
Jones (Cardiff: GD2008 Local Organizing Committee) pp 149–52
[33] Cram L E 1985 Statistical evaluation of radiative power losses from thermal plasmas due to spectral
lines J. Phys. D: Appl. Phys. 18 401–11
25
[34] Menter F R 1994 Two-equation eddy-viscosity turbulence models for engineering applications AIAA
J. 32 1598–605
[35] Bardina J E, Huang P G and Coakley T J 1997 Turbulence Modeling Validation, Testing, andDevelopment NASA Technical Memorandum 110446 (Moffett Field, CA: NASA Ames Research Center)
[36] Lide D R ed. 2007 CRC Handbook of Chemistry and Physics 88th edn (Boca Raton, USA: CRC
Press)
[37] Schnick M, Füssel U, Hertel M, Spille-Kohoff A and Murphy A B 2010 Metal vapour causes a
central minimum in arc temperature in gas-metal arc welding through increased radiation emission
J. Phys. D: Appl. Phys. 43 022001
[38] Schnick M, Fuessel U, Hertel M, Haessler M, Spille-Kohoff A and Murphy A B Modelling of gas–
metal arc welding taking into account metal vapour J. Phys. D: Appl. Phys. 43 434008
[39] Tanaka M and Lowke J J 2007 Predictions of weld pool profiles using plasma physics J. Phys. D:
Appl. Phys. 40 R1–R23
[40] Murphy A B, Tanaka M, Tashiro S, Sato T and Lowke JJ 2009 A computational investigation of the
effectiveness of different shielding gas mixtures for arc welding J. Phys. D: Appl. Phys. 42 115205
[41] Mentel J 1971 Untersuchung der Wendelinstabilität an einem wandstabilisierten Wasserstoffbogen
Z. Naturforschung 26a 526–38
[42] Farmer A J D and Haddad G N 1984 Local thermodynamic equilibrium in free-burning arcs in argonAppl. Phys. Lett. 45 24–5