Embed Size (px)
Citation preview
RESEARCH ARTICLE
Three-dimensional tooth surface texture
analysis on stall-fed and wild boars (Sus scrofa)
Eisuke YamadaID1,2,3*, Mugino O. Kubo4, Tai Kubo3, Naoki Kohno5,6
1 Department of Evolutionary Studies of Biosystems, School of Advanced Sciences, SOKENDAI (The
Graduate University for Advanced Studies), Hayama, Kanagawa, Japan, 2 Yamanashi Prefectural Museum,
Fuefuki, Yamanashi, Japan, 3 The University Museum, The University of Tokyo, Bunkyo-ku, Tokyo, Japan,
4 Department of Natural Environmental Studies, Graduate School of Frontier Sciences, The University of
Tokyo, Kashiwa, Chiba, Japan, 5 Department of Geology and Paleontology, National Museum of Nature and
Science, Tsukuba, Ibaraki, Japan, 6 Graduate School of Life and Environmental Sciences, University of
Tsukuba, Tsukuba, Ibaraki, Japan
Abstract
Categorizing the archaeological remains of Sus scrofa as domesticated “pigs” or wild
“boars” is often difficult because of their morphological and genetic similarities. For this pur-
pose, we tested whether feeding ecological change of S. scrofa that accompanied their
domestication can be detected based on the three-dimensional texture created on the tooth
enamel surface by mastication. We scanned the lower tooth surface of one wild and one
stall-fed populations of modern S. s. leucomystax and one wild population of S. s. riukiuanus
by using a confocal laser microscope. The average body weight of S. s. leucomystax is
twice as heavier as that of S. s. riukiuanus. The textures were quantified using the industrial
“roughness” standard, ISO 25178, to prevent inter-observer errors and to distinguish small
differences that were difficult to detect by two dimensional image observation. The values of
parameters related to height and volume were significantly larger in the stall-fed population.
Twenty parameters differed significantly between the stall-fed and wild population of S. s.
leucomystax, which indicated that the feeding ecological difference affected the ISO param-
eters of the two boar populations. Six parameters also differed between the wild populations
of S. s. leucomystax and S. s. riukiuanus. Surprisingly, no parameter differed between the
populations of stall-fed S. s. leucomystax and wild S. s. riukiuanus. Consumption of hard
nuts and/or agricultural fruits and crops by the wild population of S. s. riukiuanus may have
produced a tooth surface texture similar to that of the stall-fed population of S. s. leucomys-
tax. Further analysis of S. s. riukiuanus with a known diet is necessary to conclude whether
ISO parameters reflect the dietary transition accompanying the domestication of Sus (e.g.,
wild, semi-domestic, and domestic). Until then, caution is needed in discriminating domesti-
cated populations from wild populations that mainly feed on hard objects.
Introduction
Distinguishing domestic pig from wild boar is often difficult because they are the same species, Susscrofa. Their body sizes and shapes vary corresponding to the climate and nutrition conditions. As
PLOS ONE | https://doi.org/10.1371/journal.pone.0204719 October 23, 2018 1 / 16
a1111111111
a1111111111
a1111111111
a1111111111
a1111111111
OPEN ACCESS
Citation: Yamada E, Kubo MO, Kubo T, Kohno N
(2018) Three-dimensional tooth surface texture
analysis on stall-fed and wild boars (Sus scrofa).
PLoS ONE 13(10): e0204719. https://doi.org/
10.1371/journal.pone.0204719
Editor: Alistair Robert Evans, Monash University,
AUSTRALIA
Received: May 15, 2017
Accepted: September 13, 2018
Published: October 23, 2018
Copyright: © 2018 Yamada et al. This is an open
access article distributed under the terms of the
Creative Commons Attribution License, which
permits unrestricted use, distribution, and
reproduction in any medium, provided the original
author and source are credited.
Data Availability Statement: All relevant data are
within the paper and its Supporting Information
files.
Funding: Funded by The Sasakawa Scientific
Research Grant from The Japan Science Society.
(URL: http://www.jss.or.jp/en/) (Award Number:
27-633, Recipient: Eisuke YAMADA). Japan Society
for the Promotion of Science. (URL: https://www.
jsps.go.jp/english/index.html) (Award Number:
17340156, Recipient: Naoki Kohno). Japan Society
for the Promotion of Science. (URL: https://www.
jsps.go.jp/english/index.html) Cover Letter (Award
a result, the morphology of pigs and boars often overlaps. Genetic characteristics are also unsuitable
for distinguishing them because they can interbreed easily. Therefore, dichotomous approaches for
the identification of zooarchaeological remains as pig or boar are insufficient to describe the com-
plex domestication process of S. scrofa. Instead, the life style of each individual (i.e., whether they
were reared, wild, or feral etc.) can be the key to understanding the continuous domestication pro-
cess [1].
For decades, the examination of microwear using scanning electron microscopy (SEM) has
been used for the dietary reconstruction of fossil species, including those of human ancestors
[2]. Furthermore, Ward and Mainland [3] reported that dental microwear is effective in distin-
guishing stall-fed pigs from free-range paddocked boar. The former showed a low frequency
of scratches and a high frequency of pits, which reflect the consumption of soft pellets, whereas
the latter showed relatively dense microwear features with a high frequency of scratches, which
was caused by soil ingestion during rooting. Based on this report, several studies have already
applied microwear analysis to zooarchaeological remains for inferring the raising conditions
of Sus to determine whether they were fed [4–6]. Assessing dental microwear is particularly
efficient for determining the diet at the time of slaughter or hunting of S. scrofa because it
reflects the diet and foraging behavior of the animal a few days prior to death [7, 8].
To overcome the disadvantages of microwear analysis based on two-dimensional images
(2D), which are prone to inconsistency in scoring definitions [9] and inter-observer errors
[10], three-dimensional (3D) dental microwear texture analysis with an automated quantifica-
tion of “roughness” parameters has recently been developed. For the calculation of roughness,
two standards have been proposed: scale sensitive fractal analysis [11, 12] and surface texture
analysis (STA [13, 14]) using the surface roughness standard of the International Organization
for Standardization (ISO25178 [15]). Both methods have proved to be highly effective in deter-
mining the diet of both extant and extinct species of fish [14, 16], stem mammals [17], pri-
mates [12, 18, 19], carnivores [20–22], bats [23], and hoofed mammals including suids [13,
24–29]. In particular, Merceron et al. [28, 29] reported the effectiveness of dental microwear
texture analysis for detecting dietary differences within the same species, which would also be
efficient in detecting the raising conditions of the domestic animals.
In this study, we tested whether STA with ISO parameters can detect any difference
between wild and stall-fed populations of S. scrofa. In addition, we tested whether these param-
eters differ between subspecies of wild S. scrofa populations with distinct body sizes. Further-
more, we tested whether these parameters differ between the molars of S. scrofa to check the
applicability of the method to an isolated molar regardless of its tooth position. If the parame-
ters differ between domesticated and wild S. scrofa but not between wild populations, these
parameters would be indicated to reflect the feeding ecology of S. scrofa regardless of subspe-
cies or body size, and confirm the utility of STA for assessing archaeological remains to distin-
guish domesticated S. scrofa from wild S. scrofa.
Materials and methods
Ethics statement
Tooth specimens are stored in The University Museum, The University of Tokyo (UMUT),
and the National Museum of Nature and Science, Tokyo (NMNS), or deposited in the Date
City Institute of Funkawan Culture (DCIFC). They were hunted in the 1970s and 1980s with
the permission of the Ministry of the Environment, Japan, or slaughtered as domestic animals.
Permission was obtained from all museums and institutions to access the specimens for scien-
tific purposes. Hence, no animals were sacrificed for this study.
Tooth surface texture analysis on Sus scrofa
PLOS ONE | https://doi.org/10.1371/journal.pone.0204719 October 23, 2018 2 / 16
Number: 15K05333, Recipient: Naoki Kohno)
Japan Society for the Promotion of Science. (URL:
https://www.jsps.go.jp/english/index.html) (Award
Number: 26800267, Recipient: Tai Kubo). Japan
Society for the Promotion of Science. (URL:
https://www.jsps.go.jp/english/index.html) (Award
Number: 16K16340, Recipient: Eisuke YAMADA).
The funders had no role in study design, data
collection and analysis, decision to publish, or
preparation of the manuscript.
Competing interests: The authors have declared
that no competing interests exist.
Specimens
This study analyzed two wild populations and one stall-fed population of S. scrofa (Table 1).
The wild populations were classified as Wild (L) or Wild (S). All individuals (n = 13) in the
Wild (L) group were the Japanese wild boar S. s. leucomystax, which inhabits deciduous
broad-leaved forests of the Tanba region, Hyogo Prefecture, western Honshu, Japan. Asahi
[30] reported the stomach contents of boars from Hyogo, Kyoto, and Osaka prefectures col-
lected during the hunting season of 1970 (i.e., from November 1970 to February 1971). The
leaves, stems, and roots of monocots, such as Gramineae, showed the highest proportion
among the stomach contents. Rhizomes (e.g., potato, arrowroot, yam, and sweet potato)
and fruits and seeds such as beans and hard nuts were also identified. In addition, 30% of
the studied stomachs contained animal matter such as earthworms and insects. In general,
fibrous tissues occupied a high proportion of the stomach contents in both volume and
weight. Asahi [30] assumed that these fibrous tissues were digested bark and roots. How-
ever, in some individuals, bark, roots, and rhizomes were the main stomach contents. The
amount of animal matters was considerably lower, although it was frequently observed. In
summary, S. s. leucomystax mainly rely on roots, barks, and rhizomes in winter.
All individuals (n = 9) of the Wild (S) group were the Ryukyu wild boar S. s. riukiuanushunted in the evergreen forest of Iriomote-jima Island, located in the Ryukyu Archipelago, in
the south-western part of Japan, although the season in which they were hunted was unknown.
Ishigaki et al. [31] reported annual dietary contents of the Iriomote-jima boar based on inter-
views with hunters and investigation of bite marks left on plants. They reported that S. s. riu-kiuanus frequently consumed acorns and other fruits from September to the following April.
From June to September, the boars often damaged agricultural crops and fruits (e.g., pineap-
ples, bananas, mandarin oranges, and rhizomes). They consumed bamboo shoots and the
fruits of evergreen trees from spring to early summer, and the fruits of evergreen shrubs from
summer to early autumn. Plant roots were consumed all year round. The hard nuts (i.e.,
acorns) of evergreen trees were the dietary resource most favored by the boars. Other plant
parts, such as fruits, roots, leaves, and the soft tissues of stems, were also reported as included
in the diet of the boars. The boars also consumed insects, crabs, earthworms, and snakes. A sta-
ble carbon isotope ratio in the dental enamel of the individuals of the Wild (S) population was
in the range of those of C3 plant feeders (–14.0‰ [32]). The ranges of body weight of S. s. leu-comystax and S. s. riukiuanus are 50 to 150 kg and 40 to 50 kg, respectively [33].
All individuals (n = 12) of the stall-fed population mainly fed on corn in a concrete-floored
stall and were slaughtered at 18 months old. They were Japanese wild boars and were thus tax-
onomically and morphologically identical to the Wild (L) population.
Data acquisition
We examined the lingual side of occlusal enamel facets, which occlude during the chewing-
shearing phase. We generally examined the surface texture on Facet 3, as shown in Fig 1. In
cases Facet 3 was broken or extremely dirty, one of the occlusal enamel facets on the lingual
side was examined. This study analyzed specimens with attritional facets, where the tooth
enamel of the occlusal plane was not worn out, corresponding to the Individual Dental Age
Stages 2 and 3 [35].
After the surfaces of the lower first (M1), second (M2), and third molars (M3) were washed
with 100% acetone, tooth surfaces were molded using high-resolution silicone (Affinis light
body, Coltene Co, Switzerland). The molds were scanned using a confocal laser microscope
(VK-9700, Keyence Co, Japan) with a 100x objective super long-distance lens (numerical aper-
ture = 0.95). The microscope had a photomultiplier tube with a 1024×768 pixel frame. The
Tooth surface texture analysis on Sus scrofa
PLOS ONE | https://doi.org/10.1371/journal.pone.0204719 October 23, 2018 3 / 16
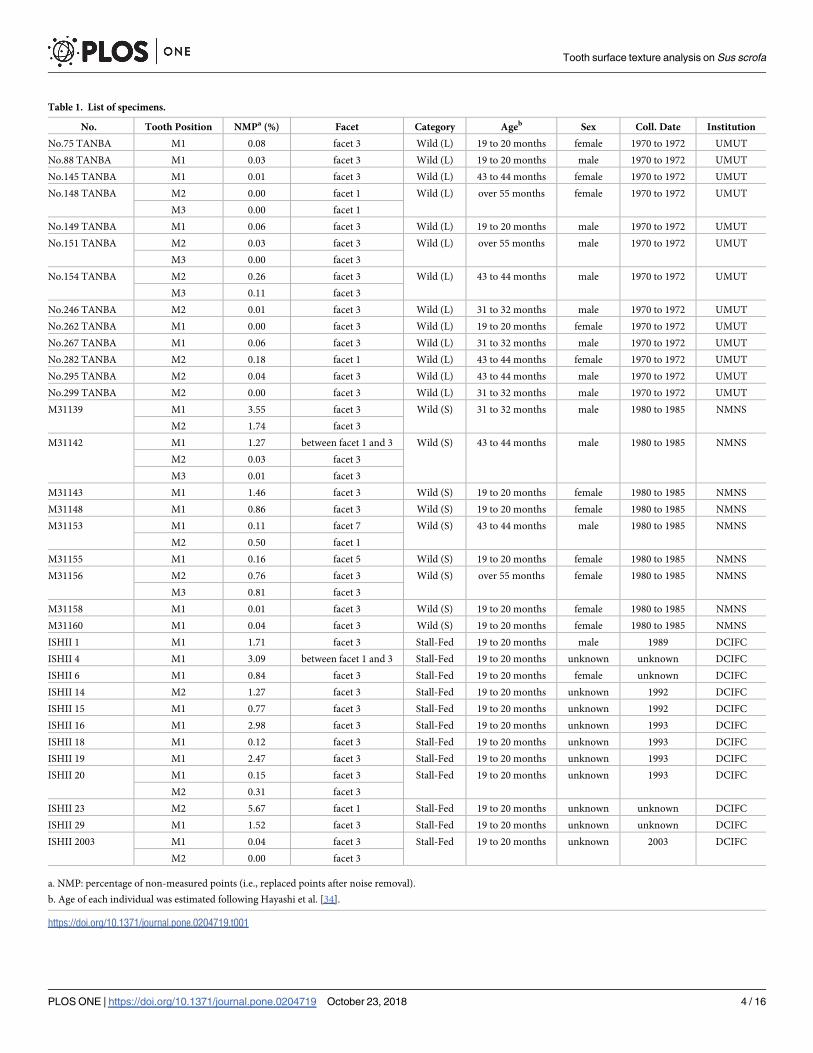
Table 1. List of specimens.
No. Tooth Position NMPa (%) Facet Category Ageb Sex Coll. Date Institution
No.75 TANBA M1 0.08 facet 3 Wild (L) 19 to 20 months female 1970 to 1972 UMUT
No.88 TANBA M1 0.03 facet 3 Wild (L) 19 to 20 months male 1970 to 1972 UMUT
No.145 TANBA M1 0.01 facet 3 Wild (L) 43 to 44 months female 1970 to 1972 UMUT
No.148 TANBA M2 0.00 facet 1 Wild (L) over 55 months female 1970 to 1972 UMUT
M3 0.00 facet 1
No.149 TANBA M1 0.06 facet 3 Wild (L) 19 to 20 months male 1970 to 1972 UMUT
No.151 TANBA M2 0.03 facet 3 Wild (L) over 55 months male 1970 to 1972 UMUT
M3 0.00 facet 3
No.154 TANBA M2 0.26 facet 3 Wild (L) 43 to 44 months male 1970 to 1972 UMUT
M3 0.11 facet 3
No.246 TANBA M2 0.01 facet 3 Wild (L) 31 to 32 months male 1970 to 1972 UMUT
No.262 TANBA M1 0.00 facet 3 Wild (L) 19 to 20 months female 1970 to 1972 UMUT
No.267 TANBA M1 0.06 facet 3 Wild (L) 31 to 32 months male 1970 to 1972 UMUT
No.282 TANBA M2 0.18 facet 1 Wild (L) 43 to 44 months female 1970 to 1972 UMUT
No.295 TANBA M2 0.04 facet 3 Wild (L) 43 to 44 months male 1970 to 1972 UMUT
No.299 TANBA M2 0.00 facet 3 Wild (L) 31 to 32 months male 1970 to 1972 UMUT
M31139 M1 3.55 facet 3 Wild (S) 31 to 32 months male 1980 to 1985 NMNS
M2 1.74 facet 3
M31142 M1 1.27 between facet 1 and 3 Wild (S) 43 to 44 months male 1980 to 1985 NMNS
M2 0.03 facet 3
M3 0.01 facet 3
M31143 M1 1.46 facet 3 Wild (S) 19 to 20 months female 1980 to 1985 NMNS
M31148 M1 0.86 facet 3 Wild (S) 19 to 20 months female 1980 to 1985 NMNS
M31153 M1 0.11 facet 7 Wild (S) 43 to 44 months male 1980 to 1985 NMNS
M2 0.50 facet 1
M31155 M1 0.16 facet 5 Wild (S) 19 to 20 months female 1980 to 1985 NMNS
M31156 M2 0.76 facet 3 Wild (S) over 55 months female 1980 to 1985 NMNS
M3 0.81 facet 3
M31158 M1 0.01 facet 3 Wild (S) 19 to 20 months female 1980 to 1985 NMNS
M31160 M1 0.04 facet 3 Wild (S) 19 to 20 months female 1980 to 1985 NMNS
ISHII 1 M1 1.71 facet 3 Stall-Fed 19 to 20 months male 1989 DCIFC
ISHII 4 M1 3.09 between facet 1 and 3 Stall-Fed 19 to 20 months unknown unknown DCIFC
ISHII 6 M1 0.84 facet 3 Stall-Fed 19 to 20 months female unknown DCIFC
ISHII 14 M2 1.27 facet 3 Stall-Fed 19 to 20 months unknown 1992 DCIFC
ISHII 15 M1 0.77 facet 3 Stall-Fed 19 to 20 months unknown 1992 DCIFC
ISHII 16 M1 2.98 facet 3 Stall-Fed 19 to 20 months unknown 1993 DCIFC
ISHII 18 M1 0.12 facet 3 Stall-Fed 19 to 20 months unknown 1993 DCIFC
ISHII 19 M1 2.47 facet 3 Stall-Fed 19 to 20 months unknown 1993 DCIFC
ISHII 20 M1 0.15 facet 3 Stall-Fed 19 to 20 months unknown 1993 DCIFC
M2 0.31 facet 3
ISHII 23 M2 5.67 facet 1 Stall-Fed 19 to 20 months unknown unknown DCIFC
ISHII 29 M1 1.52 facet 3 Stall-Fed 19 to 20 months unknown unknown DCIFC
ISHII 2003 M1 0.04 facet 3 Stall-Fed 19 to 20 months unknown 2003 DCIFC
M2 0.00 facet 3
a. NMP: percentage of non-measured points (i.e., replaced points after noise removal).
b. Age of each individual was estimated following Hayashi et al. [34].
https://doi.org/10.1371/journal.pone.0204719.t001
Tooth surface texture analysis on Sus scrofa
PLOS ONE | https://doi.org/10.1371/journal.pone.0204719 October 23, 2018 4 / 16

laser wavelength was 408 nm, and the scan pitches were 0.137 μm/pixel for x- and y- axes, with
a vertical resolution of 1 nm. Therefore, the field of view was 140×105 μm. We scanned four
adjacent fields, two by two along the x- and y- axes, and combined them into one large field by
using VK Assembler software (Keyence Co, Japan). ISO parameters were calculated from
these combined fields by using surface roughness software (Mountains Map 7 ver. 7. 4. 8226,
Digital Surf Co, France).
Because the molds were mirror images of the real tooth surfaces, the coordinates were mir-
rored in the x- and z- axes. The surface data were leveled to remove the inclination of the
mold. We used a robust Gaussian filter (cut-off scale, 0.8μm) as an S-filter to remove measure-
ment noise, and then applied the form removal function of Mountains Map 7 software (a sec-
ond order polynomial function) as an F-operation to remove large-scale curvatures of the
mold surface. Subsequently, following Arman et al. [36], the features with a slope >80˚ were
considered as noise points and were replaced with the mean of the neighboring points. Per-
centages of replaced points were calculated for each scan. After these preparations, ISO 25178
parameters were calculated for the 3D coordinates of each mold. A specimen showing over 5%
of replaced points (i.e., ISHII 23, Table 1) was excluded from following analyses. As the results
of primary comparisons, the data patterns of each ISO parameter among the populations of
the same dental age or facet (Facet 3) were similar to the patterns for different ages or facets.
Therefore, we considered the effect of a difference in age and/or facet to be negligible.
Fig 1. Occlusal enamel facets examined in surface texture analysis. This study generally examined Facet 3, as shown in the figure. In cases where Facet 3
was broken or extremely dirty, one of the facets highlighted in this figure was examined. The facet examined for each specimen is shown in Table 1.
https://doi.org/10.1371/journal.pone.0204719.g001
Tooth surface texture analysis on Sus scrofa
PLOS ONE | https://doi.org/10.1371/journal.pone.0204719 October 23, 2018 5 / 16
Data analysis
To test the applicability of STA against an isolated tooth in later tests, we first tested whether
the ISO parameters varied between M1 and M2 (five pairs), or M2 and M3 (five pairs), using
matched pairwise comparison (i.e., Wilcoxon signed-rank test).
To examine the sensitivity of the ISO parameters against the feeding ecology of S. scrofa,
each parameter was statistically compared among the populations with Holm adjustment [37].
We performed pairwise comparisons between populations using parametric or non-paramet-
ric methods depending on the distribution and variance of each ISO parameter. Before com-
parisons, the Shapiro Wilk normality test and the Bartlett test of homogeneity of variances
were performed to determine which statistical methods were most appropriate. We performed
one-way analysis of variance (ANOVA) on the parameters with normal distribution and
homogeneity of variance, as well as on the parameters with homogeneity of variance after log
transformation. When the data were distributed normally but variances were not homoge-
neous, a Welch ANOVA was performed. For the ISO parameters that were not normally dis-
tributed even after log transformation, the Wilcoxon rank sum test was applied as a non-
parametric alternative. The comparisons were performed based on three datasets; 1) M1 only
(n = 24), 2) M2 only (n = 14), and 3) either M1 or M2 (n = 33) to increase the sample size. In
the last dataset, when several teeth were available for the same individual, we used ISO parame-
ters of the tooth that erupted earlier. Therefore, only one specimen was used for each individ-
ual in any case. Statistical tests were performed using R x64 ver. 3.3.3 [38].
Results
Among the 35 ISO 25178 parameters examined, Sda (average area of dales connected to the
edge at a defined height; see S1 Table for basic statistics of the parameters) differed signifi-
cantly between M1 and M2 (Table 2). Average scores of Sda were 317.93 μm2 for M1 and
559.04 μm2 for M2.
Pairwise comparisons among the populations that used either M1 or M2 were performed
using all ISO parameters except Sda, which differed significantly between M1 and M2. Conse-
quently, the stall-fed and Wild (S) populations differed significantly from the Wild (L) popula-
tion in 20 and six parameters, respectively (Table 3).
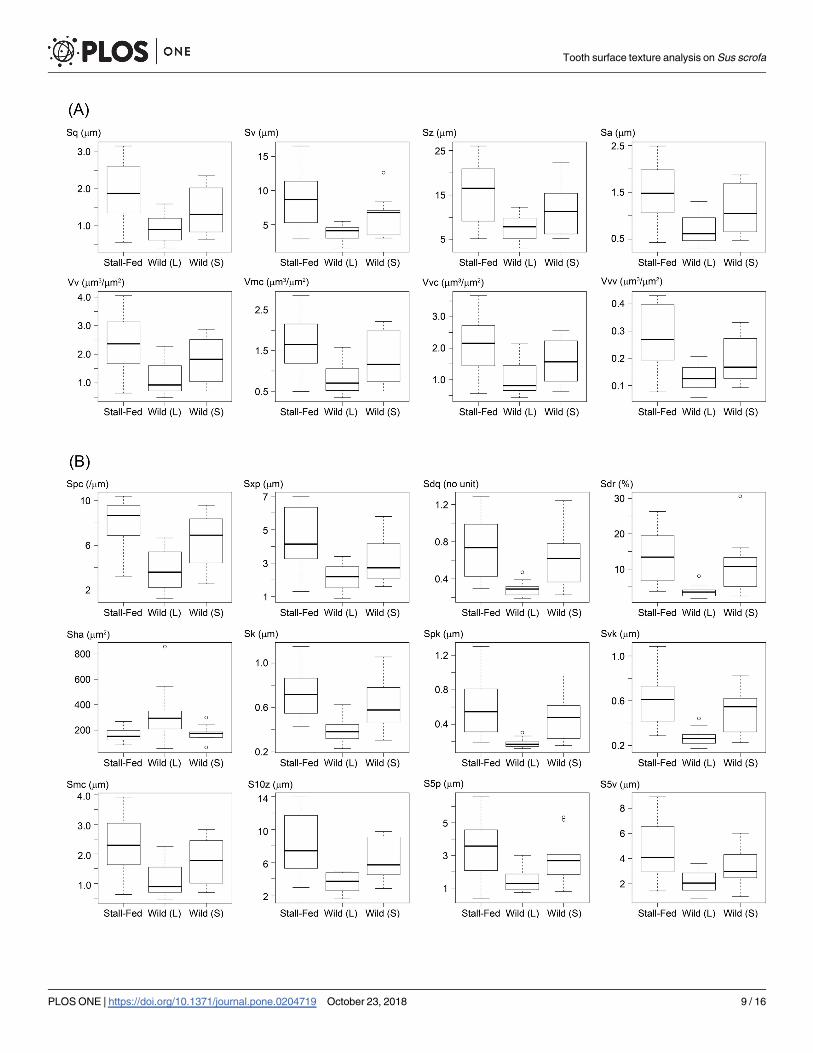
Among the three populations, the stall-fed or Wild (L) populations showed the highest or
lowest average values and the value for the Wild (S) population was between the other two
populations for all 20 parameters, which differed significantly between populations (Table 3
and Fig 2A and 2B). The value of the height parameters of the surface texture (i.e., Sq, Sv, Sz,
and Sa) were significantly larger in the stall-fed population, indicating higher hill peaks and
deeper dales on the tooth surface compared to those in the Wild (L) population (Fig 2A). The
parameters related to volume were also larger in the stall-fed population. Higher values of Vv,
Vvc, and Vvv indicated that the valley structures were larger in volume, and higher values of
Vm, Vmc, and Vmp indicated larger hill volume on the tooth surface of the stall-fed popula-
tion compared with the Wild (L) population (Fig 2A). Six parameters (Sdq, Sdr, Spc, Sk, Svk,
and Spk) differed significantly between the Wild (L) population and the other two populations
(Fig 2B). Larger values in Sdq and Sdr indicated steeper hills and dales, and higher values of
Spc and Spk indicated more pointed, angled peaks in the Wild (S) and the stall-fed populations
compared with the Wild (L) population. Conversely, neither height nor volume parameters
differed significantly between the two wild populations.
When pairwise comparisons among the populations were performed separately for M1 and
M2, the results were similar to those using both M1 and M2, although the number of signifi-
cant parameters was much smaller for the M2-only dataset (Table 4). Again, the parameters
Tooth surface texture analysis on Sus scrofa
PLOS ONE | https://doi.org/10.1371/journal.pone.0204719 October 23, 2018 6 / 16
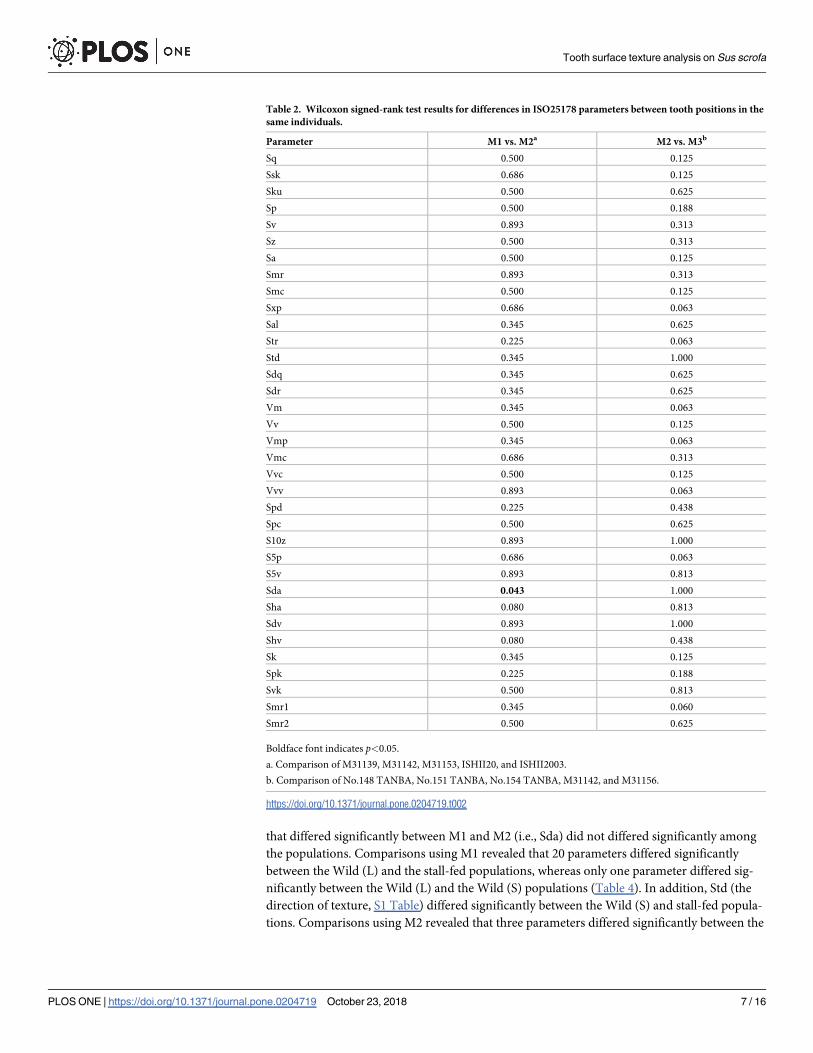
that differed significantly between M1 and M2 (i.e., Sda) did not differed significantly among
the populations. Comparisons using M1 revealed that 20 parameters differed significantly
between the Wild (L) and the stall-fed populations, whereas only one parameter differed sig-
nificantly between the Wild (L) and the Wild (S) populations (Table 4). In addition, Std (the
direction of texture, S1 Table) differed significantly between the Wild (S) and stall-fed popula-
tions. Comparisons using M2 revealed that three parameters differed significantly between the
Table 2. Wilcoxon signed-rank test results for differences in ISO25178 parameters between tooth positions in the
same individuals.
Parameter M1 vs. M2a M2 vs. M3b
Sq 0.500 0.125
Ssk 0.686 0.125
Sku 0.500 0.625
Sp 0.500 0.188
Sv 0.893 0.313
Sz 0.500 0.313
Sa 0.500 0.125
Smr 0.893 0.313
Smc 0.500 0.125
Sxp 0.686 0.063
Sal 0.345 0.625
Str 0.225 0.063
Std 0.345 1.000
Sdq 0.345 0.625
Sdr 0.345 0.625
Vm 0.345 0.063
Vv 0.500 0.125
Vmp 0.345 0.063
Vmc 0.686 0.313
Vvc 0.500 0.125
Vvv 0.893 0.063
Spd 0.225 0.438
Spc 0.500 0.625
S10z 0.893 1.000
S5p 0.686 0.063
S5v 0.893 0.813
Sda 0.043 1.000
Sha 0.080 0.813
Sdv 0.893 1.000
Shv 0.080 0.438
Sk 0.345 0.125
Spk 0.225 0.188
Svk 0.500 0.813
Smr1 0.345 0.060
Smr2 0.500 0.625
Boldface font indicates p<0.05.
a. Comparison of M31139, M31142, M31153, ISHII20, and ISHII2003.
b. Comparison of No.148 TANBA, No.151 TANBA, No.154 TANBA, M31142, and M31156.
https://doi.org/10.1371/journal.pone.0204719.t002
Tooth surface texture analysis on Sus scrofa
PLOS ONE | https://doi.org/10.1371/journal.pone.0204719 October 23, 2018 7 / 16
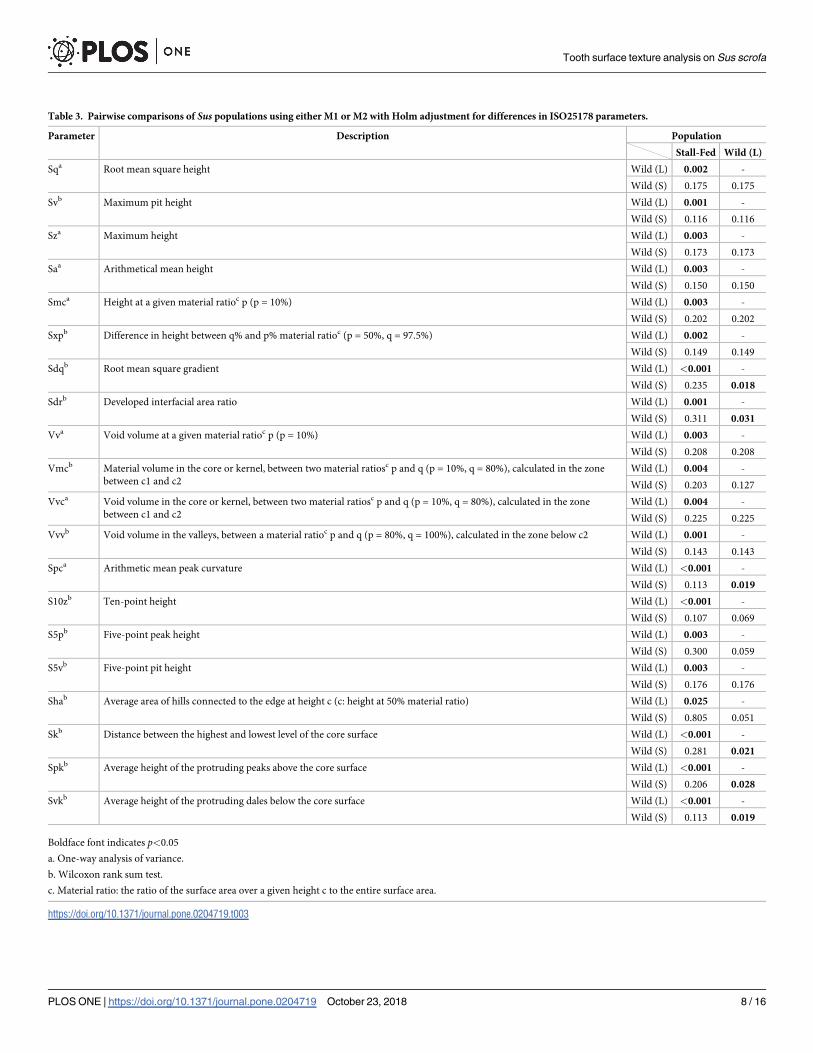
Table 3. Pairwise comparisons of Sus populations using either M1 or M2 with Holm adjustment for differences in ISO25178 parameters.
Parameter Description Population
Stall-Fed Wild (L)
Sqa Root mean square height Wild (L) 0.002 -
Wild (S) 0.175 0.175
Svb Maximum pit height Wild (L) 0.001 -
Wild (S) 0.116 0.116
Sza Maximum height Wild (L) 0.003 -
Wild (S) 0.173 0.173
Saa Arithmetical mean height Wild (L) 0.003 -
Wild (S) 0.150 0.150
Smca Height at a given material ratioc p (p = 10%) Wild (L) 0.003 -
Wild (S) 0.202 0.202
Sxpb Difference in height between q% and p% material ratioc (p = 50%, q = 97.5%) Wild (L) 0.002 -
Wild (S) 0.149 0.149
Sdqb Root mean square gradient Wild (L) <0.001 -
Wild (S) 0.235 0.018
Sdrb Developed interfacial area ratio Wild (L) 0.001 -
Wild (S) 0.311 0.031
Vva Void volume at a given material ratioc p (p = 10%) Wild (L) 0.003 -
Wild (S) 0.208 0.208
Vmcb Material volume in the core or kernel, between two material ratiosc p and q (p = 10%, q = 80%), calculated in the zone
between c1 and c2
Wild (L) 0.004 -
Wild (S) 0.203 0.127
Vvca Void volume in the core or kernel, between two material ratiosc p and q (p = 10%, q = 80%), calculated in the zone
between c1 and c2
Wild (L) 0.004 -
Wild (S) 0.225 0.225
Vvvb Void volume in the valleys, between a material ratioc p and q (p = 80%, q = 100%), calculated in the zone below c2 Wild (L) 0.001 -
Wild (S) 0.143 0.143
Spca Arithmetic mean peak curvature Wild (L) <0.001 -
Wild (S) 0.113 0.019
S10zb Ten-point height Wild (L) <0.001 -
Wild (S) 0.107 0.069
S5pb Five-point peak height Wild (L) 0.003 -
Wild (S) 0.300 0.059
S5vb Five-point pit height Wild (L) 0.003 -
Wild (S) 0.176 0.176
Shab Average area of hills connected to the edge at height c (c: height at 50% material ratio) Wild (L) 0.025 -
Wild (S) 0.805 0.051
Skb Distance between the highest and lowest level of the core surface Wild (L) <0.001 -
Wild (S) 0.281 0.021
Spkb Average height of the protruding peaks above the core surface Wild (L) <0.001 -
Wild (S) 0.206 0.028
Svkb Average height of the protruding dales below the core surface Wild (L) <0.001 -
Wild (S) 0.113 0.019
Boldface font indicates p<0.05
a. One-way analysis of variance.
b. Wilcoxon rank sum test.
c. Material ratio: the ratio of the surface area over a given height c to the entire surface area.
https://doi.org/10.1371/journal.pone.0204719.t003
Tooth surface texture analysis on Sus scrofa
PLOS ONE | https://doi.org/10.1371/journal.pone.0204719 October 23, 2018 8 / 16
Tooth surface texture analysis on Sus scrofa
PLOS ONE | https://doi.org/10.1371/journal.pone.0204719 October 23, 2018 9 / 16
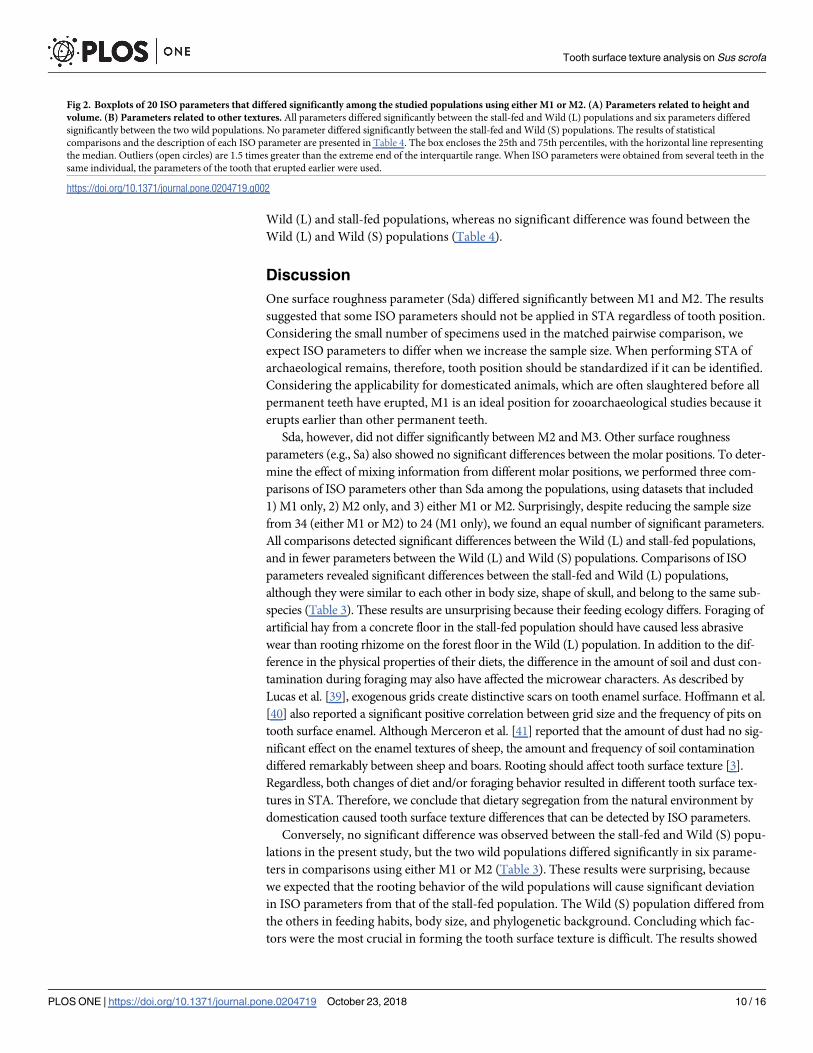
Wild (L) and stall-fed populations, whereas no significant difference was found between the
Wild (L) and Wild (S) populations (Table 4).
Discussion
One surface roughness parameter (Sda) differed significantly between M1 and M2. The results
suggested that some ISO parameters should not be applied in STA regardless of tooth position.
Considering the small number of specimens used in the matched pairwise comparison, we
expect ISO parameters to differ when we increase the sample size. When performing STA of
archaeological remains, therefore, tooth position should be standardized if it can be identified.
Considering the applicability for domesticated animals, which are often slaughtered before all
permanent teeth have erupted, M1 is an ideal position for zooarchaeological studies because it
erupts earlier than other permanent teeth.
Sda, however, did not differ significantly between M2 and M3. Other surface roughness
parameters (e.g., Sa) also showed no significant differences between the molar positions. To deter-
mine the effect of mixing information from different molar positions, we performed three com-
parisons of ISO parameters other than Sda among the populations, using datasets that included
1) M1 only, 2) M2 only, and 3) either M1 or M2. Surprisingly, despite reducing the sample size
from 34 (either M1 or M2) to 24 (M1 only), we found an equal number of significant parameters.
All comparisons detected significant differences between the Wild (L) and stall-fed populations,
and in fewer parameters between the Wild (L) and Wild (S) populations. Comparisons of ISO
parameters revealed significant differences between the stall-fed and Wild (L) populations,
although they were similar to each other in body size, shape of skull, and belong to the same sub-
species (Table 3). These results are unsurprising because their feeding ecology differs. Foraging of
artificial hay from a concrete floor in the stall-fed population should have caused less abrasive
wear than rooting rhizome on the forest floor in the Wild (L) population. In addition to the dif-
ference in the physical properties of their diets, the difference in the amount of soil and dust con-
tamination during foraging may also have affected the microwear characters. As described by
Lucas et al. [39], exogenous grids create distinctive scars on tooth enamel surface. Hoffmann et al.
[40] also reported a significant positive correlation between grid size and the frequency of pits on
tooth surface enamel. Although Merceron et al. [41] reported that the amount of dust had no sig-
nificant effect on the enamel textures of sheep, the amount and frequency of soil contamination
differed remarkably between sheep and boars. Rooting should affect tooth surface texture [3].
Regardless, both changes of diet and/or foraging behavior resulted in different tooth surface tex-
tures in STA. Therefore, we conclude that dietary segregation from the natural environment by
domestication caused tooth surface texture differences that can be detected by ISO parameters.
Conversely, no significant difference was observed between the stall-fed and Wild (S) popu-
lations in the present study, but the two wild populations differed significantly in six parame-
ters in comparisons using either M1 or M2 (Table 3). These results were surprising, because
we expected that the rooting behavior of the wild populations will cause significant deviation
in ISO parameters from that of the stall-fed population. The Wild (S) population differed from
the others in feeding habits, body size, and phylogenetic background. Concluding which fac-
tors were the most crucial in forming the tooth surface texture is difficult. The results showed
Fig 2. Boxplots of 20 ISO parameters that differed significantly among the studied populations using either M1 or M2. (A) Parameters related to height and
volume. (B) Parameters related to other textures. All parameters differed significantly between the stall-fed and Wild (L) populations and six parameters differed
significantly between the two wild populations. No parameter differed significantly between the stall-fed and Wild (S) populations. The results of statistical
comparisons and the description of each ISO parameter are presented in Table 4. The box encloses the 25th and 75th percentiles, with the horizontal line representing
the median. Outliers (open circles) are 1.5 times greater than the extreme end of the interquartile range. When ISO parameters were obtained from several teeth in the
same individual, the parameters of the tooth that erupted earlier were used.
https://doi.org/10.1371/journal.pone.0204719.g002
Tooth surface texture analysis on Sus scrofa
PLOS ONE | https://doi.org/10.1371/journal.pone.0204719 October 23, 2018 10 / 16
that STA was not always a powerful tool for identifying domesticated individuals. Previous
studies analyzing several species with different body sizes [13, 26] have suggested that feeding
ecology (e.g., diet, foraging behavior, exogenous grits, vegetation, and climate) is the key factor
in forming characteristics of tooth surface texture. Therefore, we also require detailed feeding
ecological information of the individuals in the Wild (S) population to reach a conclusion on
this issue.
Ward and Mainland [3] reported that the microwear of free-range boars in large grassland
paddocks were characterized by a high frequency of scratches, which was an indicator of shear-
ing foods with abrasive matter such as soil contaminated during rooting. By contrast, the tooth
surfaces of stall-fed pigs were primarily dominated by pits or gouges, which are typical micro-
wear characteristics, indicative of the crushing of hard objects [42, 43] or the pulping of soft
food [44, 45]. Two-dimensional images reconstructed from 3D coordinates taken from our
specimens also indicated that the tooth surfaces of the Wild (L) population, which performed
rooting in deciduous forests, were dominated by scratches, whereas those of the stall-fed popu-
lation, which fed on corn hay (i.e., they did not perform rooting), were dominated by pits (Figs
3 and S1, S2, and S3). Nevertheless, the microwear of the Wild (S) population showed more
variation; some was dominated by scratches but some was dominated by pitting. The year-
round consumption of nuts by the Wild (S) population may have contributed to the similarity
of the microwear to that of the stall-fed population (S2 Fig). As mentioned, both the crushing
of hard objects and the tooth-to-tooth contact associated with the soft food pulping are known
to create pits and gouges, increasing the height and volume of the tooth surface texture. Calan-
dra et al. [43] reported that some primate species consuming mainly soft food showed similar
ISO parameter values to those of the other species that rely on hard nuts.
Furthermore, we must consider the effect of human encroachment on the habitat of the
Wild (S) population. Ishigaki [31] reported that the Ryukyu wild boar forages on agricultural
fruits and crops, particularly from June to September, in addition to hard nuts such as acorns in
other seasons. In the case of individuals in the Wild (S) population, which also often invade cul-
tivation areas, it is unsurprising that their tooth surface textures were similar to those of reared
pigs (i.e., artificially fed on crops). Winkler et al. [46] also reported that the tooth surface tex-
tures of modern small mammals were affected by forest cultivation. Some of the Wild (S) popu-
lation may have consumed agricultural crops before being hunted, which resulted in the surface
texture of their teeth being similar to that of the stall-fed population. The zooarchaeological
specimens probably also contained some free-range individual inhabiting a cultivation area
after harvest season. If the similarity between the Wild (S) and the stall-fed populations was due
to the consumption of agricultural crops, STA might be able to classify those archaeological
individuals similarly to the Wild (S) population indicating they were not fully domesticated, but
rather at a transitional stage from wild to reared.
However, if the consumption of nuts caused the similarity between the Wild (S) and the
stall-fed populations, biochemical analyses for carbides or fatty acids left on artificial remains
(e.g., pottery) co-excavated with Sus, and/or application of both STA and stable isotope analy-
sis of the same individuals will be necessary to propose a reliable hypothesis of the feeding ecol-
ogy based on zooarchaeological Sus remains. Therefore, in addition to studies using modern
specimens with a known diet, combination with other methods is necessary to reconstruct the
sequential dietary transition corresponding to the degree of domestication at the individual
level. The non-destructive nature of STA is a remarkable advantage of this approach.
The present study showed the caution required in applying STA with the ISO parameters
for archaeological Sus remains to categorize them as wild or domesticated. The comparison
between the stall-fed and Wild (L) populations, in which diet was the primary variable that dif-
fered, suggested that the differences were due to the different feeding ecology detected in the
Tooth surface texture analysis on Sus scrofa
PLOS ONE | https://doi.org/10.1371/journal.pone.0204719 October 23, 2018 11 / 16
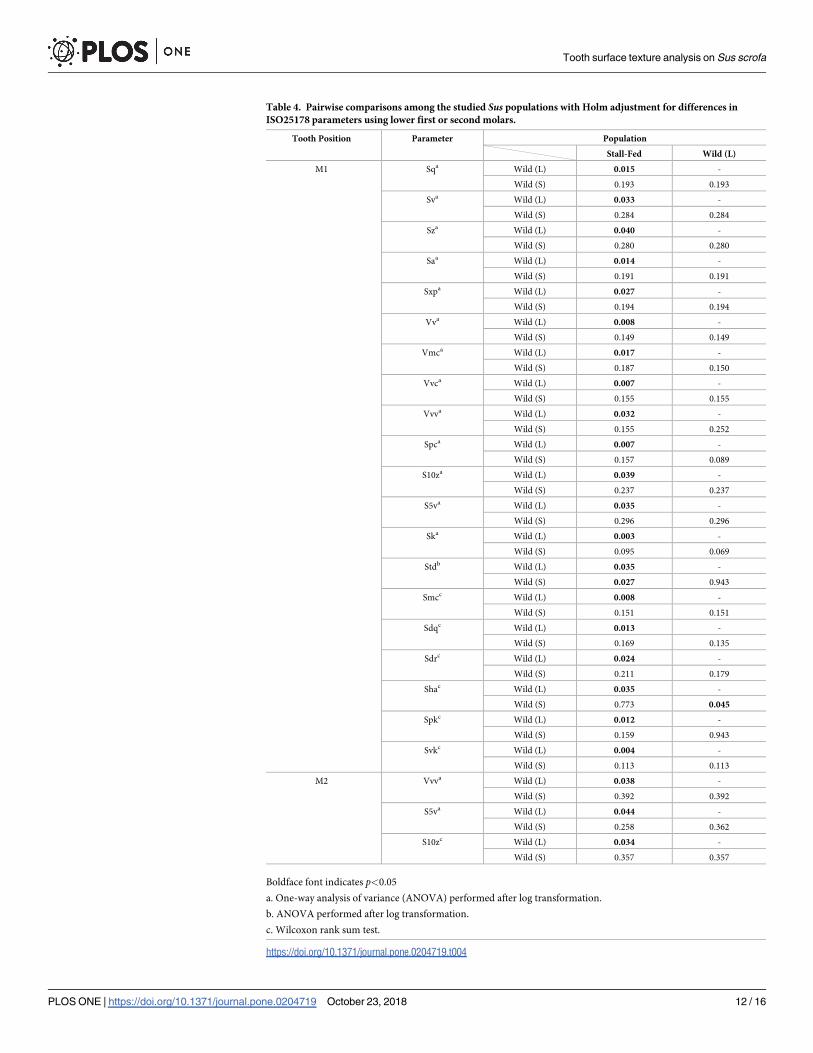
Table 4. Pairwise comparisons among the studied Sus populations with Holm adjustment for differences in
ISO25178 parameters using lower first or second molars.
Tooth Position Parameter Population
Stall-Fed Wild (L)
M1 Sqa Wild (L) 0.015 -
Wild (S) 0.193 0.193
Sva Wild (L) 0.033 -
Wild (S) 0.284 0.284
Sza Wild (L) 0.040 -
Wild (S) 0.280 0.280
Saa Wild (L) 0.014 -
Wild (S) 0.191 0.191
Sxpa Wild (L) 0.027 -
Wild (S) 0.194 0.194
Vva Wild (L) 0.008 -
Wild (S) 0.149 0.149
Vmca Wild (L) 0.017 -
Wild (S) 0.187 0.150
Vvca Wild (L) 0.007 -
Wild (S) 0.155 0.155
Vvva Wild (L) 0.032 -
Wild (S) 0.155 0.252
Spca Wild (L) 0.007 -
Wild (S) 0.157 0.089
S10za Wild (L) 0.039 -
Wild (S) 0.237 0.237
S5va Wild (L) 0.035 -
Wild (S) 0.296 0.296
Ska Wild (L) 0.003 -
Wild (S) 0.095 0.069
Stdb Wild (L) 0.035 -
Wild (S) 0.027 0.943
Smcc Wild (L) 0.008 -
Wild (S) 0.151 0.151
Sdqc Wild (L) 0.013 -
Wild (S) 0.169 0.135
Sdrc Wild (L) 0.024 -
Wild (S) 0.211 0.179
Shac Wild (L) 0.035 -
Wild (S) 0.773 0.045
Spkc Wild (L) 0.012 -
Wild (S) 0.159 0.943
Svkc Wild (L) 0.004 -
Wild (S) 0.113 0.113
M2 Vvva Wild (L) 0.038 -
Wild (S) 0.392 0.392
S5va Wild (L) 0.044 -
Wild (S) 0.258 0.362
S10zc Wild (L) 0.034 -
Wild (S) 0.357 0.357
Boldface font indicates p<0.05
a. One-way analysis of variance (ANOVA) performed after log transformation.
b. ANOVA performed after log transformation.
c. Wilcoxon rank sum test.
https://doi.org/10.1371/journal.pone.0204719.t004
Tooth surface texture analysis on Sus scrofa
PLOS ONE | https://doi.org/10.1371/journal.pone.0204719 October 23, 2018 12 / 16
ISO parameters. However, the wild S. scrofa that fed on hard objects and/or agricultural
resources could be misjudged as stall-fed individuals based on STA. In other words, wild boars
that feed on tough objects such as leaves, like the Wild (L) population in this study, can be dis-
tinguished from domesticated pigs, but wild boars that feed on hard objects may not be distin-
guishable from domesticated pigs.
Supporting information
S1 Fig. Two dimensional teeth surface images of the individuals of Wild (L) population.
Scale bar = 0.1 mm. (A) No.75, (B) No.88, (C) No.145, (D) No.148 M2, (E) No.148 M3, (F)
No.149, (G) No.151 M2, (H) No.151 M3, (I) No.154 M2, (J) No.154 M3, (K) No.246, (L)
No.262, (M) No.267, (N) No.282, (O) No.295, (P) No.299.
(TIF)
S2 Fig. Two dimensional teeth surface images of the individuals of Wild (S) population.
Scale bar = 0.1 mm. (A) M31139 M1, (B) M31139 M2, (C) M31142 M1, (D) M31142 M2, (E)
M31142 M3, (F) M31143, (G) M31148, (H) M31153 M1, (I) M31153 M2, (J) M31155, (K)
M31156 M2, (L) M31156 M3, (M) M31158, (N) M31160.
(TIF)
S3 Fig. Two dimensional teeth surface images of the individuals of stall-fed population.
Scale bar = 0.1 mm. (A) ISHII 1, (B) ISHII 4, (C) ISHII 6, (D) ISHII 14, (E) ISHII 15, (F) ISHII
16, (G) ISHII 18, (H) ISHII 19 M1, (I) ISHII 20 M2, (J) ISHII 20, (K) ISHII 23, (L) ISHII 29,
Fig 3. Representative images of microwear on the tooth surface of the studied populations, reconstructed from 3D coordinates. The 3D images (lower images)
are mirrored from the 2D images (upper images). (A) Wild (L), (B) Wild (S), (C) Stall-fed. Scale bar = 0.1 mm.
https://doi.org/10.1371/journal.pone.0204719.g003
Tooth surface texture analysis on Sus scrofa
PLOS ONE | https://doi.org/10.1371/journal.pone.0204719 October 23, 2018 13 / 16
(M) ISHII 2003 M1, (N) ISHII 2003 M2.
(TIF)
S1 Table. All values of ISO25178 parameters. a. Material ratio: the ratio of surface area over
given height c to all surface area.
(XLSX)
Acknowledgments
We are grateful to H. Endo (The University Museum, The University of Tokyo), Y. Hayashi,
and S. Kawada (National Museum of Nature and Science, Tokyo) for providing the opportu-
nity to analyze the specimens stored at respective institutions. We are also grateful to T. Nishi-
moto (National Museum of Japanese History) for providing the opportunity to analyze the
specimens of the stall-fed population, which he collected and deposited at Date City Institute
of Funkawan Culture. We thank H. Hongo (The Graduate University for Advanced Studies)
for providing information about rearing condition of the stall-fed population. We would like
to express our respect to the late T. Ishii (the ISHII Farm Co.), who succeeded in the breeding
of wild boar. Finally, we would like to thank E. K. Schulz and two anonymous reviewers, and
A. R. Evans (handling editor) for their constructive comments.
Author Contributions
Conceptualization: Eisuke Yamada, Mugino O. Kubo.
Data curation: Eisuke Yamada, Mugino O. Kubo, Tai Kubo, Naoki Kohno.
Formal analysis: Eisuke Yamada.
Funding acquisition: Eisuke Yamada, Tai Kubo, Naoki Kohno.
Investigation: Eisuke Yamada, Mugino O. Kubo, Tai Kubo.
Methodology: Eisuke Yamada, Mugino O. Kubo.
Project administration: Eisuke Yamada.
Resources: Naoki Kohno.
Software: Tai Kubo.
Supervision: Eisuke Yamada.
Validation: Eisuke Yamada, Mugino O. Kubo, Tai Kubo, Naoki Kohno.
Visualization: Eisuke Yamada, Mugino O. Kubo, Tai Kubo.
Writing – original draft: Eisuke Yamada.
Writing – review & editing: Mugino O. Kubo, Tai Kubo, Naoki Kohno.
References1. Rowley-Conwy P, Albarella U, Dobney K. Distinguishing wild boar from domestic pigs in prehistory: A
review of approaches and recent results. J World Prehist. 2012; 25: 1–44.
2. Grine FE. Dental evidence for dietary differences in Australopithecus and Paranthropus: a quantitative
analysis of permanent molar microwear. J Hum Evol. 1986; 15: 783–822.
3. Ward J, Mainland IL. Microwear in modern rooting and stall-fed pigs: the potential of dental microwear
analysis for exploring pig diet and management in the past. Environ Archaeol. 1999; 4: 25–32.
4. Wilkie T, Mainland I, Albarella U, Dobney K, Rowley-Conwy PA. Dental microwear study of pig diet and
management in Iron Age, Romano-British, Anglo-Scandinavian, and medieval contexts in England. In:
Tooth surface texture analysis on Sus scrofa
PLOS ONE | https://doi.org/10.1371/journal.pone.0204719 October 23, 2018 14 / 16
Albarella U, Dobney K, Ervynck A, Rowley-Conwy P, editor. Pigs and humans: 10,000 years of interac-
tion. Oxford: Oxford University Press; 2007. pp. 241–254.
5. Vanpoucke S, Mainland I, De Cupere B, Waelkens M. Dental microwear study of pigs from the classical
site of Sagalassos (SW Turkey) as an aid for the reconstruction of husbandry practices in ancient times.
Environ Archaeol. 2009; 14: 137–154.
6. Rivals F, Gardeisen A, Cantuel J. Domestic and wild ungulate dietary traits at Kouphovouno (Sparta,
Greece): Implications for livestock management and paleoenvironment in the Neolithic. J Archaeol Sci.
2011; 38: 528–537.
7. Teaford MF, Oyen OJ. Differences in the rate of molar wear between monkeys raised on different diets.
J Dent Res. 1989; 68: 1513–1518. https://doi.org/10.1177/00220345890680110901 PMID: 2584518
8. Teaford MF, Oyen OJ. In vivo and in vitro turnover in dental microwear. Am J Phys Anthropol. 1989; 80:
447–460. https://doi.org/10.1002/ajpa.1330800405 PMID: 2513725
9. Solounias N, Hayek LAC. New methods of tooth microwear analysis and application to dietary determi-
nation of two extinct antelope species. J Zool. 1993; 229: 421–445.
10. Grine FE, Ungar PS, Teaford MF. Error rates in dental microwear quantification using scanning electron
microscopy. Scanning. 2002; 24: 144–153. PMID: 12074496
11. Ungar PS, Brown CA, Bergstrom TS, Walker AC. Quantification of dental microwear by tandem scan-
ning confocal microscopy and scale-sensitive fractal analyses. Scanning. 2003; 25: 185–193. PMID:
12926610
12. Scott RS, Ungar PS, Bergstrom TS, Brown CA, Grine FE, Teaford MF, et al. Dental microwear texture
analysis shows within-species diet variability in fossil hominins. Nature. 2005; 436: 693–695. https://doi.
org/10.1038/nature03822 PMID: 16079844
13. Schulz E, Calandra I, Kaiser TM. Applying tribology to teeth of hoofed mammals. Scanning. 2010; 32:
162–182. https://doi.org/10.1002/sca.20181 PMID: 20949615
14. Purnell M, Seehausen O, Galis F. Quantitative three-dimensional microtextural analyses of tooth wear
as a tool for dietary discrimination in fishes. J R Soc Interface. 2012; 9: 2225–2233. https://doi.org/10.
1098/rsif.2012.0140 PMID: 22491979
15. ISO 25178–2, Geometrical Product Specifications (GPS)—Surface Texture: Areal—Part 2: Terms, Def-
initions and Surface Texture Parameters. Berlin: International Organization for Standardization; 2012.
47pp.
16. Purnell MA, Darras LPG. 3D tooth microwear texture analysis in fishes as a test of dietary hypotheses
of durophagy. Surf Topogr Metrol Prop. 2015; 4: 014006.
17. Gill PG, Purnell MA, Crumpton N, Robson Brown K, Gostling NJ, Stamponi M, et al. Dietary specializa-
tions and diversity in feeding ecology of the earliest stem mammals. Nature. 2014; 512: 303–305.
https://doi.org/10.1038/nature13622 PMID: 25143112
18. Ungar PS, Scott RS, Grine FE, Teaford M. Molar microwear textures and the diets of Australopithecus
anamensis and Australopithecus afarensis. Philos Trans R Soc Lond B Biol Sci. 2010; 365: 3345–3354.
https://doi.org/10.1098/rstb.2010.0033 PMID: 20855308
19. Merceron G, Taylor S, Scott R, Chaimanee Y, Jaeger JJ. Dietary characterization of the hominoid Khor-
atpithecus (Miocene of Thailand): evidence from dental topographic and microwear texture analyses.
Naturwissenschaften. 2006; 93: 329–333. https://doi.org/10.1007/s00114-006-0107-0 PMID:
16604335
20. Schubert BW, Ungar PS, DeSantis LRG. Carnassial microwear and dietary behaviour in large carnivor-
ans. J Zool. 2010; 280: 257–263.
21. Stynder DD, Ungar PS, Scott JR, Schubert BW. A dental microwear texture analysis of the Mio-Plio-
cene hyaenids from Langebaanweg, South Africa. Acta Palaeontol Pol. 2012; 57: 485–496.
22. Donohue SL, DeSantis LRG, Schubert BW, Ungar PS. Was the giant short-faced bear a hyper-scaven-
ger? A new approach to the dietary study of ursids using dental microwear textures. PLoS One. 2013;
8: e77531. https://doi.org/10.1371/journal.pone.0077531 PMID: 24204860
23. Purnell MA, Crumpton N, Gill PG, Jones G, Rayfield EJ. Within-guild dietary discrimination from 3-D tex-
tural analysis of tooth microwear in insectivorous mammals. J Zool. 2013; 291: 249–257.
24. Souron A, Merceron G, Blondel C, Brunetière N, Colyn M, Hofman-Kamińska E, et al. Three-dimen-
sional dental microwear texture analysis and diet in extant Suidae (Mammalia: Cetartiodactyla). Mam-
malia. 2015; 79: 279–291.
25. Ungar PS, Merceron G, Scott RS. Dental microwear texture analysis of Varswater bovids and early Plio-
cene paleoenvironments of Langebaanweg, Western Cape Province, South Africa. J Mamm Evol.
2007; 14: 163–181.
26. Scott JR. Dental microwear texture analysis of extant African Bovidae. Mammalia. 2012; 76: 157–174.
Tooth surface texture analysis on Sus scrofa
PLOS ONE | https://doi.org/10.1371/journal.pone.0204719 October 23, 2018 15 / 16
27. Schulz E, Calandra I, Kaiser TM. Feeding ecology and chewing mechanics in hoofed mammals: 3D tri-
bology of enamel wear. Wear. 2013; 300: 169–179.
28. Merceron G, Escarguel G, Angibault JM, Verheyden-Tixier H. Can dental microwear textures record
inter- individual dietary variations? PLoS ONE. 2010; 5: e9542. https://doi.org/10.1371/journal.pone.
0009542 PMID: 20209051
29. Merceron G, Hofman-Kamińska E, Kowalczyk R. 3D dental microwear texture analysis of feeding habits
of sympatric ruminants in the Białowieża Primeval Forest, Poland. For Ecol Manage. 2014; 328: 262–
269.
30. Asahi M. Stomach contents of wild boars (Sus scrofa leucomystax) in winter. J Mammal Soc Japan.
1975; 6: 115–120.
31. Ishigaki C, Shinzato T, Aramoto M, Wu L. Feed plant, dressing and utilization of carcass of Ryukyuan
wild boar in Iriomote Island. Sci Bull Coll Agric Univ Ryukyus. 2007; 54: 23–27.
32. Uno H, Yoneda M, Taru H, Kohno N. Carbon and oxygen isotope analyses of bioapatite in dental
enamel: Toward ecological restoration of fossil mammals. Fossil. 2013; 94: 33–43.
33. Abe H, editor. A Guide to the Mammals of Japan. 2nd Edition. Kanagawa: Tokai University Press;
2008. pp. 108–109.
34. Hayashi Y, Nishida T, Mochizuki K, Seta S. Sex and age determination of the Japanese wild boar (Sus
scrofa leucomystax) by the lower teeth. Jap J vet Sci;1977; 39, 165–174.
35. Anders U, Koenigswald W, Ruf I, Smith BH. Generalized individual dental age stages for fossil and
extant placental mammals. Palaontol Z. 2011; 85: 321–339.
36. Arman SD, Ungar PS, Brown CA, DeSantis LRG, Schmidt C, Prideaux GJ. Minimizing inter-microscope
variability in dental microwear texture analysis. Surf Topogr Metrol Prop. 2016; 4: 024007.
37. Holm S. A simple sequentially rejective multiple test procedure. Scand J Stat. 1979; 6: 65–70.
38. R Core Team. R: A language and environment for statistical computing. R Foundation for Statistical
Computing; 2016.
39. Lucas PW, van Casteren A, Al-Fadhalah K, Almusallam AS, Henry AG, Michael S,et al. The role of
dust, grit and phytoliths in tooth wear. Ann Zool Fennici. 2014; 51: 143–152.
40. Hoffman JM, Fraser D, Clementz MT. Controlled feeding trials with ungulates: a new application of in
vivo dental molding to assess the abrasive factors of microwear. J Exp Biol. 2015; 218: 1538–1547.
https://doi.org/10.1242/jeb.118406 PMID: 25852070
41. Merceron G, Ramdarshan A, Blondel C, Boisserie J-R, Brunetiere N, Francisco A, et al. Untangling the
environmental from the dietary: dust does not matter. Proc R Soc B. 2016; 283: 20161032. https://doi.
org/10.1098/rspb.2016.1032 PMID: 27629027
42. Daegling DJ, Scott McGraw SW, Ungar PS, Pampush JD, Vick AD, Bitty AE. Hard-object feeding in
sooty Mangabeys (Cercocebus atys) and interpretation of early hominin feeding ecology. PLoS ONE.
2011; 6: e23095. https://doi.org/10.1371/journal.pone.0023095 PMID: 21887229
43. Calandra I, Schulz E, Pinnow M, Krohn S, Kaiser TM. Teasing apart the contributions of hard dietary
items on 3D dental microtextures in Primates. J Hum Evol. 2012; 63: 85–98. https://doi.org/10.1016/j.
jhevol.2012.05.001 PMID: 22705031
44. Teaford MF, Walker A. Quantitative differences in dental microwear between primate species with dif-
ferent diets and a comment on the presumed diet of Sivapithecus. Am J Phys Anthropol. 1984; 64: 191–
200. https://doi.org/10.1002/ajpa.1330640213 PMID: 6380302
45. Solounias N, Semprebon G. Advances in the reconstruction of ungulate ecomorphology with application
to early fossil Equids. Am Mus Novitates. 2002; 3366: 1–49.
46. Winkler DE, Andrianasolo TH, Andriamandimbiarisoa L, Ganzhorn JU, Raakotondranary SJ, Kaiser
TM, et al. Tooth wear patterns in black rats (Rattus rattus) of Madagascar differ more in relation to
human impact than to differences in natural habitats. Ecol Evol. 2016; 6: 2205–2215. https://doi.org/10.
1002/ece3.2048 PMID: 27069577
Tooth surface texture analysis on Sus scrofa
PLOS ONE | https://doi.org/10.1371/journal.pone.0204719 October 23, 2018 16 / 16