Embed Size (px)
Citation preview

Old Dominion UniversityODU Digital Commons
Finance Theses & Dissertations Department of Finance
Summer 2017
Three Essays on Mutual Funds, Fund ManagementSkills, and Investor SentimentFeng DongOld Dominion University
Follow this and additional works at: https://digitalcommons.odu.edu/finance_etds
Part of the Finance and Financial Management Commons
This Dissertation is brought to you for free and open access by the Department of Finance at ODU Digital Commons. It has been accepted forinclusion in Finance Theses & Dissertations by an authorized administrator of ODU Digital Commons. For more information, please [email protected].
Recommended CitationDong, Feng. "Three Essays on Mutual Funds, Fund Management Skills, and Investor Sentiment" (2017). Doctor of Philosophy (PhD),dissertation, , Old Dominion University, DOI: 10.25777/f9zh-2k55https://digitalcommons.odu.edu/finance_etds/8

THREE ESSAYS ON MUTUAL FUNDS, FUND
MANAGEMENT SKILLS, AND INVESTOR SENTIMENT
by
Feng Dong
B.A. May 2011, Oklahoma City University
M.A. June 2012, The Ohio State University
A Dissertation Submitted to the Faculty of Old Dominion
University in Partial Fulfillment of the Requirements for
the Degree of
DOCTOR OF PHILOSOPHY
BUSINESS ADMINISTRATION – FINANCE
OLD DOMINION UNIVERSITY
August 2017
Approved by:
John A. Doukas (Director)
Mohammad Najand (Member)
David Selover (Member)

ABSTRACT
THREE ESSAYS ON MUTUAL FUNDS, FUND MANAGEMENT SKILLS, AND
INVESTOR SENTIMENT
Feng Dong
Old Dominion University, 2017
Director: Dr. John A. Doukas
The mutual fund research focus has switched from whether average active fund managers
have fund management skill to whether a subset of active fund managers have skills that produce
investor benefits. In this dissertation we participate into the study stream by investigating the
relation between managerial skills possessed by mutual fund managers and fund performance.
Essay 1 focuses on whether investor sentiment affects the performance of skilled mutual
fund managers. Stocks during periods of high investor sentiment are more likely to have noise,
while during low investor sentiment periods stocks are more likely to trade close to their
fundamental values. This implies that skilled fund managers are more likely to benefit fund
investors the most during periods of high sentiment when asset prices are noisier and information
is costlier. We empirically examine and confirm this intuition. Our results persist after
distinguishing between management “skill” and “luck”.
Essay 2 addresses the question that whether skilled fund managers’ value added stock
picking ability is associated with investing in firms run by skilled CEOs. We find that the
performance of high managerial ability stocks has a strong explanation power on the
performance of mutual funds with skilled managers. Our results suggest that fund managers’
ability to find and invest in firms with skilled CEOs is an essential element of their stock picking
ability, and it can enhance the fund future performance significantly.

Essay 3 questions whether skill exists among European mutual fund industry, and if so,
what factors can influence the validity and profitability of the skill. This research presents
evidence that managerial skill exists in the European mutual fund industry. Furthermore, the
relation remains positive and significant after controlling for investor sentiment and market
dispersion. Additionally, we find a strong mediating effect of country characteristics on the
relation between fund selectivity and fund performance.
Overall, this dissertation investigates the efficiency of fund manager’s skills under
different market states, finds the essential elements of fund manager’s stock picking skills, and
explores the research to other countries. Given the vital role of mutual fund industry to the
financial markets, the findings of this dissertation show important values for further academic
research and industry implications.

iii
Copyright, 2017, by Feng Dong, All Rights Reserved.

iv
I dedicate my dissertation work to my family and many of my friends, especially to my
loving wife, Qian Ma, who has supported me through the whole process. I also dedicate this
dissertation to the help of many faculty and staff in Strome College of business, especially
Andrew Cohen and Katrina Davenport. I will always appreciate all my classmates, Bader
Almuhtadi, Son Dang, and Trung Nguyen, for being with me throughout the entire doctorate
program. I also dedicate this work and give special thanks to my dog, Heimi, for cheering me up
whenever I feel exhausted.

v
ACKNOWLEDGMENTS
I would like to express my deepest gratitude to my dissertation chair, Dr. John Doukas,
for all his excellent guidance, caring, and patience, and I would never have been able to finish
my dissertation without his support. I would also like to thank Dr. Mohammad Najand and Dr.
David Selover for their valuable feedback and tremendous encouragement.
vi
TABLE OF CONTENTS
Page
LIST OF TABLES……………………………………………………………………………… ix
LIST OF FIGURES……………………………………………………………………………….xii
DISSERTATION INTRODUCTION……………………………………………………………. 1
INVESTOR SENTIMENT AND MUTUAL FUND PERFORMANCE………………………… 3
ABSTRACT……………………………………………………………………………………… 3
INTRODUCTION…………………………………………………………………………………3
RELATED LITERATURE AND HYPOTHESIS DEVELOPMENT…………………………… 9
DATA AND EMPIRICAL METHODOLOGY……………………………………………….... 13
Data and Sample Selection…………………………………………………………………. 13
Empirical Methodology……………………………………………………………………... 16
Fund Management Selectivity and Alpha Measures……………………………………. 16
BvanB Fund Management Added Value and BvanB Alpha Measures………………… 17
Stock Return Dispersion and Business Cycle Measures……………………………….. 19
Lucky Bias Measurement……………………………………………………………….. 21
EMPIRICAL RESULTS……………………………………………………………………….. 22
Fund Management Selectivity Performance results………………………………………… 22
BvanB Fund Management Added Value Performance Results…………………………….. 26
Fund Portfolio Performance and Stock Market Dispersion………………………………… 31
Fund Portfolio Performance and Economic Activity……………………………………….. 32
Fund Management Selectivity Performance Regression Results…………………………… 35
BvanB Fund Management Added Value Regression Results………………………………. 42
Stock Mispricing and Mutual Fund Performance……………………………..……………. 45
Lucky Bias Analysis………………………………………………….…………………….. 47
Selectivity Performance Lucky Bias Results……………………………………………. 47
BvanB Fund Added Value Lucky Bias Results……………………………….………… 49
ROBUSTNESS CHECK…………………………………………………………………………51
Sentiment beta analysis……………………………………………………………………… 51
Fund Capital Flow Analysis………………………………………………………………… 54
Volatility Anomaly Analysis………………………………………………..……………… 57
Alternative Sentiment Measures……………………………………………………………. 59
CONCLUSION…………………………………………………………………………………. 60
REFERENCES…………………………………………………………………………………. 62

vii
DOES CORPORATE MANAGERIAL ABILITY MATTER TO FUND MANAGERS?.......... 72
ABSTRACT………………………………………………………………………...…………… 72
INTRODUCTION………………………………………………………………………………. 72
DATA AND EMPIRICAL METHODOLOGY……………………………………………….. 81
Data and sample selection………………………………………………………………….. 81
Methodology………………………………………………………………………………… 84
Corporate managerial ability measure………………………………………………….. 84
Fund selectivity and performance measures……………………………………………. 85
BvanB fund skill and performance measures…………………………………………… 87
EMPIRICAL RESULTS………………………………………………………………………… 88
Effect of CEO managerial ability on stock performance…………………………………… 88
Effect of fund manager skill on fund performance…………………………………………. 91
Skilled fund performance and CEO managerial ability……………………………………. 95
Skilled fund performance, fund manager skill, and CEO managerial ability……………… 100
Skilled fund performance and CEO managerial ability change…………………………… 104
ROBUSTNESS CHECKS…………………………………………………………………….. 107
Fund portfolios sorted by high managerial ability (MA-Score) stocks…………………… 107
Skilled fund performance, CEO ability, and economic states……………………..……… 109
Skilled fund performance, CEO ability, and fund trading strategy……………………….. 111
Skilled fund performance, CEO ability, and firm industry………………………………… 112
CONCLUSION………………………………………………………………………………… 116
REFERENCES………………………………………………………………………………….117
THE PAYBACK OF MUTUAL FUND SELECTIVITY: EVIDENCE FROM EUROPEAN
COUNTRIES……………………………………………………………………………………123
ABSTRACT…………………………………………………………………………… ……….123
INTRODUCTION………………………………………………………………………………123
DATA AND METHODOLOGY……………………………………………………… ……….128
Sample Description…………………………………………………………………… ……128
Measuring Fund Selectivity and Performance……………………………………… ……...130
Investor Sentiment and Market Dispersion…………………………………………………133
Country-Level Characteristics……………………………………………………………... 135
EMPIRICAL FINDINGS……………………………………………………………………….137
Effect of Fund Selectivity on Fund Performance…………………………………………...137
Effect of Selectivity, Market Sentiment, and Market Dispersion on Fund Performance…...141

viii
Effect of Country-Level Variables on Fund Selectivity Profitability……………………… 150
CONCLUSION………………………………………………………………………………… 152
REFERENCES………………………………………………………………………………… 153
DISSERTATION CONCLUSION………………………..…………………………………… 157
VITA.......................................................................................................................................... 158

ix
LIST OF TABLES
Table Page
1.1 Summary Statistics of Actively Managed Equity Mutual Funds’ Characteristics………. 15
1.2 Portfolio Fund Alpha, Based on Sorting on Lagged R2 and Alpha………………………. 24
1.3 Portfolio BvanB Fund Alpha, Based on Sorting on BvanB Fund Skill and Lagged BvanB
Fund Alpha……………………………………………………………………………………… 28
1.4 Portfolio Fund Alpha, Based on Sorting on Lagged R2 and Fund Alpha, in High and Low
Market Dispersion Periods……………………………………………………………………… 33
1.5 Portfolio Fund Alpha, Based on Sorting on Lagged R2 and Fund Alpha, in Economic
Expansions and Economic Recessions…………………………………………………….……. 34
1.6 Regressions of Returns of Fund Portfolios on CAPM, FF3, and FFC Models…………… 36
1.7 The Effect of Fund Selectivity and Investor Sentiment on Fund Performance…………… 40
1.8 The Effect of Fund Skill Ratio and Investor Sentiment on Fund Performance…………… 44
1.9 Stock Mispricing and Mutual Fund Performance………………………………………… 46
1.10 Skill versus Luck on the Fund Performance Using Fund Alpha to Measure
Performance…………………………………………………………………………………….. 48
1.11 Skill versus Luck on the Fund Performance Using BvanB Fund Alpha to Measure
Performance…………………………………………………………………………………….. 50
1.12 Fama-MacBeth Regressions of Fund Returns and Alpha on Sentiment Beta…………… 53
1.13 The Effect of Fund Flow and Investor Sentiment on Fund Performance………………… 56
1.14 The Effect of Volatility Anomaly and Investor Sentiment on Fund Performance..……… 58
APPENDIX 1.I Data Collection Process Comparison……………………………………….. 67
APPENDIX 1.II Vanguard Index funds………………………………………………………. 68
APPENDIX 1.III Portfolio Fund Alpha, Based on Sorting on Lagged R2 and Fund Alpha, in High and Low Market Sentiment Periods Using UM Index……………………………………..69
APPENDIX 1.IV Portfolio BvanB Fund Alpha, Based on Sorting on BvanB Skill and Lagged
Fund Alpha, in High and Low Market Sentiment Periods Using UM Index…….…………….. 70
APPENDIX 1.V The Effect of Fund Selectivity, Skill Ratio, and Investor Sentiment on Fund
Performance, Controlling for Macroeconomic Conditions…………………………………….. 71

x
2.1 Summary statistics………………………………………………………………………… 83
2.2 Portfolio firm alpha, sorting on lagged CEO managerial ability score and alpha……….. 90
2.3 Fund portfolio performance, based on sorting on fund manager skill and lagged fund
performance……………………………………………………………………………………... 93
2.4 High and low managerial ability stocks’ performance and high selectivity funds’
performance (Alpha)……………………………………………………………………………. 96
2.5 High and low managerial ability stocks’ performance and high BvanB skill funds’
performance (value added)……………………………………………………………………… 97
2.6 High and low managerial ability stocks’ performance, fund selectivity, and high selectivity
funds’ performance (Alpha)…………………………………………………………………… 101
2.7 High and low managerial ability stocks’ performance, fund BvanB skill, and high BvanB
skill funds’ performance (value added)……………………………………………………….. 102
2.8 High and low managerial ability change stocks’ performance and skilled funds’
performance…………………………………………………………………………………… 106
2.9 Fund portfolio MA-Score, based on sorting on fund manager skill……………………... 108
2.10 High managerial ability stocks’ performance, skilled funds’ performance, and business
states…………………………………………………………………………………………… 110
2.11 High managerial ability stocks’ performance, skilled funds’ performance, and fund trading
strategies………………………………………………………………………………………. 114
2.12 High managerial ability stocks’ performance, skilled funds’ performance, and stock
industries ……………………………………………………………………………………… 115
APPENDIX 2.I Vanguard Index funds……………………………………………………… 119
APPENDIX 2.II CEO managerial ability and firm’s stock performance…………………… 120
APPENDIX 2.III Fund management skill and fund performance………………………….. 121
APPENDIX 2.IV High and low CEO MA-Score and skilled funds’ performance…………. 122
3.1 List of European countries in the database……………………………………………… 129
3.2 Summary statistics of actively managed equity mutual funds’ characteristics from 11
selected European countries…………………………………………………………………… 130
3.3 Market risk factor summary and correlations between market premium and major market
index return for each country………………………………………………………………….. 132

xi
3.4 The effect of fund selectivity on fund performance……………………………………. 139
3.5 The effect of fund selectivity on fund performance for each country………………….. 140
3.6 The effect of fund selectivity on fund performance in high/low market sentiment and
market dispersion periods……………………………………………………………………… 142
3.7 The effect of fund selectivity, market sentiment, and market Dispersion on fund
performance……………………………………………………………………………………. 144
3.8 The effect of fund selectivity, market sentiment, and market Dispersion on fund
performance for each country………………………………………………………………….. 146
3.9 The effect of market sentiment on fund performance, using alternative European Sentiment
measures……………………………………………………………………………………….. 149
3.10 The effect of country level variables on the relationship between fund performance and
selectivity………………………………………………………………………………………. 151
APPENDIX 3 Country level variable description and data resource ……………………..... 156

xii
LIST OF FIGURES
Figure Page
1 Time series plot of each sentiment measure (free of macroeconomic influences) from
January 2000 to December 2015………………………………………………………………..148
1
INTRODUCTION
Mutual funds have become an increasingly important investment instrument and attract a
large amount of capital, from individual investors to the financial markets. By the end of 2014,
the total value of the assets managed by mutual funds was more than 31 trillion US dollars,
which reflected a 20% growth rate from 2007. The mutual fund industry has been studies by
finance and economics scholars for a long time and the research focus has switched from
whether average active fund managers have fund management skill to whether a subset of active
fund managers have skills that produce investor benefits. In this dissertation we participate into
the study stream by investigating the relation between managerial skills possessed by mutual
fund managers and fund performance.
Essay 1 focuses on whether investor sentiment affects the performance of skilled mutual
fund managers. The price of stocks may differ from their fundamental value due to random
noise. In this case, stocks during periods of high investor sentiment are more likely to have noise,
while during low investor sentiment periods stocks are more likely to trade close to their
fundamental values, i.e., have less noise. This implies that skilled fund managers with high
insight and analytical ability are more likely to benefit fund investors the most during periods of
high sentiment when asset prices are noisier and information is costlier. We empirically examine
and confirm this intuition. Our results persist after distinguishing between management “skill”
and “luck”.
Essay 2 addresses the question that whether skilled fund managers’ value added stock
picking ability is associated with investing in firms run by skilled CEOs, using the latter as the
identification strategy. We find that the performance of stocks from firms with skilled CEOs has
a strong explanation power on the performance of actively-managed mutual funds with skilled

2
fund managers. More importantly, this positive relationship only exists in mutual funds with high
skill managers. Our results suggest that fund managers’ ability to find and invest in firms with
skilled CEOs is an essential element of their stock picking ability, and it can enhance the fund
future performance significantly.
In Essay 3 we explore the question and whether skill exists among European mutual fund
industry, and if so, whether the validity and profitability of fund managerial skills are affected by
investor sentiment, market dispersion, and country characteristics. Using a sample of 2,947
actively managed, domestic equity mutual funds from 11 European countries, this research
presents evidence that the positive relation between fund selectivity and fund performance exists
in the European mutual fund industry. Furthermore, the relation remains positive and significant
after controlling for investor sentiment and market dispersion. In addition, we investigate the
mediating effect of country characteristics on the relation between fund selectivity and fund
performance, and find that managers’ selectivity ability is more valuable for funds in countries
with high economic development, strong legal strength, small but highly liquid equity markets,
and young mutual fund industries.

3
CHAPTER 1
INVESTOR SENTIMENT AND MUTUAL FUND PERFORMANCE
ABSTRACT
Do fund managers’ stock trades add value during periods of heightened investor sentiment, a
natural setting to detect skill, when asset prices are noisier, short-selling is limited and
information is costlier? Our results reveal that fund managers with the highest (lowest) skill
create (experience) $7.71 ($5.64) million of added value (loss) during high sentiment periods,
but only $3.74 million for the entire sample period while they incur a value loss of $0.18
($30.32) million in low sentiment periods. We also find that skilled fund managers’ investments
are associated with undervalued stocks. Our results persist after distinguishing between
management “skill” and “luck”.
INTRODUCTION
“…noise creates the opportunity to trade profitably, but at the same time makes it
difficult to trade profitably.” Fisher Black, 1986
Does investor sentiment affect the performance of skilled mutual fund managers? While
investor sentiment has been held largely responsible for the dramatic rises and falls in financial
asset prices during the last two decades, its impact on actively managed mutual funds’
performance remains unknown. We address this question by examining whether variations in
fund profitability can be explained by variations in investor sentiment, since sentiment affects the
amount of noise trading as noted by Miller (1997), which, in turn, makes it difficult to carry out
profitable trades, as discussed in Black (1986). Since fund managers trade on stocks, their
capacity to add value is examined during periods of heightened optimistic investor sentiment, as

4
an “acid” test of skill, when markets are noisier and it is more difficult to identify profitable
stocks.
A large body of the literature, motivated by the question of whether fund managers create
value, arrives at the conclusion that actively managed funds underperform passively managed
funds. Using fund holdings’ deviation from the benchmark portfolio to measure active
management, the more recent literature shows that active management has a positive relationship
with fund performance (Brands, Brown, and Gallagher, 2005; Kacperczyk, Sialm, and Zheng,
2005; Cremers and Petajisto, 2009; and Cremers, Ferreira, Matos, and Starks, 2015). This
superior fund management performance is often attributed to management skills possessed by
active fund managers such as stock-picking and market-timing talents.
On the other hand, while previous work has assumed that management skill is fixed, only
a few studies have touched upon the question of whether active fund managers’ skill varies with
time. However, as with skills of other people, fund managers’ management skill is developed
with experience and the efficiency of the skill to generate profits for their clients should be
highly affected by the state of financial markets and economic conditions, which are changing
with time. In addition, studies addressing the question of whether a fund manager's skill varies
with time continue to assume that market participants are rational, an assumption that has been
challenged by many behavioral finance studies in recent years (DeBondt and Thaler, 1985;
Shiller and Pound, 1989; Barber and Odean, 2001; and Barberis and Thaler, 2003). Furthermore,
as explained by Black (1986), noise traders’ participation in the market, which can be triggered
by optimistic or pessimistic beliefs, will force asset prices to deviate from their fundamental
values making it difficult to produce risk adjusted excess-returns. Additionally, noise traders’
participation varies with time and could be related to the state of investor sentiment. Since

5
investor sentiment has been shown to influence noise trader’s investment behavior and by way of
asset prices (Hirshleifer and Shumway, 2003; Dowling and Lucey, 2005; Edmans, Garcia, and
Norli, 2007; Kaplanski and Levy, 2010; and Bialkowski, Etebari, and Wisniewski, 2012), fund
performance could be also affected by the state of investor sentiment. In addition, there are
reasons to believe that noise trader’s activity is not symmetric across optimistic and pessimistic
sentiment periods, but will be more prevalent during optimistic ones. For instance, Grinblatt and
Keloharju (2001) and Lamont and Thaler (2003) report that unsophisticated investors are more
likely to enter the stock market during prosperous and investor exuberant periods. Therefore, the
above arguments could have implications about the performance of fund managers across time.
Specifically, if skilled fund managers trade more on (private) information about the true value of
financial assets under management, in contrast to their low skill counterparts, they are expected
to deliver more value during high sentiment periods when financial asset prices are noisier than
in low sentiment periods when financial markets are not crowded by unsophisticated (noisy)
investors. In sum, previous findings raise the important question of whether fund managers’
performance is affected by investor sentiment, a natural setting to detect if fund managers
possess skill, when noise trading activity is prevalent. Surprisingly, this question has not yet been
the focus of empirical investigation, and the aim of our analysis in this study is to address this
issue using two different measures of fund skill and performance, controlling for the influence of
economic business cycles and fund flows.
In contrast to the previous literature that examines whether fund managers try to exploit
investor sentiment by deploying sentiment-based (timing) strategies in order to attract capital
flows (Massa and Yadav, 2015) or whether funds tilt their portfolios toward better performing
stocks when they buy (sell) stocks that are highly sensitive to market sentiment, measured by

6
sentiment betas, preceding an increase (decrease) in investor sentiment (Cullen, Gasbarro, Le,
and Monroe, 2013), we treat sentiment as a market condition, not as a risk factor where skilled
managers actively time investor sentiment by modifying fund strategies based on their sentiment
prediction.1 While our evidence is consistent with the previous literature showing that skilled
fund managers outperform their low skill peers, we mainly focus on whether fund managers’
stock-selectivity skill is more profitable during high than low sentiment periods when noise
trading is more prevalent and impactful on asset prices, due to short selling limitations (Shleifer
and Vishny, 1997), in an attempt to determine the power of fund management skill. The practical
implication of this analysis, is to aid investors to make more efficient fund investment decisions,
especially when markets are populated by noise traders. Unlike Kacperczyk, Van Nieuwerburgh,
and Veldkamp (2016), who argue that the time-varying fund performance is caused by fund
managers’ optimally choosing to process information about aggregate shocks in recessions and
idiosyncratic shocks in booms, we treat investor sentiment as a noisy market condition which
allows us to determine whether skilled fund managers are able to outperform their average and
low-skilled counterparts. When we treat sentiment as risk factor, we find that sentiment-based
(timing) strategies are associated only with low skilled fund managers realizing significant risk-
adjusted fund losses.
Another interesting question, which has received a little attention in the literature (e.g.
Baks, Metrick, and Wachter, 2001) is what percentage of the active fund managers’ skill is
consistently associated with higher excess risk-adjusted returns in different states of investor
sentiment. The answer to this question, which is addressed in this study, is very important
1 Specifically, Massa and Yadav (2015) consider the preferences of fund managers for holding stocks that react in a contrary
manner to the level of investor sentiment or display a contrarian sentiment behavior.

7
because more and more capital is flowing from individual investors to professional investment
managers.
To examine these two questions, we employ two different management skill and fund
performance measures over the 1990–2014 period. We first use the Amihud and Goyenko (2013)
selectivity skill, which does not require the fund portfolio holdings (i.e., as the one by Daniel et
al., 1998), and condition the tests of the relationship between fund selectivity and performance
on different states of investor sentiment. The results of these tests consistent with our hypothesis
demonstrate that fund managers with superior skills generate significantly high risk-adjusted
returns during high sentiment periods. While high investor sentiment tends to harm the average
mutual fund performance, low skilled fund managers incur substantial losses.
Second, following Berk and van Binsbergen (2015), we reexamine the validity of our
original results by using their measures of performance (i.e., the mean of the product of the gross
abnormal return (alpha) and fund size (the value extracted by a fund from capital markets)) and
management skill (i.e., skill ratio) and find consistently that investor sentiment harms fund
performance, but managers with above-average stock-picking skill manage to protect fund
performance from the adverse effects of high investor sentiment and even create value in high
sentiment periods if they are endowed with superior management skill. Specifically, fund
managers with the highest skill create $7.71 million of added value during high sentiment
periods which exceeds the average realized fund gains ($3.74 million), while they incur a small
value loss of $0.18 million in low sentiment periods.2 However, fund managers with the lowest
skill experience a values loss of $5.64 million during high sentiment periods which is far lower
2 The $3.74 million per year of added value created annually by the average fund manager is consistent with the Berk van
Binsbergen (2015) who document that the average manager is skilled, adding $3.2 million per year.

8
than the average realized fund gains ($3.74 million), while they incur a substantial value loss of
$30.32 million in low sentiment periods.
We also examine whether the superior performance of skilled fund managers in high
sentiment periods comes through investing in undervalued stocks. Cross-sectional analysis on the
relation between fund performance and stock mispricing, using a set of 11 market anomalies to
identify overpriced stocks (Stambaugh, Yu, and Yuan, 2012), reveals a negative relation between
fund performance and skilled fund management indicating that skilled fund managers’
investments are associated with undervalued stocks.
We then follow Barras, Scaillet, and Wermers (2010) and conduct a lucky bias analysis
that allows us to determine if significant fund performance (alphas) is due to luck alone, and not
management skill, for the whole sample during high and low sentiment periods. The results show
that, even though the percentage of skilled fund managers decreases considerably after
controlling for lucky bias, a portion (around 2%, i.e., under the 5% significant level) of fund
managers do possess skill capable of delivering significant alphas during high sentiment periods.
Our findings also hold when we control for the effects of net capital flows and volatility
anomaly. In addition, when using the FEARS index (Da, Engelberg, and Gao, 2015) and the
credit market sentiment index, as an alternative sentiment measures, these new results are
qualitatively similar with our main findings. Jointly, the evidence that skilled managers generate
high alphas in high sentiment periods suggests that they can create value for fund investors when
markets are populated by noisy investors (signals).
The rest of the paper is organized as follows. Section II describes the related literature
and hypothesis development. Section III gives the data and empirical methodology. Section IV
9
shows the results, along with a discussion of the results. Section V presents the robustness check.
Section VI concludes.
RELATED LITERATURE AND HYPOTHESIS DEVELOPMENT
Malkiel (1995) found that equity mutual funds have underperformed the benchmark
portfolio using both gross fund returns and net fund returns, and he suggests that investors should
choose low-expense index funds rather than active funds. Gruber (1996) shows that compared
with different indices, the average active mutual fund has a negative performance. In addition,
Daniel, Grinblatt, Titman, and Wermers (1997), who employed a characteristics-based
benchmark, claim that the average active fund can beat the benchmark, but by a very small
amount. However, other studies document that even though active funds on average cannot beat
the market benchmark, some of the active fund managers do have skills and achieve a superior
performance (Brands et al., 2005; Kacperczyk et al., 2005; Cremers and Petajisto, 2009; and
Cremers et al., 2015).
Empirical studies show that skilled managers do add value for their clients by selecting
valuable stocks (Gruber, 1996; Carhart, 1997; Daniel et al., 1997; and Zheng, 1999), and that
leads to the conclusion that fund managers’ skill in identifying high-performance stocks is
coming from their superior insight and analytical ability. Kacperczyk, Van Nieuwerburgh, and
Veldkamp (2011) show that the skill comes from the managers’ ability to anticipate micro- and
macro-fundamentals. In addition, the previous literature shows that a fund attains superior
performance if its manager focuses on the assets that s/he has specialized knowledge of. For
example, Kacperczyk et al. (2005) found that funds focusing on some specific industries have
better performance than the ones holding more diversified portfolios. Cohen, Frazzini, and
Malloy (2007) showed that if fund managers and corporate board members have a close

10
connection via shared education networks, fund managers prefer to place larger bets on those
firms that such corporate board members serve and find that those funds perform significantly
better on these holdings relative to their non-connected holdings. Kacperczyk and Seru (2007)
reported that changing portfolio allocation based on public information decreases fund
performance, which supports the argument that fund manager skill is coming from private
information rather than public information.
While the most of this literature has focused on the stock-picking ability of fund
managers, the findings on managers’ market-timing ability are ambiguous. Jiang, Yao, and Yu
(2007) employed a single-index model using measures of market timing based on mutual fund
holdings, and they found that, on average, active fund managers have a positive market-timing
ability. However, as shown by Elton, Gruber, and Blake (2012), there is no evidence that market-
timing strategy increases fund performance when a multi-index model is used. Interestingly,
there might be a negative market-timing effect on fund performance due to the sector rotation
decisions with respect to high-tech stocks. By adding timing-related variables to the basic model,
which is proposed by Fama and French (1993) and Carhart (1997), denoted as the FFC model,
Amihud and Goyenko (2013) found no evidence that high selectivity funds possess any market-
timing skill.
Meanwhile, few studies have focused on the question of whether the active fund
managers’ skill varies with time. Reibnitz (2013), for example, shows that the market
environment impacts on the effectiveness of active strategies, and highly skilled managers can
produce superior returns in times of high cross-sectional dispersion in stock returns. Some
studies have focused on the relationship between fund performance and the business cycle and

11
report that active funds, on average, have a better performance in recessions than in expansions
(Kacperczyk, Van Nieuwerburgh, and Veldkamp 2014, 2016).
Unlike previous studies, we argue that the activities of investors are not consistently
rational and, thus, fund profitability can be affected by investor sentiment. There are two reasons
to suggest that investor sentiment can influence the profitability of a fund manager’s insight and
analytical ability. First, the level of investor sentiment can affect both overall market returns and
individual stock returns (Miller, 1977; Daniel, Hirshleifer, and Subrahmanyam, 1998; Hong and
Stein, 1999; Amromin and Sharpe, 2009; and Antoniou, Doukas, and Subrahmanyam, 2015).
Stocks during high sentiment periods are driven away from their fundamental values by naïve
investors. Antoniou et al. (2015) find that the capital asset pricing model (CAPM) only holds
during pessimistic periods when investor sentiment is low and asset prices are more likely to be
close to their intrinsic values, which reveals that the effect of more unsophisticated investors
entering the market during high sentiment states is dramatic. In optimistic times, however, the
opposite is true with noise traders focusing on risky stocks, and thus overvaluing high beta
stocks. As argued by Barberis and Thaler (2003), rational investors or arbitrageurs do not
aggressively force prices back to fundamentals because betting against sentimental investor
activities is costly and risky. Additionally, short-selling impediments of institutional investors,
especially mutual funds, are also major obstacles to eliminating price overvaluation. Since more
irrational and unsophisticated traders participate in financial markets during high sentiment
periods, asset prices are more likely to be noisy and consequently more difficult to identify good
investment opportunities. Hence, on average, stock-picking ability during high sentiment periods
might be limited, thus resulting in fund underperformance. If fund managers’ skills, however, are
based on firm-specific analytic abilities and information rather than noise, fund managers with

12
high selectivity skill should be able to produce superior fund performance during high sentiment
periods when stock prices are exposed to greater noise than during low sentiment periods. The
ability of skilled fund managers to create value in high sentiment states is expected to depend on
their analytical valuation skill to make profitable investment decisions and not by investing in
overvalued stocks which are preferred by naive investors. In contrast, unsophisticated investors
keep away from the equity market during low sentiment periods (Grinblatt and Keloharju, 2001;
Lamont and Thaler, 2003; Amromin and Sharpe, 2009; and Antoniou et al., 2015), with asset
prices reverting to fundamental values. In low sentiment periods, stocks are traded at close to
fundamental values, and this leaves less room for skilled fund managers to realize significant
high alphas. Taken together, these arguments lead us to expect that fund managers with high
selectivity skill will outperform their low selectivity skill counterparts in high and low sentiment
periods.
Second, fund performance can be influenced by investor sentiment due to market
anomalies, which are created by irrational investor trading activities that are more pronounced in
high sentiment periods (Stambaugh, Yu, and Yuan, 2012). Momentum is one of the most
significant market anomalies, and it is described as the tendency of past winners (losers) to
outperforming (underperforming) the market benchmark in the near future. Antoniou, Doukas,
and Subrahmanyam (2013) find a strong connection between sentiment and momentum. They
argue that during high sentiment periods, information signals that oppose the direction of
sentiment travels slowly due to investors’ cognitive dissonance, and they show that the
momentum strategy works only during optimistic (high sentiment) periods. In addition, due to
short-sale constraints, mutual fund managers are more likely to bet on positive information.
While stocks tend to be overvalued due to the momentum effect during high sentiment periods,

13
stock prices will drift away from their intrinsic values and sophisticated fund managers should
generate superior returns by taking advantage of this drift from true value during high sentiment
times. That is, active fund managers with superior insight and analytical skill are expected not
only to protect a fund’s performance from this price to value drift, but also produce a higher fund
alpha in high investor sentiment periods when noise investor participation in the market is high.
On the other hand, their inability to generate high alphas during low sentiment periods when
asset prices are less noisy and near fundamental values may suggest that their superior insight
and analytical skill is most relevant during high sentiment and noisy periods. Unlike previous
studies, the novelty of this investigation is to shed light on whether fund managers’ performance
varies across different states of investor sentiment and particularly whether fund investors benefit
the most from their selectivity skill especially during high sentiment periods when market signals
are noisy.
DATA AND EMPIRICAL METHODOLOGY
Data and Sample Selection
Unlike most previous studies, which use the CRSP Survivor-Bias-Free Mutual Fund
Database, we use the Bloomberg Fund Dataset, which is originally built for institutional
investors in 1993 and is widely used in the finance industry nowadays. The dataset receives
pricing and performance information from the fund management companies, administrators, and
trustees directly, in the form of a feed or, more commonly, via automated email distribution
channels with the entities. The exchange traded information comes directly from the exchange on
which the mutual fund is listed. In addition, if one data point cannot pass the volatility threshold,
which varies for each mutual fund based upon its past accepted volatility and the market in
which the entity trades or prices, the data point will be rejected. These features, make Bloomberg
14
fund data reliable for academic studies and not suffering from the standard sample bias. Our data
sample period covers 24 years from January 1990 to December 2014. We use 24-month time
windows to estimate selectivity and past fund alphas, so the data were collected from December
1987. We collected monthly raw returns for each fund if the fund had full return data for the 24-
month estimation period. We also collected fund-level control variables that may be associated
with the fund’s performance: turnover, which is the minimum of aggregated sales or aggregated
purchases of securities divided by the total net assets of the fund, age, expanse ratio, which is the
annual expense ratio of each fund, and total net assets (TNA).
To make sure our sample does not suffer from survivorship bias, we collected data from
funds with both alive and dead statuses. We also used several criteria to restrict our sample to
actively managed U.S. domestic equity mutual funds. We only collected fund data if a fund met
all the following standards: 1) geographical focus is the United States, 2) country of domicile is
the United States, 3) asset class is equity, and 4) fund type is an open-ended mutual fund.
Because we needed 24 months’ estimation periods and our sample period ended in December
2014, all observations were removed if the fund had an inception date later than December 2012.
We further eliminated other types of funds, such as index funds, balance funds, international
funds, and sector funds, by deleting funds whose name contained the word “index,” “ind,”
“S&P,” “DOW,” “Wilshire,” “Russell,” “global,” “fixed-income,” “international,” “sector,” and
“balanced.” Following Reibnitz (2013), we required funds to have TNA of at least $15 million in
December 2013. Overall, our sample contained 2190 mutual funds over the period from January
1990 to December 2014, with 273,557 observations. We set an estimation period of 24 months
followed by a test month, and during the estimation period, we regressed monthly fund excess
return (over the T-bill rate) on the FFC model factors and moved the window a month at a time.
15
A detailed data collection comparison between this paper and the previous literature (Amihud
and Goyenko, 2013 and Reibnitz, 2013) is presented in Appendix I.
Table 1 shows the summary statistics of the mutual funds in our sample. R2
t-1 estimations
range from 0.219 to 0.991, with a mean value of 0.883 and a median value of 0.922.3 This shows
a clear negatively skewed distribution, which indicates that around 90% of the funds’ excess
return variance can be explained by the market indexes variance.
TABLE 1.1 Summary Statistics of Actively Managed Equity Mutual Funds’ Characteristics This table shows descriptive statistics of individual fund estimates of R
2t-1 and control variables. R
2 t-1 is calculated
by regressing each fund’s excess return (fund monthly raw return minuses one month T-bill rate of that month) on
the multifactor model of Fama-French (1993) and Carhart (1997) (FFC model) over a time window of 24 months.
Our sample contains 2190 actively-managed U.S. equity mutual funds over the period from January 1990 to
December 2014, with 273,557 observations. Turnover is the minimum of aggregated sales or aggregated purchases
of securities divided by the total net assets of the fund. Expense ratio is the annual expense ratio of each fund. TNA
is each fund’s total net assets in millions.
Mean Median Minimum Maximum
Turnover (%) 85.64 56.00 0.00 3,452.00
Age (years) 17.44 17.00 3.00 47.00
Expense Ratio (%) 1.28 1.21 0.00 9.16
TNA (millions) 1,267.96 234.49 8.26 202,305.77
R2
t-1 0.883 0.922 0.219 0.991
The main sentiment measures used in this paper is the Baker and Wurgler (2006)
sentiment index (BW)4 and the University of Michigan sentiment index (UM)
5. The BW index
has been used widely in the finance literature and is constructed using six proxies of investors’
propensity to invest in stocks: trading volume (total NYSE turnover); the premium for dividend
paying stocks; the closed-end fund discount; the number and first-day returns of IPOs; and the
equity share in new issues. The BW index data are collected from January 1990 to December
2014, and for the whole 300-month sample period, if the month t’s BW sentiment index is higher
(lower) than the median number of all the monthly BW sentiment index numbers, month t is
3 Consistent with Amihud and Goyenko (2013), the top 0.5% and the bottom 0.5% R2 observations were deleted. The argument
here is that funds with the highest R2 should be “closet indexers,” which have not been limited out by the sample selection
criteria. Funds with the lowest R2 may be caused by estimation error. 4 The BW sentiment data are available on Jeffrey Wurgler’s website http://people.stern.nyu.edu/jwurgler/. 5 The UM sentiment data can be found on University of Michigan Surveys of Consumers website http://www.sca.isr.umich.edu/.

16
defined as a high (low) investor sentiment month. The UM index is another sentiment index
measured outside of the financial market and used widely in finance studies. The results are
consistent with those using BW sentiment index. Furthermore, our findings are also supported by
using two alternative sentiment measures: credit market sentiment index and the Financial and
Economic Attitudes Revealed by Search (FEARS) index, as reported in the robustness tests.
Empirical Methodology
Fund Management Selectivity and Alpha Measures
To examine whether the positive relationship between fund performance and
management skill varies with time and particularly if it is more pronounced during high
sentiment periods, we first assess fund management selectivity by employing the method of
Amihud and Goyenko (2013). Selectivity is calculated using a fund’s R2 from regressing its
returns on multifactor benchmark models. The main benchmark model used is the FFC model,
which contains market excess return (RM-Rf), small minus big size stocks (SMB), high minus
low book-to-market ratio stocks (HML), and winner minus loser stocks (MOM), and all the data
are accessible online through the Kenneth French data library. According to Amihud and
Goyenko (2013), a low R2 and indeed a low level of co-movement with the benchmark model
applied, indicates fund management’s superior selectivity ability because highly skilled fund
managers manage funds based on private information, which makes the fund less sensitive to
variations in public information. Selectivity, in Amihud and Goyenko (2013), is measured as:
(1)
where RMSE2 is the variance of the error term from the regression, which denotes the
idiosyncratic risk of a fund, Total Variance is the overall variance of a fund’s excess return, and

17
Systematic Risk2 is the return variance that is due to the benchmark indexes’ risk. As Eq. (1)
demonstrates, selectivity is higher when the fund’s strategy is based more on firm-specific
information, rather than market information. More importantly, unlike other fund selectivity
measures, such as the well-known DGTW measure (Daniel et al. 1997), which use the
characteristics of stocks within each fund to estimate the fund manager selectivity skill, the
Amihud and Goyenko (2013) method does not require the knowledge of fund holdings or the
benchmark index that the fund is using. The fund performance measure we use in our analysis is
the fund gross alpha, which is the average fund abnormal return before fees. The reason for
using the fund gross alpha rather than the net alpha is that, as Berk and Green (2002) argue, if
skill is detectable by investors, the significant positive net fund alpha will vanish due to the
competition among investors. In that case, gross alpha is a more appropriate way to measure the
fund managers' performance.
BvanB Fund Management Added Value and BvanB Alpha Measures
As our second fund management skill measure, we use the method of Berk and van
Binsbergen (2015), who deduce fund management skill based on the extra value added to the
fund (i.e., the mean of the product of the gross abnormal return and fund size at the beginning of
the period) divided by its standard error, measured over the period December 2002 to December
2014. As discussed in Berk and Green (2002), even the gross alpha is not a suitable performance
measure. Mutual funds share the same investment mechanism, and a value measure, rather than a
return measure, is more appropriate approach to measure fund performance. To measure fund
performance, the gross abnormal return has to be adjusted by fund size. On the other hand,
unlike prior studies that have measured fund performance using risk models (FFC model, Fama–
French three-factor model, CAPM model, etc.), Berk and van Binsbergen (2015) evaluated fund

18
performance by comparing fund performance with an alternative investment opportunity set – 11
Vanguard index funds.6 Their argument is that, in order to evaluate the performance of a mutual
fund, one should compare its performance with the next best investment opportunity available to
investors at that time. The benchmark should have two characteristics: the return of the
benchmark should be known to investors and the benchmark can be traded. Unfortunately, the
benchmarks used in factor models do not meet these criteria. Therefore, Berk and van
Binsbergen (2015) suggest to use the set of passively managed index funds offered by Vanguard
as the alternative investment opportunity set, and they define the fund benchmark as the closet
portfolio formed by those index funds.
We then follow Berk and van Binsbergen (2015) and use the 11 Vanguard index funds to
form the alternative investment opportunity set as the benchmark. Unlike their analysis, which
focuses on the cross-sectional skill difference within fund managers, we use a rolling window
regression method to test whether management skills vary with time. We collected data only
when all the 11 index funds had available data, and finally, our data period covered 145 months,
from December 2002 to December 2014. We then constructed an orthogonal basis set out of
these index funds by regressing the nth
fund on the orthogonal basis produced by the first n-1
funds over the whole 145-month period. The orthogonal basis for index fund n is calculated by
adding the residuals collected from the prior regression and the mean return of the nth
index fund
of the whole period.
Next, as shown in Eq. (2), we regress the excess returns of each fund f on the 11
Vanguard index fund orthogonal bases for the whole sample period from December 2002 to
December 2014, using 24-month rolling window regression and moving forward 1 month each
time.
6 The list of the 11 Vanguard index funds and their inception dates are shown in Appendix II.
19
∑
(2)
The performance measure we use is the abnormal capital inflow a fund experiences in the
test month (denoted BvanB alpha), which is calculated as the fund's gross abnormal return (real
raw return over its expected return) multiplied by the TNA of the fund at the beginning of the
current month. The fund expected return is the product of multiplying the coefficients between
each Vanguard index fund orthogonal basis and fund excess return from the 24-month preceding
estimation period by the real numbers of each Vanguard index fund orthogonal basis in the
current month.
To capture fund management skill, we use the skill ratio measure introduced by Berk and
van Binsbergen (2015), denoted as the BvanB fund skill. As shown in Eq. (3), the BvanB fund
skill for each fund in each month is the product of a fund's abnormal return (fund alpha) times
the fund’s size at the beginning of the month before the test month, divided by the standard error
of the fund alpha. Fund alphas and standard errors are obtained from the 24-month rolling
window regression of fund excess return over the alternative investment opportunity. Fund size,
which is the total net assets of the fund, is inflation-adjusted.
(3)
Stock Return Dispersion and Business Cycle Measures
The previous literature has shown that the presence of dispersion in stock returns and the
state of the economy can influence the market environment which, in turn, provides the
opportunity of skilled fund managers to outperform the market (Reibnitz, 2013; and Kacperczyk
et al., 2014, 2016). Active opportunity in the market, captured by cross-sectional dispersion in
stock returns, as argued by Reibnitz (2013), could influence fund performance by the variation in

20
the arrival of firm-specific information. During a high market-dispersion period, the market price
is affected more by firm-specific information than market conditions. If so, during high market-
dispersion times, the impact of active bets is expected to be more pronounced, and managers
with skill in identifying, interpreting, and acting on firm-specific information will significantly
outperform their low-skilled peers. As in Reibnitz (2013), we calculate market dispersion for
each month. This is estimated as the average diversion between the equally weighted average
return on S&P 500 constituents in each month and the return of each S&P 500 constituent in the
same month. The stock return dispersion in month t (MDt) is calculated as follows:
√
∑
(4)
where n is the number of S&P 500 constituents in month t, Ri,t is the return of each constituent i
in this month, and Rm,t is the equally weighted average return of all S&P 500 constituents in
month t. We collected the list of S&P 500 constituents and their monthly returns from
Bloomberg database. Bloomberg reports these historical data since February 1990, so our dataset
for market dispersion ranges from February 1990 to December 2014.
The second element that can have an impact on the profitability of skilled fund managers
is the state of the economy. Kacperczyk et al. (2016) built an information choice model by
assuming fund managers have a finite mental capacity (attention) and skilled managers are the
ones who allocate their capacity efficiently. Since the optimal allocation strategy is changing
with the state of the economy, the efficiency of fund managers’ investment strategy and fund
return is expected to vary with time. Kacperczyk et al. (2014) decomposed manager skill into
stock picking and market timing and report that managers balance those two strategies based on
the state of the business cycle. The previous literature has also suggested that skilled managers
devote more time and resources in managing a fund actively during recessions to protect the

21
fund’s performance from economic downturns (Wermers, 2000; Glode, 2011; Kosowski, 2011;
and Reibnitz, 2013). Thus, one can argue that the effect of investor sentiment on mutual fund
performance is caused by the correlation between the cyclical variation in sentiment and
economic cycles. For that reason, we use the Chicago Fed National Activity Index 3 month
average (CFNAI MA3), following Kacperczyk et al. (2014), to capture the effects of the business
cycle on fund performance.7 The CFNAI is a coincident indicator of national economic activity
comprising 85 existing macroeconomic time series.
Lucky Bias Measurement
Even though we employ two different measures to proxy fund manager skill to ensure
that our results are not sensitive to a specific measure, it is reasonable to argue that fund
performance may be due to luck rather than skill. To disentangle luck from skill, we used the
“false discovery rate” approach developed by Barras et al. (2010) to estimate the fraction of
mutual funds that truly outperform the benchmarks. This approach assumes that there are three
mutual fund performance categories in the market: zero-alpha funds (performance is not
different from 0), skilled funds (performance is significantly better than the benchmark), and
unskilled funds (performance is significantly worse than the benchmark). The fund performances
within each category are normally distributed. For a given significant level γ, the lucky (unlucky)
funds within the skilled funds category and unskilled funds category are the same, and are
calculated as:
Fγ=π0 * γ/2 (5)
7 Most studies use NBER business-cycle dates to clarify economic recessions or expansions. However, when we collected the
data for this paper, NBER business cycle dates were unavailable after 2009. In addition, based on the NBER business-cycle
dates, 200 months out of 234 sample months (1990–2009) were in expansions periods.

22
where π0 is the true proposition of the zero-alpha fund category, and γ is the significance level
we choose. Then, the true proportions of skilled funds, Tγ+, and unskilled funds, Tγ
-, adjusted by
the presence of lucky funds, Fγ, are measured as:
Tγ+ = Sγ
+ - Fγ = Sγ
+ - π0 * γ/2 (6)
Tγ- = Sγ
- - Fγ = Sγ
- - π0 * γ/2 (7)
Next, we implement the procedure of Barras et al. (2010) with a rolling window
regression analysis. A fund will be considered only if the fund has full data during the whole 24-
month estimation period. Within each month, we count the total number of funds and P-value
from each regression. Then, the true proposition of the zero-alpha fund category in each month
is estimated as:
(8)
where λ* is a sufficiently high P-value threshold (we use λ
* = 0.6, as suggested in Barras et al.,
2010). Wλ* equals the number of funds with a P-value exceeding λ* within this month, and Mt is
the total number of funds considered in this month.
EMPIRICAL RESULTS
Fund Management Selectivity Performance results
We begin our examination of whether the performance of active mutual funds of
differing management skills is sensitive to investor sentiment by predicting fund performance
based on the fund’s lagged 1-R2 and the lagged excess return from the multifactor model, i.e., the
fund alpha. We estimate R2 using rolling regressions of the FFC model with a 24-month
window. R2 is used only if the fund has 24 months’ continuous data. After each fund’s R
2 is
calculated for each month, we rank all the funds within each month based on their prior month’s
23
selectivity (1-R2
t-1) and sort all the funds into five quintiles based on their selectivity ranking.
Within each quintile, we sort funds into five portfolios based on their prior one month’s alpha
(alphat-1), which is the intercept of the rolling regressions. This procedure produces 25 (5x5)
portfolios with different selectivity and fund alphas, and each portfolio contains 4% of total
mutual funds within the same month.
For each month, we calculate the monthly average excess raw returns (over the T-bill
rate) of the funds that are included in each portfolio sorted by selectivity (1-R2
t-1) and past
performance (alphat-1), and these average excess returns are regressed on the FFC model over the
whole 25 years (1990–2014, 300 months) to obtain the abnormal risk-adjusted excess return, i.e.,
the portfolio fund alpha. The annualized alpha and P-value for each portfolio are reported in
Panel A of Table 2. Next, we examine whether fund selectivity skill varies with time and mainly
whether high selectivity is associated with higher (lower) fund performance during high (low)
states of sentiment. We address this question by examining whether variations in fund
performance can be explained by variations in sentiment in line with the underlying hypothesis
of this paper predicting that fund managers endowed with high selectivity skill should be
associated with higher risk-adjusted excess returns during high investor sentiment periods. We
used the BW sentiment index to measure the investor sentiment and separate our sample into
high/low sentiment subgroups based on the investor sentiment, and each subgroup contains 150
months’ observations. Then we repeat the previous analysis for high and low sentiment periods
by sorting funds in each month by fund selectivity and past performance and present in Table 2
the annualized alpha and P-value for each portfolio for high (Panel B) and low (Panel C)
sentiment periods.

24
TABLE 1.2 Portfolio Fund Alpha, Based on Sorting on Lagged R
2 and Alpha
This table presents the portfolio fund alpha, annualized, using monthly returns, from January1990 to December
2014 (Panel A), high sentiment (Panel B), and low sentiment (Panel C) periods, based on the sentiment index data
available at Jeffrey Wurgler’s website. If the BW sentiment index for the test month (t) is higher (lower) than the
median number of all monthly BW sentiment index numbers, we define this month as high (low) market sentiment
month. Portfolios are formed by sorting all funds in each month into quintiles by lagged R2 and then by fund alphat-
1. Both are obtained from the 24-month estimation period (t-24 to t-1) by regressing each fund’s monthly excess
returns (over the T-bill rate) on the factors from FFC model. Then, for the following month (t), we calculate the
average monthly excess returns for each fund portfolio. This process is repeated by moving the estimation and test
period one month at a time. Last we regress the test period average portfolio returns on the FFC model. For each
portfolio cell, we present portfolio alpha, which is the intercept from the above regression, and the P-value. ***, **,
* denotes significance at the 1%, 5% or 10% level.
Panel A: Portfolio fund alpha for the entire sample period
Fund selectivity (1-R2t-1)
Alphat-1 Low 4 3 2 High All High-Low
Low -1.75*** -2.04*** -1.84** -1.97** -2.06 -1.93*** -0.20
(0.001) (0.003) (0.015) (0.026) (0.117) (0.002) (0.765)
2 -1.43*** -0.99** -0.90 -0.34 0.34 -0.67 0.87**
(0.001) (0.049) (0.154) (0.653) (0.712) (0.196) (0.047)
3 -0.94** -0.67 -1.17** -0.51 0.56 -0.55 0.65
(0.024) (0.143) (0.044) (0.450) (0.501) (0.219) (0.145)
4 -1.18** -1.16 0.11 -0.20 0.99 -0.28 1.05**
(0.011) (0.106) (0.840) (0.792) (0.277) (0.535) (0.037)
High -1.41* -0.81 -0.08 2.14** 3.05** 0.58 2.24***
(0.051) (0.355) (0.912) (0.025) (0.023) (0.381) (0.003)
All -1.34*** -1.14** -0.78 -0.19 0.58 -0.57 0.92**
(0.001) (0.012) (0.110) (0.754) (0.426) (0.166) (0.019)
High-Low 0.19 0.62 0.91* 2.03*** 2.57** 1.27**
(0.606) (0.191) (0.061) (0.001) (0.004) (0.004)
Panel B: Portfolio fund alpha during high market sentiment
Alphat-1 Low 4 3 2 High All High-Low
Low -2.38*** -3.71*** -2.97** -2.68* -1.45 -2.65*** 0.47
(0.002) (0.001) (0.017) (0.054) (0.412) (0.006) (0.614)
2 -2.34*** -1.38* -2.11** -1.02 0.02 -1.36* 1.18*
(0.001) (0.097) (0.026) (0.378) (0.990) (0.095) (0.068)
3 -1.36** -1.40** -2.19** -0.69* 0.03 -1.12* 0.61
(0.021) (0.050) (0.018) (0.508) (0.982) (0.095) (0.340)
4 -0.95 -1.19 -0.73 -0.01 0.36 -0.50 0.64
(0.187) (0.150) (0.381) (0.996) (0.792) (0.488) (0.396)
High -1.92 -1.39 -0.50 2.70* 4.82** 0.75 3.39***
(0.133) (0.379) (0.696) (0.073) (0.020) (0.499) (0.006)
All -1.79*** -1.82** -1.70** -0.35 0.74 -0.98 1.25**
(0.003) (0.014) (0.033) (0.721) (0.508) (0.147) (0.046)
High-Low 0.17 1.03 1.23 2.48*** 3.03** 1.59**
(0.787) (0.209) (0.117) (0.009) (0.015) (0.017)
Panel C: Portfolio fund alpha during low market sentiment
Alphat-1 Low 4 3 2 High All High-Low
Low -1.14** -0.33 -0.90 -1.38 -2.35 -1.21 -0.68
(0.035) (0.668) (0.272) (0.156) (0.236) (0.117) (0.470)
2 -0.61 -0.68 -0.45 -0.36 0.44 -0.34 0.47
(0.186) (0.161) (0.450) (0.670) (0.711) (0.540) (0.386)
3 -0.54 -0.31 -0.84 -0.81 0.58 -0.38 0.44
(0.280) (0.549) (0.136) (0.255) (0.595) (0.413) (0.449)
4 -1.34** -1.34 0.27 -1.22 1.40 -0.44 1.32*
(0.019) (0.253) (0.687) (0.117) (0.245) (0.410) (0.051)
High -0.68 0.30 0.16 0.89 0.63 0.26 0.65
(0.328) (0.694) (0.859) (0.439) (0.702) (0.730) (0.458)
All -0.86** -0.47 -0.34 -0.58 0.17 -0.42 0.45
(0.026) (0.321) (0.457) (0.331) (0.851) (0.341) (0.312)
High-Low 0.41 0.54 0.70 1.39* 1.68 0.94*
(0.312) (0.232) (0.208) (0.055) (0.196) (0.070)

25
Consistent with the findings of Amihud and Goyenko (2013), the results in Panel A of
Table 2 show that greater fund selectivity, as measured by (1-R2
t-1), yields higher fund alpha.
The results in the row “All” clearly show that fund portfolio performance (alpha) decreases as
we move from the high selectivity (high 1-R2
t-1) portfolio to the low selectivity (low 1-R2
t-1)
portfolio. The highest annualized alpha is 3.05% (P = 0.023) for the fund portfolio with the
highest selectivity and the best past performance. On average, around 8% of mutual funds
outperform the benchmark significantly every month, which confirms that a relatively small
fraction of some active funds does have selectivity skill that creates value for fund investors.
We also calculate the performance difference between the high selectivity fund portfolio
and the low selectivity fund portfolio by estimating a hypothetical portfolio of a long position in
the high selectivity fund portfolio and a short position in the low selectivity fund portfolio for
every lagged alpha quintile. These results, presented in the rightmost column of Table 2 under
“High-Low,” indicate that the return from this strategy is positive and significant in all alpha
quintiles except for the low alpha quintile. For the whole sample, the high selectivity fund
portfolio outperforms the low selectivity fund portfolio by 0.92% (P = 0.019). For the highest
and second-highest alpha quintiles, the hypothetical portfolio yields an annualized alpha of
2.24% (P = 0.003) and 1.05% (P = 0.037), respectively. In sum, the results in Panel A of Table 2
reveal that funds’ risk-adjusted excess return is higher for funds with greater fund selectivity skill
(1-R2
t-1), which is highly consistent with the patterns in Amihud and Goyenko (2013).
As predicted, the results in Panels B and C of Table 2 demonstrate that high selectivity
fund managers outperform the market benchmark and their low selectivity counterparts only
during high sentiment periods. When investor sentiment level is high, as shown in Panel B, the
highest past alpha quintile managers with the highest skill and second-highest skill produce
26
4.82% (P = 0.020) and 2.70% (P = 0.073) higher excess returns than the market benchmark,
respectively. In sum, about 8% of active funds outperform the market benchmark during high
sentiment periods. The hypothetical strategy of a long position in the high selectivity fund
portfolio and a short position in the low selectivity fund portfolio, rightmost “High-Low,” yields
1.25% (P = 0.046) extra return than the market. However, the results in Panel C indicate that
during low sentiment periods none of the fund portfolios can beat the market benchmark
significantly. In addition, the hypothetical strategy fails to significantly outperform the market on
average. These results indicate the superior performance of fund managers with the highest and
the second highest selectivity skill, reported in Panel A for the entire sample period, is realized
during high sentiment periods. Taken together, the results are in line with our hypothesis that
high fund management selectivity produces the highest alpha only during high sentiment
periods. Funds with higher selectivity skill deliver higher risk-adjusted returns in high sentiment
periods. During low sentiment periods, they fail to outperform the market when asset prices are
commonly believed to trade near their intrinsic values due to the absence of noise traders.8
Jointly, these results suggest that fund selectivity skill is far more valuable to fund investors
when there is high sentiment and price signals are noisy due to the greater presence of investor
hype in the market.
BvanB Fund Management Added Value Performance Results
In this section, we report results based on the Berk and van Binsbergen (2015) fund
selectivity measure, i.e., BvanB fund skill. As noted earlier, this fund skill measure allows us to
deduce the fund selectivity based on the extra value added to the fund (i.e., the mean of the
product of the gross abnormal return and fund size at the beginning of the period divided by its
8 To check the sensitivity of these results, we replicated our analysis using the median number of the UM index to separate
high/low sentiment periods, and the results are presented in Appendix III. The results are more significant, both economically and
statistically.

27
standard error) measured over the 24-month estimation period. The advantage of this metric it
that it permits to gauge the success of a fund manager based on the added value of an investment
opportunity (i.e., the net present value (NPV) of an investment) rather than the return a fund
earns (i.e., the internal rate of return (IRR)), as bigger funds could generate more value even if
they have lower alphas. To form the portfolios, we first rank all funds within each month based
on their prior month’s BvanB fund skill, as described in Eq. (3), and sort them into five quintiles.
Within each quintile, we sort funds into five portfolios based on their previous performance, i.e.,
the BvanB fund alphat-1. The BvanB fund alphat-1 of each fund in each month is the product of
fund alphat-1 and fund inflation-adjusted TNA at the beginning of the last month in the 24-month
estimation period, while fund alphat-1 is obtained by regressing each fund’s monthly excess
returns on the 11 Vanguard index funds orthogonal bases. Then, for the following month, we
calculate the average monthly excess return for each portfolio, and we regress the test period
average portfolio returns on the alternative investment opportunity market benchmark. For each
portfolio, we present the portfolio BvanB fund alpha, which is the product of the intercept from
the above regression and the average inflation-adjusted TNA of all funds within the portfolio at
the beginning of the current month, and present these results in Table 3.9 This procedure
produces 25 (5x5) portfolios with a different BvanB fund skill and BvanB fund alphat-1, and
each portfolio contains 4% of the total mutual funds within the same month.
9 We also did a similar portfolio performance analysis using the median number of the UM index to separate high/low sentiment
periods, and we sort funds into portfolios based on BvanB fund skill and conventional fund alphat-1, which is obtained from the
estimation period by regressing each fund’s monthly excess returns on the factors from the alternative market benchmark, formed
by the 11 Vanguard index funds orthogonal bases. The results, exhibited in Appendix IV, are consistent and more significant.

28
TABLE 1.3 Portfolio BvanB Fund Alpha, Based on Sorting on BvanB Fund Skill and Lagged BvanB Fund
Alpha This table presents the portfolio BvanB fund alpha, annualized, using monthly returns (145 months), from
December 2002 to December 2014 (Panel A), high sentiment (Panel B), and low sentiment (Panel C) periods, based
on the sentiment index data available at Jeffrey Wurgler’s website. If the BW sentiment index for the test month (t)
is higher (lower) than the median number of all monthly BW sentiment index numbers, we define this month as high
(low) market sentiment month. Portfolios are formed by sorting all funds in each month into quintiles by BvanB
fund skill (Eq. 3) and then by BvanB fund alphat-1, and both are described in detail in section III.B.2. For each
portfolio cell, we present portfolio BvanB fund alpha, which is the portfolio alpha times the average TNA of funds
within the portfolio at the beginning of current month (t), and the P-value. ***, **, * denotes significance at the 1%,
5% or 10% level.
Panel A: Portfolio BvanB fund alpha for the entire sample period
BvanB fund skill
BvanB Alphat-1 Low 4 3 2 High All High-Low
Low -18.06* -3.25 -1.44 -0.22 0.77 -4.44 9.42*
(0.074) (0.115) (0.353) (0.850) (0.609) (0.124) (0.056)
4 -8.61 -3.25* -1.30 -0.42 1.03 -2.51 4.82*
(0.103) (0.065) (0.324) (0.740) (0.563) (0.194) (0.069)
3 -4.84 -2.30 -0.87 0.31 1.22 -1.29 3.03*
(0.140) (0.138) (0.470) (0.796) (0.498) (0.393) (0.089)
2 -4.52 -2.02 -0.64 0.14 2.14 -0.98 3.33*
(0.120) (0.168) (0.575) (0.911) (0.308) (0.500) (0.053)
High -4.80** -1.75 -0.20 0.64 3.74 -0.48 4.27*
(0.048) (0.182) (0.864) (0.649) (0.337) (0.769) (0.061)
All -8.82* -2.51 -0.89 0.09 1.78 -1.94 5.30**
(0.078) (0.115) (0.472) (0.943) (0.413) (0.280) (0.044)
High-Low 6.63* 0.75 0.62 0.43 1.48 1.98*
(0.098) (0.150) (0.138) (0.199) (0.261) (0.060)
Panel B: Portfolio BvanB fund alpha during high market sentiment
BvanB Alphat-1 Low 4 3 2 High All High-Low
Low -5.64 2.98 3.12 3.55* 3.44 1.49 4.54
(0.732) (0.356) (0.217) (0.054) (0.167) (0.755) (0.566)
4 8.97 1.80 2.60 2.99 4.51 4.17 -2.23
(0.249) (0.516) (0.207) (0.141) (0.138) (0.166) (0.560)
3 4.67 2.04 2.85 3.78* 3.64 3.39 -0.52
(0.344) (0.416) (0.138) (0.055) (0.234) (0.169) (0.842)
2 3.39 2.23 2.78 3.24 5.25 3.38 0.93
(0.441) (0.339) (0.140) (0.114) (0.128) (0.157) (0.710)
High 1.65 1.90 3.03 3.86 7.71 3.63 3.03
(0.656) (0.370) (0.122) (0.101) (0.219) (0.183) (0.373)
All 3.21 2.19 2.88 3.48* 4.91 3.21 0.85
(0.682) (0.387) (0.154) (0.082) (0.172) (0.276) (0.829)
High-Low 3.64 -0.54 -0.05 0.15 2.14 1.07
(0.579) (0.516) (0.944) (0.782) (0.304) (0.520)
Panel C: Portfolio BvanB fund alpha during low market sentiment
BvanB Alphat-1 Low 4 3 2 High All High-Low
Low -30.32** -9.39*** -5.95*** -3.95*** -1.85 -10.29*** 14.23**
(0.011) (0.001) (0.001) (0.006) (0.284) (0.002) (0.017)
4 -25.96*** -8.22*** -5.14*** -3.77*** -2.40 -9.10*** 11.78***
(0.001) (<.001) (0.001) (0.010) (0.198) (<.001) (0.001)
3 -14.22*** -6.58*** -4.54*** -3.11** -1.15 -5.92*** 6.53***
(0.001) (0.001) (0.001) (0.018) (0.557) (0.001) (0.007)
2 -12.33*** -6.20*** -4.02*** -2.92** -0.93 -5.28*** 5.70**
(0.001) (0.001) (0.002) (0.032) (0.700) (0.001) (0.017)
High -11.17*** -5.35*** -3.38*** -2.54* -0.18 -4.53*** 5.49*
(0.001) (0.001) (0.007) (0.091) (0.969) (0.009) (0.074)
All -20.68*** -7.15*** -4.61*** -3.26** -1.30 -7.02*** 9.69***
(0.001) (0.001) (0.001) (0.018) (0.599) (0.001) (0.006)
High-Low 9.58** 2.02*** 1.28** 0.70* 0.84 2.88**
(0.041) (0.001) (0.013) (0.073) (0.613) (0.028)

29
Consistent with our previous findings (Table 2), the results in Table 3 reveal that funds
with superior management skills, as measured by BvanB fund skill, have better performance.
The results of Panel A in the row “All” show that fund portfolio performance (BvanB fund
alpha) decreases as we move from the high BvanB fund skill portfolio to the low BvanB fund
skill portfolio, i.e., greater fund skill produces higher BvanB fund alphas. The highest annualized
BvanB fund alpha is 3.74 (P = 0.337) for the fund portfolio with the highest BvanB fund skill
and the best past performance. While highly skilled fund managers with high past performance,
Q5, do not outperform the benchmark significantly every month, the low-skilled ones realize
significant losses of -4.80 (P = 0.048). The reason is that highly skilled managers, due to their
high past performance, experience high capital inflow and—under the pressure to invest the extra
capital received from investors—they are forced to make suboptimal investment decisions due to
limited optimal investment opportunities in the market. This, in return, lowers the profitability of
their skills.
The results for the hypothetical portfolio of a long position in a high BvanB fund skill
portfolio and a short position in a low BvanB fund skill portfolio for each lagged alpha quintile,
presented in the rightmost column of Panel A under “High-Low,” indicate that the return from
this strategy is positive and significant in all alpha quintiles. For example, the high BvanB skill
fund portfolio outperforms the low BvanB skill fund portfolio by 5.30 (P = 0.044). For the
highest and second-highest BvanB alpha quintiles, the hypothetical portfolio yields an
annualized alpha of 4.27 (P = 0.061) and 3.33 (P = 0.053), respectively. On average, the high
BvanB fund skill portfolio adds 5.30 million dollars more capital than the low BvanB fund skill
portfolio every month (P = 0.044). Overall, these results confirm that funds with the best past
performance are associated with the most highly skilled managers.

30
The results in Panels B and C of Table 3 demonstrate that highly skilled managers do
better during high sentiment periods than in low sentiment periods. In high sentiment periods
(Panel B), consistent with the previous evidence, the highest annualized BvanB fund alpha is
$7.71 million (P = 0.337) for the fund portfolio with the highest BvanB fund skill and the best
past performance. Even though this number is not significant, it is much higher than the entire
sample period, i.e., $3.74 million (P = 0.337). This indicates that the performance of skilled fund
managers is pronounced when financial markets are populated with noisy investors. This means
that managers with the highest skill produce $7.71 million added value during high sentiment
periods, but only $3.74 million for the entire period. That is, they can double a fund’s added
value in high sentiment periods even though they experience an increased inflow of capital
because of their superior past performance. While highly skilled managers with high past
performance, Q5, do not significantly outperform the benchmark every month, the low-skilled
ones do not realize losses (P = 0.656) in high sentiment periods. This performance difference
shows that highly skilled fund managers do considerably better in high sentiment periods (Panel
B) than in the entire sample period (Panel A). The reason that highly skilled managers with high
past performance do not realize statistically significant superior performance in high sentiment
periods is because they experience high capital inflows and under the pressure to invest the extra
capital received from investors it lowers the profitability of their skill due to limited optimal
investment opportunities.
However, in low sentiment periods (Panel C), the highest annualized BvanB fund alpha
is -0.18 (P = 0.969) for the fund portfolio with the highest BvanB fund skill and the best past
performance. This is substantially lower than the counterpart fund performance in high sentiment
periods (Panel B), i.e., 7.71 (P = 0.219), and this is consistent with our view that skilled fund
31
managers outperform their peers even in low sentiment periods. In addition, the row “All” in
Panel C shows that fund portfolio performance (BvanB fund alpha) is significantly below the
benchmark and in contrast with the corresponding row “All” for high sentiment periods (Panel
B). While a greater fund skill produces a higher BvanB fund alpha, the highest annualized
BvanB fund alpha is -0.18% (P = 0.969) for the fund portfolio with the highest BvanB fund skill
and the best past performance, while the parallel BvanB fund alpha in the high sentiment periods
is 7.71 (P = 0.219). The rest of the funds of this group realize significant negative BvanB fund
alphas. The results for the hypothetical portfolio of a long position in a high BvanB fund skill
portfolio and a short position in a low BvanB fund skill portfolio for every lagged alpha quintile,
presented in the rightmost column of Panel C under “High-Low,” suggest that the high BvanB
skill fund portfolio realizes significantly lower losses than the low BvanB skill fund portfolio by
9.69 (P = 0.006). For the highest and second-highest BvanB alpha quintiles, the hypothetical
portfolio yields an annualized alpha of 5.49 (P = 0.074) and 5.70 (P = 0.017), respectively,
suggesting that the high BvanB skill fund portfolio consistently realizes significantly lower
losses than the low BvanB skill fund portfolio. Taken together, the results are in line with our
contention that the performance of skilled fund managers is greater in high sentiment periods
than in low sentiment periods suggesting that fund management skill is of higher value to
investors when there is greater noise in the market.
Fund Portfolio Performance and Stock Market Dispersion
As discussed in section III, equity market dispersion and the state of the economy can
influence the performance of skilled fund managers. To examine their impact on fund portfolio
performance, we first repeat our portfolio sorting analysis simply based on the market dispersion.
Similar to our sentiment analysis, we divide our sample into high and low market-dispersion

32
periods based on the median number of the market-dispersion index, calculated for January 1990
to December 2014. The reported results in Table 4 for the high (Panel A) and low (Panel B)
market-dispersion periods indicate that skilled fund managers outperform their unskilled peers
and the market benchmark, especially during high market-dispersion periods. This pattern, which
is consistent with our high sentiment results, suggests that skilled fund managers can add value
to fund investor portfolios when the market is subject to considerable uncertainty and more
difficult than normal times for fund investors to interpret financial price signals.
Fund Portfolio Performance and Economic Activity
Using CFNAI MA3 to split the sample into recession and expansion periods, we repeated
the portfolio sorting analysis using the same sample period as in the previous section (1990–
2014). Our results, as shown in Table 5, reveal that more funds with high selectivity skill realize
positive risk-adjusted excess returns in economic expansions, which is 1.58% (P = 0.041), than
in economic recessions, which is 0.27% (P = 0.786). In addition, the performance dispersion
between the highest selectivity fund and the lowest selectivity fund is more pronounced in
economic recessions, i.e., 2.71% (P = 0.008), than in expansions, i.e., 2.41% (P = 0.021), which
is consistent with the previous literature (Kacperczyk et al., 2011) that found that skilled active
funds provide an insurance mechanism against recessions.
Jointly, these results—while in line with previous studies—also demonstrate that skilled
fund managers have superior performance during states of high equity market dispersion and
economic expansion. However, one can argue that it is essentially market dispersion or business
cycle, rather than investor sentiment that determines the fund performance difference between
the high and low sentiment states. In response to this argument, as shown later in Tables 7 and 8,
we account for the stock market dispersion and business cycle effects in our analysis and find

33
TABLE 1.4 Portfolio Fund Alpha, Based on Sorting on Lagged R
2 and Fund Alpha, in High and Low Market
Dispersion Periods The table presents the portfolio alpha, annualized, using monthly returns, in high and low market sentiment periods.
If market dispersion index for the test month (t) is higher (lower) than the median number of all monthly market
dispersion index numbers, we define this month as high (low) market dispersion month. Portfolios are formed by
sorting all funds in each month into quintiles by lagged R2 and then by fund alphat-1. Both are obtained from the 24-
month estimation period (t-24 to t-1) by regressing each fund’s monthly excess returns (over the T-bill rate) on the
factors from FFC model. Then, for the following month (t), we calculate the average monthly excess returns for each
fund portfolio. The process repeats by moving the estimation and test period one month at a time. Last, we regress
the test period average portfolio returns on the FFC model. For each portfolio cell we present portfolio alpha, which
is the intercept from the above regression, and the P-value. The sample period of the test months is from February
1990 to December 2014 (299 months). Panel A shows the results of high market dispersion group and Panel B
shows the results of low market dispersion group. For each portfolio, we present the portfolio alpha, annualized,
using monthly returns and the P-value. ***, **, * denotes significance at the 1%, 5% or 10% level.
Panel A: During high market dispersion
Fund selectivity (1-R2
t-1)
Alphat-1 Low 4 3 2 High All High-Low
Low -2.31*** -3.59*** -1.87 -1.92 -1.39 -2.22** 0.38
(0.002) (0.002) (0.163) (0.201) (0.534) (0.040) (0.729)
2 -2.00*** -1.39* -1.38 -0.16 1.46 -0.69 1.73**
(0.004) (0.096) (0.196) (0.902) (0.341) (0.432) (0.017)
3 -1.53** -1.31* -2.04** -0.83 -0.20 -1.18 0.57
(0.026) (0.083) (0.037) (0.459) (0.889) (0.113) (0.452)
4 -2.39*** -1.39 -0.21 0.01 1.02 -0.59 1.68**
(0.002) (0.121) (0.822) (0.995) (0.497) (0.442) (0.045)
High -1.98 -2.37 0.07 3.57** 4.55** 0.77 3.28***
(0.118) (0.139) (0.962) (0.031) (0.035) (0.509) (0.008)
All -2.05*** -2.02*** -1.09 0.11 1.09 -0.79 1.53**
(0.001) (0.009) (0.196) (0.913) (0.382) (0.272) (0.020)
High-Low 0.06 0.57 0.88 2.61** 2.88* 1.41*
(0.925) (0.498) (0.308) (0.015) (0.051) (0.062)
Panel B: During low market dispersion
Fund selectivity (1-R2
t-1)
Alphat-1 Low 4 3 2 High All High-Low
Low -1.39*** -0.68 -1.60*** -2.10*** -2.92** -1.74*** -0.78
(0.008) (0.289) (0.006) (0.010) (0.034) (0.002) (0.278)
2 -0.98** -0.67 -0.52 -0.35 -0.84 -0.68* 0.03
(0.015) (0.130) (0.307) (0.615) (0.368) (0.095) (0.947)
3 -0.48 -0.14 -0.18 -0.20 1.47* 0.10 0.88**
(0.210) (0.750) (0.730) (0.744) (0.058) (0.784) (0.044)
4 0.13 -0.82 0.57 -0.16 1.13 0.17 0.47
(0.794) (0.475) (0.303) (0.814) (0.201) (0.694) (0.350)
High -0.68 1.05 0.09 1.31 2.04 0.77 1.38
(0.304) (0.119) (0.884) (0.136) (0.187) (0.191) (0.107)
All -0.68* -0.25 -0.33 -0.31 0.18 -0.28 0.40
(0.058) (0.547) (0.413) (0.518) (0.786) (0.399) (0.312)
High-Low 0.51 0.93** 1.02*** 1.83*** 2.62** 1.38***
(0.168) (0.018) (0.004) (0.002) (0.011) (0.001)

34
TABLE 1.5 Portfolio Fund Alpha, Based on Sorting on Lagged R
2 and Fund Alpha, in Economic Expansions
and Economic Recessions The table presents the portfolio alpha, annualized, using monthly returns, in high and low market sentiment periods.
If the Fed National Activity Index 3 month average (CFNAI MA3) for the test month (t) is higher (lower) than the
median number of all monthly CFNAI MA3 index numbers, we define this month as economic expansion
(recession) month. Portfolios are formed by sorting all funds in each month into quintiles by lagged R2 and then by
fund alpha. Both are obtained from the 24-month estimation period (t-24 to t-1) by regressing each fund’s monthly
excess returns (over the T-bill rate) on the factors from FFC model. Then, for the following month (t), we calculate
the average monthly excess returns for each fund portfolio. The process repeats by moving the estimation and test
period one month at a time. Last, we regress the test period average portfolio returns on the FFC model. For each
portfolio cell, we present portfolio alphat-1, which is the intercept from the above regression, and the P-value. The
sample period of the test months is from January 1990 to December 2014 (300 months). Panel A shows the results in
economic expansions and Panel B shows the results in economic recessions. For each portfolio, we present the
portfolio alpha, annualized, using monthly returns and the P-value. ***, **, * denotes significance at the 1%, 5% or
10% level.
Panel A: Economic expansions
Fund selectivity (1-R2
t-1)
Alphat-1 Low 4 3 2 High All High-Low
Low -1.52** -3.27*** -2.55** -4.09*** -3.12* -2.92*** -0.88
(0.028) (0.001) (0.029) (0.003) (0.084) (0.002) (0.327)
2 -1.75*** -0.67 -2.65*** -1.00 -0.97 -1.41** 0.35
(0.006) (0.381) (0.003) (0.298) (0.401) (0.043) (0.532)
3 -1.07* -0.95 -1.25 -1.14 -0.02 -0.89 0.47
(0.075) (0.122) (0.142) (0.203) (0.983) (0.122) (0.334)
4 -0.46 -1.83 -0.17 -0.57 1.48 -0.31 0.92
(0.459) (0.146) (0.810) (0.609) (0.176) (0.610) (0.123)
High -0.75 -0.13 0.95 3.69*** 4.11** 1.58** 2.41**
(0.422) (0.892) (0.268) (0.006) (0.024) (0.041) (0.021)
All -1.12** -1.38** -1.14* -0.65 0.27 -0.81 0.64
(0.032) (0.028) (0.086) (0.439) (0.760) (0.152) (0.176)
High-Low 0.37 1.56** 1.82*** 3.82*** 3.60*** 2.24***
(0.478) (0.012) (0.003) (<.001) (0.003) (<.001)
Panel B: Economic recessions
Fund selectivity (1-R2
t-1)
Alphat-1 Low 4 3 2 High All High-Low
Low -1.89*** -1.04 -0.68 -0.30 -0.62 -0.90 0.61
(0.003) (0.224) (0.464) (0.778) (0.738) (0.252) (0.512)
2 -1.06** -1.19* 0.73 0.65 1.99 0.22 1.55**
(0.042) (0.072) (0.394) (0.554) (0.161) (0.767) (0.019)
3 -0.84 -0.06 -0.66 0.20 1.37 0.01 0.95
(0.127) (0.916) (0.393) (0.835) (0.325) (0.987) (0.195)
4 -1.87*** -0.38 0.63 0.45 0.99 -0.02 1.44*
(0.006) (0.610) (0.462) (0.661) (0.497) (0.972) (0.077)
High -1.79* -1.34 -0.62 1.61 3.54* 0.27 2.71***
(0.075) (0.313) (0.606) (0.220) (0.055) (0.786) (0.008)
All -1.49*** -0.80 -0.12 0.51 1.48 -0.08 1.46**
(0.003) (0.175) (0.866) (0.549) (0.193) (0.891) (0.013)
High-Low 0.06 -0.17 -0.01 0.92 2.11* 0.58
(0.914) (0.789) (0.982) (0.185) (0.094) (0.301)

35
that funds with skilled managers continue to have a significantly better performance during high
investor sentiment periods.
Fund Management Selectivity Performance Regression Results
So far we have analyzed the linear relationship between active fund performance,
selectivity, and sentiment, but we want to make sure that high selectivity funds do outperform
low selectivity funds using different factor models. To do so, we first formed two fund portfolios
based on selectivity. In each month from January 1990 to December 2014, we formed five
equally weighted fund portfolios based on their selectivity, which is estimated using rolling
regressions of the FFC model with the 24-month time windows. These portfolios are rebalanced
every month. Within these five portfolios, we only focus on the highest selectivity fund portfolio
and the lowest selectivity fund portfolio. Within each month, we calculate the equally weighted
average return for both portfolios and this provides a time series of monthly performance
estimates for each portfolio. We then calculate the risk-adjusted returns of high and low
selectivity fund portfolios using the CAPM model, FF3 model, and FFC model. The results are
shown in Table 6, along with the performance of the hypothetical strategy of longing the high
selectivity fund portfolio and shorting the low selectivity fund portfolio, in the column labeled
"High-Low".

36
TABLE 1.6 Regressions of Returns of Fund Portfolios on CAPM, FF3, and FFC Models This table reports the regression results for monthly returns on portfolios with high or low skilled funds from
January 1990 through December 2014 (300 months) based on CAPM model, FF3 model, and FFC model. The high
(low) skilled fund portfolio is an equal weighted portfolio of active US equity funds with the highest (lowest) 20%
selectivity (1-R2
t-1), where R2
t-1 is obtained from the 24-month estimation period (t-24 to t-1) by regressing each
fund’s monthly excess returns (over the T-bill rate) on the factors from FFC model. The process repeats by moving
the estimation and test period one month at a time. The independent variables contain market excess return (RM-Rf),
return difference of small and big size stocks (SMB), return difference of high and low book-to-market ratio stocks
(HML), and return difference of past winner and loser stocks (MOM). The regression results of a hypothetical
strategy of buying high skilled fund portfolio and selling low skilled fund portfolio are also reported in this table.
The sample period of the test months is from January 1990 to December 2014 (300 months). The P-value and
adjusted R2 for each regression are also presented. ***, **, * denotes significance at the 1%, 5% or 10% level.
CAPM 3 Factor Model 4 Factor Model
High Skill Low Skill High - Low High Skill Low Skill High - Low High Skill Low Skill High - Low
Intercept 0.14* -0.12*** 0.13*** 0.06 -0.13*** 0.09*** 0.05 -0.11*** 0.08**
(0.082) (<.001) (<.001) (0.304) (<.001) (0.004) (0.433) (<.001) (0.031)
RM-Rf 0.89*** 1.02*** -0.06*** 0.88*** 1.02*** -0.07*** 0.88*** 1.01*** -0.06***
(<.001) (<.001) (<.001) (<.001) (<.001) (<.001) (<.001) (<.001) (<.001)
SMB
0.27*** 0.05*** 0.11*** 0.27*** 0.05*** 0.11***
(<.001) (<.001) (<.001) (<.001) (<.001) (<.001)
HML
0.19*** 0.02** 0.09*** 0.20*** 0.02 0.09***
(<.001) (0.052) (<.001) (<.001) (0.164) (<.001)
MOM
0.02 -0.02*** 0.02***
(0.170) (<.001) (0.001)
Adj. R2 0.89 0.99 0.14 0.94 0.99 0.41 0.94 0.99 0.42
Unsurprisingly, the low-skilled fund portfolio delivers significant negative fund alphas in
all three models. On the other hand, the highly skilled fund portfolio alpha is statistically
insignificant in the FF3 and FFC models, which indicates that, on average, fund managers do not
outperform these multifactor benchmarks. This is consistent with our earlier results
demonstrating that only a small fraction of (skilled) fund managers (i.e., with the highest
selectivity (Q5 quintile)), as shown in Tables 2 and 3. The high selectivity fund portfolio
outperforms its low selectivity counterpart significantly in all three models. The hypothetical
strategy of a long position in the high selectivity fund portfolio and a short position in the low
selectivity delivers 1.56% (P < 0.001), 1.08% (P = 0.004), and 0.96% (P = 0.031) annualized
alphas in each of the three models, respectively.10
After adjusting for other risk factors, the
10 The annualized alpha is calculated as the monthly alpha (regression intercept) times 12.

37
spread in alpha between the high selectivity fund portfolio and the low selectivity fund portfolio
decreases but continuous to remain significant. In addition, the significant negative relationship
(-0.02, P < 0.001) between the return of the low selectivity portfolio and the momentum risk
factor (MOM) indicates that low-skill managers require a lower return to invest in high-
momentum-related stocks, suggesting that low-skilled managers behave like the average investor
who chases momentum market anomalies by paying high prices. This confirms that they lack
analytic and investment selection skills. However, this is not the case for the skilled fund
managers. The insignificant coefficient between skilled fund portfolio and MOM (0.02, P =
0.170) means that highly skilled fund managers do not appear to make a profit by capitalizing on
the momentum anomaly per se. For the rest of our analysis, we will focus on the FFC model.
Subsequently, we use multivariate regression analysis to examine the effect of selectivity
and its interaction with sentiment on active fund performance for the entire sample period. The
multivariate regression results are calculated using the BW index, as an investor sentiment
measure,11
while we also control for the market dispersion and business cycle effects.12
To test
whether the profitability of fund management skill (selectivity) is higher during high sentiment
periods, we estimate the following model:
∑ (9)
where Alphaf,t is calculated as the difference in the fund’s excess return in each month (over the
T-bill rate) and the expected excess return in the same month. The expected excess return for
each fund in each month is calculated by multiplying the FFC model factor loadings from the 24-
11 We also replicate the same analysis using an orthogonalized BW index where each of the proxies has first been orthogonalized
with respect to a set of macroeconomic conditions. The results are similar to the reported ones and are available upon request. 12 Among those variables, CFAI MA3 and the UM index have the strongest correlation coefficient of 0.565, followed by the
correlation coefficient of -0.513 between CFAI MA3 and market dispersion. Our main sentiment measure, the BW index, has a -
0.015 coefficient with CFAI MA3 and a 0.351 coefficient with market dispersion.

38
month preceding estimation period by the factors in the current month. The estimation and test
periods are rolling one month at a time. Selectivity for each fund is calculated as 1-R2
t-1, and R2
is estimated using the FFC model with the 24-month estimation period. Control variables in the
regression include alphat-1, expense ratio, log value of fund age, fund turnover, log of fund total
net assets, and squared log value of the fund total net assets. Alphat-1 is the intercept from the
FFC model using a 24-month estimation period, and as in Amihud and Goyenko (2013), we
report results with and without alphat-1 as control variables. Based on the central prediction of
our hypothesis that active funds run by managers with high selectivity skills are expected to
produce a better performance during high investor sentiment periods, when market signals are
likely to be more noisy, than in low sentiment periods, we hypothesize that β1 > 0, β2 < 0, and β3
> 0.
Consistent with the univariate results presented earlier and the above prediction, the
results in Table 7 Panel A show that selectivity in all regression specifications, in accordance
with the evidence in Amihud and Goyenko (2013), is positive and significantly correlated with
fund alpha (P < 0.001) while sentiment is negative and significantly related to fund alpha (P <
0.001), suggesting that, on average, fund performance is adversely affected when the market is
plagued by noisy price signals as is most likely to be the case during high sentiment periods.
However, the coefficient of the interaction variable between fund management selectivity and
sentiment, Selectivity*Sentiment, is highly significant (0.23, P = 0.005 without alphat-1, and 0.21,
P = 0.009 with alphat-1) and positively related to fund performance. Consistent with our
hypothesis, this result demonstrates that during high sentiment periods, fund managers endowed
with high selectivity deliver high alphas. This implies that high selectivity managers possess the

39
ability to identify and make superior investments to the benefit of fund investors during high
sentiment periods when the market is populated by noisy investors.
Given that the distribution of R2 is negatively skewed with its mass being in the high
values close to 1, the distribution of selectivity should be heavily positively skewed. Therefore,
we replicated the previous estimation, using the logistic transformation of selectivity, labeled
TSelectivity, as shown in Eq. (10), instead of the original selectivity measure.
(10)
The new results, reported in Table 7 Panel B, have a similar pattern with those presented
previously in Panel A. The logistic-transformed selectivity measure is positively correlated with
fund alpha (P < 0.001). As in Panel A, Sentiment retains its negative relation with fund alpha (-
0.04, P = 0.088 without alphat-1, and -0.11, P < 0.001 with alphat-1) and the coefficient of the
new interaction variable, TSelectivity*Sentiment, and fund performance is still positive and
statistically significant (0.04, P < 0.001 without alphat-1, and 0.02, P = 0.016 with alphat-1).
Jointly, the results in Table 7 demonstrate a positive and significant relationship between fund
performance and fund management skill in high sentiment periods. A funds’ risk-adjusted excess
return is higher for funds run by high selectivity managers, as measured by 1-R2
t-1, in high
sentiment periods.
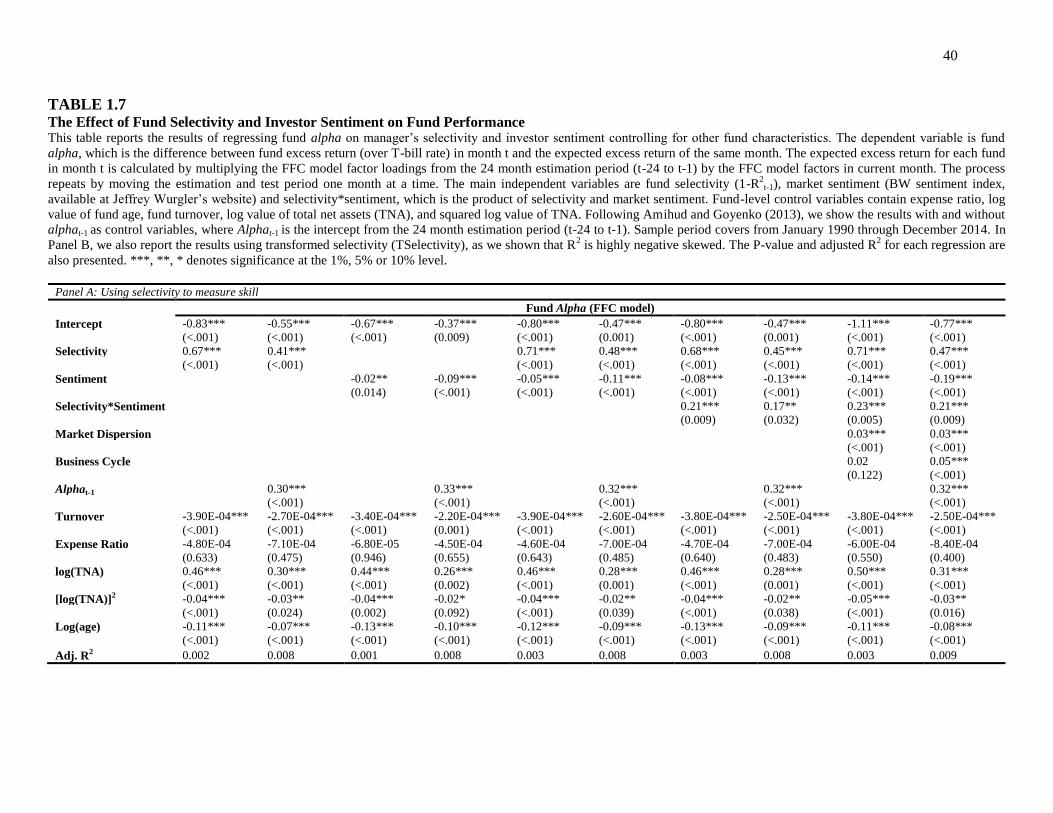
40
TABLE 1.7 The Effect of Fund Selectivity and Investor Sentiment on Fund Performance This table reports the results of regressing fund alpha on manager’s selectivity and investor sentiment controlling for other fund characteristics. The dependent variable is fund
alpha, which is the difference between fund excess return (over T-bill rate) in month t and the expected excess return of the same month. The expected excess return for each fund
in month t is calculated by multiplying the FFC model factor loadings from the 24 month estimation period (t-24 to t-1) by the FFC model factors in current month. The process
repeats by moving the estimation and test period one month at a time. The main independent variables are fund selectivity (1-R2
t-1), market sentiment (BW sentiment index,
available at Jeffrey Wurgler’s website) and selectivity*sentiment, which is the product of selectivity and market sentiment. Fund-level control variables contain expense ratio, log
value of fund age, fund turnover, log value of total net assets (TNA), and squared log value of TNA. Following Amihud and Goyenko (2013), we show the results with and without
alphat-1 as control variables, where Alphat-1 is the intercept from the 24 month estimation period (t-24 to t-1). Sample period covers from January 1990 through December 2014. In
Panel B, we also report the results using transformed selectivity (TSelectivity), as we shown that R2 is highly negative skewed. The P-value and adjusted R
2 for each regression are
also presented. ***, **, * denotes significance at the 1%, 5% or 10% level.
Panel A: Using selectivity to measure skill
Fund Alpha (FFC model)
Intercept -0.83*** -0.55*** -0.67*** -0.37*** -0.80*** -0.47*** -0.80*** -0.47*** -1.11*** -0.77***
(<.001) (<.001) (<.001) (0.009) (<.001) (0.001) (<.001) (0.001) (<.001) (<.001)
Selectivity 0.67*** 0.41***
0.71*** 0.48*** 0.68*** 0.45*** 0.71*** 0.47***
(<.001) (<.001)
(<.001) (<.001) (<.001) (<.001) (<.001) (<.001)
Sentiment
-0.02** -0.09*** -0.05*** -0.11*** -0.08*** -0.13*** -0.14*** -0.19***
(0.014) (<.001) (<.001) (<.001) (<.001) (<.001) (<.001) (<.001)
Selectivity*Sentiment
0.21*** 0.17** 0.23*** 0.21***
(0.009) (0.032) (0.005) (0.009)
Market Dispersion
0.03*** 0.03***
(<.001) (<.001)
Business Cycle
0.02 0.05***
(0.122) (<.001)
Alphat-1 0.30***
0.33***
0.32***
0.32***
0.32***
(<.001)
(<.001)
(<.001)
(<.001)
(<.001)
Turnover -3.90E-04*** -2.70E-04*** -3.40E-04*** -2.20E-04*** -3.90E-04*** -2.60E-04*** -3.80E-04*** -2.50E-04*** -3.80E-04*** -2.50E-04***
(<.001) (<.001) (<.001) (0.001) (<.001) (<.001) (<.001) (<.001) (<.001) (<.001)
Expense Ratio -4.80E-04 -7.10E-04 -6.80E-05 -4.50E-04 -4.60E-04 -7.00E-04 -4.70E-04 -7.00E-04 -6.00E-04 -8.40E-04
(0.633) (0.475) (0.946) (0.655) (0.643) (0.485) (0.640) (0.483) (0.550) (0.400)
log(TNA) 0.46*** 0.30*** 0.44*** 0.26*** 0.46*** 0.28*** 0.46*** 0.28*** 0.50*** 0.31***
(<.001) (<.001) (<.001) (0.002) (<.001) (0.001) (<.001) (0.001) (<.001) (<.001)
[log(TNA)]2 -0.04*** -0.03** -0.04*** -0.02* -0.04*** -0.02** -0.04*** -0.02** -0.05*** -0.03**
(<.001) (0.024) (0.002) (0.092) (<.001) (0.039) (<.001) (0.038) (<.001) (0.016)
Log(age) -0.11*** -0.07*** -0.13*** -0.10*** -0.12*** -0.09*** -0.13*** -0.09*** -0.11*** -0.08***
(<.001) (<.001) (<.001) (<.001) (<.001) (<.001) (<.001) (<.001) (<.001) (<.001)
Adj. R2 0.002 0.008 0.001 0.008 0.003 0.008 0.003 0.008 0.003 0.009
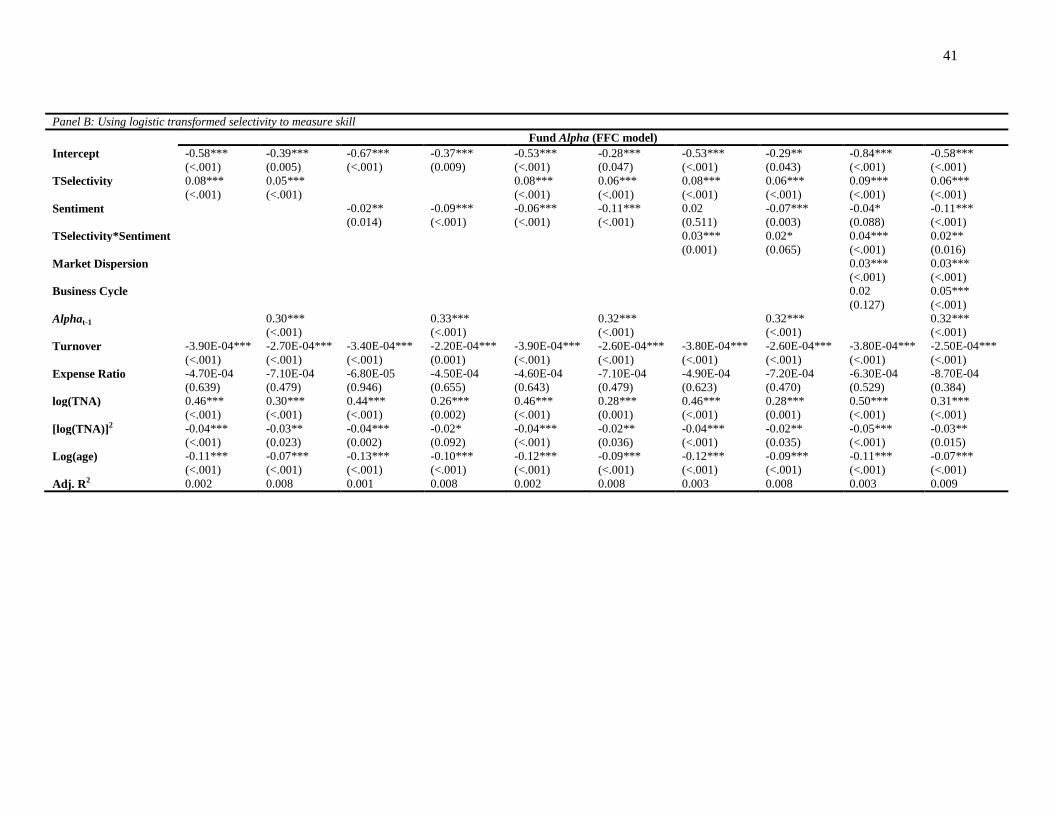
41
Panel B: Using logistic transformed selectivity to measure skill
Fund Alpha (FFC model)
Intercept -0.58*** -0.39*** -0.67*** -0.37*** -0.53*** -0.28*** -0.53*** -0.29** -0.84*** -0.58***
(<.001) (0.005) (<.001) (0.009) (<.001) (0.047) (<.001) (0.043) (<.001) (<.001)
TSelectivity 0.08*** 0.05***
0.08*** 0.06*** 0.08*** 0.06*** 0.09*** 0.06***
(<.001) (<.001)
(<.001) (<.001) (<.001) (<.001) (<.001) (<.001)
Sentiment
-0.02** -0.09*** -0.06*** -0.11*** 0.02 -0.07*** -0.04* -0.11***
(0.014) (<.001) (<.001) (<.001) (0.511) (0.003) (0.088) (<.001)
TSelectivity*Sentiment
0.03*** 0.02* 0.04*** 0.02**
(0.001) (0.065) (<.001) (0.016)
Market Dispersion
0.03*** 0.03***
(<.001) (<.001)
Business Cycle
0.02 0.05***
(0.127) (<.001)
Alphat-1 0.30***
0.33***
0.32***
0.32***
0.32***
(<.001)
(<.001)
(<.001)
(<.001)
(<.001)
Turnover -3.90E-04*** -2.70E-04*** -3.40E-04*** -2.20E-04*** -3.90E-04*** -2.60E-04*** -3.80E-04*** -2.60E-04*** -3.80E-04*** -2.50E-04***
(<.001) (<.001) (<.001) (0.001) (<.001) (<.001) (<.001) (<.001) (<.001) (<.001)
Expense Ratio -4.70E-04 -7.10E-04 -6.80E-05 -4.50E-04 -4.60E-04 -7.10E-04 -4.90E-04 -7.20E-04 -6.30E-04 -8.70E-04
(0.639) (0.479) (0.946) (0.655) (0.643) (0.479) (0.623) (0.470) (0.529) (0.384)
log(TNA) 0.46*** 0.30*** 0.44*** 0.26*** 0.46*** 0.28*** 0.46*** 0.28*** 0.50*** 0.31***
(<.001) (<.001) (<.001) (0.002) (<.001) (0.001) (<.001) (0.001) (<.001) (<.001)
[log(TNA)]2 -0.04*** -0.03** -0.04*** -0.02* -0.04*** -0.02** -0.04*** -0.02** -0.05*** -0.03**
(<.001) (0.023) (0.002) (0.092) (<.001) (0.036) (<.001) (0.035) (<.001) (0.015)
Log(age) -0.11*** -0.07*** -0.13*** -0.10*** -0.12*** -0.09*** -0.12*** -0.09*** -0.11*** -0.07***
(<.001) (<.001) (<.001) (<.001) (<.001) (<.001) (<.001) (<.001) (<.001) (<.001)
Adj. R2 0.002 0.008 0.001 0.008 0.002 0.008 0.003 0.008 0.003 0.009
42
BvanB Fund Management Added Value Regression Results
We re-examine the effect of fund management skill and its interaction with sentiment on
fund performance using the BvanB fund skill (ratio) and performance (alpha) measures, as
defined in section III.B.2, to estimate the following model:
∑ (11)
where BvanB fund alpha (performance) is the product of fund inflation-adjusted TNA at the
beginning of the current month and the difference between the fund excess return in the current
month and the expected excess return of the same month. BvanB fund skill is measured as the
product of fund alphat-1 and the fund TNA at the beginning of the last month in the 24-month
estimation period divided by the standard error of the fund alphat-1, where fund alphat-1 is the
intercept from the 24-month preceding estimation period.
Basically, the regression results in Table 8 show that BvanB fund skill significantly
contributes to the fund performance, BvanB fund alpha, in all regressions. Consistent with the
previous results, we find mostly a significant negative relationship between investor sentiment
and fund performance, but a positive and significant association between the interaction variable,
BvanB skill*Sentiment, and fund performance. This indicates that, on average, sentiment harms
the overall fund performance, but this does not hold for skilled fund managers. In fact, skilled
fund managers during high sentiment periods experience a significantly better performance than
in low sentiment periods due to their ability to identify and make superior investments in high
sentiment periods when the market is populated by noisy investors. The positive and significant
relationship between fund past performance, BvanB Alphat-1, and fund performance, BvanB fund
alpha, reveals a strong persistent performance of skilled managers. These results, as shown in the

43
far-right regressions, remain robust after controlling for the state of the economy and stock
market dispersion. In sum, the consistency between the multivariate and the univariate results,
regardless of fund selectivity and performance measures used, provide strong evidence in
support of the proposition that skilled fund managers realize superior risk-adjusted abnormal
returns in high sentiment periods when noisy trading is more prevalent and it is more difficult to
discern true (intrinsic) value.13
13 Avramov and Wermers (2006) argue that some macroeconomic variables can effect fund managers skill and influence fund
performance. To address this question, we use four macroeconomic variables, as suggested in their paper, to control economic
conditions: aggregate dividend yield, which is the total cash dividends on the value-weighted CRSP index over prior 12 months
divided by the current level of the index; default spread, which is the difference between Moody’s BAA-rated bonds yield and
AAA-rated bonds yield; term spread, which is the different between ten-year treasury bonds yield and three-month T-bills yield;
and the yield on the three-month T-bill. The results are consistent with our findings and can be found in Appendix V.

44
TABLE 1.8 The Effect of Fund Skill Ratio and Investor Sentiment on Fund Performance This table reports the results of regressing fund’s BvanB alpha on manager’s BvanB fund skill and investor
sentiment controlling for other fund characteristics. The dependent variable is fund’s BvanB alpha, which is the
product of fund total net assets (TNA) in month t-1and the difference between fund excess return (over T-bill rate)
in month t and the expected excess return of the same month. The expected excess return for each fund in month t is
calculated by multiplying the 11 Vanguard Index fund orthogonal bases factor loadings from the 24 month
estimation period (t-24 to t-1) by the 11 Vanguard Index fund orthogonal bases factors in current month. The
process repeats by moving the estimation and test period one month at a time. The main independent variables are
fund BvanB skill ratio, which is measured as the product of fund alphat-1 and fund TNA at the beginning of the last
month (t-1) in the estimation period (t-24 to t-1) divided by the standard error of the fund alphat-1, market sentiment
(BW sentiment index, available at Jeffrey Wurgler’s website), and Skill*Sentiment, which is the product of BvanB
skill ratio and market sentiment. Fund-level control variables contain expense ratio, log value of fund age, fund
turnover, log value of TNA, squared log value of TNA, and BvanB alphat-1, which is the product of fund alphat-1 and
fund TNA at the beginning of the last month (t-1) in the estimation period (t-24 to t-1) and fund alphat-1 is the
intercept from the 24 month estimation period (t-24 to t-1). Sample period ranges from December 2002 through
December 2014 (145 months). The P-value and adjusted R2 for each regression are also presented. ***, **, *
denotes significance at the 1%, 5% or 10% level.
BvanB Fund Alpha
Intercept 0.71*** 0.72*** 0.84*** 0.84***
(<.001) (<.001) (<.001) (<.001)
BvanB Skill 0.03** 0.04** 0.25*** 0.24***
(0.018) (0.014) (<.001) (<.001)
Sentiment
0.04*** -0.06*** -0.06***
(<.001) (<.001) (<.001)
BvanB Skill*Sentiment
1.01*** 1.00***
(<.001) (<.001)
Market Dispersion
0.01
(0.975)
Business Cycle
-0.02**
(0.036)
BvanB Alphat-1 1.03*** 1.03*** 1.02*** 1.02***
(<.001) (<.001) (<.001) (<.001)
Turnover 0.01 0.01* 0.01 0.01
(0.205) (0.092) (0.130) (0.243)
Expense Ratio -0.50*** -0.50*** -0.60*** -0.60***
(<.001) (<.001) (<.001) (<.001)
log(TNA) 0.08*** 0.08*** 0.10*** 0.10***
(<.001) (<.001) (<.001) (<.001)
[log(TNA)]2 7.11E-05** 6.81E-05** 6.01E-05* 5.86E-05*
(0.035) (0.043) (0.072) (0.080)
Log(age) 0.01 0.01 0.01 0.01
(0.631) (0.675) (0.357) (0.313)
Adj. R2 0.878 0.878 0.880 0.880
45
Stock Mispricing and Mutual Fund Performance
We next examine whether the superior performance of skilled fund managers in high
sentiment periods, when the views of more optimistic (noisy) investors are more pronounced and
short selling is limited, comes through investing in undervalued stocks. To address this issue, we
perform a cross-sectional analysis on the relation between fund performance and stock
mispricing, using a set of 11 market anomalies to identify overpriced stocks (Stambaugh et al.,
2012), and expect a negative relation to emerge for skilled fund managers.14,15
Specifically, the
stock mispricing data range between 0 and 100, and stocks with the highest mispricing values are
the ones that are overpriced by the market, while stocks with the lowest mispricing values are
underpriced. Then, we calculate the value weighted average of stock mispricing (VW_MISP) for
all stocks within each fund.16
To check the sensitivity of our results, we replace the value
weighted average mispricing with the equal weighted average of stock mispricing (EW_MISP)
for all stocks within each fund. Then, we break our sample into 5 quintiles based on fund
management skill, and estimate the relation between fund performance and stock mispricing for
each quintile.
Table 9 presents the coefficient between fund performance and stock mispricing by
regressing fund performance, for the 5 management skill quintiles, on fund level mispricing,
while controlling for past fund performance (Alphat-1), expense ratio, log value of fund age, fund
turnover, log value of total net assets (TNA), and squared log value of TNA. First, as expected,
the results in column “All” reveal a significant and negative relation between fund performance
and stock mispricing. Furthermore, we find that the negative association between fund
14 The 11 anomalies contain net stock issues, composite equity issues, accruals, net operating assets, asset growth, investment to
assets, financial distress, O-score, momentum, gross profitability premium, and return on assets. 15 The data are available through Yu Yuan’s website http://www.saif.sjtu.edu.cn/facultylist/yyuan/. 16 Fund holdings information is manually collected through Bloomberg Portfolio Analysis Database.

46
performance and stock mispricing is more pronounced for funds with lower management skills.
For example, when soring funds based on fund selectivity, the coefficient between fund
performance and VW_MISP (EW_MISP) in the lowest skill fund quintile is -0.111 (-0.111) and
significant, while the coefficient in the highest skill fund quintile is -0.069 (-0.101). This pattern
is even stronger when sorting funds into quintiles using BvanB fund skill measure. In sum,
consistent with our previous evidence, the results of this cross-sectional analysis demonstrate
that skilled fund managers’ investments are associated with undervalued stocks.
TABLE 1.9 Stock Mispricing and Mutual Fund Performance This table presents the coefficient between fund performance and fund mispricing level, along with the
corresponding P-value and regression adjusted R2, by regressing fund performance on fund level mispricing for each
management skill quintile while controlling for past fund performance (Alphat-1), expense ratio, log value of fund
age, fund turnover, log value of total net assets (TNA), and squared log value of TNA. Fund performance is
estimated using both Fund Alpha and BvanB Fund Alpha measures. Fund level mispricing is measured using two
ways: (i) VW_MISP is the market value weighted average of stock mispricing for all stocks within each fund and
(ii) EW_MISP is the equal weighted average of stock mispricing for all stocks within each fund. Stock mispricing
value is introduced by Stambaugh et al. (2012) and the data are available through Yu Yuan’s website
(http://www.saif.sjtu.edu.cn/facultylist/yyuan/). Furthermore, the sample is split into quintiles based on their
selectivity or BvanB skill, which are estimated using 24 month regression from October 2011 to September 2013.
Fund holdings information are manually collected through Bloomberg Portfolio Analysis Database, and the data are
collected for the last quarter of 2013. ***, **, * denotes significance at the 1%, 5% or 10% level.
Fund Alpha (FFC model)
All Lowest Selectivity Skill 4 3 2 Highest Selectivity Skill
VW_MISP -0.085*** -0.111*** -0.101*** -0.105*** -0.072*** -0.069***
P-Value (<.0001) (<.0001) (<.0001) (0.000) (0.008) (0.007)
Controls Yes Yes Yes Yes Yes Yes
Adj. R2 0.085 0.135 0.124 0.145 0.139 0.089
EW_MISP -0.101*** -0.111*** -0.102*** -0.121*** -0.097*** -0.101***
P-Value (<.0001) (<.0001) (<.0001) (<.0001) (0.000) (<.0001)
Controls Yes Yes Yes Yes Yes Yes
Adj. R2 0.108 0.134 0.118 0.155 0.165 0.135
BvanB Fund Alpha
All Lowest BvanB Skill 2 3 4 Highest BvanB Skill
VW_MISP -3.470*** -7.799** -1.671 -0.604** 0.061 -2.455
P value (0.005) (0.037) (0.132) (0.034) (0.973) (0.583)
Controls Yes Yes Yes Yes Yes Yes
Adj. R2 0.090 0.095 0.181 0.181 0.038 0.030
EW_MISP -3.098** -8.018** -2.013* -0.461 0.709 -0.353
P value (0.012) (0.037) (0.083) (0.104) (0.702) (0.933)
Controls Yes Yes Yes Yes Yes Yes
Adj. R2 0.089 0.095 0.184 0.172 0.020 0.028
47
Lucky Bias Analysis
Selectivity Performance Lucky Bias Results
One criticism about the superior performance of skilled fund managers, particularly in
high sentiment periods, as documented above, is that it could be attributed to luck rather than to
the differing abilities of managers. To address this concern, we followed Barras et al. (2010) and
conduct a lucky bias analysis for the entire sample and replicated the analysis for both high and
low sentiment periods. As shown in Table 10 Panel A, using fund risk-adjusted excess return
(fund alpha) as a performance measure, with a 20% significance level, 4.41% of the total funds
beat the market significantly, and within the 4.41% funds, only 1.63% of fund managers are truly
skilled. This number decreases to 0.69% when we move to the 5% significance level. This
indicates that some of the mutual fund managers do possess management skill, but the proportion
is very low.
After we take investor sentiment into consideration, the results for high (Panel B) and
low (Panel C) investor sentiment are consistent with our hypothesis. On average, 5.10% of funds
outperform the market benchmark with a 20% significance level during high sentiment periods.
After we get rid of the lucky funds, this number decreases to 1.57%. Using a 5% significance
level, the total proportion of funds with positive extra returns is 1.85%, and the skilled funds
account for 1.00% of total funds. During low sentiment periods, 3.70% (1.13%) of total funds
beat the market at the 20% (5%) significance level, and the true skilled-funds proportion is only
0.73% (0.39%). The explanation for observing more skilled fund managers during high than low
sentiment periods is that in high sentiment periods, when the market is noisy and information is
costly, the investor demand for superior fund management skills is greater, which increases the
payoffs of talented managers, resulting in superior fund performance.

48
TABLE 1.10 Skill versus Luck on the Fund Performance Using Fund Alpha to Measure Performance Fund performance is measured using fund alpha based on FFC model. Panel A shows the estimated proportions of zero-alpha,
unskilled, and skilled funds in the funds population with the monthly average fund number in each category based on Barras,
Scaillet, and Wermers (2010)’s methodology of false discoveries. It also exhibits the proportion of funds in the right and left
tails using four significant levels (0.05, 0.10, 0.15, and 0.20). The significant proportion in left tail is divided into unlucky and
unskilled categories, and the significant proportion in right tail is divided into lucky and skilled categories. Average fund
alpha and fund alpha standard division are also reported. Panel B and C show the results of false discoveries analysis during
high and low sentiment periods. The BW sentiment index is used to capture market sentiment and is available at Jeffrey
Wurgler’s website. If the BW sentiment index for the test month (t) is higher (lower) than the median number of all monthly
BW sentiment index numbers, we define this month as high (low) market sentiment month.
Panel A: Proportion of Unskilled and Skilled Funds
Zero Alpha Unskilled Skilled
Proportion 84.29% 11.30% 4.41%
Ave. # of funds 893 164 89
Left Tail
Right Tail
Significant level 0.05 0.10 0.15 0.20
0.20 0.15 0.10 0.05 Sig. level
Signif. % 4.55% 7.17% 9.23% 11.30%
4.41% 3.47% 2.53% 1.49% Signif. %
# of funds 66 104 134 164
89 70 51 30 # of funds
unlucky % 1.24% 2.55% 3.72% 6.10%
3.26% 2.43% 1.64% 0.79% lucky %
# of funds 18 37 54 89
66 49 33 16 # of funds
unskilled % 3.31% 4.62% 5.51% 6.40%
1.63% 1.04% 0.89% 0.69% skilled %
# of funds 48 67 80 91
24 21 18 14 # of funds
Alpha (% /month) -0.277 -0.321 -0.340 -0.354
0.826 0.884 0.961 1.081 Alpha (% /month)
Alpha Stdv. 1.979 1.985 1.995 2.007
3.434 3.537 3.670 3.530 Alpha Stdv.
Panel B: Proportion of Unskilled and Skilled Funds in High Market Sentiment
Zero Alpha Unskilled Skilled
Proportion 84.29% 10.06% 5.10%
Ave. # of funds 876 142 102
Left Tail
Right Tail
Sig. level 0.05 0.10 0.15 0.20
0.20 0.15 0.10 0.05 Sig. level
Signif. % 3.90% 6.23% 8.22% 10.06%
5.10% 4.10% 3.05% 1.85% Signif. %
# of funds 55 88 116 142
102 82 61 37 # of funds
unlucky % 1.20% 2.48% 3.68% 4.89%
3.35% 2.55% 1.70% 0.85% lucky %
# of funds 17 35 52 69
67 51 34 17 # of funds
unskilled % 2.69% 3.75% 4.53% 4.37%
1.57% 1.55% 1.35% 1.00% skilled %
# of funds 38 53 64 73
35 31 27 20 # of funds
Alpha (% /month) -0.764 -0.743 -0.707 -0.686
0.832 0.899 0.996 1.143 Alpha (% /month)
Alpha Stdv. 2.038 2.042 2.055 2.078
3.780 3.934 4.115 3.924 Alpha Stdv.
Panel C: Proportion of Unskilled and Skilled Funds in Low Market Sentiment
Zero Alpha Unskilled Skilled
Proportion 83.78% 12.52% 3.70%
Ave. # of funds 910 185 75
Left Tail
Right Tail
Sig. level 0.05 0.10 0.150 0.2
0.20 0.15 0.10 0.05 Sig. level
Signif. % 5.28% 8.12% 10.35% 12.52%
3.70% 2.86% 2.02% 1.13% Signif. %
# of funds 78 120 153 185
75 58 41 23 # of funds
unlucky % 1.35% 2.64% 3.93% 6.10%
3.06% 2.32% 1.53% 0.74% lucky %
# of funds 20 39 58 77
62 47 31 15 # of funds
unskilled % 3.93% 5.48% 6.43% 6.03%
0.73% 0.54% 0.49% 0.39% skilled %
# of funds 58 81 95 108
13 11 10 8 # of funds
Alpha (% /month) -0.197 -0.224 -0.236 -0.245
0.814 0.854 0.884 0.939 Alpha (% /month)
Alpha Stdv. 1.958 1.959 1.965 1.971
2.579 2.490 2.418 2.380 Alpha Stdv.

49
BvanB Fund Added Value Lucky Bias Results
When we replicate the lucky bias analysis, using the BvanB fund alpha, as the
performance measure, which captures the extra capital funds absorb from the financial market,
we find similar results to those reported in Table 9. Specifically, as shown in Table 11 Panel A,
on average, 7.52% (3.73%) of funds outperform the market benchmark at the 20% (5%)
significance level. The proportion drops to 5.40% (1.48%) at a 20% (5%) significance level after
we remove the lucky funds. Once again, during high sentiment periods, the percentage of skilled
funds goes up to 8.60% (2.71%), but in low sentiment periods, the percentage decreases to
2.24% (0.27%).
There are three points to take away from the lucky bias analysis. First, even though the
average mutual manager cannot beat the market, a small fraction of fund managers (about
0.69%, using selectivity (1-R2) measure and 1.48%, using BvanB value added skill measure,
both of which are below the 5% significance level) with high stock-picking skills delivers
persistently superior performance than their low skill peers. Second, skilled fund managers’
skills are more profitable during high sentiment periods when the market is crowded with noise
traders. During low sentiment periods when stocks are more likely to be traded near their
intrinsic values, only a smaller portion of skilled managers produces significantly positive fund
alphas for investors, which implies that selectivity skill is less valuable in low sentiment periods.
Third, as argued by Berk and van Binsbergen (2015), there are more skilled fund managers in the
market than we can detect using fund excess returns to capture performance because larger
skilled funds may generate more value for their clients with relative low alphas. One could argue
that an upward bias exists in the results due to sample selection, since good opportunities might
attract more talented managers into the mutual fund industry during high sentiment periods.
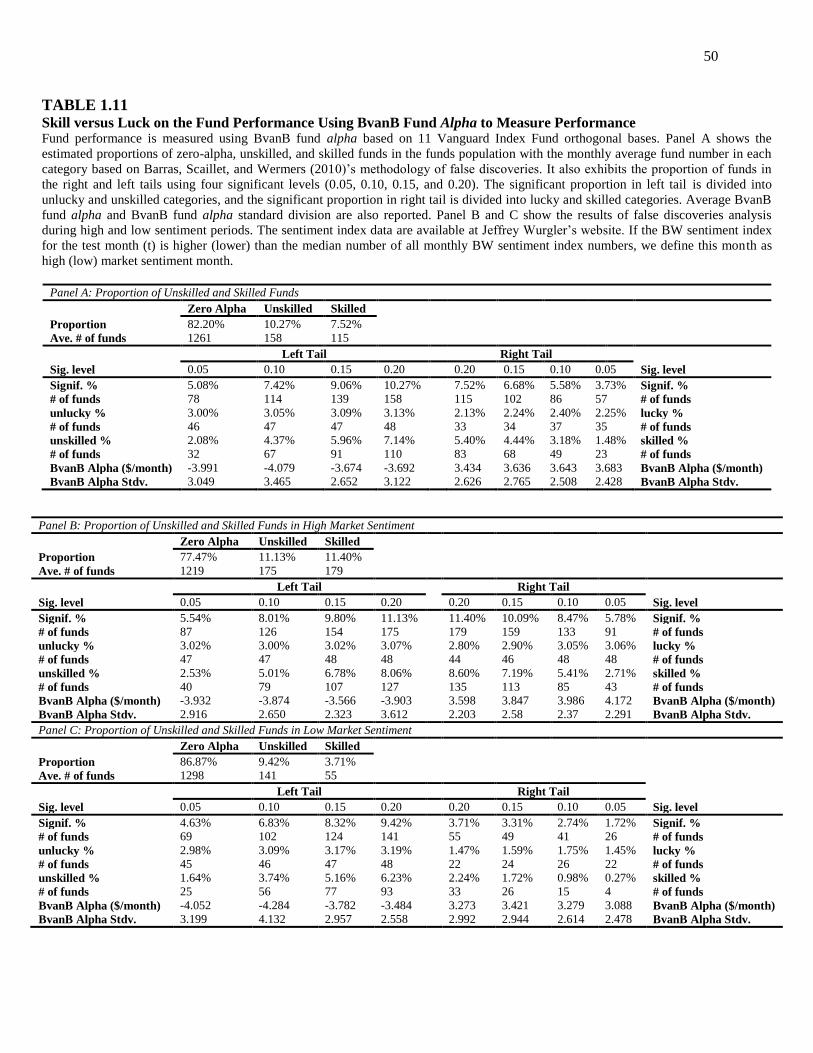
50
TABLE 1.11 Skill versus Luck on the Fund Performance Using BvanB Fund Alpha to Measure Performance Fund performance is measured using BvanB fund alpha based on 11 Vanguard Index Fund orthogonal bases. Panel A shows the
estimated proportions of zero-alpha, unskilled, and skilled funds in the funds population with the monthly average fund number in each
category based on Barras, Scaillet, and Wermers (2010)’s methodology of false discoveries. It also exhibits the proportion of funds in
the right and left tails using four significant levels (0.05, 0.10, 0.15, and 0.20). The significant proportion in left tail is divided into
unlucky and unskilled categories, and the significant proportion in right tail is divided into lucky and skilled categories. Average BvanB
fund alpha and BvanB fund alpha standard division are also reported. Panel B and C show the results of false discoveries analysis
during high and low sentiment periods. The sentiment index data are available at Jeffrey Wurgler’s website. If the BW sentiment index
for the test month (t) is higher (lower) than the median number of all monthly BW sentiment index numbers, we define this month as
high (low) market sentiment month.
Panel A: Proportion of Unskilled and Skilled Funds
Zero Alpha Unskilled Skilled
Proportion 82.20% 10.27% 7.52%
Ave. # of funds 1261 158 115
Left Tail
Right Tail
Sig. level 0.05 0.10 0.15 0.20
0.20 0.15 0.10 0.05 Sig. level
Signif. % 5.08% 7.42% 9.06% 10.27%
7.52% 6.68% 5.58% 3.73% Signif. %
# of funds 78 114 139 158
115 102 86 57 # of funds
unlucky % 3.00% 3.05% 3.09% 3.13%
2.13% 2.24% 2.40% 2.25% lucky %
# of funds 46 47 47 48
33 34 37 35 # of funds
unskilled % 2.08% 4.37% 5.96% 7.14%
5.40% 4.44% 3.18% 1.48% skilled %
# of funds 32 67 91 110
83 68 49 23 # of funds
BvanB Alpha ($/month) -3.991 -4.079 -3.674 -3.692
3.434 3.636 3.643 3.683 BvanB Alpha ($/month)
BvanB Alpha Stdv. 3.049 3.465 2.652 3.122 2.626 2.765 2.508 2.428 BvanB Alpha Stdv.
Panel B: Proportion of Unskilled and Skilled Funds in High Market Sentiment
Zero Alpha Unskilled Skilled
Proportion 77.47% 11.13% 11.40%
Ave. # of funds 1219 175 179
Left Tail
Right Tail
Sig. level 0.05 0.10 0.15 0.20
0.20 0.15 0.10 0.05 Sig. level
Signif. % 5.54% 8.01% 9.80% 11.13% 11.40% 10.09% 8.47% 5.78% Signif. %
# of funds 87 126 154 175 179 159 133 91 # of funds
unlucky % 3.02% 3.00% 3.02% 3.07% 2.80% 2.90% 3.05% 3.06% lucky %
# of funds 47 47 48 48 44 46 48 48 # of funds
unskilled % 2.53% 5.01% 6.78% 8.06% 8.60% 7.19% 5.41% 2.71% skilled %
# of funds 40 79 107 127 135 113 85 43 # of funds
BvanB Alpha ($/month) -3.932 -3.874 -3.566 -3.903 3.598 3.847 3.986 4.172 BvanB Alpha ($/month)
BvanB Alpha Stdv. 2.916 2.650 2.323 3.612 2.203 2.58 2.37 2.291 BvanB Alpha Stdv.
Panel C: Proportion of Unskilled and Skilled Funds in Low Market Sentiment
Zero Alpha Unskilled Skilled
Proportion 86.87% 9.42% 3.71%
Ave. # of funds 1298 141 55
Left Tail
Right Tail
Sig. level 0.05 0.10 0.15 0.20
0.20 0.15 0.10 0.05 Sig. level
Signif. % 4.63% 6.83% 8.32% 9.42% 3.71% 3.31% 2.74% 1.72% Signif. %
# of funds 69 102 124 141 55 49 41 26 # of funds
unlucky % 2.98% 3.09% 3.17% 3.19% 1.47% 1.59% 1.75% 1.45% lucky %
# of funds 45 46 47 48 22 24 26 22 # of funds
unskilled % 1.64% 3.74% 5.16% 6.23% 2.24% 1.72% 0.98% 0.27% skilled %
# of funds 25 56 77 93 33 26 15 4 # of funds
BvanB Alpha ($/month) -4.052 -4.284 -3.782 -3.484 3.273 3.421 3.279 3.088 BvanB Alpha ($/month)
BvanB Alpha Stdv. 3.199 4.132 2.957 2.558 2.992 2.944 2.614 2.478 BvanB Alpha Stdv.
51
Conversely, there might be a downward bias if bad funds disappear in times of low sentiment. To
address this concern, we estimate the correlation between the number of funds
appearing/disappearing and investor sentiment (BW Index) for each month. Interestingly, we
find the number of funds appearing to be insignificantly correlated with investor sentiment index
(-0.01, P=0.880), implying that skilled fund managers are not attracted by high investor
sentiment. However, the number of funds disappearing is significantly positively correlated with
investor sentiment (0.22, P< .001), demonstrating that investor sentiment harms their
performance due to luck of skill.17
ROBUSTNESS CHECK
Sentiment beta analysis
Several studies have focused on the profitability of mutual funds’ sentiment timing
strategy. For example, Grinblatt, Titman, and Wermers (1995) and Carhart (1997) have showed
that mutual funds tend to follow momentum. Recently, Massa and Yadav (2015) reported that
mutual funds employ portfolio strategies based on market sentiment. Specifically, they find that
low sentiment beta funds outperform the high sentiment beta funds, even after controlling for
standard risk factors and fund characteristics. This result is attributed to the sentiment-contrarian
strategy rather than the sentiment-momentum strategy, which, in turn, attracts significant
investor flows in comparison to the sentiment-catering strategy. In a more recent study, Chen,
Han, and Pan (2016) examine whether exposure to sentiment risk can explain the cross-sectional
variation in hedge fund returns and find that funds with a sentiment beta in the top decile
subsequently outperform those in the bottom decile by 0.67% per month on a risk-adjusted basis.
17 These results are available upon request.
52
Therefore, they argue that some hedge funds can time sentiment and contribute to fund
performance by increasing their exposure to a sentiment factor when the factor premium is high.
In this section, we investigate the impact of fund sentiment timing strategy on fund
performance. As discussed earlier, in this study, we view investor sentiment as an economic
condition, rather than as a risk factor to be exploited by its timing and argue that skilled
managers invest in assets based on their superior analytic ability and private information about
an asset’s true value, rather than timing sentiment. This leads us to expect that the fund sentiment
timing strategy is more likely to be associated with low rather than high skilled fund managers.
To examine whether high (low) skilled fund managers are less (more) likely to time investor
sentiment, we perform Fama–MacBeth regressions of high- and low-skilled fund portfolio
returns and alphas on sentiment beta, while controlling for fund-level characteristics. The fund
alpha is calculated as the intercept of the regressing portfolio excess returns on the FFC model
for our entire 300-months sample period. Following Massa and Yadav (2015), we calculate each
portfolio’s sentiment beta by regression using the 24 months of data proceeding the current
month:
(12)
where Rp,t is the portfolio p’s return in month t; Rf,t is the risk-free rate in month t; RM-Rf is the
market excess return in month i, SMB is the return difference of small and big size stocks in
month i, HML is the return difference of high and low book-to-market ratio stocks in month i,
MOM is the return difference of winner and loser stocks in month i, and Sentiment is the BW
index for the same month. β5 is the sentiment beta estimated by running regression (12) with a
24-month moving window. Then, we run the following cross-sectional regression of portfolio
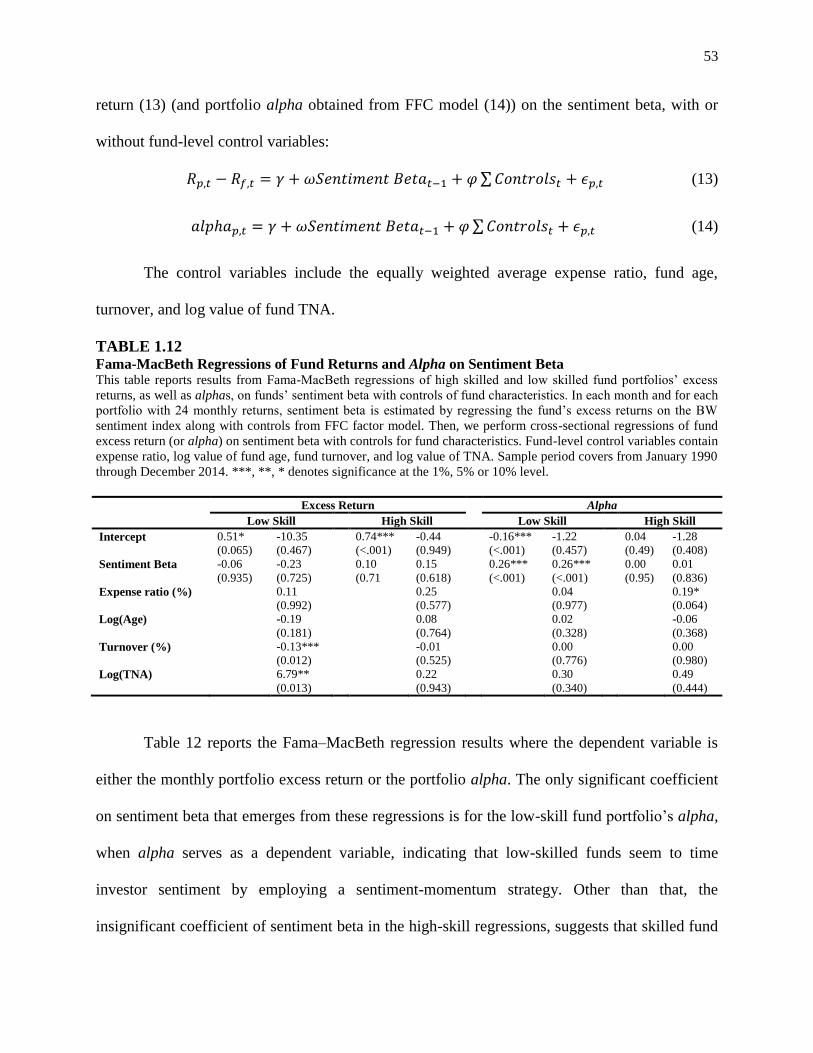
53
return (13) (and portfolio alpha obtained from FFC model (14)) on the sentiment beta, with or
without fund-level control variables:
∑ (13)
∑ (14)
The control variables include the equally weighted average expense ratio, fund age,
turnover, and log value of fund TNA.
TABLE 1.12 Fama-MacBeth Regressions of Fund Returns and Alpha on Sentiment Beta This table reports results from Fama-MacBeth regressions of high skilled and low skilled fund portfolios’ excess
returns, as well as alphas, on funds’ sentiment beta with controls of fund characteristics. In each month and for each
portfolio with 24 monthly returns, sentiment beta is estimated by regressing the fund’s excess returns on the BW
sentiment index along with controls from FFC factor model. Then, we perform cross-sectional regressions of fund
excess return (or alpha) on sentiment beta with controls for fund characteristics. Fund-level control variables contain
expense ratio, log value of fund age, fund turnover, and log value of TNA. Sample period covers from January 1990
through December 2014. ***, **, * denotes significance at the 1%, 5% or 10% level.
Excess Return
Alpha
Low Skill
High Skill
Low Skill
High Skill
Intercept 0.51* -10.35
0.74*** -0.44
-0.16*** -1.22
0.04 -1.28
(0.065) (0.467)
(<.001) (0.949)
(<.001) (0.457)
(0.49) (0.408)
Sentiment Beta -0.06 -0.23
0.10 0.15
0.26*** 0.26***
0.00 0.01
(0.935) (0.725)
(0.71 (0.618)
(<.001) (<.001)
(0.95) (0.836)
Expense ratio (%)
0.11
0.25
0.04
0.19*
(0.992)
(0.577)
(0.977)
(0.064)
Log(Age)
-0.19
0.08
0.02
-0.06
(0.181)
(0.764)
(0.328)
(0.368)
Turnover (%)
-0.13***
-0.01
0.00
0.00
(0.012)
(0.525)
(0.776)
(0.980)
Log(TNA)
6.79**
0.22
0.30
0.49
(0.013)
(0.943)
(0.340)
(0.444)
Table 12 reports the Fama–MacBeth regression results where the dependent variable is
either the monthly portfolio excess return or the portfolio alpha. The only significant coefficient
on sentiment beta that emerges from these regressions is for the low-skill fund portfolio’s alpha,
when alpha serves as a dependent variable, indicating that low-skilled funds seem to time
investor sentiment by employing a sentiment-momentum strategy. Other than that, the
insignificant coefficient of sentiment beta in the high-skill regressions, suggests that skilled fund
54
managers do not appear to time investor sentiment. These results support the view that skilled
fund managers do not time investor sentiment as a value-creating strategy because, as argued by
Shleifer and Vishny (1997), movements in investor sentiment are in part unpredictable.
Therefore, fund managers betting against mispricing during high sentiment periods run a high
risk, at least in the short run, that investor sentiment will become more extreme and prices will
move even further away from fundamental values. Skilled fund managers focus more on stock
selection during high sentiment periods than on timing the investor sentiment movements.
Consistent with our previous results, these findings imply that skilled fund managers’ superior
performance relative to their low-skilled peers is mainly due to their ability to produce more
(private) information about the true value of financial assets under management during high
sentiment periods when asset prices are noisier than in low sentiment periods when financial
markets are not crowded by unsophisticated (noisy) investors.
Fund Capital Flow Analysis
The portfolio sorting and multivariate analysis thus far, shows that skilled fund managers
have a significant and persistent past performance (alphat-1), and this should attract capital
inflows from the financial market as investors tend to make investment decisions based on the
past performance of each mutual fund. Therefore, due to limited optimal investment
opportunities in the market skilled fund managers under the pressure to invest the extra capital
inflows will be forced to make investment decisions which consequently may weaken fund
performance (fund alpha), unless they are endowed with high selectivity skills. Additionally,
studies have shown that sentiment is correlated with fund flows (Ben-Raphel, Kandel, and Wohl,
2012). In this section, we address this issue by investigating whether the superior performance of
skilled fund managers remains pronounced under the influence of additional capital inflows.

55
To inspect the influence of capital inflows, we first estimate the capital flow of each fund
as follows:
(15)
where TNAf,t is the total net assets of fund f in month t, and Rf,t is the fund return in month t. To
test whether and how fund performance is affected by capital flows, we include net capital flows
2 months ago (Fowt-2) and 1 month ago (Flowt-1), and their interaction variables with fund
selectivity and sentiment into our main multivariate regression, as presented in Eq. (9).
Consistent with our prediction, the results in Table 13 column 1 show a negative and
significant correlation between the previous month capital inflows (Flowt-1) with fund alpha,
which reveals that extra capital inflows create more pressure on fund managers to invest
resulting in lower fund alpha. The insignificant coefficients between the interaction
Flow*Sentiment in t-1 and t-2 and fund alpha (P = 0.97 and P = 0.62 for capital inflows,
respectively), as shown in column 2, indicate that the negative relationship between the previous
months’ capital inflows and fund performance is not sentiment-related. The coefficients between
the interaction Flow*Selectivity in t-1 and t-2 and fund alpha, as reported in column 3, are
positive and significant (P < 0.001), suggesting that managers with high selectivity skill direct
extra capital inflows in better investment opportunities delivering high alpha than their unskilled
fund counterparts. Last, the positive and significant relationship between the interaction
Selectivity*Sentiment and fund alpha (0.166, P = 0.04), in column 4, shows that even after
controlling for the negative effect of capital inflows from previous months, high selectivity
managers still possess the ability to make significantly superior investments during high
sentiment periods to the benefit fund investors.

56
TABLE 1.13 The Effect of Fund Flow and Investor Sentiment on Fund Performance This table reports the regression results of following model:
( ) ( )
( ) ( ) ∑
The dependent variable is fund alpha. The main independent variables are fund selectivity (1-R2t-1), market
sentiment (BW sentiment index, available at Jeffrey Wurgler’s website), selectivity*Sentiment, which is the product
of selectivity and market sentiment, flowi,p+q, which is the net capital flow of fund i in month t+q (q equals -2, -1);
and the product of fund flow with sentiment and the product of fund flow with selectivity. Control variables contain
Alphat-1, which is the intercept from the 24 month estimation period (t-24 to t-1), expense ratio, log value of fund
age, fund turnover, log value of fund total net assets (TNA), and squared log value of fund TNA. Sample period
covers from January 1990 through December 2014. The P-value and adjusted R2 for each regression are also
presented. ***, **, * denotes significance at the 1%, 5% or 10% level.
Fund Alpha
(1) (2) (3) (4)
Intercept -1.07*** -0.97*** -1.25*** -1.04***
(<.001) (<.001) (<.001) (<.001)
Selectivity
0.42*** 0.36***
(<.001) (<.001)
Sentiment
-0.09***
-0.12***
(<.001)
(<.001)
Selectivity*Sentiment
0.17**
(0.040)
Flowt-1 -6.40E-05** -3.71E-05 -6.71E-04*** -3.33E-05
(0.040) (0.270) (<.001) (0.290)
Flowt-2 2.95E-05 6.25E-05* -2.69E-04*** 5.97E-05*
(0.350) (0.070) (<.001) (0.060)
Flowt-1*Selectivity
3.97E-03***
(<.001)
Flowt-2*Selectivity
2.30E-03***
(<.001)
Flowt-1*Sentiment 1.69E-06
(0.970)
Flowt-2*Sentiment -2.15E-05
(0.620)
Alphat-1 0.32*** 0.34*** 0.33*** 0.33***
(<.001) (<.001) (<.001) (<.001)
Turnover 0.00*** 0.00*** -4.84E-04*** -4.68E-04***
(<.001) (<.001) (<.001) (<.001)
Expense ratio -0.04*** -0.04*** -0.05*** -0.05***
(<.001) (0.010) (<.001) (<.001)
Log(TNA) 0.63*** 0.60*** 0.71*** 0.62***
(<.001) (<.001) (<.001) (<.001)
[Log(TNA)]2 -0.07*** -0.06*** -0.08*** -0.07***
(<.001) (<.001) (<.001) (<.001)
Log(age) -0.09*** -0.10*** -0.08*** -0.10***
(<.001) (<.001) (<.001) (<.001)
Adj. R2 0.009 0.009 0.012 0.010

57
Volatility Anomaly Analysis
There is also evidence in the literature suggesting that the volatility anomaly, either
directly or indirectly, can lead to mismeasurement of fund manager skill (Jordan and Riley,
2014; Novy-Marx, 2014; and Fama and French, 2015). Volatility anomaly basically means that
the low volatility stock portfolio outperforms the high volatility stock portfolio significantly, and
Jordan and Riley (2014) show that it has a large impact on mutual fund returns, which could
create a significant bias when measuring managers' skills. Even though the volatility anomaly
has been questioned by other studies, we assess the sensitivity of our results by controlling for
the effect of the volatility anomaly.18
In accord with section IV.A, we sort all the funds in each month into 25 (5x5) portfolios
with a different selectivity (1-R2
t-1) and past fund performance, alphat-1. Next, we examine
whether fund selectivity skill varies with time and particularly whether high selectivity is
associated with a higher fund performance during high sentiment states. As before, we use the
BW sentiment index to measure the investor sentiment and if the month t’s BW sentiment index
is higher (lower) than the median number of all the monthly BW sentiment index numbers, we
define month t as a high (low) investor sentiment month. Then, for each month, we calculate the
monthly average excess raw returns of funds included in each portfolio and regress the returns on
the Fama–French five-factor plus momentum factor model, which contain the profitability factor
and investment factor that can explain the volatility anomaly (Jordan and Riley, 2015), to obtain
the abnormal risk-adjusted excess return, i.e., portfolio fund alpha. Table 14 presents the
annualized fund alpha and P-value for each portfolio in high (Panel A) and low (Panel B)
sentiment periods, respectively.
18 For example, Moreira and Muir (2016) showed that a volatility-managed portfolio, which decreases portfolio volatility when
the expected market risk is high and increases the portfolio volatility when expected market risk is low, yields high alphas and
increases the portfolio Sharpe ratio significantly.

58
TABLE 1.14
The Effect of Volatility Anomaly and Investor Sentiment on Fund Performance The table presents the portfolio alpha, annualized, using monthly returns, in high and low market sentiment periods.
If the BW sentiment index for the test month (t) is higher (lower) than the median number of all monthly BW
sentiment index numbers, we define this month as high (low) market sentiment month. Portfolios are formed by
sorting all funds in each month into quintiles by lagged R2 and then by fund alphat-1. Both are obtained from the 24-
month estimation period (t-24 to t-1) by regressing each fund’s monthly excess returns (over the T-bill rate) on the
factors from FFC model. Then, for the following month (t), we calculate the average monthly excess returns for each
fund portfolio. The process repeats by moving the estimation and test period one month at a time. Last we regress
the test period average portfolio returns on Fama-French 5 factor plus momentum model. For each portfolio cell, we
present portfolio alpha, which is the intercept from the above regression, and the P-value. The sample period of the
test months is from January 1990 to December 2014 (300 months). Panel A shows the results of high market
sentiment group and Panel B shows the results of low market sentiment group. For each portfolio, we present the
portfolio alpha, annualized, using monthly returns and the P-value. ***, **, * denotes significance at the 1%, 5% or
10% level.
Panel A: FF 5 factor plus momentum model in high market sentiment
Fund selectivity (1-R2
t-1)
Alphat-1 Low 4 3 2 High All High-Low
Low -2.28*** -3.59*** -3.50*** -3.94*** -1.66 -3.00*** 0.32
(0.005) (0.002) (0.008) (0.005) (0.363) (0.003) (0.742)
2 -2.67*** -1.57* -3.41*** -2.31** -0.77 -2.14*** 0.97
(<.001) (0.073) (<.001) (0.047) (0.593) (0.010) (0.149)
3 -1.59*** -1.77** -2.90*** -1.74* -0.73 -1.74** 0.33
(0.009) (0.019) (0.002) (0.099) (0.556) (0.012) (0.621)
4 -0.84 -0.82 -0.61 -0.20 -0.06 -0.50 0.38
(0.265) (0.340) (0.491) (0.870) (0.967) (0.506) (0.628)
High -0.41 0.59 1.70 4.54*** 6.66*** 2.63** 3.56***
(0.746) (0.707) (0.159) (0.003) (0.002) (0.013) (0.005)
All -1.56** -1.44* -1.75** -0.75 0.68 -0.96 1.10*
(0.013) (0.059) (0.038) (0.469) (0.563) (0.178) (0.087)
High-Low 0.89 1.97** 2.62*** 4.06*** 4.05*** 2.72***
(0.154) (0.018) (<.001) (<.001) (0.002) (<.001)
Panel B: FF 5 factor plus momentum model in low market sentiment
Fund selectivity (1-R2
t-1)
Alphat-1 Low 4 3 2 High All High-Low
Low -1.24** -0.05 -0.85 -1.09 -2.26 -1.09 -0.60
(0.027) (0.953) (0.317) (0.274) (0.271) (0.173) (0.540)
2 -0.56 -0.51 -0.04 -0.01 0.71 -0.09 0.57
(0.244) (0.311) (0.943) (0.990) (0.566) (0.874) (0.309)
3 -0.20 -0.24 -0.50 -0.30 0.96 -0.05 0.44
(0.697) (0.650) (0.386) (0.680) (0.395) (0.916) (0.472)
4 -1.05* -1.08 0.74 -0.63 2.30* 0.06 1.63**
(0.071) (0.374) (0.257) (0.426) (0.059) (0.906) (0.020)
High -0.34 0.75 0.92 1.96* 1.93 1.04 1.11
(0.629) (0.341) (0.277) (0.081) (0.247) (0.142) (0.215)
All -0.68* -0.22 0.06 -0.02 0.75 -0.02 0.64
(0.084) (0.648) (0.891) (0.969) (0.426) (0.961) (0.167)
High-Low 0.63 0.62 1.06* 1.75** 2.27* 1.26**
(0.137) (0.187) (0.055) (0.016) (0.088) (0.016)

59
These results continue to show that skilled fund managers’ performance is superior
during high investor sentiment periods indicating that they are not sensitive volatility anomaly.
Consistent with the pattern of our main results, fund portfolio performance (alpha), as shown in
row “All,” decreases from the high selectivity (high 1-R2
t-1) portfolio to the low selectivity (low
1-R2
t-1) portfolio in both high (Panel A) and low sentiment (Panel B) periods. Panel A shows that
when investor sentiment level is high, the highest past alpha quintile managers with the highest
skill and second-highest skill produce 6.66% (P = 0.002) and 4.54% (P = 0.003) higher excess
returns than the market benchmark, respectively. The hypothetical strategy of a long position in
the high selectivity fund portfolio and a short position in the low selectivity fund portfolio,
rightmost “High-Low,” yields 1.10% (P = 0.087) extra return than the market benchmark for the
entire sample. However, during low sentiment periods, as shown in Panel B, the fund portfolio
with the highest selectivity and the best past performance cannot beat the market benchmark
significantly (1.93%, P = 0.247). In addition, the hypothetical strategy fails to significantly
outperform the market on average (0.64%, P = 0.167).19
Taken together, these results provide
supplemental evidence indicating that skilled managers produce higher fund alphas during high
sentiment periods, and this relationship is not biased by the volatility anomaly.
Alternative Sentiment Measures
We also ran robustness tests using two alternative sentiment measures: credit market
sentiment and the Financial and Economic Attitudes Revealed by Search (FEARS) sentiment
index. Following Lopez-Salido, Stein, and Zakrajsek (2016), we estimated the credit investor
sentiment using the two-step econometric methodology. First, we calculate the spread between
yields on seasoned long-term Baa-rated industrial bonds and yields on 10-year Treasury
19
The same analysis is re-examined using the UM index and the results are consistent with the results using the BW index.

60
securities for each month. Next, we regress the change in the spread based on the past 24
months’ spreads, and the expected spread change is used as the credit investor sentiment index.
The 24-month estimation period moves one month each time. The FEARS index, as introduced
by Da et al. (2015), is an index based on the internet search behavior of households. To use this
index in our analysis, we converted the data into monthly observations by taking the average of
the daily data in order to match our data. Unreported results based on these two sentiment
measures are qualitatively consistent with the pattern of our previous findings.20
CONCLUSION
In this paper, unlike most of the previous literature that has focused on the question of
whether fund managers improve fund performance, we examine whether skilled mutual fund
managers deliver greater value (alpha) during high sentiment periods when security markets are
crowded by noise traders (signals). Our results can be construed as providing general support for
the hypothesis that skilled fund managers generate persistent excess risk-adjusted returns
especially during high sentiment periods when asset prices are noisier and information is costlier.
Using a large sample of U.S. domestic active-managed equity mutual funds, we
empirically examine this conjecture and find that managers endowed with high fund
management skills realize superior fund performance during high investor sentiment periods.
Specifically, our result show that fund managers with the highest skill create $7.71 million of
added value during high sentiment periods which exceeds the average realized fund gains ($3.74
million), while they incur a small value loss of $0.18 million in low sentiment periods. However,
fund managers with the lowest skill experience a values loss of $5.64 million during high
20
These results are available upon request.

61
sentiment periods which is far lower than the average realized fund gains ($3.74 million), while
they incur a substantial value loss of $30.32 million in low sentiment periods.
We also find that only a small subset (around 2%, under the 5% significance level) of all
fund managers has superior management skills that generate persistent excess risk-adjusted
returns. Our findings are robust to sentiment beta effect, stock market dispersion, state of
macroeconomic environment, alternative sentiment measures (i.e., credit market sentiment and
the FEARS sentiment index) and the effect of the volatility anomaly. Overall, our findings
conclusively suggest that skilled fund managers create more value during high than low
sentiment periods when noise trading is more pronounced.

62
REFERENCES
Amihud, Y.; and R. Goyenko. "Mutual fund's R2 as predictor of performance." Review of
Financial Studies 26.3 (2013): 667-694.
Amromin, G.; and S. A. Sharpe. "Expectations of risk and return among household investors:
Are their Sharpe ratios countercyclical?."Available at SSRN 1327134 (2009).
Antoniou, C.; J. A. Doukas; and A. Subrahmanyam. "Cognitive dissonance, sentiment, and
momentum." Journal of Financial and Quantitative Analysis 48.01 (2013): 245-275.
Antoniou, C.; J. A. Doukas; and A. Subrahmanyam. "Investor sentiment, beta, and the cost of
equity capital." Management Science 62.2 (2015): 347-367.
Avramov, D.; and R. Wermers. "Investing in mutual funds when returns are predictable."
Journal of Financial Economics 81.2 (2006): 339-377.
Baker, M.; and J. Wurgler. "Investor sentiment and the cross‐section of stock returns." The
Journal of Finance 61.4 (2006): 1645-1680.
Baks, K.; A. Metrick; and J. Wachter. "Should investors avoid all actively managed mutual
funds? A study in Bayesian performance evaluation." The Journal of Finance 56.1 (2001): 45-
85.
Barber, B. M.; and T. Odean. "Boys will be boys: Gender, overconfidence, and common stock
investment." Quarterly journal of Economics (2001): 261-292.
Barberis, N.; and R. Thaler. "A survey of behavioral finance."Handbook of the Economics of
Finance 1 (2003): 1053-1128.
Barras, L.; O. Scaillet; and R. Wermers. "False discoveries in mutual fund performance:
Measuring luck in estimated alphas." The Journal of Finance 65.1 (2010): 179-216.
Ben-Rephael, A.; S. Kandel; and A. Wohl. "Measuring investor sentiment with mutual fund
flows." Journal of Financial Economics 104.2 (2012): 363-382.
Berk, J. B.; and R. C. Green. Mutual fund flows and performance in rational markets. No.
w9275. National Bureau of Economic Research, 2002.
Berk, J. B.; and J. H. Van Binsbergen. "Measuring skill in the mutual fund industry." Journal of
Financial Economics 118.1 (2015): 1-20.
Białkowski, J.; A. Etebari; and T. P. Wisniewski. "Fast profits: Investor sentiment and stock
returns during Ramadan." Journal of Banking & Finance 36.3 (2012): 835-845.
Black, F. "Noise." The journal of finance 41.3 (1986): 528-543.

63
DeBondt, W. F.; and R. Thaler. "Does the stock market overreact?."The Journal of finance 40.3
(1985): 793-805.
Brands, S.; S. J. Brown; and D. R. Gallagher. "Portfolio concentration and investment manager
performance." International Review of Finance 5.3‐4 (2005): 149-174.
Carhart, M. M. "On persistence in mutual fund performance." The Journal of finance 52.1
(1997): 57-82.
Chen, Y.; B. Han; and J. Pan. "Sentiment Risk, Sentiment Timing, and Hedge Fund
Returns." Sentiment Timing, and Hedge Fund Returns (January 12, 2016) (2016).
Cohen, L.; A. Frazzini; and C. Malloy. "The small world of investing: Board connections and
mutual fund returns." (2007). National Bureau of Economic Research Cambridge, Mass.,
USA.
Cremers, K. M.; and A. Petajisto. "How active is your fund manager? A new measure that
predicts performance." Review of Financial Studies 22.9 (2009): 3329-3365.
Cremers, M.; M. A. Ferreira; P. P. Matos; and L. T. Starks. "Indexing and active fund
management: International evidence." Journal of Financial Economics 120.3 (2016): 539-
560.
Cullen, G.; D. Gasbarro; K. S. Le; and G. S. Monroe. "Does Selectivity in Mutual Fund Trades
Exploit Sentiment Timing?." (2013).
Da, Z., J. Engelberg; and P. Gao. "The sum of all FEARS investor sentiment and asset
prices." Review of Financial Studies 28.1 (2015): 1-32.
Daniel, K.; M. Grinblatt; S. Titman; and R. Wermers. "Measuring mutual fund performance with
characteristic‐based benchmarks." The Journal of finance 52.3 (1997): 1035-1058.
Daniel, K.; D. Hirshleifer; and A. Subrahmanyam. "Investor psychology and security market
under‐and overreactions." the Journal of Finance 53.6 (1998): 1839-1885.
Dowling, M.; and B. M. Lucey. "Weather, biorhythms, beliefs and stock returns—some
preliminary Irish evidence." International Review of Financial Analysis 14.3 (2005): 337-355.
Edmans, A.; D. Garcia; and Ø. Norli. "Sports sentiment and stock returns." The Journal of
Finance 62.4 (2007): 1967-1998.
Elton, E. J.; M. J. Gruber; and C. R. Blake. "An examination of mutual fund timing ability using
monthly holdings data." Review of Finance16.3 (2012): 619-645.

64
Fama, E. F.; and K. R. French. "Common risk factors in the returns on stocks and
bonds." Journal of financial economics 33.1 (1993): 3-56.
Fama, E. F.; and K. R. French. "A five-factor asset pricing model, Fama-Miller Working Paper."
(2014).
Glode, V. "Why mutual funds “underperform”." Journal of Financial Economics 99.3 (2011):
546-559.
Grinblatt, M.; and M. Keloharju. "How distance, language, and culture influence stockholdings
and trades." The Journal of Finance 56.3 (2001): 1053-1073.
Grinblatt, M.; S. Titman; and R. Wermers. "Momentum investment strategies, portfolio
performance, and herding: A study of mutual fund behavior." The American economic
review (1995): 1088-1105.
Gruber, M. J. "Another puzzle: The growth in actively managed mutual funds." The journal of
finance 51.3 (1996): 783-810.
Hirshleifer, D.; and T. Shumway. "Good day sunshine: Stock returns and the weather." The
Journal of Finance 58.3 (2003): 1009-1032.
Hong, H.; and J. C. Stein. "A unified theory of underreaction, momentum trading, and
overreaction in asset markets." The Journal of Finance 54.6 (1999): 2143-2184.
Jiang, G. J.; T. Yao; and T. Yu. "Do mutual funds time the market? Evidence from portfolio
holdings." Journal of Financial Economics86.3 (2007): 724-758.
Jordan, B. D.; and T. B. Riley. "Volatility and mutual fund manager skill." Journal of Financial
Economics 118.2 (2015): 289-298.
Kacperczyk, M.; S. V. Nieuwerburgh; and L. Veldkamp. "Time‐Varying Fund Manager
Skill." The Journal of Finance 69.4 (2014): 1455-1484.
Kacperczyk, M.; and A. Seru. "Fund manager use of public information: New evidence on
managerial skills." The Journal of Finance 62.2 (2007): 485-528.
Kacperczyk, M.; C. Sialm; and L. Zheng. "On the industry concentration of actively managed
equity mutual funds." The Journal of Finance 60.4 (2005): 1983-2011.
Kacperczyk, M.; S. V. Nieuwerburgh; and L. Veldkamp. “Rational attention allocation over the
business cycle.” No. w15450. National Bureau of Economic Research, 2009.
Kacperczyk, M.; S. V. Nieuwerburgh; and L. Veldkamp. "A rational theory of mutual funds'
attention allocation." Econometrica 84.2 (2016): 571-626.
65
Kaplanski, G.; and H. Levy. "Sentiment and stock prices: The case of aviation
disasters." Journal of Financial Economics 95.2 (2010): 174-201.
Kosowski, R. "Do mutual funds perform when it matters most to investors? US mutual fund
performance and risk in recessions and expansions." The Quarterly Journal of Finance 1.03
(2011): 607-664.
Lamont, O. A.; and R. H. Thaler. "Anomalies: The law of one price in financial markets." The
Journal of Economic Perspectives 17.4 (2003): 191-202.
López-Salido, D.; J. C. Stein; and E. Zakrajšek. “Credit-market sentiment and the business
cycle.” No. w21879. National Bureau of Economic Research, 2016.
Malkiel, B. G. "Returns from investing in equity mutual funds 1971 to 1991." The Journal of
finance 50.2 (1995): 549-572.
Massa, M.; and V. Yadav. "Investor Sentiment and Mutual Fund Strategies." Journal of
Financial and Quantitative Analysis 50.04 (2015): 699-727.
Miller, E. M. 1977. Risk, Uncertainty, and Divergence of Opinion. Journal of Finance 32:1151–
1168.
Moreira, A.; and T. Muir. “Volatility managed portfolios.” No. w22208. National Bureau of
Economic Research, 2016.
Novy-Marx, R. Understanding defensive equity. No. w20591. National Bureau of Economic
Research, 2014.
Shiller, R. J.; and J. Pound. "Survey evidence on diffusion of interest and information among
investors." Journal of Economic Behavior & Organization 12.1 (1989): 47-66.
Shleifer, A.; and R. W. Vishny. "The limits of arbitrage." The Journal of Finance 52.1 (1997):
35-55.
Stambaugh, R. F.; J. Yu; and Y. Yuan. "The short of it: Investor sentiment and
anomalies." Journal of Financial Economics 104.2 (2012): 288-302.
Von Reibnitz, A. H. "When Opportunity Knocks: Cross-Sectional Return Dispersion and Active
Fund Performance." (2015). Paper presented at the 26th Australasian Finance and Banking
Conference.
Wermers, R. "Mutual fund performance: An empirical decomposition into stock‐picking talent,
style, transactions costs, and expenses." The Journal of Finance 55.4 (2000): 1655-1703.

66
Zheng, L. "Is money smart? A study of mutual fund investors' fund selection ability." The
Journal of Finance 54.3 (1999): 901-933.
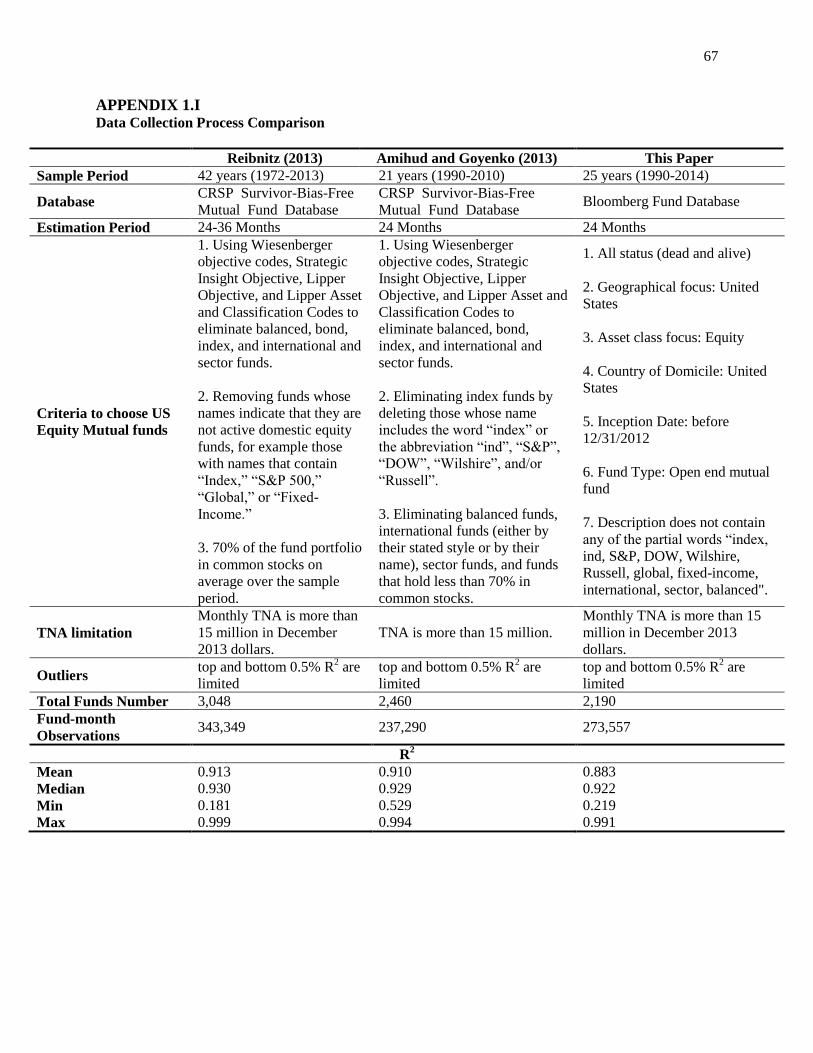
67
APPENDIX 1.I Data Collection Process Comparison
Reibnitz (2013) Amihud and Goyenko (2013) This Paper
Sample Period 42 years (1972-2013) 21 years (1990-2010) 25 years (1990-2014)
Database CRSP Survivor-Bias-Free
Mutual Fund Database
CRSP Survivor-Bias-Free
Mutual Fund Database Bloomberg Fund Database
Estimation Period 24-36 Months 24 Months 24 Months
Criteria to choose US
Equity Mutual funds
1. Using Wiesenberger
objective codes, Strategic
Insight Objective, Lipper
Objective, and Lipper Asset
and Classification Codes to
eliminate balanced, bond,
index, and international and
sector funds.
2. Removing funds whose
names indicate that they are
not active domestic equity
funds, for example those
with names that contain
“Index,” “S&P 500,”
“Global,” or “Fixed-
Income.”
3. 70% of the fund portfolio
in common stocks on
average over the sample
period.
1. Using Wiesenberger
objective codes, Strategic
Insight Objective, Lipper
Objective, and Lipper Asset and
Classification Codes to
eliminate balanced, bond,
index, and international and
sector funds.
2. Eliminating index funds by
deleting those whose name
includes the word “index” or
the abbreviation “ind”, “S&P”,
“DOW”, “Wilshire”, and/or
“Russell”.
3. Eliminating balanced funds,
international funds (either by
their stated style or by their
name), sector funds, and funds
that hold less than 70% in
common stocks.
1. All status (dead and alive)
2. Geographical focus: United
States
3. Asset class focus: Equity
4. Country of Domicile: United
States
5. Inception Date: before
12/31/2012
6. Fund Type: Open end mutual
fund
7. Description does not contain
any of the partial words “index,
ind, S&P, DOW, Wilshire,
Russell, global, fixed-income,
international, sector, balanced".
TNA limitation
Monthly TNA is more than
15 million in December
2013 dollars.
TNA is more than 15 million.
Monthly TNA is more than 15
million in December 2013
dollars.
Outliers top and bottom 0.5% R
2 are
limited
top and bottom 0.5% R2 are
limited
top and bottom 0.5% R2 are
limited
Total Funds Number 3,048 2,460 2,190
Fund-month
Observations 343,349 237,290 273,557
R2
Mean 0.913 0.910 0.883
Median 0.930 0.929 0.922
Min 0.181 0.529 0.219
Max 0.999 0.994 0.991
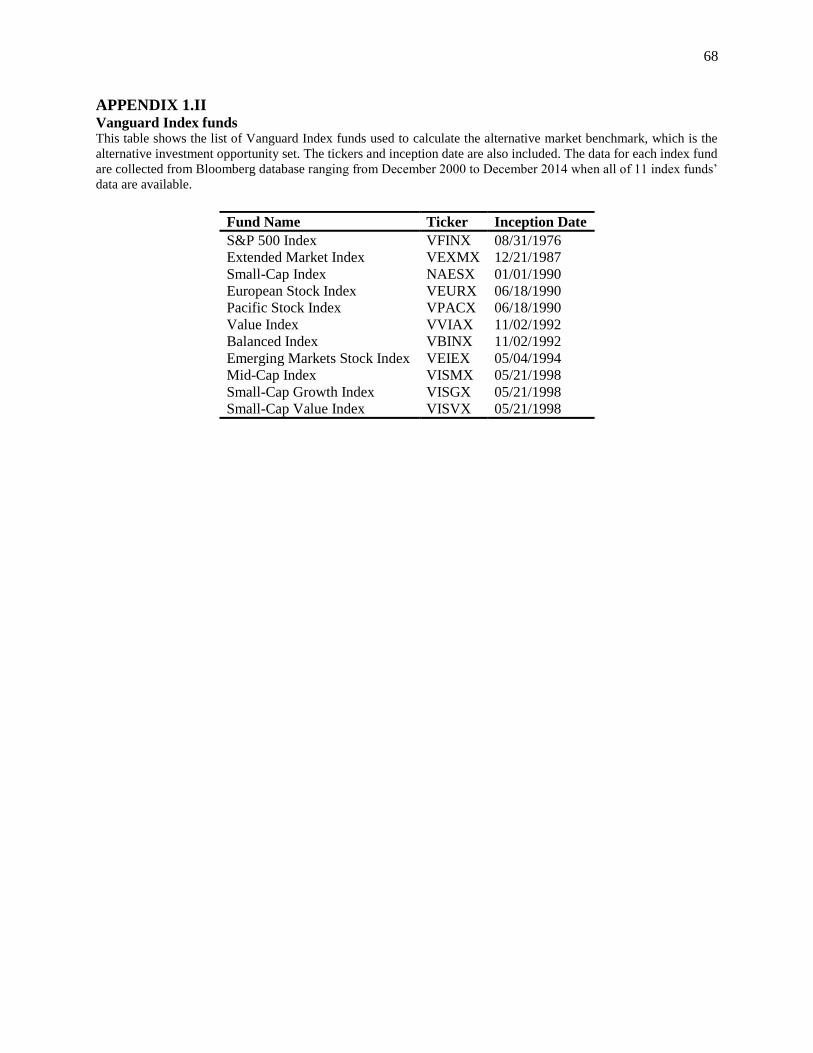
68
APPENDIX 1.II Vanguard Index funds This table shows the list of Vanguard Index funds used to calculate the alternative market benchmark, which is the
alternative investment opportunity set. The tickers and inception date are also included. The data for each index fund
are collected from Bloomberg database ranging from December 2000 to December 2014 when all of 11 index funds’
data are available.
Fund Name Ticker Inception Date
S&P 500 Index VFINX 08/31/1976
Extended Market Index VEXMX 12/21/1987
Small-Cap Index NAESX 01/01/1990
European Stock Index VEURX 06/18/1990
Pacific Stock Index VPACX 06/18/1990
Value Index VVIAX 11/02/1992
Balanced Index VBINX 11/02/1992
Emerging Markets Stock Index VEIEX 05/04/1994
Mid-Cap Index VISMX 05/21/1998
Small-Cap Growth Index VISGX 05/21/1998
Small-Cap Value Index VISVX 05/21/1998

69
APPENDIX 1.III Portfolio Fund Alpha, Based on Sorting on Lagged R
2 and Fund Alpha, in High and Low Market
Sentiment Periods Using UM Index The table presents the portfolio alpha, annualized, using monthly returns, in high and low market sentiment periods
based on the University of Michigan consumer sentiment index (UM sentiment index). If the UM sentiment index
for the test month (t) is higher (lower) than the median number of all monthly UM sentiment index numbers, we
define this month as high (low) market sentiment month. Portfolios are formed by sorting all funds in each month
into quintiles by lagged R2 and then by fund alpha. Both are obtained for the 24-month estimation period (t-24 to t-
1) by regressing each fund’s monthly excess returns (over the T-bill rate) on the factors from FFC model. Then, for
the following month (t), we calculate the average monthly excess returns for each fund portfolio. The process
repeats by moving the estimation and test period one month at a time. Last we regress the test period average
portfolio returns on the FFC model. For each portfolio cell, we present portfolio alpha, which is the intercept from
the above regression, and the P-value. The sample period of the test months is from January 1990 to December 2014
(300 months). Panel A shows the results of high market sentiment group and Panel B shows the results of low
market sentiment group. For each portfolio, we present the portfolio alpha, annualized, using monthly returns and
the P-value. ***, **, * denotes significance at the 1%, 5% or 10% level.
Panel A: High market sentiment periods
Fund selectivity (1-R2
t-1)
Alphat-1 Low 4 3 2 High All High-Low
Low -2.05*** -4.14*** -2.54* -2.85* -2.69 -2.86*** -0.38
(0.010) (<.001) (0.052) (0.053) (0.151) (0.005) (0.699)
2 -2.01*** -0.67 -1.38 -0.67 0.69 -0.81 1.31**
(0.003) (0.436) (0.151) (0.564) (0.585) (0.291) (0.041)
3 -0.45 -1.29* -1.67* -0.60 0.93 -0.62 0.47
(0.478) (0.060) (0.058) (0.526) (0.383) (0.307) (0.462)
4 -0.06 -1.48 -0.31 0.46 3.35*** 0.40 1.70**
(0.943) (0.280) (0.708) (0.712) (0.008) (0.583) (0.022)
High -1.24 -1.15 0.22 4.14*** 5.80*** 1.56 3.48***
(0.340) (0.476) (0.866) (0.009) (0.004) (0.162) (0.004)
All -1.16* -1.76** -1.15 0.07 1.58 -0.49 1.30**
(0.060) (0.025) (0.136) (0.943) (0.130) (0.451) (0.030)
High-Low 0.47 1.51* 1.46* 3.42*** 4.27*** 2.23***
(0.469) (0.072) (0.077) (0.001) (0.001) (0.002)
Panel B: Low market sentiment periods
Fund selectivity (1-R2
t-1)
Alphat-1 Low 4 3 2 High All High-Low
Low -1.24** -0.53 -1.92** -2.12** -2.12 -1.58** -0.46
(0.023) (0.457) (0.015) (0.013) (0.262) (0.028) (0.614)
2 -0.85* -1.46*** -1.28** -1.03 -0.77 -1.08* 0.02
(0.055) (0.004) (0.032) (0.219) (0.548) (0.070) (0.967)
3 -1.16*** -0.25 -1.35** -1.12 -0.27 -0.82 0.41
(0.009) (0.634) (0.035) (0.154) (0.825) (0.117) (0.498)
4 -2.03*** -1.02* -0.25 -1.45* -1.20 -1.19** 0.36
(<.001) (0.081) (0.707) (0.062) (0.355) (0.025) (0.602)
High -1.14 -0.15 -0.77 0.07 0.23 -0.35 0.73
(0.117) (0.860) (0.390) (0.953) (0.897) (0.650) (0.429)
All -1.29*** -0.68 -1.10** -1.13* -0.79 -1.00** 0.23
(0.001) (0.122) (0.030) (0.081) (0.436) (0.041) (0.644)
High-Low 0.08 0.23 0.61 1.14* 1.21 0.65
(0.852) (0.628) (0.254) (0.061) (0.343) (0.179)

70
APPENDIX 1.IV Portfolio BvanB Fund Alpha, Based on Sorting on BvanB Skill and Lagged Fund Alpha, in High
and Low Market Sentiment Periods Using UM Index This table presents the portfolio BvanB fund alpha, annualized, using monthly returns (145 months), from
December 2002 to December 2014 (Panel A), high sentiment (Panel B), and low sentiment (Panel C) periods, based
on the University of Michigan consumer sentiment index (UM sentiment index). If the UM sentiment index for the
test month (t) is higher (lower) than the median number of all monthly UM sentiment index numbers, we define this
month as high (low) market sentiment month. Portfolios are formed by sorting all funds in each month into quintiles
by BvanB fund skill (Eq. 3) and then by BvanB fund alphat-1, and both are described in detail in section III.B.2. For
each portfolio cell, we present portfolio BvanB fund alpha, which is the portfolio alpha times the average TNA of
funds within the portfolio at the beginning of current month (t), and the P-value. ***, **, * denotes significance at
the 1%, 5% or 10% level.
Panel A: Portfolio BvanB alpha based on alternative investment opportunity
BvanB fund skill
Alphat-1 Low 4 3 2 High All High-Low
Low -29.64*** -11.21*** -8.13*** -8.32*** -23.35*** -16.13*** 3.15
(<.001) (<.001) (<.001) (<.001) (<.001) (<.001) (0.211)
4 -11.07*** -4.61*** -3.05*** -2.09 -3.86 -4.94*** 3.60*
(0.001) (0.001) (0.008) (0.092) (0.166) (0.002) (0.064)
3 -4.17 -1.87 -0.44 0.28 1.83 -0.87 3.00
(0.137) (0.166) (0.689) (0.817) (0.511) (0.555) (0.117)
2 0.01 0.84 1.79 2.95** 8.76*** 2.87* 4.38**
(0.998) (0.550) (0.115) (0.023) (0.001) (0.064) (0.026)
High 18.16*** 6.79*** 7.32*** 9.02*** 30.39*** 14.34*** 6.11**
(<.001) (<.001) (<.001) (<.001) (<.001) (<.001) (0.015)
All -7.58** -2.01 -0.50 0.37 2.76 -0.95 5.17**
(0.027) (0.159) (0.668) (0.775) (0.337) (0.548) (0.018)
High-Low 23.90*** 9.00*** 7.72*** 8.67*** 26.87*** 15.23***
(<.001) (<.001) (<.001) (<.001) (<.001) (<.001)
Panel B: Portfolio BvanB alpha in high market sentiment
Alphat-1 Low 4 3 2 High All High-Low
Low -23.81*** -7.87*** -5.51*** -5.93*** -23.37*** -13.30*** 0.22
(<.001) (0.001) (0.007) (0.010) (<.001) (<.001) (0.955)
4 -4.55 -1.45 -0.49 0.55 -1.43 -1.47 1.56
(0.293) (0.511) (0.789) (0.780) (0.755) (0.549) (0.586)
3 3.80 1.82 2.65 3.27 7.18 3.74 1.69
(0.375) (0.403) (0.149) (0.114) (0.103) (0.131) (0.530)
2 9.43** 5.24** 5.48*** 6.59*** 12.96*** 7.94*** 1.77
(0.040) (0.028) (0.005) (0.004) (0.003) (0.003) (0.521)
High 30.95*** 12.64*** 12.61*** 13.69*** 35.95*** 21.17*** 2.50
(<.001) (<.001) (<.001) (<.001) (<.001) (<.001) (0.494)
All 1.59 2.07 2.95 3.64* 6.26 3.62 2.34
(0.758) (0.364) (0.127) (0.091) (0.180) (0.166) (0.462)
High-Low 27.38*** 10.25*** 9.06*** 9.81*** 29.66*** 17.23***
(<.001) (<.001) (<.001) (<.001) (<.001) (<.001)
Panel C: Portfolio BvanB alpha in low market sentiment
Alphat-1 Low 4 3 2 High All High-Low
Low -35.40*** -14.49*** -10.71*** -10.68*** -23.33*** -18.92*** 6.04*
(<.001) (<.001) (<.001) (<.001) (<.001) (<.001) (0.062)
4 -17.50*** -7.73*** -5.58*** -4.70*** -6.26* -8.35*** 5.62**
(<.001) (<.001) (<.001) (0.002) (0.051) (<.001) (0.035)
3 -12.02*** -5.51*** -3.49*** -2.66** -3.44 -5.43*** 4.29
(0.001) (0.001) (0.003) (0.040) (0.315) (0.001) (0.118)
2 -9.28** -3.49** -1.86* -0.64 4.62 -2.13 6.95**
(0.019) (0.018) (0.089) (0.603) (0.138) (0.162) (0.013)
High 5.56 1.03 2.09* 4.41*** 24.90*** 7.60*** 9.67***
(0.192) (0.487) (0.082) (0.003) (<.001) (<.001) (0.005)
All -16.63*** -6.04*** -3.91*** -2.85** -0.70 -5.45*** 7.96***
(0.001) (0.001) (0.003) (0.043) (0.836) (0.002) (0.009)
High-Low 20.48*** 7.76*** 6.40*** 7.55*** 24.12*** 13.26***
(<.001) (<.001) (<.001) (<.001) (<.001) (<.001)

71
APPENDIX 1.V The Effect of Fund Selectivity, Skill Ratio, and Investor Sentiment on Fund Performance,
Controlling for Macroeconomic Conditions This table reports the results of regressing fund performance (fund alpha based on FFC model or fund BvanB alpha)
on manager’s skill (selectivity or BvanB skill ratio) and investor sentiment, controlling for other characteristics. The
main independent variables are fund selectivity (1-R2
t-1), market sentiment (BW sentiment index, available at Jeffrey
Wurgler’s website) and selectivity*sentiment, which is the product of selectivity and market sentiment. We use four
macroeconomic variables to control economic conditions: aggregate dividend yield, which is the total cash
dividends on the value-weighted CRSP index over prior 12 months divided by the current level of the index; default
spread, which is the difference between Moody’s BAA-rated bonds yield and AAA-rated bonds yield; term spread,
which is the different between ten-year treasury bonds yield and three-month T-bills yield; and the yield on the
three-month T-bill. Fund-level control variables contain expense ratio, log value of fund age, fund turnover, log
value of total net assets (TNA), and squared log value of TNA. The P-value and adjusted R2 for each regression are
also presented. ***, **, * denotes significance at the 1%, 5% or 10% level.
Fund alpha (FFC model)
Fund BvanB alpha
Intercept -0.794*** -0.844***
Intercept -0.547*** -0.428***
(<.0001) (<.0001)
(<.0001) (0.002)
Selectivity 0.410*** 0.414***
BvanB Skill 2.664*** 2.693***
(<.0001) (<.0001)
(<.0001) (<.0001)
Sentiment -0.242*** -0.260***
Sentiment -0.361*** -0.406***
(<.0001) (<.0001)
(<.0001) (<.0001)
Selectivity*Sentiment 0.278*** 0.286***
BvanB Skill*Sentiment 1.712*** 1.738***
(0.001) (0.000)
(<.0001) (<.0001)
Market Dispersion
0.010***
Market Dispersion
0.057***
(<.0001)
(<.0001)
Aggregate Dividend Yield -8.026*** -6.060***
Aggregate Dividend Yield 9.760*** -1.919
(<.0001) (0.001)
(0.000) (0.467)
default Spread 0.275*** 0.218***
default Spread -0.023 -0.216***
(<.0001) (<.0001)
(0.176) (<.0001)
Term Spread -0.015* -0.023***
Term Spread 0.158*** 0.088***
(0.053) (0.005)
(<.0001) (<.0001)
Three Month T-bill 0.047*** 0.040***
Three Month T-bill 0.106*** 0.064***
(<.0001) (<.0001)
(<.0001) (<.0001)
Alphat-1 0.320*** 0.322***
BvanB Alphat-1 0.204*** 0.202***
(<.0001) (<.0001)
(<.0001) (<.0001)
Turnover -0.071*** -0.069***
Turnover -0.011 -0.008
(<.0001) (<.0001)
(0.193) (0.320)
Expense Ratio 0.000*** 0.000***
Expense Ratio 0.000 0.000
(0.000) (0.000)
(0.824) (0.868)
log(TNA) -0.001 -0.001
log(TNA) 0.033*** 0.032***
(0.432) (0.414)
(0.001) (0.001)
[log(TNA)]2 0.322*** 0.326***
[log(TNA)]
2 -0.084 -0.042
(0.000) (0.000)
(0.258) (0.574)
Log(age) -0.029** -0.030***
Log(age) 0.009 0.004
(0.012) (0.010)
(0.389) (0.733)
Adj. R2 0.010 0.010
Adj. R
2 0.790 0.790

72
CHAPTER 2
DOES CORPORATE MANAGERIAL ABILITY MATTER TO FUND MANAGERS?
ABSTRACT
In this paper, we examine whether skilled fund managers’ value creation is linked with the
performance of high managerial ability stocks—that is, the stocks of firms run by skilled chief
executive officers (CEOs)—using the latter as their stock identification strategy. We find that the
performance of the stocks of firms managed by skilled CEOs has strong explanatory power in
the performance of actively managed mutual funds headed by highly skilled fund managers. The
evidence shows that the excess value added generated by mutual fund managers is $3.47 million
per year with exposure to high CEO managerial ability stocks, whereas the average performance
of all mutual funds is -$1.94 million.
INTRODUCTION
Previous studies using fund holdings’ deviation from the benchmark portfolio to measure
mutual fund managers’ management skill show that fund management skill has a positive
relation with fund performance (Brands, Brown, and Gallagher, 2005; Kacperczyk, Sialm, and
Zheng, 2005; Cremers and Petajisto, 2009; Cremers, Ferreira, Matos, and Starks, 2015).
Furthermore, empirical studies report that skilled fund managers add value by selecting valuable
stocks (Gruber, 1996; Carhart, 1997; Daniel, Grinblatt, Titman, and Wermers, 1997; Zheng,
1999) and that their talent in identifying high-performance stocks is due to their superior insight
and analytical ability. Amihud and Goyenko (2013), using 1 - R2 to measure fund selectivity
without paying attention to the composition of fund portfolios, find that funds tracing less the
market benchmark (i.e., skilled fund managers) are associated with higher risk-adjusted excess
returns (alpha). Similarly, Berk and van Binsbergen (2015; hereafter BvanB), who question the

73
long-held view that risk-adjusted returns (net or gross alpha) are an appropriate measure of
mutual fund management skill, propose the dollar value of a fund’s added value over its
benchmark as the measure of skill and find that the average mutual fund adds value by extracting
about $3.2 million US Dollars a year from financial markets. They also find skilled fund
managers’ superior performance to persist for 10 years.21
While most previous studies focus on whether skilled fund managers improve fund
performance or how to estimate fund managerial skill, the important question of how skilled
fund managers detect valuable stocks remains largely unexplored. As mentioned by Wermers,
Yao, and Zhao (2012), the majority of active mutual fund managers claim that they select
valuable stocks using private information generated from stocks’ fundamental information.
Employing the “generalized inverse alpha” (GIA) approach, the authors conclude that the private
information used by active fund managers in the stock selection process is distinct from stock
fundamental information, which is contained in publicly available quantitative signals.
Kacperczyk and Seru (2007) show that skilled fund managers use more private information than
public information to change portfolio allocation, implying that fund managers’ superior
analytical ability helps them to recognize and process idiosyncratic information efficiently,
which, in turn, leads them to identify the most valuable stocks. Therefore, previous research
argues that the superior performance of skilled mutual fund managers is rooted in private
information, but only a few studies try to characterize the private information used by fund
managers. For instance, Kacperczyk et al. (2005) claim that the private information may be about
21
As BvanB argue, due to the scale effect, a fund’s ability to outperform the benchmark (net or gross alpha)
declines as the size of the fund increases and, therefore, the manager’s selectivity skill should be adjusted by fund
size. Net alpha, the authors argue, is determined in equilibrium by competition between investors and not by
managerial skill. Gross alpha is a return measure, not a value measure, and therefore not a measure of skill either.

74
valuation and performance prediction for specific industries and find that fund managers have
better performance if they are more familiar with and focus on specific industries.
Motivated by the growing body of literature and the business world that managers matter
for firm behavior and economic performance (i.e., Bertrand and Schoar 2003; Kaplan, Klebanov,
and Sorensen, 2012; Demerjian, Lev, and McVay, 2012), in this paper, we explore whether the
superior fund performance delivered by skilled fund managers is associated with the
performance of stocks from companies run by chief executive officers (CEOs) with high
managerial ability. If, in fact, CEO skill matters and its importance varies across fund managers,
it can help to explain variation in fund performance. Intuitively, we want to quantify how much
of the observed variation in fund performance can be attributed to fund managers’ stock selection
based on CEO managerial ability.22
We add to this literature by testing the proposition that skilled fund managers’ value
creation is related to the performance of high managerial ability stocks (i.e., stocks from firms
run by skilled CEOs), using the latter as their stock identification strategy. To the extent that a
company’s stock valuation ultimately reflects the quality of its managers through their large
contributions to corporate profits, the question of whether fund manager performance is
associated with the performance of stocks from companies led by adept corporate managers
remains unexplored. Accordingly, if stocks are highly likely to represent firms run by more
efficient (skilled) corporate managers than others, fund managers using corporate managerial
ability as a stock selection identification strategy should significantly contribute to a fund’s
superior performance. However, whether the source of mutual fund managers’ superior stock
22
Cohen, Frazzini, and Malloy (2007) indirectly support this argument by showing that, if fund managers have more
information about corporate board members through shared education networks, they will place larger bets on those
firms and such funds perform significantly better in these holdings relative to their non-connected holdings.

75
picking ability is rooted in the stocks of firms run by CEOs with high managerial talent has not
been the focus of the empirical finance literature until now. In this paper, we add to this literature
by examining whether the value (fund performance improvement) created by skilled fund
managers can be explained by the performance of high managerial ability stocks. That is, we
explore whether CEO managerial skill, as an identification strategy, plays an important role in
explaining skilled mutual fund performance by analyzing the connection between mutual fund
managers’ stock selectivity skill and CEO managerial ability through the relation between the
performance of skilled mutual funds and high managerial ability stocks.
There are three reasons to suggest that CEO managerial ability should be an important
factor for fund managers’ consideration in their stock picking decisions. First, the financial
literature documents that corporate managerial ability plays an important role in a firm’s future
performance. Hayes and Schaefer (1999) link the loss of an adept manager to abnormal negative
returns. Holcomb et al. (2009), show that managerial ability can serve as the basis of value
creation and superior firm performance. Chang et al. (2010) report that higher-ability CEOs
receive higher compensation and that differences in CEO ability account for differences in firm
value and performance. Using a manager–firm matched panel data, Bertrand and Schoar (2003)
find that managerial ability, measured by manager fixed effects, shapes a large range of
corporate decisions, such as mergers and acquisitions or research and development (R&D)
investments.23
Consequently, low-ability corporate managers may lead firms to adopt suboptimal
strategies, hurting firm performance. Consistent with this view, Demerjian, Lev, and McVay
23
Prior literature (i.e., Bertrand and Schoar, 2003; Gow, Kaplan, Larcker, and Zakolyukina, 2015) has explored
heterogeneity across corporate managers, such as differences in managerial ability, personality traits, management
styles, education, or work experience, to explain differences in corporate policies and value across firms without a
narrow focus on specific executive characteristics. A different stream of research has concentrated on executive
characteristics such as risk aversion, time preferences, optimism, and overconfidence (Malmendier and Tate, 2005,
2008; Graham, Harvey and Ruri, 2013) and shows their influence on corporate decisions and outcomes.

76
(2012) find a strong relationship between changes in managerial ability, measured by managers’
efficiency in generating revenues, and changes in a firm’s subsequent performance.24
In the same
vein, Andreou, Ehrlich, Karasamani, and Louca (2015) report that firms with high managerial
ability had better performance even during the 2008 global financial crisis. These findings
suggest that the stocks of firms under the helm of CEOs with high managerial ability are
expected to have better performance than their counterparts managed by low-skilled CEOs
because the former run corporate organizations more efficiently and direct capital resources to
projects with favorable growth opportunities. Therefore, such stocks should attract the attention
of skilled mutual fund managers if corporate managers’ ability is viewed as a sign of efficiently
run corporations, signaling favorable future stock price increases.
The second reason why CEO managerial ability matters as an investment identification
strategy to skilled mutual fund managers is that skilled CEOs can limit firm total risk. For
example, Bonsall, Holzman, and Miller (2016) document that companies with CEOs possessing
higher managerial ability have lower credit risk, because of the lower likelihood that they will
miss principal or interest payments. In addition, Trueman (1986) points out that CEOs with
higher managerial ability are more likely to issue earnings forecasts to keep the market aware of
changes in the firm’s economic environment, which, in turn, lowers stock price volatility. Baik,
Farber, and Lee (2011) provide empirical evidence in support of Trueman’s argument and show
that the frequency of earnings forecasts increases when the firm’s CEO has greater managerial
ability. Third, firms with strong CEO managerial abilities are subject to less information
asymmetry (Andreou et al., 2015; Baik, Farber, and Lee, 2011), which increases the accuracy of
24
Demerjian, Lev, and McVay (2012) show that their managerial ability measure is strongly associated with
manager fixed effects and that stock price reactions to CEO turnover are positive (negative) when they assess the
outgoing CEO as being of low (high) ability. The authors also report that replacing CEOs with CEOs with more
(less) managerial ability improves (deteriorates) firm performance subsequent to executive replacement decisions.

77
mutual fund managers’ stock valuations. Since more firm-specific information is released to the
equity market by CEOs with high managerial ability, mutual fund managers’ research efforts are
expected to be less costly and their stock picking choices are more likely to be rewarded with
higher excess returns when they invest in the stocks of such firms. The above arguments lead to
the hypothesis that CEO managerial skill is likely to act as an important factor in skilled fund
managers’ portfolio allocation, resulting in superior fund performance.25
Surprisingly, this
question has not been the focus of empirical investigation and the aim of this study is to address
this issue.
To address this question, we first examine whether heterogeneity across stock valuations
is associated with differences in managerial ability, using the managerial ability score (MA-
Score) data proposed by Demerjian et al. (2012). This MA-Score estimates corporate managerial
ability based on how efficiently superior managers, especially CEOs, can transform corporate
resources into revenue relative to their industry peers. In their research, Demerjian et al. first use
data envelopment analysis to estimate firm efficiency and then remove any firm-specific
characteristics that are expected to assist or hamper the management’s efforts to obtain an
accurate managerial efficiency measure. The unexplained portion of firm efficiency is attributed
to managerial ability. In the context of this study, the MA-Score is employed as a proxy for
corporate managerial ability to assess its predictive power on firm performance (i.e., stock alpha)
using portfolio analysis. Consistent with the evidence of Demerjian et al., we find firms with
higher managerial ability, as measured by the company’s MA-Score one year prior, have better
performance than their peers. Specifically, the stocks of companies with the highest managerial
ability generate a 4.74% abnormal return every year (P = 0.017), which exceeds the average
25
The literature on managerial compensation dynamics (i.e., Lucas, 1978) argues that managerial ability
(competitive advantage) is rewarded with higher compensation because it enables shareholders to earn positive
rents, implying that the stocks of such companies are very likely to be the most valuable.

78
managerial ability performance (1.57%, P = 0.077), whereas the stocks of companies with the
lowest managerial ability experience a negative 5.00% abnormal return every year (P = 0.042),
which is far lower than the average. Therefore, given this evidence, if managerial ability is used
by skilled fund managers as a stock selection strategy, fund performance should be positively
and significantly related to the stock performance of high managerial ability firms.
Next, we estimate fund manager skill and fund performance by employing two different
measures over the 1990–2014 sample period. First, fund management selectivity skill is assessed
by employing the method of Amihud and Goyenko (2013). Then, we estimate fund manager skill
and fund performance using the measures of management skill (i.e., skill ratio) and performance
(i.e., the value extracted by a fund from capital markets) of BvanB. The evidence based on both
measures consistently shows that fund managers with the highest skill create $3.74 million of
value added, which exceeds the average realized fund loss of $1.97 million, while fund managers
with the lowest skill experience a value loss of $18.06 million every year. To determine whether
the performance of mutual funds managed by skilled fund managers is linked with the stocks of
firms run by managers of high managerial ability, we sort all sampled firms into high managerial
ability firms (top 50%, top 33%, or top 20%) and low managerial ability (bottom 50%, bottom
33%, or bottom 20%) firms based on their previous year’s managerial ability score. If skilled
mutual fund managers do have stock picking skills by detecting firms of high managerial ability
and investing in such firms, their fund performance should be positively and significantly
correlated with the performance of high managerial ability firms.
To examine the relationship between highly skilled mutual fund performance and the
performance of high managerial ability stocks, we sort all mutual funds into quintiles based on
managers’ stock picking skill measures (i.e., fund selectivity or the BvanB skill ratio) and the

79
performance for each mutual fund is measured by the abnormal return, which is the difference
between the real return and the expected return of the test month, with a 24-month moving
estimation window. This procedure enables us to inspect the merit of our hypothesis without
requiring knowledge of the fund’s portfolio holdings. The results of these tests support the
hypothesis that skilled fund managers’ performance is positively and significantly associated
with the performance of firms run by managers possessing high managerial skill, suggesting that
fund managers’ superior stock picking ability is linked with investments in high managerial
ability stocks. Conversely, the alphas of skilled mutual funds are insignificantly related with the
average performance of low CEO managerial ability firms, implying that the superior
performance of skilled fund managers comes from investing in high CEO ability stocks, since
low CEO ability stocks fail to improve fund performance. Furthermore, we find a significant
negative relation between skilled funds’ BvanB alphas and the stock performance of firms led by
CEOs with low managerial ability. These results provide additional support for the view that
skilled fund managers’ superior fund performance comes through investing in firms headed by
CEOs with superior managerial ability.
Next, we apply an analysis using the composition of each fund to confirm whether funds
with highly skilled fund managers are loaded with a higher proportion of high–MA-Score stocks.
By calculating the value-weighted MA-Score for each fund, we find that the highest-skilled fund
quintile is linked with the highest average fund level MA-Score value. This provides additional
evidence that skilled fund managers’ stock holdings are associated with high managerial ability
stocks.
In addition, to test the persistence of the relationship between corporate managerial
ability and fund management performance, the previous analysis is replicated by sorting firms

80
based on the average MA-Score of the past two years instead of the previous year. The results of
this test demonstrate consistently that the superior performance of skilled mutual fund managers
is closely linked with the performance of high managerial ability stocks, revealing that this link
is not a short-lived phenomenon.
Pan, Wang, and Weisbach (2015) show that investors update their expectations about the
future outcomes of firms dynamically when there is uncertainty about the managerial ability of
top corporate managers. Along this argument, skilled mutual fund managers are expected to
respond to corporate managerial skill changes and improve fund performance in anticipation of
investors’ revised expectations about managerial skill. We investigate this hypothesis by sorting
firms in our sample into two groups based on each firm’s MA-Score change in the previous year.
Then, we estimate the average performance of the firms in each group and examine their relation
with the performance of mutual funds run by skilled managers. The results ascertain that skilled
mutual fund managers can accurately assess CEO managerial ability ahead of their peers and
other investors generating superior fund performance. Furthermore, this finding confirms that
CEO managerial ability is an essential source of value creation by fund managers possessing
superior stock picking ability.
Kacperczyk, van Nieuwerburgh, and Veldkamp (2014, 2016) argue that mutual fund
managers successfully pick stocks in economic expansions and time the market in recessions.
Accordingly, one would expect CEO managerial ability to be more precious for skilled fund
managers during economic expansions, since CEO managerial ability information is mainly used
during fund managers’ stock selection process. The evidence supports this hypothesis by
showing that the performance of high managerial ability stocks contributes significantly more in

81
the performance of mutual funds run by skilled managers during economic expansions than in
recessions.
In the next two robustness checks, we examine whether the indispensable role of CEO
managerial ability assessment in fund managers’ stock selection skill is concentrated in picking
stocks from specific industries or is based on certain fund trading strategies. Even though the
results based on the selectivity measure show that fund performance is more pronounced in
mutual funds adopting the Value strategy and only appears when the underlying stocks are from
certain industries (i.e., mining, construction, manufacturing, transportation, communications,
electric, gas, and sanitary services), the results based on the BvanB skill measure indicate that the
corporate managerial ability-based stock picking strategy of skilled fund managers produces
superior abnormal returns in all types (Value, Growth, and Blend) of mutual funds and across
industries.
The remainder of the paper is organized as follows. Section 1 describes the data and the
empirical methodology. Section 2 discusses the results. Section 3 presents the results from
robustness tests. Section 4 concludes the paper.
DATA AND EMPIRICAL METHODOLOGY
Data and sample selection
The data cover actively managed US mutual funds and US public traded companies. The
mutual fund data are obtained from the Bloomberg Fund Dataset, which is widely used in the
finance industry but has not been used in academic studies. Hence, this dataset does not suffer
from the standard sample bias. The data sample period covers 25 years, from 1990 to 2014. To
estimate mutual fund manager skill and past fund alphas for the current year, we use the monthly

82
data for the previous two years (24 months). Therefore, our data collection starts in January
1988. We collect monthly raw returns for each fund if the fund has complete data for more than
two years. We also collect fund-level control variables that could be associated with fund
performance: turnover, which is the minimum of the aggregated sales or aggregated purchases of
securities divided by each fund’s total net assets (TNA), age, and expense ratio (i.e., the fund’s
annual expense ratio). We control for survivorship bias by collecting data for both alive and dead
funds. We also use several criteria to restrict our sample to actively managed US equity mutual
funds: 1) The geographical focus is the United States, 2) the country of domicile is the United
States, 3) the asset class is equity, 4) the fund type is an open-ended mutual fund, and 5) the
inception date is no later than December 2012. Furthermore, we exclude other types of funds,
such as index funds, balance funds, international funds, and sector funds, by deleting funds
whose name contains the term index, ind, S&P, DOW, Wilshire, Russell, global, fixed-income,
international, sector, or balanced. In addition, we require funds to have a minimum TNA of
$15 million (in December 2013 dollars). Overall, the sample contains 2,190 mutual funds over
the period from 1990 to 2014.26
To collect company data, we first match the list of companies having managerial ability
score data with the list of companies, both alive and dead, listed in the NASDAQ, New York
Stock Exchange (NYSE), and American Stock Exchange (AMEX) stock exchanges. The
managerial ability score data, introduced by Demerjian et al. (2012), are from Sarah McVay’s
UW faculty website.27
Finally, our sample consists of 2,469 companies and covers the period
from 1989 to 2013. Other firm-level annual variables, such as a firm’s total debt-to-total equity
26
The top and bottom 1% of R2 observations were deleted. The reason for their exclusion is that funds with the
highest R2 should be index funds, which have not been filtered out by the sample selection criteria. The lowest R
2
values of funds may be due to estimation error. 27
See http://faculty.washington.edu/pdemerj/data.html.

83
ratio (D/E), return on equity (ROE), market-to-book ratio (M/B), and market capitalization, are
obtained from the Bloomberg database for all the companies in the sample.28
The summary
statistics for the annual data of mutual funds and companies are reported in Table 1.
TABLE 2.1 Summary statistics
This table shows the summary statistics of US actively managed equity mutual funds and US public-traded
companies with CEO managerial ability scores (MA-Scores). Panel A gives the statistics for mutual funds. R2t-1 is
calculated by regressing each fund’s excess return (fund monthly raw return minuses risk free rate of that month) on
the multifactor model of Fama-French (1993) and Carhart (1997) (FFC model) over a time window of 24 months.
The risk factors are accessible online through the Kenneth French data library. Expense ratio is the annual expense
ratio of each fund. TNA is each fund’s total net assets in millions. Turnover is the minimum of aggregated sales or
aggregated purchases of securities divided by the total net assets of the fund. Our sample contains 2,190 actively-
managed equity mutual funds over the period from January 1990 to December 2014. Panel B shows the summary
statistics of US public-traded companies with CEO managerial ability scores. The companies are collected by
matching companies having managerial ability data with companies listed in NASDAQ, NYSE, and AMEX stock
exchanges. The managerial ability score data are introduced by Demerjian and McVay (2012) and are public
available online. Finally we have 2,469 companies in our sample and the time period is from 1990 to 2014. Debt to
equity ratio is the ratio of total debt to the total equity hold by the company in each year. Market to book ratio is the
ratio of the company’s market capitalization to its accounting value for each year. ROE is the return on equity of the
company. Size is captured using the company’s total market capitalization.
Panel A: Mutual fund summary statistics
Variable Mean 25% Median 75%
Age (Year) 12.83 7.00 11.00 17.00
Expense Ratio (%) 1.18 0.92 1.15 1.35
R2
t-1 0.88 0.85 0.92 0.95
TNA (Million $) 1,105.42 57.93 190.06 782.90
Turnover 67.94 27.00 48.92 83.00
Panel B: Company summary statistics
Variable Mean 25% Median 75%
Firm MA-Score 0.01 -0.08 0.00 0.08
Debt to Equity Ratio (%) 64.48 2.66 30.44 72.36
Excess Return (%) 15.77 -18.35 7.13 35.72
Market to Book Ratio (%) 3.28 1.32 2.14 3.58
ROE (%) 4.81 1.28 10.89 18.61
Size (Million $) 5,340.08 135.04 589.81 2,323.17
As shown in Table 1, the R2
estimates for mutual funds have a mean value of 0.88 and a
median value of 0.92. This reveals a clear negatively skewed distribution, which indicates that
more than 80% of the funds’ excess return variance can be explained by the variance of market
28
Similar to the mutual fund data, the top and bottom 1% of performance observations were deleted, because these
observations are more likely to be affected by firm-specific events or estimation errors.

84
indexes. On the other hand, the MA-Score values show an average of 0.01, with a median
number of 0.00.
Methodology
In this section, we describe in detail the corporate managerial ability, mutual fund
performance, and fund manager’s skill measures used in our analysis.
Corporate managerial ability measure
The CEO managerial ability measure is the MA-Score measure introduced by Demerjian
et al. (2012), which is defined as management’s efficiency, relative to its industry peers, in
transforming corporate resources into firm revenue. Compared with previous CEO skill
measures, such as the manager’s fixed effects skill measure, the MA-Score measure is more
precise and easier to implement.
Specifically, Demerjian et al., (2012) use a two-step process to measure a firm’s
managerial ability score. First, they employ data envelopment analysis to optimize firm
performance across different inputs and outputs and then they compare each firm to the most
efficient outcome. They then distinguish managerial performance from firm performance by
regressing the total firm efficiency score on the firm’s size, market share, cash availability, life
cycle, operational complexity, and foreign operations and collect the residual from this
estimation as the measure of managerial ability. This measure is highly correlated with previous
management skill measurements, such as managers’ fixed effects and historical stock returns.
Demerjian et al. also conduct tests to establish the validity of this managerial ability measure and
find that abnormal stock returns around the time of a CEO turnover announcement are negatively
associated with the managerial ability score. In addition, changes in the CEO ability score are

85
shown to be positivity associated with the firm’s future stock return and profitability. These
results suggest that the MA-Score managerial ability measure can be used as a reliable proxy to
gauge CEO managerial skill in the context of our study.
Furthermore, we take another step to verify whether the MA-Score measure is an
appropriate CEO managerial skill measure by using a firm’s MA-score in the previous year to
predict the stock’s mispricing level during the current year.29
With firm-level controls, along
with year and industry fixed controls, we find that the MA-score has significantly negative
predictive power in the mispricing level of the firm’s stock. Hence, our evidence demonstrates
that the CEO skilled-based stock-picking identification strategy of fund managers is equivalent
to identifying and investing in stocks subject to low mispricing, since mispricing will introduce
greater volatility to stock performance and skilled CEOs can protect the stocks from
unpredictable price changes caused by market anomalies for the interests of their stockholders.
Fund selectivity and performance measures
To examine whether a positive relationship between skilled fund managers’ performance
and the performance of firms run by skilled CEOs exists, we first assess fund manager skill by
employing the method of Amihud and Goyenko (2013). In their research, Amihud and Goyenko
calculate fund manager skill, which they refer to as selectivity, using a fund’s R2 obtained by
regressing fund returns on multifactor benchmark models. The benchmark multifactor model
used in this study is that proposed by Fama and French (1993) and Carhart (1997) and is denoted
the FFC model, which contains market excess returns (RM - Rf), small minus big size stocks
29
The mispricing data are introduced by Stambaugh, Yu, and Yuan (2012) and can be collected from Robert F.
Stambaugh’s website, at http://finance.wharton.upenn.edu/~stambaug/. The firm-level control variables contain the
industry-adjusted return on assets, monthly stock return, number of total analysts following, M/B, monthly stock
volatility, firm size (sales), capital expenditure, and industry-adjusted R&D expenses. The results are available upon
request.

86
(SMB), high minus low book-to-market ratio stocks (HML), and winner minus loser stocks
(MOM), and all the data are accessible online through Kenneth French’s data library. Amihud
and Goyenko argue that a low level of co-movement with the benchmark model (i.e., the FFC
model), which is reflected by a low R2, shows high fund management skill because highly skilled
fund managers manage funds based on private information, which makes the fund less sensitive
to public information variations. Selectivity, as for Amihud and Goyenko, is measured as
(1)
where RMSE2 is the variance of the error term from the regression, which denotes the
idiosyncratic risk of a fund; Total Variance is the overall variance of a fund’s excess return; and
Systematic Risk2 is the return variance that is due to the benchmark indexes’ risk. As shown in
Eq. (1), fund selectivity will be higher when the fund’s strategy is based less on market
information, which is reflected in systematic risk. The advantage of this method is that it does
not require knowledge of fund holdings or the benchmark index that the fund is using. However,
as shown in Table 1, the distribution of R2 is negatively skewed, which means that the
distribution of selectivity should be heavily positively skewed. Therefore, we used the logistic
transformation of selectivity, TSelectivity, as shown in Eq. (2), as the first fund manager skill
measure:
(2)
We use the average fund abnormal return before fees, the fund gross alpha, to measure
fund performance. The reason for using the fund gross alpha rather than the net alpha is that, as
Berk and Green (2002) argue, if skill is detectable by investors, the significant positive net fund

87
alpha will vanish due to the competition among investors. In that case, gross alpha is a more
appropriate way to measure fund manager performance.
BvanB fund skill and performance measures
Besides the selectivity measure of Amihud and Goyenko (2013), fund manager skill is
also estimated using the method of BvanB, who deduce fund manager skill based on the extra
value added to the fund divided by its standard error (the BvanB measure). Compared with the
selectivity measure, the BvanB measure is a more suitable way to measure fund performance. As
argued by BvanB, the gross abnormal return has to be adjusted by fund size to estimate fund
performance. In addition, the authors also question the benchmark used in previous research
(e.g., FFC model, Fama–French three-factor model, capital asset pricing model) and argue that,
for a reliable market benchmark, the return of the benchmark should be known to investors and
the benchmark should be tradable. Unfortunately, the benchmarks used in factor models do not
meet these criteria. To solve this problem, BvanB use the set of passively managed index funds
offered by Vanguard as the alternative investment opportunity set and they define the fund
benchmark as the closet portfolio formed by those index funds.
Following BvanB, we also use the 11 Vanguard index funds as the benchmark.30
We
started collecting data when all the index funds have data and, therefore, our data period covers
14 years, from 2001 to 2014. As BvanB, we construct an orthogonal basis set out of these index
funds by regressing the nth fund on the orthogonal basis produced by the first n - 1 funds over the
whole sample period. The orthogonal basis for index fund n is calculated by adding the residuals
collected from the prior regression and the mean return of the nth index fund of the whole period.
30
The list of the 11 Vanguard index funds and their inception dates is shown in Appendix I.

88
After we obtain the new benchmark, we regress the excess returns of each fund on the 11
Vanguard index fund orthogonal benchmark for the whole sample period, from 2003 to 2014,
using 24-month rolling window regression and moving forward one year each time. We calculate
fund performance using the abnormal capital inflow of each fund in the test year (denoted BvanB
alpha), which is calculated as the fund's gross abnormal return (real raw return over its expected
return) multiplied by the inflation-adjusted TNA of the fund at the beginning of the current year.
The fund expected return is the product of the loading of each Vanguard index fund on the
orthogonal basis on the fund excess return from the preceding 24-month estimation period by the
real numbers of each Vanguard index fund on the orthogonal basis in the current year.
As BvanB, we use the skill ratio measure (denoted BvanB skill) to capture fund
management skill, as shown in Eq. (3). Each fund’s BvanB skill in each year is calculated as the
fund’s abnormal return (fund alpha) multiplied by the inflation-adjusted fund size at the
beginning of the last year, divided by the standard error of the fund alpha, collected from the 24-
month rolling window regression of fund excess returns over the alternative investment
opportunity formed with the 11 Vanguard index funds:
(3)
EMPIRICAL RESULTS
Effect of CEO managerial ability on stock performance
To examine whether CEO managerial ability works as a means of fund managers’ stock
picking identification strategy, we examine whether high (low) fund performance is associated
with the performance of the stocks of firms run by CEOs with high (low) managerial skill.
Consequently, we first investigate whether high CEO managerial ability is linked with superior

89
stock performance. If the stocks of firms managed by skilled CEOs are associated with abnormal
gains, they should be attractive to mutual fund managers and beneficial to fund performance.
Therefore, discovering firms run by talented CEOs and investing in these companies should
assist fund managers in improving fund performance. That is, using corporate managerial skill as
an investment strategy, skilled fund managers should be able to deliver value. To explore the
relation between stock performance and a company’s CEO’s ability, we first sort all companies
in each year (t) into quintiles based on their CEOs’ managerial ability scores (MA-Score) in year
t - 1. The managerial ability score data are from Demerjian and McVay (2012) and are available
online. Then, within each quintile, we further sort all firms into five groups based on their past
performance (i.e., firm alphat-1). The firm alphat-1 values are the intercepts of regressing each
company’s monthly stock excess returns (over the T-bill rate) on the factors from the FFC model
for a 24-month estimation period. This procedure produces 25 (5×5) portfolios of different
corporate managerial abilities and past performances. Then, we report the equally weighted firm
annualized abnormal returns and P-values for each portfolio during the whole sample period
(January 1990 to December 2014) in Table 2. To estimate the monthly abnormal return for each
company, we calculate the difference between the company’s monthly excess return (over the
risk-free rate) and the expected excess return of the same month. To calculate the expected
excess return for each company in the current month, we multiply the FFC model factor
loadings, which are also obtained from the preceding 24-month estimation period (t - 2 to t - 1)
by the FFC model factors in the same month. This process is repeated by moving the estimation
and test period one month at a time.

90
TABLE 2.2 Portfolio firm alpha, sorting on lagged CEO managerial ability score and alpha
The table presents the portfolio average of firm annual abnormal return (firm alpha) in the whole sample periods
from January 1990 to December 2014. Portfolios are formed by sorting all companies in each year into quintiles by
lagged CEO managerial ability score (MS-Score) and then by firm alphat-1. The managerial ability score data are
introduced by Demerjian and McVay (2012) and are public available online. Firm alphat-1 data are obtained from the
24-month estimation period by regressing each company’s monthly stock excess returns (over the T-bill rate) on the
factors from FFC model. Then, we calculate the abnormal return in month t for each company as the difference
between company excess return (over risk free rate) in month t and the expected excess return of the same month.
The expected excess return for each company in month t is calculated by multiplying the FFC model factor loadings
from the 24 month preceding estimation period (t-2 to t-1) by the FFC model factors in current month. The process
repeats by moving the estimation and test period one month at a time. We report the equal weighted firm abnormal
returns for each portfolio and the P-value. ***, **, * denotes significance at the 1%, 5% or 10% level.
CEO Managerial Abilityt-1
Stock Alphat-1 Low 4 3 2 High All High-Low
Low -5.00** 3.94* 1.97 4.02** 1.47 1.28 3.23***
(0.042) (0.056) (0.271) (0.023) (0.409) (0.391) (0.008)
4 -2.39 0.76 0.98 4.14*** 3.52** 1.40 2.95***
(0.126) (0.619) (0.505) (0.004) (0.026) (0.183) (0.002)
3 -2.22 3.72*** 3.10** 2.37* 3.88*** 2.17** 3.05***
(0.113) (0.005) (0.025) (0.083) (0.005) (0.020) (<.0001)
2 -0.99 2.99** 2.48* 4.26*** 3.26** 2.40** 2.13**
(0.532) (0.039) (0.077) (0.007) (0.027) (0.017) (0.019)
High -6.93*** 0.77 2.54 1.84 4.74** 0.59 5.84***
(0.002) (0.699) (0.122) (0.330) (0.017) (0.654) (<.0001)
All -3.51*** 2.43** 2.22** 3.33*** 3.37*** 1.57* 3.44***
(0.006) (0.016) (0.026) (0.002) (0.002) (0.077) (<.0001)
High-Low -0.96 -1.58 0.29 -1.09 1.64 -0.34
(0.490) (0.215) (0.800) (0.331) (0.195) (0.681)
Consistent with the findings of Demerjian et al. (2012), the results in Table 2 show that
firms under the helm of high CEO ability (a high CEO MA-Score in the prior year) earn high
abnormal stock returns (i.e., stock alpha).31
The highest abnormal return is 4.74% (P = 0.017) for
the portfolio with the highest managerial ability and best past performance, while the average
abnormal return for the whole sample is 1.57% (P = 0.077).32
Meanwhile, the results indicate
that, if active mutual funds aggressively invest in the stocks of firms managed by CEOs with
high managerial ability, they can reap large rewards for fund investors. We also perform a
31
Even though this relation has been documented by Demerjian et al. (2012), we confirm this relation in our context
by narrowing the data to only public companies traded on the AMEX, NYSE, and NASDAQ stock exchanges,
because those stocks are available for mutual fund managers to invest in and their financials are more reliable. 32
We replicate the portfolio analysis using yearly data and the results are consistent with the monthly data results.

91
regression analysis by regressing stock alpha on CEO MA-Scoret-1 and stock alphat-1, controlling
for firms’ total D/E, ROE, M/B, and market capitalization. The regression results, reported in
Appendix II, for the sample period from 1990 through 2014, consistently show that the stocks of
firms managed by CEOs with higher managerial ability have significant better performance than
other stocks. Jointly, these findings confirm that investing in the stocks of firms under the
directorship of skilled CEOs is expected to be very attractive to skilled mutual fund managers
because such stocks represent valuable investment opportunities that could improve fund
performance.
Effect of fund manager skill on fund performance
In this section, we examine the predictive power of the two fund manager skill measures
on fund performance used in our analysis. First, we test the predictive power of the selectivity
measure (i.e., the logistic transformation of 1 - R2
t-1) on fund performance (i.e., fund annual
alpha). As stated by Amihud and Goyenko (2013), this selectivity measure captures the
proportion of fund performance that is explained by trading on private information and,
therefore, we expect a significant positive relation between high fund selectivity and the fund
alpha. We estimate R2 using a 24-month window rolling regression procedure and R
2 is used
only if the mutual fund has 24 months of complete continuous data in the estimation period.
Then, for each month, we rank all mutual funds in the quintiles based on their 1 - R2
value.
Within each quintile, we sort funds into five portfolios based on their alphat-1, which is the
intercept from the estimation regression. This procedure produces 25 (5×5) portfolios with
different fund manager selectivities and past performances. For each portfolio, we report the
equally weighted firm abnormal returns and P-values during the whole sample period (January
1990 to December 2014) and report the results in Table 3, Panel A. To estimate the fund alpha in

92
month t for each mutual fund, we calculate the difference between the fund excess return (over
the risk-free rate) in month t and the expected excess return for the same month. To calculate the
expected excess return for each fund in month t, we multiply the FFC model factor loadings,
which are also collected from the preceding 24-month estimation period (t - 2 to t - 1) by the
FFC model factors in the current month. This procedure is repeated by moving the estimation
and test period one month at a time.
The results in Table 3, Panel A, show that, when the overall mutual fund industry cannot
beat the market benchmark significantly (-0.57%, P = 0.166), funds in the highest selectivity
quintile generate a significant, positive 3.05% annual alpha (P = 0.023). In addition, the return of
the hypothetical portfolio of a long position in high-selectivity funds and a short position in low-
selectivity funds delivers a significant positive annual alpha (0.92%, P = 0.019 for the whole
sample; 2.24%, P = 0.003 for funds with the best past performance). These results confirm that
fund selectivity is positively associated with fund alpha.
We re-examine the effect of fund management skill on fund performance using the
BvanB skill measure. The main difference with the previous portfolio analysis is that the BvanB
skill and performance (BvanB alpha) measures are used, as defined in Section 1.2.3. This metric
permits us to gauge the success of a fund manager based on the value added of an investment
opportunity (i.e., the net present value of an investment) rather than the return a fund earns (i.e.,
the internal rate of return), since bigger funds could generate more value even if they have lower
alphas. These results are presented in Table 3, Panel B.

93
TABLE 2.3 Fund portfolio performance, based on sorting on fund manager skill and lagged fund performance
This table presents the fund portfolio performance (fund alpha and fund BvanB alpha), annualized, using monthly
returns. In panel A, portfolios are formed by sorting all funds in each month into quintiles by lagged R2 and then by
fund alphat-1. Both are obtained from the 24-month estimation period (t-24 to t-1) by regressing each fund’s monthly
excess returns (over the T-bill rate) on the factors from FFC model. Then, for the following month (t), we calculate
the average monthly excess returns for each fund portfolio. This process is repeated by moving the estimation and
test period one month at a time for the period from January 1990 to December 2014. Last we regress the test period
average portfolio returns on the FFC model. For each portfolio cell, we present portfolio alpha, which is the
intercept from the above regression, and the P-value. Panel B presents the portfolio BvanB fund alpha, annualized,
using monthly returns (145 months), from December 2002 to December 2014. Portfolios are formed by sorting all
funds in each month into quintiles by BvanB fund skill (Eq. 3) and then by BvanB fund alphat-1, and both are
described in detail in section 1.2.3. For each portfolio cell, we present portfolio BvanB fund alpha, which is the
portfolio alpha times the average TNA of funds within the portfolio at the beginning of current month (t), and the P-
value. ***, **, * denotes significance at the 1%, 5% or 10% level.
Panel A: Portfolio fund alpha for the entire sample period
Fund selectivity (1-R
2t-1)
Alphat-1 Low 4 3 2 High All High-Low
Low -1.75*** -2.04*** -1.84** -1.97** -2.06 -1.93*** -0.20
(0.001) (0.003) (0.015) (0.026) (0.117) (0.002) (0.765)
2 -1.43*** -0.99** -0.90 -0.34 0.34 -0.67 0.87**
(0.001) (0.049) (0.154) (0.653) (0.712) (0.196) (0.047)
3 -0.94** -0.67 -1.17** -0.51 0.56 -0.55 0.65
(0.024) (0.143) (0.044) (0.450) (0.501) (0.219) (0.145)
4 -1.18** -1.16 0.11 -0.20 0.99 -0.28 1.05**
(0.011) (0.106) (0.840) (0.792) (0.277) (0.535) (0.037)
High -1.41* -0.81 -0.08 2.14** 3.05** 0.58 2.24***
(0.051) (0.355) (0.912) (0.025) (0.023) (0.381) (0.003)
All -1.34*** -1.14** -0.78 -0.19 0.58 -0.57 0.92**
(0.001) (0.012) (0.110) (0.754) (0.426) (0.166) (0.019)
High-Low 0.19 0.62 0.91* 2.03*** 2.57** 1.27**
(0.606) (0.191) (0.061) (0.001) (0.004) (0.004)
Panel B: Portfolio BvanB fund alpha for the entire sample period
BvanB fund skill
BvanB Alphat-1 Low 4 3 2 High All High-Low
Low -18.06* -3.25 -1.44 -0.22 0.77 -4.44 9.42*
(0.074) (0.115) (0.353) (0.850) (0.609) (0.124) (0.056)
4 -8.61 -3.25* -1.30 -0.42 1.03 -2.51 4.82*
(0.103) (0.065) (0.324) (0.740) (0.563) (0.194) (0.069)
3 -4.84 -2.30 -0.87 0.31 1.22 -1.29 3.03*
(0.140) (0.138) (0.470) (0.796) (0.498) (0.393) (0.089)
2 -4.52 -2.02 -0.64 0.14 2.14 -0.98 3.33*
(0.120) (0.168) (0.575) (0.911) (0.308) (0.500) (0.053)
High -4.80** -1.75 -0.20 0.64 3.74 -0.48 4.27*
(0.048) (0.182) (0.864) (0.649) (0.337) (0.769) (0.061)
All -8.82* -2.51 -0.89 0.09 1.78 -1.94 5.30**
(0.078) (0.115) (0.472) (0.943) (0.413) (0.280) (0.044)
High-Low 6.63* 0.75 0.62 0.43 1.48 1.98*
(0.098) (0.150) (0.138) (0.199) (0.261) (0.060)

94
Consistent with our previous findings (Table 3, Panel A), the results in Table 3, Panel B,
reveal that funds with superior management skills, based on the BvanB fund skill measure,
exhibit better performance than the average mutual fund. The highest annualized BvanB fund
alpha is $3.74 million (P = 0.337) for the fund portfolio with the highest BvanB fund skill and
the best past performance, while the average performance of all mutual funds is -$1.94 million (P
= 0.280). The results for the hypothetical portfolio of a long position in a high BvanB fund skill
portfolio and a short position in a low BvanB fund skill portfolio, presented in the rightmost
column of Panel B under “High–Low”, indicate that the return from this strategy is positive and
significant ($5.30 million, P = 0.044). For the highest and BvanB alphat-1 quintiles, the
hypothetical portfolio yields an annualized alpha of $4.27 million (P = 0.061). Overall, these
results confirm the existence of a positive relationship between those funds with the greatest
management skill and performance.33
We also perform regression analysis to assess the validity of the linear relationship
between fund manager skill and fund performance, controlling for other effects. For both
measures, we regress fund performance (fund alpha or fund BvanB alpha) on fund manager skill
(TSelectivity or BvanB skill), controlling for fund past performance (fund alphat-1 or fund
BvanB alphat-1), the expense ratio, the log value of fund age, TNA, and the squared log value of
TNA and report these results in Appendix III. Consistent with the results from portfolio analysis,
the regression results show that fund manager skill in all the regression specifications is positive
and significantly associated with fund performance. Jointly, in accordance with previous studies,
these results demonstrate that both fund selectivity and BvanB fund management skill measures
are reliable metrics that allow us to capture fund managers’ stock picking skill. Both measures
33
We replicate the portfolio analysis using yearly data and the results are consistent with the monthly data results.
95
demonstrate that skilled managers at the helm of mutual funds significantly outperform their
peers.
Skilled fund performance and CEO managerial ability
The central hypothesis of this research is that the superior performance of mutual funds
headed by skilled fund managers (i.e., top 20% of funds with the highest stock picking skill in
each year) relative to their low-skilled peers is associated with the stocks of firms run by CEOs
possessing high managerial skills. To address this issue, at the beginning of each year from 1990
to 2014, we assign all funds in our sample to one of five equally weighted portfolios based on
managers’ stock picking skill inferred from the selectivity measure, as defined in Section 1.2. In
each year, we treat the mutual funds in the top selectivity quintile as the funds with skilled
managers. To proxy for the performance of firms with high and low CEO skill, we sort all firms
into two groups (each group contains 50% of the companies in the sample), three groups (each
group contains 33% of the companies in the sample), and five groups (each group contains 20%
of the companies in the sample) based on each firm’s past year MA-Score and compute the
average performance for each group. The performance of the groups consisting of the top 50%,
33%, or 20% of the firms is used to identify the performance of firms with skilled CEOs, while
the performance of the groups containing the bottom 50%, 33%, or 20% of firms is used to
indicate the performance of firms with low managerial ability CEOs. We then regress the
highest-skilled funds’ annual fund alpha, obtained from the top 20% of funds in terms of
selectivity, on the performance of the two company groups managed by CEOs with high (top
50%, top 33%, or top 20%) or low (bottom 50%, bottom 33%, or bottom 20%) managerial
ability scores, controlling for other fund characteristics. The results are illustrated in Table 4.

96
TABLE 2.4 High and low managerial ability stocks’ performance and high selectivity funds’ performance (Alpha)
This table reports the results of regressing high selectivity (top 20%) fund annual alpha on the performance of firms assigned in groups with high (top 50%, 33%,
and 20%) and low (bottom 50%, 33%, and 20%) lagged CEO managerial ability scores, controlling for other fund characteristics. The dependent variable is the
annual alpha of high selectivity funds, representing the top 20% funds with the highest selectivity in each year. The annual fund alpha is the difference between
fund excess return (over risk free rate) in year t and the expected excess return of the same year. The expected excess return for each fund in year t is calculated
by multiplying the FFC model factor loadings from the 24 month preceding estimation period by the FFC model factors in current year. The process is repeated
by moving the estimation and test period one year at a time. The main independent variables are the average abnormal firm returns (firm alpha) with MA-Scores
in the high (top 50%, 33%, and 20%) and low (bottom 50%, 33%, and 20%) groups. Companies are sorted into groups based on their CEO MA-Scores in prior
year. The abnormal return in year t for each company is calculated as the difference between company excess return (over risk free rate) in year t and the
expected excess return of the same year. The expected excess return for each company in year t is calculated by multiplying the FFC model factor loadings from
the 24 month preceding estimation period by the FFC model factors in current year. The process repeats by moving the estimation and test period one year at a
time. Fund-level control variables contain expense ratio, log value of fund age, value of total net assets (TNA), and squared log value of TNA. Sample period
covers from 1990 through 2014. We present the P values and adjusted R2 for each regression. ***, **, * denotes significance at the 1%, 5% or 10% level.
Top 20% Selectivity Fund Alpha
[1] [2] [3] [4] [5] [6] [7] [8] [9]
Intercept -0.88 -0.29 -0.47 -0.81 -0.29 -0.64 -1.06 -0.62 -1.07
(0.815) (0.940) (0.902) (0.829) (0.940) (0.866) (0.777) (0.870) (0.776)
Alpha of Top 50% MA-Score Firms 0.15***
0.25***
(0.002)
(0.001)
Alpha of Bottom 50% MA-Score Firms
0.05 -0.08
(0.174) (0.106)
Alpha of Top 33% MA-Score Firms
0.15***
0.17***
(0.002)
(0.006)
Alpha of Bottom 33% MA-Score Firms
0.04 -0.03
(0.158) (0.505)
Alpha of Top 20% MA-Score Firms
0.16***
0.16***
(<.0001)
(0.002)
Alpha of Bottom 20% MA-Score Firms
0.06** 0.00
(0.023) (0.973)
Fund Alphat-1 1.61*** 1.71*** 1.57*** 1.63*** 1.71*** 1.61*** 1.66*** 1.70*** 1.66***
(0.001) (<.0001) (0.001) (0.001) (<.0001) (0.001) (<.0001) (<.0001) (<.0001)
Expense Ratio -0.25** -0.25** -0.25** -0.25** -0.25** -0.25** -0.25** -0.25** -0.25**
(0.013) (0.014) (0.013) (0.013) (0.014) (0.013) (0.014) (0.013) (0.014)
Turnover -0.01*** -0.01*** -0.01*** -0.01*** -0.01*** -0.01*** -0.01*** -0.01*** -0.01***
(<.0001) (<.0001) (<.0001) (<.0001) (<.0001) (<.0001) (<.0001) (<.0001) (<.0001)
Log(Age) -0.70 -0.79 -0.77 -0.70 -0.79 -0.73 -0.69 -0.72 -0.69
(0.222) (0.171) (0.178) (0.220) (0.169) (0.204) (0.225) (0.208) (0.229)
Log(TNA) 1.27 1.28 1.24 1.27 1.29 1.26 1.30 1.30 1.30
(0.309) (0.306) (0.319) (0.308) (0.303) (0.312) (0.297) (0.298) (0.297)
[Log(TNA)]2 -0.13 -0.13 -0.12 -0.13 -0.13 -0.13 -0.13 -0.13 -0.13
(0.236) (0.236) (0.241) (0.234) (0.234) (0.237) (0.223) (0.230) (0.223)
Strategy Control YES YES YES YES YES YES YES YES YES
Adj. R2 0.036 0.030 0.038 0.036 0.031 0.036 0.040 0.033 0.040

97
TABLE 2.5 High and low managerial ability stocks’ performance and high BvanB skill funds’ performance (value added)
This table reports the results of regressing high (Top 20%) BvanB skill fund annual BvanB alpha on the performance of company groups with high and low CEO
ability scores controlling for other fund characteristics. The dependent variable is the annual alpha of high BvanB skill funds, representing the top 20% funds
with the highest BvanB skill in each year. The main independent variables are added value of high (top 50%, 33%, and 20%) and low (bottom 50%, 33%, and
20%) MA-Score firms, which is the average of company’s abnormal return timing the company’s market capitalization at the beginning of year t in each group.
Companies are sorted into groups based on their CEO MA-Scores in prior year. Fund-level control variables contain expense ratio, log value of fund age, fund
turnover, log value of TNA, squared log value of TNA, and BvanB alphat-1, which is the product of fund alphat-1 and fund TNA at the beginning of last year in
the estimation period and fund alphat-1 is the intercept from the 24 month preceding estimation period. Sample period ranges from 2003 through 2014. The P-
value and adjusted R2 for each regression are also presented. ***, **, * denotes significance at the 1%, 5% or 10% level.
Top 20% BvanB Skill Fund Alpha
[1] [2] [3] [4] [5] [6] [7] [8] [9]
Intercept 453.04*** 705.06*** 540.05*** 415.51*** 756.59*** 633.34*** 425.96*** 661.11*** 499.81***
(<.0001) (<.0001) (<.0001) (<.0001) (<.0001) (<.0001) (<.0001) (<.0001) (<.0001)
Added Value of Top 50% MA-Score Firms 0.20***
0.35***
(<.0001)
(<.0001)
Added Value of Bottom 50% MA-Score Firms
-0.34*** -0.49***
(<.0001) (<.0001)
Added Value of Top 33% MA-Score Firms
0.32***
0.42***
(<.0001)
(<.0001)
Added Value of Bottom 33% MA-Score Firms
-0.21*** -0.31***
(<.0001) (<.0001)
Added Value of Top 20% MA-Score Firms
0.26***
0.25***
(<.0001)
(<.0001)
Added Value of Bottom 20% MA-Score Firms
-0.08*** -0.06***
(<.0001) (<.0001)
Fund BvanB Alphat-1 0.04 0.80 0.65 -0.01 0.53 0.31 0.06 0.35 0.14
(0.961) (0.339) (0.417) (0.993) (0.533) (0.693) (0.938) (0.683) (0.856)
Expense Ratio -32.12** -31.59*** -18.33 -24.84** -33.20*** -13.52 -15.08 -35.50*** -13.21
(0.011) (0.010) (0.119) (0.042) (0.008) (0.243) (0.200) (0.005) (0.259)
Turnover -0.05 -0.07 -0.02 -0.04 -0.07 -0.02 -0.02 -0.07 -0.01
(0.417) (0.284) (0.713) (0.544) (0.265) (0.747) (0.808) (0.279) (0.858)
Log(Age) 18.14** 7.59 8.18 17.08* 6.74 3.94 16.14* 13.66 14.30*
(0.044) (0.391) (0.331) (0.051) (0.452) (0.636) (0.055) (0.133) (0.087)
Log(TNA) -223.06*** -291.73*** -246.16*** -213.72*** -302.07*** -267.34*** -218.93*** -278.82*** -237.99***
(<.0001) (<.0001) (<.0001) (<.0001) (<.0001) (<.0001) (<.0001) (<.0001) (<.0001)
[Log(TNA)]2 26.22*** 30.39*** 27.25*** 25.84*** 31.12*** 29.00*** 26.19*** 29.73*** 27.30***
(<.0001) (<.0001) (<.0001) (<.0001) (<.0001) (<.0001) (<.0001) (<.0001) (<.0001)
Strategy Control YES YES YES YES YES YES YES YES YES
Adj. R2 0.329 0.356 0.416 0.366 0.340 0.433 0.414 0.318 0.421
98
As hypothesized, skilled mutual fund alpha values are positively and significantly linked
with the average performance of firms run by high-ability CEOs. This indicates that the high
alpha delivered by skilled fund managers is strongly associated with the superior stock
performance of firms managed by CEOs with high managerial skills (0.25, P = 0.001 for the top
50% of firms; 0.17, P = 0.006 for the top 33%; 0.16, P = 0.002 for the top 20%). On the other
hand, the skilled mutual fund alpha values are insignificantly related with the average
performance of low CEO managerial ability firms, suggesting that investing in the stocks of
firms run by low-ability CEOs fails to improve fund performance (-0.08, P = 0.106 for the
bottom 50% of firms; -0.03, P = 0.505 for the bottom 33%; 0.00, P = 0.973 for the bottom 20%),
further corroborating that skilled fund managers’ superior fund performance comes from
investing in firms managed by CEOs of superior managerial ability. In sum, the results clearly
show that the highest quintile of skilled fund managers generates the highest alpha when
investing in the stocks of firms operating under the helm of highly skilled corporate managers.
We repeat the previous analysis using the BvanB measures of fund management skill and
fund performance. Specifically, we regress the high BvanB skill funds’ annual alpha, obtained
from the top 20% of funds with the highest BvanB skill, on the performance of the two company
groups managed by CEOs with high (top 50%, top 33%, or top 20%) or low (bottom 50%,
bottom 33%, or bottom 20%) managerial ability scores, controlling for other fund characteristics.
Furthermore, in accord with the argument of BvanB, we use a firm’s value added to measure
each firm’s performance for year t, which is calculated by its abnormal return (stock alpha) times
the firm’s inflation adjusted market capitalization at the beginning of year t. We then regress the
high BvanB skill funds’ annual BvanB alpha, obtained from the top 20% of funds with the
highest BvanB skill, on the average value added of the two company groups managed by CEOs

99
with high or low managerial ability, controlling for other fund characteristics, and report these
results in Table 5.
The pattern of these results provides additional support for our hypothesis that the
superior performance of mutual funds, under the helm of skilled mutual managers, is associated
with the stocks of firms run by CEOs of high managerial talent. Specifically, the regression
results in Table 5 show that the performance of firms run by CEOs with high managerial ability
significantly contributes to the performance of mutual funds managed by skilled fund managers
(0.35, P < 0.0001 for the top 50% of firms; 0.42, P < 0.0001 for the top 33%; 0.25, P < 0.0001
for the top 20%). Additionally, we find a significant, negative relation between the skilled funds’
BvanB alpha values and the stock performance of firms led by CEOs with low managerial
ability (-0.49, P < 0.0001 for the bottom 50% of firms; -0.31, P < 0.0001 for the bottom 33%; -
0.06, P < 0.0001 for the bottom 20%). This negative relation reveals two things. First, even
within the top 20% highest skilled mutual funds, a portion of the mutual funds show a significant
performance correlation with low managerial ability stocks, which consequently harm fund
performance. A probable reason for this negative relationship (i.e., investing in firms with low
managerial ability) may be related to increased capital inflows due to past superior performance,
limiting options to invest in firms with superior managerial ability. In addition, due to short
selling restrictions, the majority mutual funds can only hold long stock positions. Hence,
investing in stocks of firms with low managerial ability while they hold stock positions in firms
with high managerial ability could be viewed as a way of creating a short selling position to
protect fund performance. The last regression (regression [9]) shows that when highly skilled
fund managers invest in both high and low managerial ability firms, this both improves (0.25, P
< 0.0001) and harms (-0.06, P < 0.0001) fund performance, respectively, significantly improving

100
net fund performance (0.19). This pattern also holds for regression (regression [6]) for the top
33% of skilled fund managers, but not for the top 50% of skilled fund managers (regression [3]).
Second, when skilled fund managers correctly anticipate the negative effects of a CEO’s
managerial ability, one would expect them to cash out the investment in this company quickly
and take a hedge position on the company’s stock by investing in the company’s competitors or
in companies with the opposite operating strategy. The latter activity can cause a negative
relation between skilled fund performance based on the BvanB value measure and the stock
performance of firms led by CEOs with low managerial ability.34
Skilled fund performance, fund manager skill, and CEO managerial ability
Subsequently, we perform multivariate regression analysis to examine the effect of fund
manager skill, high/low MA-Score firm performance, and their interactions on fund performance
for the entire sample period (1990–2014). First, we estimate the following model:
Skilled Fund Alphaf,t = TSelectivityf,t + Alpha of High MA-Score Firmst + Alpha of Low
MA-Score Firmst +TSelectivityf,t* Alpha of High MA-Score Firmst +∑Controlsf,t (4)
Based on the central prediction of our hypothesis, skilled mutual fund managers are
expected to invest in the stocks of firms run by skilled CEOs to improve fund performance.
Therefore, a positive and significant relation between the interaction of fund selectivity and the
average stock return performance of firms managed by CEOs with high managerial ability,
TSelectivity* Alpha of High (top 50%, 33%, or 20%) MA-Score Firms, and fund performance
(Alpha) is expected to emerge from the regression analysis.
34
We also replicate the same analyses in Section 2.2 by replacing high/low MA-Score firm performance by the
average CEO MA-Score values for each group in the previous year. The results can be found in Appendix VI, which
are similar to those reported and support our argument.
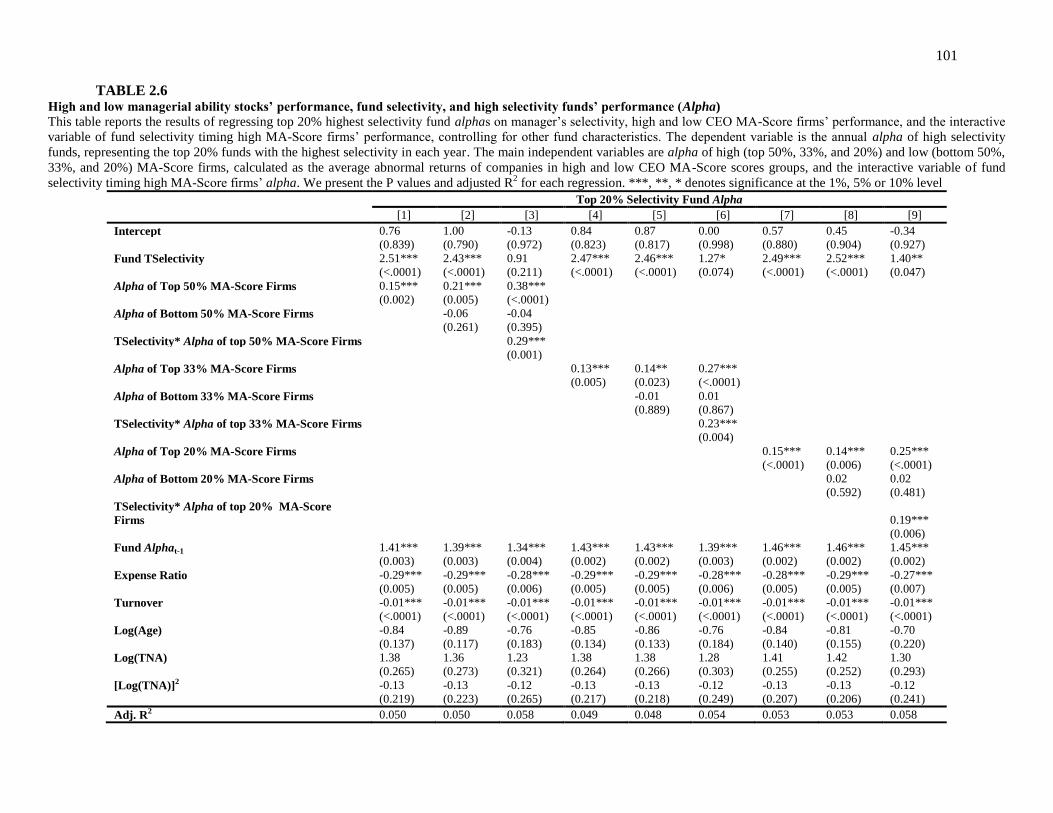
101
TABLE 2.6 High and low managerial ability stocks’ performance, fund selectivity, and high selectivity funds’ performance (Alpha)
This table reports the results of regressing top 20% highest selectivity fund alphas on manager’s selectivity, high and low CEO MA-Score firms’ performance, and the interactive
variable of fund selectivity timing high MA-Score firms’ performance, controlling for other fund characteristics. The dependent variable is the annual alpha of high selectivity
funds, representing the top 20% funds with the highest selectivity in each year. The main independent variables are alpha of high (top 50%, 33%, and 20%) and low (bottom 50%,
33%, and 20%) MA-Score firms, calculated as the average abnormal returns of companies in high and low CEO MA-Score scores groups, and the interactive variable of fund
selectivity timing high MA-Score firms’ alpha. We present the P values and adjusted R2 for each regression. ***, **, * denotes significance at the 1%, 5% or 10% level
Top 20% Selectivity Fund Alpha
[1] [2] [3] [4] [5] [6] [7] [8] [9]
Intercept 0.76 1.00 -0.13 0.84 0.87 0.00 0.57 0.45 -0.34
(0.839) (0.790) (0.972) (0.823) (0.817) (0.998) (0.880) (0.904) (0.927)
Fund TSelectivity 2.51*** 2.43*** 0.91 2.47*** 2.46*** 1.27* 2.49*** 2.52*** 1.40**
(<.0001) (<.0001) (0.211) (<.0001) (<.0001) (0.074) (<.0001) (<.0001) (0.047)
Alpha of Top 50% MA-Score Firms 0.15*** 0.21*** 0.38***
(0.002) (0.005) (<.0001)
Alpha of Bottom 50% MA-Score Firms
-0.06 -0.04
(0.261) (0.395)
TSelectivity* Alpha of top 50% MA-Score Firms
0.29***
(0.001)
Alpha of Top 33% MA-Score Firms
0.13*** 0.14** 0.27***
(0.005) (0.023) (<.0001)
Alpha of Bottom 33% MA-Score Firms
-0.01 0.01
(0.889) (0.867)
TSelectivity* Alpha of top 33% MA-Score Firms
0.23***
(0.004)
Alpha of Top 20% MA-Score Firms
0.15*** 0.14*** 0.25***
(<.0001) (0.006) (<.0001)
Alpha of Bottom 20% MA-Score Firms
0.02 0.02
(0.592) (0.481)
TSelectivity* Alpha of top 20% MA-Score
Firms
0.19***
(0.006)
Fund Alphat-1 1.41*** 1.39*** 1.34*** 1.43*** 1.43*** 1.39*** 1.46*** 1.46*** 1.45***
(0.003) (0.003) (0.004) (0.002) (0.002) (0.003) (0.002) (0.002) (0.002)
Expense Ratio -0.29*** -0.29*** -0.28*** -0.29*** -0.29*** -0.28*** -0.28*** -0.29*** -0.27***
(0.005) (0.005) (0.006) (0.005) (0.005) (0.006) (0.005) (0.005) (0.007)
Turnover -0.01*** -0.01*** -0.01*** -0.01*** -0.01*** -0.01*** -0.01*** -0.01*** -0.01***
(<.0001) (<.0001) (<.0001) (<.0001) (<.0001) (<.0001) (<.0001) (<.0001) (<.0001)
Log(Age) -0.84 -0.89 -0.76 -0.85 -0.86 -0.76 -0.84 -0.81 -0.70
(0.137) (0.117) (0.183) (0.134) (0.133) (0.184) (0.140) (0.155) (0.220)
Log(TNA) 1.38 1.36 1.23 1.38 1.38 1.28 1.41 1.42 1.30
(0.265) (0.273) (0.321) (0.264) (0.266) (0.303) (0.255) (0.252) (0.293)
[Log(TNA)]2 -0.13 -0.13 -0.12 -0.13 -0.13 -0.12 -0.13 -0.13 -0.12
(0.219) (0.223) (0.265) (0.217) (0.218) (0.249) (0.207) (0.206) (0.241)
Adj. R2 0.050 0.050 0.058 0.049 0.048 0.054 0.053 0.053 0.058
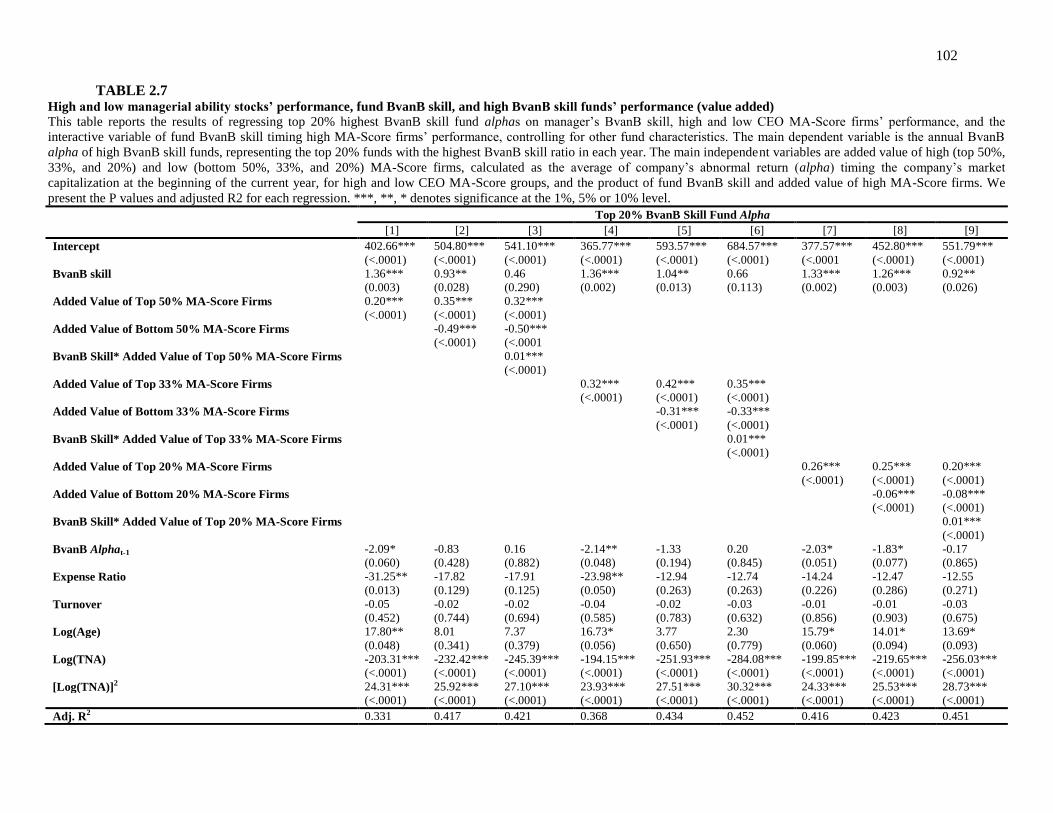
102
TABLE 2.7 High and low managerial ability stocks’ performance, fund BvanB skill, and high BvanB skill funds’ performance (value added)
This table reports the results of regressing top 20% highest BvanB skill fund alphas on manager’s BvanB skill, high and low CEO MA-Score firms’ performance, and the
interactive variable of fund BvanB skill timing high MA-Score firms’ performance, controlling for other fund characteristics. The main dependent variable is the annual BvanB
alpha of high BvanB skill funds, representing the top 20% funds with the highest BvanB skill ratio in each year. The main independent variables are added value of high (top 50%,
33%, and 20%) and low (bottom 50%, 33%, and 20%) MA-Score firms, calculated as the average of company’s abnormal return (alpha) timing the company’s market
capitalization at the beginning of the current year, for high and low CEO MA-Score groups, and the product of fund BvanB skill and added value of high MA-Score firms. We
present the P values and adjusted R2 for each regression. ***, **, * denotes significance at the 1%, 5% or 10% level.
Top 20% BvanB Skill Fund Alpha
[1] [2] [3] [4] [5] [6] [7] [8] [9]
Intercept 402.66*** 504.80*** 541.10*** 365.77*** 593.57*** 684.57*** 377.57*** 452.80*** 551.79***
(<.0001) (<.0001) (<.0001) (<.0001) (<.0001) (<.0001) (<.0001 (<.0001) (<.0001)
BvanB skill 1.36*** 0.93** 0.46 1.36*** 1.04** 0.66 1.33*** 1.26*** 0.92**
(0.003) (0.028) (0.290) (0.002) (0.013) (0.113) (0.002) (0.003) (0.026)
Added Value of Top 50% MA-Score Firms 0.20*** 0.35*** 0.32***
(<.0001) (<.0001) (<.0001)
Added Value of Bottom 50% MA-Score Firms
-0.49*** -0.50***
(<.0001) (<.0001
BvanB Skill* Added Value of Top 50% MA-Score Firms
0.01***
(<.0001)
Added Value of Top 33% MA-Score Firms
0.32*** 0.42*** 0.35***
(<.0001) (<.0001) (<.0001)
Added Value of Bottom 33% MA-Score Firms
-0.31*** -0.33***
(<.0001) (<.0001)
BvanB Skill* Added Value of Top 33% MA-Score Firms
0.01***
(<.0001)
Added Value of Top 20% MA-Score Firms
0.26*** 0.25*** 0.20***
(<.0001) (<.0001) (<.0001)
Added Value of Bottom 20% MA-Score Firms
-0.06*** -0.08***
(<.0001) (<.0001)
BvanB Skill* Added Value of Top 20% MA-Score Firms
0.01***
(<.0001)
BvanB Alphat-1 -2.09* -0.83 0.16 -2.14** -1.33 0.20 -2.03* -1.83* -0.17
(0.060) (0.428) (0.882) (0.048) (0.194) (0.845) (0.051) (0.077) (0.865)
Expense Ratio -31.25** -17.82 -17.91 -23.98** -12.94 -12.74 -14.24 -12.47 -12.55
(0.013) (0.129) (0.125) (0.050) (0.263) (0.263) (0.226) (0.286) (0.271)
Turnover -0.05 -0.02 -0.02 -0.04 -0.02 -0.03 -0.01 -0.01 -0.03
(0.452) (0.744) (0.694) (0.585) (0.783) (0.632) (0.856) (0.903) (0.675)
Log(Age) 17.80** 8.01 7.37 16.73* 3.77 2.30 15.79* 14.01* 13.69*
(0.048) (0.341) (0.379) (0.056) (0.650) (0.779) (0.060) (0.094) (0.093)
Log(TNA) -203.31*** -232.42*** -245.39*** -194.15*** -251.93*** -284.08*** -199.85*** -219.65*** -256.03***
(<.0001) (<.0001) (<.0001) (<.0001) (<.0001) (<.0001) (<.0001) (<.0001) (<.0001)
[Log(TNA)]2 24.31*** 25.92*** 27.10*** 23.93*** 27.51*** 30.32*** 24.33*** 25.53*** 28.73***
(<.0001) (<.0001) (<.0001) (<.0001) (<.0001) (<.0001) (<.0001) (<.0001) (<.0001)
Adj. R2 0.331 0.417 0.421 0.368 0.434 0.452 0.416 0.423 0.451
103
Consistent with the tests presented earlier and the above prediction, the results in Table 6
show that the average performance of firms run by skilled CEOs, Alpha of High (Top 50%, 33%,
or 20%) MA-Score Firms, in all the regression specifications is positive and significantly
correlated with high selectivity fund alpha. Furthermore, the interaction of fund management
selectivity and the average performance of skilled CEO firms, TSelectivity* Alpha of High (top
50%, 33%, or 20%) MA-Score Firms, is also positively and significantly associated with high
selectivity fund alpha (0.29, P = 0.001 in regression [3]; 0.23, P = 0.004 in regression [6]; 0.19,
P = 0.006 in regression [9]), suggesting that skilled fund managers create more value by
investing in the stocks of firms run by CEOs with high managerial ability than in those of firms
run by CEOs with low managerial ability. Interestingly, while the interactive term in the
horserace, TSelectivity* Alpha of High (top 50%, 33%, or 20%) MA-Score Firms in regressions
[3], [6], and [9], remains positive and significant, fund selectivity (Fund TSelectivity), however,
turns out to be less significant (0.09, P = 0.211 for regression [3]; 1.27, P = 0.074 for regression
[6]; 1.40, P = 0.047 for regression [9]), indicating that fund managers’ stock picking skill
delivers greater value to fund performance when they invest in the stocks of firms managed by
CEOs with superior managerial ability.
Next, we replicate the previous regression analysis using the BvanB skill and
performance measures and report the results in Table 7, Panel A. Consistent with the pattern of
results in Table 6, these regression results show that the average performance of firms run by
skilled CEOs is positive and significantly correlated with a high BvanB fund alpha, suggesting
that investing in the stocks of firms headed by skilled CEOs improves fund performance. The
interaction of the BvanB skill and the average performance of skilled CEO firms, BvanB Skill*
Added Value of Top (50%, 33%, and 20%) MA-Score Firms, is also positively and significantly
104
associated with high selectivity fund alpha (0.01, P < 0.0001 in regressions [3], [6], and [9]),
respectively, indicating that skilled fund managers’ investment in such firms improves fund
performance. On the other hand, as in Table 5, the contribution of the stocks of firms run by low-
skilled CEOs (Added Value of Bottom 50% MA-Score Firms) to fund performance, BvanB
alpha, is significantly negative (-0.50, P < 0.0001 in regression [3]; -0.33, P < 0.0001 in
regression [6]; -0.08, P < 0.0001 in regression [9]). Jointly, the results from the multivariate
regression analysis lend support to the hypothesis that skilled mutual fund managers’ CEO
managerial ability-based stock selection investment strategy has a positive and significant impact
on mutual fund performance. Funds earn higher (lower) subsequent returns by investing in the
stocks of companies managed by CEOs with high (low) managerial ability. Hence, adopting
corporate managerial ability as a stock identification and investment strategy is an essential
component of mutual fund performance success.35,36,37
Skilled fund performance and CEO managerial ability change
Since CEO managerial ability is not expected to be static over time and is not accurately
known at a point of time, it is interesting to examine how its changes (i.e., increases or
decreases) influence fund performance, to the extent that managerial ability is considered
35
From now on, we only report the results using the top and bottom 50% MA-Score firm performance, since the
33% and 20% measures give consistent results. 36
We replicate the analyses by exploring the performance relation between high managerial ability stocks and
mutual funds in the lowest fund managers’ skill quintile (bottom 20%) compared to mutual funds in the highest
managers’ skill quintile (top 20%). Unsurprisingly, the coefficients for the performance of funds with less-skilled
managers and the average performance of high managerial ability stocks, using both fund selectivity and the BvanB
skill measures, are insignificant, at zero (-0.01, P = 0.719 for the selectivity measure and 0.04, P = 0.379 for the
BvanB measure). 37
Furthermore, to assess the persistence of the impact of CEO ability on fund performance, we use the previous
two-year average MA-Score to identify firms with high or low managerial ability. The new evidence is consistent
with the previous results based on both skill measures and provides additional support for the positive and
significant association between skilled fund performance and the stocks of firms managed by CEOs with high
managerial ability, even when using the previous two-year average MA-Score to measure corporate managerial
ability.

105
important by fund managers for their stock picking decisions. To examine this effect, we sort the
firms into two groups based on each firm’s previous year MA-Score change (MA-Scoret-2 - MA-
Scoret-1) and then estimate the relation between each group’s performance change (i.e., high and
low CEO ability change firms’ alpha) and skilled mutual fund performance. The results are
reported in Table 8.

106
TABLE 2.8 High and low managerial ability change stocks’ performance and skilled funds’ performance
This table reports the results of regressing top 20% highest selectivity (BvanB skill) fund alpha on fund manager’s
selectivity (BvanB skill) and performances of firm groups with high/low previous year CEO MA-Score changes
controlling for other fund characteristics. Firms are sorted into two groups based on their previous year CEO MA-
Score changes. For regression [1] and [2], the dependent variable is the annual alpha of high selectivity funds,
representing the top 20% funds with the highest selectivity in each year. The main independent variables are firm
alphas of high and low previous year CEO MA-Score changes, which are the average abnormal returns of
companies in high and low previous year CEO MA-Score change groups. For regression [3] and [4], the dependent
variable is the annual BvanB alpha of high BvanB skill funds, representing the top 20% funds with the highest
BvanB skill ratio in each year. The main independent variables are value added of high and low previous year CEO
MA-Score changes, which are the average abnormal returns of companies in high and low previous year CEO MA-
Score change groups time the company’s market capitalization at the beginning of each year. Fund-level control
variables contain expense ratio, log value of fund age, value of total net assets (TNA), and squared log value of
TNA. We present the P values and adjusted R2 for each regression. ***, **, * denotes significance at the 1%, 5% or
10% level.
Top 20% Selectivity Fund Alpha Top 20% BvanB Skill Fund Alpha
[1] [2] [3] [4]
Intercept -1.53 0.13 612.50*** 563.68***
(0.686) (0.974) (<.0001) (<.0001)
TSelectivity
2.59***
(<.0001)
BvanB Skill
1.30***
(0.005)
High CEO Ability Change Firm Alpha 0.21*** 0.19***
(0.001) (0.003)
Low CEO Ability Change Firm Alpha -0.14** -0.11
(0.039) (0.114)
High CEO Ability Change Firm Added Value 0.06* 0.07**
(0.080) (0.045)
Low CEO Ability Change Firm Added Value -0.15*** -0.16***
(0.001) (0.001)
Fund Alphat-1 1.82*** 1.55***
(0.001) (0.001)
Fund BvanB Alphat-1 0.21 -1.86
(0.813) (0.102)
Expense Ratio -0.24** -0.28*** -36.96*** -36.06***
(0.018) (0.006) (0.004) (0.005)
Turnover -0.01*** -0.01*** -0.08 -0.07
(0.001) (0.001) (0.270) (0.298)
Log(Age) -0.74 -0.88 14.83 14.58
(0.196) (0.122) (0.105) (0.110)
Log(TNA) 1.47 1.59 -270.32*** -251.51***
(0.241) (0.200) (<.0001) (<.0001)
[Log(TNA)]2 -0.14 -0.14 29.21*** 27.38***
(0.190) (0.172) (<.0001) (<.0001)
Strategy Control YES YES YES YES
Adj. R2 0.039 0.052 0.310 0.313

107
These results show a positive and significant relation between CEO ability increases and
fund performance. Specifically, the performance of mutual funds run by skilled managers is
positively and significantly associated with the performance of firms experiencing large CEO
ability improvement (0.19, P = 0.003 based on the selectivity measure, controlling for lagged
fund selectivity; 0.07, P = 0.045 based on the BvanB skill measure, controlling for lagged fund
BvanB skill). The opposite pattern is observed when firms experience CEO ability declines,
especially when the BvanB alpha and BvanB skill measures are used. In sum, these results
suggest that skilled fund managers’ performance is linked with CEO managerial ability changes,
implying that the stock picking decisions of highly skilled fund managers based on the high CEO
managerial ability strategy (preference) contribute significantly to fund alpha. That is, the
investment exposure of skilled fund managers to the stocks of firms headed by high-ability CEOs
pays off.
ROBUSTNESS CHECKS
Fund portfolios sorted by high managerial ability (MA-Score) stocks
Our earlier results provide support for the hypothesis that skilled fund managers’ value
creation is related to the performance of high managerial ability stocks. In this section, we
examine the robustness of this result by analyzing the composition of fund portfolios. The fund
portfolio information is manually collected from the Bloomberg Portfolio Analysis database. 38
Specifically, using cross-sectional analysis for each year, we investigate whether the portfolios of
highly skilled fund managers are loaded with a higher proportion of high–MA-Score stocks than
the portfolios of less-skilled fund managers. To address this, we first identify the MA-Score for
38
Only funds with full information in the 24-month estimation period and have no less than 10 stocks with MA-
Score information are included.

108
each stock held within each fund portfolio and then we calculate the value-weighted score of
each fund, as follows:
∑
∑ (5)
where FundScorej is the value-weighted MA-Score for fund j, MAScorei,j is the MA-Score of
stock i in fund j, and MarketValuei,j is the total market value of stock i in fund j. Finally, for each
fund portfolio quintile, we estimate the average FundScore value and report the results for 2012
and 2013.39
TABLE 2.9 Fund portfolio MA-Score, based on sorting on fund manager skill
This table presents the average value-weighted fund MA-Scores of each fund portfolio. Fund portfolios are formed
by sorting all funds in each year into quintiles by fund selectivity (logistic transformed 1-R2) or fund BvanB skill.
Fund selectivity (Eq. 1 and 2) and fund BvanB skill (Eq. 3) are estimated separately using 24-month monthly fund
data in current year and one year before. Within each portfolio, we estimate the portfolio MA-Score by averaging
the value-weighted average fund MA-Score of all the funds containing in the portfolio, and the value-weighted
average fund MA-Score is calculated as the sum of market value weighted MA-Scores of the stocks holding by the
fund. Fund portfolio holdings information are manually collected from Bloomberg Portfolio Analysis database, and
stock MA-Score data are available through Sarah McVay’s UW faculty website. We report the cross sectional
analysis results for the last two years of our sample period (2012 and 2013).
Fund Portfolio MA-Score
Fund Manager Skill Selectivity Skill Measure BvanB Skill Measure
2012 2013 2012 2013
Q1 (Highest Skill) 0.074 0.068
0.072 0.074
Q2 0.069 0.066
0.070 0.063
Q3 0.070 0.067
0.062 0.073
Q4 0.071 0.068
0.065 0.073
Q5 (Lowest Skill) 0.062 0.066 0.070 0.073
All 0.069 0.067 0.068 0.071
The average portfolio FundScore results, presented in Table 9, provide additional support
for our hypothesis by showing that the highest-skilled fund quintile (Q1) has the highest average
FundScore, among all five quintiles, indicating that skilled fund managers’ stock holdings are
39
The cross-sectional analysis results for other years are consistent with our findings and are available upon request.

109
associated with high managerial ability stocks. On the other hand, the portfolios of low-skilled
fund managers appear to be tilted in favor of low managerial ability stocks.
Skilled fund performance, CEO ability, and economic states
Previous studies have shown that fund managers’ value creation varies with the state of
the economy (Glode, 2011; Kosowski, 2011; Kacperczyk, van Nieuwerburgh, and Veldkamp,
2014, 2016). Specially, Kacperczyk et al. (2014, 2016) argue that mutual fund managers pick
stocks in economic expansions and time the market in recessions. Along this argument, one
would expect CEO managerial ability to be more precious for skilled fund managers during
economic expansions, since CEO managerial ability information is mainly used during fund
managers’ stock selection process. To test the sensitivity of our results, we condition our
previous regression analysis to the state of the economy. We follow Kacperczyk et al. (2014) and
use the Chicago Fed National Activity Index (CFNAI) to capture the business state. The CFNAI
is a coincident indicator of national economic activity comprising 85 macroeconomic time series.
For the whole sample period, if the CFNAI index in year t is higher (lower) than the median
number of the sample of all the index numbers, year t is defined as an economic expansion
(recession). Separately, we perform a regression of fund performance on skilled-CEO firm
performance while controlling for other fund-level control variables in economic expansions and
recessions. The results can be found in Table 10.

110
TABLE 2.10 High managerial ability stocks’ performance, skilled funds’ performance, and business states
This table reports the results of regressing high skill (selectivity and BvanB skill) fund annual alpha on
the performance of company groups with high and low CEO ability scores in economic expansions and
economic recessions, controlling for other fund characteristics. If the 12-month average Fed National
Activity Index (CFNAI) for the test year (t) is higher (lower) than the median number of all yearly 12-
month average CFNAI index numbers, we define this year as economic expansion (recession) year. The
dependent variable is the annual alpha of high selectivity (BvanB skill) funds, which are the top 20%
funds with the highest selectivity (BvanB skill) in each year. For the selectivity skill measurement, the
main independent variable is alpha of top 50% MA-Score firms, which is the average abnormal
performance of companies in high CEO ability scores group. For the BvanB skill measurement, the main
independent variable is added value of top 50% MA-Score firms, which is the average of each company’s
abnormal performance timing the company’s market capitalization at the beginning of year t in high CEO
ability scores group. Companies are sorted into two CEO ability groups (high and low) based on their
CEO ability score in prior year (t-1). Fund-level control variables contain expense ratio, log value of fund
age, fund turnover, log value of TNA, squared log value of TNA, and fund alphat-1 (BvanB alphat-1).
Sample period ranges from 1990 through 2014 for selectivity measurement and from 2003 to 2014 for
BvanB skill measurement. The P-value and adjusted R2 for each regression are also presented. ***, **, *
denotes significance at the 1%, 5% or 10% level.
Top 20% Selectivity Fund
Alpha
Top 20% BvanB Skill Fund
Alpha
Expansion
Recession
Expansion
Recession
Intercept -3.83
0.97
636.16***
451.31***
(0.478)
(0.852)
(<.0001)
(<.0001)
Alpha of Top 50% MA-Score Firms 0.46***
0.12**
(<.0001)
(0.054)
Added Value of Top 50% MA-Score Firms 0.38*** 0.21***
(0.010) (<.0001)
Fund Alphat-1 2.09***
1.35**
(0.001)
(0.044)
BvanB Alphat-1
3.43***
-3.33**
(<.0001)
(0.016)
Expense Ratio -0.54***
-0.07
-19.45
-36.84**
(<.0001)
(0.611)
(0.193)
(0.043)
Turnover -0.01*
-0.01***
0.02
-0.06
(0.071)
(0.001)
(0.897)
(0.466)
Log(Age) 0.63
-1.57**
-0.36
38.11***
(0.436)
(0.046)
(0.972)
(0.005)
Log(TNA) 0.71
1.68
-258.03***
-243.14***
(0.696)
(0.322)
(<.0001)
(<.0001)
[Log(TNA)]2 -0.06
-0.17
28.08***
28.52***
(0.683)
(0.225)
(<.0001)
(<.0001)
Strategy Control YES
YES
YES
YES
Adj. R2 0.090
0.028
0.490
0.271

111
In line with previous studies, the results in Table 10 demonstrate that, even though a
positive relation exists in both economic states, the performance of skilled mutual funds has a
markedly stronger relation with the performance of firms run by skilled CEOs during economic
expansions than in economic recessions. Using the fund selectivity measure, we find the
coefficient decreases from 0.46 (P < 0.0001) in economic expansions to 0.12 (P = 0.054) in
economic recessions, while, based on the BvanB fund skill measure, the coefficient decreases
from 0.38 (P = 0.010) in economic expansions to 0.21 (P < 0.0001) in economic recessions.
Thus, consistent with the findings of Kacperczyk et al. (2014, 2016), our results show that the
performance relation between skilled fund managers and the stocks of firms managed by skilled
CEOs is more pronounced during economic expansions than in recessions. In sum, controlling
for the state of the economy, our evidence continues to point out that skilled fund managers’
performance is reliably linked with the stocks of firms run by CEOs of high managerial ability.
Skilled fund performance, CEO ability, and fund trading strategy
We next investigate whether the positive relation between the performance of skilled
fund managers and the performance of high managerial ability that we have documented so far is
driven by certain (asset class) fund investment strategies. To address this issue, we classify
mutual funds within the highest management skill quintile into three groups based on their fund
management strategy: Growth, Value, and Blend.40
For each group, we reexamine the association
between the fund performance of the fund managers with the highest skill with the performance
of those firms run by the CEOs with the high managerial ability. The results are reported in
Table 11. When the fund selectivity measure is used, only Value strategy funds are positively
40
Within our 2,190 mutual fund sample, we have 7 types of trading strategies based on their Bloomberg trading
strategy classification, and 98% of the funds are covered in the main three strategies: Growth, Value, and Blend.
Besides that, 2% of the mutual funds have strategies of Market Neutral, Long Short, Bear Market, and no trading
strategy data.

112
and significantly associated with the stocks of firms managed by CEOs with high managerial
ability (0.22, P = 0.001), while the other two fund strategies (i.e., Growth and Blend) show a
positive but not significant (0.08, P = 0.394 for Growth strategy; 0.14, P = 0.111 for Blend
strategy) relation with high managerial ability stocks. When switched to the BvanB fund skill
measure, all three fund strategy groups show a significant positive relationship with high
managerial ability stocks (0.17, P < 0.0001 for Growth strategy; 0.15, P < 0.0001 for Value
strategy; 0.32, P < 0.0001 for Blend strategy). Since the BvanB fund skill measure, as argued by
BvanB, represents a more accurate fund management skill measure because it measures fund
performance adjusted by total assets under management, these results indicate that skilled fund
managers, no matter which fund management strategy they follow, consistently generate excess
value through their ability to recognize the value of corporate managerial ability and to pick the
stocks of firms managed by adept CEOs.
Skilled fund performance, CEO ability, and firm industry
Our last robustness check examines whether the positive relation between the
performance of skilled fund managers and high managerial ability stocks is more pronounced in
certain industries. We first group all companies based on their two-digit Standard Industrial
Classification code and then, within each industry, we assign each firm into a high or a low CEO
ability group, based on the firm’s CEO MA-Score the previous year. Then, we calculate the
average performance of firms with skilled CEOs (in the top 50% based on the prior year’s MA-
Score) in each industry annually and regress the skilled mutual fund performance on the average
performance of firms with skilled CEOs in each industry, controlling for other fund-level
variables. The coefficients with their corresponding P-values are shown in Table 12. The pattern
of these results, similar with that reported in Table 11, indicates that the relationship between

113
skilled fund manager performance and high managerial ability stocks holds across industries.
The explanations of these results are analogous to those of the results reported in Table 11. When
we use the fund selectivity to measure fund manager skill, the positive and significant relation
between the performance of skilled fund managers and high managerial ability stocks is
documented for only four industries (mining, construction, manufacturing, transportation,
communications, electric, gas, and sanitary services). However, when the BvanB fund skill
measure is used, the evidence indicates this relationship is not industry specific. While the
relation between skilled fund manager performance and high managerial ability stocks is
somewhat stronger in some industries than others, it holds across all industries.

114
TABLE 2.11 High managerial ability stocks’ performance, skilled funds’ performance, and fund trading strategies
This table reports the results of regressing high skill (selectivity and BvanB skill) fund annual alpha, grouped based
on their investment strategies (growth, value, and blend), on the performance of high managerial ability stocks,
controlling for other fund characteristics. The dependent variable is the annual alpha of high selectivity (BvanB
skill) funds, which are the top 20% funds with the highest selectivity (BvanB skill) in each year. For the selectivity
skill measurement, the main independent variable is the performance of high managerial ability stocks, which is the
average abnormal performance of stocks from companies in high CEO MA-Score group (top 50%). For the BvanB
skill measurement, the main independent variable is the average added value of top 50% MA-Score firms, which is
the average of each stock’s abnormal performance timing the company’s market capitalization at the beginning of
year t in high CEO MA-Score group (top 50%). Companies are sorted into two CEO ability groups (high and low)
based on their CEO MA-Score in prior year (t-1). Fund-level control variables contain expense ratio, log value of
fund age, fund turnover, log value of TNA, squared log value of TNA, and fund alphat-1 (BvanB alphat-1). Sample
period ranges from 1990 through 2014 for selectivity measurement and from 2003 to 2014 for BvanB skill
measurement. The P-value and adjusted R2 for each regression are also presented. ***, **, * denotes significance at
the 1%, 5% or 10% level.
Top 20% Selectivity Fund Alpha
Top 20% BvanB Skill Fund Alpha
Fund Strategy Growth Value Blend
Growth Value Blend
Intercept 1.60 8.11 -12.24
333.08** 624.25*** 398.58**
(0.820) (0.135) (0.105)
(0.014) (<.0001) (0.016)
Alpha of Top 50% MA-Score Firms 0.08 0.22*** 0.14
(0.394) (0.001) (0.111)
Added Value of Top 50% MA-Score Firms 0.17*** 0.15*** 0.32***
(<.0001) (<.0001) (<.0001)
Fund Alphat-1 1.51** 0.41 1.48*
(0.033) (0.697) (0.081)
BvanB Alphat-1
-0.95 -1.25 0.79
(0.524) (0.564) (0.522)
Expense Ratio -2.56*** -0.86 -0.16
-11.65 -16.52 -95.12***
(<.0001) (0.574) (0.167)
(0.515) (0.468) (0.001)
Turnover -0.01 -0.03*** -0.01**
-0.15 0.07 0.01
(0.206) (0.010) (0.045)
(0.195) (0.724) (0.906)
Log(Age) 0.39 -1.06 -2.46**
23.70 19.48 8.72
(0.700) (0.177) (0.034)
(0.110) (0.185) (0.630)
Log(TNA) 0.32 -1.68 7.49***
-186.21*** -294.66*** -182.61***
(0.890) (0.283) (0.007)
(<.0001) (<.0001) (0.001)
[Log(TNA)]2 -0.01 0.11 -0.71***
22.83*** 32.14*** 23.85***
(0.951) (0.372) (0.004)
(<.0001) (<.0001) (<.0001)
Adj. R2 0.063 0.046 0.047
0.291 0.342 0.362

115
TABLE 2.12 High managerial ability stocks’ performance, skilled funds’ performance, and stock industries
This table reports the coefficients between the performance of high managerial ability stocks in different industries
and the performance of funds having high skill (selectivity and BvanB skill) managers. Companies are sorted into
industry groups based on their 2-digit SIC code. Within each group, companies are sorted into two CEO ability
subgroups (high and low) based on their CEO MA-Score in prior year (t-1). The dependent variable is the annual
alpha of high selectivity (BvanB skill) funds, which are the top 20% funds with the highest selectivity (BvanB skill)
in each year. For the selectivity skill measurement, the main independent variable is the performance of high
managerial ability stocks, which is the average abnormal performance of stocks from companies in high CEO MA-
Score group (top 50%). For the BvanB skill measurement, the main independent variable is the average added value
of top 50% MA-Score firms, which is the average of each stock’s abnormal performance timing the company’s
market capitalization at the beginning of year t in high CEO MA-Score group (top 50%). Companies are sorted into
two CEO ability groups (high and low) based on their CEO MA-Score in prior year (t-1). Fund-level control
variables contain expense ratio, log value of fund age, fund turnover, log value of TNA, squared log value of TNA,
and fund alphat-1 (BvanB alphat-1). Sample period ranges from 1990 through 2014 for selectivity measurement and
from 2003 to 2014 for BvanB skill measurement. The P-values for each coefficient are also presented. ***, **, *
denotes significance at the 1%, 5% or 10% level.
Industry Division Top 20% Selectivity Fund Alpha Top 20% BvanB Skill Fund Alpha
agriculture, forestry and fishing 0.00 0.26***
(0.678) (<.0001)
mining 0.05*** 0.78***
(<.0001) (<.0001)
construction 0.03*** 0.02***
(0.010) (<.0001)
manufacturing 0.13*** 0.46***
(0.007) (<.0001)
transportation, communications, electric, gas
and sanitary service
0.14*** 0.49***
(<.0001) (<.0001)
wholesale trade 0.00 0.31***
(0.881) (<.0001)
retail trade 0.01 0.44***
(0.567) (<.0001)
finance, insurance and real estate 0.00 0.45***
(0.898) (<.0001)
services 0.04 0.50***
(0.187) (<.0001)
non-classifiable 0.00** 0.25***
(0.042) (<.0001)
116
CONCLUSION
In this paper, we examine whether the value created by skilled fund managers can be
attributed to the performance of high managerial ability stocks. Prior research on CEO ability has
shown a strong prediction power of CEOs’ managerial skill in future firm performance. We
hypothesize that this predictive power makes CEO’s managerial ability valuable for mutual fund
managers and using CEOs’ high managerial ability as an identification strategy should be
associated with superior mutual fund performance, especially for funds managed by highly
skilled fund managers. Hence, a significant positive connection should exist between the
performance of mutual funds run by skilled managers and the performance of high managerial
ability stocks.
Consistent with this prediction, this paper shows that the excess value added generated by
mutual fund managers with exposure to high managerial ability stocks ($3.47 million per year) is
much higher than the average performance of all mutual funds (-$1.94 million per year).
Consequently, this research provides strong evidence that the performance of high managerial
ability stocks has strong explanatory power for the performance of actively managed mutual
funds headed by highly skilled fund managers. Furthermore, this positive relation exists for
stocks across all industries and for funds with different types of trading strategies.
The results of this paper enable us to characterize the private information used by skilled
fund managers and to suggest that their stock selection is based on information about the level of
CEO managerial ability, while previous research mainly focuses on firm- and industry-level
explanations. In sum, our research suggests that skilled mutual fund managers’ superior
performance (alpha) stems from allocating capital in corporations run by CEOs with high
managerial skill.

117
REFERENCES
Allen, F. & Babus, A. (2008). Networks in finance. Available at SSRN.
Amihud, Y. & Goyenko, R. (2013). Mutual fund's R2 as predictor of performance. Review of
Financial Studies 26(3): 667-694.
Andreou, P. C., Ehrlich, D., Karasamani, I., & Louca, C. (2015). Managerial ability and firm
performance: Evidence from the global financial crisis. Available at SSRN.
Baik, B. O. K., Farber, D. B., & Lee, S. S. (2011). CEO ability and management earnings
forecasts. Contemporary Accounting Research 28(5), 1645-1668.
Berk, J. B. & Green, R. C. (2002). Mutual fund flows and performance in rational markets.
National Bureau of Economic Research.
Berk, J. B. & van Binsbergen, J. H. (2015). Measuring skill in the mutual fund industry. Journal
of Financial Economics 118(1): 1-20.
Bertrand, M. & Schoar, A. (2002). Managing with style: The effect of managers on firm policies.
Available at SSRN.
Bonsall IV, S. B., Holzman, E. R., & Miller, B. P. (2016). Managerial Ability and Credit Risk
Assessment. Management Science 2016 May 2.
Brands, S., Brown, S. J., & Gallagher, D. R. (2005). Portfolio concentration and investment
manager performance. International Review of Finance, 5(3‐4), 149-174.
Carhart, M. M. (1997). On persistence in mutual fund performance. The Journal of
finance, 52(1), 57-82.
Cohen, L., Frazzini, A., & Malloy, C. (2007). The small world of investing: Board connections
and mutual fund returns. NBER Working Paper.
Cremers, K. J., Martijn, M. A. F., Pedro, P. M., & Laura, T. S. (2015).Indexing and Active Fund
Management. Available at SSRN.
Cremers, K. M. & Petajisto, A. (2009). How active is your fund manager? A new measure that
predicts performance. Review of Financial Studies. 22(9): 3329-3365.
Daniel, K., Grinblatt, M., Titman, S., & Wermers, R. (1997). Measuring mutual fund
performance with characteristic‐based benchmarks. The Journal of finance, 52(3), 1035-
1058.
Demerjian, P., Lev, B., & McVay, S. (2012). Quantifying managerial ability: A new measure
and validity tests. Management Science, 58(7), 1229-1248.

118
Fama, E. F., & French, K. R. (1993). Common risk factors in the returns on stocks and
bonds. Journal of financial economics. 33(1), 3-56.
Glode, V. (2011). Why mutual funds “underperform”. Journal of Financial Economics. 99(3):
546-559.
Gruber, M. J. (1996). Another puzzle: The growth in actively managed mutual funds. The
Journal of Finance. 51(3): 783-810.
Kacperczyk, M., Nieuwerburgh, S. V., & Veldkamp, L. (2014). Time‐Varying Fund Manager
Skill. The Journal of Finance. 69(4), 1455-1484.
Kacperczyk, M. & Seru, A. (2007). Fund manager use of public information: New evidence on
managerial skills. The Journal of Finance. 62(2): 485-528.
Kacperczyk, M., Sialm, C., & Zheng, L. (2005). On the industry concentration of actively
managed equity mutual funds. The Journal of Finance. 60(4), 1983-2011.
Kacperczyk, M., Van Nieuwerburgh, S., & Veldkamp, L. (2016). A rational theory of mutual
funds' attention allocation. Econometrica. 84(2), 571-626.
Kosowski, R. (2011). Do mutual funds perform when it matters most to investors? US mutual
fund performance and risk in recessions and expansions. The Quarterly Journal of
Finance. 1(03): 607-664.
Pan, Y., Wang, T. Y., & Weisbach, M. S. (2015). Learning about CEO ability and stock return
volatility. Review of Financial Studies, hhv014.
Stambaugh, R. F., Yu, J., & Yuan, Y. (2014). The long of it: Odds that investor sentiment
spuriously predicts anomaly returns. Journal of Financial Economics, 114(3), 613-619.
Trueman, B. (1986). Why do managers voluntarily release earnings forecasts? Journal of
accounting and economics. 8(1): 53-71.
Van Nieuwerburgh, S. & Veldkamp, L. (2009). Information immobility and the home bias
puzzle. The Journal of Finance. 64(3): 1187-1215.
Wermers, R., Yao T., & Zhao J. (2012). "Forecasting stock returns through an efficient
aggregation of mutual fund holdings." Review of Financial Studies 25.12: 3490-3529.
Zheng, L. (1999). Is money smart? A study of mutual fund investors' fund selection ability. The
Journal of Finance. 54(3): 901-933.

119
APPENDIX 2.I Vanguard Index funds
This table shows the list of Vanguard Index funds used to calculate the alternative market benchmark, which is the
alternative investment opportunity set. The tickers and inception date are also included. The data for each index fund
are collected from Bloomberg database ranging from December 2000 to December 2014 when all of 11 index funds’
data are available.
Fund Name Ticker Inception Date
S&P 500 Index VFINX 08/31/1976
Extended Market Index VEXMX 12/21/1987
Small-Cap Index NAESX 01/01/1990
European Stock Index VEURX 06/18/1990
Pacific Stock Index VPACX 06/18/1990
Value Index VVIAX 11/02/1992
Balanced Index VBINX 11/02/1992
Emerging Markets Stock Index VEIEX 05/04/1994
Mid-Cap Index VISMX 05/21/1998
Small-Cap Growth Index VISGX 05/21/1998
Small-Cap Value Index VISVX 05/21/1998

120
APPENDIX 2.II CEO managerial ability and firm’s stock performance
This table reports the results of regressing firm’s stock alpha on this firm’s CEO MA-Score score in previous year
controlling for other firm level characteristics. The dependent variable is firm alpha, which is the difference between
stock excess return (over risk free rate) in year t and the expected excess return of the same year. The expected
excess return for each stock in year t is calculated by multiplying the FFC model factor loadings from the 24 month
preceding estimation period (t-2 to t-1) by the FFC model factors in current year. This process is repeated by moving
the estimation and test period one year at a time. The main independent variables are CEO MA-Score in previous
year (t-1), which is introduced by Demerjian et al. (2012) and available online, and stock alphat-1, which is the
intercept from the 24 month preceding estimation period (t-2 to t-1). Firm-level control variables contain firm total
debt to total equity ratio (D/E ratio), return on equity (ROE), market to book ratio (M/B ratio), and market
capitalization. Sample period covers from 1990 through 2014. We show the regression results with and without
alphat-1 and results with and without industry control. We present the P values and adjusted R2 for each regression.
***, **, * denotes significance at the 1%, 5% or 10% level.
Firm Alpha
Intercept 13.12* 13.12*
(0.068) (0.068)
CEO MA-Score 4.14* 4.12*
(0.093) (0.096)
Firm Alphat-1 0.02
(0.840)
D/E Ratio 0.01*** 0.01***
(<.0001) (<.0001)
M/B Ratio -0.32*** -0.32***
(<.0001) (<.0001)
ROE 0.01 0.01
(0.455) (0.470)
Log(Size) -3.05*** -3.05***
(<.0001) (<.0001)
Industry Control YES YES
Adj. R2 0.013 0.012

121
APPENDIX 2.III Fund management skill and fund performance
This table reports the results of regressing fund performance on fund manager’s skill, controlling for other fund
characteristics. In regression [1] and [2], the dependent variable is fund annual alpha, which is the difference
between fund excess return (over risk free rate) in year t and the expected excess return of the same year. The
expected excess return for each fund in year t is calculated by multiplying the FFC model factor loadings from the
24 month preceding estimation period by the FFC model factors in current year. This process is repeated by moving
the estimation and test period one year at a time. The main independent variables are fund selectivity, which is the
logistic transformed value of (1-R2
t-1), and fund alphat-1, which is the intercept from the 24 month preceding
estimation period. In regression [3] and [4], the dependent variable is fund’s BvanB alpha, which is the product of
fund total net assets (TNA) in year t-1 and the difference between fund excess return (over T-bill rate) in year t and
the expected excess return of the same year. The expected excess return for each fund in year t is calculated by
multiplying the 11 Vanguard Index fund orthogonal bases factor loadings from the 24 month preceding estimation
period (t-2 to t-1) by the 11 Vanguard Index fund orthogonal bases factors in current year. The process repeats by
moving the estimation and test period one year at a time. The main independent variable is fund BvanB skill, which
is measured as the product of fund alphat-1 and fund TNA at the beginning of the last year (t-1) in the estimation
period (t-2 to t-1) divided by the standard error of the fund alphat-1. Fund-level control variables for all regressions
contain expense ratio, log value of fund age, fund turnover, log value of TNA, squared log value of TNA, and
BvanB alphat-1, which is the product of fund alphat-1 and fund TNA at the beginning of the last year (t-1) in the
estimation period (t-2 to t-1) and fund alphat-1 is the intercept from the 24 month preceding estimation period (t-2 to
t-1). The P-value and adjusted R2 for each regression are also presented. ***, **, * denotes significance at the 1%,
5% or 10% level.
Fund Alpha BvanB Alpha
[1] [2] [3] [4]
Intercept 0.83 0.26 743.39*** 743.25***
(0.562) (0.854) (<.0001) (<.0001)
Fund TSelectivity 0.50*** 0.37*
(0.010) (0.052)
Fund Alphat-1
1.34***
(<.0001)
Fund BvanB Skill
1.36*** 1.38***
(<.0001) (<.0001)
BvanB Alphat-1 -0.07
(0.847)
Expense Ratio -0.30*** -0.25*** -20.25*** -20.29***
(<.0001) (0.001) (<.0001) (<.0001)
Log(TNA) 0.35 0.40 -0.02 -0.02
(0.460) (0.397) (0.309) (0.308)
[Log(TNA)]2 -0.04 -0.04 14.50*** 14.49***
(0.360) (0.309) (<.0001) (<.0001)
Turnover -0.01*** -0.01*** -333.22*** -333.13***
(<.0001) (<.0001) (<.0001) (<.0001)
Log(Age) -0.37* -0.33 35.83*** 35.82***
(0.086) (0.127) (<.0001) (<.0001)
Strategy Control YES YES YES YES
Adj. R2 0.011 0.016 0.330 0.330

122
APPENDIX 2.IV High and low CEO MA-Score and skilled funds’ performance
This table reports the results of regressing high selectivity (BvanB skill) fund annual alpha on the average MA-
Score in high and low CEO managerial ability groups. The dependent variable is the annual alpha of high selectivity
(BvanB skill) funds, representing the top 20% funds with the highest selectivity (BvanB skill) in each year. The
main independent variables are high MA-Score *1,000 and low MA-Score*1,000, which are the average CEO MA-
Score of companies in high CEO MA-Score group and low MA-Score group, timing 1,000. Companies are sorted
into two groups (high and low) based on their CEO MA-Scores in prior year (t-1). The process repeats by moving
the estimation and test period one year at a time. Fund-level control variables contain expense ratio, log value of
fund age, value of total net assets (TNA), and squared log value of TNA. Sample period covers from 1990 through
2014 for selectivity measure and from 2003 to 2014 for BvanB skill measure. We present the P values and adjusted
R2 for each regression. ***, **, * denotes significance at the 1%, 5% or 10% level.
Top 20% Selectivity
Fund Alpha
Top 20% BvanB Skill
Fund Alpha
Intercept -44.97*** -614.81**
(<.0001)
(0.044)
High MA-Score *1,000 0.18***
4.49***
(<.0001)
(<.0001)
Low MA-Score *1,000 -0.23***
-6.63***
(<.0001)
(<.0001)
Fund Alphat-1 1.69***
(<.0001)
BvanB Alphat-1
0.59
(0.499)
Expense Ratio -0.26**
-36.50**
(0.011)
(0.004)
Turnover -0.01***
-0.08
(<.0001)
(0.264)
Log(Age) -0.92
16.48*
(0.106)
(0.071)
Log(TNA) 1.16
-268.21***
(0.352)
(<.0001)
[Log(TNA)]2 -0.12
29.02***
(0.263)
(<.0001)
Strategy Control YES
YES
Adj. R2 0.045 0.313

123
CHAPTER 3
THE PAYBACK OF MUTUAL FUND SELECTIVITY: EVIDENCE FROM EUROPEAN
COUNTRIES
ABSTRACT
Using a sample of 2,947 actively-managed domestic equity mutual funds from 11
European countries, we investigate the performance of mutual fund selectivity across markets.
The evidence of this paper supports the argument that selectivity (1-R2) still benefits fund
investors outside US. Our analysis is robust after controlling for investor sentiment and market
dispersion. In addition, we investigate the mediating effect of country characteristics on the
profitability of fund selectivity, indicating that managers’ selectivity ability is more valuable in
countries with high economic development, strong legal strength, small but highly liquid equity
markets, and young mutual fund industries.
INTRODUCTION
Since their invention in 1924, mutual funds have become an increasingly important
investment instrument and attract a large amount of capital from individual investors to the
financial markets. By the end of 2014, the total value of assets managed by mutual funds
exceeded US$31 trillion, which reflected a 20% growth rate since 2007 (Investment Company
Institute, 2015). With a value of US$16 trillion, the United States has the largest mutual fund
industry in the world. Numerous studies have confirmed the extremely important role of the
mutual fund industry in US financial markets, showing the relation between US mutual fund
performance and fund managers’ skills ( Malkiel, 1995; Carhart, 1997; Daniel, Grinblatt,
Titman, and Wermers, 1997; Brands, Brown, and Gallagher, 2005; Kacperczyk, Sialm, and
Zheng, 2005; Cremers and Petajisto, 2009; Berk and van Binsbergen, 2015; Cremers, Ferreira,

124
Amihud and Goyenko, 2015). However, only a few studies have explored these questions in
other settings, such as European countries.
This gap is noteworthy because the mutual fund industry in Europe is the second largest
mutual fund industry in the world. As of the end of 2014, the European mutual fund industry had
more than US$9.5 trillion in assets under management, which is 31% of the world’s total mutual
fund industry. Among the current mutual funds worldwide, 44% are from European countries.
Meanwhile, the net sale of European mutual funds in 2014 was US$617 billion, more than twice
that in 2013, while the net sale of mutual funds in the United States was US$318 billion. Given
the important role the European mutual fund industry plays in the world economy and its
dramatic growth in recent years, academic studies of its workings are very relevant but lacking.
In this paper, we investigate whether fund selectivity, an established measure of fund
management skill, is associated with superior fund performance for actively managed domestic
equity mutual funds in European countries.
Several studies have investigated the determinants of fund performance in the European
mutual fund industry, but only at a very macro level. Both Grünbichler and Pleschiutschnig
(1999) and Otten and Bams (2002) have conducted aggregate research on the European mutual
fund industry’s performance and Otten and Bams (2002) find that, unlike US mutual funds,
European mutual funds as a whole slightly outperform the market benchmark. Banegas, Gillen,
Timmermann, and Wermers (2013) show that European mutual fund performance can be
explained by macroeconomic state variables, such as the default yield spread, the term spread, or
the dividend yield. Ferreira, Keswani, Miguel, and Romos (2012), using the data of actively
managed equity mutual funds from 27 countries, find that both fund-level variables and country
characteristics can determine fund performance and, in particular, mutual funds show superior

125
performance if they are located in countries with highly liquid markets and strong legal
protection. Many other studies focus on specific European countries (e.g., Dermine and Roller,
1992; Shukla and van Imwegen, 1995; Blake and Timmermann, 1998; Dahlquist, Engstrom, and
Soderlind, 2000; Cesari and Panetta, 2002). However, these focus on evaluating the overall
performance of the European mutual fund industry and more valuable questions from the
investor’s perspective—whether fund management skills exist and whether managers with higher
skills can generate more profits for their clients—have received less attention from academia.
Abinzano, Muga, and Santamaria (2010) use stochastic dominance techniques to show that some
European mutual fund managers do possess management skills. Cuthbertson, Nitzsche, and
O’Sullivan (2008) employ a cross-sectional bootstrap methodology and find evidence that some
top-performing UK equity mutual fund managers have stock-picking abilities. Furthermore,
Franck and Kerl (2013) point out that European fund managers actively change their portfolio
allocations based on sell-side analyst information and this strategy benefits fund performance.
However, as far as we know, no study has been conducted to measure European mutual fund
managers’ skill (i.e., fund selectivity) directly and there is no evidence that managerial skill leads
to superior fund performance. The aim of our analysis is to address those issues.
Empirical studies based on the US mutual fund industry show that mutual fund managers
with high managerial skills do add value for their clients by selecting valuable stocks (Gruber,
1996; Carhart, 1997; Daniel et al., 1997; Zheng, 1999). The skill may be due to their superior
analytical ability to anticipate macro or micro fundamental information (Kacperczyk, van
Nieuwerburgh, and Veldkamp, 2011) or special knowledge of specific industries or companies
(Cohen, Frazzini, and Malloy, 2007; Kacperczyk et al., 2005). Petajisto (2013) uses active share,
which is measured as the aggregate stock-holding dispersion between a manager’s portfolio and

126
the benchmark index, to capture fund managers’ selectivity skill and finds a strong relation
between active management and fund performance. Amihud and Goyenko (2013), using a lower
fund R2 value from regressing its returns on multifactor benchmark models to proxy for higher
selectivity skill, find similar results. One advantage of Amihud and Goyenko’s method is that it
does not require the knowledge of fund holdings or the fund’s benchmark index. Following their
methodology and using a special sample of 2,947 actively managed domestic equity mutual
funds from 11 European countries over the years 2000–2015, we add to this literature by
estimating fund manager’s stock-picking skill directly and investigating the relation between
managerial skills and fund performance. To measure fund manager skill, we first construct the
benchmark factors in the Fama–French (1993) and Carhart (1997) four-factor model (FFC
model) for each individual country, using all the stocks included in the Bloomberg database, and
calculate fund selectivity following Amihud and Goyenko (2013). Our analysis reveals evidence
that, as in the US mutual fund industry, a significantly positive relationship exists between fund
selectivity and fund performance in the European mutual fund industry.
Subsequently, our analysis is robust to adjusting for two market conditions, investor
sentiment and market dispersion, which can strongly influence fund performance. First, investors
are not consistently rational and investor sentiment can influence the profitability of a fund
manager’s skill. Previous literature on investor sentiment has shown that it can affect both
overall market returns and individual stock returns (Daniel, Hirshleifer, and Subrahmanyam,
1998; Hong and Stein, 1999; Amromin and Sharpe, 2009; Antoniou, Doukas, and
Subrahmanyam, 2015). During high-sentiment periods, the equity market is filled with greater
noise than during low-sentiment periods. Hence, asset prices are more likely to be noisy and it is
more difficult to identify good investment opportunities. On average, stock-picking ability

127
during high-sentiment periods is limited, thus resulting in fund underperformance. During low-
sentiment periods, stocks are traded around their fundamental values and overall mutual fund
performance should be higher during low-sentiment periods, when asset prices are less noisy.
The above argument indicates that the relation between fund selectivity and fund performance
should be affected by market sentiment. We estimate market sentiment for each country based on
the European market Consumer Confidence Indicator (CCI) and further test the sensitivity of our
results by replacing the major sentiment index with four alternative market sentiment measures.
The results show the same trend as our previous findings.
Second, von Reibnitz (2013) shows that market dispersion, which is used to measure the
level at which stocks prices are affected by firm-specific information, can also influence the
market state and consequently impact the effectiveness of fund manager skill. If fund manager
skills result from their great insight and analytical ability, average mutual funds cannot yield
high risk-adjusted returns during periods of low market dispersion when access to firm-specific
information is costly. Thus, mutual fund manager selectivity should be more profitable during
periods of high market dispersion, when more firm-specific information is available in the
market. Our results also support this argument.
Next, we study how the profitability of fund selectivity relates to country-level
characteristics. Unlike previous studies, which examine the direct effects of country-level
variables on fund performance (e.g., Ferreira et al., 2012), we argue that those factors, such as
equity market development or legal protection strength, could influence the validity of fund
manager skills, which consequently affect mutual fund performance. To address this question,
we employ a two-step regression procedure and find that fund manager skill is more valuable
and profitable for fund investors if the fund is in countries with high economic development,

128
strong legal protection, small but highly liquid equity markets, and a young mutual fund
industry.
The remainder of the paper is organized as follows. Section 1 describes the data and empirical
methodology. Section 2 presents the empirical findings, along with a discussion of the results.
Section 3 concludes with a discussion of the implications of this study for the literature on
mutual fund performance and managerial skill.
DATA AND METHODOLOGY
In this section, we describe our sample selection process and then present the methodology
used to calculate fund performance and fund selectivity. Lastly, we explain the other market
variables and country-level characteristics in our analysis.
Sample Description
We first collect data for European actively managed domestic equity mutual funds. The
source is Bloomberg mutual fund database and the time period is from January 1998 to
December 2015 (the first 24 months of data are used to estimate fund selectivity and fund
performance as of January 2000). The criteria used to collect data are 1) whether the fund status
is active or dead, 2) whether the country of domicile is European, 3) whether the asset focus is
equity, 4) whether the inception date is before December 31, 2013, and 5) whether the fund type
is an open-end mutual fund. To eliminate index funds or international funds, funds with a
description containing any of the partial terms are deleted: index, ind, global, fixed-income,
international, sector, balanced, bond, money-market, and convertible debt. In addition, each fund
must have more than 25 months of continuous data. Our final sample consists of 3,388 mutual
funds from 17 European countries. The list of countries and the numbers of mutual funds in each
country is shown in Table 1.

129
TABLE 3.1 List of European countries in the database
This table lists all the European countries in Bloomberg with actively-managed domestic equity mutual
fund database, along with the number of mutual funds within each country. Totally we have 3,388
actively-managed European domestic equity mutual funds, both active and dead status, from January
2000 to December 2015.
Country Number of Funds
Austria 371
Belgium 13
Denmark 138
Finland 156
France 15
Germany 339
Greece 74
Ireland 641
Italy 308
Luxembourg 207
Netherlands 111
Norway 83
Portugal 49
Spain 399
Sweden 147
Switzerland 185
United Kingdom 152
Total 3,388
To ensure reliable results, we narrow down the list of countries to those with more than
100 months of available mutual funds data. Of the 17 European countries, 12 remain. We then
delete Luxembourg, because it often functions as an offshore mutual fund market for other
countries. Finally, we have 11 countries in the database, with 2,947 actively managed mutual
funds. The summary statistics for these funds are reported in Table 2. The average monthly raw

130
return for all European mutual funds is 0.49%, Sweden has the highest average monthly return
(0.81%), and Austria has the lowest (0.36%). The average of total net assets (TNA) for all funds
in the sample is US$235.15 million and the average age is 10.11 years.
TABLE 3.2 Summary statistics of actively managed equity mutual funds’ characteristics from 11 selected
European countries
This table shows the means of mutual funds’ descriptive statistics in each country and the number of
funds from each country for 11 European countries with more than 100 mutual funds data in Bloomberg
actively-managed domestic mutual fund database. Expense ratio is the annual expense ratio of each fund.
TNA is each fund’s total net assets in millions. Our sample contains 2,947 actively-managed equity
mutual funds over the period from January 1998 to December 2015.
Country Age (years) TNA (Million $) Expense Ratio (%) Raw Return (%) Number of Funds
Austria 10.87 81.93 1.68 0.36 371
Denmark 13.19 173.71 1.93 0.78 138
Finland 8.66 169.66 1.84 0.51 156
Germany 11.69 208.98 2.27 0.57 339
Ireland 7.74 599.02 1.83 0.46 641
Italy 10.90 181.62 2.24 0.39 308
Netherlands 10.93 170.71 1.57 0.57 111
Spain 8.98 76.20 2.05 0.41 399
Sweden 14.17 433.88 1.63 0.81 147
Switzerland 11.13 186.60 1.73 0.54 185
United Kingdom 7.98 171.96 1.83 0.59 152
All 10.11 235.15 1.95 0.49 2,947
Measuring Fund Selectivity and Performance
The next step is to estimate fund performance (fund alpha) and fund selectivity for all
mutual funds in our sample. Following Amihud and Goyenko (2013), we use 1 - R2 to measure
fund selectivity, where R2 is obtained from regressing each fund’s returns on the multifactor
benchmark model (i.e., the FFC model). According to this study, a low R2
value indicates that
fund performance has a low level of co-movement with the market benchmark and the higher a
manager’s selectivity skill, the more private information the manager will use and the less
sensitive the fund’s performance will be to market benchmark movement. The model to estimate
R2 is the following:

131
(1)
where Ri,t is the return in US dollars of fund i in month t over the one-month US Treasury bill
rate in month t; RMt - Rft is the market excess return in US dollars in month t; SMBt (small minus
big) is the return difference between a large capitalization portfolio and a small capitalization
portfolio in month t; HMLt (high minus low) is the return difference between a high–book-to-
market ratio portfolio and a low book-to-market ratio portfolio in month t; and MOMt
(momentum) is the return difference between the past 12 months’ winners and the past 12
months’ losers. To employ this model, we first construct the monthly benchmark factors from the
FFC model for each country using all equity values included in the Bloomberg equity database
traded in each country. The variable RM is calculated as the value-weighted average return of all
stocks, active or dead. We then form the SMB, HML, and MOM factors following the method
described by Fama and French (1993) and Carhart (1997). To test the validity of our estimation,
we calculate the correlation between each market return factor and the same country’s major
market index return.41
The summary statistics are shown in Table 3.
41 The following are the major markets: Austrian Traded Index (ATX Index) for Austria, OMX Copenhagen Index (KFX Index)
for Denmark, OMX Helsinki Index (HEX Index) for Finland, German Stock Index (DAX Index) for Germany, Irish Stock
Exchange Overall Index (ISEQ Index) for Ireland, FTSE Italia All-Share Index (FTSEMIB Index) for Italy, Amsterdam
Exchange index (AEX Index) for the Netherlands, Spanish Continuous Market Index (IBEX Index) for Spain, Stockholm Stock
Exchange Index (OMX Index) for Sweden, Swiss Market Index (SMI Index) for Switzerland, and FTSE 100 Index (UKX Index)
for the United Kingdom.

132
TABLE 3.3 Market risk factor summary and correlations between market premium and major market index
return for each country
This table gives the average of the risk factors in the estimated Fama-French (1993) and Carhart (1997)
model (FFC model) for each country. The table also shows the coefficient between the market return
factor (RM) and the major market index return for each country. (Austrian Traded Index (ATX Index) for
Austria, OMX Copenhagen Index (KFX Index) for Denmark, OMX Helsinki Index (HEX Index) for
Finland, German Stock Index (DAX Index) for Germany, Irish Stock Exchange Overall Index (ISEQ
Index) for Ireland, FTSE Italia All-Share Index (FTSEMIB Index) for Italy, Amsterdam Exchange index
(AEX Index) for Netherlands, Spanish Continuous Market Index (IBEX Index) for Spain, Stockholm
Stock Exchange Index (OMX Index) for Sweden, Swiss Market Index (SMI Index) for Switzerland, and
FTSE 100 Index (UKX Index) for United Kingdom). *** stands for Pearson’s P value at 1% significant
level.
Country RM SMB HML MOM Market Index Correlation
Austria 1.203 -0.238 0.150 0.510 ATX Index 0.928***
Denmark 1.774 0.388 -1.008 0.698 KFX Index 0.868***
Finland 1.548 -0.170 0.296 0.555 HEX Index 0.987***
Germany 1.111 1.032 1.152 0.873 DAX Index 0.926***
Ireland 0.969 -0.325 0.166 0.062 ISEQ Index 0.749***
Italy 0.637 -0.063 1.293 0.101 FTSEMIB Index 0.963***
Netherlands 0.800 0.018 -0.158 0.581 AEX Index 0.951***
Spain 0.951 0.113 0.748 0.660 IBEX Index 0.972***
Sweden 1.315 0.184 0.306 0.531 OMX Index 0.985***
Switzerland 0.994 -0.192 0.393 0.332 SMI Index 0.865***
United Kingdom 0.787 0.390 0.284 0.656 UKX Index 0.966***
All 1.099 0.103 0.329 0.505
Std. Dev. 0.341 0.391 0.622 0.249
We calculate fund performance (the fund’s alpha), past performance (the fund’s alphat-1),
and fund selectivity (logistically transformed 1 - R2) using a 24-month moving window
regression based on the estimated FFC model for each individual country. The fund alpha is the
difference between the fund’s return in month t and the expected return of the same month. The
expected return for each fund in month t is calculated by multiplying the FFC model factor
loadings from the preceding 24-month estimation period (months t - 24 to t - 1) by the FFC
model factors in the current month. The process repeats by moving the estimation and test period
one month at a time. The fund’s alphat-1 is the intercept from the preceding 24-month estimation
period (months t - 24 to t - 1). As Amihud and Goyenko (2013) explain, the distribution of R2 is
133
negatively skewed, which means that the distribution of 1 - R2 should be heavily positively
skewed. Therefore, we use the following logistic transformation of (1 - R2) to measure fund
manager selectivity skill:
(
) (
) (2)
One thing to be noted here is that, based on the argument of Berk and Green (2004), the
performance measure based on fund return (the fund’s alpha) is inaccurate due to economic
scale, since superior performance can be detected by investors and abstract capital inflows.
Consequently, managers with more capital must choose suboptimal investment opportunities due
to the limited number of investment opportunities in the market, which harms fund performance.
However, Ferreira et al. (2012) show that this scale effect is not present outside the US mutual
fund industry.
Investor Sentiment and Market Dispersion
In this section, we estimate market sentiment and market dispersion and incorporate these
two factors into the analysis. We argue that, on average, high market sentiment signals a high
level of noise trader participation, which will hurt the performance of the overall mutual fund
industry because the asset prices are more likely to be noisy and, therefore, it will be more
difficult to identify good investment opportunities. To measure European market sentiment, we
use the CCI, a survey-based index designed to measure consumer confidence in European
countries. This index is available through the European Commission database. To ensure that the
sentiment measure is free of macroeconomic influences, we use the residual from the regression
of the CCI index on a set of macroeconomic variables that includes Europe’s inflation rate, the
growth rate of Europe’s employment rate, the growth rate of Europe’s industrial production, the
growth rate of Europe’s durable consumer goods production, the growth rate of Europe’s

134
nondurable goods production, the consumer price index change in Europe’s service industry, and
European recession indicators based on the Organisation for Economic Co-operation and
Development (OECD). The data reflect the period from January 2000 through December 2015.
We also estimate the market dispersion for each European country in our sample. Market
dispersion, as argued by von Reibnitz (2013), measures how the level of stock price is affected
by firm-specific information. During a period of high market dispersion, more firm-specific
information is available in the market and stock prices are more affected by firm-specific
information than by market conditions. This improves the profitability of fund managers’
selectivity skills, since using private information to estimate assets value is more reliable. On the
other hand, during periods of low market dispersion, all stocks closely follow market
benchmarks. Fund selectivity may not be profitable or may even hurt fund performance, since
the benefits of active bets are expected to be less pronounced and actively building a portfolio
based on firm-specific information will draw more risk into the fund when fund performance is
more related to market-level information, such as economic shocks. Following von Reibnitz
(2013), we measure market dispersion using the standard deviation of stock returns for all stocks
in each country in month t:
√
∑ ( )
(3)
where n is the number of stocks traded within country j in month t, Ri,j,t is month t’s return for
each stock i in country j, and Rm,j,t is the equally weighted average return of all stocks traded in
country j for month t. The data for both active and delisted stocks are from the Bloomberg
database and our data for market dispersion range from January 2000 to December 2015.

135
Country-Level Characteristics
Previous studies have documented that, besides fund-level variables, country-level
characteristics are essential determinants of mutual fund performance (Otten and Bams, 2002;
Ferreira et al., 2012). Rather than investigate the direct relationship between funds’ domicile
country characteristics and fund performance, in our study we investigate whether those country-
level variables can influence the profitability of fund selectivity skills. In other words, we
examine which country-level factors will make fund managerial skills more valuable and
produce superior fund performance. To address this issue, we use a two-step regression
procedure. First, for each year from 2001 to 2015, we regress fund performance (fund alpha) on
fund selectivity, controlling for other fund-level variables using monthly data for the current year
and one year prior. Only funds with data for the full 24-month period are considered. Then we
collect the coefficients of fund selectivity for each year from the prior regression, which is used
as a proxy of fund selectivity profitability, and run a regression of the coefficients on various
country-level variables. Similar to the country-level variables used by Ferreira et al. (2012), we
classify our country characteristics into different groups: economic development, equity market
development, investor protection and legal strength, and mutual fund industry development. The
details of country-level characteristics can be found in the Appendix.
First, we use the gross domestic product (GDP) per capita and the percentage of Internet
users to capture economic development. Both sets of data are collected from the World
Development Indicators (WDI) database. The GDP per capita is the GDP divided by the mid-
year population, while the percentage of Internet users measures the percentage of individuals
who have used the Internet in each country in the last year. Greater economic development is
associated with higher income and education levels and, in our scenario, we expect a positive

136
relationship between fund selectivity, profitability, and country economic development, since
information quality should be higher with better-informed and more educated investors, which
places more value on the accuracy of fund managers’ selectivity ability.
To capture equity market development, we use equity share turnover and the total size of
equity markets. These two variables are also accessible from the WDI database. Share turnover,
which is the value of domestic shares traded divided by their market capitalization, measures the
liquidity of the equity market in each country. A higher share turnover ratio, that is, higher equity
market liquidity, will help fund managers to establish and change portfolios based on new
information. This argument indicates a positive relation between fund selectivity profitability and
the share turnover ratio. On the other hand, a large equity market size may have an ambiguous
effect on the implementation of fund managerial skills. First, a large equity market means more
investment opportunities, which allows skilled managers to find profitable investment
opportunities much more easily. On the contrary, a large equity market contains more noise,
which hinders selectivity skills from being profitable.
We use a dummy variable that equals one for a common-law country and zero otherwise to
capture common-law countries and securities regulation to capture investor protection and legal
strength. According to La Porta, Lopez-de-Silanes, Shleifer, and Vishny (1997), common-law
systems provide more protection for investors than civil-law systems do and enhance the
enforcement of business contracts. Another variable used as a proxy for a country’s legal
strength is securities regulation, which combines disclosure requirements, liability standards, and
public enforcement, introduced by La Porta Lopez-de-Silanes, and Shleifer (2006). We expect a
strong positive relationship between fund selectivity profitability and investor protection and
legal strength, since strong legal strength and strong securities market regulation limit insider
137
trading activities and promote informed arbitrage, which makes fund managerial skills based on
analytical ability more valuable (Morck, Yeung, and Yu, 1999). In addition, stock markets in
countries with weak property rights protection are more influenced by political events and
rumors, which create more noise in the markets and harm the profitability of fund managers’
selectivity ability.
Finally, we use fund industry age and the mutual fund industry’s proportion of the equity
market to capture mutual fund industry development. We collect mutual fund industry age data
from Ferreira et al. (2012). We argue that the older the mutual fund industry, the more
competitive it is and the harder it is, therefore, for fund managers to achieve superior
performance, since they will generate fewer risk-adjusted returns due to a higher market
competition. To estimate the mutual fund industry proportion, which is calculated as the
percentage of total mutual fund equity within the total capitalization of the equity market, we
collect mutual fund industry equity data from the annual Asset Management Report of the
European Fund and Asset Management Association. From our perspective, a larger mutual fund
industry proportion means a more competitive mutual fund industry, which will hurt the
profitability of fund managers’ selectivity skills.
EMPIRICAL FINDINGS
Effect of Fund Selectivity on Fund Performance
We begin our examination of whether high fund selection ability leads to superior fund
performance in the European mutual fund industry by predicting fund performance (fund alpha)
based on the fund’s selectivity, estimated using the lagged logistically translated 1 - R2. The
model we estimate is as follows:
138
(4)
The dependent variable is the fund alpha, which is the difference between the fund’s
excess return in month t and the expected excess return the same month. The expected excess
return for each fund in month t is calculated by multiplying the FFC model factor loadings from
the preceding 24-month estimation period (months t - 24 to t - 1) by the FFC model factors in the
current month. The process repeats by moving the estimation and test period one month at a
time. The main independent variable is fund selectivity, which is the logistically transformed
value of (1 - R2
t-1). Fund-level control variables contain the fund alphat-1, which is the intercept
from the preceding 24-month estimation period (months t - 24 to t - 1), the expense ratio, the log
value of fund age, the value of TNA, and the squared log value of TNA. All control variables are
lagged by one month. Following Amihud and Goyenko (2013), we report the results with and
without alphat-1 as a control variable. Our sample period ranges from January 2000 through
December 2015. If a positive relation between fund selectivity and fund performance exists in
the European mutual fund industry, as we predicted, we hypothesize that β1 >0. The regression
results are reported in Table 4.

139
TABLE 3.4 The effect of fund selectivity on fund performance
This table reports the results of regressing fund alpha on manager’s selectivity controlling for other fund
characteristics. The dependent variable is fund alpha, which is the difference between fund excess return
in month t and the expected excess return of the same month. The expected excess return for each fund in
month t is calculated by multiplying the FFC model factor loadings from the 24 month preceding
estimation period (t-24 to t-1) by the FFC model factors in current month. The process repeats by moving
the estimation and test period one month at a time. The main independent variable is fund selectivity,
which is the logistic transformed value of (1-R2t-1). Fund-level control variables contain fund alphat-1,
which is the intercept from the 24 month preceding estimation period (t-24 to t-1), expense ratio, log
value of fund age, value of total net assets (TNA), and squared log value of TNA. Sample period covers
from January 2000 through December 2015. ***, **, * denotes significance at the 1%, 5% or 10% level.
Fund Alpha
Intercept -0.194*** -0.140** -0.162** -0.083
(0.002) (0.022) (0.022) (0.241)
Fund Selectivity 0.115*** 0.090*** 0.113*** 0.088***
(<.0001) (<.0001) (<.0001) (<.0001)
Alphat-1
0.099***
0.101***
(<.0001)
(<.0001)
Expense Ratio -0.008 -0.007 -0.009 -0.008
(0.427) (0.469) (0.387) (0.407)
Log(Age) 0.130*** 0.118*** 0.131*** 0.120***
(<.0001) (<.0001) (<.0001) (<.0001)
Log(TNA) 0.063*** 0.051** 0.064*** 0.053**
(0.003) (0.016) (0.003) (0.012)
Log(TNA)2 -0.005** -0.005** -0.005** -0.005**
(0.039) (0.044) (0.038) (0.042)
Strategy Control NO NO YES YES
Adj. R2 0.12% 0.17% 0.12% 0.17%
Consistent with the above prediction, the results in Table 4 show that selectivity in all
regression specifications is positive and significantly correlated with the fund alpha (p < 0.0001).
These results present strong evidence that the positive relationship between fund selectivity and
fund performance exists in the European mutual fund industry. In addition, logistically translated

140
lagged 1 - R2
values, in accordance with the literature focusing on US mutual fund industry, can
be used to proxy fund managers’ selectivity ability.
Next, we repeat the regression, as shown by Eq. (4), for each country and we present the
coefficients of fund selectivity, along with p-values, in Table 5.
TABLE 3.5 The effect of fund selectivity on fund performance for each country
This table reports the coefficients of fund selectivity from regressing fund alpha on manager’s selectivity
controlling for other fund characteristics for each country. Sample period covers from January 2000
through December 2015. P value for each coefficient is also reported. ***, **, * denotes significance at
the 1%, 5% or 10% level.
Selectivity Coefficient
Austria 0.106***
(<.0001)
Denmark 0.127***
(0.007)
Finland -0.013
(0.819)
Germany 0.236***
(<.0001)
Ireland 0.166***
(<.0001)
Italy 0.039
(0.110)
Netherlands 0.263***
(0.002)
Spain -0.029
(0.128)
Sweden 0.146***
(<.0001)
Switzerland 0.298***
(<.0001)
United Kingdom 0.030
(0.549)
The results in Table 5 show that, of 11 European countries, seven show significantly positive
relationships between fund selectivity and fund performance. On the other hand, we find no
evidence that the above relationship exists in Finland, Italy, Spain, or the United Kingdom, but
none of the coefficients of selectivity within those four countries is significantly negative.
Jointly, these results support the hypothesis that managerial skill exists among European mutual

141
fund managers and high fund selectivity leads to better performance for European actively
managed domestic mutual funds.
Effect of Selectivity, Market Sentiment, and Market Dispersion on Fund Performance
We then re-examine the effect of fund management skill on fund performance by
incorporating market sentiment and market dispersion into the analysis. The purpose of this
analysis is to see whether selectivity still contributes to fund performance after controlling for
investor sentiment and market dispersion. First, we divide the sample periods into periods of
high and low investor sentiment based on the median number of the monthly CCI index,
orthogonalized with respect to a set of macroeconomic conditions. If month t’s CCI is higher
(lower) than the median number of the monthly CCI for all sample periods (January 2000 to
December 2015), we define month t as a period of high (low) sentiment. Then, we estimate the
model as shown in Eq. (4) in periods of high and low investor sentiment separately. The results
are shown in Table 6, columns (1) and (2), respectively. As predicted, fund selectivity has a
stronger relationship with fund performance during low-sentiment periods (0.154, p < 0.0001),
when asset prices are around fundamental values, than in high-sentiment periods (0.001, p =
0.094), when the market is filled with noisy information.
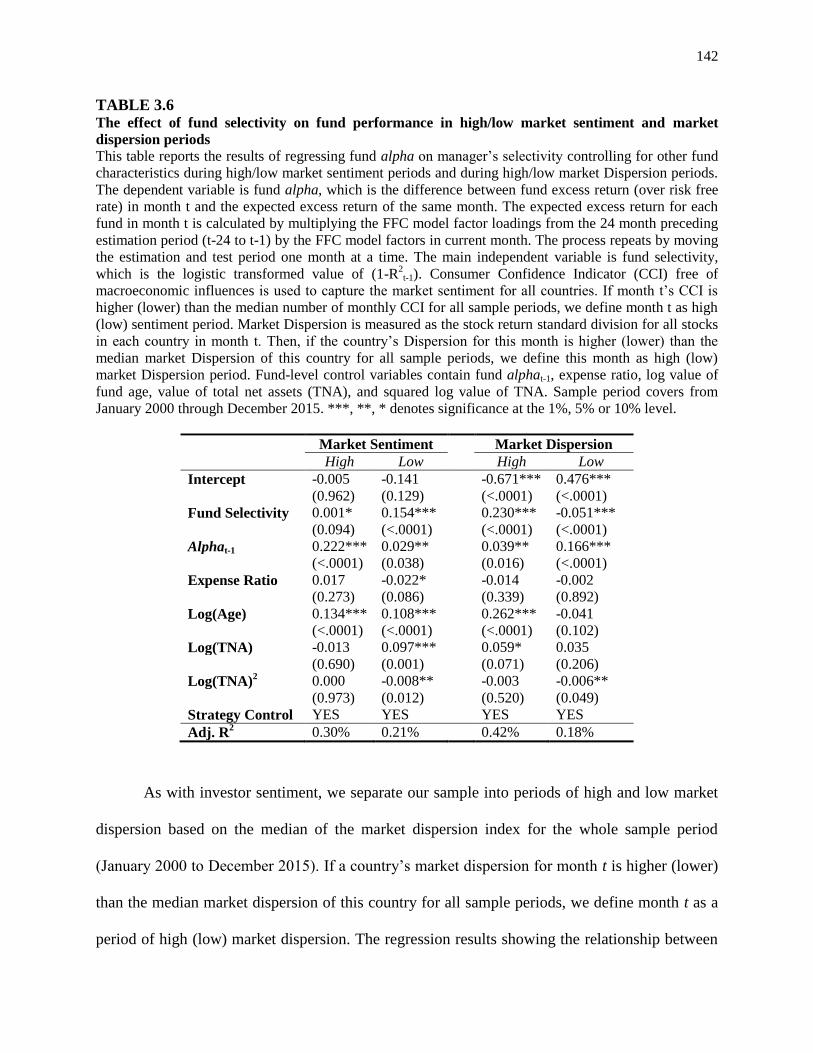
142
TABLE 3.6 The effect of fund selectivity on fund performance in high/low market sentiment and market
dispersion periods
This table reports the results of regressing fund alpha on manager’s selectivity controlling for other fund
characteristics during high/low market sentiment periods and during high/low market Dispersion periods.
The dependent variable is fund alpha, which is the difference between fund excess return (over risk free
rate) in month t and the expected excess return of the same month. The expected excess return for each
fund in month t is calculated by multiplying the FFC model factor loadings from the 24 month preceding
estimation period (t-24 to t-1) by the FFC model factors in current month. The process repeats by moving
the estimation and test period one month at a time. The main independent variable is fund selectivity,
which is the logistic transformed value of (1-R2t-1). Consumer Confidence Indicator (CCI) free of
macroeconomic influences is used to capture the market sentiment for all countries. If month t’s CCI is
higher (lower) than the median number of monthly CCI for all sample periods, we define month t as high
(low) sentiment period. Market Dispersion is measured as the stock return standard division for all stocks
in each country in month t. Then, if the country’s Dispersion for this month is higher (lower) than the
median market Dispersion of this country for all sample periods, we define this month as high (low)
market Dispersion period. Fund-level control variables contain fund alphat-1, expense ratio, log value of
fund age, value of total net assets (TNA), and squared log value of TNA. Sample period covers from
January 2000 through December 2015. ***, **, * denotes significance at the 1%, 5% or 10% level.
Market Sentiment
Market Dispersion
High Low
High Low
Intercept -0.005 -0.141
-0.671*** 0.476***
(0.962) (0.129)
(<.0001) (<.0001)
Fund Selectivity 0.001* 0.154***
0.230*** -0.051***
(0.094) (<.0001)
(<.0001) (<.0001)
Alphat-1 0.222*** 0.029**
0.039** 0.166***
(<.0001) (0.038)
(0.016) (<.0001)
Expense Ratio 0.017 -0.022*
-0.014 -0.002
(0.273) (0.086)
(0.339) (0.892)
Log(Age) 0.134*** 0.108***
0.262*** -0.041
(<.0001) (<.0001)
(<.0001) (0.102)
Log(TNA) -0.013 0.097***
0.059* 0.035
(0.690) (0.001)
(0.071) (0.206)
Log(TNA)2 0.000 -0.008**
-0.003 -0.006**
(0.973) (0.012)
(0.520) (0.049)
Strategy Control YES YES
YES YES
Adj. R2 0.30% 0.21%
0.42% 0.18%
As with investor sentiment, we separate our sample into periods of high and low market
dispersion based on the median of the market dispersion index for the whole sample period
(January 2000 to December 2015). If a country’s market dispersion for month t is higher (lower)
than the median market dispersion of this country for all sample periods, we define month t as a
period of high (low) market dispersion. The regression results showing the relationship between

143
fund selectivity and fund performance periods of high and low market dispersion are presented in
Table 6, columns (3) and (4), respectively. Interestingly, during periods of high market
dispersion, when private information is more valuable, fund selectivity skill is positively and
significantly related to fund performance (0.230, p < 0.0001). On the contrary, during periods of
low market dispersion, the relationship is negative and significant (-0.051, p < 0.0001). Our
explanation is that, during periods of low market dispersion, when market-level information (i.e.,
economic shocks) is more important for estimating stock prices, increased attention on private
information will not generate visible abnormal returns and will bring more risk into the portfolio.
In this scenario, a strategy of building a portfolio deviating from market movements during
periods of low market dispersion is costly and will decrease fund performance.
Next, we incorporate investor sentiment and market dispersion into the main regression (Eq. 4).
The results are shown in Table 7.

144
TABLE 3.7 The effect of fund selectivity, market sentiment, and market Dispersion on fund performance
This table reports the results of regressing fund alpha on manager’s selectivity controlling for other fund
characteristics during high/low market sentiment periods and during high/low market Dispersion periods.
The dependent variable is fund alpha, which is the difference between fund excess return (over risk free
rate) in month t and the expected excess return of the same month. The expected excess return for each
fund in month t is calculated by multiplying the FFC model factor loadings from the 24 month preceding
estimation period (t-24 to t-1) by the FFC model factors in current month. The process repeats by moving
the estimation and test period one month at a time. The main independent variables are fund selectivity,
which is the logistic transformed value of (1-R2
t-1), consumer Confidence Indicator (CCI) free of
macroeconomic, and market Dispersion, which is the stock return standard division for all stocks in each
country in month t. Fund-level control variables contain fund alphat-1, expense ratio, log value of fund
age, value of total net assets (TNA), and squared log value of TNA. Sample period covers from January
2000 through December 2015. ***, **, * denotes significance at the 1%, 5% or 10% level.
Fund Alpha
Intercept -0.167** -0.279*** -0.331***
(0.019) (0.001) (<.0001)
Fund Selectivity 0.116*** 0.099*** 0.124***
(<.0001) (<.0001) (<.0001)
Sentiment -0.042***
-0.039***
(<.0001)
(<.0001)
Dispersion
0.017*** 0.014***
(<.0001) (<.0001)
Alphat-1 0.111*** 0.100*** 0.110***
(<.0001) (<.0001) (<.0001)
Expense Ratio -0.010 -0.005 -0.006
(0.327) (0.639) (0.510)
Log(Age) 0.120*** 0.112*** 0.113***
(<.0001) (<.0001) (<.0001)
Log(TNA) 0.059*** 0.064*** 0.067***
(0.006) (0.003) (0.002)
Log(TNA)2 -0.005* -0.007*** -0.006**
(0.052) (0.010) (0.016)
Strategy Control YES YES YES
Adj. R2 0.33% 0.25% 0.39%

145
First the regression results in Table 7 show that fund selectivity is still positively related
with fund performance (0.124, p < 0.0001) after controlling for market sentiment and market
dispersion. In addition, market sentiment can hurt overall fund performance (-0.042, p < 0.0001
without market dispersion in the regression; -0.039, p < 0.0001 with market dispersion in the
regression) and market dispersion, on average, can benefit fund performance (0.017, p < 0.0001
without investor sentiment in the regression; 0.014, p < 0.0001 with investor sentiment in the
regression). Jointly, these results confirm our previous findings that fund selectivity is positively
and significantly related to fund performance and this relationship remains significant even when
controlling for investor sentiment and market dispersion.
Next, we repeat the above analysis for each country and we report the coefficients of
selectivity, investor sentiment, and market dispersion in Table 8.
After we consider investor sentiment and market dispersion, the results, as shown in
Table 8, are consistent with previous findings. Of all 11 European countries, eight show positive
and significant relationships between fund selectivity and fund performance, which indicates
that, after controlling for investor sentiment and market dispersion, fund selectivity still has
strong predictive power for future fund performance in the majority of European mutual fund
industries. Even though the selectivity coefficients for the remaining three countries are not
significant, they still show positive signs (0.007, p = 0.900 for Finland; 0.013, p = 0.502 for
Spain; 0.058, p = 0.253 for the United Kingdom). The sentiment coefficients for nine of the 11
countries appear to be significantly negative, while the market dispersion coefficients for seven
of the 11 countries are significantly positive.

146
TABLE 3.8 The effect of fund selectivity, market sentiment, and market Dispersion on fund performance for
each country
This table reports the coefficients of selectivity, market sentiment, and market Dispersion from regressing
fund alpha on manager’s selectivity, market sentiment, and market Dispersion, controlling for other fund
characteristics for each country. P value for each coefficient is also presented. Sample period ranges from
January 2000 through December 2015. ***, **, * denotes significance at the 1%, 5% or 10% level.
Selectivity Coeff. Sentiment Coeff. Dispersion Coeff.
Austria 0.159*** -0.018*** 0.089***
(<.0001) (0.002) (<.0001)
Denmark 0.163*** -0.002 0.105***
(0.001) (0.904) (<.0001)
Finland 0.007 -0.051*** 0.327***
(0.900) (<.0001) (<.0001)
Germany 0.272*** -0.066*** 0.042***
(<.0001) (<.0001) (<.0001)
Ireland 0.120*** -0.033*** -0.091***
(0.001) (<.0001) (<.0001)
Italy 0.064*** -0.088*** -0.091***
(0.009) (<.0001) (<.0001)
Netherlands 0.334*** -0.058*** 0.040***
(0.001) (0.001) (0.006)
Spain 0.013 -0.104*** -0.053***
(0.502) (<.0001) (<.0001)
Sweden 0.190*** -0.018* 0.066***
(<.0001) (0.058) (<.0001)
Switzerland 0.265*** -0.025** -0.103***
(<.0001) (0.014) (<.0001)
United Kingdom 0.058 -0.015 0.012**
(0.253) (0.109) (0.032)

147
To examine the sensitivity of our finding of the relation between the European mutual
fund industry’s performance and market sentiment, in this section we replace our major
sentiment measure (CCI) with four alternative market sentiment measures, including the
Economic Sentiment Indicator (ESI), which is from the European Commission's Business and
Consumer Surveys and is constructed from the following indicators: the industrial confidence
indicator (40%), the service confidence indicator (30%), the CCI (20%), the construction
confidence indicator (5%), and the retail trade confidence indicator (5%); the Economic Climate
Index (ENOMWLEC), which is drawn from surveys of business conditions in Germany among a
broad range of business executives across the manufacturing, construction, wholesale, and retail
sectors; and the German Consumer Confidence Index (GECSI), where a value of 100 indicates
an equal number of optimists and pessimists and figures below 100 indicate more pessimists than
optimists (and vice versa). The same as with the CSI sentiment index, we use the residual from
the regression of the each index on a set of macroeconomic variables, including Europe’s
inflation rate, the growth rate of Europe’s employment rate, the growth rate of Europe’s
industrial production, the growth rate of Europe’s durable consumer goods production, the
growth rate of Europe’s nondurable goods production, the consumer price index change in
Europe’s service industry, and OECD-based European recession indicators.
Since no financial market in the world is isolated with the others, especially large and
developed ones, we also use the Baker–Wurgler (BW) sentiment index, orthogonalized with
respect to a set of macroeconomic conditions to replace the European sentiment measures. This
index is formed to measure US market sentiment but the argument here is that the US equity
market, which is the largest and most developed equity market in the world, can influence other
financial markets. Information from the US equity market (e.g., investor optimism and

148
pessimism) can transfer to other markets. The time series plots of all the sentiment indexes used
are shown in Figure 1. The regression results for this analysis are shown in Table 9.
FIGURE 1
Time series plot of each sentiment measure (free of macroeconomic influences) from January 2000
to December 2015
-20
-10
0
10
20
200
001
200
011
200
109
200
207
200
305
200
403
200
501
200
511
200
609
200
707
200
805
200
903
201
001
201
011
201
109
201
207
201
305
201
403
201
501
201
511
CSI (Main Sentiment Index)
-30
-20
-10
0
10
20
200
001
200
010
200
107
200
204
200
301
200
310
200
407
200
504
200
601
200
610
200
707
200
804
200
901
200
910
201
007
201
104
201
201
201
210
201
307
201
404
201
501
201
510
ESI
-40
-30
-20
-10
0
10
20
30
200
001
200
011
200
109
200
207
200
305
200
403
200
501
200
511
200
609
200
707
200
805
200
903
201
001
201
011
201
109
201
207
201
305
201
403
201
501
201
511
ENOMWLEC
-30
-20
-10
0
10
20
30
200
001
200
011
200
109
200
207
200
305
200
403
200
501
200
511
200
609
200
707
200
805
200
903
201
001
201
011
201
109
201
207
201
305
201
403
201
501
201
511
GECSI
-2
-1
0
1
2
3
4
200
001
200
010
200
107
200
204
200
301
200
310
200
407
200
504
200
601
200
610
200
707
200
804
200
901
200
910
201
007
201
104
201
201
201
210
201
307
201
404
201
501
201
510
BW

149
TABLE 3.9 The effect of market sentiment on fund performance, using alternative European Sentiment
measures
This table reports the results of regressing fund alpha on manager’s selectivity and different market
sentiment measures, controlling for other fund characteristics. The dependent variable is fund alpha,
which is the difference between fund excess return (over risk free rate) in month t and the expected excess
return of the same month. The expected excess return for each fund in month t is calculated by
multiplying the FFC model factor loadings from the 24 month preceding estimation period (t-24 to t-1) by
the FFC model factors in current month. The process repeats by moving the estimation and test period
one month at a time. The main independent variables are fund selectivity, which is the logistic
transformed value of (1-R2t-1), and market sentiment. We use 4 alternatives to measure market sentiment:
ESI, which is the Economic Sentiment Indicator calculated from the European Commission's Business
and Consumer Surveys; ENOMWLEC, which comes from surveys of business conditions in Germany;
GECSI, which is the German Consumer Confidence Indicator, and BW, which is Baker and Wurgler
sentiment index (BW sentiment index, available at Jeffrey Wurgler’s website). All the sentiment indexes
are free of macroeconomic influences. Fund-level control variables contain fund alphat-1, expense ratio,
log value of fund age, value of total net assets (TNA), and squared log value of TNA. Sample period
covers from January 2000 through September 2015. ***, **, * denotes significance at the 1%, 5% or 10%
level.
Fund Alpha
Intercept -0.105 -0.068 -0.263*** -0.081
(0.138) (0.339) (0.000) (0.258)
Fund Selectivity 0.113*** 0.089*** 0.076*** 0.114***
(<.0001) (<.0001) (<.0001) (<.0001)
ESI -0.044***
(<.0001)
ENOMWLEC
-0.002**
(0.016)
GECSI
-0.025***
(<.0001)
BW
-0.392***
(<.0001)
Alphat-1 0.131*** 0.102*** 0.162*** 0.122***
(<.0001) (<.0001) (<.0001) (<.0001)
Expense Ratio -0.009 -0.008 -0.011 -0.006
(0.340) (0.416) (0.269) (0.553)
Log(Age) 0.104*** 0.116*** 0.162*** 0.096***
(<.0001) (<.0001) (<.0001) (<.0001)
Log(TNA) 0.063*** 0.055*** 0.043** 0.070***
(0.003) (0.010) (0.044) (0.001)
Log(TNA)2 -0.005** -0.005** -0.004* -0.006**
(0.039) (0.039) (0.086) (0.022)
Strategy Control YES YES YES YES
Adj. R2 0.005 0.002 0.004 0.002

150
The results in Table 9 are consistent with the previous ones shown in Table 7 using the CCI
to measure investor sentiment. All the alternative sentiment indexes show a strong negative
relationship with fund performance and fund selectivity remains positively and significantly
correlated with fund performance.
Effect of Country-Level Variables on Fund Selectivity Profitability
In this section, we use a two-step regression procedure, as described in Section 1.4, to
investigate the country-level characteristics’ influence on the profitability of fund managers’
selectivity ability. Unlike the previous literature, which focuses on the direct influence of those
variables on fund performance, we treat the country characteristics as mediating variables.. The
results of regressing the selectivity coefficient on a list of country-level variables are reported in
Table 10.
The results in Table 10 confirm our hypothesis that country-level characteristics work as
mediators and affect the relationship between fund selectivity and fund performance. First, we
find no evidence that a country’s GDP per capita can influence the profitability of mutual fund
managers’ selectivity ability. As Ferreira et al. (2012), we argue that, after incorporating other
country-level variables, the effect of this broad economic indicator is diluted. However, we find
a strong relationship between fund selectivity profitability and Internet usage, as we expected.
We conclude that higher Internet usage proxies for better-educated investors in the equity
markets, which consequently increases the information quality and benefits skilled fund
managers.
Both of our variables capturing the quality of a country’s legal system show a positive
and significant relationship with selectivity profitability, which confirms our hypothesis that

151
legal strength limits insider trading and market noise, thus making fund managerial skills based
on analytical ability more valuable.
Market liquidity, measured by the share turnover ratio, has a strong positive relation with
selectivity profitability. The results, in line with our expectation, indicate that fund managers’
skill will raise more profits for fund clients if the fund strategy can be quickly adjusted to
incorporate new information. On the other hand, we find a significant negative relationship
between equity market size and fund selectivity profitability. This might be caused by noisier
information in the equity market.
TABLE 3.10 The effect of country level variables on the relationship between fund performance and selectivity
This table presents the regression results from the two-step procedure. First we calculate the coefficient
between fund selectivity and fund performance by regressing fund alpha on fund selectivity, controlling
for other fund level control variables, for 24 months. Only funds have full 24 months’ data within current
year and the prior year will be included. Then we have an annual time series data for each coefficient for
15 years (2001 to 2015). Second, we run regression of each coefficient (selectivity profitability) on 8
country level variables. The country level variables contain GDP per capital, percentage of Internet user,
total size of equity market, equity share turnover, dummy variable for common law (if common then 1,
otherwise 0), securities regulation, mutual fund industry age, and mutual fund industry proportion within
equity market. We also show adjusted R2 and P values. ***, **, * denotes significance at the 1%, 5% or
10% level.
Selectivity Profitability
Intercept -34.117*** -53.177***
(<.0001) (<.0001)
GDP per Capital (million $) -0.059 0.135
(0.660) (0.309)
Internet (%) 0.877*** 1.209***
(<.0001) (<.0001)
Common Law 9.636***
(0.001)
Securities Regulation
4.367***
(<.0001)
Equity Market Size (billion $) -0.003*** -0.001***
(<.0001) (0.005)
Share Turnover (%) 0.061*** 0.030***
(<.0001) (<.0001)
Mutual Fund Industry Age (years) -0.607*** -0.930***
(<.0001) (<.0001)
Mutual Fund Industry Proportion -0.107 -0.064
(0.788) (0.858)
Adj. R2 15.20% 16.50%

152
Finally, we find that fund managers’ selectivity ability is more profitable if the country’s
mutual fund industry is young. Since the older the mutual fund industry is, the more competitive
it is, it is harder for fund managers to achieve superior performance by competing with each
other. In addition, the mutual fund industry proportion of the equity market shows no evidence of
affecting the relationship between fund selectivity and fund performance.
Briefly, the results provide strong evidence that country-level characteristics work as mediators
between fund selectivity and fund performance and that better economic development and legal
protection, a less developed mutual fund industry, a smaller equity market, and greater equity
market liquidity will make fund managers’ selectivity ability more profitable.
CONCLUSION
This study investigates the predictive power of fund selectivity on fund performance (i.e.,
fund alpha) within the European mutual fund industry using a unique sample of actively
managed domestic equity mutual funds from 11 European countries. Our study reveals empirical
evidence that, as in the US mutual fund industry, selectivity is a valid skill measure in the
European mutual fund industry and mutual fund managers with higher levels of selectivity
ability can generate superior performance for their clients. Even though mutual fund
performance can be influenced by financial market conditions, such as market sentiment and
market dispersion, the positive relationship between fund selectivity and fund performance still
holds after controlling for those effects. We also find that country-level characteristics serve as
mediating variables between fund selectivity and fund performance. Fund selectivity is more
valuable and profitable if the fund is from a country with better economic development, stronger
legal protection, a less developed mutual fund industry, a smaller equity market, and greater
equity market liquidity.

153
REFERENCES
Abinzano, I., Muga, L., & Santamaria, R. (2010). Do managerial skills vary across fund managers? results
using European mutual funds. Journal of Financial Services Research, 38(1), 41-67.
Amihud, Y., & Goyenko, R. (2013). Mutual fund's R2 as predictor of performance. Review of Financial
Studies, 26(3), 667-694.
Amromin, G., & Sharpe, S. A. (2009). Expectations of risk and return among household investors: Are
their Sharpe ratios countercyclical? Available at SSRN 1327134.
Antoniou, C., Doukas, J. A., & Subrahmanyam, A. (2015). Investor sentiment, beta, and the cost of equity
capital. Management Science.
Baker, M., & Wurgler, J. (2006). Investor sentiment and the cross‐section of stock returns. The Journal of
Finance, 61(4), 1645-1680.
Banegas, A., Gillen, B., Timmermann, A., & Wermers, R. (2013). The cross section of conditional mutual
fund performance in European stock markets.Journal of Financial economics, 108(3), 699-726.
Berk, J. B., & Green, R. C. (2002). Mutual fund flows and performance in rational markets: National
Bureau of Economic Research.
Berk, J. B., & Van Binsbergen, J. H. (2015). Measuring skill in the mutual fund industry. Journal of
financial economics, 118(1), 1-20.
Blake, D., & Timmermann, A. (1998). Mutual fund performance: evidence from the UK. European
Finance Review, 2(1), 57-77.
Brands, S., Brown, S. J., & Gallagher, D. R. (2005). Portfolio Concentration and Investment Manager
Performance. International Review of Finance, 5(3‐4), 149-174.
Carhart, M. M. (1997). On persistence in mutual fund performance. The Journal of Finance, 52(1), 57-82.
Cesari, R., & Panetta, F. (2002). The performance of Italian equity funds.Journal of Banking &
Finance, 26(1), 99-126.
Cohen, L., Frazzini, A., & Malloy, C. (2007). The small world of investing: Board connections and
mutual fund returns. National Bureau of Economic Research Cambridge, Mass., USA.
Cremers, K. M., & Petajisto, A. (2009). How active is your fund manager? A new measure that predicts
performance. Review of Financial Studies, 22(9), 3329-3365.

154
Cremers, M., Ferreira, M. A., Matos, P. P., & Starks, L. T. (2015). Indexing and active fund management:
International evidence. Journal of Financial Economics, Forthcoming.
Cuthbertson, K., Nitzsche, D., & O'Sullivan, N. (2008). UK mutual fund performance: Skill or
luck?. Journal of Empirical Finance, 15(4), 613-634.
Dahlquist, M., Engström, S., & Söderlind, P. (2000). Performance and characteristics of Swedish mutual
funds. Journal of Financial and quantitative Analysis, 35(03), 409-423.
Daniel, K., Grinblatt, M., Titman, S., & Wermers, R. (1997). Measuring mutual fund performance with
characteristic-based benchmarks. The Journal of Finance, 52(3), 1035-1058.
Daniel, K., Hirshleifer, D., & Subrahmanyam, A. (1998). Investor psychology and security market
under‐and overreactions. The Journal of Finance, 53(6), 1839-1885.
Dermine, J., & Röller, L. H. (1992). Economies of scale and scope in French mutual funds. Journal of
Financial Intermediation, 2(1), 83-93.
Fama, E. F., & French, K. R. (1993). Common risk factors in the returns on stocks and bonds. Journal of
Financial Economics, 33(1), 3-56.
Ferreira, M. A., Keswani, A., Miguel, A. F., & Ramos, S. B. (2012). The determinants of mutual fund
performance: A cross-country study. Review of Finance, rfs013.
Franck, A., & Kerl, A. (2013). Analyst forecasts and European mutual fund trading. Journal of Banking
& Finance, 37(8), 2677-2692.
Gruber, M. J. (1996). Another puzzle: The growth in actively managed mutual funds. The Journal of
finance, 51(3), 783-810.
Grünbichler, A., & Pleschiutschnig, U. H. (1999). Performance persistence: evidence for the European
mutual funds market.
Hong, H., & Stein, J. C. (1999). A unified theory of underreaction, momentum trading, and overreaction
in asset markets. The Journal of Finance, 54(6), 2143-2184.
Kacperczyk, M., Sialm, C., & Zheng, L. (2005). On the industry concentration of actively managed equity
mutual funds. The Journal of Finance, 60(4), 1983-2011.
Kacperczyk, M., Van Nieuwerburgh, S., & Veldkamp, L. (2011). Rational attention allocation over the
business cycle. Unpublished working paper. New York University.
La Porta, R., Lopez‐de‐Silanes, F., & Shleifer, A. (2006). What works in securities laws?. The Journal of
Finance, 61(1), 1-32.

155
La Porta, R., Lopez-de-Silanes, F., Shleifer, A., & Vishny, R. (1999). The quality of government. Journal
of Law, Economics, and organization, 15(1), 222-279.
Malkiel, B. G. (1995). Returns from investing in equity mutual funds 1971 to 1991. The Journal of
Finance, 50(2), 549-572.
Morck, R., Yeung, B., & Yu, W. (2000). The information content of stock markets: why do emerging
markets have synchronous stock price movements? Journal of financial economics, 58(1), 215-260.
Otten, R., & Bams, D. (2002). European mutual fund performance. European Financial
Management, 8(1), 75-101.
Petajisto, A. (2013). Active share and mutual fund performance. Financial Analysts Journal, 69(4), 73-
93.
Shukla, R. K., & Van Inwegen, G. B. (1995). Do locals perform better than foreigners?: An analysis of
UK and US mutual fund managers. Journal of Economics and Business, 47(3), 241-254.
von Reibnitz, A. H. (2013). When Opportunity Knocks: Cross-Sectional Return Dispersion and Active
Fund Performance. Paper presented at the 26th Australasian Finance and Banking Conference.
Zheng, L. (1999). Is money smart? A study of mutual fund investors' fund selection ability. The Journal
of finance, 54(3), 901-933

156
APPENDIX 3
Country level variable description and data resource
Variable name Variable Group Description Data Type Data Resource
GDP per Capital
(Million)
Economic
development
Gross domestic product divided
by midyear population. Data are
in constant 2010 U.S. dollars.
Time-series
World Development
Indicators (WDI)
database
Internet Economic
development
Percentage of individuals who
have used the Internet (from any
location) in the last 12 months.
Internet can be used via a
computer, mobile phone, personal
digital assistant, games machine,
digital TV etc.
Time-series
World Development
Indicators (WDI)
database
Equity Market
Size
Equity market
development
The total number of shares traded,
both domestic and foreign,
multiplied by their respective
matching prices. Data are end of
year values converted to U.S.
dollars using corresponding year-
end foreign exchange rates.
Time-series
World Development
Indicators (WDI)
database
Share Turnover Equity market
development
The value of domestic shares
traded divided by their market
capitalization. The value is
annualized by multiplying the
monthly average by 12.
Time-series
World Development
Indicators (WDI)
database
Common Law Investor protection
and legal strength
1 if the legal origin is common
law and 0 if the legal origin is
civil law
Dummy La Porta et al. 1997
Securities
Regulation
Investor protection
and legal strength
Combination of disclosure
requirements, liability standards,
and public enforcement
Cross-
sectional La Porta et al. 2006
Mutual Fund
Industry Age
(years)
Mutual fund
industry
development
Number of years since the first
open-end fund was sold in the
country
Time-series Ferreira et al. 2012
Mutual Fund
Industry
Proportion
Mutual fund
industry
development
Relative mutual fund industry
size, which is total equity assets
under management divided by
equity market size
Time-series
World Development
Indicators (WDI)
database; EFAMA
Asset Management
Report

157
CONCLUSION
This dissertation participates into the study stream of mutual fund industry by
investigating the relation between managerial skills possessed by mutual fund managers and fund
performance, and it contributes to the literature by investigating the validity and efficiency of
fund manager’s skills under different market states, finding the essential elements of fund
manager’s stock picking skills, and exploring the research of mutual fund managerial skills to
other countries. Given the important role of mutual fund industry to the financial markets, the
findings of this dissertation show values for further academic research and industry implications.

158
VITA
FENG DONG
Old Dominion University
Strome College of Business
Department of Finance
Constant Hall, Suite 2111
Norfolk, VA 23529
E-mail: [email protected]
Tel: 614-736-0605
http://orgs.odu.edu/badsa/fdong.html
RESEARCH INTERESTS Institutional Investor Activity, Behavioral Finance, Empirical Asset Pricing
TEACHING INTERESTS Investments, Corporate Finance, International Finance
EDUCATION Old Dominion University, Strome College of Business August, 2017 PhD degree in Finance (Proposal Defended)
Minor in International Business
The Ohio State University, Fisher College of Business June, 2012 Specialized Masters Degree in Finance
Tracks in Corporate Finance and Investment
Oklahoma City University, Meinders School of Business May, 2011 Bachelor of Science in Business
Majors: Finance & Economics
PUBLICATIONS
Shen, J., Najand M., Dong, F, & He, W. (2017). News and Social Media Emotions in the Commodity Market.
Review of Behavior Finance, forthcoming
Chen, Y., Dong, F., & Chen, H. (2016). Business Process and Information Security: A Cross-Listing
Perspective. Journal of Industrial Integration and Management, 1(2)
CONFERENCE PAPERS
Dong, F., & Doukas, J. (October 2017). “Does Corporate Managerial Ability Matter for Fund Managers?”
Financial Management Association Annual Meeting (FMA 2017), Boston
Mallon, M., Guldiken, O., Benischke, M., Dong, F., & Nguyen, T. (July 2017). “Foreign Subsidiary
Performance in Emerging Markets: An Institutional Perspective" Academy of International Business Annual
Meeting (AIB 2017), Dubai, United Arab Emirates
Shen, J., Dong, F., & He, W. (November 2016). “Emotion at Work on Big Data Analytics: Using Media-
Based Emotion for Predicting Commodity Price.” International Conference on Behavioral, Economic, and
Socio-Cultural Computing (BESC2016), Duke University, Durham, North Carolina
Chen, Y., Dong, F., Chen, H., & Xu, L. (August 2016). “Can Cross-Listing Mitigate the Impact of an
Information Security Breach Announcement on a Firm's Values?” In IOP Conference Series: Materials
Science and Engineering

159
HONORS AND AWARDS
Research Assistantship
PhD scholarship Outstanding Finance PhD Student Award Treasury of Business Administration Doctoral Student Association
Professor's Award in Finance Third Place Undergraduate Winner, Donald W. Reynolds Governor’s Cup--
Oklahoma’s Statewide Collegiate Business Plan Competition
Graduated Cum Laude
President’s Honor Roll
Dean’s Honor Roll
President of Chinese Students and Scholars’ Association
2013-17
2013-17 2016 2014
2011
2011
2011
2010
2010
2009
TEACHING EXPERIENCE
Instructor, FIN323 Introductory Financial Management Fall 2016
Average Teaching Evaluation: 4.9/5.0 (Department Mean 4.2/5.0)
Teaching Assistant, MBA641 Investing in the Stock Market Spring 2017
Teaching Assistant, FIN220 Wall Street 101 Spring 2017
Teaching Assistant, MBA641 Investing in the Stock Market Fall 2016
Teaching Assistant, FIN220 Wall Street 101 Fall 2016
Teaching Assistant, FIN497 Option Valuation & Trading Strategies Summer 2016
Teaching Assistant, FIN220 Wall Street 101 Summer 2016
Teaching Assistant, FIN220 Wall Street 101 Spring 2016
Teaching Assistant, FIN220 Wall Street 101 Spring 2015
Teaching Assistant, MBA695 Stock Market Spring 2015
BUSINESS EXPERIENCE
Research Assistant
The Gregory A. Lumsden Bloomberg Trading Room and Research Lab
2014-current, Norfolk, VA
Financial Advisor
Matrix Partners Network
2012-2013, Garden City, NY
Equity Trader
WTS Proprietary Trading Group LLC
2012, New York City, NY
Project Member
State Teachers Retirement System (STRS)
2012, Columbus, OH
Chief Financial Officer
Quorum Company
2011- 2012, Oklahoma City, OK
Finance Intern
Bank of China, Ltd. Yantai Branch
2010, Yantai, China
SKILLS
Programming: SAS, Stata, Eviews, MS Office, Gretl
Databases: CRSP, Compustat, ExecuComp, Bloomberg (BESS, BMC certified), CapitalIQ, WRDS, LexisNexis,
Morningstar, Thomson ONE
Languages: English (fluent), Mandarin Chinese (native)

160
ACADEMIC MEMBERSHIPS
American Finance Association (AFA) European Financial Management Association (EFMA) Financial Management Association (FMA)
REFERENCES Prof. JOHN A. DOUKAS (PhD Committee Chair) Prof. MOHAMMAD NAJAND
European Financial Management (EFM) Managing Editor
Professor of Finance & Eminent Scholar
W. B. Spong, Jr., Chair in Finance
Department of Finance
Strome College of Business
Old Dominion University
Constant Hall, Suite 2080
Norfolk, VA 23529-0222, USA
Research Associate
Judge Business School
Cambridge University, UK
Tel: 757-683-5521 Fax: 757-683-5639
Email: [email protected]
Professor of Finance
Finance Department Chair
Department of Finance
Strome College of Business
Old Dominion University
Constant Hall, Suite 2125
Norfolk, VA 23529-0222, USA
Tel: 757-683-3509
Email: [email protected]
Prof. DAVID D. SELOVER ANDREW H. COHEN
Professor of Economics
Department of Economics
Strome College of Business
Old Dominion University
Constant Hall, Suite 2036
Norfolk, VA 23529-0222, USA
Tel: 757-683-3541
Email: [email protected]
Manager/Senior Lecturer
Gregory A. Lumsden Trading Room & Research Lab
Strome College of Business
Old Dominion University
Constant Hall, Suite 2002
Norfolk, VA 23529-0222, USA
Tel: 757-683-7004
Email: [email protected]