Embed Size (px)
Citation preview
HAL Id: tel-01253253https://hal.archives-ouvertes.fr/tel-01253253
Submitted on 9 Jan 2016
HAL is a multi-disciplinary open accessarchive for the deposit and dissemination of sci-entific research documents, whether they are pub-lished or not. The documents may come fromteaching and research institutions in France orabroad, or from public or private research centers.
L’archive ouverte pluridisciplinaire HAL, estdestinée au dépôt et à la diffusion de documentsscientifiques de niveau recherche, publiés ou non,émanant des établissements d’enseignement et derecherche français ou étrangers, des laboratoirespublics ou privés.
Copyright
THREE ESSAYS ON OPERATING SEGMENTDISCLOSURERucsandra Moldovan
To cite this version:Rucsandra Moldovan. THREE ESSAYS ON OPERATING SEGMENT DISCLOSURE. Businessadministration. ESSEC Business School, 2015. English. �tel-01253253�

THREE ESSAYS ON OPERATING SEGMENT DISCLOSURE
A dissertation submitted in partial fulfillment of the requirements for the degree of
PHD IN BUSINESS ADMINISTRATION
and
DOCTEUR EN SCIENCES DE GESTION
DE L’ECOLE DOCTORALE
« ECONOMIE, MANAGEMENT, MATHEMATIQUES DE CERGY »
ED 405
FROM ESSEC BUSINESS SCHOOL
Presented and defended publicly on the 15th
of June 2015 by
Rucsandra MOLDOVAN
JURY
Paul ANDRÉ Co-supervisor Professor, ESSEC Business School (Cergy, France)
Andrei FILIP Co-supervisor Associate Professor, ESSEC Business School (Cergy,
France)
Ole-Kristian HOPE Examiner Professor, Rotman School of Management, University of
Toronto (Toronto, Canada)
Michel MAGNAN Referee Professor, John Molson School of Business, Concordia
University (Montréal, Canada)
Bernard RAFFOURNIER Chair Professor, Institute of Management, University of
Geneva (Geneva, Switzerland)
Donna STREET Referee Professor, University of Dayton (Dayton, U.S.A.)

Copyright © 2015 by Rucsandra Moldovan
All rights reserved.

ACKNOWLEDGEMENTS
Some say that doing a PhD is a lonely endeavor, but I have not felt lonely during my PhD
journey. So many people have contributed to and have had an impact on my research, my
teaching, and my life during these last five years! My co-supervisors, Paul André and Andrei
Filip, have continuously guided and encouraged me. They have been generous with their time
going through draft after draft of my papers, and with their financial resources so that I could
attend as many conferences and seminars as would benefit my work. Paul’s experience and
broad theoretical and conceptual view of accounting research blends perfectly with Andrei’s
more empirically-oriented view on research and I consider myself lucky for having both of
them in my corner. For these and many other reasons, I am for ever grateful and will for ever
look up to them.
I am extremely thankful to Ole-Kristian Hope, Michel Magnan, Bernard Raffournier, and
Donna Street for accepting to be on my Jury. Donna and Michel have taken out of their
demanding schedules to follow me from the proposal stage up to the final steps of my
dissertation process, and have sat down with me on several occasions. My work is
significantly improved thanks to their invaluable feedback and I hope that my future
academic career will be at least as successful as theirs in blending research and involvement
with practice. Indirectly and without knowing it, Bernard has been a constant presence during
my studies through Andrei and I thank him for agreeing to come full circle. I was lucky
enough to be Ole-Kristian’s visiting PhD student, to have him as discussant, recommender,
and finally as member of the Jury. His comments and encouragements are a source of
motivation to aim for the top.
I am grateful for all the training and support received at ESSEC Business School which set
me on the path to becoming a scholar. The faculty members in the Department of Accounting
and Management Control, Paul André, Charles Cho, Andrei Filip, Thomas Jeanjean, Anne
Jeny, Daphne Lui, Luc Paugam, Carlos Ramirez, Chrystelle Richard, and Peter Walton, have
put in a lot of effort to ensure the success of the PhD program in accounting, have walked us
through decades of accounting literature, and have patiently provided their feedback during
brownbag seminars. I especially want to thank Chrystelle for coordinating the Accounting
and Auditing concentration and always keeping us on track, Luc for generously putting me in
touch with his financial analysts contacts, Charles for hosting student and faculty gatherings
and for his support during the job market process, and Andrei for advising me on how to
manage a classroom. I also thank the ESSEC faculty members from other departments from
whom I have learnt a great deal in core or elective courses, Gorkem Celik, Marie-Laure
Djelic, Vincenzo Esposito Vinzi, José Miguel Gaspar, Lorenzo Naranjo, Anca Metiu, Radu
Vranceanu, and others.
My exchange at Rotman School of Management, University of Toronto has been an amazing
experience and one of the highlights of my PhD studies. I thank Ole-Kristian for accepting
me as visiting student, for sharing his insights on research in class and in discussions on my
work, and for challenging me to rise up to his expectations. I also owe Ole-Kristian a debt of
gratitude for his kind help well after I finished my exchange, an essential ingredient to my job
market process. In various settings and on numerous occasions I interacted with Rotman
faculty members, Jeff Callen, Mindy Callen, Gus DeFranco, Alex Edwards, Elitzur Ramy,
Yue Li, Scott Liao, Hai Lu, Partha Mohanram, Gordon Richardson, Dushyant Vyas, Aida
Sijamic Wahid, Baohua Xin, Ping Zhang, and others, and I wish to thank them all for the

welcoming and research-intensive atmosphere I experienced. The PhD students at Rotman,
Barbara, Danqi, Heather, Hila, Leila, Na, Ross, Sandra, Sasan, Stephanie, Wuyang,
considered me one of their own and I hope to have them as life-long friends and
collaborators.
I thank my colleagues and friends in the ESSEC PhD Program, Alessandro, Ali, Alina,
Archita, Damien, Davide, Dmitry, Hyemi, Ionela, Joanne, Joel, Juan-Carlos, Like, Lisa,
Melissa, Milad, Nava, Oana, Raj, Reza, Ricardo, Samia, Shantanu, Tania, Yana, Yun,
Yuanyuan, Zhongwei, and others, for making hard times bearable and good times happier. I
would also like to thank Lina Prévost (PhD Office) for shielding us from too much
bureaucracy and being motherly and kind no matter how grown up we are, and to Tricia Todd
(Research Center) and Régine Belliard (Learning Center) for bearing with me through
countless requests for funding and data access.
Throughout my 20-something years of being in school, I have had many teachers who greatly
influenced my life and career choices. I am grateful to each and every one of them, but I
would like to mention two in particular. My Economics high school teacher, Ion Buse, guided
me towards a career in accounting. My accounting professor at Babes-Bolyai University,
Sorin Achim, opened my eyes towards doing doctoral studies and convinced me to dream
higher. I can only aspire to have the same impact on my students one day.
I would like to express my love and gratitude to my parents, Livia and Viorel Moldovan,
whose mission in life is to make sure their daughters are well-rounded, accomplished people,
and whose belief in me is unfaltering; to my sister, Carmen, and her fiancé, Dan, who keep
me grounded; and to my grandfather, Ticu, who prays for my health and good fortune. You
are all with me no matter how far I am. Also, to my friends in Romania, Sanda, Simina,
Dragos, and Mihai, I thank you for always being there on messenger or Facebook, anxious to
have news from me, and willing to listen to me complain, or share a laugh.
Finally, to Maxime, thank you for believing in me. I look forward to achieving our dreams
together and creating new ones as we embark on the journeys that await us. Allez, c’est parti!
Rucsandra Moldovan
Cergy, April 21, 2015
TABLE OF CONTENTS
List of acronyms ....................................................................................................................... ix
List of figures ............................................................................................................................. x
List of tables .............................................................................................................................. xi
Résumé substantiel en français ................................................................................................ 13
General introduction ................................................................................................................ 23
1. General overview and structure of the thesis ................................................................... 23
2. Institutional background .................................................................................................. 26
2.1 The evolution of segment reporting regulation in the U.S. and Europe .................... 27
2.2 The requirements of IFRS 8 Operating Segments ..................................................... 31
2.3 Business model-based financial reporting ................................................................. 33
3. Do financial analysts care about segment information? .................................................. 35
4. Research questions ........................................................................................................... 40
5. Segment reporting literature ............................................................................................ 43
5.1 Determinants of segment information disclosure ...................................................... 43
5.1.1 Proprietary cost hypothesis ................................................................................. 44
5.1.2 Agency cost hypothesis....................................................................................... 45
5.1.3 Other determinants .............................................................................................. 46
5.2 Effects associated with segment reporting ................................................................. 46
5.2.1 Segment reporting and analysts’ information environment ................................ 46
5.2.2 Stock market effects of segment reporting ......................................................... 47
5.2.3 Other effects of segment reporting ..................................................................... 48
6. Contributions.................................................................................................................... 50
6.1 Fit and contribution to the accounting literature ........................................................ 50
6.2 Contribution to the corporate diversification literature ............................................. 52
6.3 Practical implications for standard setters and regulators.......................................... 54
7. Overview of the three research papers ............................................................................. 55
7.1 Chapter I..................................................................................................................... 55
7.2 Chapter II ................................................................................................................... 58
7.3 Chapter III .................................................................................................................. 61
Chapter I................................................................................................................................... 64
Abstract ................................................................................................................................ 64

Résumé ................................................................................................................................. 65
I.1 Introduction .................................................................................................................... 66
I.2 Prior research and hypotheses development ................................................................... 71
I.2.1 Institutional background .......................................................................................... 71
I.2.2 Literature review...................................................................................................... 73
I.2.2.1 Disclosure quantity and quality ........................................................................ 73
I.2.2.2 Measures of segment reporting quality and quantity........................................ 75
I.2.2.3 Determinants of segment information .............................................................. 76
I.2.2.4 Segment reporting and financial analysts’ information environment .............. 78
I.2.3 Hypotheses development ......................................................................................... 79
I.2.3.1 Determinants of the likelihood to deviate from line-item standard suggestions
...................................................................................................................................... 79
I.2.3.2 Determinants of the likelihood to deviate from average segment reporting
quality .......................................................................................................................... 80
I.2.3.3 Quantity, quality, and financial analysts’ forecast accuracy ............................ 81
I.2.3.4 Segment disclosure quality when line-item disclosure follows standard
suggestions ................................................................................................................... 83
I.3 Research design .............................................................................................................. 85
I.4 Sample and results .......................................................................................................... 93
I.4.1 Sample ..................................................................................................................... 93
I.4.2 Main results ............................................................................................................. 95
I.4.3 Additional analyses.................................................................................................. 99
I.5. Conclusions and policy implications ........................................................................... 100
Appendix I.A: Variable definitions and source ................................................................. 102
Appendix I.B: Tables for chapter I .................................................................................... 104
Chapter II ............................................................................................................................... 115
Abstract .............................................................................................................................. 115
Résumé ............................................................................................................................... 116
II.1 Introduction ................................................................................................................. 117
II.2 Institutional background and literature review ............................................................ 124
II.3 Hypotheses development............................................................................................. 126
II.4 Sample and research design ........................................................................................ 131
II.4.1 Sample and main variable measurement .............................................................. 131
II.4.2 Main model .......................................................................................................... 135
II.4.3 Control variables .................................................................................................. 136
II.5 Empirical results .......................................................................................................... 137
II.5.1 Descriptive statistics ............................................................................................. 137
II.5.2 Main results .......................................................................................................... 138
II.5.3 Additional analyses .............................................................................................. 140
II.6 Robustness tests........................................................................................................... 143
II.6.1 Endogeneity concerns .......................................................................................... 143
II.6.2 Other robustness tests ........................................................................................... 146
II.7 Conclusion ................................................................................................................... 149
Appendix II.A: Examples of coding inconsistency across corporate documents .............. 152
Appendix II.B: Variable definitions .................................................................................. 160
Appendix II.C: Tables for chapter II .................................................................................. 162
Chapter III .............................................................................................................................. 175
Abstract .............................................................................................................................. 175
Résumé ............................................................................................................................... 176
III.1 Introduction ................................................................................................................ 177
III.2 Literature review and hypotheses development ......................................................... 181
III.2.1 Determinants of management guidance .............................................................. 181
III.2.2 Management guidance and financial analysts’ forecasts .................................... 182
III.2.3 Management guidance and earnings management ............................................. 185
III.3 Sample and research design ....................................................................................... 187
III.3.1 Sample................................................................................................................. 187
III.3.2 Model to test the determinants of segment-level guidance ................................. 190
III.3.3 Model to test the relation between segment-level guidance and analysts’ earnings
forecast errors................................................................................................................. 191
III.4 Results interpretation ................................................................................................. 195
III.4.1 Descriptive statistics ........................................................................................... 195
III.4.2 Determinants of segment-level guidance ............................................................ 198
III.4.3 Segment-level guidance and analysts’ earnings forecast accuracy ..................... 199
III.4.4 Segment-level guidance and earnings management ........................................... 202
III.5 Conclusions ................................................................................................................ 203
Appendix III.A: Examples of segment-level guidance ...................................................... 205
Appendix III.B: Variable definitions ................................................................................. 207
Appendix III.C: Tables for chapter III ............................................................................... 211

Conclusion ............................................................................................................................. 227
1. Summary of findings and practical implications ........................................................... 227
2. Unifying analyses........................................................................................................... 230
3. Avenues for future research ........................................................................................... 240
3.1 Different economic and legal environment.............................................................. 240
3.2 Extending the sample across time ............................................................................ 241
3.3 The relation between disclosure characteristics ....................................................... 243
3.4 How do financial analysts use segment information? .............................................. 243
3.5 Auditors’ influence on disclosure ............................................................................ 244
Abstract .................................................................................................................................. 246
Résumé ................................................................................................................................... 248
Bibliography .......................................................................................................................... 250

ix
List of acronyms
ESMA European Securities and Markets Authority
FAF Financial Accounting Foundation
FASB Financial Accounting Standards Board
GAAP Generally Accepted Accounting Principles
IASB International Accounting Standards Board
IASC International Accounting Standards Committee
IFRS International Financial Reporting Standards
MD&A Management Discussion and Analysis
SEC Securities and Exchange Commission
SFAS Statement of Financial Accounting Standards

x
List of figures
Figure 1: Historic perspective on the evolution of FASB and IASB segment reporting
standards .................................................................................................................................. 27
xi
List of tables
Chapter I
Table I.1: Sample ....................................................................................................... 104
Table I.2: Descriptive statistics .................................................................................. 105
Table I.3: Tests of determinants of segment disclosure quantity (SRQt) and segment
disclosure quality (SRQl) ........................................................................................... 108
Table I.4: The importance of segment disclosure quality and quantity for financial
analysts’ earnings forecast accuracy .......................................................................... 111
Table I.5: Tests on the sample of Box-tickers ............................................................ 113
Chapter II
Table II.1: Sample construction ................................................................................. 162
Table II.2: Descriptive statistics ................................................................................ 164
Table II.3: Correlation matrix .................................................................................... 165
Table II.4: The role of inconsistent disclosure of operating segments across corporate
documents for financial analysts’ earnings forecast accuracy ................................... 166
Table II.5: The importance of segment information in the press release and
presentation ................................................................................................................ 167
Table II.6: The effect of inconsistency between the note and the MD&A ................ 169
Table II.7: Sensitivity analysis to endogeneity arising from unobservable correlated
variable bias ............................................................................................................... 170
Table II.8: Sensitivity analyses .................................................................................. 171
Chapter III
Table III.1: Sample construction ................................................................................ 211
Table III.2: Descriptive statistics for the main variables ........................................... 212
Table III.3: Descriptive statistics for the other variables used in the analyses .......... 215
Table III. 4: Correlation matrices............................................................................... 220
Table III.5: Determinants of the decision to provide segment-level guidance .......... 222
Table III.6: Segment-level guidance and financial analysts’ earnings forecast accuracy
.................................................................................................................................... 223
Table III.7: Segment-level guidance and earnings management ............................... 225
xii
Conclusion
Table C1: The role of inconsistency across corporate documents for financial
analysts’ earnings forecast accuracy (chapter II), controlling for segment reporting
quantity and quality (chapter I) .................................................................................. 232
Table C2: Test of the inconsistency variables (chapter II) as determinants of segment
reporting quality (SRQl) conditional on the company being a Box-ticker (chapter I)
.................................................................................................................................... 235
Table C3: Segment-level guidance and financial analysts’ earnings forecast accuracy
(chapter III), controlling for operating segment disclosure inconsistency between the
press release and the presentation to analysts (chapter II) ......................................... 237
13
Résumé substantiel en français
Cette thèse contient trois essais distincts sur la publication d’information sectorielle
que les entreprises européennes ayant plusieurs secteurs opérationnels effectuent en vertu des
IFRS 8 Secteurs Opérationnels. Chaque essai vise à améliorer notre compréhension collective
sur la politique de communication financière des cadres dirigeants en examinant diverses
caractéristiques des informations sectorielles.
Le chapitre I s’intitule “L’interaction entre la qualité et la quantité des publications
sur l’information sectorielle” et examine le choix des cadres dirigeants quant à deux
caractéristiques d’information, notamment la qualité et la quantité de l’information ainsi que
la question de déterminer si les analystes financiers sont en mesure de distinguer les
entreprises selon ces critères. La littérature antérieure a tendance à examiner chaque
caractéristique de publication d’information une à une (Beyer et al. 2010), alors que la
politique de communication financière des cadres dirigeants comprends des décisions sur un
ensemble de caractéristiques ainsi qu’un compromis potentiel entres ces caractéristiques. En
examinant comment les entreprises se positionnent relatives et à la qualité et la quantité de
l’information, cet essai vise à améliorer notre compréhension sur le mécanisme de décision
des cadres dirigeants en tenant compte du volume d’information qu’ils fournissent sur le sujet
des secteur opérationnels, ainsi que la qualité de cette information.
Le reporting lie au secteurs opérationnels établit le contexte dans lequel les cadres
dirigeants disposent de différents degrés de discrétion sur la quantité de l’information, le
nombre de renseignements comptables ligne par ligne contenue dans la note de reporting
sectorielle et l’évaluation qualitative en utilisant la variation intersectorielle de la profitabilité
(Ettredge et al. 2006; Lail et al. 2013; You 2014) comme remplacement pour le degré
d’agrégation de secteurs opérationnels économiquement semblables dans des secteurs à
14
présenter. Je soutiens que les cadres dirigeants disposent de plus de discrétion quant a qualité
de l’information que sur la quantité de l’information d’une année à l’autre due aux
différences en visibilité des ces deux caractéristiques. Ceci entraine également un mecanisme
de décision séquentiel sur la question dans quel secteur opérationnel la quantité de
l’information sectorielle est déterminée avant la qualité de l’information sectorielle. Le
nombre de renseignements comptables ligne par ligne contenue dans la note de reporting
sectorielle est facilement identifiable par les utilisateurs et fixé en fonction d’une
comparaison avec les suggestions de la norme comptable, l’information antérieure de la
même entreprise (Einhorn & Ziv 2008; Graham et al. 2005) et le comportement d’entreprises
homologues (Botosan & Harris 2000; McCarthy & Iannaconi 2010; Tarca et al. 2011).
Par conséquent, la discrétion des cadres dirigeants sur une partie volontaire de
l’information sectorielle dans les notes aux états financiers est limitée par un nombre
d’éléments qui découlent principalement de la visibilité des renseignements comptables ligne
par ligne. La qualité du reporting sectoriel cependant est moins visible et reste plus exposée à
la discrétion des cadres dirigeants que la quantité. Le changement de l’agrégation du secteur
opérationnel d’un secteur à présenter à un autre ou le transfert de certains frais entre secteurs
à présenter (Lail et al. 2013; You 2014) peut être accompli sans modifications apparentes aux
secteurs a présenter.
Tout d’abord, j’examine les raisons des cadres dirigeants pour dévier de la moyenne
ou des prévisions de quantité et de qualité d’information en regroupant des entreprises en
Under-disclosers/Box-tickers/Over-disclosers basé sur la quantité d’information sectorielle,
ainsi que le LowQl/AvgQl/HighQl basé sur la qualité d’information sectorielle. Les résultats
informent que lorsque confrontés aux frais indirects et aux frais de représentation, les cadres
dirigeants sont plus susceptibles de fournir moins de renseignements comptables ligne par
ligne que recommandé en IFRS 8 (c.à.d. Under-disclosers vs. Box-tickers), alors que le plus
15
que le résultat financier est élevé au niveau consolidé, les cadres dirigeants ont plus tendance
à fournir des informations de qualité élevée sur les secteurs opérationnels (c.à.d. HighQl vs.
AvgQl). Ce qui est plus intéressant, je constate que les cadres dirigeants qui suivent la
stratégie de renseignement ligne par ligne recommandée par la norme IFRS (c.à.d. Box-
tickers) résolvent les préoccupations liées aux renseignements commerciaux de nature
exclusive en réduisant la qualité de l’information des secteurs opérationnels à présenter. Ce
résultat soulève des questions sur la valeur informative globales des informations sectorielles
et correspond à l’impression des investisseurs et des analystes financiers qu’une quantité de
l’information élevée constitue un rideau de fumée pour une qualité basse. Ces résultats
contribuent en particulier à notre compréhension de l’information sectorielle selon la version
révisée de la norme IFRS et plus généralement de notre compréhension de la politique de
communication financière des cadres dirigeants.
Deuxièmement, je m’intéresse à la question comment l’exactitude des prévisions de
résultat des analystes financiers varie en fonction de la qualité et la quantité de l’information.
Je constate que les analystes sont moins exacts pour des entreprises dans les catégories
Under-disclosers et Over-disclosers, notamment en comparaison avec les entreprises Box-
tickers. Ce résultat est cohérent avec Lehavy et al. (2011) qui constatent que les prévisions de
résultats pour des entreprises avec des rapports financiers 10-K plus longs sont mois exactes
et soutiennent l’impression des régulateurs et des investisseurs sur les effets négatifs d’une
politique de communication financière excessive sur les prises de décisions des investisseurs
(p.ex. Thomas 2014). Les analystes sont plus exacts pour les entreprises dans la catégorie
HighQl en comparaison avec les entreprises AvgQl, mais relativement moins inexactes pour
les entreprises LowQl. Afin d’obtenir une introspection dans les effets de l’interaction entre la
qualité et la quantité de l’information sur la qualité des précisions des analystes, j’essaye de
créer une interaction entre les groupes qualitatifs et quantitatifs. Les résultats démontrent
16
qu’en comparaison avec les groupes de référence Over-discloser & HighQl, Box-ticker &
HighQl, Box-ticker & LowQl, ainsi que Box-ticker & AvgQl, entrainent généralement une
exactitude de prévisions améliorée. En général, les résultats suggèrent que trop de quantité de
l’information peut être accablant à traiter et que même les utilisateurs avertis semblent
incapables de reconnaître une agrégation sectorielle inadéquate. Tenant compte du fait que
les normalisateurs semblent de plus en plus favoriser une approche des normes sur la base de
l’approche du modèle économique (Leisenring et al. 2012), ces résultats devraient intéresser
les normalisateurs ainsi que les utilisateurs.
Le deuxième essai s’intitule “La non-conformité des informations sectorielles à
travers les documents d'entreprise. ”. Je qualifie l’incohérence de l’information à travers des
documents d’entreprise comme la variation de ce qu’une entreprise publie sur le même sujet
dans différents documents relatifs à la même période fiscale. Je me concentre sur la
publication d’information liée aux secteurs opérationnels, due aux obligations IFRS8 qui
alignent le reporting externe avec l’organisation interne de l’entreprise. Ainsi, il n’existe
aucune raison ex-ante qui engendrait une attente vis-à-vis des cadres dirigeants de
publier l’information liée aux différents secteurs opérationnels dans différents documents
d’entreprises relatifs à la même période fiscale. J’examine si et de quelle mesure les
entreprises à plusieurs secteurs opérationnels publient l’information liée aux secteurs
opérationnels de manière incohérente à travers un nombre de différents documents
d’entreprise et comment cette publication incohérente affecte l’exactitude des prévisions de
résultat des analystes financiers. Les réponses à ces questions nous fourniront des
introspections sur (1) la stratégie de communication pour le paquet de communication global,
(2) l’utilisation de l’information contenue dans les différents documents de l’entreprise par
les analystes financiers, ainsi que (3) la pratique des régulateurs de vérifier la conformité avec

17
le reporting sur les secteurs opérationnels selon l’approche retenue par la Direction, en
comparant les secteurs opérationnels publiés dans divers documents et endroits.
En utilisant des données recueillies manuellement de quatre sortes de documents (1)
notes aux états financiers, (2) les discussions de la Direction ainsi que l’analyse, (3) annonces
de presse de résultat, ainsi que (4) la présentation préparé pour l’appel avec les analystes
financiers, je catégorise les entreprises comme Inconsistent s’il existe une variation dans les
secteurs opérationnels informés dans ces documents. Comme cette variation peut être le
résultat d’une désagrégation de certains secteurs opérationnels dans certains documents de
l’entreprise par les cadres dirigeants ou due au fait que les secteurs opérationnels
communiqués dans certains documents sont radicalement différents de secteurs
opérationnelles communiqués dans d’autres documents, je catégorise les entreprises
davantage en deux catégories. Inc_AddDisclosure (c.à.d. les secteurs opérationnels
désagrégés sont communiqués de telle manière qu’ils sont facilement réconciliables avec les
secteurs opérationnels communiqués dans d’autres documents) et Inc_DiffSegmentation (c.
à.d. les secteurs opérationnels sont communiqués de telle manière qu’ils ne sont pas
facilement réconciliables avec les secteurs opérationnels communiqués dans d’autres
documents. J’en conclus que, sur la base de mon échantillon de 400 entreprises à plusieurs
secteurs opérationnels, presque 39% communiquent leurs secteurs opérationnels de manière
incohérente à travers les divers documents considérés de l’entreprise. Les entreprises qui ont
désagrégées certains des secteurs opérationnels dans certains documents représentent 11% de
l’échantillon, tandis que les entreprises qui communiquent des segmentations différentes
représentent 28% de l’échantillon.
Apres avoir documenté le comportement de publication incohérent dans l’échantillon,
je m’intéresse ensuite sur la question de savoir si le comportement de publication incohérent
affecte les analystes en capital du coté acheteur, un groupe important et averti d’utilisateurs
18
d’informations comptables (Bradshaw 2009, 2011; Mangen, 2013). Les analystes sont
également les plus inclinés à considérer la range de débouchées de publication considérée
dans cet essai lorsqu’ils recueillent l’information sur les entreprises qu’ils couvrent. Ainsi, si
l’incohérence affecte un groupe en particulier, les analystes financiers sont le candidat le plus
probable. Leur objectif inclut le recueil d’information sur une entreprise en provenance d’un
nombre de sources, afin de rassembler le “puzzle” qu’est l’entreprise, créer une image sur ses
perspectives futures and de fournir des recommandations sur l’investissement dans cette
entreprise. La question est si le recueil d’information incohérent (c.à.d. variable) de
différentes sources se répercute négativement sur la faculté des analystes d’effectuer leur
objectif correctement.
Mon attente est de découvrir un impact de l’incohérence de communication sur les
prévisions des résultats des analystes due au cout d’extraction de données de documents
publiques ainsi que du traitement d’information sur la base de ces données (l’hypothèse de
Bloomfield 2002 sur la révélation incomplète). L’obtient d’information différente sur le
même sujet qui devrait à priori être identique crée de la confusion. Par conséquent,
l’incohérence agrandit le cout de traitement d’information, non seulement en ce qui concerne
le temps mais également concernant l’effort, ce qui suggère une relation négative entre
l’incohérence dans la communication et l’exactitude des prévisions de résultat. En revanche
l’incohérence pourrait également signifier que plus d’information est disponible. La variation
dans les secteurs opérationnels publie dans plusieurs documents pourrait ainsi indiquer que
les analystes reçoivent plus d’information sur l’organisation et le fonctionnement de
l’entreprise ce qui devrait entrainer une exactitude améliorée des prévisions des résultat. Les
résultats démontrent que la variation dans le paramètre de publication (Inconsistent) n’est pas
considérablement relié à l’exactitude des previsions des analystes. Cependant, des tests
utilisant des catégories améliorées montrent que Inc_AddDisclosure est positivement associe

19
alors que Inc_DiffSegmentation est négativement associe avec l’exactitude des prévisions de
résultat. En d’autres termes, l’incohérence qui résulte de certains secteurs opérationnels étant
davantage désagrégées dans certains des documents, de telle manière qu’ils peuvent être
réconciliées relativement facilement afin de fournir une image sur l’organisation interne de
l’entreprise constitue plus d’information, facile à traiter sans générer des couts considérables,
est utile pour les analystes. Cependant, l’incohérence qui résulte de la publication des
segmentations différentes qui sont impossibles ou difficiles à réconcilier a travers plusieurs
documents afin de générer une image de l’entreprise semble contribuer à la confusion des
analystes et affecte leur capacité d’exactement évaluer les perspectives de l’entreprise
globale. D’autres tests démontrent que la publication de différentes segmentations au sein du
rapport annuel (c.à.d. les notes vis-à-vis de la discussion et l’analyse des cadres dirigeants)
est associe avec des erreurs plus importantes sur les prévisions moyennes et la dispersion des
prévisions pour la période d’avant jusqu’après la publication du rapport annuel.
En considérant les publications faites dans un ensemble de documents, cet essai tente
de faciliter notre compréhension de la politique de communication financière retenue par la
Direction ainsi que les effets de cette politique. En plus des états financiers, les cadres
dirigeants utilisent un nombre de débouchées afin de communiquer l’information financière.
Cet essai met en évidence le rôle qu’une caractéristique préalablement non-documentée de
l’information financière publiée à travers plusieurs documents a sur les utilisateurs
principaux, ce qui met également en relief les publications comptables ainsi que les
caractéristiques qui rendent ces publications utiles. D’un point de vue pratique, comme les
analystes financiers représentent un lien important entre l’entreprise et les marchés du capital,
les cadres dirigeants s’intéressent à comprendre le meilleur choix de communication
(Bradshaw 2011) et cet essai couvre notamment ce sujet. L’essai a également des
implications pour les régulateurs ainsi que le débat actuel sur le disclosure framework

20
(Barker et al. 2013). Ces résultats complémentent également certaines preuves de sondage qui
mettent en évidence l’importance que les investisseurs et analystes rattachent à la cohérence
de l’information publiée (CFA Institute 2013). Tenant compte de ces résultats, les régulateurs
et normalisateurs devraient évaluer le besoin de considérer la cohérence de l’information à
travers différents documents comme une caractéristique de la qualité de l’information que les
entreprises devraient être encouragés à respecter.
Le troisième essai s’intitule “Prévisions managériales au niveau sectoriel.” Et
complémente la littérature sur les caractéristiques des prévisions managériales en examinant
spécifiquement les prévisions managériales faites au niveau des secteurs opérationnels. Les
cadres dirigeants accompagnent fréquemment leur prévisions avec des commentaires
supplémentaires comme un moyen de contextualiser ces prévisions (Hutton et al. 2003), ou
simplement afin de notifier les causes entrainant certaines prévisions (Baginski et al. 2000).
Une large quantité de recherche constate que l’information historique sur les secteurs est utile
pour les participants des marchés du capital (Behn et al. 2002; Berger & Hann 2003; Botosan
& Stanford 2005; etc). Comparativement, nous disposons de peu d’informations sur les
secteurs opérationnels quand l’information est prospective. Dans le contexte établi par ces
courants de recherche, cet essai examine (1) les caractéristiques des entreprises fournissant
les prévisions au niveau sectoriel, (2) si et comment ces prévisions au niveau sectoriel
communiquent de l’information utile pour les analystes financiers, et (3) si les prévisions au
niveau sectoriel contribuent à ou allègent la fixation de résultat par des cadres dirigeants
(c.à.d. la tendance des cadres dirigeants de se concentrer excessivement sur la performance
des résultats comptables court-terme plutôt que leur potentiel long terme) (Elliott et al. 2011).
Pour l’échantillon des entreprises utilisées dans cette thèse, j’ai lu et manuellement
codé les communiqués de presse annonçant les résultats pour l’année fiscale 2009 afin de
déterminer si les communiqués contenaient des prévisions managériales. Pour ceux qui

21
contenaient des prévisions managériales, j’ai codé (1) si celles-ci avaient des commentaires
faisant référence aux secteurs opérationnels de l’entreprise, (2) le détail des prévisions
sectorielles c.à.d. point, gamme, estimation minimale, ou simplement narratif, et (3) la
désagrégation des prévisions sectorielles relatives au type d’information fourni, c.à.d.
résultats sectoriels, revenus sectoriels, postes de dépense sectoriels, ou rapports non-
financiers (similaire au coding du guide de revenus sectoriels dans Lansford et al. 2013).
J’explore tout d’abord les caractéristiques de l’entreprise associé à la probabilité de
fournir des prévisions sectorielles. Les résultats suggèrent que les entreprises dans la haute
technologie sont moins susceptibles de préparer des prévisions sectorielles, probablement du
à leur modelé économique qui entraine des cash-flows incertains et une prévisibilité de
résultats réduite (Barron et al. 2002).
Le deuxième groupe d’analyses se concentre spécifiquement sur la question si les
prévisions de résultats des analystes financiers sont plus exactes quand les cadres dirigeants
préparent des prévisions sectorielles, et plus généralement à fournir de la preuve sur la
question si l’information sectorielle prospective sert aux utilisateurs de l’information
comptable. Les résultats des équations de régression des firmes d’analystes indiquent que
fournir des prévisions sectorielles est considérablement et positivement associé à l’exactitude
des prévisions de résultat, le controlling des prévisions managériales au niveau consolidé et
les caractéristiques des prévisions comme la désagrégation de postes (selon Lansford et al.
2013). Ainsi, fournir des prévisions désagrégées au niveau des secteurs opérationnels semble
être marginalement plus utile aux analystes financiers, au delà des prévisions de résultats ou
pour d’autres postes comptables préparés pour l’entreprise entière.
Troisièmement, je vérifie la relation entre les prévisions sectorielles et la gestion de
résultat dans la période pour laquelle les prévisions sont préparées. Les résultats démontrent
que fournir les prévisions sectorielles est positivement associé avec le comportement de

22
gestion de résultat, et que des prévisions plus précises intensifient cette relation. De plus ce
résultat est cohérent avec des résultats antérieurs qui suggèrent que la gestion des résultat n’a
pas seulement lieu au niveau du siège social, mais également au niveau des divisions lorsque
les cadres dirigeants intermédiaires sont motivés de telle manière à produire une gestion de
résultats.
En dehors de la contribution à la littérature comptable en complémentant la preuve sur
les informations supplémentaires dans les courants de recherche des prévisions managériales
(c.à.d. Hutton et al. 2003) et en dépassant le point de vue historique sur l’information
sectorielle de la littérature de reporting, cet essai a également un impact sur les parties
impliqués dans le débat sur la question de savoir si les cadres dirigeants devraient fournir des
prévisions du tout. Dans un contexte dans lequel les prévisions qualitatives, narratives et
désagrégées sont considérées comme une solution pour prévenir la fixation de revenus et le
short-termism, comprendre quelle caractéristiques de publication d’information contribuent à
réaliser ce rôle et comment, est d’importance pour les cadres dirigeants, les investisseurs et
les régulateurs similairement.
23
General introduction
1. General overview and structure of the thesis
Financial statements are a fundamental means of communication for companies with
the capital markets (IASB, 2013b). Besides preparing the accounting numbers, managers also
spend considerable time thinking about the ways in which to communicate information,
either mandatory or voluntary, about their firms in the notes to financial statements and in
other venues believing that their disclosure decisions have meaningful effects on capital
market outcomes (Miller & Skinner, 2015). In recent years, users have signalled what is
commonly referred to as “the disclosure problem” (IASB, 2013b). More specifically, the
results of a forum and survey organized by the International Accounting Standards Board
(IASB) reveal that users argue that companies’ annual reports have become longer over time
but contain less useful information, more repetition (see also Li, 2013), and that disclosures
are often boilerplate or generic without tackling the important aspects that have changed from
one year to the next (IASB, 2013b). In this context, providing evidence on why managers
make certain disclosure choices and how their disclosure strategy resonates with the users of
accounting information could enrich our collective understanding of what makes disclosures
useful for the capital markets, and potentially contribute to regulators and standard setters’
efforts to address “the disclosure problem” (e.g., IASB’s Disclosure Initiative project).
This thesis focuses on operating segment information as a topic of disclosure due to
its importance for capital market participants (see Nichols, Street, & Tarca, 2013 for a
literature review), and purely disclosure character, i.e., no recognition or measurement
implications, which allows to more cleanly draw insights into the role of disclosure
characteristics. In addition, standard setters’ interest in how companies disclose segment
information extends beyond “the disclosure problem” to the way in which their segment
24
reporting standards perform (FAF, 2012; IASB, 2013d) given that this is the first standard
introducing a business-model approach for external financial reporting (Leisenring,
Linsmeier, Schipper, & Trott, 2012). Therefore, this thesis also has practical implications for
standard setters’ decisions as they work to extend the business model-based approach to other
financial reporting standards.
Managers mainly disclose information to communicate with capital market
participants and intermediaries. As sophisticated users of accounting information (Bradshaw,
2011; Brown, Call, Clement, & Sharp, 2015; Mangen, 2013) oftentimes covering large,
diversified companies, financial analysts are a main audience for managers’ accounting
disclosures, in general (e.g., Hope, 2003a, 2003b), and operating segment disclosures, in
particular (e.g., Herrmann & Thomas, 1997). Interviews conducted with financial analysts in
the course of preparing this thesis confirm the importance of segment information for their
work and point to the areas of managers’ disclosure strategies that analysts find useful or
troublesome. For these reasons, this thesis focuses on sell-side equity financial analysts’
earnings forecast accuracy to gauge the role and usefulness of disclosure characteristics.
Based on issues raised by the interviews with financial analysts, on issues debated as
part of the IASB’s Disclosure Forum (IASB, 2013b), and building on prior literature in
accounting disclosure and segment reporting, this thesis aims to provide evidence, broadly,
on why managers make certain disclosure choices and the role that these choices have for
users’ decision-making. In the context chosen for this thesis, this broad research question
translates into three specific questions. First, why managers choose to disclose a certain level
of segment reporting quantity and quality and how the interplay between these two disclosure
dimensions influences financial analysts’ earnings accuracy (chapter I). Second, what the role
of disclosing operating segments across a set of corporate documents is and how disclosing
operating segments inconsistently influences financial analysts’ earnings accuracy (chapter
25
II). And third, why and how managers disclose forward-looking information at the segment-
level, its importance for financial analysts, and whether it influences managers’ future
earnings management behaviour (chapter III).
By providing evidence based on manually-collected data that addresses these research
questions, this thesis contributes to the accounting disclosure literature by shedding additional
light on our understanding of managers’ disclosure and communication strategies (Miller &
Skinner, 2015). I do this by identifying and examining disclosure dimensions new to the
literature, i.e., inconsistency across corporate documents (chapter II) and segment-level
forward-looking information (chapter III) and by looking at two disclosure characteristics,
quantity and quality, at a time (chapter I). This thesis also contributes to the corporate finance
literature on diversification by pointing out the discretion that managers have in disclosing
operating segment information which may reflect on some of the results in this stream of
literature (Villalonga, 2004). The findings in this thesis also have the potential to inform
standard setters, regulators, managers, financial analysts, and investors.
This thesis begins with a general introduction, continues with three chapters that
represent individual papers connected by their common broad topic and institutional setting,
and ends with a general conclusion. The general introduction discusses the institutional
background, financial analysts’ interest in this particular topic, the research questions that this
thesis aims to contribute to, the prior literature on segment reporting, the fit of this thesis into
the accounting disclosure literature and its link to the corporate diversification literature in
finance along with the contribution that it makes to these literatures. The introduction also
contains a broad overview of the research questions, findings, and contributions for each of
the three essays.

26
The three essays are presented in chapters I to III. Each of these three chapters has a
stand-alone structure and ends with appendices that contain the corresponding empirical
analyses. The essays are entitled:
I. The Interplay between Segment Disclosure Quantity and Quality
II. Inconsistent Segment Disclosure across Corporate Documents
III. Management Guidance at the Segment Level.
Finally, this thesis ends with a general concluding chapter that discusses the contribution and
practical implications of this thesis, its limitations, and avenues for potential future research.
This concluding chapter also presents a set of additional empirical analyses meant to bring
together the three essays. The purpose of the general introduction and conclusion is to
provide the reader with a comprehensive summary of the three essays.
2. Institutional background
By examining the disclosures that managers of European multi-segment firms make
on operating segments, the three essays in this thesis share the same institutional background.
The focus is on segment information disclosed after the mandatory implementation of IASB’s
standard IFRS 8 Operating Segments. The most compelling evidence that segment reporting
is useful information for the capital markets can be gleaned from the history of this
disclosure: this information was first provided voluntarily by diversified companies. Even
after successive changes to the requirements of the segment reporting standards following
demands from users, segment reporting continues to be a topic of interest for both users of
accounting information, and standard setters. This section discusses the evolution and
requirements of the Financial Accounting Standards Board (FASB) and IASB’s segment
reporting standards.
27
2.1 The evolution of segment reporting regulation in the U.S. and Europe
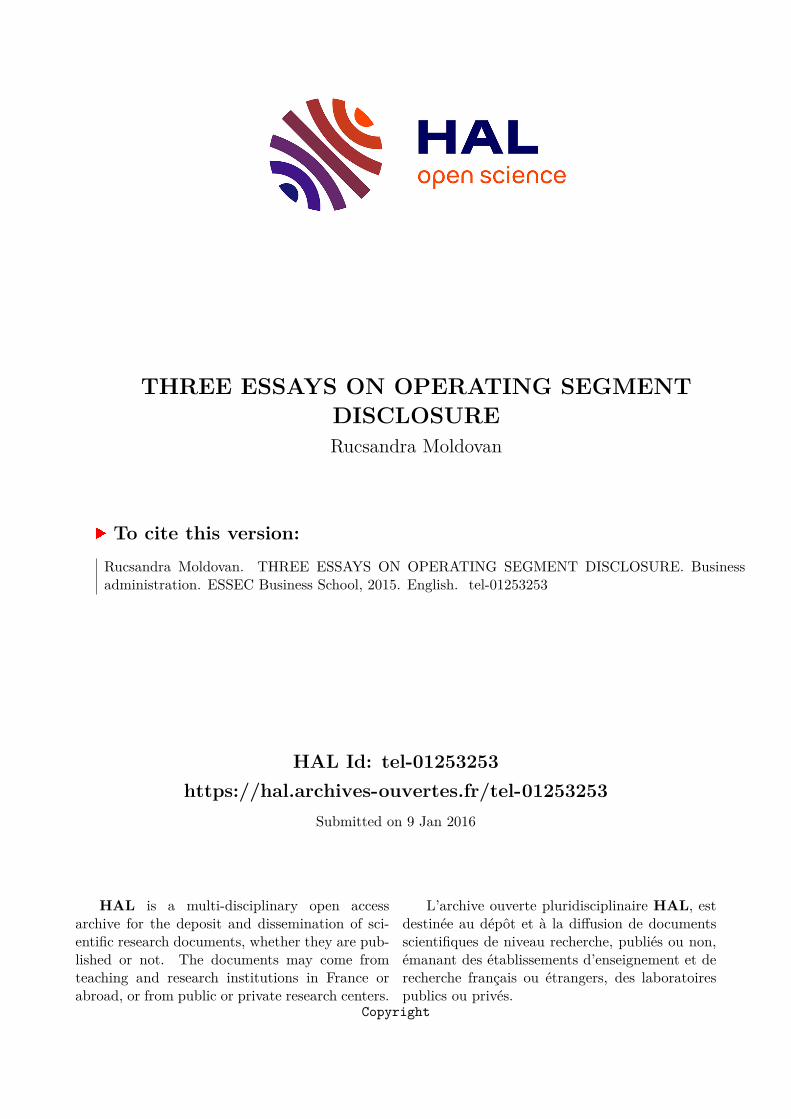
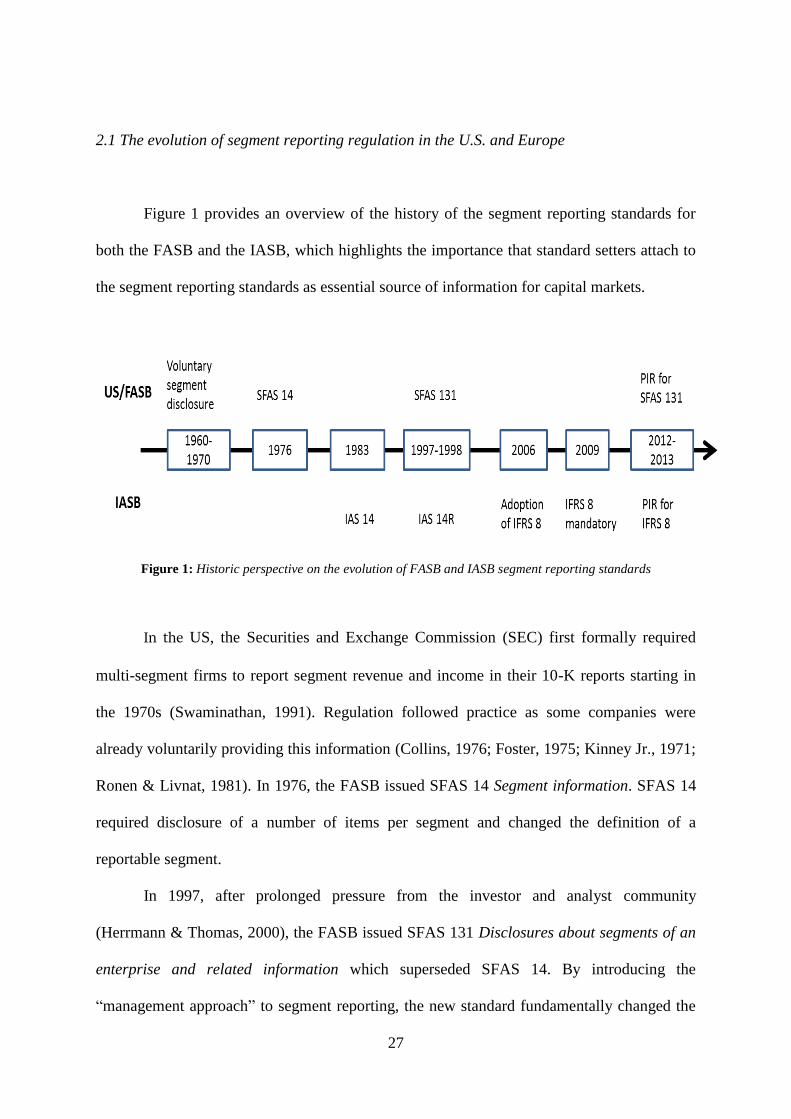
Figure 1 provides an overview of the history of the segment reporting standards for
both the FASB and the IASB, which highlights the importance that standard setters attach to
the segment reporting standards as essential source of information for capital markets.
Figure 1: Historic perspective on the evolution of FASB and IASB segment reporting standards
In the US, the Securities and Exchange Commission (SEC) first formally required
multi-segment firms to report segment revenue and income in their 10-K reports starting in
the 1970s (Swaminathan, 1991). Regulation followed practice as some companies were
already voluntarily providing this information (Collins, 1976; Foster, 1975; Kinney Jr., 1971;
Ronen & Livnat, 1981). In 1976, the FASB issued SFAS 14 Segment information. SFAS 14
required disclosure of a number of items per segment and changed the definition of a
reportable segment.
In 1997, after prolonged pressure from the investor and analyst community
(Herrmann & Thomas, 2000), the FASB issued SFAS 131 Disclosures about segments of an
enterprise and related information which superseded SFAS 14. By introducing the
“management approach” to segment reporting, the new standard fundamentally changed the

28
manner in which firms provide segment information (Herrmann & Thomas, 2000). The
management approach aligns external segment reporting with firms’ internal organization for
operating decision purposes. The basis of segmentation could be products and services,
geographic area, legal entity, customer type, or another basis as long as it is consistent with
the internal structure of the firm. Unlike SFAS 14 that required the disclosure of a two-tier
segmentation (i.e., primary and secondary segments) based on line-of-business and
geography, SFAS 131 does not require segment reporting on a secondary basis. Instead,
SFAS 131 requires disclosures for the reportable operating segments of the company based
on internal organization, and entity-wide disclosures comprising additional information about
the company’s products and services and about the company’s geographic areas of operation
(i.e., country of domicile and any country in which company operations generate a material
portion of total sales or have allocated a material portion of total assets), if the reportable
segment disclosures do not provide it (Nichols, Street, & Gray 2000).
Concurrent with the adoption of SFAS 131 in the US, the International Accounting
Standards Committee (IASC) revised IAS 14 Reporting financial information by segment and
issued IAS 14R Segment reporting. Under IAS 14R, companies had to follow the line of
business and geographic disclosures for primary and secondary segments. The primary
segments had to be identified based on the management approach modified by a risks and
rewards qualification. In other words, if the primary segments identified through the
management approach did not exhibit similar risks and rewards characteristics, the groupings
had to be modified based on these characteristics (Nichols, Street, & Cereola, 2012). In an
additional departure from the management approach, the information had to be consistent
with the consolidated statements (Nichols et al., 2012), meaning that reporting non-GAAP
measures was not allowed.
29
Among the companies that used International Accounting Standards in their financial
statements for 1997-1999, large companies audited by Big 4 auditors, listed on multiple stock
exchanges, and from Switzerland showed greater compliance with IAS 14R than other
companies (Prather-Kinsey & Meek, 2004). Street & Nichols (2002) examine segment
disclosures under IAS 14R and find that the switch led to many previously single-segment
companies to report as multi-segment, more items of information being disclosed, increased
consistency in segments disclosed in the notes and in other parts of the annual report, but that
problems related to the disclosure of geographical groupings, to the consistency with the
other parts of the annual report, and to the compliance with all the new disclosure guidelines
still persisted in the way many firms disclosed their segments.
In 2006, the IASB issued a new standard, IFRS 8 Operating Segments, effective 2009,
to replace IAS 14R. As part of the IASB-FASB convergence process (The Norwalk
Agreement), the two standard setting bodies began working jointly on a set of short-term and
long-term major projects meant to eliminate a variety of differences between IFRS and US
GAAP. Work on segment reporting requirements made the object of such a short-term joint
project, and resulted in the IASB adopting IFRS 8, a standard based closely on SFAS 131,
except for minor differences and terminology changes to be consistent with the other IFRSs
(IASB 2006), essentially replacing the “qualified” management approach in IAS 14R with
the “pure” management approach of SFAS 131 that places no restrictions on segment format
as long as the operating segments are based on the company’s organizational structure
(Nichols, Street, & Tarca, 2013).
Academic research and practitioner reports examine firms’ segmental disclosures
following the implementation of IFRS 8 and find generally consistent results (Nichols, Street,
& Tarca, 2013 provide a detailed literature review). Specifically, and relevant for this thesis,
for companies in the European Union, there seems to be, on average, an increase in the

30
number of reported operating segments (e.g., Nichols, Street, & Cereola (2012) for a sample
of European blue chip companies, Crawford, Extance, Helliar, & Power (2012) for a
companies in FTSE 100 companies, but not significantly higher for companies in the FTSE
250), although most companies report the same number of operating segments under IAS
14R and IFRS 8 (also ESMA, 2011). Further, the number of information items disclosed per
segment is, on average, lower under IFRS 8 than under IAS 14R (Bugeja, Czernkowski, &
Moran, 2014; Crawford et al., 2012; Nichols et al., 2012) most likely due to the caveat
contained in IFRS 8 that most items shall be disclosed if they are reported to the
management. According to the European Securities Market Authority (ESMA), financial
analysts and investors denounced the management approach to segment reporting (ESMA,
2011), but a majority of preparers and auditors interviewed in the UK by Crawford et al.
(2012) welcomed the management approach underpinning IFRS 8.
In recent years, segment reporting has continued to be on standard setters’ agendas as
both SFAS 131 and IFRS 8 have been subject to post-implementation reviews (PIR) (FAF,
2012; IASB, 2013d).1 Both post-implementation reviews have found issues with respect to
segment identification and aggregation criteria, definition of the chief operating decision
maker, line-items disclosed in the note, and other disclosure requirements such as
reconciliations. Overall, one third of the Financial Accounting Foundation (FAF) survey
respondents declare they are somewhat dissatisfied with the information provided under
SFAS 131, while the PIR conducted by the IASB finds that IFRS 8 works generally well,
with better enforcement improving disclosure (Moldovan, 2014).
In concluding these PIRs, the IASB and the FASB note that they will consider the
importance of the issues uncovered and will tackle them as part of their future work (FAF,
1 Post-implementation reviews are additional mechanisms of standard assessment and oversight that the IASB
and the Financial Accounting Foundation (FAF) introduced in 2007 and 2009, respectively (Blouin & Robinson,
2014; Moldovan, 2014). These complement other review mechanisms such as interpretations, annual
improvements, and three-yearly consultations on the IASB work plan (IASB, 2013d).
31
2012; IASB, 2013d). For the IASB, the segment reporting requirements are also part of the
Disclosure Initiative project (IASB, 2013d) which is currently still on its agenda. Bottom line,
although “only” a matter of presentation, segment reporting is a hot topic of interest for
standard setters and is expected to continue to be on their agendas.
2.2 The requirements of IFRS 8 Operating Segments
As mentioned above, IFRS 8 Operating Segments requires the “pure” management
approach to segment reporting which aligns reporting to external users with firms’ internal
organization. Operating segments are defined as components of an enterprise (1) that engage
in business activities earning revenues and incurring expenses, (2) that are regularly reviewed
by management, and (3) for which discrete financial information is available (IASB, 2006a).
The basis of segmentation could be products and services, geographic area, legal entity,
customer type, or another basis as long as it is consistent with the internal structure of the
firm. Unlike under IAS 14R, disclosure based on geographic areas is not required unless it is
the main way in which operations are internally organized. IFRS 8 mandates a segment profit
and loss measure and suggests a number of other accounting items that should be reported in
the segment note if the chief operating decision maker uses those measures in the normal
course of business to evaluate the performance of and/or allocate resources to the operating
segment.
Although supposed to provide more decision-useful information, problems in the way
these standards are applied continue to generate criticism from investors (ESMA, 2011). One
of the main topics of debate is the aggregation of operating segments into reportable
segments. According to the standard, operating segments that are economically similar can be
aggregated into a single operating segment and reported as such. ESMA (2011) observed that
32
disclosures on aggregation of segments were explicitly mentioned by 29% of issuers only
although IFRS 8.22(a) refers to this piece of information as an example that contributes to
helping investors understand the entity’s basis of organization, and concludes that the level of
subjectivity in deciding how aggregation should be applied may lead to diversity in practice.
Investors and analysts’ views reported in the post-implementation review generally hold that
the information provided under IFRS 8 is not meaningful as it is not reported at a sufficiently
low level of granularity (ESMA, 2011; IASB, 2013d).
The standard specifies three plus one quantitative thresholds to guide managers’
decisions on the materiality of operating segments. A standalone operating segment or one
aggregated as specified should be reported if it meets the quantitative thresholds or if
management considers this information is useful to financial statement users (IASB, 2006a).
The three main quantitative thresholds are (1) at least 10% of combined internal and external
revenue of all operating segments, (2) at least 10% of combined reported profit or loss of all
operating segments, and (3) at least 10% of combined assets of all operating segments. In
addition, if less than 75% of the consolidated revenue is allocated to reportable segments
additional operating segments should be identified to be reported, even if they do not meet
the three main quantitative thresholds (IASB, 2006a).
The standard requires that managers disclose in the notes the measures they use
internally to evaluate performance and allocate resources. The standard mandates the
disclosure of a profit or loss measure at the operating segment level and lists other accounting
line items such as assets, liabilities, external revenue, internal revenue, interest revenue
and/or expense, depreciation and amortization, interest in the profit or loss of associates and
joint ventures, income tax expense and/or income, deferred income tax assets, investments in
associates, post-employment benefit assets, rights arising under insurance contracts (IASB
33
(2006) paragraphs 8.23 and 8.24) that should be disclosed if the management reviews them
regularly.
In short, investors should see the company “through the eyes of the management,”
both in terms of the operating segments disclosed and in terms of the information disclosed at
the operating segment level. With the management approach as the overarching guiding
principle, IFRS 8 is IASB’s first standard that follows the business model approach for the
purpose of financial reporting (Leisenring et al., 2012).
2.3 Business model-based financial reporting
As discussed in the previous subsection, although there is no explicit reference to this
in the standard, IASB’s business model-based approach to standard setting transpires from all
the requirements of IFRS 8. From this point of view, the IASB’s interest in how companies
report segment information and in conducting the post-implementation review for IFRS 8
should also be interpreted in light of the Discussion Paper “A Review of the Conceptual
Framework for Financial Reporting” which explicitly proposes the use of the business model
concept in financial reporting and which gives IFRS 8 as example of standard created with
the business model approach in mind (IASB, 2013a). The IASB first explicitly referred to
business model-based financial reporting in the case of IFRS 9 Financial Instruments but
without defining the concept (IASB, 2013a, 2013c). The Discussion Paper on the Conceptual
Framework still does not provide a definition of this concept, but clarifies that business
model is different from management intent (issue pointed out in Leisenring et al., 2012a) and
34
that it is not a choice but rather a matter of fact observable from the way in which the
company is managed and information is provided to the management (IASB, 2013a).2
The IASB’s initial assessment is that considering how an entity conducts its business
activity in the standard setting process will enhance the relevance of financial statements
since it provides insights into how the business is managed (IASB, 2013a). The Discussion
Paper, as well as prior literature, also discusses the disadvantages of using the business model
concept for financial reporting. Besides the difficulty to define and apply consistently, the
business model approach is also thought to reduce comparability because the same economic
phenomena could be classified in different ways, and to encourage less neutral or strategic
use in order to report the desired results (IASB, 2013a; Leisenring et al., 2012).
Another problematic aspect of business model-based standards is enforcement. IFRS
8, and its U.S. counterpart, is currently the only business model-based standard actually
implemented, and the main area of concern is whether indeed the operating segments
reported reflect the internal organization of the company (ESMA, 2011; Pippin, 2009). In
Europe, ESMA follows the practices established by the SEC (BDO, 2011; ESMA, 2011,
2012). Part of the Staff’s work is to compare the information that companies disclose in the
financial statements with those disclosed elsewhere:
“The Staff in the Division of Corporation Finance routinely look outside the four
corners of SEC filings and submissions in connection with SEC filing reviews, examining the
content of various non-filed corporate communications – including company press releases
and statements made by officials during company or third-party sponsored investor
conferences conducted via telephone and/or the Internet – as well as analyst reports, news
articles and blogs covering the company. The Staff’s stated objective here is to assess the
consistency of filed and non-filed communications being made by public companies, along
with perceptions of those communications, with a view toward determining whether all
required material information has been disclosed in SEC-mandated documents […] and to
ensure consistency between formal and informal presentations of the company’s financial
condition and results of operations.” (Dixon, 2011)
2 This last clarification is particularly relevant for chapter II of this thesis where I argue that the internal
organization reflected in the operating segments disclosed in the notes to financial statements is a matter of fact
and there is no ex ante reason to expect it to change across published corporate documents that refer to the same
accounting period.
35
From this point of view, the experience of reporting under IFRS 8 is all the more
under scrutiny, as standard setters move more and more towards this approach, and regulators
grapple to find ways to enforce such standards. Considering that the essays in this thesis
provide evidence on the way in which companies disclose segment information under the
business model approach and its usefulness for a sophisticated category of users, and that the
IASB has still not made a definitive decision on what the revised Conceptual Framework will
look like (according to the IASB website, an Exposure Draft is planned for the second quarter
of 2015), this thesis has the potential to contribute to the current debate surrounding the
adoption of the business model concept for financial reporting.3
In this section, I motivated my focus on segment reporting by discussing standard
setters’ interest in segment information based on the history and evolution of the standards
and in light of the foreseeable future of standard setting at the international level. Next, I also
motivate this thesis from the perspective of the usefulness of segment information for
financial analysts, a sophisticated category of users of accounting information.
3. Do financial analysts care about segment information?
For diversified companies, segment information is one of the most important pieces of
information for those who aim to understand the prospects of the business as is the case with
financial analysts and investors (Healy, Hutton, & Palepu, 1999; Ramnath, Rock, & Shane,
2008). Alongside investors in general, financial analysts’ interest in segment reporting is
demonstrated by their requests for standards that require more disaggregated and more
informative segment information, which has led to changes in the segment reporting
3 The IASB’s website was accessed on April 8
th, 2015 at the following address: http://www.ifrs.org/Current-
Projects/IASB-Projects/Pages/IASB-Work-Plan.aspx
36
standards from an industrial and geographical view on the risks and returns of the company,
to the management approach to segment reporting (Herrmann & Thomas, 2000).
Financial analysts are sophisticated, financially-literate users of accounting
information (Bradshaw, 2011; Brown et al., 2015; Mangen, 2013) that provide an information
processing and monitoring role (Livnat & Zhang, 2012; Ramnath et al., 2008) to the capital
markets. In their information processing role, analysts collect mainly public information on
the company from the company itself and other various sources (e.g., business press,
macroeconomic news etc.) and employ their financial expertise and industry and/or
institutional knowledge to analyze and interpret the information (Brown et al., 2015; Livnat
& Zhang, 2012). Their final, main output is a recommendation to capital market participants,
i.e., sell/buy/hold etc. Earnings forecasts are an intermediary output, one that analysts then
use to generate the recommendation and analyst report (Schipper, 1991).
In their work forecasting future earnings for diversified companies, analysts start by
forecasting earnings for the operating segments of the company (You, 2014). This suggests
that financial analysts regard segment reporting as a main source of information on
diversified companies, and that they read and are interested in segment-related disclosure.
Some, but not all, analysts are explicit about this work routine and include the intermediary,
operating segment-level forecasts in their reports.
In order to further motivate the research questions investigated in this thesis and to
add a richer content to the archival analyses, in early April 2014 I conducted interviews with
a former French sell-side equity analyst who had worked for Morgan Stanley in London, UK
(interviewee #1), and a credit analyst currently working for OFI Asset Management in Paris,
France (interviewee #2), after having unsuccessfully contacted several other financial
analysts in the Paris area. The main focus of these interviews was to get a better sense of how
financial analysts use segment information and what they think about the way in which

37
managers disclose this information. The interviews were conducted in English in a semi-
structured manner in order to allow the interviewee to lead the interviewer to the points he
considered critical, and were recorded after obtaining the interviewee’s permission. Although
all accounts about these analysts’ way of doing their job and their opinions on the topic
discussed must be considered in the context of their individual experiences and are nowhere
near representing a reasonable sample, their thoughts and experiences can nevertheless
provide additional insights into the topic of this thesis.
The interviewees’ account related to the way in which financial analysts use segment
information confirms that when forecasting the earnings of a multi-segment firm, analysts
start from forecasting earnings for each segment.
“Because you make your forecast on the segment, you won’t forecast it [the firm]
directly, you would forecast companies by countries or by line of business, so
therefore you need to know the primary reporting, the one on which you make the
assumptions.” (Interviewee #1)
The interviewees also provided insights into the appropriateness of using certain
measures as proxies for operating segment disclosure characteristics. Interviewee #1
specifically addresses this point.
“[Interviewee #1] Sometimes you would have, I don’t know, within the segment you
would have something that is really profitable, that it’s never reported on, but that
would bring the margin up. For IT services companies (n.b., interviewee’s stated
industry specialization) generally they have a software base revenue and sometimes
you don’t see it, but you can see where they put it because sometimes for the same
type of business you had a margin that is much higher at other companies than
another one, so it’s… you can’t really trust what they tell you because you know that
they hide something to, you know, make it look good…
[Interviewer] So that’s the expectation you’re working with - they might hide
something.
[Interviewee #1] Yes, yes, quite often… for IT services companies basically they hide,
but they hide good things and bad things, and overall you know it’s a lot of contracts
so if one goes really bad, one could go really well so they don’t tell you, they just
offset each other.”
Interviewee #2 confirms this point by very bluntly saying: “When we look at it
[segmentation], by definition we don’t trust” and goes on to describing how he has seen

38
companies changing their segmentation which speaks directly to the issue of operating
segment aggregation.
“You’ve got such freedom to do that! So it’s a way of, it’s a communication tool. If I
want to show that the economic environment is great, everything is performing well,
so I need to show that I’m very aggressive and I can look for much more potential to
my equity investor, and I don’t really care about the creditors because at the time it’s
cheap money and I can have access to capital easily and I level my structure as I
want. So I will define my segment as a segment, and emphasize on the segment which
is very, how is it?… sexy. Thereafter, things change and obviously I need to
communicate to investors that I am no longer a fantastic growing story because it’s
no longer credible, so I will transform my segment from R&D growing side of new
technologies into industrial technology which generates cash. I will sacrifice my
equity financing, but I will show my creditors that I’m a very nice guy, I can reduce
my cost of capital. […] If you want to optimize your communication again, you will
change your perimeter on a regular basis. […] And you end up showing every time a
bucket of your technology portfolio which is growing, so you can communicate on a
thing that is growing every time, but once it’s no longer growing, you find another
one which has collapsed and which is growing again and so you change your
reporting. So that’s a way of communicating.” (Interviewee #2)
“In my sense, the change in perimeter of the segmentation should be more regulated
if you like. It’s too much confusing for us. […] Sometimes it’s justified, the company is
no longer the same, but sometimes it may be not that justified.” (Interviewee #2).
When asked about the line items that companies disclose in the segment note,
interviewee #1 seems to suggest that there is an “optimal” level of information that analysts
can use, and anything beyond that may not necessarily play a role in their forecast models.
“[Interviewer] Does it help if they [the companies] disclose more line items, for
example capex, cash flows and the sort?
[Interviewee #1] So yes, so basically when you look at a company, they generally
disclose what they disclose on revenues and operating profit or EBITDA.
[Interviewer] So that’s what most of them do?
[Interviewee #1] Exactly. And you would not really have, you know, cash flow
elements or even balance sheet. They would not really disclose it. Sometimes they do,
but they do it in a manner that you can’t use. So assets, liabilities by country… if you
don’t know its cash, its working capital, its fixed assets, you don’t care. So yeah, this
would mean also that from an analyst point of view this would imply that the segments
are really different and you basically would need to value them separately. […] In
your model, the more data you have, the better it is, but basically you either use it or
not… I used basically two types of data. I used data for forecasting and also had a tab
where I would track a lot of the data I wouldn’t use to forecast, but just to get a sense
of what’s happening in the business.
[Interviewer] Ok…
[Interviewee #1] So for IT services, they would report everything that is linked to
others, so it’s future revenue, but is not already recognized and following the order

39
book would be really useful, you know, all these types of things. But when you go
outside the P&L, at the order books, companies tend to report it relatively, you know,
consistently, but sometimes you had holes in your data or nothing for a quarter where
they didn’t want to show what’s happened and they don’t show it sometimes so then
you would have to call their PR and try to fill the holes and try to figure out what’s
happened.”
“Sometimes you have CFOs that on the conference call they give a lot more
information than you have in the press release… They would, you know, for each
country they would do kind of a split in terms of growth rates and would analyze, they
would tell you but orally, so you couldn’t really make, you know, a consistent
database. But for each country and each business line they would tell you the growth
rates, the price is going up or down, they would tell you a lot, but not really
consistently, so yeah, so that’s also one thing that is done by a few companies, but
they tell it orally and in a way that you can’t really, you know, track it. It helps you on
the spot, but…” (Interviewee #1)
Still related to the amount of information that companies provide in relation to their
financial reporting quality, interviewee #1 goes on to say:
“You know, you should have a simple regression to regress the earnings volatility on
the font and font size that companies use, or the amount of page per dollar of market
capitalization, then the more page you have, the lower the quality of reporting is.
Because it’s either this or the company had reporting issues in the past and therefore
to restore confidence…” (Interviewee #1)
On the topic of operating segments disclosed across corporate documents such as the
earnings announcement press release, presentation to analysts, and the annual report,
interviewee #1 says he has not covered any companies that reported inconsistently their
operating segments, and is of the opinion that, if it were the case, this would be additional
information for the analyst to use.
“I never noticed a difference between the press release and the accounts in terms of
operating segments, and… I don’t know, I think as an analyst you don’t really care.
You trust what they report and whether it is or it’s not audited [doesn’t really matter]
and usually it’s the same figure, so… [If this were the case,] you wouldn’t question
that, you would just say OK, that’s additional information. Because once again, I
think the fact that it’s in the accounts, you don’t really assign a lot of value to the fact
that it’s audited, at least I didn’t and my team didn’t.” (Interviewee #1)
The position of interviewee #2 is that although he has seen operating segments
disclosed inconsistently between corporate documents, he focuses on only one of them - the
40
presentation to analysts - and discards pretty much everything that is disclosed in the other
documents.
“[Interviewee #2] [We rely] more and more on the presentation than on the annual
report… the press release, forget it!
[Interviewer] Really?!
[Interviewee #2] Forget it. You just hear about their stories, and explanations that the
bad things are because of the weather. Annual report you show what is legal, what
you have to report and on the presentation there is a competition between companies
to show more and more, to be good provider of information to investors. […] A good
example, you used to disclose one very interesting information for investors - let’s say
how many cars are, say, in China. And suddenly you stop to disclose it. So the
investors tend to ask - tell me about how many cars, why didn’t you put it in the
presentation, you used to put it and so on. So you’ve got more freedom instead of
saying yeah, because it’s standard and accounting etc., you have more freedom to ask
and push companies to report in this presentation. So yes, investor presentation is
becoming more and more useful and sometimes more useful than the annual report.
[…]But that’s a very good question [inconsistency] because indeed they show the
product and they show the market. And indeed why do they do that? […] That’s a
very good question and I should have asked the question when I… (laughs) [was
covering this company]. But to be clear, what the analyst would do, they would mostly
ignore the two [segments in the note] and they would look at this [segments disclosed
in the presentation]. […] So again it’s a good transition to what we said before that
in some cases the presentation is more useful than financial statement, the
segmentation from it. Every analyst would tend to look at this one and to more or less
use this one.”
Based on these interviews, on the current debate surrounding IASB’s Disclosure
Initiative (Barker et al., 2013; EFRAG, 2012), and on existing accounting disclosure
literature (e.g., Beyer, Cohen, Lys, & Walther, 2010), I identified the broad research
questions that this thesis aims to contribute to, and the specific research questions in the
context of the type of disclosure of focus, segment information, that can be reasonably
tackled in the stand-alone research papers that compose this thesis.
4. Research questions
Companies disclose financial information to the capital markets in mandatory and
voluntary settings in an attempt to alleviate issues related to moral hazard and adverse
41
selection (Core, 2001; Healy & Palepu, 2001). Broadly classified, research that looks at
accounting disclosure aims to improve our understanding of (1) the reasons for which
managers choose to disclose information in a certain way and (2) the effects these choices
have for the users of accounting disclosures. Healy & Palepu (2001) and Beyer et al. (2010)
review the disclosure literature and argue that there are still many aspects we need to
understand, and especially that we lack a view on managers’ disclosure strategy and its
effects. More recently, Miller & Skinner (2015) acknowledge that “managers’ financial
reporting and disclosure decisions are likely to form part of an overall financial reporting
strategy designed to convey managers’ views about how well the firms’ overall operating and
business strategies are being achieved” and go on to remark that “it is clear from talking to
CFOs and other practitioners that managers spend considerable time thinking about how to
manage firms’ disclosures and that managers believe their disclosure decisions have first
order value implications.”
My thesis aims to contribute to our understanding of managers’ disclosure and
communication strategies by asking the following broad research questions:
1. What choices do managers make as part of their strategy to disclose accounting
information in the annual report and/or other corporate documents?
2. Why do managers make these choices as part of their disclosure strategy?
3. How do these choices that managers make influence the users of accounting
information?
In order to narrow down these broad research questions, I took a number of steps in
order to identify the disclosure characteristics that are important for users and standard
setters. The interviews with financial analysts have significantly contributed in this respect, as
well as reading about regulators’ practices with respect to enforcing disclosure standards, and
observing companies’ disclosure practices by going through a number of annual reports.
42
These steps resulted in focusing on disclosure quantity and quality in chapter I, inconsistency
across corporate documents in chapter II, and forward-looking information in chapter III.
Further narrowing the scope of the research on the type of disclosure (operating segment
information) and the category of users I focus on (sell-side equity financial analysts)
translates into the following specific research questions:
Chapter I (1) What explains managers’ choices with respect to the quantity and
quality of operating segment disclosure in the notes to financial
statements?
(2) How does the interplay between segment reporting quantity and quality
influence financial analysts’ earnings forecast accuracy?
Chapter II (1) To what extent do companies disclose operating segments
inconsistently across corporate documents?
(2) How does the inconsistency in operating segments between the
corporate documents influence financial analysts’ earnings forecast
accuracy?
Chapter III (1) Why do managers choose to provide segment-level guidance?
(2) How does segment-level guidance influence financial analysts’ earnings
forecast accuracy and what role do the precision and disaggregation of
segment-level guidance play?
(3) How does providing segment-level guidance influence managers’
earnings fixation and what role do the precision and disaggregation of
segment-level guidance play?
By focusing on these specific research questions and examining various
characteristics of operating segment disclosure in settings where the focus is on two
disclosure characteristics at a time (chapter I), a set of documents that are part of companies’
43
disclosure package (chapter II), or a refinement of the way in which management guidance is
provided (chapter III), the goal of this thesis is to enrich our understanding of managers’
overall disclosure strategy and its implications for capital market participants, above and
beyond the findings in prior literature.
5. Segment reporting literature
Segment information is generally regarded as an important source of useful
information about the company’s operations and prospects (see Nichols et al., 2013) as it
details the sources of consolidated earnings and managers’ diversification strategy. Prior
research provides evidence on the reasons for the aggregation of segment information and the
importance of segment reporting for analysts and investors. This research is mainly focused
on the U.S. environment, but since IFRS 8 and SFAS 131 are converged, the findings also
speak to the European environment. In fact, the IASB’s hope at the time of adoption of IFRS
8 was that the same benefits as at the time of implementation of SFAS 131 would show up in
an international context.
5.1 Determinants of segment information disclosure
The two main reasons put forth for aggregating segment information are proprietary
considerations and agency problems. Hayes & Lundholm (1996) show analytically that the
decision involves trading off the benefits of informing the capital market about firm value
against the cost of disclosing information that would potentially aid rivals and harm the firm.4
4 In equilibrium, they find that different activities are reported as separate segments when results are sufficiently
similar, but activities are aggregated into one segment when results are sufficiently different.

44
Disentangling the two determinants has been the subject of most research on segment
reporting.
5.1.1 Proprietary cost hypothesis
A number of findings lend support to the hypothesis that managers aggregate segment
information to protect profits in less competitive industries. Under SFAS 14, operations in
less competitive industries were less likely to be reported as industry segments (Harris 1998).
Firms in industries with high concentration ratios or that were dependent on a few major
customers engaged in more aggregation of segments under SFAS 14 (Ettredge, Kwon, &
Smith, 2002a). Firms initiated multi-segment disclosure under SFAS 131 after previously
reporting as single-segment were hiding profitable segments operating in less competitive
industries than their primary operations (Botosan & Stanford, 2005). Ettredge, Kwon, Smith,
& Stone (2006) find a continuing but decreased effect of proprietary costs on segment
profitability disclosures post-SFAS 131. At the international level, Nichols & Street (2007)
find a negative relation between disclosure of a business segment under IAS 14R and
company ROA in excess of the industry average, supporting competitive harm arguments for
aggregation and/or nondisclosure.
Using a more comprehensive sample of firms, Berger & Hann (2007) find mixed
evidence regarding the proprietary cost hypothesis and point out that the assumption held in
previous papers (Botosan & Stanford, 2005; Harris, 1998) that segment aggregation aims to
hide the profitability of the industry that the segment operates in is unrealistic since industry-
wide information, or indeed country-level information for geographical segments, is most
likely already available to both competitors and the market. Consequently, there should be no
proprietary cost of disclosing such information. However, segment profitability (Berger &
45
Hann 2007) and segment earnings growth (Wang, Ettredge, Huang, & Sun, 2011) are
relevant measures that managers would want to hide.
5.1.2 Agency cost hypothesis
The agency cost hypothesis posits that segment-level information and results are
withheld due to conflict of interest between managers and shareholders (Bens, Berger, &
Monahan, 2011). Managers could be hiding the low profitability of some operations through
aggregation in an attempt to mask moral hazard problems. Moreover, they could also be
hiding the true level of diversification of the company. Prior literature shows that diversified
firms’ shares trade at a discount compared to single-segment firms (Berger & Ofek, 1995)
and that this discount is due, at least partly, to agency problems (Berger & Ofek, 1999).
The literature provides mixed evidence with respect to the agency cost motives. On
the one hand, Botosan & Stanford (2005) find no evidence that firms which initiated multi-
segment disclosure under SFAS 131 were aggregating information under the old standard to
mask poor performance. On the other hand, based on prior literature, Berger & Hann (2007)
partition their sample into firms more likely to have agency cost issues, classified as agency
cost sample, and the others, classified as proprietary cost sample. Their results are consistent
with the agency cost motive for segment disclosure. Moreover, firms that presented more
aggregated information pre-SFAS 131 as opposed to post-SFAS 131 faced a higher takeover
probability (Berger & Hann 2002). Hope & Thomas (2008) provide evidence consistent with
the hypothesis that the non-disclosure of geographical information after SFAS 131 is due to
managers’ empire building tendencies. In an attempt to disentangle between the agency and
proprietary cost hypotheses, Bens et al. (2011) use confidential U.S. Census data from 1987,
1992, and 1997 to look at the motives behind discretionary disclosure of segment data, but
cannot draw a clear-cut conclusion.
46
5.1.3 Other determinants
Ettredge et al. (2002a) find that larger and more complex firms engage in more
aggregation of segments under SFAS 14. Ettredge et al. (2006) sample specifically large,
complex firms that reported multiple segments under both SFAS 14 and 131. They find that
capital market disclosure incentives play a significant role in segment reporting post-SFAS
131. Similarly, firms that experience declines in liquidity (i.e., trading volume) and increases
in information asymmetry (i.e., analyst forecast consensus) tend to increase the frequency of
their segment reporting (Botosan & Harris, 2000). Moreover, the frequency with which a
company’s peers disclose segment reporting also influences the frequency with which the
company itself reports (Botosan & Harris, 2000). A recent working paper also shows that
reasons related to companies’ use of tax havens increase the likelihood that managers
aggregate geographic disclosures and, thus, provide lower quality disclosures (Akamah,
Hope, & Thomas, 2014).
5.2 Effects associated with segment reporting
5.2.1 Segment reporting and analysts’ information environment
Early evidence points to reduced forecast dispersion among analysts following the
release of first-time mandated segment disclosures (Baldwin, 1984; Swaminathan, 1991) and
to more accurate forecasts following the disclosure of segment information under SFAS 14
(Lobo, Kwon, & Ndubizu, 1998). Similarly, geographic segment disclosures help analysts
make more accurate earnings forecasts (Balakrishnan, Harris, & Sen, 1990). Early papers also
show that segment earnings have predictive power for future consolidated earnings (Collins,
47
1976; Kinney Jr., 1971) and segment revenue is useful for investors’ evaluation of firms’
growth prospects incremental to consolidated data (Tse, 1989).
While investors, analysts, and the capital markets had access to part of the new
segment information upon the adoption of SFAS 131, the release of new segment data in the
annual report still triggered a significant market reaction (Berger & Hann, 2003). The
changes in segment reporting that followed the implementation of SFAS 131 in the U.S. have
led to increased predictive ability of segment reporting for consolidated earnings (Behn,
Nichols, & Street, 2002). Reporting more segments under SFAS 131 improves forecast
consensus (Berger & Hann, 2003; Venkataraman, 2001), but reliance on publicly available
segment information may in fact increase the uncertainty in analysts’ forecasts (Botosan &
Stanford, 2005). SFAS 131 has also improved geographic segment disclosure that reduced
the mispricing of foreign earnings (Hope, Kang, Thomas, & Vasvari, 2008b), but for
companies that no longer disclose geographic segment earnings after SFAS 131, analysts’
forecasting abilities are not impaired (Hope, Thomas, & Winterbotham, 2006).
5.2.2 Stock market effects of segment reporting
Analytical results suggest that increasing segment reporting requirements may induce
firms to reduce their value-relevant disclosures by aggregating proprietary information with
other value-relevant information to deter entry by rivals (Nagarajan & Sridhar, 1996). Work
on the SEC segment regulations in the early 1970s, however, finds that the SFAS 14
mandated segment reporting led to higher price variability, proportional to the number of
segments reported (Lobo et al., 1998; Swaminathan, 1991) and reduced information
asymmetry between managers and shareholders (Greenstein & Sami, 1994).
Stock markets reacted positively when announcements were made related to SFAS
131 issuance (Ettredge et al., 2002b). Givoly, Hayn, & D’Souza (1999) use market tests to
48
evaluate the incremental information content of segment data and the cross-sectional relation
between this content and the measurement error in segment reporting. Wysocki (1998) uses
the real options theory and shows that segment-level profits and losses are valued differently
by the market.
The usefulness of segment data above aggregate data relates to the heterogeneity of
investment opportunities across segments, caused by divergences of segment profitability and
growth potential (Chen & Zhang, 2003). Ettredge, Kwon, Smith, & Zarowin (2005) find that
firms that changed their segment reporting upon adoption of SFAS 131 experienced a
positive and significant increase in forward earnings response coefficient. Collins & Henning
(2004) and Chen & Zhang (2007) provide evidence that the market recognizes high and low
performing segments and reacts accordingly to their divestment.
As Denis, Denis, & Yost (2002) document an increase in global diversification
between 1984 and 1997 complementing industrial diversification, geographic entity-wide
disclosures are potentially at least as important to users of accounting information as
operating segment disclosures. Several papers deal specifically with the security pricing
effects of geographic disclosures (Boatsman, Behn, & Patz, 1994; Callen, Hope, & Segal,
2005; Hope, Kang, Thomas, & Vasvari, 2008a; Hope et al., 2008b; Thomas, 2000). Results
are generally consistent with geographic disclosures influencing investors’ pricing of foreign
earnings.
5.2.3 Other effects of segment reporting
A number of papers argue that segment information is also important because it
fulfills a monitoring role. Berger & Hann (2003) use the diversification discount to show that
changes in segment reporting have an impact on the shareholder monitoring of managers’
actions. Bens & Monahan (2004) confirm Berger & Hann’s (2003) finding by showing that a
49
measure of information disaggregation is positively associated with the excess value of
diversification. Park & Shin (2009) find that post-SFAS 131, firms that increased the number
of reported segments exhibit significant declines in insider profits relative to firms that did
not increase their number of segments. This is consistent with Baiman & Verrecchia's (1996)
finding that enhanced disclosure mitigates insiders’ ability to earn abnormal profits.
When companies diversify into unrelated industries, the earnings streams from the
different operating segments have low correlation. The coinsurance effect created as a result
reduces the risk of default. Franco, Urcan, & Vasvari (2013) find that, due to this coinsurance
effect, industrially diversified firms pay significantly lower bond-offering yields and this
relation becomes stronger as the number of reported segments, controlling for the number of
industries, increases. Blanco, Garcia Lara, & Tribo (2015) build an index of voluntary
segment information and show that higher values of this index are associated with higher
analyst forecast accuracy and reduced covariance between the firm’s returns and the returns
of all other firms in the same industry, consistent with reduced estimation risk and cost of
capital.
As Ronen & Livnat (1981) very aptly put it, the overall take-away of the studies
discussed in this section is that “segment information is both used and useful.” The
implementation of the management approach-based standards raises nevertheless additional
questions. The adoption of SFAS 131 and IFRS 8 has led, on average, to an increase in the
number of segments reported (e.g., Berger & Hann, 2003; Bugeja, Czernkowski, & Moran,
2014; Herrmann & Thomas, 2000; Leung & Verriest, 2014; Nichols et al., 2012). The
number of line items, however, appears to have decreased under the management approach
(Bugeja et al., 2014; Crawford et al., 2012; Leung & Verriest, 2014; Nichols et al., 2012),
which raises questions on the overall informativeness of segment disclosure under the new
standards and the need to understand the interplay between these two dimensions and the role

50
that other choices that managers make when disclosing segment information have. Therefore,
this thesis contributes to the accounting literature by complementing the existing stream of
segment reporting literature and by adding to the broader disclosure literature.
6. Contributions
6.1 Fit and contribution to the accounting literature
In broad terms, the financial accounting literature aims to understand why managers
make certain financial reporting choices, and whether these choices have any sort of
economic consequences. Again very broadly, the accounting literature can be classified into
papers focusing on the accounting numbers provided on the face of the financial statements,
and those focusing on the accounting information disclosed in the notes to financial
statements and in other documents that companies publish, i.e., accounting disclosure
literature.5 The majority of papers in the first category examines features of the recognized
accounting numbers, such as accruals quality, value relevance, conservatism, timeliness etc.,
while papers in the second category focus on various accounting disclosure characteristics,
encompassing both the numbers and the narrative disclosed in the notes and elsewhere. My
thesis fits in and contributes to this second stream of literature.
Intense interest in accounting disclosure research is more recent and brought about by
advances in computer linguistic analysis and processing over the last two decades (Beattie,
2014; Miller & Skinner, 2015), although the first papers on such topics date back to around
the same time as the seminal works of Ball & Brown (1968) and Beaver (1968). For example,
5 I use the term “disclosure” in its usual sense in the accounting literature to mean all financial communication
provided by the management of the company in the notes to financial statements and outside the financial
statements (Mayew, 2012). In contrast to the accounting literature, standard setters restrict this term to
information provided in the notes to financial statements (Bratten, Choudhary, & Schipper, 2013).
51
as pointed out in Beattie (2014), Soper & Dolphin (1964) and Smith & Smith (1971) were
among the first studies to provide some descriptive evidence on the readability of annual
reports as a way to gauge understandability. Following Li (2008), readability has attracted
renewed interest as a characteristic of the narrative in the annual report, alongside, for
example, tone (e.g., Davis & Tama-Sweet, 2012; Hobson, Mayew, & Venkatachalam, 2012;
Mayew, 2012).
Miller & Skinner (2015) classify the accounting disclosure literature into sub-
categories that relate to (1) why firms voluntarily disclose information that is not mandated
by regulators, i.e., papers in this category seek to understand the basic decision to disclose
information, (2) where managers choose to disseminate the information, i.e., the venue or
mechanism that managers use to release information about the firm, and whether
dissemination affects capital market outcomes (e.g., Bamber & Cheon, 1998; Myers, Scholz,
& Sharp, 2013), and (3) how managers disclose the information, i.e., the strategic aspects of
disclosure and disclosure characteristics. The third sub-category encompasses studies looking
at characteristics of accounting disclosure such as quantity, quality (defined in various ways),
level of disaggregation (e.g., Lansford, Lev, & Tucker, 2013), consistency of disclosure
behavior (Tang, 2014), repetition (Li, 2013), frequency of disclosure (Lang & Lundholm,
2000), timing of disclosure (Doyle & Magilke, 2009) etc., over which managers have some
degree of discretion. Depending on the setting, these studies address mandatory disclosure,
voluntary disclosure, or both.
My thesis particularly contributes to the third sub-stream of literature as classified
above. Each of the essays takes a different view on operating segment disclosure, either in the
note, or in other disclosure venues, to investigate a set of characteristics (quantity and quality
in chapter I), or a particular disclosure characteristic (inconsistency in chapter II,
disaggregation in chapter III).
52
Understanding the way managers disclose information about their segments also
speaks to the literature on earnings quality, the first category in the broad classification
above. In a survey reported in Dichev, Graham, Harvey, & Rajgopal (2013), managers admit
to smoothing earnings more when their companies have more operating segments. When
asked “What does the concept of earnings quality mean?” consistent profitability from core
operating segments is the fourth top answer that CFOs give. In other words, the way in which
managers report on operating segments flows into the main consolidated financial statements.
Therefore, features of operating segment disclosure such as quality, quantity, or consistency
across documents can potentially provide clues as to how faithfully the internal organization
of the company is reported, and, eventually, to the quality of consolidated earnings.
6.2 Contribution to the corporate diversification literature
The information users get from the segment note on the diversification of the
company is influenced, first, by the financial reporting standards in place, and second, by
manager’s disclosure incentives in connection with the firm’s economic reality.
Understanding the characteristics of disclosure on this topic can potentially contribute to
explaining some of the phenomena documented in prior literature in finance and accounting.
Custódio (2014) remarks that “a large proportion of financial economics studies, from
corporate finance to asset pricing, use accounting data to compute various measures and
proxies [and that] when firms are exposed to different accounting treatments, these measures
might be compromised by a lack of comparability across firms.” Low comparability which
arises from accounting standards permitting the choice of different accounting methods is
only one side to the story. Managers’ discretion over how the information is reported, i.e., the
degree to which the information is faithfully representative, is the other side. A large body of
53
accounting literature investigates the firm characteristics and managerial incentives that
motivate managers to make certain financial reporting choices. The overall take-away from
this body of literature is that financial reporting choices are not made in a vacuum, but rather
they are influenced by numerous factors, among which managerial incentives to portray the
company in a certain light.
A few papers have considered the impact of accounting as explanation for the
diversification discount. Custódio (2014) puts forth a measurement bias argument which
purports that the diversification discount is due to the methods of accounting for mergers and
acquisitions. Villalonga (2004) compares an alternative data source to Compustat and finds
that the diversification discount is due to data and reporting issues. She summarizes the issues
related to financial reporting for why judging firms’ diversification based on segment
reporting (usually, the number of segments) is problematic: (1) an (operating) segment as per
the accounting standards is defined such that it can contain more than one activity; (2) due to
the quantitative thresholds contained in the standards which are used to assess materiality, the
extent of segment disaggregation is lower than the true extent of a firm’s industrial
diversification (also in Lichtenberg, 1991); (3) in many instances, changes in the number of
segments are due to reporting issues rather than real instances of diversification or
reorganization (also in Denis, Denis, & Sarin, 1997; Hyland & Diltz, 2002).
Since segment reporting provides users with a disaggregated view of the company’s
businesses, managers may be cautious regarding the picture that they are showing. Along
with the segment reporting literature that discusses managers’ discretion when aggregating
operating segments for reporting purposes, this thesis contributes to the corporate
diversification literature by pointing out that the disclosure of the firm’s operating segments
is part of an overall strategy also influenced by various incentives along with accounting
standard requirements.
54
6.3 Practical implications for standard setters and regulators
This thesis is motivated not just by calls in the disclosure literature for more research
on the choices managers make when releasing information to capital markets in view of their
overall disclosure strategy (Berger, 2011; Beyer et al., 2010; Core, 2001; Healy & Palepu,
2001; Miller & Skinner, 2015), but also by standard setters’ interest in how the segment
reporting standards are performing, and by regulators’ practices of enforcement of segment
reporting standards and observations on how companies disclose this information.
Standard setters could potentially benefit from the findings of this thesis on two
levels, one that directly relates to segment reporting and the other that takes one step further
towards business model-based standards. First, standard setters both in the U.S. and Europe
have recently conducted post-implementation reviews on both segment reporting standards,
SFAS 131 and IFRS 8 (FAF, 2012; IASB, 2013d). Standard setters’ main interest was on
how their standards perform and how companies disclose operating segment information
under the management approach (Moldovan, 2014). The multiple-characteristics view on
operating segment information disclosed in the annual report and in other documents released
by the firm is relevant for standard setters since it provides them with insights into how and
why managers make certain choices when disclosing segment information. Second, standard
setters’ recent move towards business model-based standards (Leisenring et al., 2012), as is
the segment reporting standard, warrants an examination of how managers disclose under
such requirements and the effects this has on users’ decision-making. By providing evidence
on the interplay between the quantity and quality of segment disclosure, this thesis
contributes to our understanding of the overall informativeness of segment reporting under
the management approach.

55
Additionally, enforcement of business model-based standards is not a straightforward
matter. In the case of segment reporting, regulators in Europe and the U.S. claim that they
compare the operating segments disclosed in various documents that companies publish in
order to make sure that the disclosure in the note reflects indeed the internal organization of
the company (Dixon, 2011; ESMA, 2011; Pippin, 2009). Chapter II in this thesis is motivated
by and investigates precisely this enforcement practice. Therefore, regulators could
potentially use the findings in this thesis to further motivate or adjust their enforcement
practices.
7. Overview of the three research papers
7.1 Chapter I
The first essay is titled “The Interplay between Segment Disclosure Quantity and
Quality” and investigates managers’ choices with respect to two disclosure characteristics,
quantity and quality, and whether financial analysts are able to distinguish between
companies along these dimensions. Prior literature tends to examine one disclosure
characteristic at a time (Beyer et al., 2010), whereas managers’ disclosure strategy involves
decisions about a set of characteristics and potential trade-offs between these. By examining
how companies place themselves along both the quantity and quality dimensions of
disclosure, this essay aims to improve our understanding of managers’ decision processes
over the amount of information they provide on the topic of operating segments, and the
quality of this information.
Segment reporting provides a context in which managers have varying degrees of
discretion over disclosure quantity, the number of accounting line items disclosed in the
56
segment reporting note, and quality measured using the cross-segment profit variability
(Ettredge et al., 2006; Lail, Thomas, & Winterbotham, 2014; You, 2014) as proxy for the
degree of aggregation of economically similar operating segments into reportable segments. I
argue that managers have more discretion on quality than on quantity from one year to the
next due to differences in the visibility of these characteristics, which also leads to a
sequential decision process in which segment reporting quantity is decided upon before
segment reporting quality. The number of line items disclosed in the segment note is easy to
perceive by users and benchmarked with standard suggestions, prior disclosure by the same
company (Einhorn & Ziv, 2008; Graham, Harvey, & Rajgopal, 2005), and behavior of peer
companies (Botosan & Harris, 2000; McCarthy & Iannaconi, 2010; Tarca, Street, & Aerts,
2011). Therefore, managers’ discretion over a voluntary part of the segment reporting in the
notes to financial statements is limited by a number of factors which primarily tie back to
line-item disclosure visibility. Segment reporting quality, however, is less visible and,
therefore, more prone to managerial discretion than quantity. Changing the aggregation of an
operating segment from one reportable segment to another or transferring some expenses
between reportable segments (Lail et al., 2014; You, 2014) can be achieved without any
visible changes to the reported segments.
First, I investigate managers’ reasons for deviating from average or expected quantity
and quality by grouping companies into Under-disclosers/Box-tickers/Over-disclosers based
on segment reporting quantity, and LowQl/AvgQl/HighQl based on segment reporting quality.
Results suggest that faced with proprietary and agency costs, managers are more likely to
provide fewer segment line items than suggested in IFRS 8 (i.e., Under-disclosers vs. Box-
tickers), whereas the higher the financial performance at the consolidated level, the more
likely it is that managers disclose high quality operating segments (i.e., HighQl vs. AvgQl).
More interestingly, I find that managers that follow standard suggestions for the segment line
57
items (i.e., Box-tickers) solve proprietary concerns by decreasing the quality of reported
operating segments. This finding raises questions on the overall informativeness of segment
reporting, and is in line with investors and financial analysts’ opinion that high disclosure
quantity sometimes acts as a smokescreen for low quality. These results contribute
specifically to our understanding of segment reporting under the revised version of the
standard and, more generally, to our understanding of managers’ disclosure strategy.
Second, I examine how financial analysts’ earnings forecast accuracy varies with
disclosure quantity and quality. I find that analysts are less accurate for companies that are in
the Under-disclosers and Over-disclosers groups, compared to the Box-tickers group. This
result is consistent with Lehavy, Li, & Merkley (2011) who find that earnings forecasts for
firms with longer 10-K reports are less accurate and supports regulators and investors’ views
about the negative effects of disclosure overload on investors’ decision-making (e.g.,
Thomas, 2014). Analysts are more accurate for companies in the HighQl group compared to
the AvgQl group, but not significantly less accurate for companies in the LowQl group. In
order to obtain insights into the effects of the interplay between disclosure quantity and
quality on analysts’ accuracy, I interact the quality and quantity groups. The results show
that, compared to the Under-disclosers & LowQl benchmark group, being in the Over-
discloser & HighQl, Box-ticker & HighQl, Box-ticker & LowQl, and Box-ticker & AvgQl
group combinations is associated with higher forecast accuracy. Overall, these results suggest
that too much quantity may be too overwhelming to process and that even sophisticated users
seem to be unable to pick up improper segment aggregation. Considering that standard setters
seemingly favor business model-based standards more and more (IASB, 2013a; Leisenring et
al., 2012), these findings are of interest to standard setters and users alike.
58
7.2 Chapter II
The second essay is titled “Inconsistent Segment Disclosure across Corporate
Documents.” I define inconsistent disclosure across corporate documents as variation in what
one company reports on the same topic in different documents referring to the same fiscal
period. I focus on operating segment disclosure because, given the IFRS 8 requirements that
align external reporting with the internal organization of the company, there is no ex ante
reason to expect managers to disclose different operating segments in different documents
that refer to the same financial reporting period. I investigate whether and to what extent
multi-segment companies disclose operating segments inconsistently across a set of corporate
documents, and how inconsistent disclosure affects financial analysts’ earnings forecast
accuracy. Answers to these research questions provide us with insights into (1) managers’
strategy for the overall disclosure package, (2) financial analysts’ use of information
disclosed in different corporate documents, and (3) regulators’ practice of verifying
compliance with the reporting of operating segments under the management approach by
comparing the operating segments disclosed in various documents and venues.
Using manually collected data from four documents, (1) the notes to financial
statements, (2) the management discussion and analysis, (3) the earnings announcement press
release, and (4) the conference call presentation slides to financial analysts, I code companies
as Inconsistent if there is variation in the operating segments disclosed in these documents.
Since this variation can arise because managers further disaggregate some operating
segments in some documents or because the operating segments they provide in some
documents are entirely different compared to those provided in the other documents, I further
classify companies into two categories, Inc_AddDisclosure (i.e., the disaggregated operating
segments are disclosed in such a way that it is straightforward to reconcile them with the
59
operating segments in the other documents) and Inc_DiffSegmentation (i.e., the operating
segments disclosed in some documents cannot be easily reconciled with those disclosed in
the other documents). I find that, out of my sample of 400 multi-segment European
companies, almost 39% disclose operating segments inconsistently across the documents
considered. Companies that disaggregate some of the operating segments in some of the
documents represent 11% of the sample, while those that disclose different segmentations
represent 28% of the sample.
After documenting this inconsistent disclosure behavior in my sample, I next
investigate whether inconsistent disclosure affects sell-side equity analysts, an important and
sophisticated group of users of accounting information (Bradshaw, 2009, 2011; Brown et al.,
2015; Mangen, 2013). Analysts are also the most likely to look at the range of disclosure
outlets considered in this essay when they collect information about the companies they
cover. Therefore, if inconsistency has an effect for anyone, then financial analysts are the
most likely candidates. Their job involves collecting information about a company from
various sources in order to piece together the “puzzle” that the company is, form an image
about its future prospects, and provide recommendations on investing in that company. The
question is whether getting inconsistent (i.e., varying) information from different sources
reflects negatively on their ability to perform their job well.
I expect inconsistencies in disclosure to have an effect on analysts’ forecast accuracy
due to the costs associated with extracting data from public documents and processing
information based on that data (Bloomfield's (2002) incomplete revelation hypothesis).
Obtaining different information on the same topic that should a priori be the same creates a
sense of confusion. As a result, inconsistency increases information processing costs, both in
terms of time and effort required, which suggests a negative relation between inconsistency in
disclosures and earnings forecast accuracy. However, inconsistency could also mean that
60
more information is available. Variation in the operating segments disclosed in different
documents could, therefore, mean that analysts receive more information on how the
company is organized and functions which should reflect in more accurate earnings forecasts.
Results show that the overall variation in disclosure variable (Inconsistent) is not significantly
related to analysts’ forecast accuracy. However, tests using the refined categories show that
Inc_AddDisclosure is positively associated, while Inc_DiffSegmentation is negatively
associated with forecast accuracy. In other words, inconsistency that arises from some
operating segments being further disaggregated in some of the documents, but in such a way
that it is relatively straightforward to piece them back together in order to understand the
image of the internal organization of the company appears to be more information, easy to
process or at no significant additional cost, that is useful for analysts. However, inconsistency
that arises from disclosing different segmentations, that are impossible or relatively hard to
reconcile across documents in order to piece back the image of the company, seems to
confuse analysts and impairs their ability to accurately assess the prospects of the company as
a whole. Further tests reveal that disclosing different segmentations inside the annual report
(i.e., in the note compare to the management discussion and analysis) is associated with
increased mean forecast error and forecast dispersion from before to after the issuance of the
annual report.
By considering disclosures made in a set of documents, this essay takes us a step
further in understanding managers’ overall disclosure strategy and the effects that this
strategy has. Besides the financial statements, managers use many other outlets to
communicate financial information. This essay provides evidence on the role that a
previously undocumented characteristic of financial information disclosed across multiple
documents has for its main users, which sheds additional light on the role of accounting
disclosures and the characteristics that make such disclosure useful. From a practical
61
perspective, since financial analysts are an important link between the firm and the capital
markets, managers want to understand how to best communicate with them (Bradshaw, 2011)
and this essay speaks precisely on this issue. This essay also has implications for regulators
and the current debate on a disclosure framework (Barker et al., 2013; EFRAG, 2012). The
findings supplement some existing survey evidence that points to the importance investors
and analysts attach to consistency in disclosure (CFA Institute, 2013). Given these findings,
regulators and standard setters may want to assess the need to consider the consistency of
disclosure across documents as an attribute of disclosure quality that companies should be
encouraged to adhere to.
7.3 Chapter III
The third essay is titled “Management Guidance at the Segment Level” and
complements the literature on the characteristics of management guidance by specifically
examining management guidance made at the operating segment level. Managers often
accompany their forecasts with supplementary statements as a way to add context to the
forecast (Hutton, Miller, & Skinner, 2003), or to point to the causes that led to certain
expectations (Baginski, Hassell, & Hillison, 2000). A large body of research finds that
historical information on segments is useful for capital market participants (Behn et al., 2002;
Berger & Hann, 2003; Botosan & Stanford, 2005). Comparatively, we know little about the
role of segment information when it is forward-looking. In the context provided by these
streams of prior research, this essay examines (1) the characteristics of the firms providing
segment-level guidance, (2) whether and how segment-level guidance conveys useful
information for financial analysts, and (3) whether segment-level guidance contributes to or
alleviates managers’ earnings fixation, i.e., managers’ tendency to excessively focus on
62
companies’ short-term accounting earnings performance instead of long-term potential
(Elliott, Hobson, & Jackson, 2011).
For the sample of companies used throughout this thesis, I read and manually code
whether the press releases announcing the 2009 fiscal year earnings contain a management
guidance section. For those that have a guidance section, I code (1) whether there are
statements that make reference to the firm’s operating segments, (2) the precision of guidance
at the segment level, i.e., point, range, low-precision estimate, or narrative, and (3) the
disaggregation of segment-level guidance in terms of the type of information provided, i.e.,
segment earnings, segment revenues, segment expense items, or non-financial statements,
similar to the coding of disaggregated earnings guidance in Lansford, Lev, & Tucker (2013).
I first investigate the firm characteristics associated with the likelihood of providing
segment-level guidance. Findings suggest that companies in high tech industries are less
likely to provide segment-level guidance potentially due to their business model leading to
uncertain cash flows and low earnings predictability (Barron, Byard, Kile, & Riedl, 2002).
The second set of analyses aims specifically to reveal whether financial analysts
forecast earnings more accurately when managers provide segment level guidance, and more
generally to provide evidence on whether segment-level forward-looking disclosure matters
for the users of accounting information. Analyst-firm regression results indicate that
providing segment-level guidance is significantly and positively associated with earnings
forecast accuracy, controlling for management guidance at the consolidated level and
characteristics of this guidance such as item disaggregation. Therefore, providing guidance
disaggregated at the operating segment level appears to be incrementally useful to financial
analysts, above and beyond the guidance for earnings or for other accounting items provided
for the company as a whole.
63
Third, I test the relation between segment-level guidance and earnings management in
the period for which the guidance is provided. The results show that providing guidance at
the segment level is positively associated with earnings management behavior, and that more
precise guidance intensifies this relation. This result is in line with prior findings which
suggest that earnings management does not happen only at the headquarter level, but also at
the divisional level when mid-tier managers are incentivized in a manner conducing to
earnings management (Guidry, Leone, & Rock, 1999).
Besides contributing to the accounting literature by complementing the evidence on
supplementary statements in the management guidance stream of literature (e.g., Hutton et
al., 2003) and moving beyond the historical view on segment information that the segment
reporting literature holds, this essay also has implications for all the parties involved in the
debate on whether managers should provide forecasts at all. In a context where qualitative,
narrative, and disaggregated guidance is regarded as a solution to avoid earnings fixation and
short-termism, understanding which characteristics of disclosure aid in achieving this role,
and how, is relevant for managers, investors, and regulators, alike.
64
Chapter I
The Interplay between Segment Disclosure Quantity and Quality
Abstract
This paper investigates managers’ choices with respect to both disclosure quantity and
disclosure quality, and the usefulness of these two characteristics for financial analysts.
Focusing on segment disclosures under the management approach, I measure quantity as the
number of segment-level line items and quality as the cross-segment variation in profitability,
and argue that greater managerial discretion can be exercised over quality than over quantity.
I hypothesize and find that managers solve proprietary concerns either by deviating from the
suggested line-item disclosure in the standard, or, if following standard guidance, by
decreasing segment reporting quality. Moreover, financial analysts do not always understand
the quality of segment disclosures, which suggests that a business-model type of standard
creates difficulties even for sophisticated users. My results inform standard setters as they
work on a disclosure framework and as they consider the business model approach to
financial reporting for other issues besides segment reporting.

65
Résumé
Cet essai examine le choix des cadres dirigeants à l'égard de la quantité et de la qualité des
publications sur l’information sectorielle, ainsi que l’utilité de ces deux caractéristiques pour
les analystes financiers. J’utilise le nombre de segments opérationnels publiés comme mesure
quantitative et la variation inter-sectorielle de la profitabilité comme mesure qualitative et
soutiens que plus de pouvoir discrétionnaire peut être exercé par les dirigeants sur la qualité
que sur la quantité. Je trouve que les cadres dirigeants résolvent les préoccupations liées aux
renseignements commerciaux de nature exclusive soit en déviant de la quantité recommandée
par la norme, ou, lorsqu’ils suivent la norme, en réduisant la qualité de l’information
sectorielle. Les analystes financiers n’apprécient pas toujours la qualité de l’information
sectorielle, ce qui suggère que le modèle business crée des difficultés même pour des
utilisateurs avertis. Mes résultats informent les normalisateurs lorsque ceux-ci initient le
développement d’un nouveau cadre conceptuel et lorsqu’ils semblent envisager l’approche du
modèle business pour le reporting.
66
I.1 Introduction
This paper integrates two disclosure characteristics – quality and quantity – to
contribute to an understanding of managers’ choices regarding corporate financial disclosures
and of financial analysts’ ability to benefit from both the quantity and the quality of
information disclosed. Focusing on multiple disclosure characteristics at a time brings us
closer to understanding managers’ overall disclosure strategy (Beyer et al., 2010).
Throughout the paper, I use the term disclosure quality to refer to the representational
faithfulness of the information disclosed so as to reflect the underlying economics of the firm.
Disclosure quantity is the amount of accounting information that managers provide on one
topic.
Disclosure quality and quantity are currently on standard setters and regulators’ radars
(Barker et al., 2013) as investors and financial analysts denounce a perceived increase in the
number and length of financial disclosures without an increase in corresponding quality and
usefulness for users (CFA Institute, 2007). From this point of view, increased disclosure
quantity might appear as a smokescreen for low disclosure quality. As a result, national and
European-level regulators have initiated public debates and issued discussion papers in an
effort to encourage the International Accounting Standards Board (IASB) and the Financial
Accounting Standards Board (FASB) to bring the length of financial reporting disclosures
under control and to increase their quality (EFRAG, 2012; Financial Reporting Council,
2012). In response, the IASB has added a disclosure framework project to its agenda to
complement the Conceptual Framework.1
Segment reporting under the management approach in IFRS 8 Operating Segments
provides a setting where mandatory and voluntary disclosure with a strong discretionary
1 As of May 15
th, 2014, IASB’s medium-term agenda includes a standards-level review of disclosure project and
a disclosure framework project.
67
component interplay which allows (1) to measure disclosure quantity and quality as distinct
dimensions, thus avoiding a mechanical correlation induced by the measurement process
(Botosan, 2004), and (2) to make new predictions about managers’ choices with respect to
disclosure quality and quantity based on their relative discretionary appeal. The question of
how disclosure quality is best defined and measured and its relation with disclosure level is
yet to be answered (Beyer et al., 2010). Oftentimes, disclosure quality is either equated with
or seen as a function of disclosure level (e.g., Lambert et al. 2007; Francis et al. 2008; Shalev
2009). Even when trying to capture other dimensions of disclosure that could be deemed
“disclosure quality,” accounting researchers still end up counting items (Beretta & Bozzolan,
2004; Botosan, 2004; Bozzolan, Trombetta, & Beretta, 2009). Therefore, disclosure quality
appears positively related to quantity either as a consequence of the measurement process or
as an implicit assumption. I do not per se disagree with the view that quantity could be
regarded as a component of overall disclosure quality, but argue that in my particular setting I
can disentangle between segment disclosure quality by measuring it as the quality of
operating segment aggregation without relying on the number of segments disclosed or on
any item or word count (Botosan, 2004). My interest is precisely to distinguish between the
two in order to understand what role they serve, separately and together, from the manager’s
perspective, and how they impact analysts’ forecasts.
There are two main decisions related to segment reporting that managers make: what
and how many segment-level line items to disclose, and what operating segments to report.
Under the “management approach” in IFRS 8 the segment reporting note to financial
statements should reflect, – both in terms of line items and in terms of the reported segments
– the internal organization of the company and the view management has on it.2 The quantity
dimension of segment reporting is the number of segment-level line items disclosed in the
2 IFRS 8 and SFAS 131 are converged, so IFRS 8 requirements are the same as those of its U.S. GAAP
counterpart. Since I use a sample of European firms reporting under IFRS, I will mainly refer to IFRS 8 as “the
standard” throughout the paper.
68
note. According to the standard, disclosing a measure of profit or loss at the segment level is
mandatory. All other line items mentioned in the standard should be disclosed if the
management reviews them regularly in the course of the entity’s normal activity.
Conditioning line-item disclosure in this way lends it a voluntary character and gives rise to
three possible groups of firms – those that stick strictly to the standard’s suggestions and
disclose more or less the same number of line items as mentioned in the standard (Box-
tickers), those that disclose fewer line items than mentioned in the standard (Under-
disclosers), and those that disclose more line items than suggested (Over-disclosers).
The standard defines an operating segment as a regularly reviewed business
component of an entity and allows the aggregation of economically similar components into
reportable operating segments. The way in which IFRS 8 sets up the segment aggregation
rules leads to “clusters” of similar operating segments that are very different from all the
other operating segments of the company. Properly applied, the aggregation criteria should
lead to variability in segment-level profitability (Ettredge et al., 2006). In order to measure
the quality of operating segment aggregation, I follow Ettredge et al. (2006) who rely on the
intention of the standard to “dissuade multiple segment firms from aggregating operating
segments with different economic characteristics as indicated by different profit margins” in
order to build a measure of diversity in operating segment results.
I use a sample of 270 multi-segment European firms in the STOXX Europe 600 index
at the end of 2009 that report non-geographical operating segments. The mandatory switch to
IFRS 8 in 2009 allows firms to re-evaluate their segment disclosures and potentially break
from existing disclosure patterns, which makes the investigation of managers’ disclosure
decisions at this point in time all the more meaningful. I first investigate the determinants of
the choice to be in the Under-disclosers and Over-disclosers group, compared to the
benchmark (i.e., middle) Box-tickers group. Considering the “visibility” of segment reporting
69
quantity, I hypothesize that Under-disclosers have high proprietary and agency costs that lead
them to provide fewer segment line-items, and that Over-disclosers have strong incentives to
be transparent. Results from multinomial logistic models provide support for these
hypotheses. Specifically, I find that companies with proprietary concerns related to increased
market concentration and potential entry are more likely to disclose fewer segment line-
items. Higher levels of management ownership, i.e., potential entrenchment, are also
positively associated with the likelihood to be in the Under-disclosers group. Companies with
an overall high disclosure policy proxied by the length of the annual report are more likely to
disclose more line-items than suggested by the standard and to be part of the Over-disclosers
group.
Using similar multilogit analyses, I also investigate the choice between high
(HighQl), low (LowQl), or average (AvgQl) segment reporting quality, defined based on the
top, bottom, and two middle quartiles, respectively, of the segment reporting quality (SRQl)
measure that follows Ettredge et al. (2006). The results show that companies with overall
good financial performance and those involved in mergers and acquisitions are more likely to
be in the HighQl group rather than in the AvgQl group. The relation between proprietary costs
and the likelihood to be in one of the extreme groups compared to the AvgQl group seems to
be nonlinear as higher levels of market concentration are positively associated with being in
the LowQl and in the HighQl groups, compared to the AvgQl group.
I further investigate the consequences of positioning the company in one of the groups
along the quantity and quality dimensions for financial analysts’ earnings forecasting
accuracy. Forecast errors for both Under-disclosers and Over-disclosers are higher compared
to the Box-ticker group of companies. This result can be explained either by a “disclosure
overload” phenomenon where too much information is detrimental to financial analysts’
information processing capabilities, or by analysts interpreting the extra information as a
70
smokescreen for low disclosure quality and discounting it too much. Looking at segment
reporting quality, the HighQl companies have lower forecast errors compared to the
companies in the AvgQl group, while the association between LowQl and forecast accuracy is
not statistically significant.
In order to obtain insights into the effects of the interplay between disclosure quantity
and quality on financial analysts’ earnings forecast accuracy, I interact the quality and
quantity groups. My results show that, compared to the Under-disclosers & LowQl
benchmark group, being in the Over-discloser & HighQl, Box-ticker & HighQl, Box-ticker &
LowQl, and Box-ticker & AvgQl group combinations leads to higher forecast accuracy.
The companies that disclose the suggested amount of segment line items, i.e., Box-
tickers, may still face proprietary and agency concerns, but, unlike Under-disclosers, may
choose to solve them differently. Expectations of consistent disclosure in time (Einhorn &
Ziv, 2008; Graham et al., 2005; Tang, 2014) make changing the quantity, i.e., number of
segment line items, much more visible to users than changing the quality of segment
reporting. Discretion can presumably be exercised over the quality of operating segment
aggregation from one year to the next without any “visible” changes in segmentation (Lail et
al., 2014; You, 2014). By restricting the sample to the Box-tickers group and modeling the
determinants of quality, I find that proprietary costs from product market competition and
from innovation activities are associated with lower quality of operating segments disclosed.
A test of the earnings forecast accuracy for the subsample of Box-tickers reveals that analysts
do not distinguish high from average quality, although they are able to distinguish low from
average quality.
This paper contributes to the literature on disclosure characteristics, more specifically
to the literature on segment information, and to current debates about disclosure quantity and
quality involving users and standard setters. I contribute to the literature by taking a step in
71
the direction of understanding the holistic nature of managers’ disclosure strategies. As
suggested by Beyer et al. (2010), by focusing on multiple disclosure characteristics at a time,
I contribute to the literature with new results on the choice, and effects, of disclosure quality
when disclosure quantity has been chosen previously. Our results also inform users and
standard setters. I show that proprietary concerns are solved in different ways – either by not
following the standard’s suggestions for disclosure quantity, or, if following what the
standard suggests, by applying discretion in operating segment aggregation. Moreover,
financial analysts do not always understand the quality of segment disclosures which implies
that a business-model type of standard creates difficulties even for sophisticated users in
interpreting information.
The following section provides a discussion of the institutional background, prior
research, and hypotheses development. Section 3 describes the variable measurement and
research design. Section 4 discusses the empirical findings and section 5 concludes.
I.2 Prior research and hypotheses development
I.2.1 Institutional background
For a company with diversified operations and/or geographic spread, disaggregated
segment disclosures contribute to investors’ assessment of the various sources of the
consolidated accounting numbers. A firm reports its segments in the notes to financial
statements, regulated by the pertaining financial reporting standard, SFAS 131 under U.S.
GAAP and IFRS 8 under IFRS. The overarching principle of these standards is the
“management approach” to segment reporting which aligns external segment reporting with
firms’ internal organization for operating decision purposes. Managers should disclose the
72
internal structure and the measures they use internally to evaluate performance and allocate
resources. In other words, segment reporting should reflect the way in which the company is
organized and functions and provide users with the information the management uses
internally. Although the standard goes on to detail a number of aspects related to segment
reporting, the guiding principle can be summarized as “through the eyes of management.”
The two core aspects of segment reporting are the information given for each segment
and the operating segments disclosed. For each reported segment, the manager discloses a
number of accounting items in the segment note. The standard mandates the disclosure of a
profit or loss measure at segment level and lists a number of other line items that should be
disclosed if the management reviews them regularly.3 This condition introduces a voluntary
component to segment line-item disclosure since managers can use it as a pretext to avoid
reporting certain segment-level line items. Other companies could strictly follow the standard
and disclose only the line items suggested, although perhaps the management reviews more
items, while others could disclose many other line items. Either way, all these companies are
technically within the requirements of the standard.4
The operating segments are defined as components of an enterprise that (1) engage in
business activities earning revenues and incurring expenses, (2) are regularly reviewed by
management, and (3) for which discrete financial information is available (IASB 2006). The
basis of segmentation could be products and services, geographic area, legal entity, customer
type, or another basis as long as it is consistent with the internal structure of the firm.
Operating segments can be aggregated if they have similar economic characteristics and are
3 Paragraph 8.23 suggests the following line items: assets, liabilities, external revenues, internal revenues,
interest revenue, interest expense (or net interest), depreciation and amortization, other material items of income
and expense, interest in profit or loss of associates and joint ventures accounted for using the equity method,
income tax expense or income, material non-cash items other than depreciation and amortization. Paragraph
8.24 adds the amount of investment in associates, and the amounts of additions to non-current assets other than
financial instruments, deferred tax assets, post-employment benefit assets, and rights arising under insurance
contracts. 4 For example, although IFRS 8.21 lists segment liabilities, many companies do not disclose it claiming that it is
not a measure reviewed at the segment level and ESMA agrees with this interpretation (ESMA, 2012).
73
similar in terms of products, customers, distribution, production, and regulation applicable
(IASB 2006).5 By aligning segment reporting to the internal organization of the company
(FASB, 1997; IASB, 2006a), the “management approach” gives managers a lot of freedom in
disclosing segment information (Nichols et al., 2012).
The accounting literature has long recognized managers’ discretion in “cropping”
segments for reporting purposes (e.g., Harris 1998; Berger & Hann 2003; Berger & Hann
2007). More recently, the post-implementation reviews conducted by the IASB and the FASB
confirm that the quality of operating segments aggregation remains a major concern for users
(FAF, 2013; IASB, 2013d; Moldovan, 2014). The way in which IFRS 8 sets up the segment
aggregation rules leads to “clusters” of similar operating segments that are very different
from all the other operating segments of the company, and that allow to differentiate between
the businesses in which the company is involved (Ettredge et al., 2006; Nichols et al., 2013).
Properly applied, the aggregation criteria would lead to higher variability in segment-level
profitability, operating margins, and risk. Therefore, I view the quality of operating segment
aggregation as segment reporting quality and, similar to the measure developed in (Ettredge
et al., 2006), use the cross-segment variability in return on assets as a proxy.
I.2.2 Literature review
I.2.2.1 Disclosure quantity and quality
Accounting disclosures can be characterized from different perspectives that range
from how much information is provided to the location inside a document, to the timing and
choice of disclosure venue. Although managers set up a holistic disclosure policy, existing
5 Besides the aggregation criteria, the standard also contains a set of “three plus one” quantitative thresholds as
indicative benchmark for when an operating segment should be disclosed: 10% of revenue, profit, and assets of
the identified operating segments and 75% of the entity’s revenue. These quantitative criteria are meant to help
managers strike a balance between the importance and granularity of the reported segments, but are still
surpassed by what the management considers to be useful information for investors.
74
literature tends to examine one disclosure characteristic at a time (Beyer et al., 2010). There
is a fairly large body of research on the quantity of information that companies provide in
general in the annual report (Botosan, 1997; Hope, 2003b) or specific for certain disclosures
such as accounting policies (Hope, 2003a) and risk disclosure (Beretta & Bozzolan, 2004;
Bozzolan et al., 2009), the voluntary nature of disclosure (e.g., Chen et al. 2002; Zechman
2010; Blacconiere et al. 2011), and even non-disclosure (Depoers & Jeanjean, 2012;
Hollander, Pronk, & Roelofsen, 2010). For the time periods when they were available, AIMR
rankings (discontinued in 1997) were used as scores for disclosure quality (Lang &
Lundholm, 1996; Lang & Lundholm, 1993). Another stream of literature examines the
language for characteristics such as readability (e.g., Li, 2008; 2010), tone (e.g., Davis &
Tama-Sweet, 2012), and repetitiveness (Li, 2013) to infer disclosure quality.
The question of how disclosure quality is best defined and measured and its relation
with disclosure level is yet to be answered (Beyer et al., 2010). Disclosure quality is often
either equated with or seen as a function of disclosure level (e.g., Francis et al., 2008;
Lambert et al., 2007; Shalev, 2009).6 Botosan (2004) remarks that even when trying to
capture other dimensions of disclosure that could be deemed “disclosure quality,” accounting
researchers still end up counting items. In light of prior research on disclosure characteristics
and the discussion above, my aim is to take one step towards a holistic understanding of
managers’ financial reporting and disclosure choices by integrating multiple characteristics.
In order to do this, I specifically focus on the quantity and quality of segment reporting as a
setting where I can distinctly identify and measure these characteristics.
6 The concepts of disclosure quality, quantity, and transparency are essentially intertwined and, therefore, hard
to disentangle. Barth & Schipper (2008) define transparency as “the extent to which financial reports reveal an
entity’s underlying economics in a way that is readily understandable by those using the financial reports” and
list among the characteristics of financial reporting that foster transparency the disaggregation of unlike items,
in which our interpretations of both quantity and quality fit. The use of “transparency” to refer jointly to
reliability and relevance of financial reporting started from the idea of “see through” and “visibility” as opposed
to “obfuscation” and “concealment” (Barth & Schipper, 2008). Our way of defining disclosure quality and
quantity relates back to the same notion of visibility, so from this perspective, I see disclosure quality and
quantity as characteristics of transparency rather than concepts that can be cleanly separated and
operationalized.
75
I.2.2.2 Measures of segment reporting quality and quantity
The distinction between segment reporting quality and quantity is somewhat blurred
in the literature. A few papers construct measures to assess segment disaggregation, while
others infer quality from the number of segment-level line items. Givoly et al. (1999) assess
the measurement error of segment reporting under SFAS 14 as the difference between the
correlation in the performance of the segments with the industry and the average correlation
of the performance of single line-of-business firms in the industry. Bens & Monahan (2004),
Berger & Hann (2007), and Franco et al. (2013) use the ratio of the number of reported
segments to the number of business units in which a firm operates (i.e., two-digit SIC codes,
industry segments according to the Lexis/Nexis Directory of Corporate Affiliations database)
to capture information disaggregation. These measures rely heavily on the assumption that
reported segments reflect the industry lines in which the company operates, as was the case
under IAS 14 and SFAS 14.
In order to assess the quality of segment disaggregation under the management
approach, Ettredge et al. (2006) design a metric to capture the cross-segment variability of
reported segment profits which represents diversity in operating results as the largest return
on sales (ROS) minus the smallest ROS for the segments of the same company controlling
for inherent cross-segment profit variability using the profitability of single-segment firms.
They find that the cross-segment variability of reported segment profits increased after SFAS
131, consistent with the conjecture that, on average, firms applied the aggregation criteria as
intended. Lail et al. (2014) and You (2014) use similar measures. I also opt for an adjusted
version of this measure.
The adoption of SFAS 131 and IFRS 8 has led, on average, to an increase in the
number of segments reported (e.g., Herrmann & Thomas 2000; Berger & Hann 2003; Nichols
76
et al. 2012; Bugeja et al. 2014; Leung & Verriest 2014), although most companies report the
same number of segments as under SFAS 14 and IAS 14R, respectively (Crawford et al.,
2012; Nichols et al., 2012; Nichols et al., 2013). The number of line items, however, appears
to have decreased under the management approach (Bugeja et al., 2014; Crawford et al.,
2012; Leung & Verriest, 2014; Nichols et al., 2012), which raises the issue of overall
informativeness of segment disclosure under the new standards and the need to understand
the interplay between these two dimensions.
I.2.2.3 Determinants of segment information
The two main reasons put forth for aggregating segment information are proprietary
considerations and agency problems.7 Hayes & Lundholm (1996) show analytically that the
decision involves trading off the benefits of informing the capital market about firm value
against the cost of disclosing information that could potentially aid rivals and harm the firm.
In equilibrium, they find that different activities are reported as separate segments when
results are sufficiently similar, but activities are aggregated into one segment when results are
sufficiently different.
Some of the empirical results support the hypothesis that managers aggregate segment
information to protect profits in less competitive industries. Under SFAS 14, operations in
less competitive industries were less likely to be reported as industry segments (Harris 1998).
Additionally, firms that reported one segment under SFAS 14 and initiated multi-segment
disclosure under SFAS 131 were hiding profitable segments in less competitive industries
than their primary operations (Botosan & Stanford, 2005). Firms in industries with high
concentration ratios or dependent on a few major customers engaged in more aggregation of
segments under SFAS 14 (Ettredge et al. 2002). Nichols & Street (2007) find a negative
7 Nichols et al. (2013) provide a recent detailed review of the segment reporting literature.
77
relation between disclosure of a business segment under IAS 14R and company ROA in
excess of the industry average, supporting competitive harm arguments for aggregation
and/or non-disclosure. Managers want to hide segment profitability (Berger & Hann 2007)
and segment earnings growth (Wang et al., 2011). Ettredge et al. (2006) find, however, a
continuing but decreasing effect of proprietary costs on segment profitability disclosures
post-SFAS 131.
It is not clear, however, whether the source of hiding segment profitability is
proprietary costs or agency costs. The agency cost hypothesis posits that segment-level
information and results are withheld due to conflict of interest between managers and
shareholders (Bens et al. 2011). Managers may want to hide the low profitability of some
operations through aggregation in an attempt to mask moral hazard problems. Moreover, they
may also want to obfuscate the true level of diversification of the company. Prior literature
shows that diversified firms’ shares trade at a discount compared to single-segment firms
(Berger & Ofek, 1995) and that this discount is due, at least partly, to agency problems
(Berger & Ofek, 1999).
The literature provides mixed evidence with respect to the agency cost motives. On
the one hand, Botosan & Stanford (2005) find no evidence that firms which initiated multi-
segment disclosure under SFAS 131 aggregated information under the old standard to mask
poor performance. On the other hand, Berger & Hann (2007) partition their sample into firms
more likely to have agency cost issues, and the others likely to have high proprietary costs
and their results are consistent with the agency cost motive. Bens et al. (2011) use
confidential U.S. Census data to distinguish between the proprietary and agency cost
hypotheses but they cannot draw clear-cut conclusions. Results show that the probability a
pseudo-segment is disclosed separately relates negatively to inefficient transfers the pseudo-
segment receives from the other segments of the firm, and positively to the speed of abnormal
78
profit adjustment exhibited by firms in the segment’s industry. Additionally, if the pseudo-
segments of a single-segment firm operate in industries with high concentration of private
firms then the firm is less likely to identify them separately.
I.2.2.4 Segment reporting and financial analysts’ information environment
Segment earnings have predictive power for future consolidated earnings (Collins,
1976; Kinney Jr., 1971) and segment revenue is useful for investors’ evaluation of firm
growth prospects incremental to consolidated data (Tse, 1989). Since analysts are the main
advocates for more disaggregated segment information, their reactions to segment disclosures
have long been under scrutiny. Research in this area aims to understand analysts’ judgment-
making with respect to segment information (e.g., Maines, McDaniel, & Harris, 1997 -
experiment; Seese & Doupnik, 2003 - survey) and to assess the effects of segment data on
analysts’ forecast characteristics. Early evidence points to reduced forecast dispersion
following release of first-time mandated segment disclosures (Baldwin, 1984; Swaminathan,
1991) and to more accurate forecasts following disclosure of SFAS 14 segment information,
be it line-of-business (Lobo et al., 1998), or geographical (Balakrishnan et al., 1990).
The changes in segment reporting that followed the implementation of SFAS 131 in
the U.S. have improved analysts’ forecast accuracy (Berger & Hann, 2003; Venkataraman,
2001) but had no effect on analysts’ idiosyncratic information (Venkataraman 2001).
Reporting more segments under SFAS 131 improves forecast consensus (Berger & Hann,
2003; Venkataraman, 2001), but reliance on publicly available segment information may in
fact increase the uncertainty in analysts’ forecasts (Botosan & Stanford, 2005). Post-SFAS
131 segment reporting has more predictive ability for consolidated earnings (Behn et al.,
2002), has improved geographic segment disclosure that reduced the mispricing of foreign
79
earnings (Hope et al., 2008a), and for companies that no longer disclose geographic segment
earnings after SFAS 131 analysts’ forecasting abilities are not impaired (Hope et al., 2006).
I.2.3 Hypotheses development
The business-model orientation of the standard has turned segment reporting into a
type of disclosure that is mandated but has strong discretionary and voluntary components.
Managers decide on how much information to give at the segment level, i.e., segment
reporting quantity, and what operating segments to disclose, i.e., segment reporting quality. I
investigate what influences managers’ choice of quantity and quality and how these choices
influence individual financial analysts’ forecast accuracy. In order to build my expectations, I
draw from the determinants identified in the prior literature, from practical aspects related to
reading and interpreting the segment note, and from considerations related to the relative
stickiness of disclosure quantity versus quality.
I.2.3.1 Determinants of the likelihood to deviate from line-item standard suggestions
Apart from mandating a measure of profit and loss, the standard suggests certain line
items to be disclosed in the segment note if the manager regularly reviews these items in the
normal course of his activity. Therefore, to a large extent, the segment line items are provided
on a voluntary basis but for which there exists some regulatory guidance. I aim to understand
what drives some companies to “deviate” and disclose fewer or more line items while others
more strictly stick to the guidance in the standard.
The quantity of information provided in the segment note is a visible characteristic of
segment disclosure. It is rather straightforward to read a segment note, and assess the number
of line items disclosed and compare to what is suggested in the standard which can be easily
80
interpreted as an indication of how much information management is willing to give. If
managers understand this interpretation and want to decrease information asymmetry, they
will provide at least the line-item information suggested in the standard. Deciding to disclose
fewer segment line items may then be the result of high proprietary and agency costs that
exceed any capital markets benefits attached to providing more information (Verrecchia,
1983), characteristics that, same as disclosure quantity, are also rather sticky.
H1a. Compared to box-tickers, under-disclosers of segment reporting quantity have high
proprietary and agency costs.
Over-disclosers most likely have strong incentives to provide a lot of information to
the capital markets. Such incentives could come from different sources. Having a high quality
auditor that pays attention to the way in which companies disclose information in the notes
(Hope, 2003a; Lang, Lins, & Maffett, 2012), cross-listing in the U.S. where the regulatory
regime is generally interpreted as being of high quality (Coffee, 2002), having equity
financing needs or an overall transparent disclosure policy (Healy & Palepu, 1993; Lang &
Lundholm, 2000), potentially due to size and pressure from various stakeholders, create
incentives to provide more information.
H1b. Compared to box-tickers, over-disclosers of segment reporting quantity have incentives
for transparent financial reporting.
I.2.3.2 Determinants of the likelihood to deviate from average segment reporting quality
The quality of segment reporting, i.e., whether the operating segments are properly
defined and aggregated, is less visible and harder to understand compared to quantity and
there is no benchmark for what it should be. The lower visibility of changes in segment
reporting quality also means that this disclosure characteristic is less sticky which leads me to
expect that the nature of its main determinant is also less sticky. Prior literature has shown
81
that financial performance concerns shape managers’ decisions on segment aggregation.
Segment profitability (Berger & Hann 2007) and segment earnings growth (Wang et al. 2011)
are the relevant pieces of segment information that managers want to obfuscate because they
provide information on the sources of overall firm performance.
When financial performance is overall low, managers would want to hide their bad
decisions by “smoothing” the performance of the reported segments. They can achieve this
smooth pattern by improperly aggregating operating segments. When financial performance
is overall high, managers have incentives to show that they have made good diversification
decisions and are keener to show high quality segmentation. On the flip side, managers of
firms with low overall firm performance may want their investors to be able to discriminate
between the segments that perform well and those that do not, and so provide high segment
reporting quality. Given these arguments, I test the following hypotheses for the determinants
of the choice to be in a low or high quality group compared to the average group.
H1c(d). Compared to the average quality group, companies in the low (high) quality group
have worse (better) financial performance.
I.2.3.3 Quantity, quality, and financial analysts’ forecast accuracy
Considering all the options that managers have when disclosing information about
reported segments, do users distinguish between the different groups of companies? I focus
particularly on financial analysts because they are important and sophisticated users of
accounting information for whom segment reporting provides useful information (Healy et
al., 1999; Ramnath et al., 2008). The literature reviewed above highlights the importance of
segment information for analysts’ ability to forecast earnings. The analytical literature on
voluntary disclosure finds that disclosing more accounting information decreases information
asymmetry between managers and capital market participants (Lambert et al., 2007) and is
82
supported empirically in the context of, for example, accounting policies (Hope, 2003b) and
risk disclosures (Bozzolan et al., 2009). Given the theoretical and empirical findings on the
usefulness of larger quantities of accounting information, I expect analyst accuracy to
improve with more segment reporting quantity.
H2a(b). Compared to box-tickers, financial analysts’ earnings forecast error for under-
disclosers (over-disclosers) is higher (lower).
Financial analysts’ demand for high quality segment aggregations (ESMA, 2011;
Herrmann & Thomas, 2000; Street, Nichols, & Gray, 2000) and their relation to the
companies they cover places them in a good position to understand and distinguish between
high and low quality segment disclosures leading me to predict higher accuracy for
companies in the high quality group, relative to the average quality companies. If, however,
analysts get most of their information from privately interacting with management (Soltes,
2014) and operating segment aggregation matters less because of that, then their forecast
accuracy will not depend on the quality group to which the company belongs. Another
alternative is, of course, that my assumption that analysts are able to pick up segment
reporting quality is not supported by the data.
H2c(d). Compared to the average quality group, financial analysts’ earnings forecast error
for the low (high) quality group is higher (lower).
So far I have hypothesized the independent effect of quantity, and respectively,
quality on financial analysts’ forecast accuracy. Since these are both characteristics of the
same type of disclosure, their effect on forecast accuracy is a joint one rather than an
independent one. Therefore, I also investigate the effect of combined quantity and quality
groups on analysts’ forecast error. Without formally stating the hypotheses, I expect that,
compared to the Under-discloser & LowQl group, being in a higher group on both
dimensions allows analysts to do a better job at forecasting the company’s earnings. This
83
prediction is based on the argument that the informativeness of segment disclosures comes
not just from one of its dimensions, but from both. In order for the segment note to be
informative, users must be given proper information to discriminate between the various
businesses of the company and enough information at the segment level to understand the
future prospects of the components of the entity.
I.2.3.4 Segment disclosure quality when line-item disclosure follows standard suggestions
As discussed above, I expect companies that choose to provide low disclosure
quantity to have higher proprietary and agency costs compared to the companies that choose
to provide the line items suggested in the standard. The latter are companies that might
nevertheless face costs related to the product markets and the relation between managers and
shareholders. However, rather than decreasing the number of segment line items disclosed,
Box-tickers might decrease the quality of the segments they report. In this way, overall
segment disclosure informativeness for competitors and shareholders is lower without this
being “too visible” and in keeping with standard setters’ guidance.
This implies that managers follow a sequential decision process in which they first set
segment reporting quantity and only afterwards think about segment reporting quality. The
discretion that managers can exercise on quantity compared to quality provides the basis for
this assumption. Besides the benchmark that the standard provides for segment line items,
prior disclosure by the same company creates a second benchmark (Einhorn & Ziv, 2008;
Graham et al., 2005). One line item shown this year but missing the next is bound to raise
questions from financial analysts. For example, prior research finds that managers’ decision
to issue guidance one year heavily relies on their prior behavior and on how they think the
stock market is going to interpret guidance discontinuance (Tang, 2014). A third benchmark
for segment line items is created by the behavior of peer companies since managers tend to
84
benchmark their disclosure to that of other companies (Botosan & Harris, 2000; McCarthy &
Iannaconi, 2010; Tarca et al., 2011). Therefore, managers’ discretion over their own
voluntary disclosure is limited by a number of factors which primarily tie back to line-item
disclosure being easy to “see” and compare.
Changing the aggregation of an operating segment from one reportable segment to
another or transferring some expenses between reportable segments (Lail et al., 2014; You,
2014) can be done without any “visible” changes to the segments.8 Decreased visibility, in
turn, makes such a choice less likely to raise questions. From this perspective, segment
reporting quality is more prone to managerial discretion on a year-to-year basis than segment
reporting quantity. Therefore, I hypothesize that companies that closely follow the standard
suggestions in terms of line-item disclosure use the discretion they have on segment reporting
quality when they are subject to high proprietary and agency costs.
H3a. Box-tickers solve their concerns about proprietary and agency costs by decreasing
segment reporting quality.
In line with my investigations above, I also examine whether disclosure quality
matters for financial analysts in a “constant quantity” setting. To some extent, this is a cleaner
test for whether analysts pick up on disclosure quality when they are provided with the level
of information suggested in the standard. My expectation is that high (low) quality reporting
is associated with lower (higher) forecast errors.
H3b(c). Conditional on the company being a box-ticker, financial analysts’ earnings forecast
error is lower (higher) for the high (low) quality group compared to the average quality
group.
8 Changes in the composition of reported operating segments can occur for many other legitimate reasons, from
mergers and acquisitions to formal internal reorganizations and divestitures, and these events may or may not
lead to changes in segment names and descriptions. It is very hard, therefore, to pick up the “real” discretionary
changes in operating segments in an empirical archival research setting.
85
I.3 Research design
My measure of segment reporting quantity (SRQt) is the number of accounting items
disclosed per segment in the segment note. For example, if a firm has four segments and
discloses the following accounting items: segment sales, profit, assets, liabilities, and capital
expenditures for each of the four segments, then SRQt_Raw is equal to five. I then compute
SRQt by taking the natural logarithm of 1 plus SRQt_Raw.
I measure segment reporting quality (SRQl) as the quality of operating segment
aggregation into reportable operating segments based on the cross-segment profit variability
in Ettredge et al. (2006) meant to capture the extent to which the internal organization of the
company is faithfully represented in external reporting. A more representationally faithful
segmentation will also contribute towards better investment decisions by capital market
participants.
Properly aggregating operating segments based on their economic similarity leads to
differences in the profitability of the reported segments. In turn, managers’ incentives to
improperly aggregate operating segments lead them to disclose a smooth pattern of
profitability across segments.9 Ettredge et al. (2006) compute cross-segment profit variability
as the largest return on sales (ROS) minus the smallest ROS for the segments of the same
company. I adjust their measure (1) by using return-on-assets (ROA) instead of ROS since
ROA is a more comprehensive measure of profitability and (2) by directly taking into account
industry-level profitability weighted by the proportion of total assets allocated to each
segment. The adjusting procedure is similar to the one used in Lail et al. (2014).
𝑅𝑂𝐴𝑠,𝑖 = 𝑂𝑝𝑒𝑟𝑎𝑡𝑖𝑛𝑔𝑃𝑟𝑜𝑓𝑖𝑡𝑠,𝑖 𝐴𝑠𝑠𝑒𝑡𝑠𝑠,𝑖⁄
9 I conducted two interviews with a former sell-side equity research analyst with Morgan Stanley and a credit
analyst with OFI Asset Management in Paris, France in April 2014. These financial analysts also confirm that
cross-segment profit variability is a reasonably good proxy for the quality of reported operating segments.
86
𝐴𝑑𝑗𝑅𝑂𝐴𝑠,𝑖 = (𝑅𝑂𝐴𝑠,𝑖 − 𝐼𝑛𝑑𝑢𝑠𝑡𝑟𝑦𝑅𝑂𝐴𝑠) ×𝐴𝑠𝑠𝑒𝑡𝑠𝑠,𝑖
𝑇𝑜𝑡𝑎𝑙𝐴𝑠𝑠𝑒𝑡𝑠𝑖
𝑆𝑅𝑄𝑙𝑖 = 𝐿𝑜𝑔(2 + max 𝐴𝑑𝑗𝑅𝑂𝐴𝑠,𝑖 − min 𝐴𝑑𝑗𝑅𝑂𝐴𝑠,𝑖)
Where s is an indicator going from 1 to k, and k is the number of firm i’s segments.10
I test the determinants of the continuous measures SRQt and SRQl using cross-
sectional least-squares regressions. These tests allow us to understand what drives managers’
decisions on the quantity of line items and the quality of operating segment aggregation in the
full sample. I omit firm and time subscripts for ease of exposition.
𝑆𝑅𝑄𝑡 (𝑜𝑟 𝑆𝑅𝑄𝑙)
= 𝛽0 + 𝛽1𝐻𝑒𝑟𝑓 + 𝛽2𝑅&𝐷 + 𝛽3𝐿𝑛𝑀𝑔𝑂𝑤𝑛𝑒𝑟𝑠 + 𝛽4𝑅𝑂𝐴 + 𝛽5𝐿𝑜𝑠𝑠 + 𝛽6𝑀&𝐴
+ 𝛽7𝐵𝑖𝑔4 + 𝛽8𝐿𝑒𝑛𝑔𝑡ℎ𝐴𝑅 + 𝛽9𝐴𝐷𝑅 + 𝛽10𝐸𝑞𝐼𝑠𝑠𝑢𝑒 + 𝛽11𝐵𝑇𝑀 + 𝛽12𝐿𝑛𝑇𝐴
+ 𝐼𝑛𝑑𝑢𝑠𝑡𝑟𝑦 𝐹𝐸 + 휀 (1)
Following prior literature on segment information (Berger & Hann, 2007; Botosan &
Stanford, 2005; Harris, 1998), I proxy for industry-, and product market-related proprietary
costs using the Herfindahl industry concentration index (Herf) computed as the sum of the
squared market share of all firms at two digit SIC-level over the Thomson Reuters population
of listed companies in the sample countries. High values of Herf reflect high concentration
10
I acknowledge two limitations related to this measure of SRQl. First, the segment operating profit item used to
compute ROA is as reported. Since IFRS 8 does not define the segment result, different companies may have
different definitions for this item. Ettredge et al. (2006) and Lail et al. (2013) also discuss this issue. In addition,
Berger & Hann (2007) remark that it is not always clear whether segment assets as recorded in the databases
comprise both non-current and current assets. Due to asset allocation policies, some companies allocate and
disclose only non-current assets at segment level, but this line item gets recorded as segment assets in the
databases. For a random set of 81 companies (30%) in our sample I have checked the denomination of the
segment assets line-item disclosed in the note to financial statements. Although it might still be an issue,
following this verification, I are reasonably confident that the companies in our sample tend to allocate both
non-current and current assets at segment level, such that the segment assets line item is the equivalent of total
assets. Second, capturing the discretionary aspect of operating segment aggregation means I have to control for
the “natural” profit variability in a company’s segments. I benchmark segment profitability to single-segment
firms’ profitability based on the industry code Worldscope assigns to the segment. While this is common in the
literature (e.g., Lail et al. 2013; You 2013), I acknowledge that segments of conglomerates are not always
comparable to single-segment firms due to systematic differences hard to control for (Graham et al. 2002),
which means using single-segment profitability as benchmark may not always be meaningful.
87
and low levels of competition in that industry (Depoers & Jeanjean, 2012).11
My second
proxy for proprietary costs relates to innovation activities and is computed as the natural
logarithm of 1 plus research and development expenditures divided by lagged total sales
(R&D). Following prior literature (Ellis, Fee, & Thomas, 2012), I set the variable to 0 where
R&D expenditures are missing. High investment in R&D activities increases the firm’s
proprietary costs due to innovation.
I proxy for agency conflicts with a measure of managerial ownership (LnMgOwners)
computed following Lennox (2005) as the natural logarithm of the percent of outstanding
shares owned by current executive directors. Although aimed at aligning managers and
shareholders’ interests, management ownership potentially leads to entrenchment when
managers hold enough stock to control the company (Morck, Shleifer, & Vishny, 1988).
Management-controlled firms have considerable discretion in guiding the affairs of the
corporation, and this discretion could be used to divert some resources from corporate
shareholders (Morck et al., 1988). In contrast, owner-controlled firms do not have the same
incentives to divert resources, since owner-managers would suffer directly from reduced
share value (Jensen & Meckling, 1976).
Three variables in my model are meant to capture firm performance. I use the return-
on-assets (ROA), and an indicator variable for whether the company is making a loss in the
current year (Loss) to capture firm profitability. I also use an indicator variable for whether
the company was involved in mergers and acquisitions activity during the year (M&A) to
capture firm performance because better performing firms have enough resources to engage
in takeover activity.
Four variables proxy for firms’ incentives to provide transparent disclosures. High
quality auditors (Big4) are more likely to have their clients report high quality and high
11
According to Ali et al. (2014), high industry concentration could be interpreted as either low or high industry
competition, leading to different predictions of the relation between industry concentration and proprietary
costs. In developing our predictions, however, I rely on Herf as interpreted in prior work on segment reporting.

88
quantity of information.12
Companies’ overall disclosure policy measured using the natural
logarithm of the number of pages in the annual report (LengthAR) also proxies for firms’
incentives to provide a certain level of information. I include an indicator variable for the
U.S. cross-listing status (ADR) to capture firms’ incentives for increased transparency due to
the bonding effect (Coffee, 2002; Raffournier, 1995). The amount of equity issued during the
year divided by beginning-of-year market capitalization (EqIssue) proxies for firms’ need to
access the stock market for additional financing. Prior literature has shown that financing
needs incentivize managers to increase the quantity of disclosures they make in order to
reduce information asymmetry (Lang & Lundholm, 2000). The model also includes controls
for firm growth (BTM) and size as the natural logarithm of total assets (LnTA). Industry fixed
effects capture the similarity of segment disclosure quality and quantity in the same industry
and any sort of benchmarking of disclosure characteristics with industry peers (Botosan &
Harris, 2000). Adding country fixed effects to all the analyses (untabulated) leaves all the
inferences unchanged.
In order to test what motivates managers to deviate from an expected (i.e., average)
value of quantity and quality, I split the sample into three groups for each disclosure
characteristic. To do this, I first create quartiles based on SRQt_Raw and SRQl. Companies in
the bottom quartile of SRQt_Raw disclose fewer than 9 line items (Under-disclosers) while
those in the top quartile disclose more than 14 line items (Over-disclosers). Companies in the
two middle quartiles generally “tick” the number of line items suggested by the standard
(Box-tickers). In a similar way, I obtain three groups based on SRQl. The bottom quartile is
the LowQl group, the upper quartile is the HighQl group, and the two middle quartiles form
the AvgQl group.
12
Since French regulations require joint audits (André, Broye, Pong, & Schatt, 2014; Francis, Richard, &
Vanstraelen, 2009), Big4 is coded 1 for French firms audited by two Big 4 auditors or by one Big 4 and a local
auditor, and 0 for the French firms audited by two local auditors.

89
I run multinomial logistic regressions to test the determinants of the likelihood that
managers will choose to be in a certain disclosure group. Results will show to what extent the
hypothesized firm characteristics increase or decrease the probability that the company is an
Under-discloser or an Over-discloser compared to the reference group of Box-tickers, and,
respectively, has LowQl or HighQl disclosure, compared to the AvgQl group. As
hypothesized in H1a, I expect the multinomial regression coefficients on Herf, R&D, and
LnMgOwners in the “Under-disclosers vs. Box-tickers” model to be positive and significant,
meaning that high values for proprietary costs arising from market competition, and from
innovation activities, and agency costs due to managerial entrenchment increase the
likelihood that the company moves from the Box-tickers reference group into the Under-
disclosers group. Based on my prediction in H1b, I expect the coefficients on Big4,
LengthAR, ADR, and EqIssue in the “Over-disclosers vs. Box-tickers” column to be positive
and significant. High values for these variables reflect firms’ incentives to be transparent in
their financial reporting which increase the likelihood that the company moves from the Box-
tickers benchmark group into the Over-disclosers group. Confirming H1c and H1d rests on
the coefficients for ROA, Loss, and M&A being negative and significant in the model
predicting the likelihood of LowQl compared to AvgQl, and positive and significant in the
model predicting the likelihood of HighQl compared to AvgQl.
I test my hypotheses for whether being in different disclosure characteristic groups
makes a difference for financial analysts’ ability to accurately forecast earnings with two
models of earnings forecast error.
𝐹𝐸𝑖𝑡+1 = 𝛽0 + 𝛽1𝑈𝑛𝑑𝑒𝑟 − 𝑑𝑖𝑠𝑐𝑙𝑜𝑠𝑒𝑟𝑠𝑖𝑡 + 𝛽2𝑂𝑣𝑒𝑟 − 𝑑𝑖𝑠𝑐𝑙𝑜𝑠𝑒𝑟𝑠𝑖𝑡
+ ∑ 𝐶𝑜𝑛𝑡𝑟𝑜𝑙 𝑣𝑎𝑟𝑖𝑎𝑏𝑙𝑒𝑠 + 𝐼𝑛𝑑𝑢𝑠𝑡𝑟𝑦 𝐹𝐸 + 𝛿𝑖𝑡+1 (2)
𝐹𝐸𝑖𝑡+1 = 𝛾0 + 𝛾1𝐿𝑜𝑤𝑄𝑙𝑖𝑡 + 𝛾2𝐻𝑖𝑔ℎ𝑄𝑙𝑖𝑡 + ∑ 𝐶𝑜𝑛𝑡𝑟𝑜𝑙 𝑣𝑎𝑟𝑖𝑎𝑏𝑙𝑒𝑠 + 𝐼𝑛𝑑𝑢𝑠𝑡𝑟𝑦 𝐹𝐸
+ 𝜃𝑖𝑡+1 (3)
90
The magnitude of forecast error (FE) is the absolute value of the difference between
actual and estimated earnings-per-share, scaled by the absolute value of actual earnings-per-
share (e.g., Horton, Serafeim, & Serafeim, 2013). As Schipper (1991) points out, earnings
forecasts are not a final product but rather an input into generating a final product, i.e., the
stock recommendation and analyst report. If disclosure quality and quantity help analysts get
this intermediary step right, then the final product is more likely to be a good one. I compute
FE at the analyst-firm level since different individual analysts may have different ways of
interpreting disclosure quality and quantity, information that is lost if I use consensus
measures. Prior literature shows that analysts are heterogeneous in terms of, for example,
effort, experience, or ability, and these characteristics are related to the accuracy of their
forecasts and to how investors respond to their forecast revisions (Clement, 1999; Jacob, Lys,
& Neale, 1999; O’Brien, 1990; Stickel, 1992). Recent evidence also shows that investors use
individual analyst forecasts as additional benchmarks in evaluating reported earnings beyond
the consensus number (Kirk, Reppenhagen, & Tucker, 2014). 13
I control for variables shown in prior literature (e.g., Bradshaw, Miller, & Serafeim,
2009; Lang & Lundholm, 1996; O’Brien & Bhushan, 1990) to impact analysts’ forecast
accuracy and which have been previously used in international studies examining at the
properties of analysts’ earnings forecasts (e.g., Tan et al. 2011; Preiato et al. 2013). Namely, I
control for the firm’s earnings quality with the standard deviation of residuals from the
Dechow & Dichev (2002) model of discretionary accruals (EQ) because analysts seem to
take into account discretionary accruals when forecasting earnings (Givoly, Hayn, & Yoder,
2011). Complexity in firm organization makes it harder for analysts to forecast earnings
(Dunn & Nathan, 2005), so I control for the reported number of segments (Segments). Larger
companies are more likely to have high analyst coverage (Bhushan, 1989) and more coverage
13
Running the models on analyst-firm observations also increases the power of our tests.
91
from the business press (Kothari, Li, & Short, 2009), so I also control for firm size (LnTA).14
Forecasting earnings for loss-making companies is harder (Das, 1998), so I control for
whether the company made a loss in the previous year (Loss). Following prior literature, I use
the number of financial analysts forecasting the earnings of the company in t+1 (LnAnalysts)
to control for the firm’s overall information environment (Ashbaugh & Pincus, 2001).15
Companies that have turned to the capital market for financing during the previous
year are more likely to have increased the frequency of their non-regulated disclosures and
the amount of information they provide (Lang & Lundholm, 2000), so I control for the
amount of equity issuance in year t as a percent of lagged total market capitalization
(EqIssue). I include LengthAR and an indicator variable for whether management provides an
outlook for the t+1 earnings in year t earnings announcement press release (Guidance) based
on hand-collected data to control for management’s overall attitude towards disclosing
information to capital markets, including forward-looking information, expected to improve
forecast accuracy (Hassell, Jennings, & Lasser, 1988; Healy et al., 1999; Lang & Lundholm,
1996; Williams, 1996). I use stock return volatility (ReturnVolatility) to proxy for firm-
related news in the market (Duffee, 1995; Lang & Lundholm, 1996), book-to-market ratio
(BTM) to proxy for a firm’s growth, and ADR to proxy for a firm’s commitment to another
regulatory regime that improves the firm’s information environment (Lang, Lins, & Miller,
2003). In addition, I include industry fixed effects to account for differences in forecasting
difficulty at the industry level. I run these models on cross-sectional firm-analyst
observations to increase the power of the test, and cluster standard errors at the analyst level.
Since disclosing fewer line items in the segment note means providing less
information about the firm’s segments, I expect that compared to Box-tickers, financial
14
Using the number of distinct four-digit or two-digit industries in which the company operates instead of the
number of reported operating segments does not significantly change the results. 15
In this study, LnAnalysts and LnTA are correlated at 55%. In order to mitigate multicollinearity concerns, I
also run the analyses using the orthogonalized value of LnAnalysts on LnTA. Results are very similar and
inferences do not change.
92
analysts covering Under-disclosers are less accurate, i.e., I expect β1 to be positive and
significant (H2a). At the same time, since Over-disclosers disclose higher quantities of
information compared to Box-tickers, analysts can use that extra information to make better
earnings predictions, i.e., I expect β2 to be negative and significant (H2b). If financial
analysts are able to perceive the quality of operating segment aggregation, then their earnings
forecast errors for LowQl companies are higher compared to the AvgQl group, i.e., γ1 is
positive and significant (H2c) and the forecast errors for HighQl companies are lower
compared to the AvgQl group, i.e., γ2 is negative and significant (H2d).
Up until now I have focused on the determinants and consequences of disclosure
quantity and quality viewed as independent decisions. I now turn my focus to managers’
decisions vis-à-vis disclosure quality given that they have already decided on being a Box-
ticker in terms of disclosure quantity. In order to test H3a, I run model (1) on the sample of
Box-tickers, with SRQl as dependent variable. Box-tickers follow the suggestions in the
standard and disclose more or less the same number of items as exemplified there. They seem
to treat that number of line items as mandatory disclosure, and provide it regardless of the
proprietary and agency costs they may be incurring. I hypothesize, however, that these
companies in turn solve their proprietary and agency costs by decreasing the quality of
operating segment aggregation. Therefore, I expect positive coefficients for Herf and
LnMgOwners, and a negative coefficient for R&D. To test hypotheses H3b and H3c for
whether financial analysts are indeed able to differentiate segment reporting quality for the
group of average SRQt, I run model (3) on the sample of Box-tickers. I predict that, compared
to the reference group Box-tickers & AvgQl, companies in the LowQl group have higher
forecast errors, i.e., the coefficient on Box-tickers & LowQl is positive and significant (H3b),
while companies in the HighQl group have lower forecast errors, i.e., the coefficient on Box-
tickers & HighQl is negative and significant (H3c).
93
I.4 Sample and results
I.4.1 Sample
Due to data collection requirements for segment reporting quantity, I start the sample
construction from the companies included in the STOXX Europe 600 index at 31 December
2009. The mandatory switch to IFRS 8 in 2009 allows firms to re-evaluate their segment
disclosures and potentially break from existing disclosure habits, which makes the
investigation of managers’ disclosure decisions at this point in time all the more meaningful.
I delete 143 companies activating primarily in the financial industry (i.e., ICB codes
8000-8999), along with companies that follow U.S. GAAP (10 companies), those without a
segment footnote or that report a single segment (28 companies), companies for which two
types of shares are included in the index (i.e., doubles; 4 companies) and companies that have
been acquired and for which corporate documents are no longer available (14 companies). I
further delete firms that do not report segment assets (62 companies) necessary for computing
segment-level ROA, and companies whose main segmentation is geographical (69
companies) for lack of a profitability benchmark to use for adjusting segment-level ROA. The
final sample comprises 270 companies with one year of data. Table I.1 panel A illustrates the
sample construction procedure. Where analyses are based on analyst-firm level data, the
sample contains 7929 observations.
Sample companies are listed on stock exchanges in 17 EU countries (table I.1 panel
B). There are 74 UK companies (37%), 38 French companies (14%), and 33 German
companies (12%). Each of the other countries contributes with less than 10% of the sample
companies. This distribution is similar to the country distribution in the overall STOXX
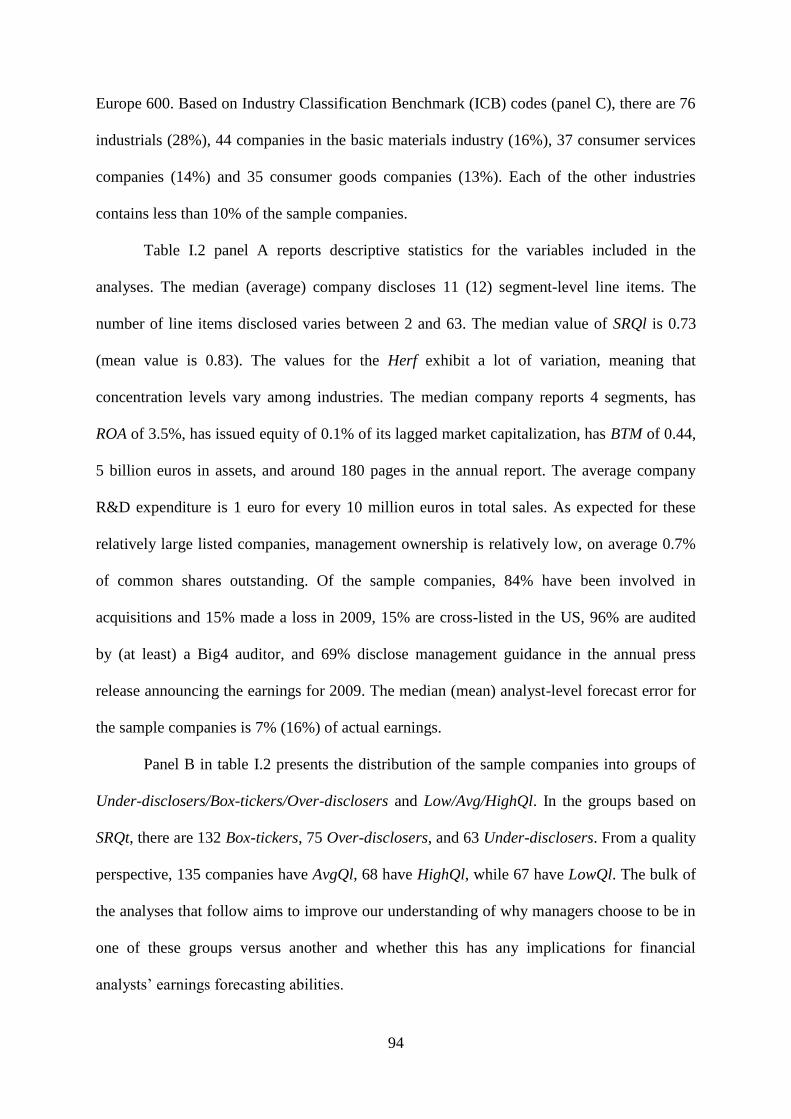
94
Europe 600. Based on Industry Classification Benchmark (ICB) codes (panel C), there are 76
industrials (28%), 44 companies in the basic materials industry (16%), 37 consumer services
companies (14%) and 35 consumer goods companies (13%). Each of the other industries
contains less than 10% of the sample companies.
Table I.2 panel A reports descriptive statistics for the variables included in the
analyses. The median (average) company discloses 11 (12) segment-level line items. The
number of line items disclosed varies between 2 and 63. The median value of SRQl is 0.73
(mean value is 0.83). The values for the Herf exhibit a lot of variation, meaning that
concentration levels vary among industries. The median company reports 4 segments, has
ROA of 3.5%, has issued equity of 0.1% of its lagged market capitalization, has BTM of 0.44,
5 billion euros in assets, and around 180 pages in the annual report. The average company
R&D expenditure is 1 euro for every 10 million euros in total sales. As expected for these
relatively large listed companies, management ownership is relatively low, on average 0.7%
of common shares outstanding. Of the sample companies, 84% have been involved in
acquisitions and 15% made a loss in 2009, 15% are cross-listed in the US, 96% are audited
by (at least) a Big4 auditor, and 69% disclose management guidance in the annual press
release announcing the earnings for 2009. The median (mean) analyst-level forecast error for
the sample companies is 7% (16%) of actual earnings.
Panel B in table I.2 presents the distribution of the sample companies into groups of
Under-disclosers/Box-tickers/Over-disclosers and Low/Avg/HighQl. In the groups based on
SRQt, there are 132 Box-tickers, 75 Over-disclosers, and 63 Under-disclosers. From a quality
perspective, 135 companies have AvgQl, 68 have HighQl, while 67 have LowQl. The bulk of
the analyses that follow aims to improve our understanding of why managers choose to be in
one of these groups versus another and whether this has any implications for financial
analysts’ earnings forecasting abilities.

95
Table I.2 also presents the correlation matrices for the variables used in the
determinants (panel C) and consequences (panel D) analyses. The nonparametric correlation
coefficient between SRQt and SRQl is 4% and not significant at conventional levels. The
highest correlations are between ROA and Loss (-61%), between ROA and BTM (58%), and
between LnAnalysts and LnTA (55%). All other correlation coefficients are below 50%. The
strongest correlation of SRQt is with LengthAR (29%, significant at 1%), while the strongest
correlation of SRQl is with ROA (15%, significant at 1%). The correlation between FE and
SRQl is -5%, significant at 1%, and between FE and SRQt is 12%, significant at 1%.
I.4.2 Main results
I begin by testing the determinants of the continuous measures for SRQt and SRQl in
least-squares firm-level regressions (table I.3 panel A). Standard errors are adjusted for
heteroskedasticity. Throughout the paper, even when I have a predicted sign, statistical
significance of regression coefficients is based on two-sided t-tests. The dependent variable
in model 1 is SRQt. The number of segment-level line items is positively associated with
companies’ overall disclosure policy proxied by LengthAR (coefficient 0.22, t-value 3.00),
and with BTM (coefficient 0.21, t-stat 3.53). Involvement in M&A is also positively
associated with SRQt (coefficient 0.13, t-stat 2.03) perhaps because managers with a
penchant for takeovers feel the need to give more information about their activity to
investors. Cross-listing in the U.S. seems to decrease the number of reported segment line
items (coefficient on ADR is -0.14, t-stat -2.37), consistent with the findings in Hope et al.
(2013), who show that compared to matched U.S. firms, cross-listed firms disclose
management earnings guidance less frequently and of lower quality. Accessing the capital
markets during the year for additional financing (EqIssue) is also negatively related to SRQt
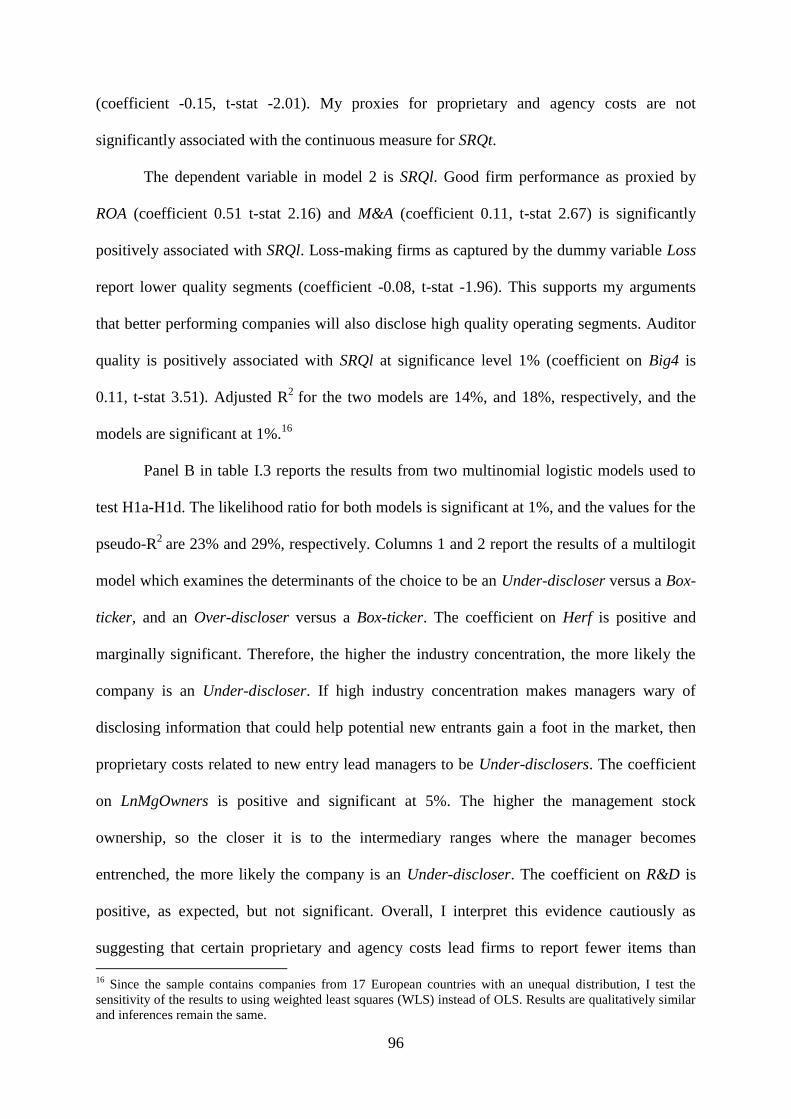
96
(coefficient -0.15, t-stat -2.01). My proxies for proprietary and agency costs are not
significantly associated with the continuous measure for SRQt.
The dependent variable in model 2 is SRQl. Good firm performance as proxied by
ROA (coefficient 0.51 t-stat 2.16) and M&A (coefficient 0.11, t-stat 2.67) is significantly
positively associated with SRQl. Loss-making firms as captured by the dummy variable Loss
report lower quality segments (coefficient -0.08, t-stat -1.96). This supports my arguments
that better performing companies will also disclose high quality operating segments. Auditor
quality is positively associated with SRQl at significance level 1% (coefficient on Big4 is
0.11, t-stat 3.51). Adjusted R2
for the two models are 14%, and 18%, respectively, and the
models are significant at 1%.16
Panel B in table I.3 reports the results from two multinomial logistic models used to
test H1a-H1d. The likelihood ratio for both models is significant at 1%, and the values for the
pseudo-R2
are 23% and 29%, respectively. Columns 1 and 2 report the results of a multilogit
model which examines the determinants of the choice to be an Under-discloser versus a Box-
ticker, and an Over-discloser versus a Box-ticker. The coefficient on Herf is positive and
marginally significant. Therefore, the higher the industry concentration, the more likely the
company is an Under-discloser. If high industry concentration makes managers wary of
disclosing information that could help potential new entrants gain a foot in the market, then
proprietary costs related to new entry lead managers to be Under-disclosers. The coefficient
on LnMgOwners is positive and significant at 5%. The higher the management stock
ownership, so the closer it is to the intermediary ranges where the manager becomes
entrenched, the more likely the company is an Under-discloser. The coefficient on R&D is
positive, as expected, but not significant. Overall, I interpret this evidence cautiously as
suggesting that certain proprietary and agency costs lead firms to report fewer items than
16
Since the sample contains companies from 17 European countries with an unequal distribution, I test the
sensitivity of the results to using weighted least squares (WLS) instead of OLS. Results are qualitatively similar
and inferences remain the same.
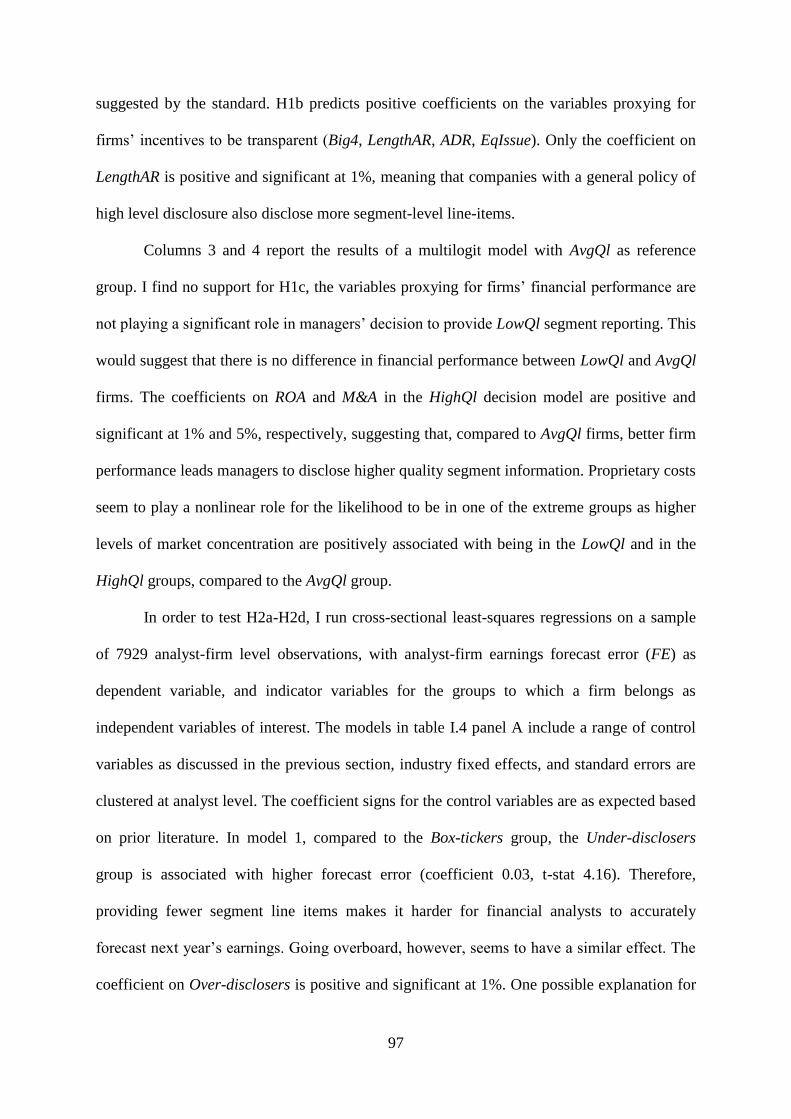
97
suggested by the standard. H1b predicts positive coefficients on the variables proxying for
firms’ incentives to be transparent (Big4, LengthAR, ADR, EqIssue). Only the coefficient on
LengthAR is positive and significant at 1%, meaning that companies with a general policy of
high level disclosure also disclose more segment-level line-items.
Columns 3 and 4 report the results of a multilogit model with AvgQl as reference
group. I find no support for H1c, the variables proxying for firms’ financial performance are
not playing a significant role in managers’ decision to provide LowQl segment reporting. This
would suggest that there is no difference in financial performance between LowQl and AvgQl
firms. The coefficients on ROA and M&A in the HighQl decision model are positive and
significant at 1% and 5%, respectively, suggesting that, compared to AvgQl firms, better firm
performance leads managers to disclose higher quality segment information. Proprietary costs
seem to play a nonlinear role for the likelihood to be in one of the extreme groups as higher
levels of market concentration are positively associated with being in the LowQl and in the
HighQl groups, compared to the AvgQl group.
In order to test H2a-H2d, I run cross-sectional least-squares regressions on a sample
of 7929 analyst-firm level observations, with analyst-firm earnings forecast error (FE) as
dependent variable, and indicator variables for the groups to which a firm belongs as
independent variables of interest. The models in table I.4 panel A include a range of control
variables as discussed in the previous section, industry fixed effects, and standard errors are
clustered at analyst level. The coefficient signs for the control variables are as expected based
on prior literature. In model 1, compared to the Box-tickers group, the Under-disclosers
group is associated with higher forecast error (coefficient 0.03, t-stat 4.16). Therefore,
providing fewer segment line items makes it harder for financial analysts to accurately
forecast next year’s earnings. Going overboard, however, seems to have a similar effect. The
coefficient on Over-disclosers is positive and significant at 1%. One possible explanation for
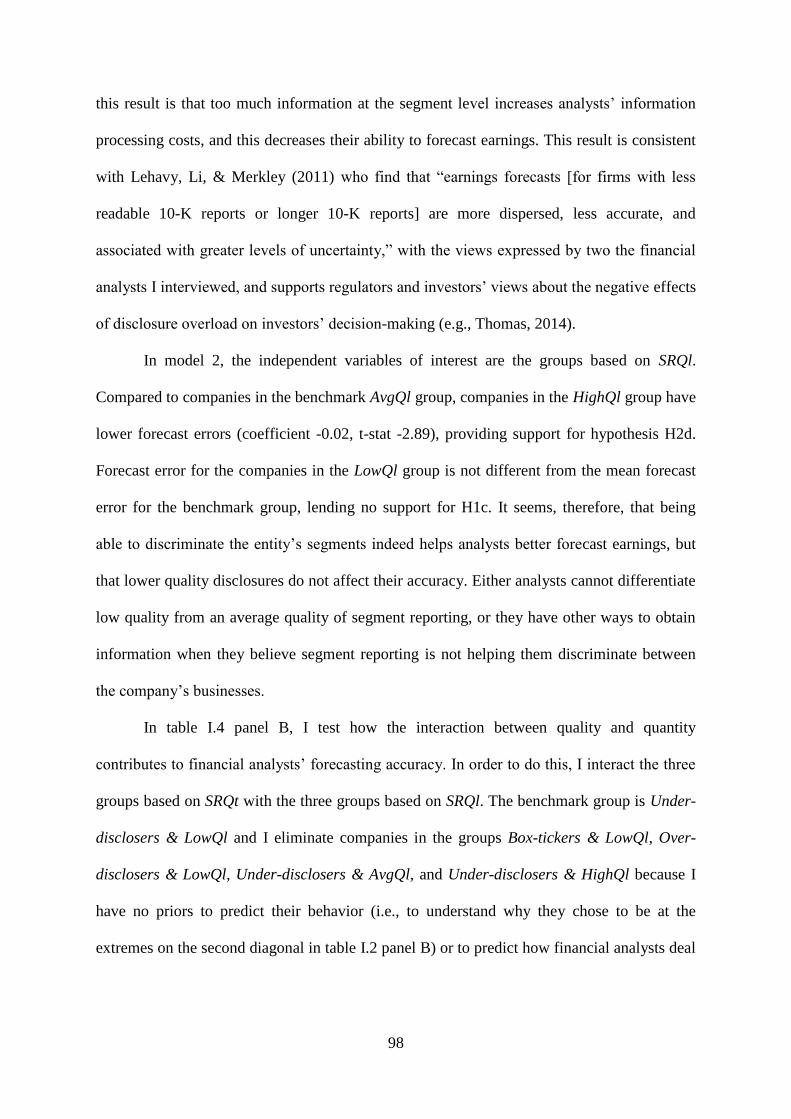
98
this result is that too much information at the segment level increases analysts’ information
processing costs, and this decreases their ability to forecast earnings. This result is consistent
with Lehavy, Li, & Merkley (2011) who find that “earnings forecasts [for firms with less
readable 10-K reports or longer 10-K reports] are more dispersed, less accurate, and
associated with greater levels of uncertainty,” with the views expressed by two the financial
analysts I interviewed, and supports regulators and investors’ views about the negative effects
of disclosure overload on investors’ decision-making (e.g., Thomas, 2014).
In model 2, the independent variables of interest are the groups based on SRQl.
Compared to companies in the benchmark AvgQl group, companies in the HighQl group have
lower forecast errors (coefficient -0.02, t-stat -2.89), providing support for hypothesis H2d.
Forecast error for the companies in the LowQl group is not different from the mean forecast
error for the benchmark group, lending no support for H1c. It seems, therefore, that being
able to discriminate the entity’s segments indeed helps analysts better forecast earnings, but
that lower quality disclosures do not affect their accuracy. Either analysts cannot differentiate
low quality from an average quality of segment reporting, or they have other ways to obtain
information when they believe segment reporting is not helping them discriminate between
the company’s businesses.
In table I.4 panel B, I test how the interaction between quality and quantity
contributes to financial analysts’ forecasting accuracy. In order to do this, I interact the three
groups based on SRQt with the three groups based on SRQl. The benchmark group is Under-
disclosers & LowQl and I eliminate companies in the groups Box-tickers & LowQl, Over-
disclosers & LowQl, Under-disclosers & AvgQl, and Under-disclosers & HighQl because I
have no priors to predict their behavior (i.e., to understand why they chose to be at the
extremes on the second diagonal in table I.2 panel B) or to predict how financial analysts deal
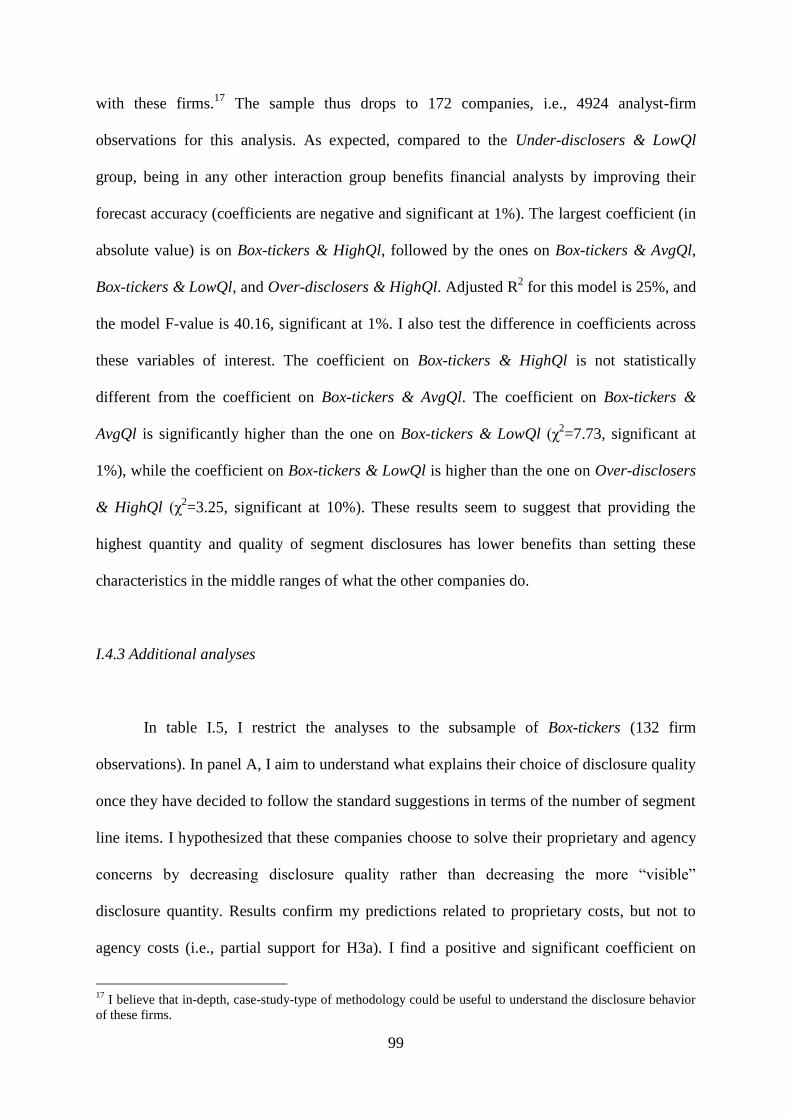
99
with these firms.17
The sample thus drops to 172 companies, i.e., 4924 analyst-firm
observations for this analysis. As expected, compared to the Under-disclosers & LowQl
group, being in any other interaction group benefits financial analysts by improving their
forecast accuracy (coefficients are negative and significant at 1%). The largest coefficient (in
absolute value) is on Box-tickers & HighQl, followed by the ones on Box-tickers & AvgQl,
Box-tickers & LowQl, and Over-disclosers & HighQl. Adjusted R2 for this model is 25%, and
the model F-value is 40.16, significant at 1%. I also test the difference in coefficients across
these variables of interest. The coefficient on Box-tickers & HighQl is not statistically
different from the coefficient on Box-tickers & AvgQl. The coefficient on Box-tickers &
AvgQl is significantly higher than the one on Box-tickers & LowQl (χ2=7.73, significant at
1%), while the coefficient on Box-tickers & LowQl is higher than the one on Over-disclosers
& HighQl (χ2=3.25, significant at 10%). These results seem to suggest that providing the
highest quantity and quality of segment disclosures has lower benefits than setting these
characteristics in the middle ranges of what the other companies do.
I.4.3 Additional analyses
In table I.5, I restrict the analyses to the subsample of Box-tickers (132 firm
observations). In panel A, I aim to understand what explains their choice of disclosure quality
once they have decided to follow the standard suggestions in terms of the number of segment
line items. I hypothesized that these companies choose to solve their proprietary and agency
concerns by decreasing disclosure quality rather than decreasing the more “visible”
disclosure quantity. Results confirm my predictions related to proprietary costs, but not to
agency costs (i.e., partial support for H3a). I find a positive and significant coefficient on
17
I believe that in-depth, case-study-type of methodology could be useful to understand the disclosure behavior
of these firms.
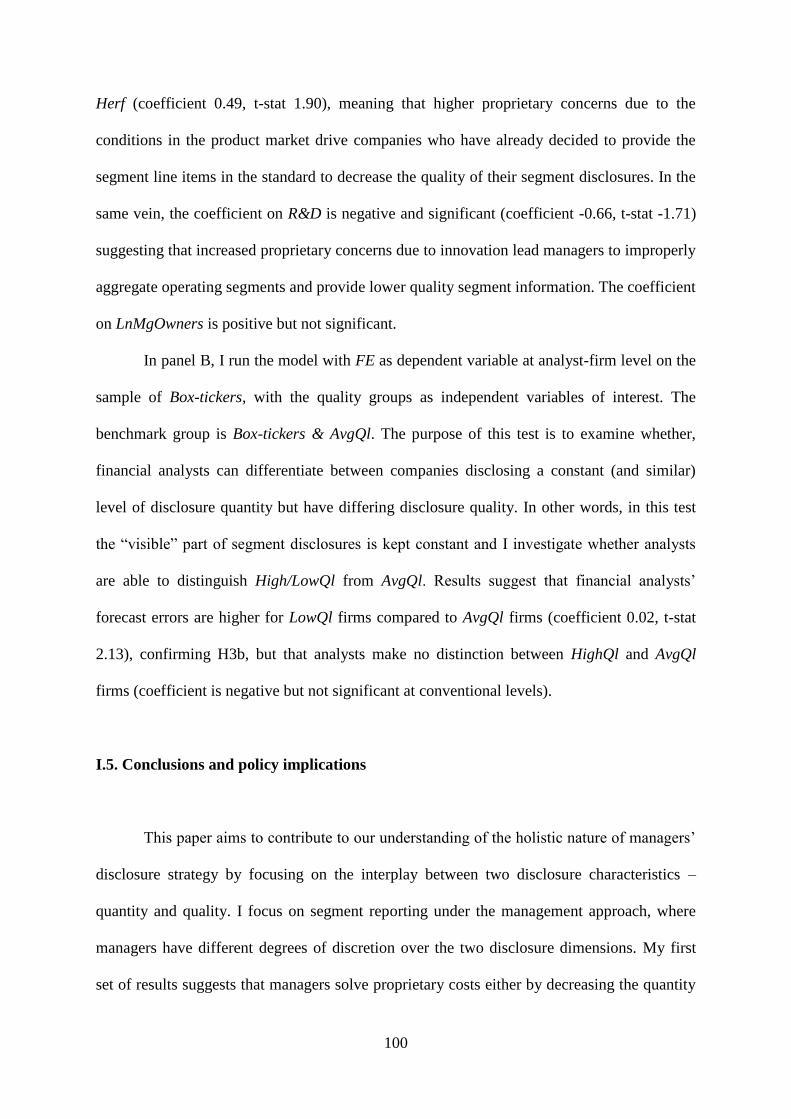
100
Herf (coefficient 0.49, t-stat 1.90), meaning that higher proprietary concerns due to the
conditions in the product market drive companies who have already decided to provide the
segment line items in the standard to decrease the quality of their segment disclosures. In the
same vein, the coefficient on R&D is negative and significant (coefficient -0.66, t-stat -1.71)
suggesting that increased proprietary concerns due to innovation lead managers to improperly
aggregate operating segments and provide lower quality segment information. The coefficient
on LnMgOwners is positive but not significant.
In panel B, I run the model with FE as dependent variable at analyst-firm level on the
sample of Box-tickers, with the quality groups as independent variables of interest. The
benchmark group is Box-tickers & AvgQl. The purpose of this test is to examine whether,
financial analysts can differentiate between companies disclosing a constant (and similar)
level of disclosure quantity but have differing disclosure quality. In other words, in this test
the “visible” part of segment disclosures is kept constant and I investigate whether analysts
are able to distinguish High/LowQl from AvgQl. Results suggest that financial analysts’
forecast errors are higher for LowQl firms compared to AvgQl firms (coefficient 0.02, t-stat
2.13), confirming H3b, but that analysts make no distinction between HighQl and AvgQl
firms (coefficient is negative but not significant at conventional levels).
I.5. Conclusions and policy implications
This paper aims to contribute to our understanding of the holistic nature of managers’
disclosure strategy by focusing on the interplay between two disclosure characteristics –
quantity and quality. I focus on segment reporting under the management approach, where
managers have different degrees of discretion over the two disclosure dimensions. My first
set of results suggests that managers solve proprietary costs either by decreasing the quantity
101
of information below standard guidance, or, if following standard suggestions, by decreasing
information quality. This finding has implications for how researchers and regulators rate
overall disclosure informativeness and is in line with investors and financial analysts’ opinion
that high disclosure quantity may sometimes act as a smokescreen for low quality.
Our second set of results suggests that financial analysts do not always pick up
segment reporting quality and too much quantity may increase information processing costs
and impair their ability to accurately forecast earnings. In light of standard setters’ increasing
interest for business-model based standards (Leisenring et al., 2012), these results advocate a
cautious approach since it appears that even sophisticated users have difficulties with the
“management approach.”
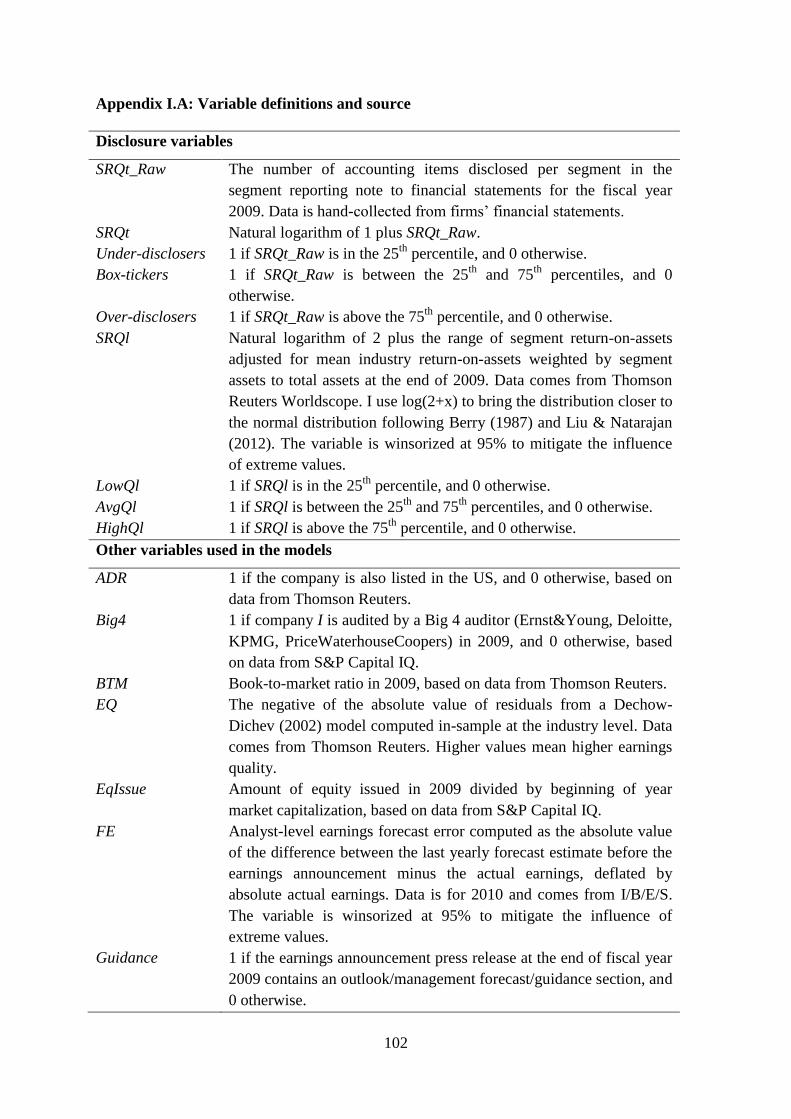
102
Appendix I.A: Variable definitions and source
Disclosure variables
SRQt_Raw The number of accounting items disclosed per segment in the
segment reporting note to financial statements for the fiscal year
2009. Data is hand-collected from firms’ financial statements.
SRQt Natural logarithm of 1 plus SRQt_Raw.
Under-disclosers 1 if SRQt_Raw is in the 25th
percentile, and 0 otherwise.
Box-tickers 1 if SRQt_Raw is between the 25th
and 75th
percentiles, and 0
otherwise.
Over-disclosers 1 if SRQt_Raw is above the 75th
percentile, and 0 otherwise.
SRQl Natural logarithm of 2 plus the range of segment return-on-assets
adjusted for mean industry return-on-assets weighted by segment
assets to total assets at the end of 2009. Data comes from Thomson
Reuters Worldscope. I use log(2+x) to bring the distribution closer to
the normal distribution following Berry (1987) and Liu & Natarajan
(2012). The variable is winsorized at 95% to mitigate the influence
of extreme values.
LowQl 1 if SRQl is in the 25th
percentile, and 0 otherwise.
AvgQl 1 if SRQl is between the 25th
and 75th
percentiles, and 0 otherwise.
HighQl 1 if SRQl is above the 75th
percentile, and 0 otherwise.
Other variables used in the models
ADR 1 if the company is also listed in the US, and 0 otherwise, based on
data from Thomson Reuters.
Big4 1 if company I is audited by a Big 4 auditor (Ernst&Young, Deloitte,
KPMG, PriceWaterhouseCoopers) in 2009, and 0 otherwise, based
on data from S&P Capital IQ.
BTM Book-to-market ratio in 2009, based on data from Thomson Reuters.
EQ The negative of the absolute value of residuals from a Dechow-
Dichev (2002) model computed in-sample at the industry level. Data
comes from Thomson Reuters. Higher values mean higher earnings
quality.
EqIssue Amount of equity issued in 2009 divided by beginning of year
market capitalization, based on data from S&P Capital IQ.
FE Analyst-level earnings forecast error computed as the absolute value
of the difference between the last yearly forecast estimate before the
earnings announcement minus the actual earnings, deflated by
absolute actual earnings. Data is for 2010 and comes from I/B/E/S.
The variable is winsorized at 95% to mitigate the influence of
extreme values.
Guidance 1 if the earnings announcement press release at the end of fiscal year
2009 contains an outlook/management forecast/guidance section, and
0 otherwise.
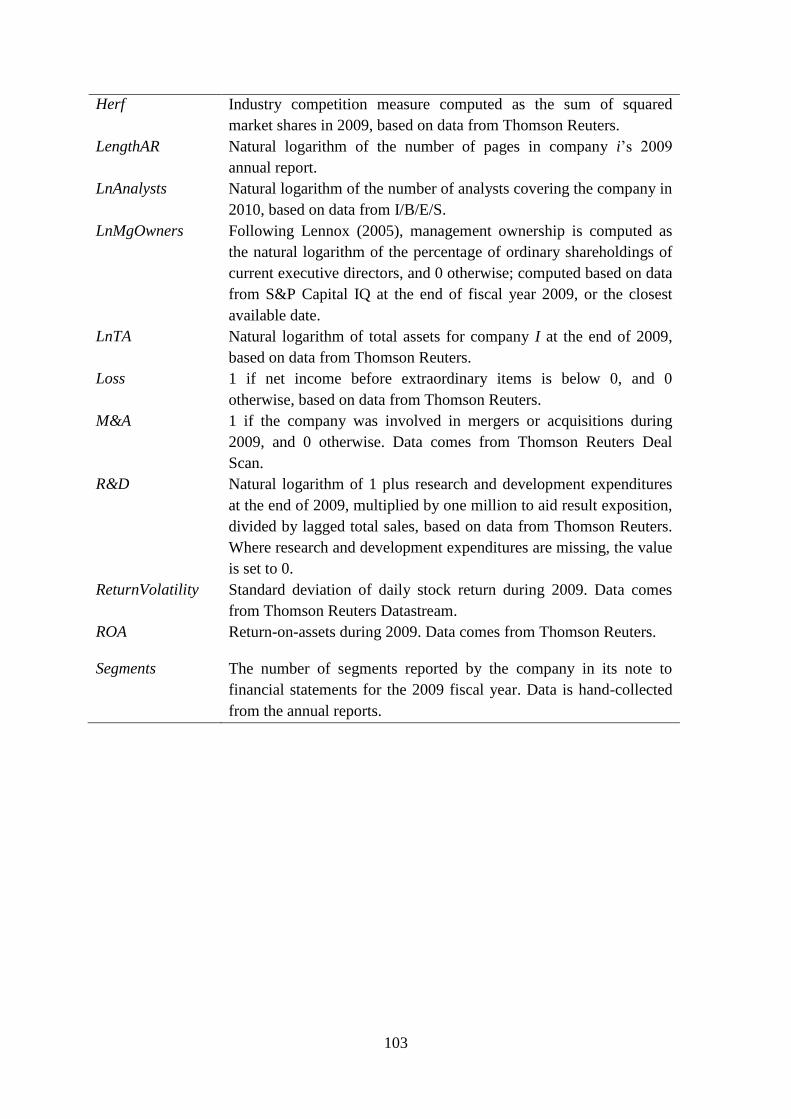
103
Herf Industry competition measure computed as the sum of squared
market shares in 2009, based on data from Thomson Reuters.
LengthAR Natural logarithm of the number of pages in company i’s 2009
annual report.
LnAnalysts Natural logarithm of the number of analysts covering the company in
2010, based on data from I/B/E/S.
LnMgOwners Following Lennox (2005), management ownership is computed as
the natural logarithm of the percentage of ordinary shareholdings of
current executive directors, and 0 otherwise; computed based on data
from S&P Capital IQ at the end of fiscal year 2009, or the closest
available date.
LnTA Natural logarithm of total assets for company I at the end of 2009,
based on data from Thomson Reuters.
Loss 1 if net income before extraordinary items is below 0, and 0
otherwise, based on data from Thomson Reuters.
M&A 1 if the company was involved in mergers or acquisitions during
2009, and 0 otherwise. Data comes from Thomson Reuters Deal
Scan.
R&D Natural logarithm of 1 plus research and development expenditures
at the end of 2009, multiplied by one million to aid result exposition,
divided by lagged total sales, based on data from Thomson Reuters.
Where research and development expenditures are missing, the value
is set to 0.
ReturnVolatility Standard deviation of daily stock return during 2009. Data comes
from Thomson Reuters Datastream.
ROA Return-on-assets during 2009. Data comes from Thomson Reuters.
Segments The number of segments reported by the company in its note to
financial statements for the 2009 fiscal year. Data is hand-collected
from the annual reports.

104
Appendix I.B: Tables for chapter I
Table I.1: Sample
Panel A: Sample construction
STOXX Europe 600 at 31/12/2009 600
(-) Financial institutions -143
(-) Follow U.S. GAAP -10
(-) No segment footnote/Single segment -28
(-) Doubles -4
(-) Taken over in/after 2010 -14
(-) Missing segment asset data -62
(-) Main segmentation is geographical -69
(=) Total 270
This table describes the sampling procedure.
Panel B: Distribution of sample by country
Country Freq. Percent
Austria 5 1.85
Belgium 3 1.11
Switzerland 19 7.04
Germany 33 12.22
Denmark 3 1.11
Spain 15 5.56
Finland 15 5.56
France 38 14.07
UK 74 27.41
Greece 2 0.74
Ireland 4 1.48
Italy 11 4.07
Luxembourg 2 0.74
Netherlands 14 5.19
Norway 8 2.96
Portugal 6 2.22
Sweden 18 6.67
Total 270 100
This table reports the country distribution of
companies in the sample.
Panel C: Distribution of sample by
industry
Industry Freq. Percent
Basic Materials 44 16.30
Consumer Goods 35 12.96
Consumer Services 37 13.70
Health Care 13 4.81
Industrials 76 28.15
Oil and Gas 25 9.26
Technology 11 4.07
Telecommunications 12 4.44
Utilities 17 6.30
Total 270 100
This table presents the industry distribution of the
companies included in the sample, based on one-
digit Industry Classification Benchmark (ICB)
classification codes.
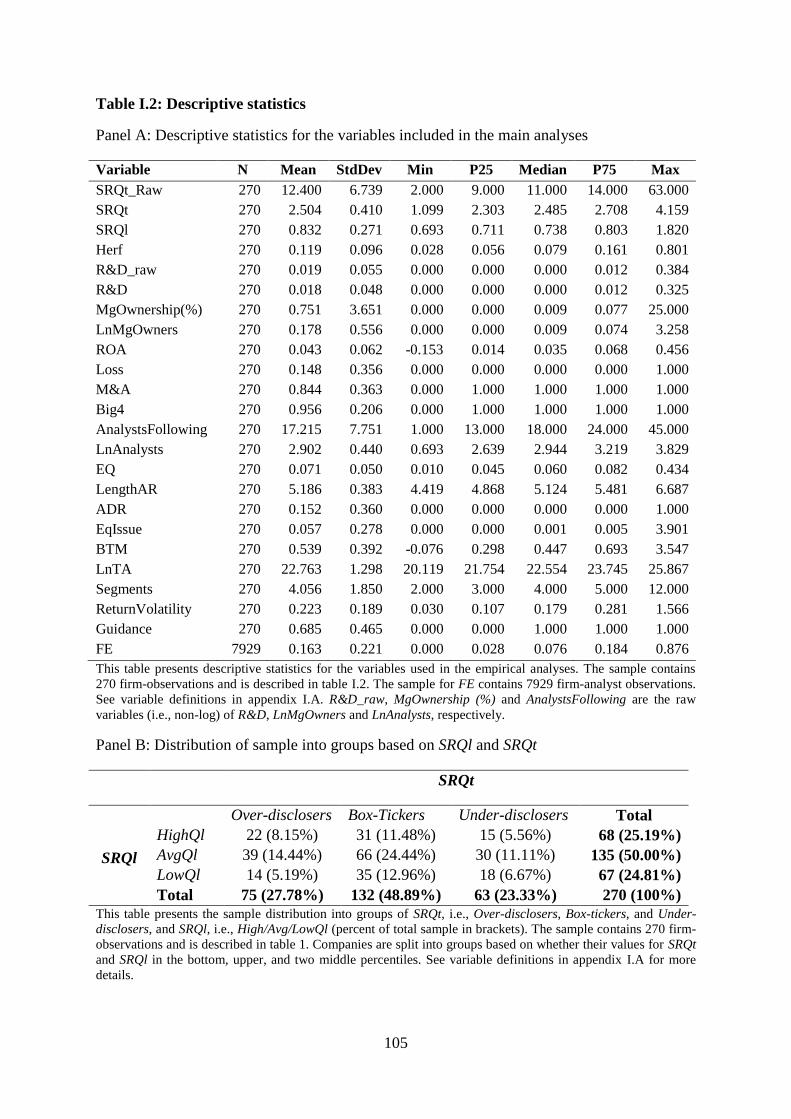
105
Table I.2: Descriptive statistics
Panel A: Descriptive statistics for the variables included in the main analyses
Variable N Mean StdDev Min P25 Median P75 Max
SRQt_Raw 270 12.400 6.739 2.000 9.000 11.000 14.000 63.000
SRQt 270 2.504 0.410 1.099 2.303 2.485 2.708 4.159
SRQl 270 0.832 0.271 0.693 0.711 0.738 0.803 1.820
Herf 270 0.119 0.096 0.028 0.056 0.079 0.161 0.801
R&D_raw 270 0.019 0.055 0.000 0.000 0.000 0.012 0.384
R&D 270 0.018 0.048 0.000 0.000 0.000 0.012 0.325
MgOwnership(%) 270 0.751 3.651 0.000 0.000 0.009 0.077 25.000
LnMgOwners 270 0.178 0.556 0.000 0.000 0.009 0.074 3.258
ROA 270 0.043 0.062 -0.153 0.014 0.035 0.068 0.456
Loss 270 0.148 0.356 0.000 0.000 0.000 0.000 1.000
M&A 270 0.844 0.363 0.000 1.000 1.000 1.000 1.000
Big4 270 0.956 0.206 0.000 1.000 1.000 1.000 1.000
AnalystsFollowing 270 17.215 7.751 1.000 13.000 18.000 24.000 45.000
LnAnalysts 270 2.902 0.440 0.693 2.639 2.944 3.219 3.829
EQ 270 0.071 0.050 0.010 0.045 0.060 0.082 0.434
LengthAR 270 5.186 0.383 4.419 4.868 5.124 5.481 6.687
ADR 270 0.152 0.360 0.000 0.000 0.000 0.000 1.000
EqIssue 270 0.057 0.278 0.000 0.000 0.001 0.005 3.901
BTM 270 0.539 0.392 -0.076 0.298 0.447 0.693 3.547
LnTA 270 22.763 1.298 20.119 21.754 22.554 23.745 25.867
Segments 270 4.056 1.850 2.000 3.000 4.000 5.000 12.000
ReturnVolatility 270 0.223 0.189 0.030 0.107 0.179 0.281 1.566
Guidance 270 0.685 0.465 0.000 0.000 1.000 1.000 1.000
FE 7929 0.163 0.221 0.000 0.028 0.076 0.184 0.876
This table presents descriptive statistics for the variables used in the empirical analyses. The sample contains
270 firm-observations and is described in table I.2. The sample for FE contains 7929 firm-analyst observations.
See variable definitions in appendix I.A. R&D_raw, MgOwnership (%) and AnalystsFollowing are the raw
variables (i.e., non-log) of R&D, LnMgOwners and LnAnalysts, respectively.
Panel B: Distribution of sample into groups based on SRQl and SRQt
SRQt
Over-disclosers Box-Tickers Under-disclosers Total
SRQl
HighQl 22 (8.15%) 31 (11.48%) 15 (5.56%) 68 (25.19%)
AvgQl 39 (14.44%) 66 (24.44%) 30 (11.11%) 135 (50.00%)
LowQl 14 (5.19%) 35 (12.96%) 18 (6.67%) 67 (24.81%)
Total 75 (27.78%) 132 (48.89%) 63 (23.33%) 270 (100%)
This table presents the sample distribution into groups of SRQt, i.e., Over-disclosers, Box-tickers, and Under-
disclosers, and SRQl, i.e., High/Avg/LowQl (percent of total sample in brackets). The sample contains 270 firm-
observations and is described in table 1. Companies are split into groups based on whether their values for SRQt
and SRQl in the bottom, upper, and two middle percentiles. See variable definitions in appendix I.A for more
details.
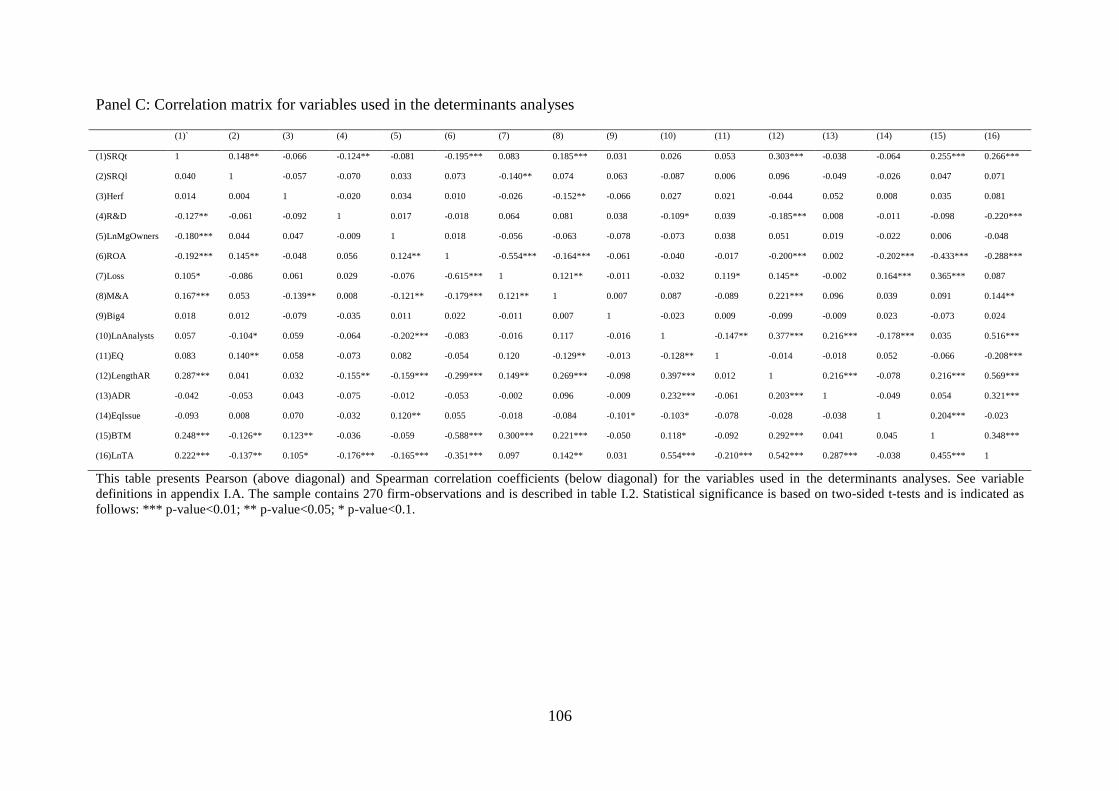
106
Panel C: Correlation matrix for variables used in the determinants analyses
(1)` (2) (3) (4) (5) (6) (7) (8) (9) (10) (11) (12) (13) (14) (15) (16)
(1)SRQt 1 0.148** -0.066 -0.124** -0.081 -0.195*** 0.083 0.185*** 0.031 0.026 0.053 0.303*** -0.038 -0.064 0.255*** 0.266***
(2)SRQl 0.040 1 -0.057 -0.070 0.033 0.073 -0.140** 0.074 0.063 -0.087 0.006 0.096 -0.049 -0.026 0.047 0.071
(3)Herf 0.014 0.004 1 -0.020 0.034 0.010 -0.026 -0.152** -0.066 0.027 0.021 -0.044 0.052 0.008 0.035 0.081
(4)R&D -0.127** -0.061 -0.092 1 0.017 -0.018 0.064 0.081 0.038 -0.109* 0.039 -0.185*** 0.008 -0.011 -0.098 -0.220***
(5)LnMgOwners -0.180*** 0.044 0.047 -0.009 1 0.018 -0.056 -0.063 -0.078 -0.073 0.038 0.051 0.019 -0.022 0.006 -0.048
(6)ROA -0.192*** 0.145** -0.048 0.056 0.124** 1 -0.554*** -0.164*** -0.061 -0.040 -0.017 -0.200*** 0.002 -0.202*** -0.433*** -0.288***
(7)Loss 0.105* -0.086 0.061 0.029 -0.076 -0.615*** 1 0.121** -0.011 -0.032 0.119* 0.145** -0.002 0.164*** 0.365*** 0.087
(8)M&A 0.167*** 0.053 -0.139** 0.008 -0.121** -0.179*** 0.121** 1 0.007 0.087 -0.089 0.221*** 0.096 0.039 0.091 0.144**
(9)Big4 0.018 0.012 -0.079 -0.035 0.011 0.022 -0.011 0.007 1 -0.023 0.009 -0.099 -0.009 0.023 -0.073 0.024
(10)LnAnalysts 0.057 -0.104* 0.059 -0.064 -0.202*** -0.083 -0.016 0.117 -0.016 1 -0.147** 0.377*** 0.216*** -0.178*** 0.035 0.516***
(11)EQ 0.083 0.140** 0.058 -0.073 0.082 -0.054 0.120 -0.129** -0.013 -0.128** 1 -0.014 -0.018 0.052 -0.066 -0.208***
(12)LengthAR 0.287*** 0.041 0.032 -0.155** -0.159*** -0.299*** 0.149** 0.269*** -0.098 0.397*** 0.012 1 0.216*** -0.078 0.216*** 0.569***
(13)ADR -0.042 -0.053 0.043 -0.075 -0.012 -0.053 -0.002 0.096 -0.009 0.232*** -0.061 0.203*** 1 -0.049 0.054 0.321***
(14)EqIssue -0.093 0.008 0.070 -0.032 0.120** 0.055 -0.018 -0.084 -0.101* -0.103* -0.078 -0.028 -0.038 1 0.204*** -0.023
(15)BTM 0.248*** -0.126** 0.123** -0.036 -0.059 -0.588*** 0.300*** 0.221*** -0.050 0.118* -0.092 0.292*** 0.041 0.045 1 0.348***
(16)LnTA 0.222*** -0.137** 0.105* -0.176*** -0.165*** -0.351*** 0.097 0.142** 0.031 0.554*** -0.210*** 0.542*** 0.287*** -0.038 0.455*** 1
This table presents Pearson (above diagonal) and Spearman correlation coefficients (below diagonal) for the variables used in the determinants analyses. See variable
definitions in appendix I.A. The sample contains 270 firm-observations and is described in table I.2. Statistical significance is based on two-sided t-tests and is indicated as
follows: *** p-value<0.01; ** p-value<0.05; * p-value<0.1.
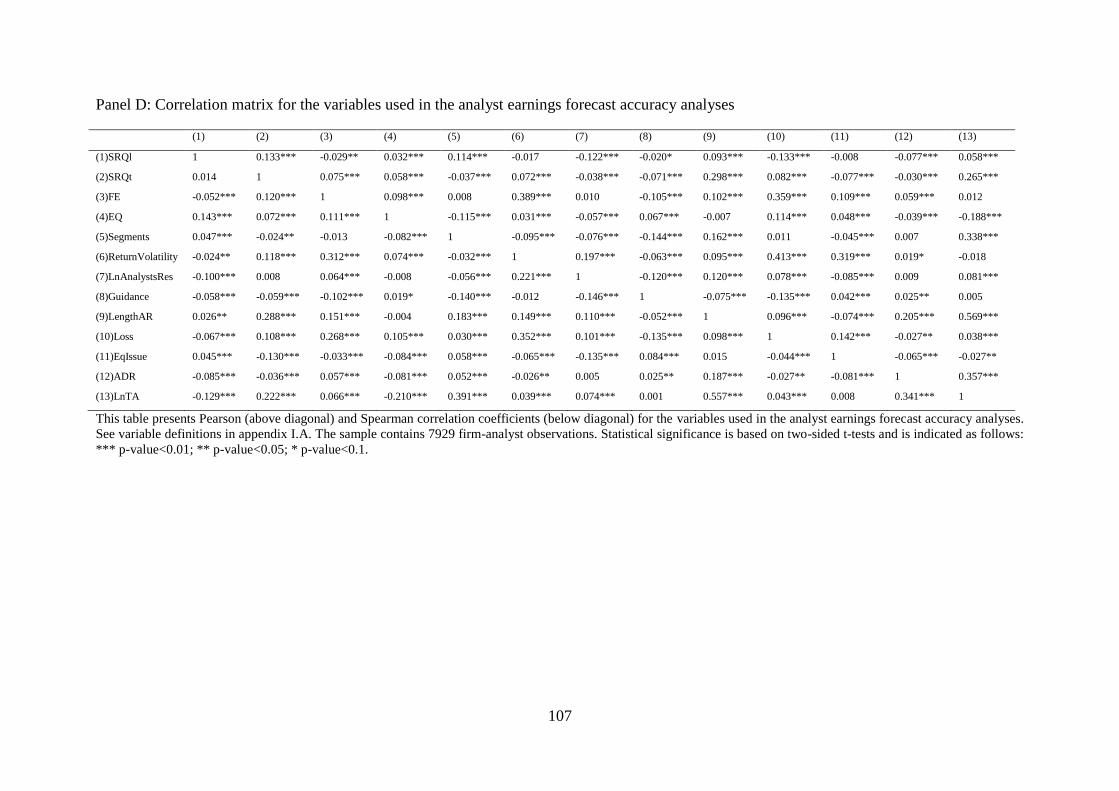
107
Panel D: Correlation matrix for the variables used in the analyst earnings forecast accuracy analyses
(1) (2) (3) (4) (5) (6) (7) (8) (9) (10) (11) (12) (13)
(1)SRQl 1 0.133*** -0.029** 0.032*** 0.114*** -0.017 -0.122*** -0.020* 0.093*** -0.133*** -0.008 -0.077*** 0.058***
(2)SRQt 0.014 1 0.075*** 0.058*** -0.037*** 0.072*** -0.038*** -0.071*** 0.298*** 0.082*** -0.077*** -0.030*** 0.265***
(3)FE -0.052*** 0.120*** 1 0.098*** 0.008 0.389*** 0.010 -0.105*** 0.102*** 0.359*** 0.109*** 0.059*** 0.012
(4)EQ 0.143*** 0.072*** 0.111*** 1 -0.115*** 0.031*** -0.057*** 0.067*** -0.007 0.114*** 0.048*** -0.039*** -0.188***
(5)Segments 0.047*** -0.024** -0.013 -0.082*** 1 -0.095*** -0.076*** -0.144*** 0.162*** 0.011 -0.045*** 0.007 0.338***
(6)ReturnVolatility -0.024** 0.118*** 0.312*** 0.074*** -0.032*** 1 0.197*** -0.063*** 0.095*** 0.413*** 0.319*** 0.019* -0.018
(7)LnAnalystsRes -0.100*** 0.008 0.064*** -0.008 -0.056*** 0.221*** 1 -0.120*** 0.120*** 0.078*** -0.085*** 0.009 0.081***
(8)Guidance -0.058*** -0.059*** -0.102*** 0.019* -0.140*** -0.012 -0.146*** 1 -0.075*** -0.135*** 0.042*** 0.025** 0.005
(9)LengthAR 0.026** 0.288*** 0.151*** -0.004 0.183*** 0.149*** 0.110*** -0.052*** 1 0.096*** -0.074*** 0.205*** 0.569***
(10)Loss -0.067*** 0.108*** 0.268*** 0.105*** 0.030*** 0.352*** 0.101*** -0.135*** 0.098*** 1 0.142*** -0.027** 0.038***
(11)EqIssue 0.045*** -0.130*** -0.033*** -0.084*** 0.058*** -0.065*** -0.135*** 0.084*** 0.015 -0.044*** 1 -0.065*** -0.027**
(12)ADR -0.085*** -0.036*** 0.057*** -0.081*** 0.052*** -0.026** 0.005 0.025** 0.187*** -0.027** -0.081*** 1 0.357***
(13)LnTA -0.129*** 0.222*** 0.066*** -0.210*** 0.391*** 0.039*** 0.074*** 0.001 0.557*** 0.043*** 0.008 0.341*** 1
This table presents Pearson (above diagonal) and Spearman correlation coefficients (below diagonal) for the variables used in the analyst earnings forecast accuracy analyses.
See variable definitions in appendix I.A. The sample contains 7929 firm-analyst observations. Statistical significance is based on two-sided t-tests and is indicated as follows:
*** p-value<0.01; ** p-value<0.05; * p-value<0.1.
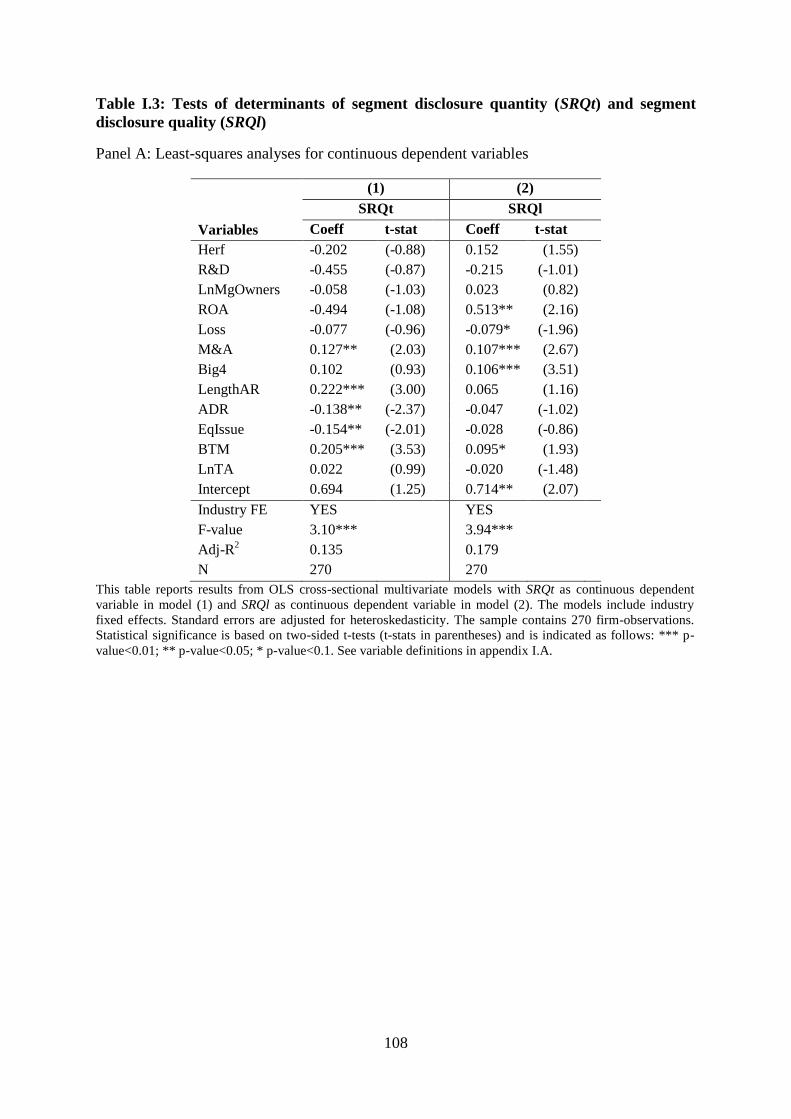
108
Table I.3: Tests of determinants of segment disclosure quantity (SRQt) and segment
disclosure quality (SRQl)
Panel A: Least-squares analyses for continuous dependent variables
Variables
(1) (2)
SRQt SRQl
Coeff t-stat Coeff t-stat
Herf -0.202 (-0.88) 0.152 (1.55)
R&D -0.455 (-0.87) -0.215 (-1.01)
LnMgOwners -0.058 (-1.03) 0.023 (0.82)
ROA -0.494 (-1.08) 0.513** (2.16)
Loss -0.077 (-0.96) -0.079* (-1.96)
M&A 0.127** (2.03) 0.107*** (2.67)
Big4 0.102 (0.93) 0.106*** (3.51)
LengthAR 0.222*** (3.00) 0.065 (1.16)
ADR -0.138** (-2.37) -0.047 (-1.02)
EqIssue -0.154** (-2.01) -0.028 (-0.86)
BTM 0.205*** (3.53) 0.095* (1.93)
LnTA 0.022 (0.99) -0.020 (-1.48)
Intercept 0.694 (1.25) 0.714** (2.07)
Industry FE YES YES
F-value 3.10*** 3.94***
Adj-R2 0.135 0.179
N 270 270
This table reports results from OLS cross-sectional multivariate models with SRQt as continuous dependent
variable in model (1) and SRQl as continuous dependent variable in model (2). The models include industry
fixed effects. Standard errors are adjusted for heteroskedasticity. The sample contains 270 firm-observations.
Statistical significance is based on two-sided t-tests (t-stats in parentheses) and is indicated as follows: *** p-
value<0.01; ** p-value<0.05; * p-value<0.1. See variable definitions in appendix I.A.
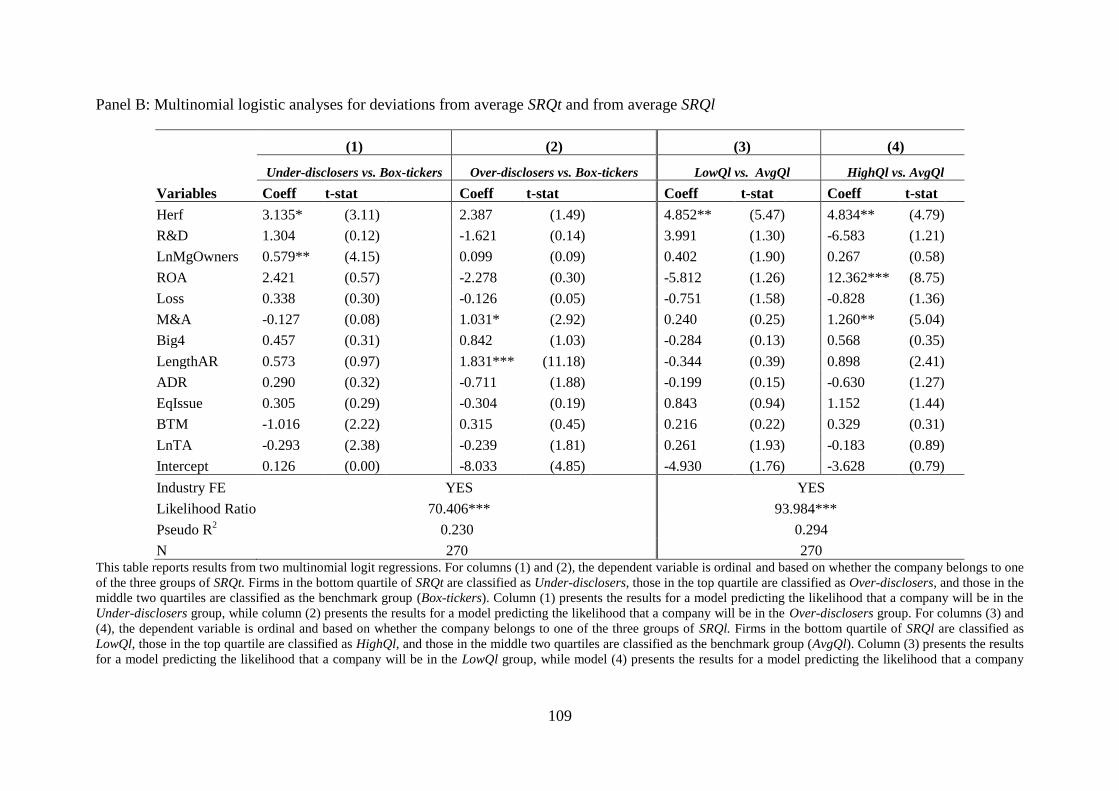
109
Panel B: Multinomial logistic analyses for deviations from average SRQt and from average SRQl
Variables
(1) (2) (3) (4)
Under-disclosers vs. Box-tickers Over-disclosers vs. Box-tickers LowQl vs. AvgQl HighQl vs. AvgQl
Coeff t-stat Coeff t-stat Coeff t-stat Coeff t-stat
Herf 3.135* (3.11) 2.387 (1.49) 4.852** (5.47) 4.834** (4.79)
R&D 1.304 (0.12) -1.621 (0.14) 3.991 (1.30) -6.583 (1.21)
LnMgOwners 0.579** (4.15) 0.099 (0.09) 0.402 (1.90) 0.267 (0.58)
ROA 2.421 (0.57) -2.278 (0.30) -5.812 (1.26) 12.362*** (8.75)
Loss 0.338 (0.30) -0.126 (0.05) -0.751 (1.58) -0.828 (1.36)
M&A -0.127 (0.08) 1.031* (2.92) 0.240 (0.25) 1.260** (5.04)
Big4 0.457 (0.31) 0.842 (1.03) -0.284 (0.13) 0.568 (0.35)
LengthAR 0.573 (0.97) 1.831*** (11.18) -0.344 (0.39) 0.898 (2.41)
ADR 0.290 (0.32) -0.711 (1.88) -0.199 (0.15) -0.630 (1.27)
EqIssue 0.305 (0.29) -0.304 (0.19) 0.843 (0.94) 1.152 (1.44)
BTM -1.016 (2.22) 0.315 (0.45) 0.216 (0.22) 0.329 (0.31)
LnTA -0.293 (2.38) -0.239 (1.81) 0.261 (1.93) -0.183 (0.89)
Intercept 0.126 (0.00) -8.033 (4.85) -4.930 (1.76) -3.628 (0.79)
Industry FE YES YES
Likelihood Ratio 70.406*** 93.984***
Pseudo R2 0.230 0.294
N 270 270 This table reports results from two multinomial logit regressions. For columns (1) and (2), the dependent variable is ordinal and based on whether the company belongs to one
of the three groups of SRQt. Firms in the bottom quartile of SRQt are classified as Under-disclosers, those in the top quartile are classified as Over-disclosers, and those in the
middle two quartiles are classified as the benchmark group (Box-tickers). Column (1) presents the results for a model predicting the likelihood that a company will be in the
Under-disclosers group, while column (2) presents the results for a model predicting the likelihood that a company will be in the Over-disclosers group. For columns (3) and
(4), the dependent variable is ordinal and based on whether the company belongs to one of the three groups of SRQl. Firms in the bottom quartile of SRQl are classified as
LowQl, those in the top quartile are classified as HighQl, and those in the middle two quartiles are classified as the benchmark group (AvgQl). Column (3) presents the results
for a model predicting the likelihood that a company will be in the LowQl group, while model (4) presents the results for a model predicting the likelihood that a company
110
will be in the HighQl group. The models include industry fixed effects. The sample contains 270 firm-observations. Statistical significance is based on two-sided t-tests (t-
stats in parentheses) and is indicated as follows: *** p-value<0.01; ** p-value<0.05; * p-value<0.1. See variable definitions in appendix I.A.
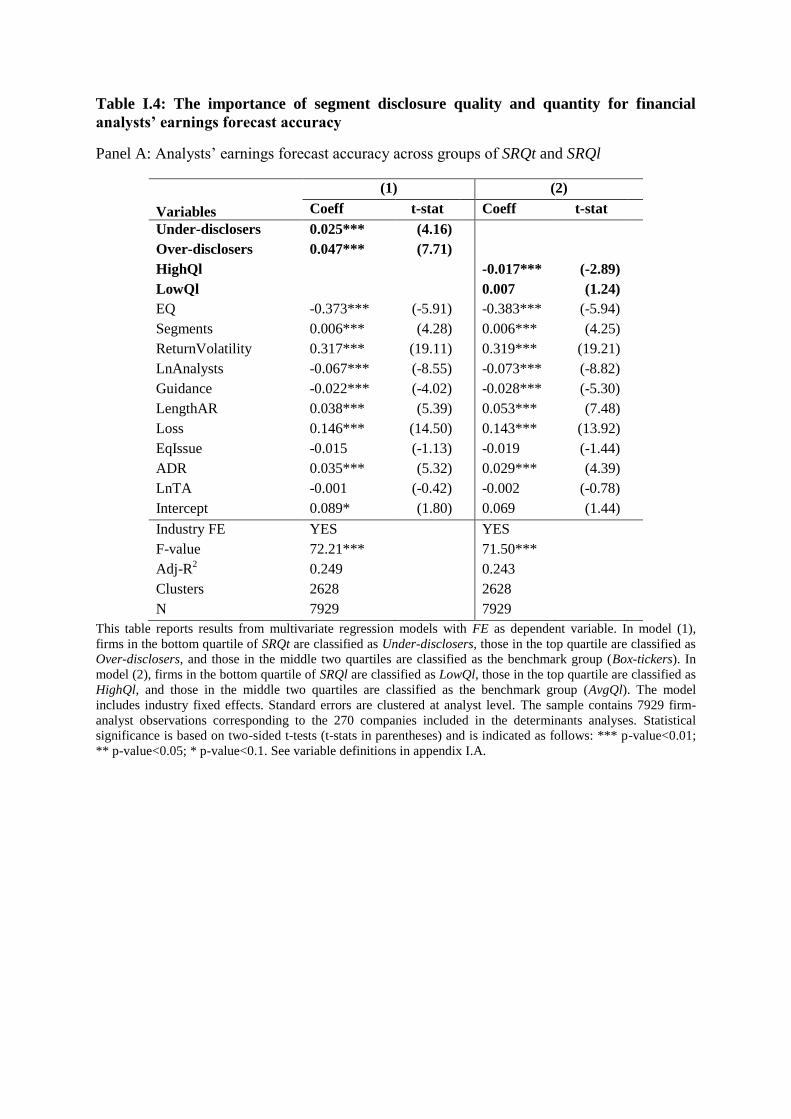
Table I.4: The importance of segment disclosure quality and quantity for financial
analysts’ earnings forecast accuracy
Panel A: Analysts’ earnings forecast accuracy across groups of SRQt and SRQl
Variables
(1) (2)
Coeff t-stat Coeff t-stat
Under-disclosers 0.025*** (4.16)
Over-disclosers 0.047*** (7.71)
HighQl -0.017*** (-2.89)
LowQl 0.007 (1.24)
EQ -0.373*** (-5.91) -0.383*** (-5.94)
Segments 0.006*** (4.28) 0.006*** (4.25)
ReturnVolatility 0.317*** (19.11) 0.319*** (19.21)
LnAnalysts -0.067*** (-8.55) -0.073*** (-8.82)
Guidance -0.022*** (-4.02) -0.028*** (-5.30)
LengthAR 0.038*** (5.39) 0.053*** (7.48)
Loss 0.146*** (14.50) 0.143*** (13.92)
EqIssue -0.015 (-1.13) -0.019 (-1.44)
ADR 0.035*** (5.32) 0.029*** (4.39)
LnTA -0.001 (-0.42) -0.002 (-0.78)
Intercept 0.089* (1.80) 0.069 (1.44)
Industry FE YES YES
F-value 72.21*** 71.50***
Adj-R2 0.249 0.243
Clusters 2628 2628
N 7929 7929
This table reports results from multivariate regression models with FE as dependent variable. In model (1),
firms in the bottom quartile of SRQt are classified as Under-disclosers, those in the top quartile are classified as
Over-disclosers, and those in the middle two quartiles are classified as the benchmark group (Box-tickers). In
model (2), firms in the bottom quartile of SRQl are classified as LowQl, those in the top quartile are classified as
HighQl, and those in the middle two quartiles are classified as the benchmark group (AvgQl). The model
includes industry fixed effects. Standard errors are clustered at analyst level. The sample contains 7929 firm-
analyst observations corresponding to the 270 companies included in the determinants analyses. Statistical
significance is based on two-sided t-tests (t-stats in parentheses) and is indicated as follows: *** p-value<0.01;
** p-value<0.05; * p-value<0.1. See variable definitions in appendix I.A.
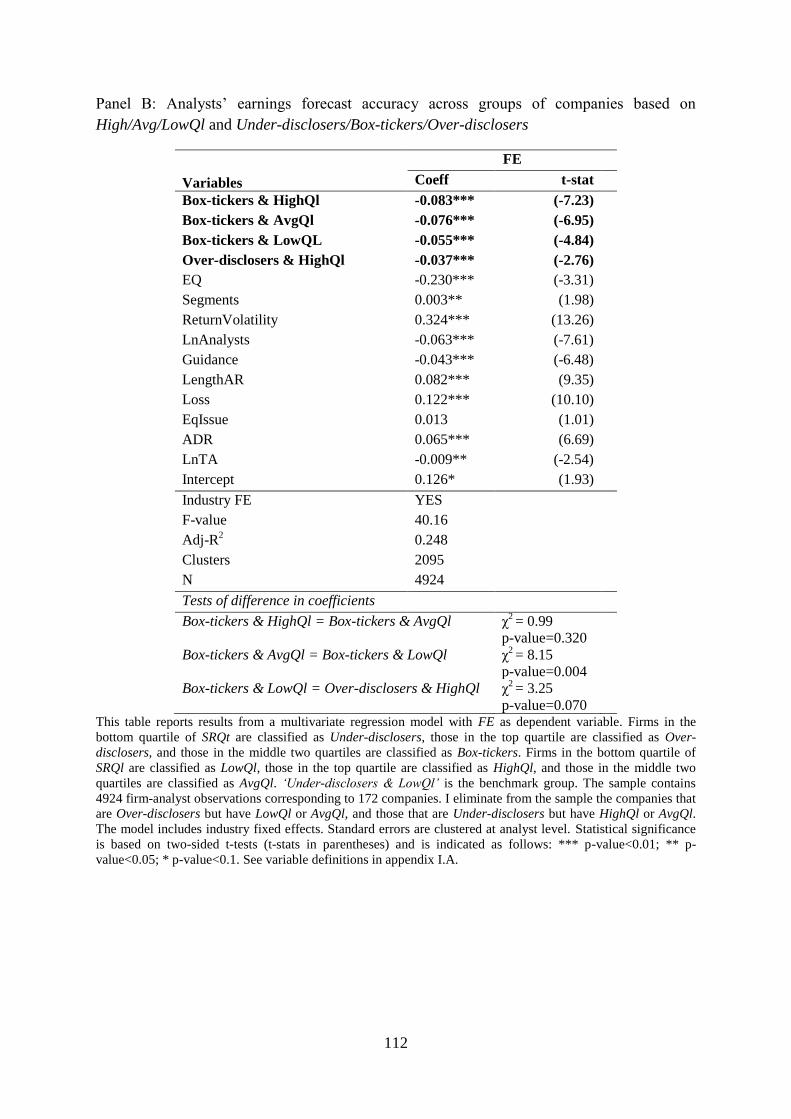
112
Panel B: Analysts’ earnings forecast accuracy across groups of companies based on
High/Avg/LowQl and Under-disclosers/Box-tickers/Over-disclosers
Variables
FE
Coeff t-stat
Box-tickers & HighQl -0.083*** (-7.23)
Box-tickers & AvgQl -0.076*** (-6.95)
Box-tickers & LowQL -0.055*** (-4.84)
Over-disclosers & HighQl -0.037*** (-2.76)
EQ -0.230*** (-3.31)
Segments 0.003** (1.98)
ReturnVolatility 0.324*** (13.26)
LnAnalysts -0.063*** (-7.61)
Guidance -0.043*** (-6.48)
LengthAR 0.082*** (9.35)
Loss 0.122*** (10.10)
EqIssue 0.013 (1.01)
ADR 0.065*** (6.69)
LnTA -0.009** (-2.54)
Intercept 0.126* (1.93)
Industry FE YES
F-value 40.16
Adj-R2 0.248
Clusters 2095
N 4924
Tests of difference in coefficients
Box-tickers & HighQl = Box-tickers & AvgQl χ2 = 0.99
p-value=0.320
Box-tickers & AvgQl = Box-tickers & LowQl χ2 = 8.15
p-value=0.004
Box-tickers & LowQl = Over-disclosers & HighQl χ2 = 3.25
p-value=0.070
This table reports results from a multivariate regression model with FE as dependent variable. Firms in the
bottom quartile of SRQt are classified as Under-disclosers, those in the top quartile are classified as Over-
disclosers, and those in the middle two quartiles are classified as Box-tickers. Firms in the bottom quartile of
SRQl are classified as LowQl, those in the top quartile are classified as HighQl, and those in the middle two
quartiles are classified as AvgQl. ‘Under-disclosers & LowQl’ is the benchmark group. The sample contains
4924 firm-analyst observations corresponding to 172 companies. I eliminate from the sample the companies that
are Over-disclosers but have LowQl or AvgQl, and those that are Under-disclosers but have HighQl or AvgQl.
The model includes industry fixed effects. Standard errors are clustered at analyst level. Statistical significance
is based on two-sided t-tests (t-stats in parentheses) and is indicated as follows: *** p-value<0.01; ** p-
value<0.05; * p-value<0.1. See variable definitions in appendix I.A.
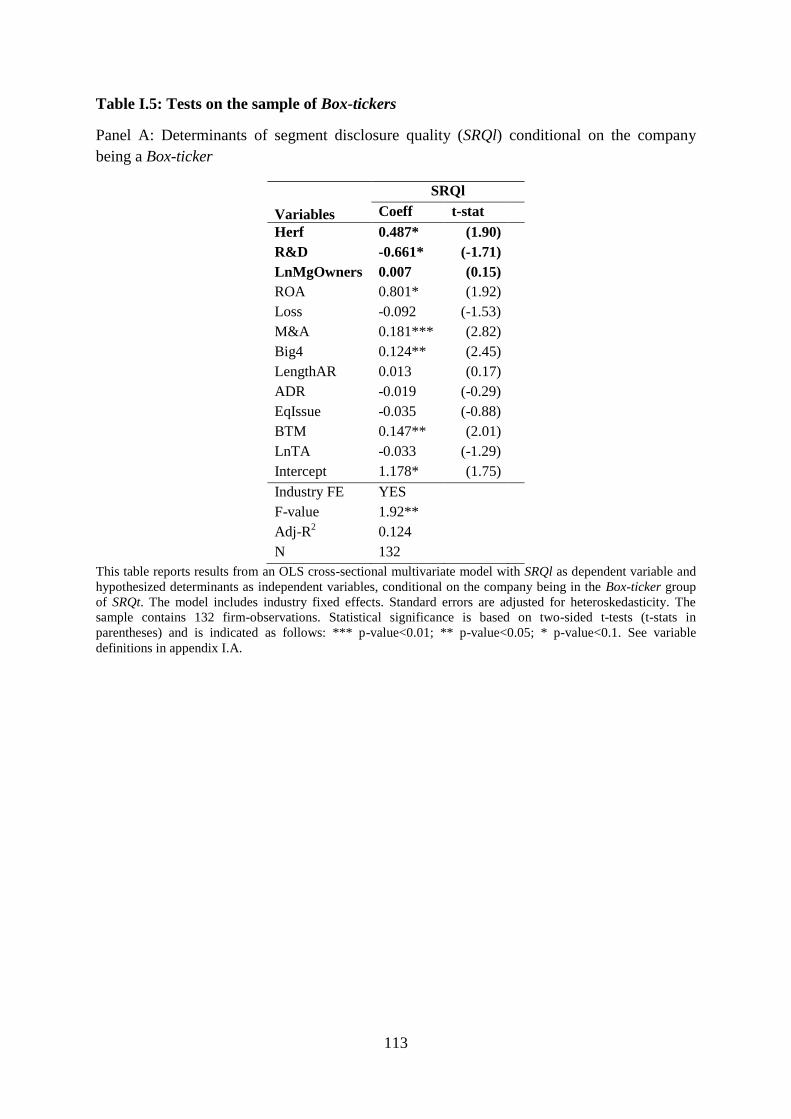
113
Table I.5: Tests on the sample of Box-tickers
Panel A: Determinants of segment disclosure quality (SRQl) conditional on the company
being a Box-ticker
Variables
SRQl
Coeff t-stat
Herf 0.487* (1.90)
R&D -0.661* (-1.71)
LnMgOwners 0.007 (0.15)
ROA 0.801* (1.92)
Loss -0.092 (-1.53)
M&A 0.181*** (2.82)
Big4 0.124** (2.45)
LengthAR 0.013 (0.17)
ADR -0.019 (-0.29)
EqIssue -0.035 (-0.88)
BTM 0.147** (2.01)
LnTA -0.033 (-1.29)
Intercept 1.178* (1.75)
Industry FE YES
F-value 1.92**
Adj-R2 0.124
N 132
This table reports results from an OLS cross-sectional multivariate model with SRQl as dependent variable and
hypothesized determinants as independent variables, conditional on the company being in the Box-ticker group
of SRQt. The model includes industry fixed effects. Standard errors are adjusted for heteroskedasticity. The
sample contains 132 firm-observations. Statistical significance is based on two-sided t-tests (t-stats in
parentheses) and is indicated as follows: *** p-value<0.01; ** p-value<0.05; * p-value<0.1. See variable
definitions in appendix I.A.
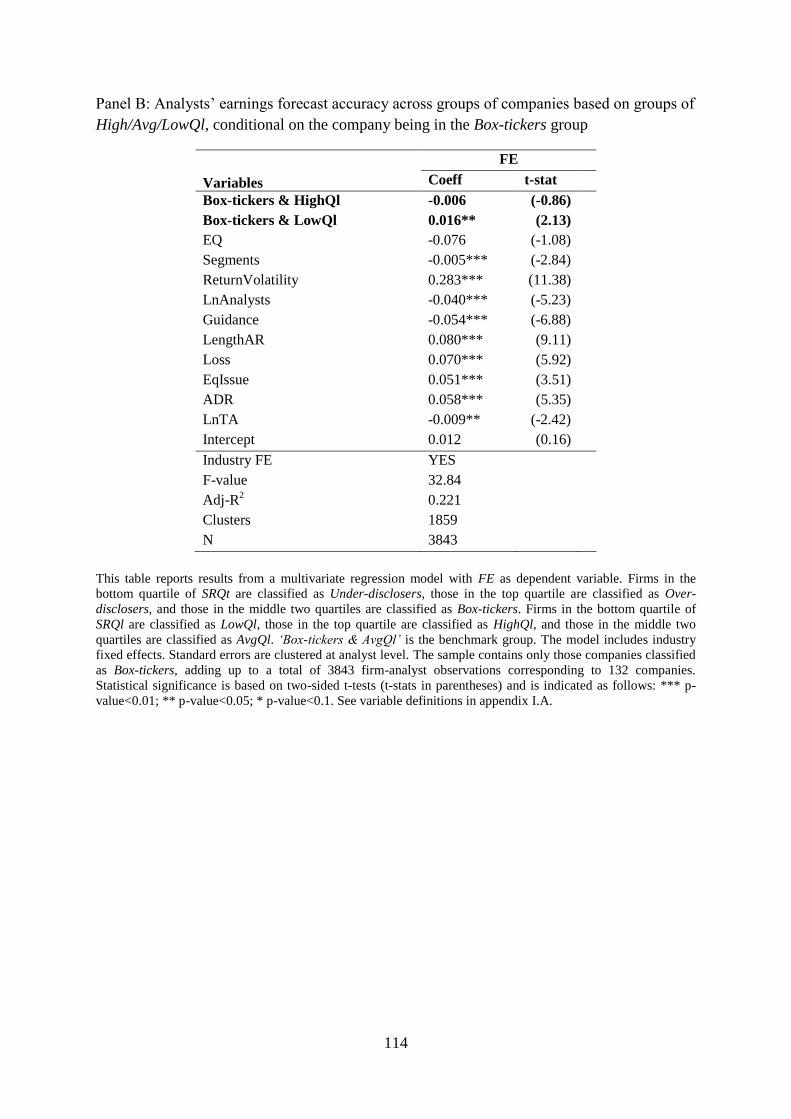
114
Panel B: Analysts’ earnings forecast accuracy across groups of companies based on groups of
High/Avg/LowQl, conditional on the company being in the Box-tickers group
Variables
FE
Coeff t-stat
Box-tickers & HighQl -0.006 (-0.86)
Box-tickers & LowQl 0.016** (2.13)
EQ -0.076 (-1.08)
Segments -0.005*** (-2.84)
ReturnVolatility 0.283*** (11.38)
LnAnalysts -0.040*** (-5.23)
Guidance -0.054*** (-6.88)
LengthAR 0.080*** (9.11)
Loss 0.070*** (5.92)
EqIssue 0.051*** (3.51)
ADR 0.058*** (5.35)
LnTA -0.009** (-2.42)
Intercept 0.012 (0.16)
Industry FE YES
F-value 32.84
Adj-R2 0.221
Clusters 1859
N 3843
This table reports results from a multivariate regression model with FE as dependent variable. Firms in the
bottom quartile of SRQt are classified as Under-disclosers, those in the top quartile are classified as Over-
disclosers, and those in the middle two quartiles are classified as Box-tickers. Firms in the bottom quartile of
SRQl are classified as LowQl, those in the top quartile are classified as HighQl, and those in the middle two
quartiles are classified as AvgQl. ‘Box-tickers & AvgQl’ is the benchmark group. The model includes industry
fixed effects. Standard errors are clustered at analyst level. The sample contains only those companies classified
as Box-tickers, adding up to a total of 3843 firm-analyst observations corresponding to 132 companies.
Statistical significance is based on two-sided t-tests (t-stats in parentheses) and is indicated as follows: *** p-
value<0.01; ** p-value<0.05; * p-value<0.1. See variable definitions in appendix I.A.
Chapter II
Inconsistent Segment Disclosure across Corporate Documents
Abstract
Market regulators in the U.S. and Europe investigate cases of inconsistent disclosures when a
company provides different information on the same topic in different documents. Focusing
on operating segments, this paper uses manually-collected data from four different corporate
documents of multi-segment firms to analyze the impact of inconsistent disclosure on
financial analysts’ earnings forecast accuracy. Inconsistencies that arise from further
disaggregation of operating segments in some documents seem to bring in new information
and increase analysts’ accuracy. However, when analysts must work with different, difficult-
to-reconcile segmentations, their information processing capacity and forecasts are less
accurate. These findings contribute to our understanding of the effects of managers’
disclosure strategy across multiple documents and have implications for regulators and
standard setters’ work on a disclosure framework.

116
Résumé
Les régulateurs de marché examinent des cas de présentations lorsqu'une entreprise fournit
des informations différentes sur le même sujet dans différents documents. En mettant l’accent
sur les secteurs opérationnels, cet essai utilise des données recueillies manuellement auprès
de quatre documents d’entreprise afin d'analyser l'impact de la publication d’information non-
conforme sur l’exactitude des prévisions de résultat des analystes financiers. La non-
conformité qui découle de la déségrégation supplémentaire des secteurs semble introduire de
nouveautés et contribue à l’exactitude des prévisions. La publication des segmentations
difficilement réconciliables entraine une exactitude réduite des prévisions. Ces résultats
contribuent à notre compréhension des effets de la politique de communication des dirigeants
à travers plusieurs documents et ont des répercussions sur le travail les régulateurs.
117
II.1 Introduction
A company discloses inconsistently if in different public documents it reports
different things on the same topic, i.e., if there is variation in what the company reports on the
same topic in different documents that refer to the same fiscal period. This paper uses hand-
collected data from four documents, (1) the notes to financial statements, (2) the management
discussion and analysis (MD&A), (3) the earnings announcement press release, and (4) the
conference call presentation slides to financial analysts, to investigate whether and to what
extent multi-segment firms disclose operating segments inconsistently across corporate
documents, i.e., there is variation in the operating segments disclosed across these
documents, and to examine the consequences of inconsistent disclosure for financial analysts’
earnings forecast accuracy.1
Investors and financial analysts emphasize that “principles of transparency,
consistency and completeness, along with the intention to communicate clearly, must form
the basis for disclosure elements wherever they are found” (CFA Institute, 2007, p. 40).
Standard setters have also taken note of this issue. One of the findings in a survey conducted
by the International Accounting Standards Board (IASB) as part of its preparation to revise
the Conceptual Framework and existing disclosure requirements reveals that “in terms of
poor communication, many respondents cited internal inconsistency [as one key problem].
For example, segment disclosures are not always consistent with information provided
elsewhere” (IASB, 2013b).
Regulators’ enforcement practices related to disclosure, in general, and the disclosure
of operating segments, in particular, also motivate an examination of the effects of disclosure
inconsistency. The management approach to segment reporting required under both SFAS
1 Throughout the essay, I use “operating segments” and “segments” interchangeably to refer to the operating
segments that companies report in the notes to financial statements and which reflect the internal organization of
the company, based on IFRS 8.
118
131 and IFRS 8 aligns external segment reporting with firms’ internal organization for
operating decision purposes (FASB, 1997; IASB, 2006a). This approach allows for
considerable discretion in the way managers report operating segments (ESMA, 2011), with
the improper aggregation of operating segments into reportable ones as the most problematic
aspect of the standards (IASB, 2013d). When evaluating compliance with these business
model-based standards (Leisenring et al., 2012), the Securities and Exchange Commission
(SEC) and the European Securities and Markets Authority (ESMA) look for inconsistent
disclosure of operating segments across a firm’s disclosure outlets as a first step before
requesting the firm’s internal documents (Pippin, 2009; Johnson, 2010; Dixon, 2011; ESMA,
2012). Regulators’ point of view is that inconsistent disclosures are opaque and make it hard
for users to understand the internal organization of the company.2 The focus of this paper is
to evaluate the effect, if any, of inconsistent disclosures on financial analysts as an important
category of users of accounting information.
In order to assess inconsistency, I hand-collect segment disclosures of 400 multi-
segment European firms during one year (i.e., a cross-section of firms) from (1) the notes to
financial statements, (2) the MD&A, (3) the earnings announcement press release, and (4) the
presentation to financial analysts during the fiscal year-end conference call. These are the
main documents containing financial information in a firm’s overall disclosure package
(Clarkson, Kao, & Richardson, 1999). I code a company as inconsistent discloser
(Inconsistent) if the operating segments disclosed in these documents are not the same, i.e.,
there is variation in the operating segments disclosed in these documents. When one
document is missing, I rely on the available documents to assess inconsistency.
2 The SEC and ESMA investigate inconsistencies across documents not just for segment reporting, but also for
loss contingencies and non-GAAP financial measures (Dixon, 2011; ESMA, 2011). “The Staff issue comments
on perceived inconsistencies between filed and non-filed communications to investors […] to ensure
consistency between formal (i.e., MD&A, financial statements) and informal presentations of the company’s
financial condition and results of operations” (Dixon, 2011). Non-filed communications can include anything
from production reports and marketing materials to the information disclosed on the corporate website (Cormier
& Magnan, 2004).
119
The incomplete revelation hypothesis (Bloomfield, 2002) is the theoretical framework
that guides my predictions related to the role of inconsistent disclosure for financial analysts.
Contrary to the efficient markets hypothesis, the incomplete revelation hypothesis
acknowledges the costs to extracting data from public documents and processing information
based on that data. This framework helps explain numerous empirical results on the effects of
disclosure characteristics and regulators and standard setters’ interest with regulation of
informationally equivalent disclosures and reports (Bloomfield, 2002). There are two
different views on the consequences that inconsistent disclosure could have on financial
analysts’ forecast accuracy. Analysts’ claims with respect to inconsistency being an
undesirable characteristic of disclosure (CFA Institute, 2013; Hoffmann & Fieseler, 2012)
suggests that inconsistent information coming from different sources makes it hard for
analysts to piece together the “puzzle” that the company is. Obtaining different information
on the same topic that should a priori be the same creates a sense of confusion. As a result,
inconsistency increases information processing costs, both in terms of time and effort
required, which suggests a positive relation between inconsistent disclosures and forecast
error. However, inconsistency could also mean that more information is available for
analysts. Variation in the operating segments disclosed in different documents could mean
that financial analysts receive more information on the organization of the company which
should help them more accurately forecast future earnings.
While the reasons for why managers disclose inconsistently is not the direct focus of
this paper, I acknowledge that inconsistent disclosure of operating segments could potentially
be the product of managers’ strategy to obfuscate the information on the company’s internal
organization, or, on the contrary, of their honest efforts to provide more information about the
internal organization of the company in some documents. My focus is rather on testing
120
whether inconsistent disclosure has adverse effects for the users of accounting information,
and should therefore be of concern to regulators and standard setters.
In order to test the two views on the effect of inconsistent disclosure, I identify
different types of inconsistency depending on the easiness with which the variation in the
disclosed operating segments can be reconciled. If the operating segments disclosed in some
documents are disaggregated compared to those in other documents, and presented in such a
way that makes it is clear that this is the case, and easy to understand how the operating
segments fit together, i.e., it is easy to piece back the operating segments disclosed across
documents in a coherent image of the internal organization of the firm then users should be
able to easily understand the organization of the firm while having more information about its
operating segments and the “sub-segments.” In other words, such variation in disclosure
brings more information for financial analysts that is easy to process and make sense of. I
code such firms as providing additional disclosure, i.e., further disaggregated operating
segments, in some documents (Inc_AddDisclosure). If further disaggregation in some of the
documents brings new information (Verrecchia, 2001), then financial analysts will make
more accurate forecasts.
If the operating segments disclosed in different documents cannot be easily put back
together to get an image of the internal organization of the firm because different documents
discuss different segmentations of the company without presenting any indication as to how
these could be reconciled and pieced back together, then this information is potentially hard
to process and creates confusion when an analyst tries to understand the image and results of
the company. I code such firms as providing inconsistent disclosure that arises from
presenting different segmentations across the set of documents considered
(Inc_DiffSegmentation). Although companies in both groups qualify as inconsistent
121
disclosers under the SEC and ESMA guidelines, grouping them in a more refined way allows
more careful tests based on the type of variation in disclosure.
I first investigate whether and to what extent firms make inconsistent disclosures
across corporate documents. I find that almost 39% of the sample companies disclose
segments inconsistently across the four documents. Out of the full sample, 11% are
inconsistent by providing further disaggregation of the operating segments reported in the
note, while 28% seem to disclose a different segmentation of the company operations or
operating segments that are not easily reconcilable with the ones reported in the note. I then
examine whether disclosure inconsistency has consequences for financial analysts’ earnings
forecast accuracy. I choose to examine the effect of inconsistency on analysts’ forecasts
because analysts are important and sophisticated users of financial information and they are
most likely to look at the range of disclosure outlets considered in this paper. Results show
that overall inconsistency is not significantly related to forecast errors. However, tests using
the refined grouping reveal that inconsistency arising from further disaggregation of
operating segments in some documents compared to others significantly decreases forecast
errors suggesting that such inconsistency brings more information that financial analysts can
use. Inconsistency arising from the disclosure of different segmentations is significantly and
positively related to forecast errors, which suggests that receiving difficult-to-reconcile,
potentially contradicting, information from various sources confuses analysts and impair their
ability to assess the prospects of the company as a whole and make accurate earnings
forecasts.3
Further tests also show that even inconsistency solely inside the annual report, i.e.,
between the operating segments disclosed in the note to financial statements and the MD&A,
affects analysts when it arises from disclosing different segmentations. When the operating
3 Making it harder for analysts to assess the prospects of the company as a whole is consistent with managers
trying to obfuscate the internal organization of the company and, therefore, decreasing the transparency of
communication with the investor community.
122
segments presented in the MD&A are different from those disclosed in the note to financial
statements, mean forecast error as well as forecast dispersion increase from before to after the
issuance of the annual report.
The set of four documents considered in this paper contains both mandatory and
voluntary disclosure. The segment information presented in the note to financial statements is
mandated under IFRS 8, while any segment information presented outside the financial
statements is voluntary. As mentioned above, the overarching principle in IFRS 8 requires the
disclosure of the internal organization of the company to external users of information.
Therefore, a priori there is no reason to expect variation in the operating segments that
management discusses in different documents since the internal organization does not change
from one day to the next. Moreover, given the importance of segment information for capital
market participants to understand the sources of consolidated earnings and the diversification
strategy of the management, it is likely that managers include segment information in the
voluntary disclosure they want to communicate to capital markets.4 Additional analyses also
suggest that, although not regulated, there is demand from analysts for companies to provide
segment information in documents such as the earnings announcement press release and the
presentation to analysts. Omitting this information significantly increases analysts’ forecast
errors. Therefore, since it is reasonable to expect segment information disclosure in these
outlets and given the management approach principle of IFRS 8, it makes sense to include
these documents in the set of documents I examine and to expect mandatory and voluntary
disclosure of operating segments to be the same, which warrants their comparison.
In light of the current debates on the development of a disclosure framework to go
together with the IASB and the Financial Accounting Standards Board’s (FASB) Conceptual
Frameworks (Barker et al., 2013; EFRAG, 2012), this paper contributes by providing
4 The fact that segment information was first voluntarily provided by U.S. companies in the 1960s before being
regulated by the SEC and then the FASB in the 1970s also backs up this point.

123
evidence on the validity of arguments made by regulators and analysts with respect to
inconsistent disclosures across corporate documents. More specifically, the results suggest
that when managers provide additional information to capital market participants by further
disaggregating the operating segments in some documents, analysts get more information that
is easy to process and which allows them to more accurately forecast the earnings of the
company. However, inconsistency that reveals different segmentations across documents
confuses analysts and impairs their ability to accurately forecast earnings.
Besides its practical implications, this paper contributes to the accounting and
financial disclosure literature. The paper investigates one disclosure characteristic that
practitioners, standard setters, and regulators are interested in, but which has not been
systematically examined so far. This paper complements existing evidence on the effects of
inconsistency on corporate reputation (e.g., Hutton, Goodman, Alexander, & Genest, 2001)
by testing the consequences of inconsistency for the tasks performed by a specific category of
users – financial analysts.
By considering disclosures made in an array of documents, this paper takes a step
forward towards improving our understanding of managers’ overall disclosure strategy and
the effects that this strategy has. Besides the financial statements, managers use multiple
other outlets to communicate financial information to capital market participants. I provide
evidence on the role that a characteristic of financial information disclosed across multiple
documents has and how users assess it, which enhances our understanding of the role of
accounting disclosures and the characteristics that make accounting disclosure useful.
The next section provides background information on segment reporting requirements
under IFRS and U.S. GAAP and reviews the booming accounting disclosure characteristics
literature. Section 3 develops the hypotheses. Section 4 describes the sample, research design,
124
and variable measurement. Section 5 discusses the main empirical results and additional
analyses, while section 6 provides a discussion of the robustness tests. Section 7 concludes.
II.2 Institutional background and literature review
Financial analysts and the investor community have expressed their dissatisfaction
with segment reporting over and over again, on both sides of the Atlantic. In 1997, the FASB
replaced SFAS 14 with SFAS 131 following pressures from U.S. financial analysts
(Herrmann & Thomas 2000). Internationally, the IASB has converged segment reporting
under IFRS with segment reporting under U.S. GAAP by issuing IFRS 8 in 2006 (IASB,
2006a). Both SFAS 131 and IFRS 8 require the management approach to segment reporting
which aligns external segment reporting with firms’ internal organization for operating
decision purposes. Operating segments are defined as components of an enterprise (1) that
engage in business activities earning revenues and incurring expenses, (2) that are regularly
reviewed by management, and (3) for which discrete financial information is available. The
basis of segmentation could be products and services, geographic area, legal entity, customer
type, or another basis as long as it is consistent with the internal structure of the firm.
Although supposed to provide more decision-useful information, problems in the way these
standards are applied continue to generate criticism from investors (ESMA, 2011).
One of the main concerns is the aggregation of operating segments into reportable
segments: “ESMA observed that disclosures on aggregation of segments were explicitly
mentioned by 29% of issuers only, although IFRS 8.22(a) refers to this piece of information
as an example that contributes to helping investors understand the entity’s basis of
organization. The level of subjectivity in deciding how aggregation should be applied may
lead to diversity in practice” (ESMA 2011). Moreover, investors and analysts’ views reflect
125
these problems in implementation of segment reporting standards: “the investor community is
generally of the view that the information provided [under IFRS 8] does not provide
meaningful information as it is not reported at a sufficiently low level of granularity” (ESMA
2011).
In this paper, I focus on a set of disclosure outlets and integrate the disclosure made
across the documents considered.5 Recent literature has examined accounting and financial
information disclosure in various outlets from many perspectives. For example, Lang &
Lundholm (2000) examine disclosure frequency as it relates to equity issuance; Doyle &
Magilke (2009) investigate the strategic versus broad dissemination reasons behind earnings
announcement timing; Tang (2014) looks at management guidance consistency over time. A
closely related stream of literature examines the language used in annual reports and public
corporate documents for characteristics such as readability (e.g., Li 2008; 2010) and tone –
(e.g., Davis & Tama-Sweet 2012). Most often, however, disclosure outlets are examined in
isolation from each other. There are a few notable exceptions. Li (2013) examines repetitive
disclosures between the MD&A and the notes. Myers, Scholz & Sharp (2013) examine the
choice of outlet for restatements.
Although regulators have long mentioned inconsistent disclosures as one of the
signals they pick up in their review process, this particular characteristic of disclosure has
received only limited attention in the accounting literature in a survey-based setting. Street,
Nichols & Gray (2000) and Nichols, Street & Cereola (2012) compare the segment note to
the MD&A and provide survey evidence that suggests improved consistency between the two
parts of the annual report upon adoption of SFAS 131 and IFRS 8, respectively.
5 Davis & Tama-Sweet (2012) and Mayew (2012) define a disclosure outlet as “any medium of expression or
publication through which a firm describes its economic condition.” There are many disclosure outlets firms use
- press releases, presentations to analysts and investors, annual reports, marketing materials, corporate website,
social media.
126
II.3 Hypotheses development
Inconsistency across documents means that there is variation in disclosure on the
same topic in different documents issued by the same firm and referring to the same fiscal
period. Inconsistency as a characteristic of disclosures made by management has been studied
previously from a time-series perspective. Tang (2014) examines the regularity, i.e.,
consistency, with which managers provide guidance across years. Differently, my paper
investigates the irregularity, or variation, in information disclosed cross-sectionally, i.e.,
across documents issued by the same company during one fiscal period. I choose to examine
operating segment disclosures since I must necessarily restrict the focus of my investigation
to one topic and since this is primarily a disclosure issue for companies, rather than a
recognition or measurement one (Nichols et al., 2012). Segment information is also important
to capital market participants since it allows investors and financial analysts to understand the
sources of consolidated earnings and the diversification strategy of the management.
Moreover, given the management approach principle that regulates the disclosure of segment
information in the financial statements and aligns external reporting with the internal
organization of the firm, there is no a priori reason to expect variation in the operating
segments disclosed across different documents that refer to the same fiscal period. In other
words, operating segment disclosure should a priori be consistent across the set of documents
considered.
Prior research suggests that receiving consistent information from various sources is
important for investors. Li (2013) finds that repetitive, and thus consistent, disclosures in the
financial statement notes and the MD&A are informative to investors. Her findings are
explained by communication theories which suggest that using repetitive communication
increases the credibility of the information transferred (e.g., Stephan, Stephan, & Gudykunst,
127
1999). Therefore, in light of the evidence and discussion in Li (2013) and based on the
alignment between externally-reported operating segments and internal organization, I
assume that consistency is the benchmark disclosure behavior.
There is ample evidence on the importance of segment reporting for analysts and
investors’ decision-making. Segment earnings have predictive power for future consolidated
earnings (Collins, 1976; Kinney Jr., 1971) and segment revenue is useful for investors’
evaluation of firms’ growth prospects incremental to consolidated data (Tse, 1989). Post-
SFAS 131 segment reporting has more predictive ability for consolidated earnings (Behn et
al., 2002), has improved geographic segment disclosure that reduced the mispricing of
foreign earnings (Hope et al., 2008a), and for companies that no longer disclose geographic
segment earnings after SFAS 131 analysts’ forecasting abilities are not impaired (Hope et al.,
2006). Reporting more segments under SFAS 131 improves forecast consensus
(Venkataraman, 2001; Berger & Hann, 2003), but reliance on publicly available segment
information may in fact increase the uncertainty in analysts’ forecasts (Botosan & Stanford,
2005).
Financial analysts are important and sophisticated users of financial information
(Bradshaw, 2009, 2011). I choose them as subjects for testing the consequences of
inconsistent disclosures for two main reasons. First, they are the users of accounting and
financial information most likely to look at and pay attention to many, if not all, of the
disclosure outlets that companies use, including the whole range of documents considered in
this paper. Even more so since, for example, the presentation during the earnings
announcement conference call is specifically designed for direct interaction between top
management and analysts (Hollander et al., 2010). For each company covered, the analyst has
access to numerous sources of information, including security prices, firm-specific financial
and operating information, industry data, and macroeconomic factors (Bradshaw, 2011).
128
Firm-specific information also comes from various sources – public regulated or unregulated
documents issued by the company, the business community and press, information disclosed
by competitors, or private interactions with the management (Soltes, 2014). The analyst’s job
is to analyze (Bradshaw, 2011) all that information, to put together the “puzzle” that a
company is, and write a report detailing his conclusions. In the case of multi-segment firms,
the “puzzle” is complicated by non-homogenous operations, e.g., across several industries
and/or geographical regions, the performance, risks, and synergies of which the analyst must
understand and assess before drawing conclusions. From this perspective, variation in the
operating segments disclosed in different documents, i.e., sources of information, creates
difficulties for analysts when they piece together the image of the company, requiring more
effort and increased processing costs. In turn, these difficulties translate into lower
forecasting accuracy.
Segment reporting under the management approach does little to confine the way in
which operating segments can be reported. The standard contains quantitative threshold rules
for reporting an operating segment (IASB, 2006a), and the interpretive guidelines mention an
upper limit of ten reportable operating segments (IASB, 2006b). However, the standard
explicitly allows management to disregard such guidelines in the interest of providing
information that is useful to investors. Given this emphasis, regulators and users expect
operating segments disclosed in the notes to financial statements to reflect the internal
organization of the company and to be the same as segments disclosed elsewhere. For this
reason, as part of their review process, the SEC and ESMA go through a range of disclosure
outlets and issue comment letters when there is a mismatch or inconsistency between the
operating segments reported in the notes and the information provided through other
channels, along with requiring the internal reports of the firm (Dixon, 2011; ESMA, 2011;
Johnson, 2010; Pippin, 2009).
129
Two theories provide competing arguments for whether inconsistent disclosure has an
effect on financial analysts. The characteristics of disclosure are irrelevant under the efficient
markets hypothesis. Under this hypothesis, the ways in which information is presented, its
features, or location are irrelevant because there are no costs for users to obtain the data and
extract relevant information. The incomplete revelation hypothesis (Bloomfield, 2002),
however, takes into consideration that there are costs to obtaining data and processing
information and, as a result, the statistics (i.e., useful facts) that are more costly to extract
from public data are less likely to be revealed by market prices. According to this hypothesis,
the costs to extracting and processing data comprise costs necessary to identify and collect
relevant data, and costs generated by increased cognitive difficulty to extract information
from collected data. The main result that flows from the incomplete revelation hypothesis is
that disclosure characteristics or features indeed matter for the users of financial information
because the way in which information is disclosed could make it easier or harder to collect,
process, and interpret data.
Empirical research in experimental and archival settings finds supporting evidence.
For example, using the readability measures introduced to the accounting literature in Li
(2008), Lehavy, Li, & Merkley (2011) find that lower readability scores for the annual report
are significantly associated with lower analyst earnings forecast accuracy. Maines &
McDaniel (2000) use students to proxy for nonprofessional investors and find that disclosure
presentation format matters for their investment decisions. Still in an experimental setting,
Bloomfield, Hodge, Hopkins, & Rennekamp (2015) find that the decision-making of credit
analysts, which are conceivably at least as sophisticated as equity analysts, is influenced by
the disaggregation and location of disclosure in the financial statements.
Based on the incomplete revelation hypothesis, I predict that disclosure inconsistency
has an effect on financial analysts’ forecast accuracy.
130
H1a. Inconsistent segment disclosure across documents affects the magnitude of
analysts’ forecast error.
The direction in which inconsistent disclosure affects financial analysts’ accuracy,
i.e., how inconsistency affects analysts’ accuracy, could depend, however, on the “source” of
inconsistency in disclosure. On the one hand, inconsistency could arise because some of the
operating segments are further disaggregated in some documents. In other words, there is
variation in the operating segments disclosed across the set of documents that the company
publishes, but the way in which the disclosure is made makes it clear how the operating
segments disclosed in each document fit in with the operating segments disclosed in the other
documents. As a result, although there is variation in the operating segments disclosed in the
set of documents, constructing the image of the company from these sources of information is
easy or comes at no additional costs. If the inconsistent disclosure of operating segments
arises from a further disaggregation of the segments in some documents presented such that it
is clear how the sets of disclosed operating segments map into each other, then this is more
information, easy to process or at no significant additional cost which helps analysts forecast
the earnings for that company and decreases their forecast error. If the disaggregated
operating segments in some of the documents add to analysts’ information set and the
operating segments across the documents are easy to piece back together to understand the
“puzzle” of the company, then this type of inconsistent disclosure brings additional
information that is easy to process and interpret, and therefore, I predict to lower analysts’
earnings forecast errors.
H1b. Inconsistent segment disclosure across documents that provides further
disaggregation of operating segments is negatively associated with the magnitude of
analysts’ forecast error.

131
On the other hand, variation in the operating segments disclosed across documents
could arise because the management discloses different sets of operating segments in
different documents such that it is not clear how they fit together and map into each other. I
expect such variation to increase processing and interpretation costs on the part of the analyst,
and increase their forecast error because the different segmentations disclosed make it harder
for the analyst to understand the internal organization of the company. Although the different
segmentation could be more information, I hypothesize that the net effect is dominated by
increased processing costs generated by more effort and time necessary to piece the
information together to arrive at the image of the company’s internal organization.
H1c. Inconsistent segment disclosure across documents that suggests a different
segmentation is positively associated with the magnitude of analysts’ forecast error.
II.4 Sample and research design
II.4.1 Sample and main variable measurement
This paper uses manually-collected data to assess inconsistencies in disclosures made
in four corporate documents: (1) the notes to financial statements, (2) the MD&A, (3) the
earnings announcement press release, and (4) the presentation to analysts during the earnings
announcement conference call. I start from all the firms included in STOXX 600 Europe at
31 December 2009. Since 2009 is the first year of mandatory adoption of the new IFRS 8 for
European companies there might be more inconsistent disclosure related to this year, which
132
makes testing my research questions using 2009 cross-sectional data all the more
meaningful.6
I eliminate 143 financial institutions, 10 firms that follow U.S. GAAP, 28 single-
segment firms, 14 firms that were acquired after 2010 and for which corporate documents are
no longer available, 2 companies counted twice in the market index, and 3 companies that do
not disclose segments except in the segment note.7 The final sample contains a cross-section
of 400 multi-segment European companies. Table II.1 details the sample construction (panel
A) and composition by country and industry (panels B and C). As expected, firms from the
UK and France together make up 45% of the sample. Based on their primary ICB code,
27.5% of the sample firms are industrials, followed by consumer services (15.25%) and
consumer goods (15%).
I retrieve the annual reports, fiscal year-end earnings announcement press releases and
presentations to financial analysts during earnings announcement conference call from each
company’s investor relations website. Where the press release and/or presentation are not
available on the website, I contact the investor relations department disclosing the purpose of
this research and asking for the missing document(s).8 Panel D in table II.1 provides details
on the distribution of the sample by available documents. For five firms (1.25%) and 28 firms
(7%) the earnings announcement press release and the presentation to analysts, respectively,
are missing. The set of documents is complete for 369 of the 400 sample firms (92.25%).
6 In the US, SFAS 131 was adopted in 1997 making it much harder to get access to corporate documents from
that point in time and would involve using stale data. 7 Out of the 28 companies that disclose as single-segment in the note to financial statement, three present
disaggregations of their organization in at least one of the other documents that would qualify as operating
segments. Coding the three companies with 1 for Inconsistent and Inc_DiffSegmentation and the other 25 with 0
and adding them back to the sample leaves the results qualitatively unchanged. I do not tabulate this analysis
since I prefer to show the results in a more homogenous, and therefore more stringent, setting in which all
companies self-report as being diversified. 8 I contacted the investor relations department either via e-mail or via the inquiry forms on their websites during
October-November 2013. The rate of response is around 50%, with around 70% of the times actually receiving
the missing document. The two most common reasons for not providing a document are either that the company
does not keep a history of the documents older than a few years or that the company did not issue that document
at all.
133
In order to code the main variables, I first go to the segment note in the financial
statements and collect the number and names of the reported operating segments.9 Next, I go
through each of the other three documents to identify and collect the number and names of
the operating segments disclosed there. I perform this step in the following way: (1) I look for
the operating segments that are reported in the note, (2) I focus mainly on tables and graphs
to avoid any subjective interpretation of management’s narrative to the extent possible, and
(3) I only count an operating segment as mentioned in a document if it is accompanied by an
accounting number such as sales, operating profit, EBIT, capex etc. Considering that
management tends to disclose many operating details – especially in the MD&A –, this last
condition is meant to provide assurance that what I pick up from these documents are parts of
the company that would indeed qualify as operating segments.10,11
The Inconsistent variable is an indicator taking the value 1 if the operating segments
are disclosed inconsistently across the four documents and 0 otherwise. In other words,
Inconsistent is 1 if there is variation in the operating segments disclosed in the four
documents, and 0 if exactly the same operating segments are disclosed across the four
documents.12
Variation could, however, arise either because managers disclose different
segmentations in such a way that makes it difficult, if not impossible, to reconcile the
operating segments disclosed in different documents, or because they disaggregate the
operating segments in some documents compared to the others but do so in a way that makes
9 Using the “old” vocabulary in IAR 14R, this is the “primary” segmentation that companies disclose. At this
point, I also collect the “secondary” segmentation, if disclosed, and the entity-wide information provided based
on IFRS 8 requirements in the note. 10
Based on both IFRS 8 and SFAS 131, the main criteria for a part of the company to be recognized as an
operating segment is whether the chief operating decision maker regularly reviews accounting numbers of that
unit for resource allocation and performance evaluation purposes (FASB, 1997; IASB, 2006a). 11
My coding methodology is very similar to the one used by Street et al. (2000) and Nichols et al. (2012). 12
I also check whether the segments picked up from the MD&A, press release, and presentation and which are
different from the reported operating segments are not in fact disclosed as “secondary” operating segments (in
the lingering spirit of IAS 14R) or as entity-wide information in the segment reporting note. If this were the
case, then the information disclosed outside the note would in fact be consistent with the information in the
segment reporting note. However, this does not seem to be the case for any of the companies disclosing
inconsistently.
134
it clear how the segments can be reconciled. In the first case, presenting difficult-to-reconcile
segmentations in different documents increases the difficulty of putting the segments
“puzzle” back together to arrive at a coherent image of the company. In the second case,
however, the puzzle is easy to piece together and even though there is variation in the
operating segments disclosed, reconciling the operating segments is clear and easy.
Therefore, I refine the group of inconsistent disclosers based on whether inconsistency comes
from disclosing a different segmentation of the company (Inc_DiffSegmentation) or from
further disaggregation of operating segments (Inc_AddDisclosure). These two variables are
also binary. If a document is missing or does not mention any operating segments, I code
these variables based on the other existing documents. Appendix II.A provides two detailed
examples of the coding procedure. A research assistant coded this information a second time
following the instructions provided in advance. The agreement between the two sets of
variables coded is 96%. All cases of mismatch were re-coded a third time.
For the additional tests that I conduct, I code two more sets of indicator variables. The
first set of variables refers to whether segment information is missing from the press release
(MissingSegPressRelease), from the presentation to analysts (MissingSegPresentation), or
from both these documents (MissingSegBoth). The second set of variables captures the
variation in operating segments disclosed across the note to financial statements and the
MD&A, split based on whether this variation suggests a different segmentation
(Note_MDA_DiffSegmentation) or further disaggregation (Note_MDA_AddDisclosure).13
13
If segment information is missing in the MD&A, these variables are set to missing.
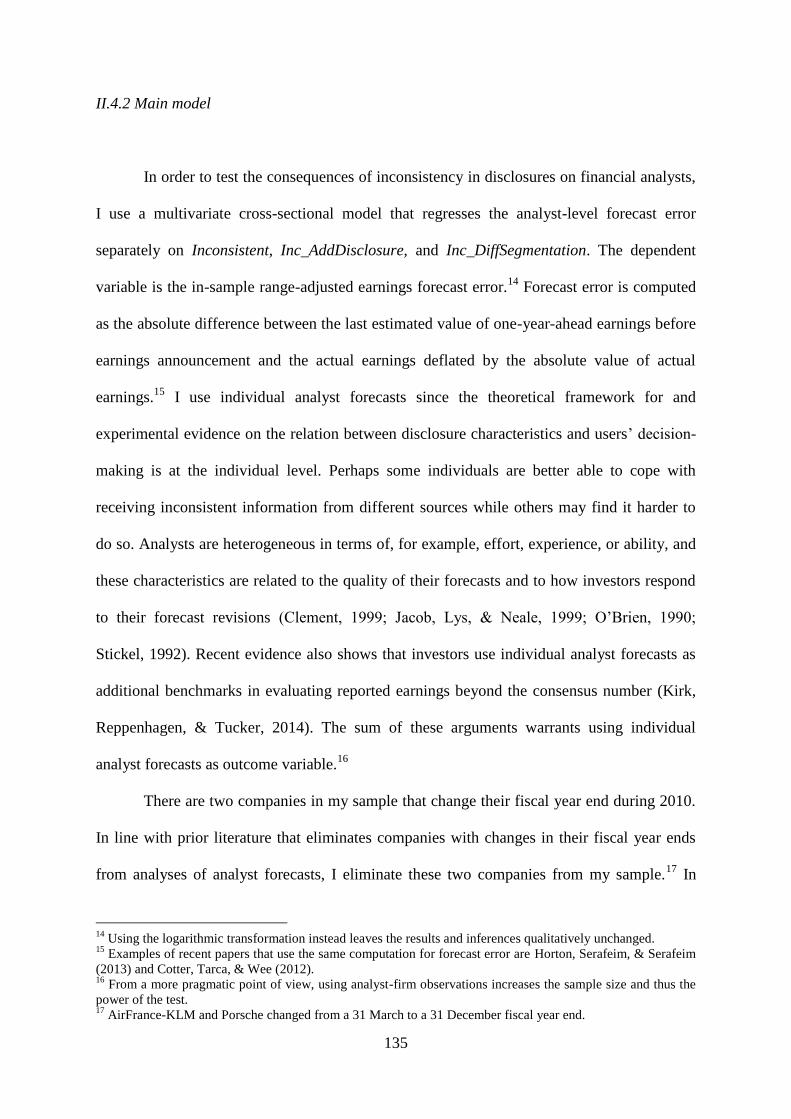
135
II.4.2 Main model
In order to test the consequences of inconsistency in disclosures on financial analysts,
I use a multivariate cross-sectional model that regresses the analyst-level forecast error
separately on Inconsistent, Inc_AddDisclosure, and Inc_DiffSegmentation. The dependent
variable is the in-sample range-adjusted earnings forecast error.14
Forecast error is computed
as the absolute difference between the last estimated value of one-year-ahead earnings before
earnings announcement and the actual earnings deflated by the absolute value of actual
earnings.15
I use individual analyst forecasts since the theoretical framework for and
experimental evidence on the relation between disclosure characteristics and users’ decision-
making is at the individual level. Perhaps some individuals are better able to cope with
receiving inconsistent information from different sources while others may find it harder to
do so. Analysts are heterogeneous in terms of, for example, effort, experience, or ability, and
these characteristics are related to the quality of their forecasts and to how investors respond
to their forecast revisions (Clement, 1999; Jacob, Lys, & Neale, 1999; O’Brien, 1990;
Stickel, 1992). Recent evidence also shows that investors use individual analyst forecasts as
additional benchmarks in evaluating reported earnings beyond the consensus number (Kirk,
Reppenhagen, & Tucker, 2014). The sum of these arguments warrants using individual
analyst forecasts as outcome variable.16
There are two companies in my sample that change their fiscal year end during 2010.
In line with prior literature that eliminates companies with changes in their fiscal year ends
from analyses of analyst forecasts, I eliminate these two companies from my sample.17
In
14
Using the logarithmic transformation instead leaves the results and inferences qualitatively unchanged. 15
Examples of recent papers that use the same computation for forecast error are Horton, Serafeim, & Serafeim
(2013) and Cotter, Tarca, & Wee (2012). 16
From a more pragmatic point of view, using analyst-firm observations increases the sample size and thus the
power of the test. 17
AirFrance-KLM and Porsche changed from a 31 March to a 31 December fiscal year end.
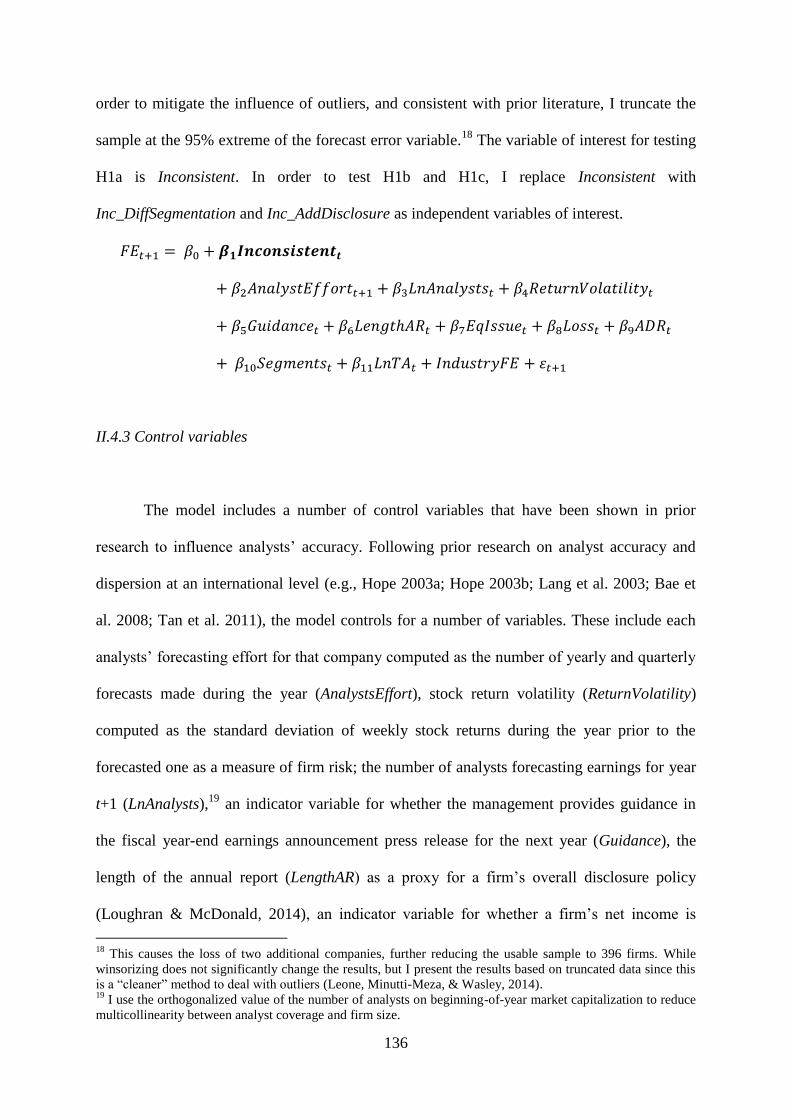
136
order to mitigate the influence of outliers, and consistent with prior literature, I truncate the
sample at the 95% extreme of the forecast error variable.18
The variable of interest for testing
H1a is Inconsistent. In order to test H1b and H1c, I replace Inconsistent with
Inc_DiffSegmentation and Inc_AddDisclosure as independent variables of interest.
𝐹𝐸𝑡+1 = 𝛽0 + 𝜷𝟏𝑰𝒏𝒄𝒐𝒏𝒔𝒊𝒔𝒕𝒆𝒏𝒕𝒕
+ 𝛽2𝐴𝑛𝑎𝑙𝑦𝑠𝑡𝐸𝑓𝑓𝑜𝑟𝑡𝑡+1 + 𝛽3𝐿𝑛𝐴𝑛𝑎𝑙𝑦𝑠𝑡𝑠𝑡 + 𝛽4𝑅𝑒𝑡𝑢𝑟𝑛𝑉𝑜𝑙𝑎𝑡𝑖𝑙𝑖𝑡𝑦𝑡
+ 𝛽5𝐺𝑢𝑖𝑑𝑎𝑛𝑐𝑒𝑡 + 𝛽6𝐿𝑒𝑛𝑔𝑡ℎ𝐴𝑅𝑡 + 𝛽7𝐸𝑞𝐼𝑠𝑠𝑢𝑒𝑡 + 𝛽8𝐿𝑜𝑠𝑠𝑡 + 𝛽9𝐴𝐷𝑅𝑡
+ 𝛽10𝑆𝑒𝑔𝑚𝑒𝑛𝑡𝑠𝑡 + 𝛽11𝐿𝑛𝑇𝐴𝑡 + 𝐼𝑛𝑑𝑢𝑠𝑡𝑟𝑦𝐹𝐸 + 휀𝑡+1
II.4.3 Control variables
The model includes a number of control variables that have been shown in prior
research to influence analysts’ accuracy. Following prior research on analyst accuracy and
dispersion at an international level (e.g., Hope 2003a; Hope 2003b; Lang et al. 2003; Bae et
al. 2008; Tan et al. 2011), the model controls for a number of variables. These include each
analysts’ forecasting effort for that company computed as the number of yearly and quarterly
forecasts made during the year (AnalystsEffort), stock return volatility (ReturnVolatility)
computed as the standard deviation of weekly stock returns during the year prior to the
forecasted one as a measure of firm risk; the number of analysts forecasting earnings for year
t+1 (LnAnalysts),19
an indicator variable for whether the management provides guidance in
the fiscal year-end earnings announcement press release for the next year (Guidance), the
length of the annual report (LengthAR) as a proxy for a firm’s overall disclosure policy
(Loughran & McDonald, 2014), an indicator variable for whether a firm’s net income is
18
This causes the loss of two additional companies, further reducing the usable sample to 396 firms. While
winsorizing does not significantly change the results, but I present the results based on truncated data since this
is a “cleaner” method to deal with outliers (Leone, Minutti-Meza, & Wasley, 2014). 19
I use the orthogonalized value of the number of analysts on beginning-of-year market capitalization to reduce
multicollinearity between analyst coverage and firm size.
137
negative during the year prior to the forecast (Loss) because is it harder to value loss firms,
the amount of equity issued during the year relative to lagged market capitalization (EqIssue),
an indicator variable for whether the company is cross-listed in the U.S. (ADR), and firm
complexity and size measured as the number of segments reported in the note (Segments) and
the natural logarithm of lagged total assets (LnTA). An additional specification includes
controls for the quality of operating segment aggregation (SRQuality) and the number of
accounting line items reported in the segment note (SRQuantity). SRQuality is the natural
logarithm of the industry-adjusted range of segment-level ROA (Ettredge et al., 2006). The
sample decreases when controlling for this variable because not all companies report segment
assets. Information for SRQuantity is hand-collected from the companies’ financial
statements. All variables are defined in Appendix II.B.
II.5 Empirical results
II.5.1 Descriptive statistics
Table II.2 reports descriptive statistics for the variables used in the empirical analyses.
A percent of 38.8% of the sample discloses operating segments inconsistently across the four
documents, and 28.3% disclose segments that indicate different internal organizations of the
company. Out of the sample companies, 10.5% provide further disaggregation of operating
segments in some documents. Panel B in table II.2 reports the descriptive statistics for the
analyst-firm observations used in the main analyses.
In table II.3, I report the Pearson and Spearman correlation coefficients for the
variables included in the analyses. The Pearson (Spearman) correlation between Inconsistent
and FE is small, 0.015 (0.015), and insignificant at conventional levels, Inc_DiffSegmentation
138
and FE are correlated at 0.032 (0.035), significant at 1%, while Inc_AddDisclosure and FE
are correlated at -0.023 (-0.026), significant at 1%. These raw correlations are a first-step,
bivariate analysis confirmation of the predictions in H1b and c. In a sense, these results lend
further support to the idea that the relations uncovered in the main analyses are not just an
artificial outcome of the partial correlations structure between the variables included in the
multivariate analyses. Regarding the other variables, the highest correlations are between
Segments and LnTA (0.335 Pearson and 0.359 Spearman) and between ADR and LnTA (0.392
Pearson and 0.380 Spearman). All other correlation coefficients are below 30% which
suggests that multicollinearity is not a particular concern in this setting.
II.5.2 Main results
Table II.4 presents the main analyses. The sample contains 10421 firm-analyst
observations Model 1 has Inconsistent as independent variable of interest. This model,
therefore, compares all the companies for which there is variation in the way operating
segments are disclosed across the four documents with those companies that disclose
consistently. The coefficient estimate is not statistically significant, which suggests that
inconsistency defined in this overall sense has no significant effect on analysts’ forecast error,
providing no support for H1a.
Model 2 shows that the effect of Inc_DiffSegmentation on analysts’ forecast error is
positive and significant at 1% (t-stat 4.89), confirming H1b. Since Inc_DiffSegmentation and
Inc_AddDisclosure are defined such that they are exclusive, the benchmark is the group of
companies that discloses either consistently or further disaggregates operating segments, i.e.,
Inc_AddDisclosure is 1. Therefore, compared to all the other companies, for those that
disclose operating segments across documents in a way that suggests different organizations
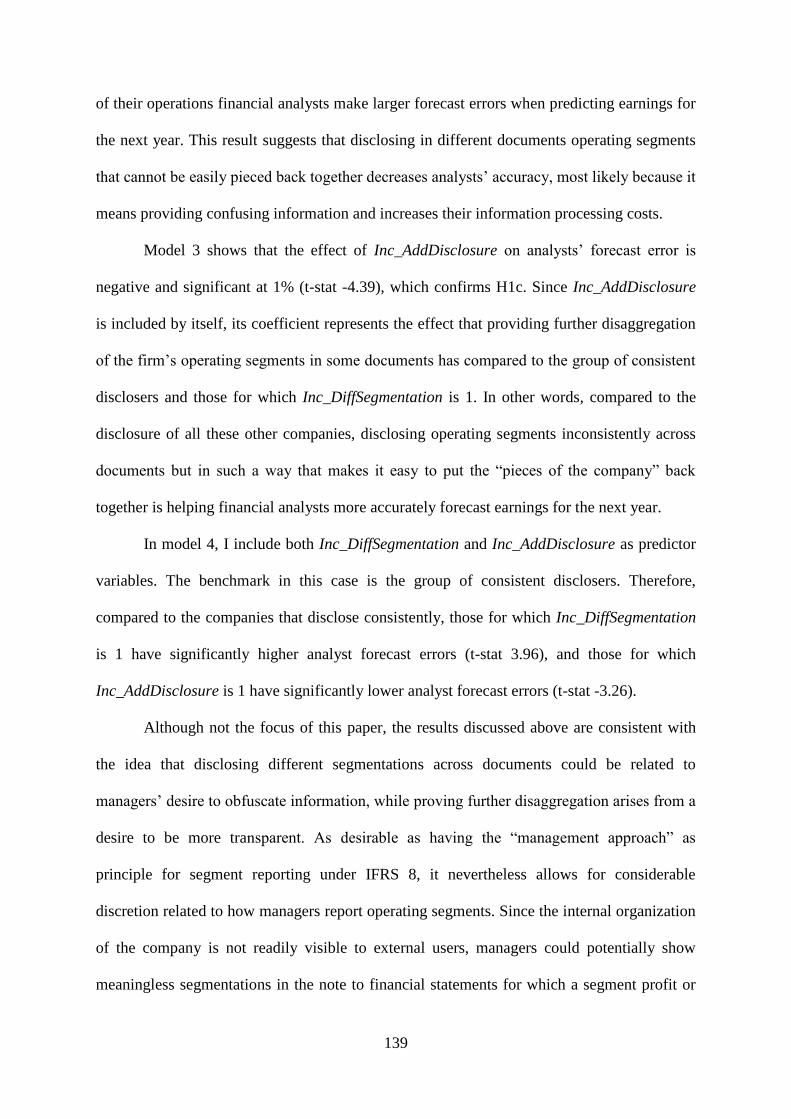
139
of their operations financial analysts make larger forecast errors when predicting earnings for
the next year. This result suggests that disclosing in different documents operating segments
that cannot be easily pieced back together decreases analysts’ accuracy, most likely because it
means providing confusing information and increases their information processing costs.
Model 3 shows that the effect of Inc_AddDisclosure on analysts’ forecast error is
negative and significant at 1% (t-stat -4.39), which confirms H1c. Since Inc_AddDisclosure
is included by itself, its coefficient represents the effect that providing further disaggregation
of the firm’s operating segments in some documents has compared to the group of consistent
disclosers and those for which Inc_DiffSegmentation is 1. In other words, compared to the
disclosure of all these other companies, disclosing operating segments inconsistently across
documents but in such a way that makes it easy to put the “pieces of the company” back
together is helping financial analysts more accurately forecast earnings for the next year.
In model 4, I include both Inc_DiffSegmentation and Inc_AddDisclosure as predictor
variables. The benchmark in this case is the group of consistent disclosers. Therefore,
compared to the companies that disclose consistently, those for which Inc_DiffSegmentation
is 1 have significantly higher analyst forecast errors (t-stat 3.96), and those for which
Inc_AddDisclosure is 1 have significantly lower analyst forecast errors (t-stat -3.26).
Although not the focus of this paper, the results discussed above are consistent with
the idea that disclosing different segmentations across documents could be related to
managers’ desire to obfuscate information, while proving further disaggregation arises from a
desire to be more transparent. As desirable as having the “management approach” as
principle for segment reporting under IFRS 8, it nevertheless allows for considerable
discretion related to how managers report operating segments. Since the internal organization
of the company is not readily visible to external users, managers could potentially show
meaningless segmentations in the note to financial statements for which a segment profit or
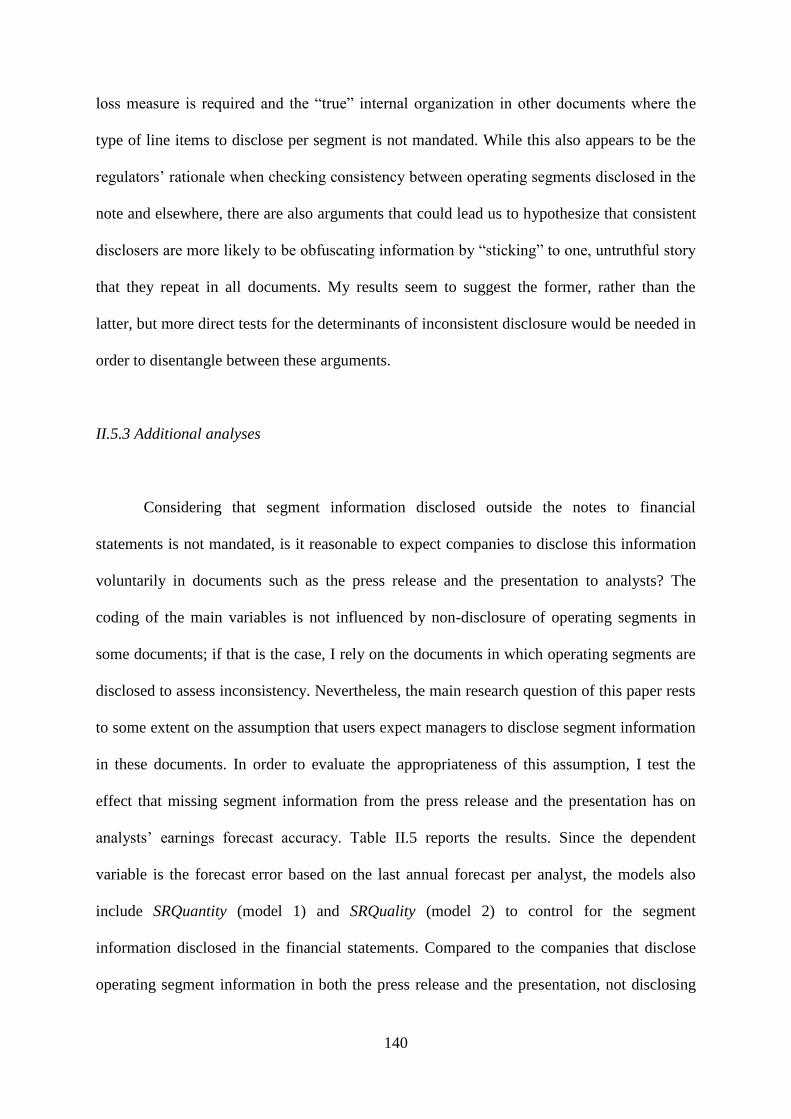
140
loss measure is required and the “true” internal organization in other documents where the
type of line items to disclose per segment is not mandated. While this also appears to be the
regulators’ rationale when checking consistency between operating segments disclosed in the
note and elsewhere, there are also arguments that could lead us to hypothesize that consistent
disclosers are more likely to be obfuscating information by “sticking” to one, untruthful story
that they repeat in all documents. My results seem to suggest the former, rather than the
latter, but more direct tests for the determinants of inconsistent disclosure would be needed in
order to disentangle between these arguments.
II.5.3 Additional analyses
Considering that segment information disclosed outside the notes to financial
statements is not mandated, is it reasonable to expect companies to disclose this information
voluntarily in documents such as the press release and the presentation to analysts? The
coding of the main variables is not influenced by non-disclosure of operating segments in
some documents; if that is the case, I rely on the documents in which operating segments are
disclosed to assess inconsistency. Nevertheless, the main research question of this paper rests
to some extent on the assumption that users expect managers to disclose segment information
in these documents. In order to evaluate the appropriateness of this assumption, I test the
effect that missing segment information from the press release and the presentation has on
analysts’ earnings forecast accuracy. Table II.5 reports the results. Since the dependent
variable is the forecast error based on the last annual forecast per analyst, the models also
include SRQuantity (model 1) and SRQuality (model 2) to control for the segment
information disclosed in the financial statements. Compared to the companies that disclose
operating segment information in both the press release and the presentation, not disclosing
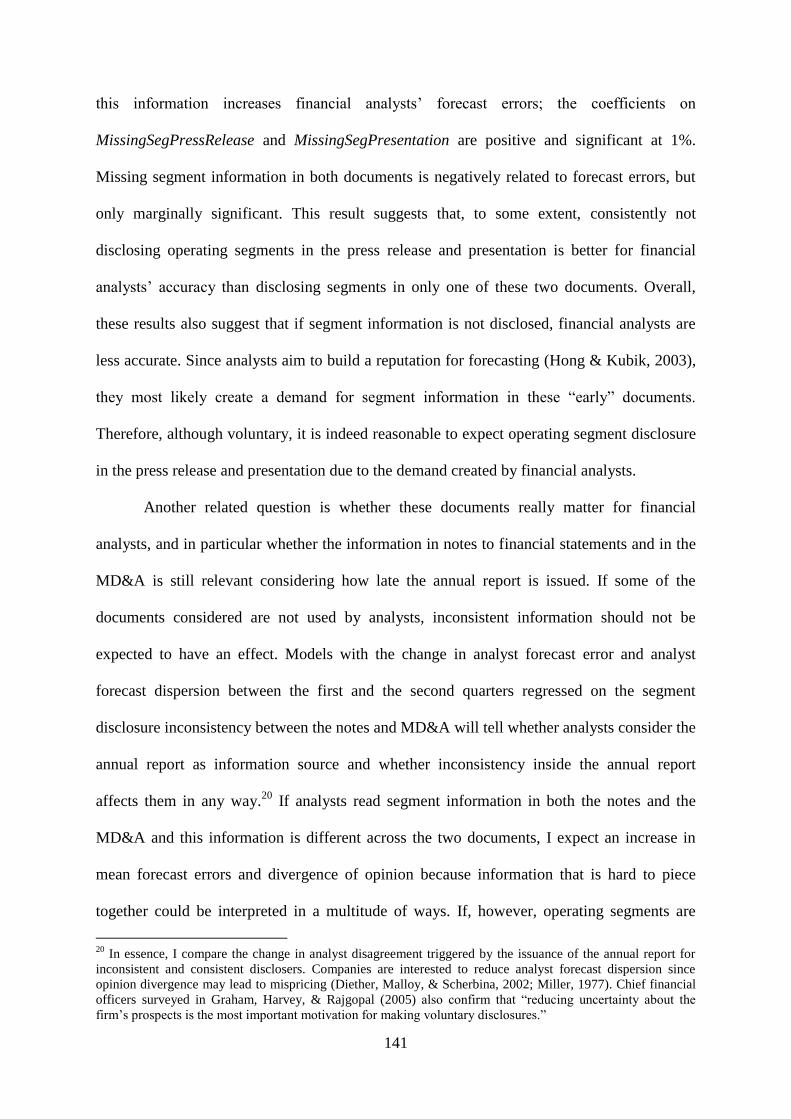
141
this information increases financial analysts’ forecast errors; the coefficients on
MissingSegPressRelease and MissingSegPresentation are positive and significant at 1%.
Missing segment information in both documents is negatively related to forecast errors, but
only marginally significant. This result suggests that, to some extent, consistently not
disclosing operating segments in the press release and presentation is better for financial
analysts’ accuracy than disclosing segments in only one of these two documents. Overall,
these results also suggest that if segment information is not disclosed, financial analysts are
less accurate. Since analysts aim to build a reputation for forecasting (Hong & Kubik, 2003),
they most likely create a demand for segment information in these “early” documents.
Therefore, although voluntary, it is indeed reasonable to expect operating segment disclosure
in the press release and presentation due to the demand created by financial analysts.
Another related question is whether these documents really matter for financial
analysts, and in particular whether the information in notes to financial statements and in the
MD&A is still relevant considering how late the annual report is issued. If some of the
documents considered are not used by analysts, inconsistent information should not be
expected to have an effect. Models with the change in analyst forecast error and analyst
forecast dispersion between the first and the second quarters regressed on the segment
disclosure inconsistency between the notes and MD&A will tell whether analysts consider the
annual report as information source and whether inconsistency inside the annual report
affects them in any way.20
If analysts read segment information in both the notes and the
MD&A and this information is different across the two documents, I expect an increase in
mean forecast errors and divergence of opinion because information that is hard to piece
together could be interpreted in a multitude of ways. If, however, operating segments are
20
In essence, I compare the change in analyst disagreement triggered by the issuance of the annual report for
inconsistent and consistent disclosers. Companies are interested to reduce analyst forecast dispersion since
opinion divergence may lead to mispricing (Diether, Malloy, & Scherbina, 2002; Miller, 1977). Chief financial
officers surveyed in Graham, Harvey, & Rajgopal (2005) also confirm that “reducing uncertainty about the
firm’s prospects is the most important motivation for making voluntary disclosures.”
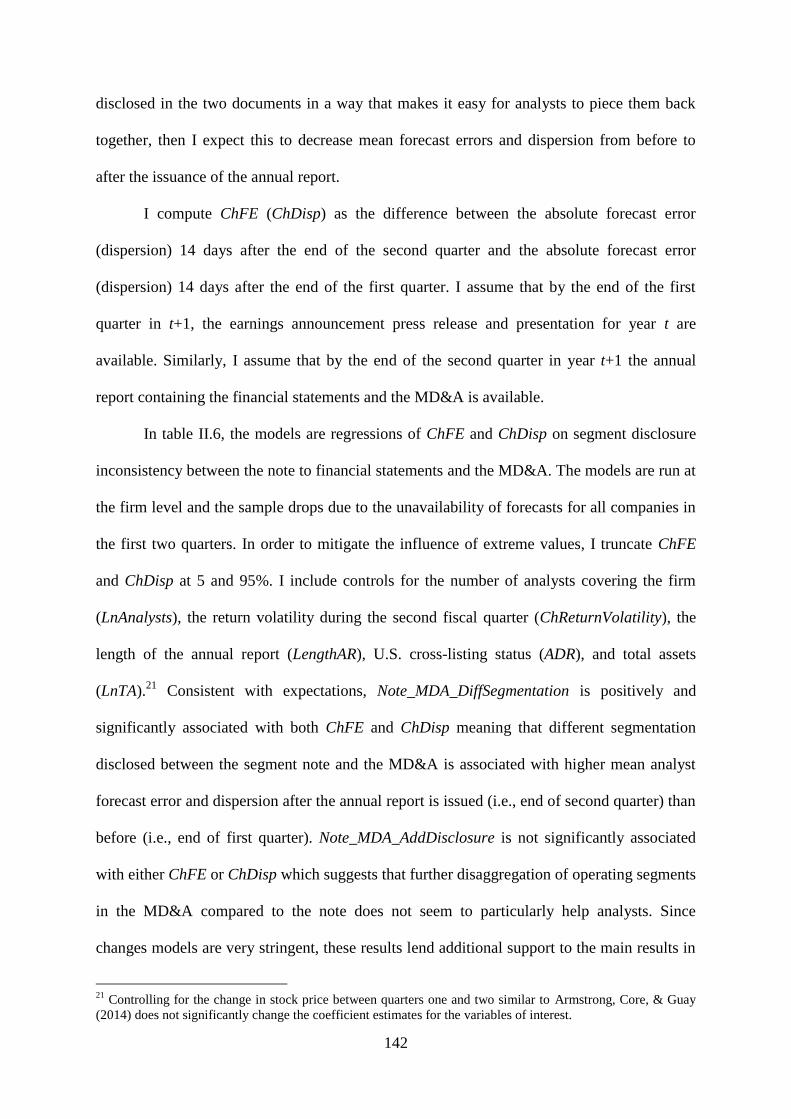
142
disclosed in the two documents in a way that makes it easy for analysts to piece them back
together, then I expect this to decrease mean forecast errors and dispersion from before to
after the issuance of the annual report.
I compute ChFE (ChDisp) as the difference between the absolute forecast error
(dispersion) 14 days after the end of the second quarter and the absolute forecast error
(dispersion) 14 days after the end of the first quarter. I assume that by the end of the first
quarter in t+1, the earnings announcement press release and presentation for year t are
available. Similarly, I assume that by the end of the second quarter in year t+1 the annual
report containing the financial statements and the MD&A is available.
In table II.6, the models are regressions of ChFE and ChDisp on segment disclosure
inconsistency between the note to financial statements and the MD&A. The models are run at
the firm level and the sample drops due to the unavailability of forecasts for all companies in
the first two quarters. In order to mitigate the influence of extreme values, I truncate ChFE
and ChDisp at 5 and 95%. I include controls for the number of analysts covering the firm
(LnAnalysts), the return volatility during the second fiscal quarter (ChReturnVolatility), the
length of the annual report (LengthAR), U.S. cross-listing status (ADR), and total assets
(LnTA).21
Consistent with expectations, Note_MDA_DiffSegmentation is positively and
significantly associated with both ChFE and ChDisp meaning that different segmentation
disclosed between the segment note and the MD&A is associated with higher mean analyst
forecast error and dispersion after the annual report is issued (i.e., end of second quarter) than
before (i.e., end of first quarter). Note_MDA_AddDisclosure is not significantly associated
with either ChFE or ChDisp which suggests that further disaggregation of operating segments
in the MD&A compared to the note does not seem to particularly help analysts. Since
changes models are very stringent, these results lend additional support to the main results in
21
Controlling for the change in stock price between quarters one and two similar to Armstrong, Core, & Guay
(2014) does not significantly change the coefficient estimates for the variables of interest.
143
table II.4 related to the effect of disclosing different segmentations across different
documents.
These additional analyses have shown that all the documents considered are important
for financial analysts, and that indeed they demand segment disclosures in these documents.
It is therefore reasonable to examine the effect that inconsistency in the operating segments
disclosed across the set of four documents chosen.
II.6 Robustness tests
II.6.1 Endogeneity concerns
In this setting, endogeneity could arise from unobserved correlated variable bias if
there are unobservable characteristics that are correlated with both Inc_DiffSegmentation
and/or Inc_AddDisclosure and FE.22
If a variable exists that is either unobservable or has not
been included in the set of control variables and determines both the inconsistent disclosure
and analysts’ forecast errors, then the coefficient estimates in the main analyses may be
biased (Larcker & Rusticus, 2010). Since the model is run with industry fixed effects, as well
as country fixed-effects in untabulated analyses, the fixed effects capture the unobservable
characteristics that firms in an industry/country share. Therefore, it is less likely that this
unobservable variable is an industry or country characteristic. Rather, it is more likely that the
unobservable variable is a firm-level characteristic. Including firm fixed effects is not a
solution since the model is a cross-sectional regression with predictor variables at the firm-
level.
22
Simultaneity bias is not a concern since the decisions on disclosure and earnings forecasts are made by
different actors (managers vs. financial analysts) at different times (t vs. t+1).
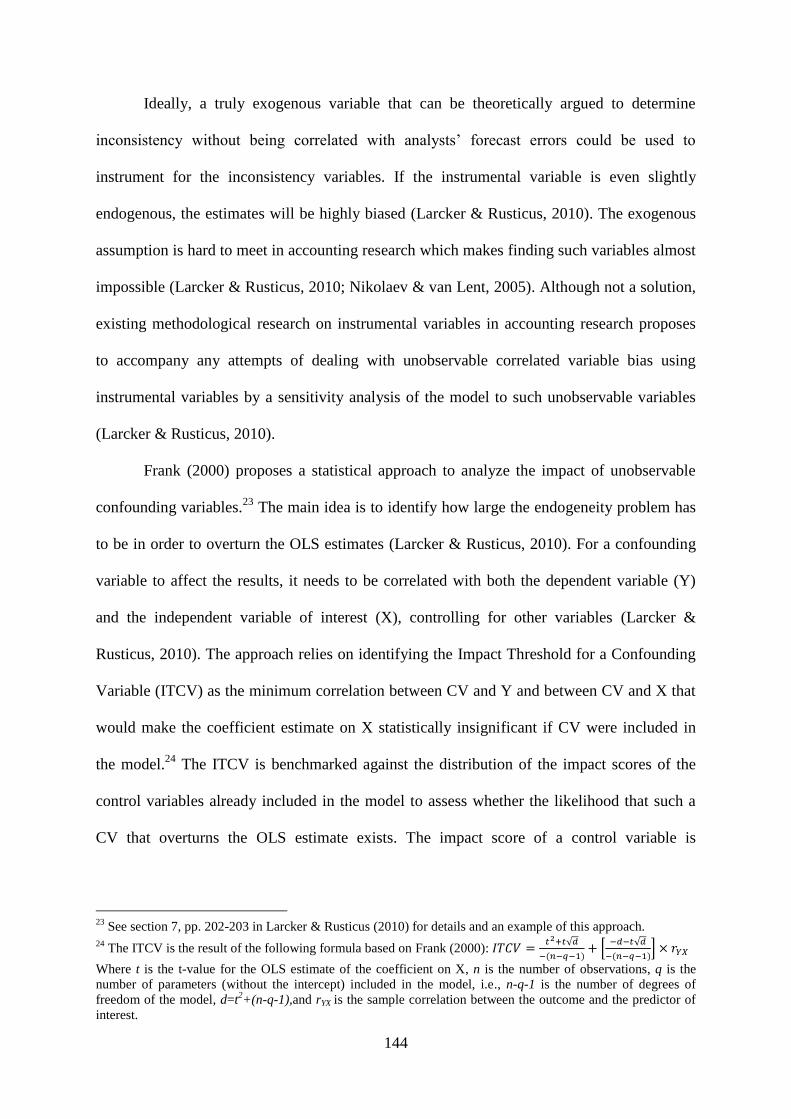
144
Ideally, a truly exogenous variable that can be theoretically argued to determine
inconsistency without being correlated with analysts’ forecast errors could be used to
instrument for the inconsistency variables. If the instrumental variable is even slightly
endogenous, the estimates will be highly biased (Larcker & Rusticus, 2010). The exogenous
assumption is hard to meet in accounting research which makes finding such variables almost
impossible (Larcker & Rusticus, 2010; Nikolaev & van Lent, 2005). Although not a solution,
existing methodological research on instrumental variables in accounting research proposes
to accompany any attempts of dealing with unobservable correlated variable bias using
instrumental variables by a sensitivity analysis of the model to such unobservable variables
(Larcker & Rusticus, 2010).
Frank (2000) proposes a statistical approach to analyze the impact of unobservable
confounding variables.23
The main idea is to identify how large the endogeneity problem has
to be in order to overturn the OLS estimates (Larcker & Rusticus, 2010). For a confounding
variable to affect the results, it needs to be correlated with both the dependent variable (Y)
and the independent variable of interest (X), controlling for other variables (Larcker &
Rusticus, 2010). The approach relies on identifying the Impact Threshold for a Confounding
Variable (ITCV) as the minimum correlation between CV and Y and between CV and X that
would make the coefficient estimate on X statistically insignificant if CV were included in
the model.24
The ITCV is benchmarked against the distribution of the impact scores of the
control variables already included in the model to assess whether the likelihood that such a
CV that overturns the OLS estimate exists. The impact score of a control variable is
23
See section 7, pp. 202-203 in Larcker & Rusticus (2010) for details and an example of this approach.
24 The ITCV is the result of the following formula based on Frank (2000): 𝐼𝑇𝐶𝑉 =
𝑡2+𝑡√𝑑
−(𝑛−𝑞−1)+ [
−𝑑−𝑡√𝑑
−(𝑛−𝑞−1)] × 𝑟𝑌𝑋
Where t is the t-value for the OLS estimate of the coefficient on X, n is the number of observations, q is the
number of parameters (without the intercept) included in the model, i.e., n-q-1 is the number of degrees of
freedom of the model, d=t2+(n-q-1),and rYX is the sample correlation between the outcome and the predictor of
interest.
145
computed by multiplying its raw (i.e., simple) correlation with Y to its raw correlation with
X.25
Table II.7 panel A reports the results for the sensitivity analysis following Frank
(2000). The threshold value for ITCV for Inc_DiffSegmentation is -0.0039, implying that the
correlations between Inc_DiffSegmentation and FE with the unobserved confounding
variable need to be around 0.062 (=√0.0039) to overturn the OLS result. While this seems as
a low correlation coefficient, it is nevertheless higher than most of the correlations between
Inc_DiffSegmentation and the other variables included in the analyses (table II.3 panel A).
Since Inc_DiffSegmentation is negatively related to FE, one of these two correlations needs to
be negative, otherwise the confounding variable would strengthen rather than weaken the
effect of Inc_DiffSegmentation on FE. The value of ITCV for Inc_DiffSegmentation is closest
to the impact scores of LengthAR and Loss. The confounding variable would have to be
similar in terms of type of relation and magnitude of effect to these two variables in order to
render the effect of Inc_DiffSegmentation on FE insignificant, but nevertheless different from
them since the model already includes these as control variables.
The ITCV value for Inc_AddDisclosure is 0.0421, meaning that the correlations
between Inc_AddDisclosure and FE with the confounding variable would have to be around
0.205 (=√0.0421) to make the coefficient on Inc_AddDisclosure insignificant at
conventional levels and both correlations would have to be either positive or negative to
weaken the OLS estimate. None of the raw impact scores is higher than the ITCV for
Inc_AddDisclosure which suggests that the confounding variable would have to be very
different from any of the control variables.
25
Larcker & Rusticus (2010) note that the raw impact scores are a more conservative measure of impact, so
comparing the ITCV to the raw impact scores instead of the partial correlation impact scores assumes that CV is
relatively distinct from existing control variables and provides a more “negative” view on how sensitive the
results are to endogeneity.
146
Overall, the sensitivity to endogeneity analyses following Frank (2000) suggest that
the main results are reasonably robust to unobservable correlated variable bias, although such
variables might still exist. The large set of controls and numerous other untabulated analyses
with additional controls lend further confidence in the results.
II.6.2 Other robustness tests
I conduct a set of supplementary analyses to check the robustness of the main results.
These tests are presented in table II.8. In panel A, instead of clustering standard errors at the
analyst level, I use clustering by firm since unobservable firm-level characteristics might
cause analysts to consistently forecast in a certain way. In other words, earnings forecasts for
the same firm are not independent observations. Since the model is used on a cross-section,
the number of clusters becomes equal to the number of companies in the sample. The results
suggest that Inc_DiffSegmentation is positively and significantly associated with forecast
error (t-stat 1.75). The coefficient for Inc_AddDisclosure has the expected negative sign but
is statistically weaker. Therefore, taking into account the non-independence (i.e., correlation)
of forecast errors for the same company makes the results weaker which suggests that
analysts covering a firm are similarly affected by the disclosure inconsistency of that
company.
I also control for the influence of country-level institutions given prior evidence that
home-country institutions matter for voluntary disclosure (Shi, Magnan, & Kim, 2012).
Replacing the industry fixed effects with country fixed effects (panel B) leaves the tenor of
the main results unchanged. Inc_DiffSegmentation is positively and strongly associated with
FE (t-stat 4.78), while Inc_AddDisclosure is negatively associated with FE, with a coefficient
significant at 5% (t-stat -2.23). When I include both variables of interest in the same
regression with country fixed effects, Inc_AddDisclosure is negative but no longer
147
statistically significant. This analysis suggests that, to some extent, how much additional
disaggregation of information in different documents matters for analysts may be subsumed
by country-level characteristics. If I include both industry and country fixed effects, both
variables of interest are strongly significant in all models, i.e., included either separately or
together (panel C).
In panel D, I expand the set of control variables by including EQ as a measure of
earnings quality. EQ is computed as the absolute value of residuals from a Dechow & Dichev
(2002) model computed in-sample at the industry level. Higher values of absolute residuals
mean lower earnings quality. As expected based on prior evidence (Bradshaw, Richardson, &
Sloan, 2001; Burgstahler & Eames, 2003), EQ is positively and significantly associated with
FE, meaning that analysts’ forecast errors are higher when there is more earnings
management. The coefficient estimates on the variables of interest remain qualitatively
unchanged even after controlling for EQ. Replacing EQ with measures of discretionary
accruals based on Jones (1991) type of models does not have a different effect.
In panel E, I restrict the sample to only those companies that disclose segment
information in all four documents. The dropped companies are those without segment
disclosure in the press release and presentation (the variables MissingSegPressRelease and
MissingSegPresentation describe the sample from this point of view) and one company that
does not mention any segment-related information in the MD&A. All results remain
qualitatively similar and significant at 1%.
I run two sensitivity tests to take into account companies’ disclosure policy in the
segment note. In panel F, I test the sensitivity of the results when controlling for the quality
of operating segment aggregation in the notes to financial statements (SRQuality) and the
number of accounting line items (SRQuantity) provided in the segment note. Controlling for
these variables is meant to mitigate concerns that the inconsistency variables are correlated
148
with some of the characteristics of segment disclosure in the note, and since financial analysts
potentially focus first and foremost on this regulated information, the coefficients of interest
reflect analysts’ processing of the segment information in the note. Including SRQuality as
control variable reduces the sample due to data constraints for computing it. The main results
hold when controlling for SRQuality and SRQuantity, although in model 4 when both
Inc_DiffSegmentation and Inc_AddDisclosure are included, Inc_AddDisclosure is significant
at 5% instead of 1% when not controlling for SRQuality and SRQuantity. Across all four
models, the coefficients for SRQuality are negative suggesting that higher quality of
operating segment aggregation allows a better discrimination of the company’s businesses
and more accurate forecast of future prospects, but not significant at conventional levels. The
coefficients on SRQuantity are positive and strongly significant meaning that the more line
items provided in the segment note, the harder it is for analysts to be accurate in their
earnings forecasts.26
In order to compare across companies with similar disclosure policies, a more
“apples-to-apples” comparison, I also restrict the sample to those companies with available
data to compute SRQuality and run the regressions on this restricted sample but without
including SRQuality as control variable (panel G). The coefficients of interest have the
expected signs and are significant at 1%. Therefore, overall, the robustness tests leave the
tenor of the main results unchanged.
The complexity associated with a company’s businesses may be a reason for which
managers disclose operating segments inconsistently across documents and, at the same time,
may be influencing analysts’ accuracy when forecasting earnings. In other words, business
complexity and uncertainty may be a correlated omitted variable from our model, and could
be a source of endogeneity. In panel H, I use three variables to proxy for this concept. In
26
This result provides support to the disclosure overload arguments, is in line with prior research (Lehavy et al.,
2011), and is consistent with the coefficient on LengthAR in all the models, which is similarly negative and
significant.
149
model (1) I include the standard deviation of earnings for the last five years (StdEarnings), in
model (2), the standard deviation of cash flows for the last five years (StdCFO), and in model
(3) an indicator variable for whether the company has its main operations in a high tech
industry known to have more uncertain cash flows (Barron et al., 2002). The coefficient on
StdEarnings in model (1) is positive and strongly significant, which suggests that analysts
covering firms with more volatile earnings are less accurate. The coefficients for StdCFO and
HighTech in models (2) and (3), respectively, are not statistically significant. The variables of
interest Inc_DiffSegmentation and Inc_AddDisclosure remain strongly significant and have
the predicted signs. Therefore, business complexity and earnings stream uncertainty does not
seem to be an omitted correlated variable that would significantly influence the main results.
II.7 Conclusion
This paper uses hand-collected data on operating segments from four different
corporate documents of 400 multi-segment European firms to analyze the consequences of
inconsistent disclosures for financial analysts’ forecast accuracy. The set of documents I
consider contains (1) the notes to financial statements, (2) the MD&A, (3) the fiscal year-end
earnings announcement press release and (4) the fiscal year-end presentation to analysts that
is part of the earnings announcement conference call. Inconsistent disclosure is defined based
on the Securities and Exchange Commission (SEC) and European Securities and Markets
Authority’s (ESMA) review process guidelines as variation in information disclosed on the
same topic in different documents issued by the same firm, and further refined to account for
potential additional information, i.e., disaggregation of operating segments in some
documents, or hard-to-reconcile different segmentations disclosed in different documents.

150
I show that disclosing inconsistently across documents is a relatively pervasive
practice – almost 39% of the companies in my sample do not disclose exactly the same
operating segments in the four documents considered. Inconsistency that arises from further
disaggregating operating segments seems to bring new information and lowers analysts’
forecast errors. Disclosure of a different segmentation, however, impedes analysts’
information processing such that their forecast errors are larger. These results have practical
implications for managers and financial analysts. Since financial analysts are an important
link between the firm and the capital markets, managers want to understand how to best
communicate with them (Bradshaw, 2011). This paper shows the effects that inconsistency as
a characteristic of disclosure across documents has on analysts’ accuracy, so managers could
use these results to adjust their disclosure strategy.
The results also have implications for regulators and the current debate on a
disclosure framework. I supplement some existing survey evidence that points to the
importance investors and analysts attach to consistency in disclosure with empirical results
from a relatively large sample of firms. Given my findings, regulators and standard setters
may want to assess the need to consider the consistency of disclosure across documents as an
attribute of disclosure quality that companies should be encouraged to adhere to. My findings
also back up regulators’ existing practices of evaluating compliance with disclosure standards
by comparing mandated disclosure with voluntary disclosure on the same topic but in
different documents.
Last, but not least, this paper contributes to the accounting disclosure literature and
this contribution stems from two main aspects. First, the paper identifies a dimension of
corporate accounting disclosure that has not been previously examined and investigates the
consequences of this disclosure characteristic for an important set of users of accounting
information – the financial analysts. Second, by considering disclosures made in more than

151
one document, this paper takes a step forward towards improving our understanding of
managers’ overall disclosure strategy and the effects that this strategy has. The financial
statements are one component of an array of disclosure “weapons” that managers use to
communicate to capital market participants, although financial information is present in most
of the other documents as well. Evidence on the role that financial information plays when
disclosed outside the financial statements and whether and how users assess it in comparison
to the financial statements enhances our understanding of the role of accounting disclosures
and the characteristics that make accounting disclosure useful.

152
(in € million)
Power
Transport
Corporate
& others
Eliminations
Total
Sales 13,918 5,751 - (19) 19,650
Inter Sector eliminations (17) (2) - 19 -
Total Sales 13,901 5,749 - - 19,650
Income (loss) from operations 1,468 414 (103) - 1,779
Earnings (loss) before interest and taxes 1,377 368 (116) - 1,629
Financial income (expense) (42)
Income tax (385)
Share in net income of equity investments 3
Net profit 1,205
Fin
anci
al
Info
rmati
on
Appendix II.A: Examples of coding inconsistency across corporate documents
Alstom SA, France
Extract from Note 5 Sector and geographical data
At 31 March 2010
2
(1) Segment assets are defined as the sum of goodwill, intangible assets, property, plant and equipment, associates and other investments, other non current assets (other than those related to financial debt and to employee defined benefit plans), inventories, construction contracts in progress assets, trade receivables and other operating assets.
(2) Segment liabilities are defined as the sum of non-current and current provisions, construction contracts in progress liabilities, trade payables and other operating liabilities.
(3) Capital employed corresponds to segment assets minus segment liabilities.
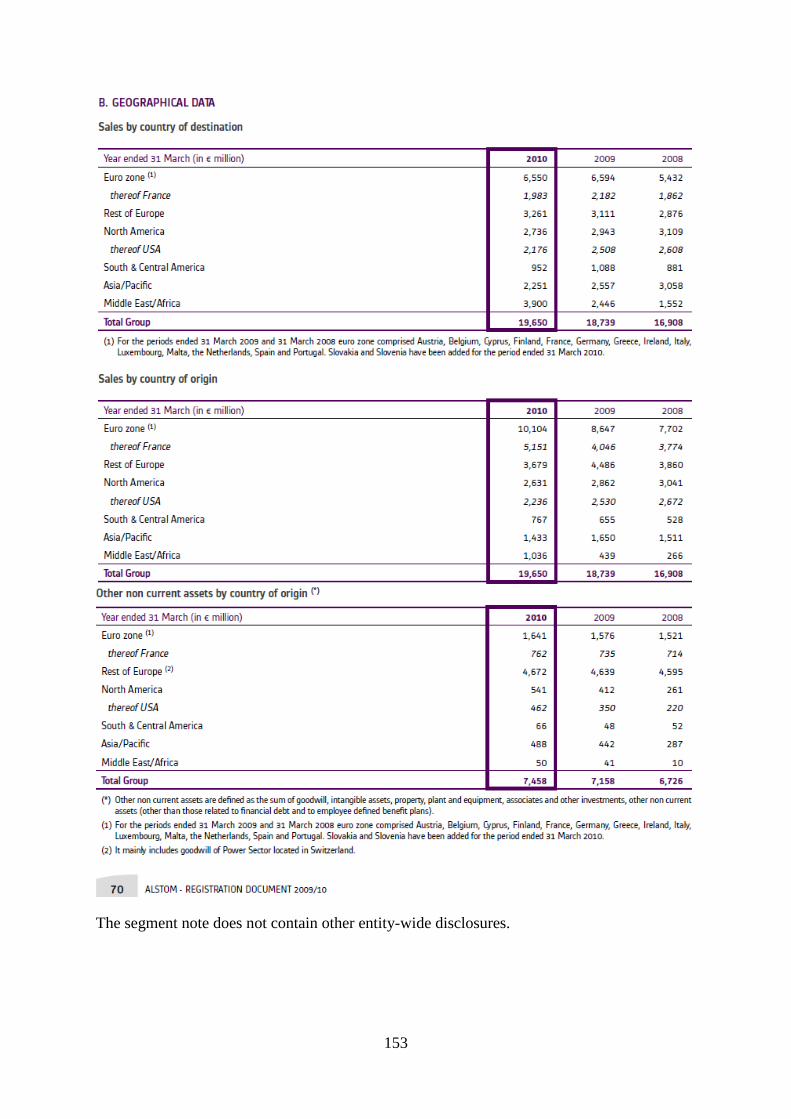
153
The segment note does not contain other entity-wide disclosures.
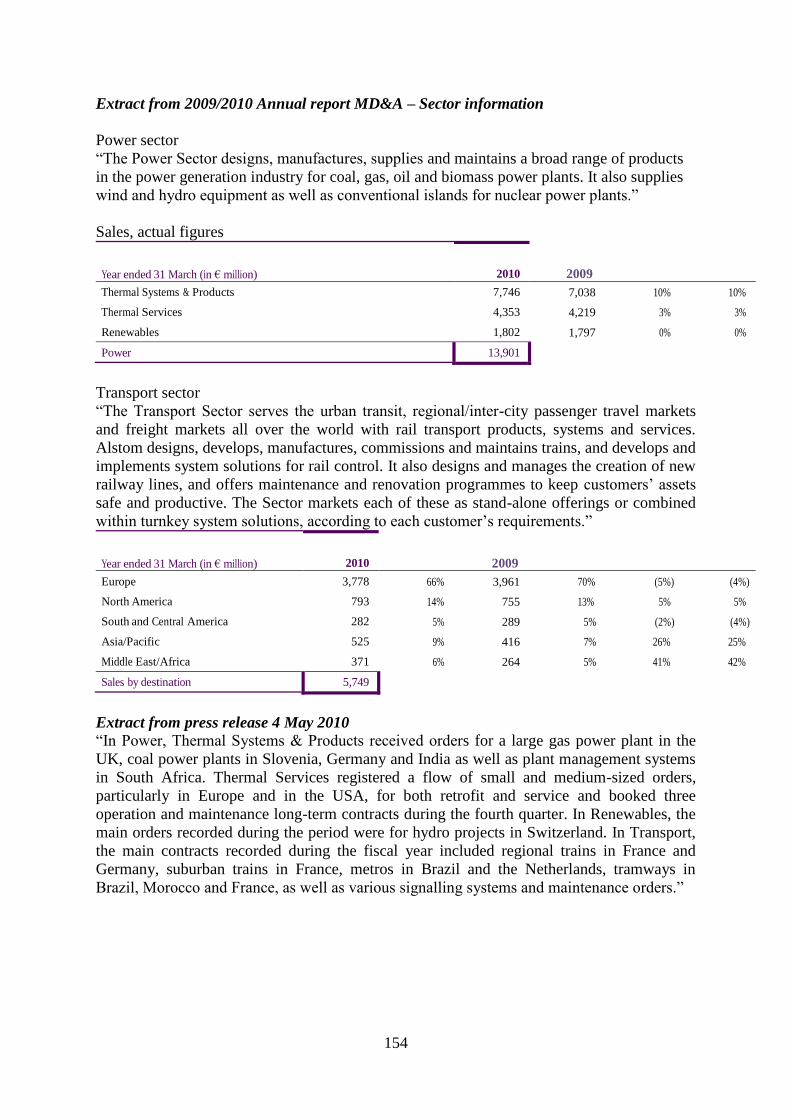
154
Extract from 2009/2010 Annual report MD&A – Sector information
Power sector
“The Power Sector designs, manufactures, supplies and maintains a broad range of products
in the power generation industry for coal, gas, oil and biomass power plants. It also supplies
wind and hydro equipment as well as conventional islands for nuclear power plants.”
Sales, actual figures
Year ended 31 March (in € million)
2010 2009
Thermal Systems & Products
Thermal Services
Renewables
7,746
4,353
1,802
7,038 10% 10%
4,219 3% 3%
1,797 0% 0%
Power 13,901
Transport sector
“The Transport Sector serves the urban transit, regional/inter-city passenger travel markets
and freight markets all over the world with rail transport products, systems and services.
Alstom designs, develops, manufactures, commissions and maintains trains, and develops and
implements system solutions for rail control. It also designs and manages the creation of new
railway lines, and offers maintenance and renovation programmes to keep customers’ assets
safe and productive. The Sector markets each of these as stand-alone offerings or combined
within turnkey system solutions, according to each customer’s requirements.”
Year ended 31 March (in € million)
2010 2009
Europe
North America
South and Central America
Asia/Pacific
Middle East/Africa
3,778
793
282
525
371
66% 3,961 70% (5%) (4%)
14% 755 13% 5% 5%
5% 289 5% (2%) (4%)
9% 416 7% 26% 25%
6% 264 5% 41% 42%
Sales by destination 5,749
Extract from press release 4 May 2010
“In Power, Thermal Systems & Products received orders for a large gas power plant in the
UK, coal power plants in Slovenia, Germany and India as well as plant management systems
in South Africa. Thermal Services registered a flow of small and medium-sized orders,
particularly in Europe and in the USA, for both retrofit and service and booked three
operation and maintenance long-term contracts during the fourth quarter. In Renewables, the
main orders recorded during the period were for hydro projects in Switzerland. In Transport,
the main contracts recorded during the fiscal year included regional trains in France and
Germany, suburban trains in France, metros in Brazil and the Netherlands, tramways in
Brazil, Morocco and France, as well as various signalling systems and maintenance orders.”
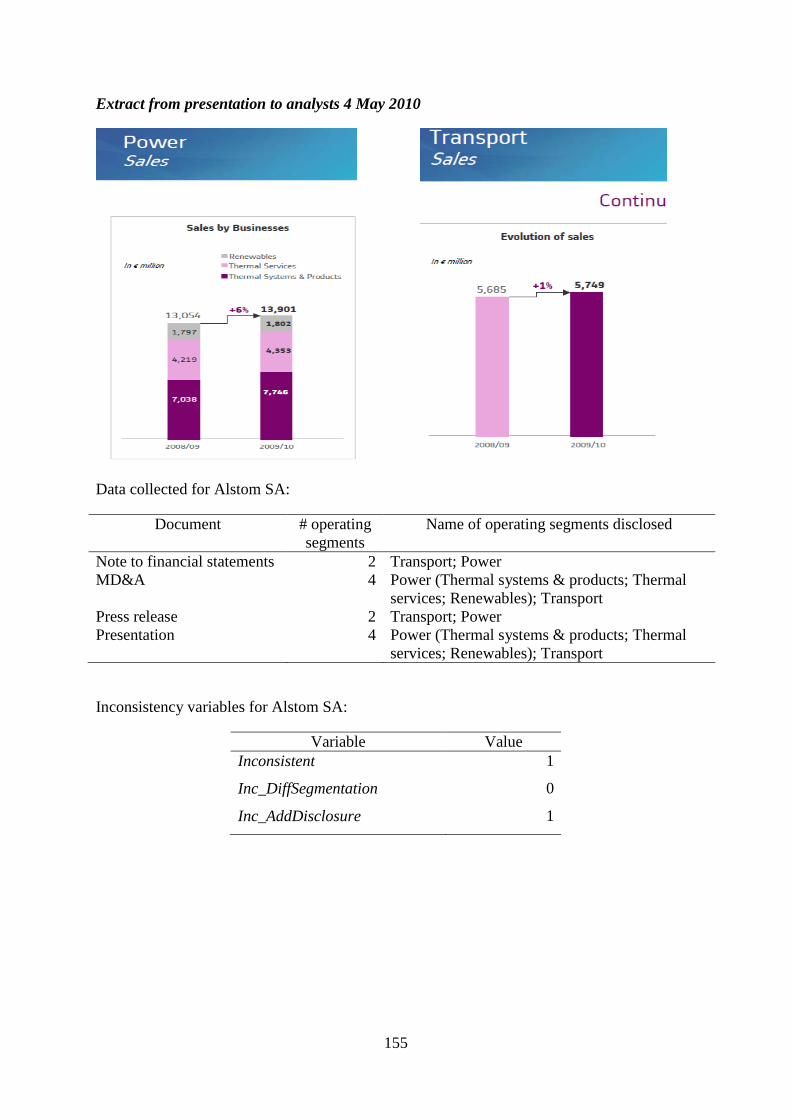
155
Extract from presentation to analysts 4 May 2010
Data collected for Alstom SA:
Document # operating
segments
Name of operating segments disclosed
Note to financial statements 2 Transport; Power
MD&A 4 Power (Thermal systems & products; Thermal
services; Renewables); Transport
Press release 2 Transport; Power
Presentation 4 Power (Thermal systems & products; Thermal
services; Renewables); Transport
Inconsistency variables for Alstom SA:
Variable Value
Inconsistent 1
Inc_DiffSegmentation 0
Inc_AddDisclosure 1
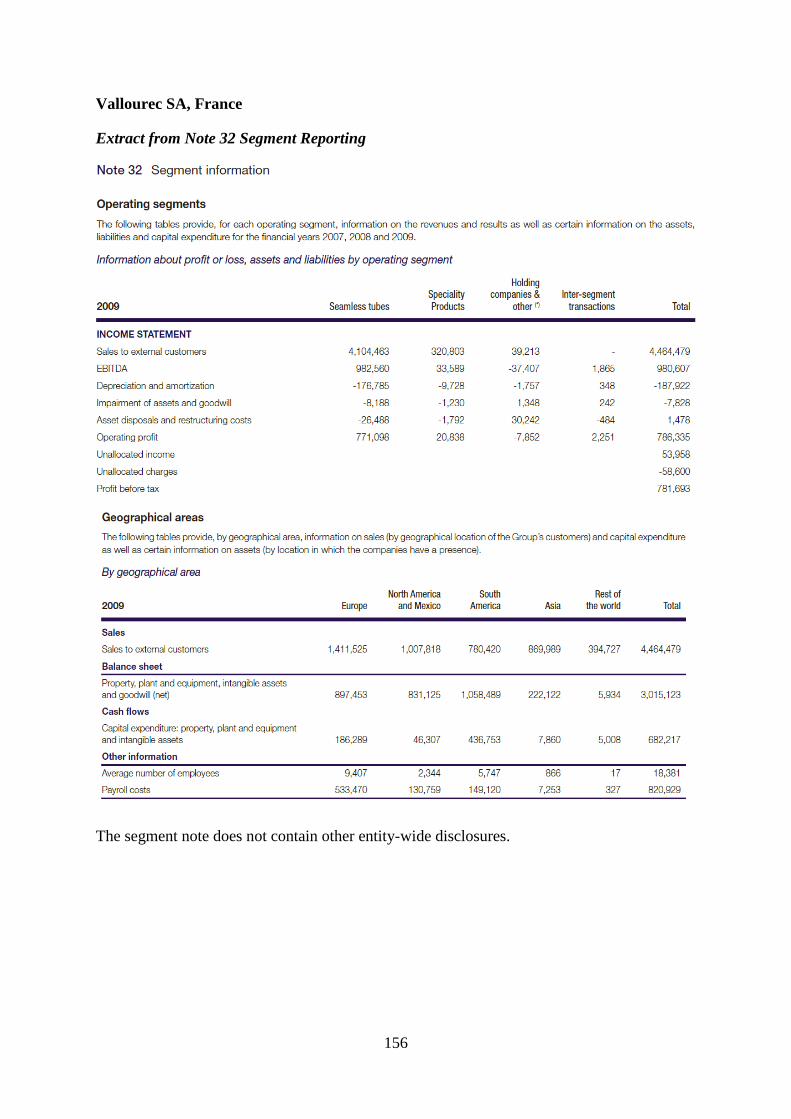
156
Vallourec SA, France
Extract from Note 32 Segment Reporting
The segment note does not contain other entity-wide disclosures.
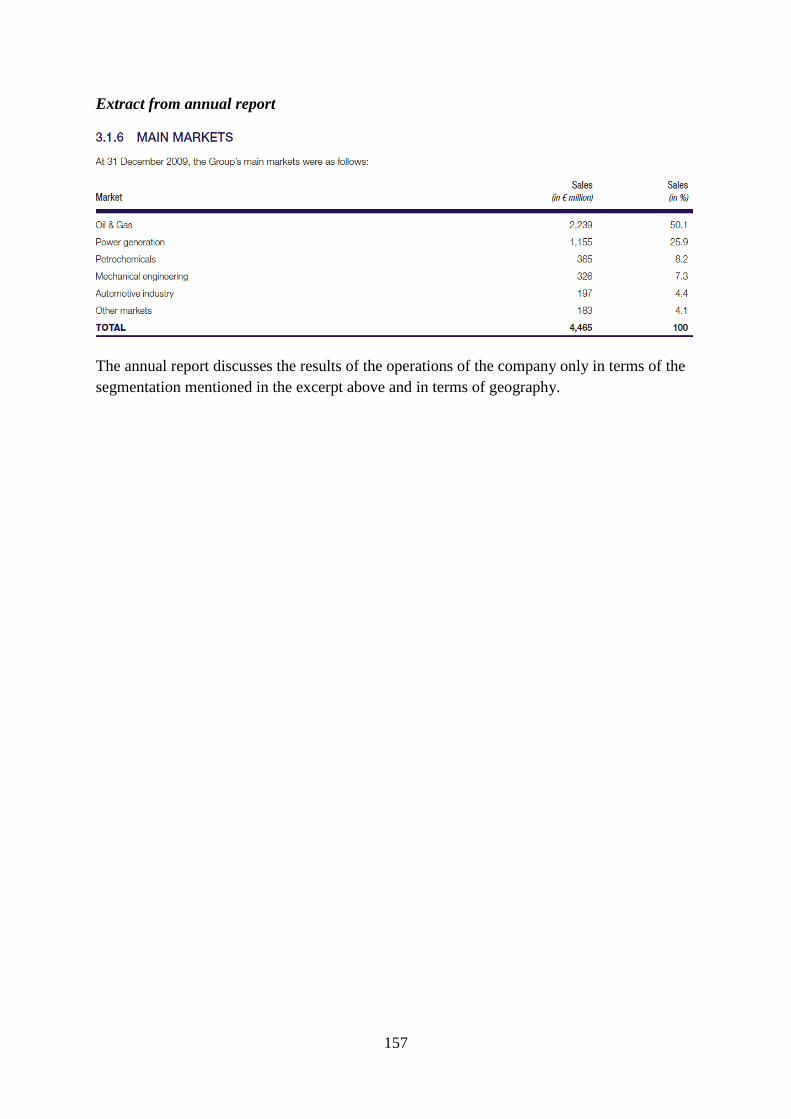
157
Extract from annual report
The annual report discusses the results of the operations of the company only in terms of the
segmentation mentioned in the excerpt above and in terms of geography.
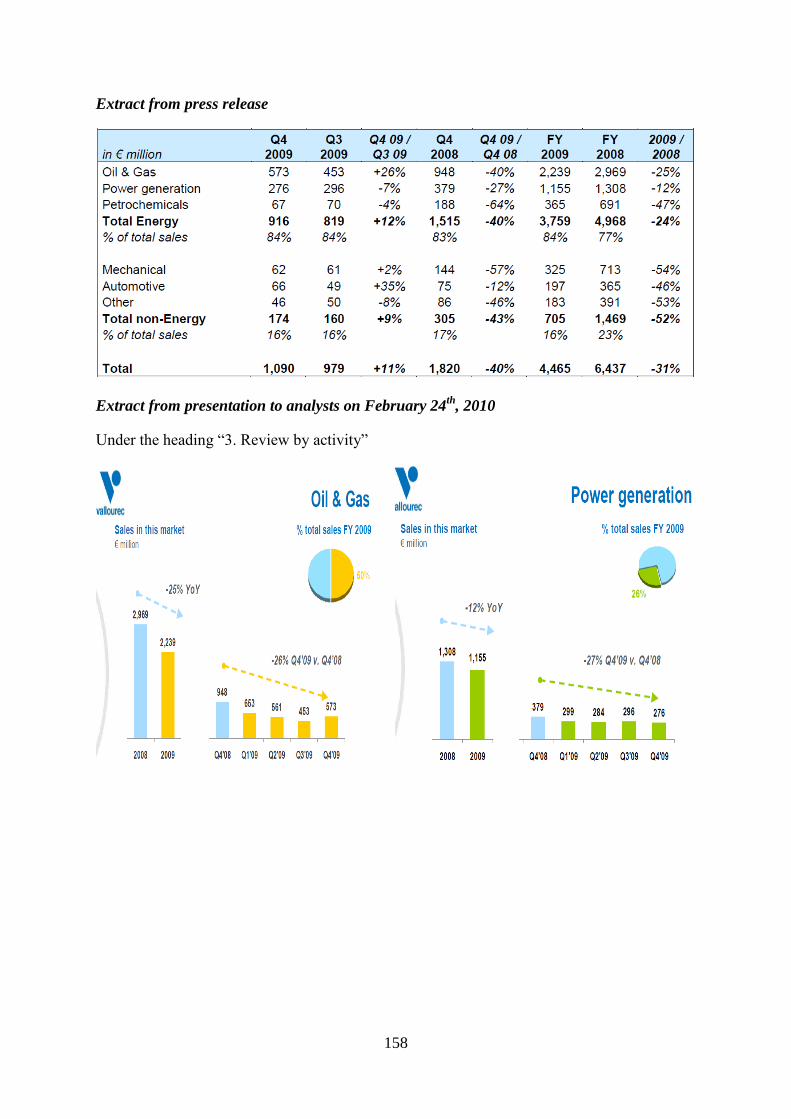
158
Extract from press release
Extract from presentation to analysts on February 24th
, 2010
Under the heading “3. Review by activity”
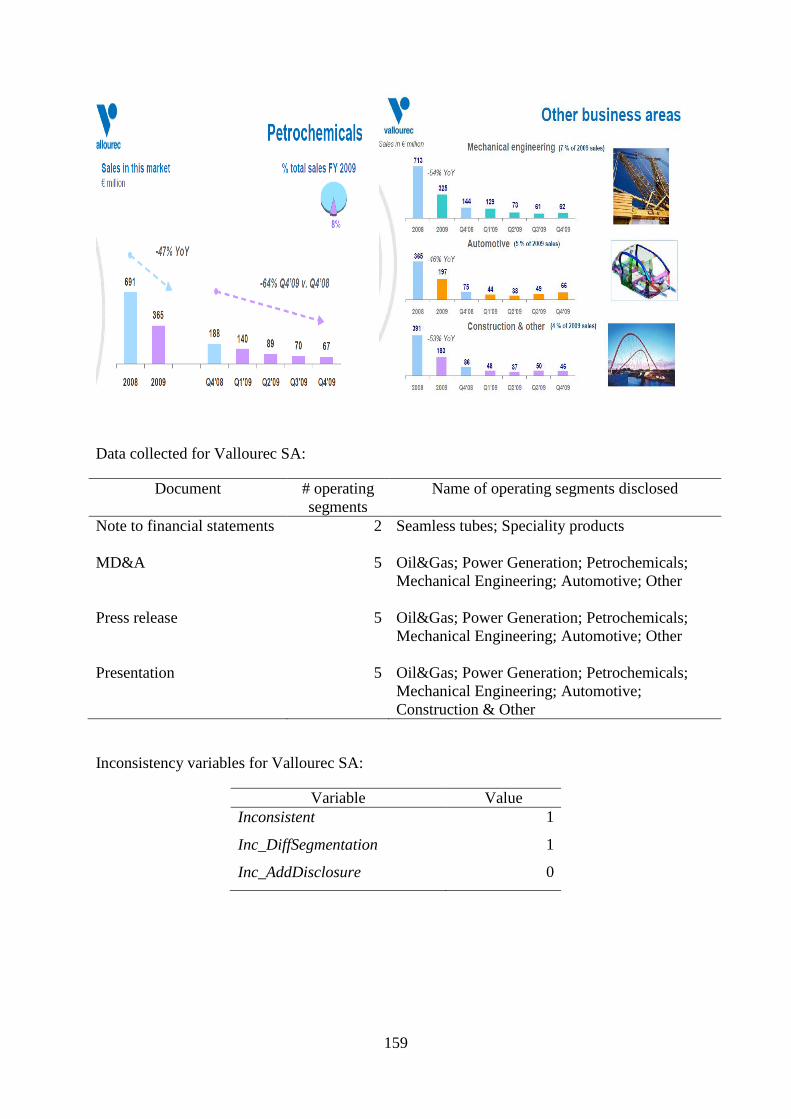
159
Data collected for Vallourec SA:
Document # operating
segments
Name of operating segments disclosed
Note to financial statements 2 Seamless tubes; Speciality products
MD&A 5 Oil&Gas; Power Generation; Petrochemicals;
Mechanical Engineering; Automotive; Other
Press release 5 Oil&Gas; Power Generation; Petrochemicals;
Mechanical Engineering; Automotive; Other
Presentation 5 Oil&Gas; Power Generation; Petrochemicals;
Mechanical Engineering; Automotive;
Construction & Other
Inconsistency variables for Vallourec SA:
Variable Value
Inconsistent 1
Inc_DiffSegmentation 1
Inc_AddDisclosure 0
160
Appendix II.B: Variable definitions
MAIN VARIABLES USED IN THE ANALYSES
Inconsistent 1 if operating segments are disclosed inconsistently across the
four documents (segment note to financial statements, MD&A,
earnings announcement press release, presentation to analysts),
and 0 otherwise. When a document is missing, the variable is
coded based on existing documents.
Inc_DiffSegmentation 1 if operating segments are disclosed inconsistently across the
four documents (segment note to financial statements, MD&A,
earnings announcement press release, presentation to analysts)
such that it suggests a different segmentation, and 0 otherwise.
When a document is missing, the variable is coded based on
existing documents.
Inc_AddDisclosure 1 if operating segments are disclosed inconsistently across the
four documents (segment note to financial statements, MD&A,
earnings announcement press release, presentation to analysts)
such that it further disaggregates one or more of the operating
segments, and 0 otherwise. When a document is missing, the
variable is coded based on existing documents.
Note_MDA_DiffSegmentation 1 if operating segments are disclosed inconsistently across the
segment note to financial statements and the MD&A such that it
suggests different segmentation bases, and 0 otherwise. The
variable is set to missing if the operating segments are not
mentioned in the MD&A.
Note_MDA_AddDisclosure 1 if operating segments are disclosed inconsistently across the
segment note to financial statements and the MD&A such that it
suggests additional disaggregation of the segments, and 0
otherwise. The variable is set to missing if the operating
segments are not mentioned in the MD&A.
MissingSegPresentation 1 if the presentation does not mention any information about the
firm’s segments, and 0 otherwise. The variable is set to missing if
the presentation is not available.
MissingSegPressRelease 1 if the earnings announcement press release does not mention
any information about the firm’s segments, and 0 otherwise. The
variable is set to missing if the press release is not available.
MissingSegBoth 1 if both the presentation and earnings announcement press
release do not mention any information about the firm’s
segments, and 0 otherwise. The variable is set to missing if any
of the two documents are not available.
VARIABLES FOR THE MAIN ANALYSES
ADR 1 if the company is also listed in the U.S., and 0 otherwise, based
on data from Thomson Reuters.
AnalystEffort Range-adjusted number of yearly and quarterly earnings
forecasts an analyst makes for a company before the 2010
earnings announcement date.
EQ Measure of earnings quality computed as the absolute value of
residuals from a (Dechow & Dichev, 2002) model computed in-
161
sample at the industry level. Higher values of absolute residuals
mean lower earnings quality. Data comes from Thomson
Reuters.
EqIssue Amount of equity issued divided by beginning of year market
capitalization, based on data from S&P Capital IQ.
FE Analyst-level earnings forecast error computed as the absolute
value of the difference between the last yearly forecast estimate
before the earnings announcement minus the actual earnings,
deflated by absolute actual earnings. Data is for 2010 and comes
from I/B/E/S. The variable is truncated at 95% to mitigate the
influence of extreme values. The variable is range-adjusted in-
sample as (ForecastError-minForecastError)/(maxForecastError-
minForecastError).
Guidance 1 if the earnings announcement press release at the end of fiscal
year 2009 contains an outlook section, and 0 otherwise.
LengthAR Natural logarithm of the number of pages in company i’s 2009
annual report.
LnAnalysts Natural logarithm of 1 plus the number of analysts covering the
company in 2010 orthogonalized on the natural logarithm of
market capitalization at the end of 2009, based on data from
I/B/E/S.
LnTA Natural logarithm of total assets for company i in 2009, based on
data from Thomson Reuters.
Loss 1 if net income before extraordinary items is below 0, and 0
otherwise, based on data from Thomson Reuters.
ReturnVolatility Standard deviation of weekly stock returns during 2009. Data
comes from Datastream.
Segments Number of operating segments as reported in the segment
information footnote to the 2009 financial statements (without
the “Other” segment). Data is hand-collected from the financial
statements.
SRQuality Natural logarithm of 2 plus the range of segment return-on-assets
adjusted for mean industry return-on-assets weighted by segment
assets to total assets at the end of 2009. Data comes from
Thomson Reuters Worldscope. Industry is defined at the three-
digit SIC code level. I use Log(2+x) to make the distribution
closer to the normal distribution following Berry (1987) and Liu
& Natarajan (2012).
SRQuantity The number of accounting items disclosed per segment in
company i’s segment information footnote. Data is hand-
collected from firms’ financial statements.
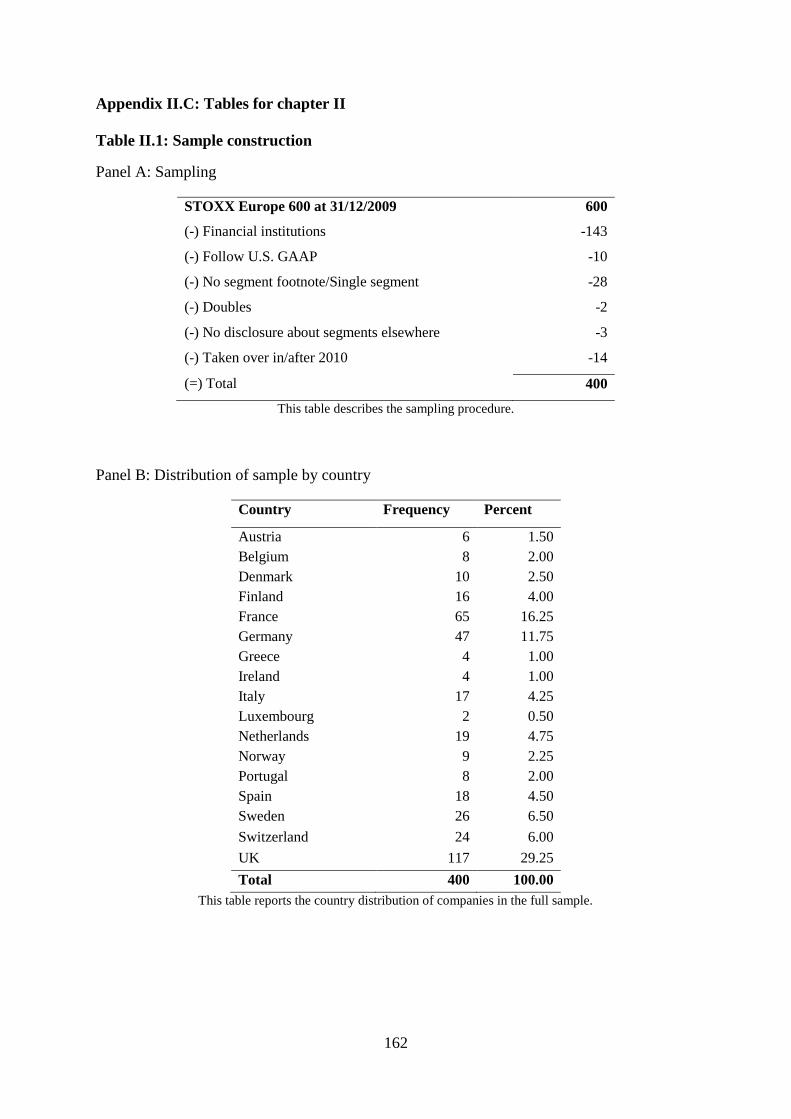
162
Appendix II.C: Tables for chapter II
Table II.1: Sample construction
Panel A: Sampling
STOXX Europe 600 at 31/12/2009 600
(-) Financial institutions -143
(-) Follow U.S. GAAP -10
(-) No segment footnote/Single segment -28
(-) Doubles -2
(-) No disclosure about segments elsewhere -3
(-) Taken over in/after 2010 -14
(=) Total 400
This table describes the sampling procedure.
Panel B: Distribution of sample by country
Country Frequency Percent
Austria 6 1.50
Belgium 8 2.00
Denmark 10 2.50
Finland 16 4.00
France 65 16.25
Germany 47 11.75
Greece 4 1.00
Ireland 4 1.00
Italy 17 4.25
Luxembourg 2 0.50
Netherlands 19 4.75
Norway 9 2.25
Portugal 8 2.00
Spain 18 4.50
Sweden 26 6.50
Switzerland 24 6.00
UK 117 29.25
Total 400 100.00
This table reports the country distribution of companies in the full sample.
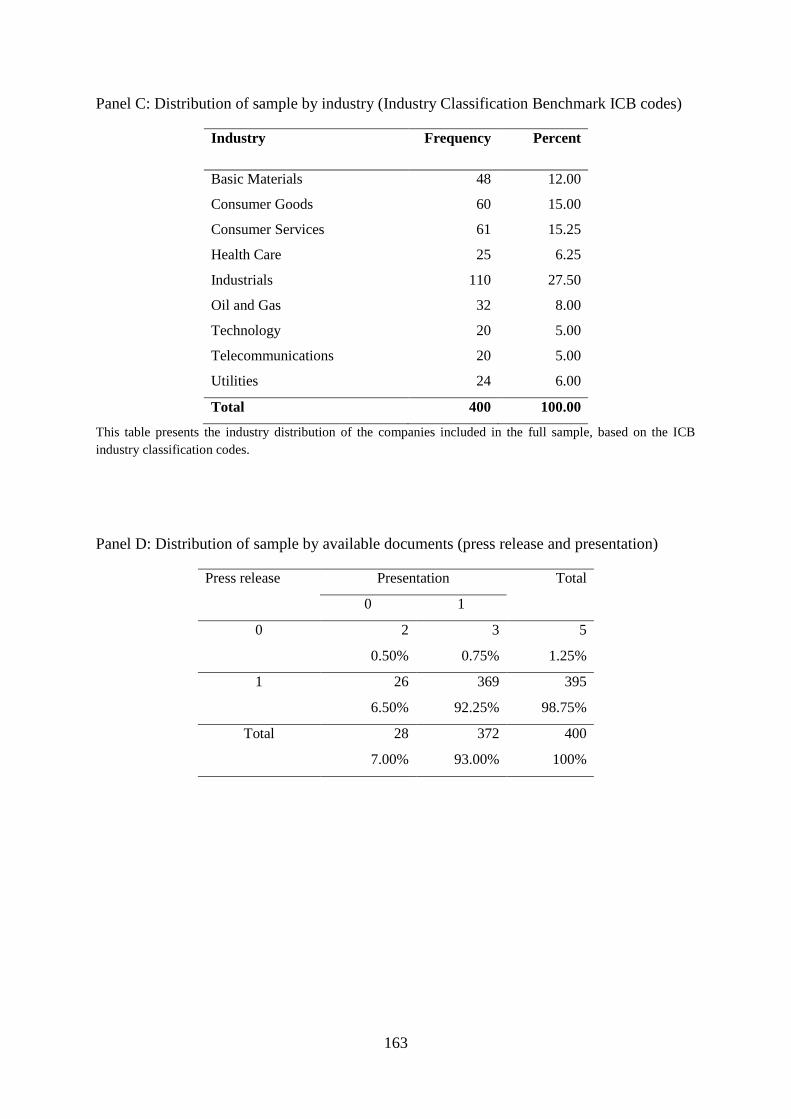
163
Panel C: Distribution of sample by industry (Industry Classification Benchmark ICB codes)
Industry Frequency Percent
Basic Materials 48 12.00
Consumer Goods 60 15.00
Consumer Services 61 15.25
Health Care 25 6.25
Industrials 110 27.50
Oil and Gas 32 8.00
Technology 20 5.00
Telecommunications 20 5.00
Utilities 24 6.00
Total 400 100.00
This table presents the industry distribution of the companies included in the full sample, based on the ICB
industry classification codes.
Panel D: Distribution of sample by available documents (press release and presentation)
Press release Presentation Total
0 1
0 2 3 5
0.50% 0.75% 1.25%
1 26 369 395
6.50% 92.25% 98.75%
Total 28 372 400
7.00% 93.00% 100%
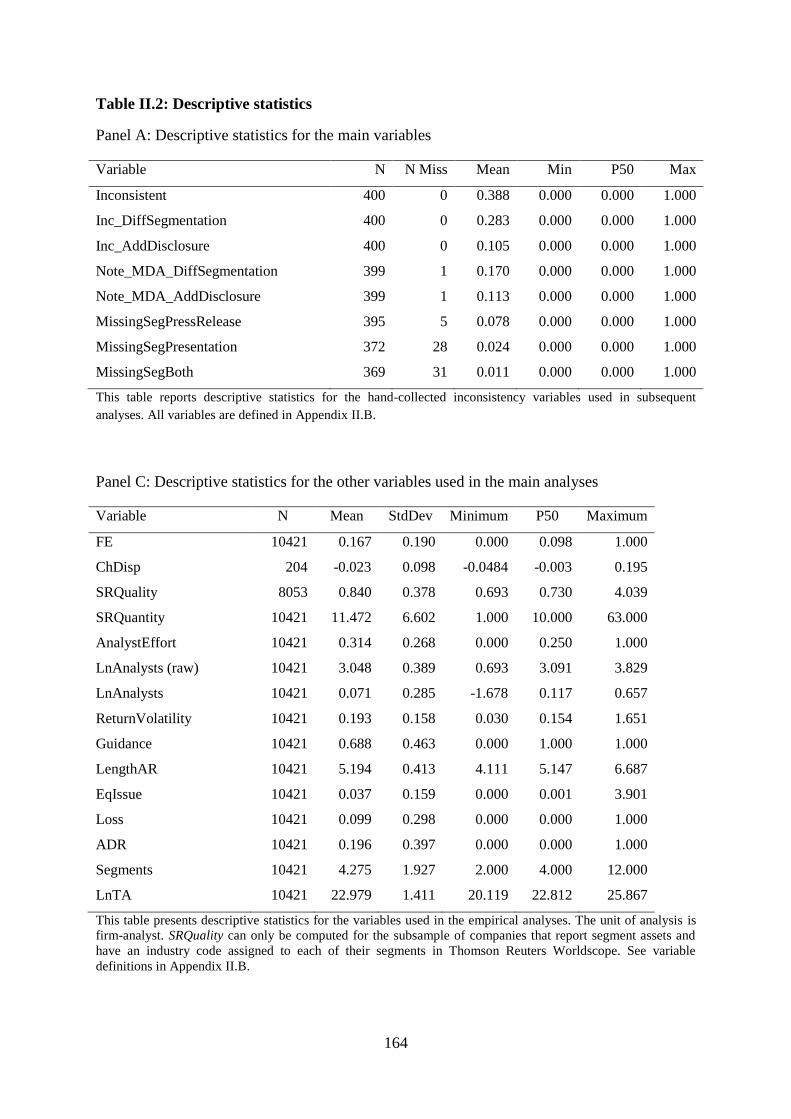
164
Table II.2: Descriptive statistics
Panel A: Descriptive statistics for the main variables
Variable N N Miss Mean Min P50 Max
Inconsistent 400 0 0.388 0.000 0.000 1.000
Inc_DiffSegmentation 400 0 0.283 0.000 0.000 1.000
Inc_AddDisclosure 400 0 0.105 0.000 0.000 1.000
Note_MDA_DiffSegmentation 399 1 0.170 0.000 0.000 1.000
Note_MDA_AddDisclosure 399 1 0.113 0.000 0.000 1.000
MissingSegPressRelease 395 5 0.078 0.000 0.000 1.000
MissingSegPresentation 372 28 0.024 0.000 0.000 1.000
MissingSegBoth 369 31 0.011 0.000 0.000 1.000
This table reports descriptive statistics for the hand-collected inconsistency variables used in subsequent
analyses. All variables are defined in Appendix II.B.
Panel C: Descriptive statistics for the other variables used in the main analyses
Variable N Mean StdDev Minimum P50 Maximum
FE 10421 0.167 0.190 0.000 0.098 1.000
ChDisp 204 -0.023 0.098 -0.0484 -0.003 0.195
SRQuality 8053 0.840 0.378 0.693 0.730 4.039
SRQuantity 10421 11.472 6.602 1.000 10.000 63.000
AnalystEffort 10421 0.314 0.268 0.000 0.250 1.000
LnAnalysts (raw) 10421 3.048 0.389 0.693 3.091 3.829
LnAnalysts 10421 0.071 0.285 -1.678 0.117 0.657
ReturnVolatility 10421 0.193 0.158 0.030 0.154 1.651
Guidance 10421 0.688 0.463 0.000 1.000 1.000
LengthAR 10421 5.194 0.413 4.111 5.147 6.687
EqIssue 10421 0.037 0.159 0.000 0.001 3.901
Loss 10421 0.099 0.298 0.000 0.000 1.000
ADR 10421 0.196 0.397 0.000 0.000 1.000
Segments 10421 4.275 1.927 2.000 4.000 12.000
LnTA 10421 22.979 1.411 20.119 22.812 25.867
This table presents descriptive statistics for the variables used in the empirical analyses. The unit of analysis is
firm-analyst. SRQuality can only be computed for the subsample of companies that report segment assets and
have an industry code assigned to each of their segments in Thomson Reuters Worldscope. See variable
definitions in Appendix II.B.
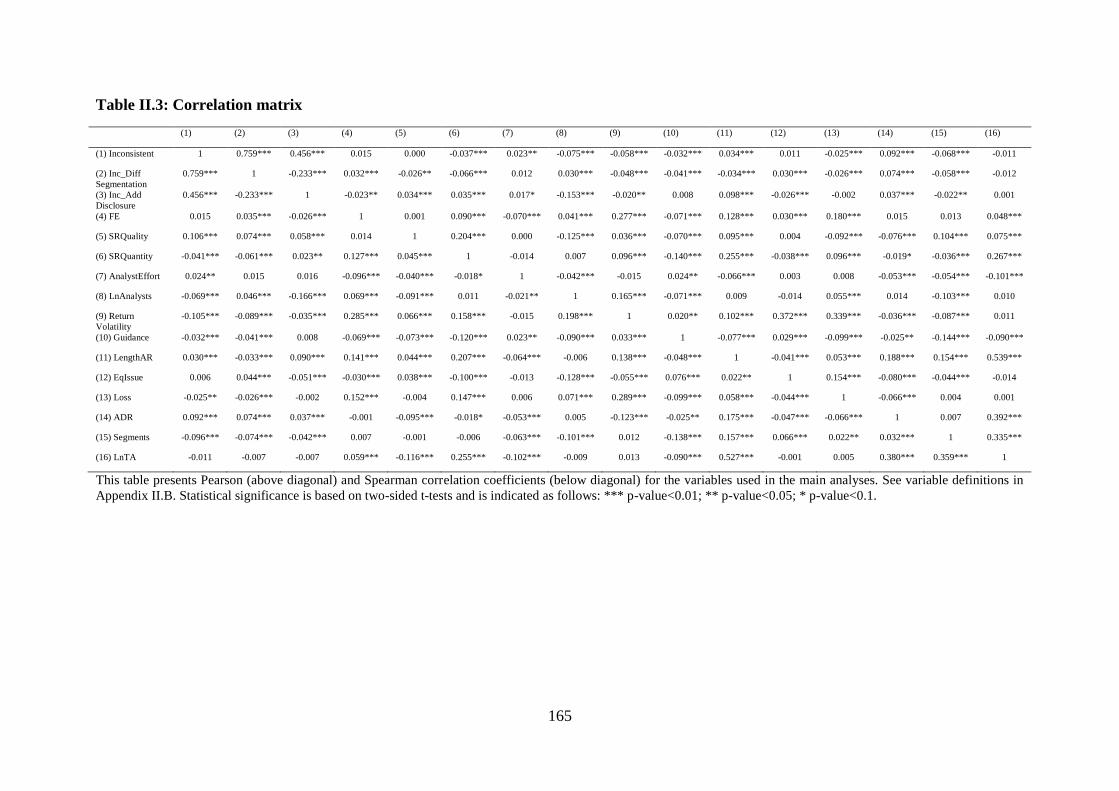
165
Table II.3: Correlation matrix
(1) (2) (3) (4) (5) (6) (7) (8) (9) (10) (11) (12) (13) (14) (15) (16)
(1) Inconsistent 1 0.759*** 0.456*** 0.015 0.000 -0.037*** 0.023** -0.075*** -0.058*** -0.032*** 0.034*** 0.011 -0.025*** 0.092*** -0.068*** -0.011
(2) Inc_Diff
Segmentation
0.759*** 1 -0.233*** 0.032*** -0.026** -0.066*** 0.012 0.030*** -0.048*** -0.041*** -0.034*** 0.030*** -0.026*** 0.074*** -0.058*** -0.012
(3) Inc_Add
Disclosure
0.456*** -0.233*** 1 -0.023** 0.034*** 0.035*** 0.017* -0.153*** -0.020** 0.008 0.098*** -0.026*** -0.002 0.037*** -0.022** 0.001
(4) FE 0.015 0.035*** -0.026*** 1 0.001 0.090*** -0.070*** 0.041*** 0.277*** -0.071*** 0.128*** 0.030*** 0.180*** 0.015 0.013 0.048***
(5) SRQuality 0.106*** 0.074*** 0.058*** 0.014 1 0.204*** 0.000 -0.125*** 0.036*** -0.070*** 0.095*** 0.004 -0.092*** -0.076*** 0.104*** 0.075***
(6) SRQuantity -0.041*** -0.061*** 0.023** 0.127*** 0.045*** 1 -0.014 0.007 0.096*** -0.140*** 0.255*** -0.038*** 0.096*** -0.019* -0.036*** 0.267***
(7) AnalystEffort 0.024** 0.015 0.016 -0.096*** -0.040*** -0.018* 1 -0.042*** -0.015 0.024** -0.066*** 0.003 0.008 -0.053*** -0.054*** -0.101***
(8) LnAnalysts -0.069*** 0.046*** -0.166*** 0.069*** -0.091*** 0.011 -0.021** 1 0.165*** -0.071*** 0.009 -0.014 0.055*** 0.014 -0.103*** 0.010
(9) Return
Volatility
-0.105*** -0.089*** -0.035*** 0.285*** 0.066*** 0.158*** -0.015 0.198*** 1 0.020** 0.102*** 0.372*** 0.339*** -0.036*** -0.087*** 0.011
(10) Guidance -0.032*** -0.041*** 0.008 -0.069*** -0.073*** -0.120*** 0.023** -0.090*** 0.033*** 1 -0.077*** 0.029*** -0.099*** -0.025** -0.144*** -0.090***
(11) LengthAR 0.030*** -0.033*** 0.090*** 0.141*** 0.044*** 0.207*** -0.064*** -0.006 0.138*** -0.048*** 1 -0.041*** 0.053*** 0.188*** 0.154*** 0.539***
(12) EqIssue 0.006 0.044*** -0.051*** -0.030*** 0.038*** -0.100*** -0.013 -0.128*** -0.055*** 0.076*** 0.022** 1 0.154*** -0.080*** -0.044*** -0.014
(13) Loss -0.025** -0.026*** -0.002 0.152*** -0.004 0.147*** 0.006 0.071*** 0.289*** -0.099*** 0.058*** -0.044*** 1 -0.066*** 0.004 0.001
(14) ADR 0.092*** 0.074*** 0.037*** -0.001 -0.095*** -0.018* -0.053*** 0.005 -0.123*** -0.025** 0.175*** -0.047*** -0.066*** 1 0.007 0.392***
(15) Segments -0.096*** -0.074*** -0.042*** 0.007 -0.001 -0.006 -0.063*** -0.101*** 0.012 -0.138*** 0.157*** 0.066*** 0.022** 0.032*** 1 0.335***
(16) LnTA -0.011 -0.007 -0.007 0.059*** -0.116*** 0.255*** -0.102*** -0.009 0.013 -0.090*** 0.527*** -0.001 0.005 0.380*** 0.359*** 1
This table presents Pearson (above diagonal) and Spearman correlation coefficients (below diagonal) for the variables used in the main analyses. See variable definitions in
Appendix II.B. Statistical significance is based on two-sided t-tests and is indicated as follows: *** p-value<0.01; ** p-value<0.05; * p-value<0.1.
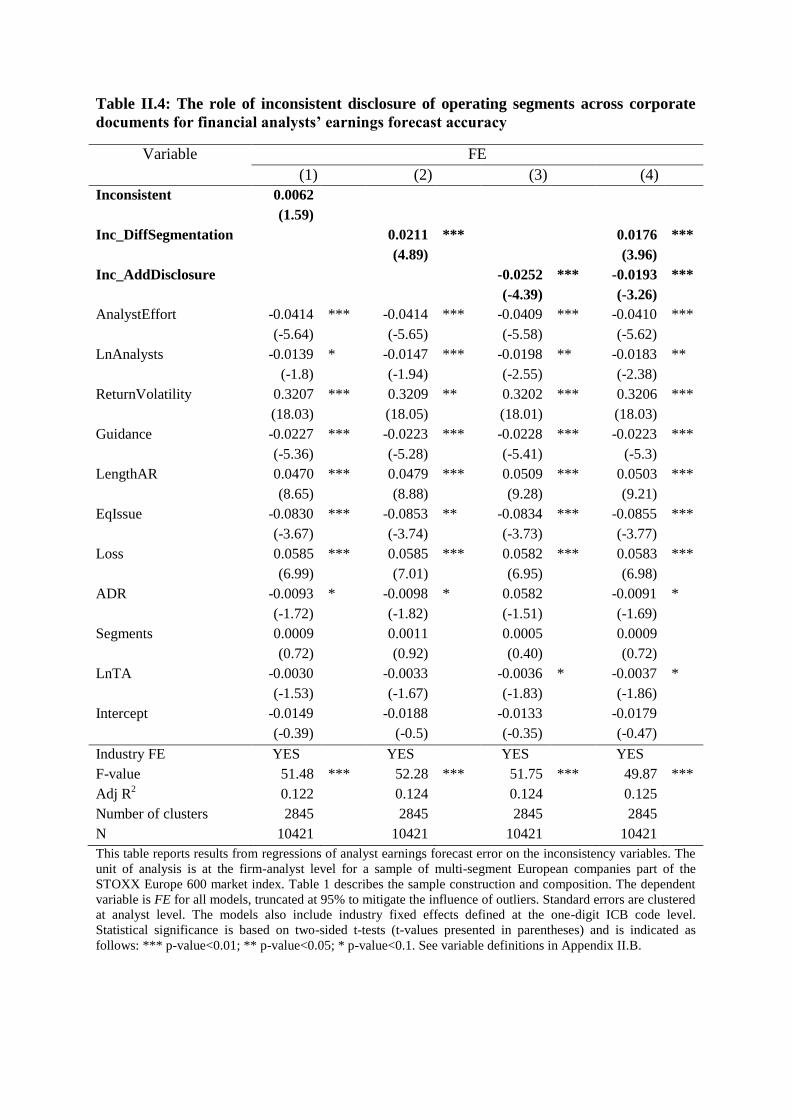
Table II.4: The role of inconsistent disclosure of operating segments across corporate
documents for financial analysts’ earnings forecast accuracy
Variable FE
(1) (2) (3) (4)
Inconsistent 0.0062
(1.59)
Inc_DiffSegmentation 0.0211 *** 0.0176 ***
(4.89) (3.96)
Inc_AddDisclosure -0.0252 *** -0.0193 ***
(-4.39) (-3.26)
AnalystEffort -0.0414 *** -0.0414 *** -0.0409 *** -0.0410 ***
(-5.64) (-5.65) (-5.58) (-5.62)
LnAnalysts -0.0139 * -0.0147 *** -0.0198 ** -0.0183 **
(-1.8) (-1.94) (-2.55) (-2.38)
ReturnVolatility 0.3207 *** 0.3209 ** 0.3202 *** 0.3206 ***
(18.03) (18.05) (18.01) (18.03)
Guidance -0.0227 *** -0.0223 *** -0.0228 *** -0.0223 ***
(-5.36) (-5.28) (-5.41) (-5.3)
LengthAR 0.0470 *** 0.0479 *** 0.0509 *** 0.0503 ***
(8.65) (8.88) (9.28) (9.21)
EqIssue -0.0830 *** -0.0853 ** -0.0834 *** -0.0855 ***
(-3.67) (-3.74) (-3.73) (-3.77)
Loss 0.0585 *** 0.0585 *** 0.0582 *** 0.0583 ***
(6.99) (7.01) (6.95) (6.98)
ADR -0.0093 * -0.0098 * 0.0582 -0.0091 *
(-1.72) (-1.82) (-1.51) (-1.69)
Segments 0.0009 0.0011 0.0005 0.0009
(0.72) (0.92) (0.40) (0.72)
LnTA -0.0030 -0.0033 -0.0036 * -0.0037 *
(-1.53) (-1.67) (-1.83) (-1.86)
Intercept -0.0149 -0.0188 -0.0133 -0.0179
(-0.39) (-0.5) (-0.35) (-0.47)
Industry FE YES YES YES YES
F-value 51.48 *** 52.28 *** 51.75 *** 49.87 ***
Adj R2 0.122 0.124 0.124 0.125
Number of clusters 2845 2845 2845 2845
N 10421 10421 10421 10421
This table reports results from regressions of analyst earnings forecast error on the inconsistency variables. The
unit of analysis is at the firm-analyst level for a sample of multi-segment European companies part of the
STOXX Europe 600 market index. Table 1 describes the sample construction and composition. The dependent
variable is FE for all models, truncated at 95% to mitigate the influence of outliers. Standard errors are clustered
at analyst level. The models also include industry fixed effects defined at the one-digit ICB code level.
Statistical significance is based on two-sided t-tests (t-values presented in parentheses) and is indicated as
follows: *** p-value<0.01; ** p-value<0.05; * p-value<0.1. See variable definitions in Appendix II.B.
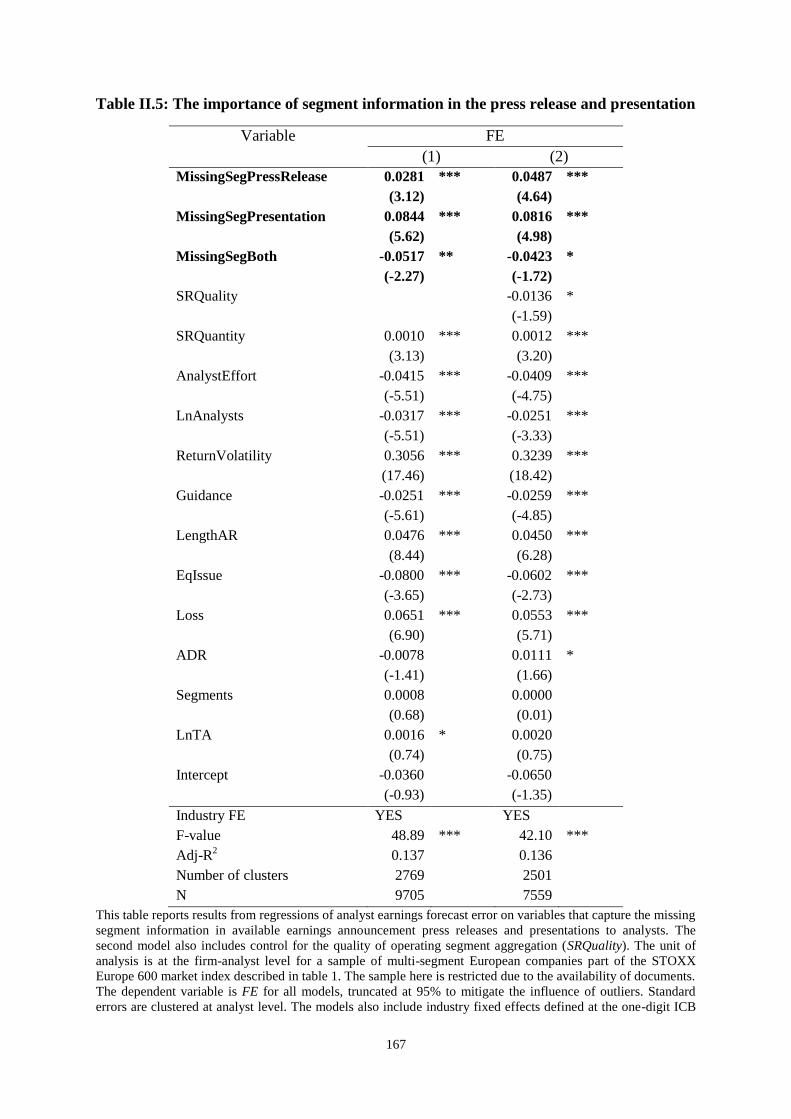
167
Table II.5: The importance of segment information in the press release and presentation
Variable FE
(1) (2)
MissingSegPressRelease 0.0281 *** 0.0487 ***
(3.12) (4.64)
MissingSegPresentation 0.0844 *** 0.0816 ***
(5.62) (4.98)
MissingSegBoth -0.0517 ** -0.0423 *
(-2.27) (-1.72)
SRQuality -0.0136 *
(-1.59)
SRQuantity 0.0010 *** 0.0012 ***
(3.13) (3.20)
AnalystEffort -0.0415 *** -0.0409 ***
(-5.51) (-4.75)
LnAnalysts -0.0317 *** -0.0251 ***
(-5.51) (-3.33)
ReturnVolatility 0.3056 *** 0.3239 ***
(17.46) (18.42)
Guidance -0.0251 *** -0.0259 ***
(-5.61) (-4.85)
LengthAR 0.0476 *** 0.0450 ***
(8.44) (6.28)
EqIssue -0.0800 *** -0.0602 ***
(-3.65) (-2.73)
Loss 0.0651 *** 0.0553 ***
(6.90) (5.71)
ADR -0.0078 0.0111 *
(-1.41) (1.66)
Segments 0.0008 0.0000
(0.68) (0.01)
LnTA 0.0016 * 0.0020
(0.74) (0.75)
Intercept -0.0360 -0.0650
(-0.93) (-1.35)
Industry FE YES YES
F-value 48.89 *** 42.10 ***
Adj-R2 0.137 0.136
Number of clusters 2769 2501
N 9705 7559
This table reports results from regressions of analyst earnings forecast error on variables that capture the missing
segment information in available earnings announcement press releases and presentations to analysts. The
second model also includes control for the quality of operating segment aggregation (SRQuality). The unit of
analysis is at the firm-analyst level for a sample of multi-segment European companies part of the STOXX
Europe 600 market index described in table 1. The sample here is restricted due to the availability of documents.
The dependent variable is FE for all models, truncated at 95% to mitigate the influence of outliers. Standard
errors are clustered at analyst level. The models also include industry fixed effects defined at the one-digit ICB

168
code level. Statistical significance is based on two-sided t-tests (t-values presented in parentheses) and is
indicated as follows: *** p-value<0.01; ** p-value<0.05; * p-value<0.1. See variable definitions in Appendix
II.B.
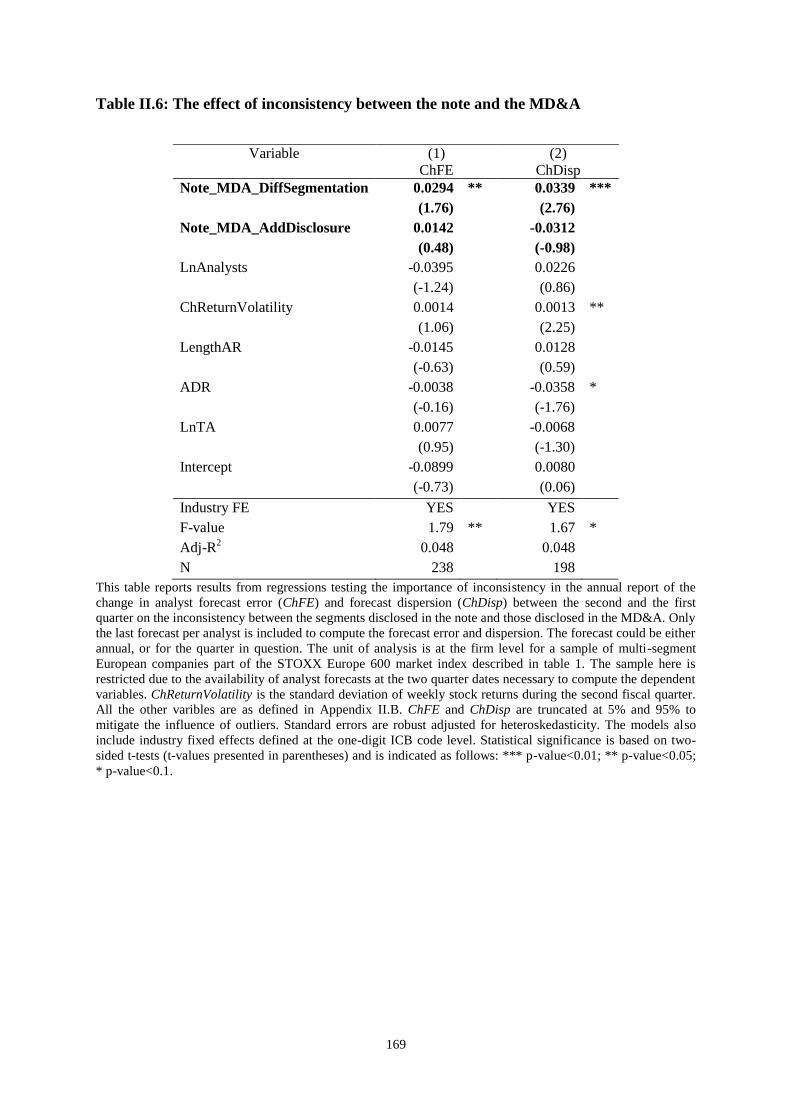
169
Table II.6: The effect of inconsistency between the note and the MD&A
Variable (1)
ChFE
(2)
ChDisp
Note_MDA_DiffSegmentation 0.0294 ** 0.0339 ***
(1.76) (2.76)
Note_MDA_AddDisclosure 0.0142 -0.0312
(0.48) (-0.98)
LnAnalysts -0.0395 0.0226
(-1.24) (0.86)
ChReturnVolatility 0.0014 0.0013 **
(1.06) (2.25)
LengthAR -0.0145 0.0128
(-0.63) (0.59)
ADR -0.0038 -0.0358 *
(-0.16) (-1.76)
LnTA 0.0077 -0.0068
(0.95) (-1.30)
Intercept -0.0899 0.0080
(-0.73) (0.06)
Industry FE YES YES
F-value 1.79 ** 1.67 *
Adj-R2 0.048 0.048
N 238 198
This table reports results from regressions testing the importance of inconsistency in the annual report of the
change in analyst forecast error (ChFE) and forecast dispersion (ChDisp) between the second and the first
quarter on the inconsistency between the segments disclosed in the note and those disclosed in the MD&A. Only
the last forecast per analyst is included to compute the forecast error and dispersion. The forecast could be either
annual, or for the quarter in question. The unit of analysis is at the firm level for a sample of multi-segment
European companies part of the STOXX Europe 600 market index described in table 1. The sample here is
restricted due to the availability of analyst forecasts at the two quarter dates necessary to compute the dependent
variables. ChReturnVolatility is the standard deviation of weekly stock returns during the second fiscal quarter.
All the other varibles are as defined in Appendix II.B. ChFE and ChDisp are truncated at 5% and 95% to
mitigate the influence of outliers. Standard errors are robust adjusted for heteroskedasticity. The models also
include industry fixed effects defined at the one-digit ICB code level. Statistical significance is based on two-
sided t-tests (t-values presented in parentheses) and is indicated as follows: *** p-value<0.01; ** p-value<0.05;
* p-value<0.1.
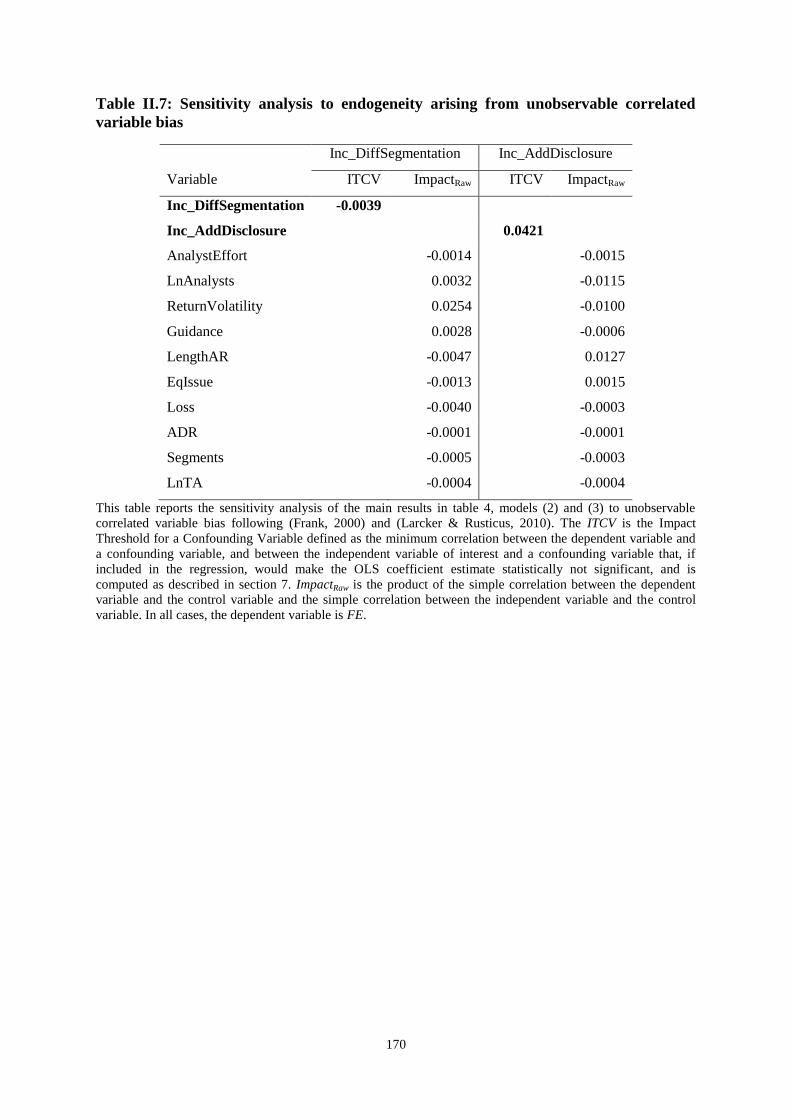
170
Table II.7: Sensitivity analysis to endogeneity arising from unobservable correlated
variable bias
Inc_DiffSegmentation Inc_AddDisclosure
Variable ITCV ImpactRaw ITCV ImpactRaw
Inc_DiffSegmentation -0.0039
Inc_AddDisclosure 0.0421
AnalystEffort -0.0014 -0.0015
LnAnalysts 0.0032 -0.0115
ReturnVolatility 0.0254 -0.0100
Guidance 0.0028 -0.0006
LengthAR -0.0047 0.0127
EqIssue -0.0013 0.0015
Loss -0.0040 -0.0003
ADR -0.0001 -0.0001
Segments -0.0005 -0.0003
LnTA -0.0004 -0.0004
This table reports the sensitivity analysis of the main results in table 4, models (2) and (3) to unobservable
correlated variable bias following (Frank, 2000) and (Larcker & Rusticus, 2010). The ITCV is the Impact
Threshold for a Confounding Variable defined as the minimum correlation between the dependent variable and
a confounding variable, and between the independent variable of interest and a confounding variable that, if
included in the regression, would make the OLS coefficient estimate statistically not significant, and is
computed as described in section 7. ImpactRaw is the product of the simple correlation between the dependent
variable and the control variable and the simple correlation between the independent variable and the control
variable. In all cases, the dependent variable is FE.
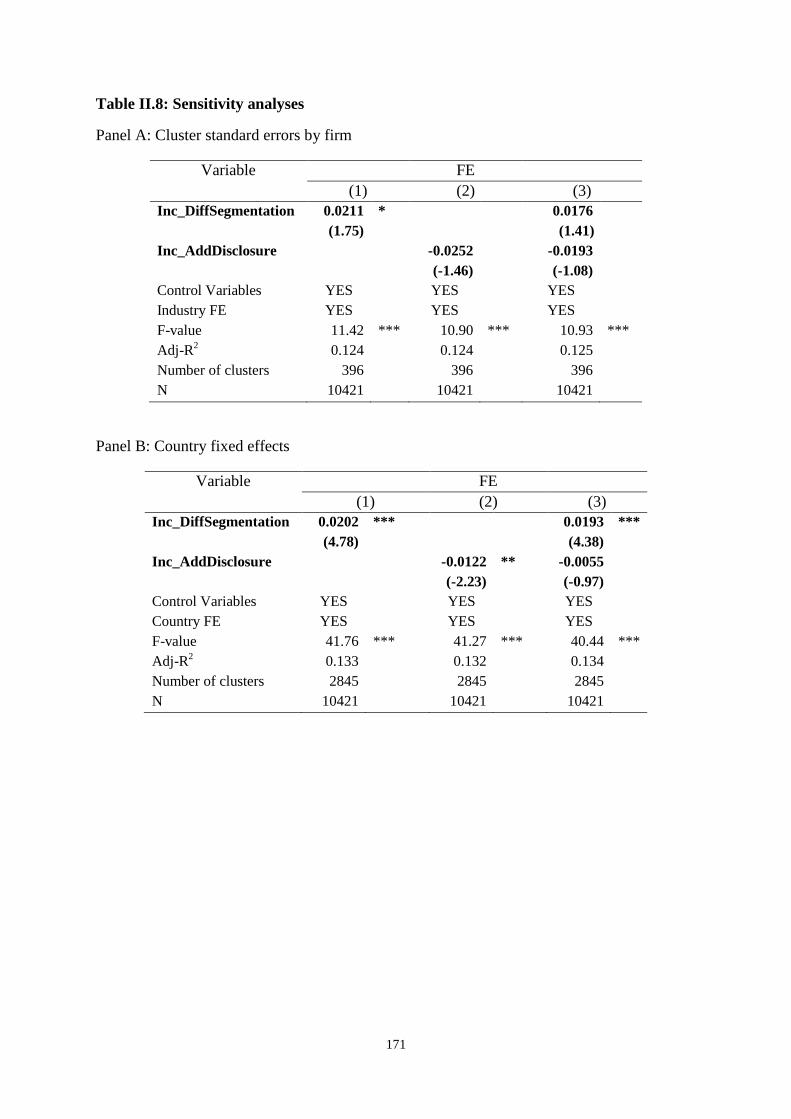
171
Table II.8: Sensitivity analyses
Panel A: Cluster standard errors by firm
Variable FE
(1) (2) (3)
Inc_DiffSegmentation 0.0211 * 0.0176
(1.75) (1.41)
Inc_AddDisclosure -0.0252 -0.0193
(-1.46) (-1.08)
Control Variables YES YES YES
Industry FE YES YES YES
F-value 11.42 *** 10.90 *** 10.93 ***
Adj-R2 0.124 0.124 0.125
Number of clusters 396 396 396
N 10421 10421 10421
Panel B: Country fixed effects
Variable FE
(1) (2) (3)
Inc_DiffSegmentation 0.0202 *** 0.0193 ***
(4.78) (4.38)
Inc_AddDisclosure -0.0122 ** -0.0055
(-2.23) (-0.97)
Control Variables YES YES YES
Country FE YES YES YES
F-value 41.76 *** 41.27 *** 40.44 ***
Adj-R2 0.133 0.132 0.134
Number of clusters 2845 2845 2845
N 10421 10421 10421
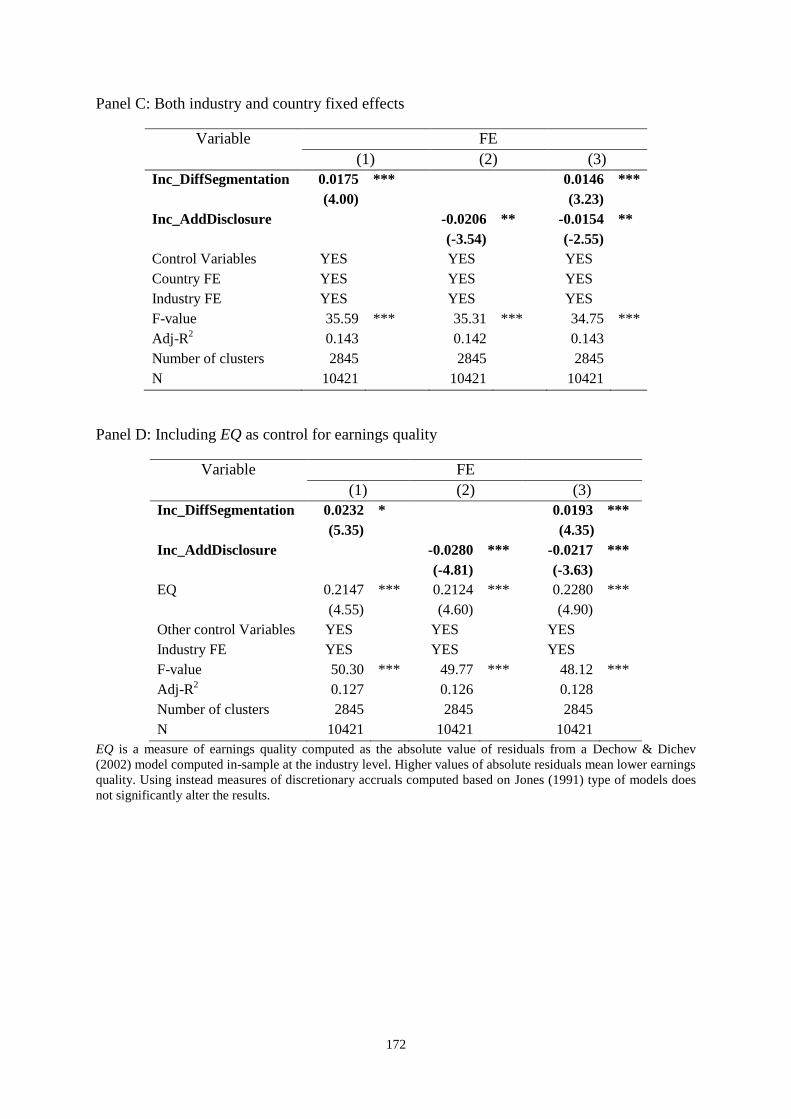
172
Panel C: Both industry and country fixed effects
Variable FE
(1) (2) (3)
Inc_DiffSegmentation 0.0175 *** 0.0146 ***
(4.00) (3.23)
Inc_AddDisclosure -0.0206 ** -0.0154 **
(-3.54) (-2.55)
Control Variables YES YES YES
Country FE YES YES YES
Industry FE YES YES YES
F-value 35.59 *** 35.31 *** 34.75 ***
Adj-R2 0.143 0.142 0.143
Number of clusters 2845 2845 2845
N 10421 10421 10421
Panel D: Including EQ as control for earnings quality
Variable FE
(1) (2) (3)
Inc_DiffSegmentation 0.0232 * 0.0193 ***
(5.35) (4.35)
Inc_AddDisclosure -0.0280 *** -0.0217 ***
(-4.81) (-3.63)
EQ 0.2147 *** 0.2124 *** 0.2280 ***
(4.55) (4.60) (4.90)
Other control Variables YES YES YES
Industry FE YES YES YES
F-value 50.30 *** 49.77 *** 48.12 ***
Adj-R2 0.127 0.126 0.128
Number of clusters 2845 2845 2845
N 10421 10421 10421
EQ is a measure of earnings quality computed as the absolute value of residuals from a Dechow & Dichev
(2002) model computed in-sample at the industry level. Higher values of absolute residuals mean lower earnings
quality. Using instead measures of discretionary accruals computed based on Jones (1991) type of models does
not significantly alter the results.

173
Panel E: Restrict sample to companies that have segment disclosure in all four documents
Panel F: Restricted sample analyses to control for the quality of operating segment
aggregation (SRQuality) and the number of accounting line items (SRQuantity) disclosed in
the note to financial statements
Variable FE
(1) (2) (3)
Inc_DiffSegmentation 0.0184 *** 0.0154 ***
(3.58) (2.92)
Inc_AddDisclosure -0.0209 *** -0.0161 **
(-3.04) (-2.28)
SRQuality -0.0120 -0.0106 -0.0112
(-1.64) (-1.45) (-1.52)
SRQuantity 0.0013 *** 0.0012 *** 0.0012 ***
(3.43) (3.12) (3.31)
Other Control Variables YES YES YES
Industry FE YES YES YES
F-value 41.8 *** 41.89 *** 40.24 ***
Adj-R2 0.124 0.124 0.125
Number of clusters 2599 2599 2599
N 8053 8053 8053
Variable FE
(1) (2) (3)
Inc_DiffSegmentation 0.0190 *** 0.0159 ***
(4.24) (3.45)
Inc_AddDisclosure -0.0211 *** -0.0157 ***
(-3.62) (-2.63)
Control Variables YES YES YES
Industry FE YES YES YES
F-value 43.54 *** 42.97 *** 41.35 ***
Adj-R2 0.117 0.116 0.118
Number of clusters 2735 2735 2735
N 9458 9458 9458
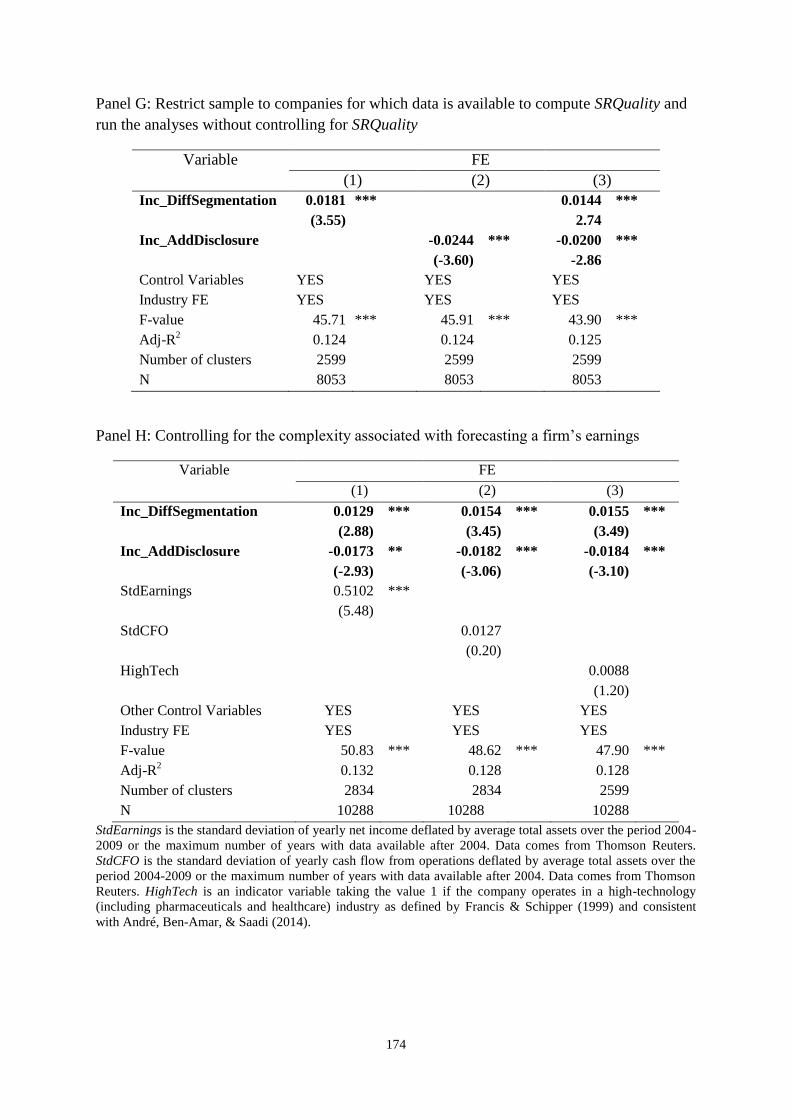
174
Panel G: Restrict sample to companies for which data is available to compute SRQuality and
run the analyses without controlling for SRQuality
Variable FE
(1) (2) (3)
Inc_DiffSegmentation 0.0181 *** 0.0144 ***
(3.55) 2.74
Inc_AddDisclosure -0.0244 *** -0.0200 ***
(-3.60) -2.86
Control Variables YES YES YES
Industry FE YES YES YES
F-value 45.71 *** 45.91 *** 43.90 ***
Adj-R2 0.124 0.124 0.125
Number of clusters 2599 2599 2599
N 8053 8053 8053
Panel H: Controlling for the complexity associated with forecasting a firm’s earnings
Variable FE
(1) (2) (3)
Inc_DiffSegmentation 0.0129 *** 0.0154 *** 0.0155 ***
(2.88) (3.45) (3.49)
Inc_AddDisclosure -0.0173 ** -0.0182 *** -0.0184 ***
(-2.93) (-3.06) (-3.10)
StdEarnings 0.5102 ***
(5.48)
StdCFO 0.0127
(0.20)
HighTech 0.0088
(1.20)
Other Control Variables YES YES YES
Industry FE YES YES YES
F-value 50.83 *** 48.62 *** 47.90 ***
Adj-R2 0.132 0.128 0.128
Number of clusters 2834 2834 2599
N 10288 10288 10288
StdEarnings is the standard deviation of yearly net income deflated by average total assets over the period 2004-
2009 or the maximum number of years with data available after 2004. Data comes from Thomson Reuters.
StdCFO is the standard deviation of yearly cash flow from operations deflated by average total assets over the
period 2004-2009 or the maximum number of years with data available after 2004. Data comes from Thomson
Reuters. HighTech is an indicator variable taking the value 1 if the company operates in a high-technology
(including pharmaceuticals and healthcare) industry as defined by Francis & Schipper (1999) and consistent
with André, Ben-Amar, & Saadi (2014).

Chapter III
Management Guidance at the Segment Level
Abstract
Managers add information to their earnings guidance to justify, explain, or contextualize their
forecasts. I identify segment-level guidance (SLG) as a type of disaggregated information
that multi-segment firms provide with their management guidance and investigate its
usefulness for financial analysts’ earnings forecasting accuracy, and the influence it has on
managers’ earnings fixation. I further characterize the level of precision (point and range,
maximum or minimum estimate, or simply narrative) and of disaggregation of SLG. Results
suggest that companies in high tech industries known for increased uncertainty in future
performance are less likely to provide SLG, and that SLG is associated with better
forecasting accuracy. However, while providing more item-disaggregated SLG improves
accuracy, increased precision of SLG has no impact on forecast accuracy. From the
manager’s point of view, SLG creates incentives to engage in earnings management, and the
more precise the SLG is, the greater the incentive. In contrast, more item-disaggregated SLG
discourages earnings management, perhaps by improving monitoring. In a context where
qualitative, narrative, and disaggregated guidance is regarded as a solution to avoid earnings
fixation and short termism, understanding which types of information achieve this goal, and
how, is relevant for managers, investors, and regulators alike.

176
Résumé
Je considère les prévisions au niveau sectoriel (PNS) comme un type d'information désagrégé
que les entreprises fournissent ensemble avec leur stratégie de gestion. J’examine l’utilité de
cette information pour l’exactitude des prévisions de résultat par les analystes ainsi que
l’impact de cette information sur la manipulation du résultat. Je constate que les entreprises
de haute technologie réputées pour l’incertitude supplémentaire liée à profitabilité sont moins
susceptibles de fournir des PNS et que le PNS est associé à une prévision améliorée.
Cependant, alors que la communication de davantage de PNS désagrégé par secteur a
tendance à améliorer la précision, plus de précision ne semble pas avoir d’importance. Du
point de vue des cadres dirigeants, les PNS les incitent à manipuler le résultat comptable,
mais le PNS désagrégé par poste semble décourager la manipulation, fort probablement due à
une surveillance supplémentaire. Dans un contexte où une orientation narrative et désagrégée
est considérée comme la solution pour empêcher la vision à court terme, comprendre quel
type d'information permet d’atteindre cet objectif, et de quelle manière, est tout autant
pertinent pour les cadres dirigeants, les investisseurs et les régulateurs.
177
III.1 Introduction
Managers of listed companies issue guidance on the short or mid-term performance of
their companies as part of their communications with investors. Management guidance takes
the form of a forecast of the bottom-line profit measure, of various accounting items
(Lansford et al., 2013), and/or other non-financial measures (Brazel, Lail, & Pagach, 2013)
that could come in different forms (e.g., point, range, minimum, maximum, narrative). Prior
literature documents that managers often accompany their forecasts with supplementary
statements (Hutton et al., 2003) that could be used to provide a richer context for the forecast,
or as a way to point to the causes that led to certain expectations (Baginski et al., 2000). I
complement this literature by specifically examining the management guidance made at the
segment-level. I investigate (1) the characteristics of firms that provide segment-level
guidance (henceforth, SLG), (2) which characteristics of SLG, disaggregation and/or
precision, matter more, and (3) whether segment-level guidance contributes to or alleviates
managers’ earnings fixation.
I focus on segment-related statements in the management guidance for two reasons.
Segment information is essential for investors to understand the nature and diversification
strategy of large companies and to assess the sources of consolidated earnings. For multi-
segment companies, analysts first forecast segment-level earnings and then aggregate them at
the entity level. This practice has been previously discussed in the literature (You, 2014) and
confirmed by interviews with financial analysts, but is also apparent from the contents of
analyst reports, some of which also contain the segment-level forecasts.1 A large body of
literature finds that historical information on segments is useful for predicting future
consolidated earnings (e.g., Behn et al., 2002; Berger & Hann, 2003; Botosan & Stanford,
1 Interviews were conducted with a former Morgan Stanley equity financial analyst and with a credit analyst
currently working for OFI Asset Management in Paris, France in April 2014. Transcripts are available upon
request.

178
2005; Collins, 1976; Hope et al., 2008b, 2006; Kinney Jr., 1971; Tse, 1989). Comparatively,
we know little about the role of segment information when it is forward-looking. Prior
research has mainly focused on the segment information disclosed in the notes to financial
statements which is essentially historical in nature. An exception is Hutton et al. (2003) who
examine a range of supplementary disclosures that managers make together with the earnings
forecasts, including those related to segment information which they classify as “soft talk
disclosures.” Their goal is to distinguish the role of qualitative, soft-talk statements versus
verifiable forward-looking statements for the credibility of good versus bad news forecasts.
Our paper contributes to this literature by investigating in more detail the role of segment
information when it is forward-looking and disclosed outside the notes to financial
statements, in the management guidance section of the earnings announcement press release.
I also contribute to the literature on management guidance by more closely looking
into European companies’ strategies for providing guidance. Anecdotal evidence and surveys
of investor relations professionals suggest that European companies have a different approach
to management guidance compared to U.S. firms. Roach (2013b) reports that “65% of UK
companies in the FTSE 100 provide qualitative guidance in the form of commentaries on
EPS, revenue, profit, or other operational metrics, and only 9% take the U.S. approach in
providing quantitative EPS guidance.” The chairman of the IR Society remarked that UK
companies are “a lot less prescriptive and specific [in their guidance] compared to U.S. firms
and that directional and qualitative guidance is as effective as quantitative profit forecasts.”
(Roach (2013b) citing John Dawson, chairman of the IR Society). There is very scarce
evidence on management guidance outside the US. As the IR Society suggests, guidance
strategies of European firms are different from those of U.S. firms, meaning that the
generalizability of US-based management guidance research results to the European setting
should be at least questioned.
179
For a sample of multi-segment European companies included in the STOXX Europe
600 I collect the 2009 earnings announcement press releases. By reading through the press
release I identify the management guidance section and code whether it contains any
statements related to the operating segments of the company, which I call SLG.2 I also code
the precision with which SLG is provided – point, range, estimate, or narrative -, and what
segment-level accounting items are forecasted for the next fiscal year in order to obtain a
measure of item disaggregation of SLG similar to the disaggregated earnings guidance in
Lansford et al. (2013).
I first examine whether segment-level guidance is useful information for financial
analysts beyond the forecasted accounting numbers. A large stream of literature starting with
Penman (1980) shows that voluntary earnings forecasts have information content beyond the
information contained in prior-year annual earnings. In addition, Sobel (1985) shows that the
usefulness of information depends on its relevance, i.e., surprise, and credibility, i.e.,
believability. Managers can increase the credibility of their reports (1) by building a
reputation through various choices such as forecast frequency, specificity (Bhojraj, Libby, &
Yang, 2012), and consistency in time (Tang, 2014) or (2) by disclosing additional details
supporting the contents (Dye, 1986) such as disaggregating earnings forecasts into other
accounting items (Lansford et al., 2013). Somewhat similar to the item disaggregation of
earnings guidance, SLG can be regarded as the disaggregation of management guidance
along the segment dimension. I find that providing SLG helps analysts make more accurate
forecasts, even after controlling for the item disaggregation of the earnings guidance as per
Lansford et al. (2013). I also aim to understand under what conditions SLG is useful to
analysts. I find that the precision of the SLG is not significantly associated with analysts’
2 The management guidance section could have a variety of names, such as outlook, prospects, or forecasts. I
take all of these into consideration.
180
accuracy, but the higher the score for the item disaggregation of SLG, the more accurate
analysts are.
The evidence in Lansford et al. (2013) also suggests that item disaggregation of
earnings guidance reduces managers’ fixation on earnings. I add to the long-standing debate
of whether management forecasts encourage short-termism and what characteristics guidance
should have to help avoid earnings fixation (Miller, 2009) by examining the relation between
SLG and earnings management. Kasznik (1999) finds that managers are likely to manipulate
earnings via accruals in order to meet the expectations set in yearly managerial earnings
forecasts. For short-term forecasts, however, Call, Chen, Miao, & Tong (2014) find that
quarterly guidance is associated with less earnings management. There are arguments for
both a positive and a negative relation between SLG and managers’ fixation on earnings. On
the one hand, disaggregating the guidance at the segment-level could induce earnings fixation
for the divisional managers.3 On the other hand, disaggregating guidance at the segment level
potentially makes it easier for monitors – shareholders or analysts (Liu, 2014; Lui, Young, &
Zeng, 2011) – to verify ex-post how the earnings targets where achieved (Mercer, 2004). This
ex-post verifiability could potentially commit the manager ex-ante to honest behavior. I find
that companies that provide SLG engage in more earnings management compared to the
companies that do not disaggregate their guidance at the segment level. Absolute
discretionary accruals increase with increased precision of the SLG, consistent with the idea
that more specific guidance induces fixation on the earnings target. Item disaggregation of
SLG, however, is associated with less earnings management, most likely due to the fact that
guidance disaggregation allows better monitoring (Mercer, 2004).
3 Under IFRS 8, operating segments reflect the internal organization of the company as seen by the
management. As a result, most often the operating segments reflect the divisional organization, with divisional
managers basically in charge of the results of the segments.
181
The paper proceeds as follows. Section 2 reviews prior research and builds up the
hypotheses. Section 3 details the variable measurement and research design. Section 4
presents the results, and section 5 concludes.
III.2 Literature review and hypotheses development
III.2.1 Determinants of management guidance
I aim to understand what firm characteristics are associated with providing SLG.
Lansford et al. (2013) find that demand-and-supply factors are more important for the
decision to disaggregate, once the decision to provide guidance is taken, than strategic
reasons. They also find that innovation-intensive firms and those with high earnings surprises
are more likely to disaggregate, while those with a high earnings-returns correlation and high
variation in sales are less likely to disaggregate. Baginski, Hassell, & Kimbrough (2004) and
Baginski et al. (2000) find that larger firms and those in non-regulated industries are more
likely to disclose attributions together with the management earnings forecast, and that the
type of attribution is more likely to be external for bad news forecasts. US-based
internationally diversified firms issued more guidance prior to Reg FD, and less and of lower
quality post-Reg FD (Herrmann, Kang, & Kim, 2010).
Given the sensitive nature of segment information from a proprietary costs
perspective (Bens et al., 2011; Berger & Hann, 2007), combined with the nature of
management guidance that is sensitive to future uncertainty, I predict that companies in
innovative industries are less likely to provide SLG. It could be either that it is hard for
managers to be confident enough in the predictions for next year to formulate disaggregated
managerial guidance at the segment level due to the high uncertainty in high tech industries.
182
It could also be, however, that managers do not provide SLG due to proprietary costs. When
testing the following hypothesis, I try to distinguish between these two explanations by
including controls for proprietary costs.
H1. Companies in high tech industries are less likely to disclose segment-level guidance.
III.2.2 Management guidance and financial analysts’ forecasts
Broadly speaking, prior literature examines the antecedents, characteristics, and
consequences of management forecasts (Hirst, Koonce, & Venkataraman, 2008).
Management guidance is generally regarded as a “necessary evil” (Graham et al., 2005).
Although it may induce earnings fixation and short-termism (Miller, 2009) and be used by
managers in a self-serving manner for insider trading purposes (Cheng, Luo, & Yue, 2013),
the market views this type of voluntary disclosure as informative (e.g., Penman, 1980;
Pownall, Wasley, & Waymire, 1993), penalizes companies who discontinue or suspend
guidance (Chen, Matsumoto, & Rajgopal, 2011) which most often happens when there are
difficulties associated with predicting earnings (Houston, Lev, & Tucker, 2010), and rewards
managers’ reputation for reliable forecasts (Yang 2012).
The information content of management guidance depends on its relevance and
credibility (Sobel, 1985). Providing guidance for other accounting items to accompany the
earnings forecast seems to increase the credibility of the forecast and be informative for
financial analysts (Lansford et al., 2013). Hirst, Koonce, & Venkataraman (2007) run a set of
experiments to test the mechanisms through which line-item disaggregation adds to the
perceived credibility of management earnings forecasts. They find that managers who
183
disaggregate are perceived as having more precise beliefs, but also that disaggregation
improves the clarity of the forecast and the perceived financial reporting quality of the firm.4
The upheld belief in management forecast research is that bad news forecasts are
inherently credible, whereas good news ones are not. Hutton et al. (2003) find empirically
that good news forecasts are informative for investors only when supplemented with forecasts
on disaggregated accounting items and that when disaggregations accompany bad-news
forecasts, this increases the information content (i.e., stock price reaction) to the forecast.5,6
Merkley, Bamber, & Christensen (2012), however, find that analysts rely on both good and
bad news forecasts, regardless of whether these are further disaggregated. Given this recent
finding, I do not distinguish between good and bad news forecasts but rather focus on
whether guidance disaggregated at the segment level is informative (i.e., both relevant and
credible) on average for analysts.
Prior literature documents the economic consequences of management guidance
characteristics. Baginski & Rakow (2011) find a negative association between the quality of
management earnings forecast policy (i.e., frequency of quarterly guidance and precision)
and the cost of equity capital. The association is stronger for companies that incur high
disclosure costs (measured with current product market competition, capital intensity,
expected litigation costs, and growth opportunities) and for those for which quarterly
management earnings forecasts are more value relevant. Merkley et al. (2012) find that
disaggregated earnings forecasts increase analysts’ sensitivity (i.e., in terms of the magnitude
of forecast revision) to the news in managers’ earnings guidance, consistent with the idea that
4 More specifically, Hirst et al. (2007) identify three avenues by which disaggregation increases management
forecast credibility: (1) specificity – disaggregation signals that managers have particularly precise beliefs, (2)
analysts use detailed (i.e., at the segment level) analytical models to arrive at their forecasts, so disaggregation
allows analysts to better justify their forecasts, and (3) forecasts of earnings components (and at the segment-
level) pre-commit the manager to meeting bottom-line EPS forecasts in a particular way, and such pre-
commitment increases the manager’s credibility by increasing ex-post verifiability of disclosures (Mercer,
2004). 5 Hutton et al. (2003) use the name “verifiable supplementary statements” for this type of forecast
disaggregation. 6 Soft-talk disclosures are more likely to accompany bad-news forecasts (Hutton et al., 2003).
184
analysts find disaggregated guidance more credible. Disaggregation reduces analyst forecast
dispersion and improves forecast revision times (Lansford et al., 2013; Merkley et al., 2012).
A few papers code the supplementary statements that accompany management
forecasts based on the attribution or causality effect that managers “assign” to them. Baginski
et al. (2004) define attributions as the statements that link forecasted performance to
managers’ internal actions and/or the actions of other parties external to the firm and find that
stock market reaction to management forecasts accompanied by attributions is stronger.
Based on these prior findings and theoretical underpinnings, I predict that SLG
increases the information content of managerial guidance and is negatively associated with
analysts’ earnings forecast errors. Testing the usefulness of SLG for financial analysts is in
fact a joint test of whether SLG is relevant and credible. I focus on analysts in particular since
they directly use segment information to perform their job.
H2a. Financial analysts’ earnings forecasts errors are smaller for companies that provide
segment-level guidance.
There are various choices that managers make to render credibility to their forecasts.
For example, more frequent and more specific forecasts are more credible and help managers
build a reputation for corporate disclosure quality (Bhojraj et al., 2012). Consistency in time,
either as a guider or as a non-guider, also helps create guidance reputation and build market
expectations (Tang, 2014). There is mixed empirical evidence with regards to the effects of
some of these choices. Pownall et al. (1993) find no effect of guidance form on stock returns.
Baginski, Conrad, & Hassell (1993) find that forecast precision improves the relation
between unexpected earnings and unexpected returns. Hirst, Koonce, & Miller (1999) find
experimentally that investors’ earnings predictions are responsive to management forecasts,
but forecast form does not influence the earnings predictions. Libby, Tan, & Hunton (2006)
take into consideration the whole sequence of corporate events – management forecast,

185
analyst forecasts, earnings announcement arguing that “the complete effect of earnings
guidance cannot be observed until after the actual earnings announcement” and test
experimentally whether the form of management earnings guidance (i.e., point, narrow range,
wide range) affects analysts’ earnings forecasts. Their results show that guidance form has no
effect on analysts’ forecasts made immediately after the guidance, but that subsequent to the
actual earnings announcement, the interaction of guidance form and accuracy is significantly
influencing analysts’ forecast errors. Still in an experimental setting, Fleming (2009) suggests
that the benefits of guidance disaggregation are limited to precise guidance (i.e., point rather
than range).7
I test two hypotheses related to the effect of SLG characteristics on analysts’
accuracy, one related to the precision of SLG, and the other to the item disaggregation of
SLG.
H2b. For companies that provide segment-level guidance, the precision of the segment-level
guidance is negatively associated with financial analysts’ earnings forecast errors.
H2c. For companies that provide segment-level guidance, the accounting item-
disaggregation at the segment-level guidance is negatively associated with financial analysts’
earnings forecast errors.
III.2.3 Management guidance and earnings management
The CFA Institute (2007) defines short-termism as the excessive focus that corporate
leaders, investors, and analysts place on short-term earnings at the expense of long-term
value creation, which translates into pressure on managers to engage in myopic behavior,
including the use of accounting manipulations, to meet earnings expectations. The general
7 The experiment in Fleming (2009) refers to item disaggregation of earnings guidance.
186
perception is that providing management forecasts focuses managers on short-term results
and induces earnings fixation (Miller, 2009). However, given the capital market benefits of
providing management forecasts (Miller, 2009), regulators and practitioners are interested in
whether the way in which management forecasts are provided could alleviate some of the
costs, while still providing all the benefits.
It is not clear what the effect of guidance disaggregation should be on managers’
earnings fixation. On the one hand, disaggregating the guidance at the segment-level could
induce earnings fixation for the divisional managers.8 Earnings targets that are set internally
are conducive to earnings management behavior at the business-unit level (Guidry et al.,
1999). Once an earnings target is publicly announced for a segment, we can easily expect the
effect to be even stronger. Therefore, SLG might create incentives for divisional managers to
engage in earnings management in order to meet or beat these publicly-announced targets.
On the other hand, similar to the argument in Mercer (2004), disaggregating guidance
at the segment level potentially makes it easier for monitors – shareholders or analysts (Liu,
2014; Lui et al., 2011) – to verify ex-post how the earnings targets where achieved. This ex-
post verifiability potentially commits the manager ex-ante to honest behavior. Experimental
results suggest that accompanying earnings forecasts with forecasts for other items such as
revenue, cash flows, capital expenditures etc. appears to reduce investor fixation on earnings
(Elliott et al., 2011). Analytical results also support the notion that guidance allows
monitoring and so deters earnings management (Dutta & Gigler, 2002). Furthermore, Ajinkya
& Gift (1984) show that managers issue guidance to align market expectations with their own
expectations. Therefore, there is less need to manage earnings if managers can already use
guidance to influence the benchmarks.
8 Under IFRS 8, operating segments reflect the internal organization of the company as seen by the
management. As a result, most often the segments reflect the divisional organization, with divisional managers
basically in charge of the results of the segments.
187
I test the following three hypotheses on the relation between SLG and earnings
management, including the precision and item-disaggregation characteristics of SLG.
H3a. Companies that provide segment-level guidance are more likely to manage earnings in
the following year.
H3b. For companies that provide segment-level guidance, the precision of the segment-level
guidance is positively related to earnings management in the following year.
H3c. For companies that provide segment-level guidance, the accounting item-
disaggregation of segment-level guidance is negatively related to earnings management in
the following year.
III.3 Sample and research design
III.3.1 Sample
My sample contains multi-segment European companies. According to the 2012 IR
Magazine Global Practice Report, the proportion of European companies providing guidance
is comparable to that of U.S. companies (IR Magazine, 2012) but we know comparatively
little regarding their guidance practices. Anecdotal evidence suggests that UK companies are
providing more directional and qualitative rather than quantitative guidance compared to U.S.
firms and that investor relations managers consider it “just as effective” (Roach, 2013b).
Throughout Europe, investor relations specialists in large companies speak of a “trend of
super transparency” that “U.S. managers would find shocking” (Roach, 2013a).9 Differences
in the regulatory environment could also be driving differences in guidance practices between
9 The “super transparency” translates into how companies maintain their investor relations websites,
communicate with investors and financial analysts, including private communication which Reg FD prohibits in
the US, provide guidance, and publish in-house consensus estimates, a practice so far confined to European
firms (Human, 2013).
188
European and U.S. firms. In the US, regulations such as the Safe Harbour Law, the Private
Securities Litigation Reform Act, and Reg FD provide guidelines on management guidance
and the SEC is in charge of enforcing them, while in Europe there is no regulatory body
explicitly covering this topic (Karageorgiou & Serafeim, 2014). For these reasons, examining
guidance practices by European companies is warranted in and of itself.
There are various venues in which managers disclose guidance (Bamber & Cheon,
1998; King, Pownall, & Waymire, 1990). I use earnings announcement press releases as the
venue of interest. Lansford et al. (2013) point out that “the overall number of firms providing
guidance at the earnings announcement is far greater than the number providing guidance in
special releases” i.e., guidance disclosed in press releases issued in between quarterly
earnings announcements, and Rogers & Buskirk (2013) find that stand-alone guidance press
releases are rare. To the extent that European firms use the same venues as U.S. firms to
disclose guidance, I focus on the venue where I am more likely to find guidance.10
I start from a sample of multi-segment companies included in the STOXX Europe 600
index at the end of 2009 and retrieve the earnings announcement press releases from their
corporate websites. I go through each press release and code whether the company provides
guidance or not. For those that do, I extract the section containing the guidance and manually
code (1) whether segments are discussed, (2) the form of guidance at the segment level, i.e.,
point, range, low-precision range estimate (henceforth “estimate”), or narrative, and (3) the
type of information in the segment-level guidance, i.e., segment earnings, segment revenues,
segment expense items, or non-financial statements.11
I use this data to construct the main
variables of interest.
10
I have no reason to expect European companies to differ from U.S. companies regarding the guidance
disclosure venue. 11
My coding of guidance form follows Lansford et al. (2013). An example of low-precision range estimate is
“we expect mid- to high single-digit earnings growth.”
189
An indicator variable (SLG) takes the value 1 if the company provides segment-level
guidance, and 0 otherwise, conditional on the company providing guidance (i.e., an indicator
variable Guidance is 1 if this is the case, and 0 otherwise). I define indicator variables for
whether the company provides segment-level guidance in the form of point and/or range
estimates (Point_Range), low-precision range estimates (Estimate), or in a
qualitative/narrative form (Narrative) which comprises financial and/or non-financial
statements. The variable Precision is meant to summarize the form of segment-level
guidance. It takes integer values between 0 and 2, with higher values reflecting more
precision of the segment guidance. For narrative guidance, Precision takes the value 0, for
estimates it takes the value 1, and for point and/or range guidance it takes the value 2.
The last variable of interest is SEG which captures the disaggregation of segment-
level guidance based on the type of information that is provided. SEG is 0 if only non-
financial statements are provided in the segment-level guidance, 1 if only segment expense
items and/or segment revenue are mentioned in the segment-level guidance, 2 if only segment
earnings are forecasted, and 3 if segment earnings and at least one other accounting item
(e.g., segment revenue, segment expense items) are mentioned.
The debate on the appropriateness of providing guidance (CFA Institute, 2013; Miller,
2009) is pushing managers to adopt a more general, qualitative way of expressing their
expectations about future performance. Non-financial information such as number of stores,
order backlog, number of patents etc. is an important input into management forecasts
(Brazel et al., 2013). More than being just an input, however, survey evidence indicates that a
large proportion of the qualitative guidance that UK managers provide relates to non-
financial information such as operational metrics or other KPIs (Roach, 2013b). For these
reasons, I also score non-financial information into the SEG measure.
190
Following Lansford et al. (2013) and Merkley et al. (2012) I also retain the
components of guidance at the firm level, i.e., guidance on earnings, revenues, expense items,
and cash flow items, to construct a measure of disaggregated earnings guidance (DEG).
Appendix III.B provides further details on variable definitions.
III.3.2 Model to test the determinants of segment-level guidance
The first model is a logistic regression that tests whether the main industry is a
determinant of managers’ decision to provide segment-level guidance.
𝑆𝐿𝐺𝑡+1 = 𝛽0 + 𝜷𝟏𝑯𝒊𝒈𝒉𝑻𝒆𝒄𝒉𝒕 + 𝛽2𝐿𝑛𝑀𝑔𝑂𝑤𝑛𝑒𝑟𝑠𝑡 + 𝛽3𝐶𝐻𝑆𝑡 + 𝛽4𝐻𝑒𝑟𝑓𝑡 + 𝛽5𝑅&𝐷𝑡
+ 𝛽6𝑅𝑂𝐴𝑡 + 𝛽7𝑆𝑡𝑑𝐸𝑎𝑟𝑛𝑖𝑛𝑔𝑠𝑡 + 𝛽8𝐵𝑇𝑀𝑡 + 𝛽9𝑆𝑒𝑔𝑚𝑒𝑛𝑡𝑠𝑡 + 𝛽10𝐿𝑛𝑇𝐴𝑡
+ 휀𝑡+1
The model is run on the sample of guiders, with SLG as dependent variable. The
independent variable of interest is HighTech and equals 1 for companies in high-tech
industries as defined by Francis & Schipper (1999) and including companies in the healthcare
and pharmaceuticals industry, consistent with André, Ben-Amar, et al. (2014).12
Without formally hypothesizing their association to SLG, I include a number of
variables that have been shown in prior literature to be related to managers’ decision to issue
guidance (Miller, 2009). Two variables relate to the firm’s ownership structure –
LnMgOwners is the natural logarithm of the proportion of management ownership, and CHS
is the natural logarithm of the proportion of closely held shares. Two other variables relate to
12
The Francis & Schipper (1999) classification of high tech industries comprises the following three-digit SIC
codes: 283 Drugs, 357 Computer and Office Equipment, 360 Electrical Machinery and Equipment, excluding
Computers, 361 Electrical Transmissions and Distribution Equipment, 362 Electrical Industrial Apparatus, 363
Household Appliances, 34 Electrical Lighting and Wiring Equipment, 365 Household Audio, Video Equipment,
Audio Receiving, 366 Communication Equipment, 367 Electronic Components, Semiconductors, 368 Computer
Hardware, 481 Telephone Communications, 737 Computer Programming, Software, Data Processing, 873
Research, Development, Testing Services. I add the 384 and 800 three-digit codes for companies in the
healthcare and pharmaceutical industry, consistent with André, Ben-Amar, & Saadi (2014).
191
the proprietary costs that the company may be facing by disclosing disaggregated guidance at
the segment level: Herf is the Herfindahl industry concentration index, and R&D is the log of
the ratio of research and development expenditures to total sales. I also include ROA and
StdEarnings to account for firm profitability and earnings volatility. The book-to-market ratio
(BTM) is an inverse proxy for firm growth opportunities and life cycle. Lastly, I include the
number of reported operating segments (Segments) and lagged total assets (LnTA) to control
for firm complexity and size. Appendix III.B provides definitions of all the variables included
in the model.
III.3.3 Model to test the relation between segment-level guidance and analysts’ earnings
forecast errors
In order to test the relation between segment-level guidance on financial analysts’
accuracy, I use a multivariate cross-sectional model that regresses the individual analyst
forecast error on the indicator variable SLG.13
The dependent variable is the in-sample range-
adjusted earnings forecast error. The forecast error (FE) is computed as the logarithm of one
plus the absolute difference between the first estimated value of one-year-ahead earnings
within 30 days after the earnings announcement and the actual earnings, deflated by the
absolute value of actual earnings.14
In order to mitigate the influence of outliers and
measurement error, I winsorize the sample at the extreme 99th
percentile of the FE variable.
Since I run a cross-sectional model, year t is 2009, and t+1 is 2010.
13
Using analyst-firm observations as unit of analysis increases the power of our tests. Models using the firm-
level observations as unit of analysis lack power, especially when the sample is restricted to guiders (288
observations) or providers of SLG (127 observations). 14
Extending the period to 90 days after the earnings announcement leaves the inferences qualitatively similar.
Restricting the period to 10 days after the earnings announcement significantly reduces the sample (1500 firm-
analyst observations) which makes some results unstable.
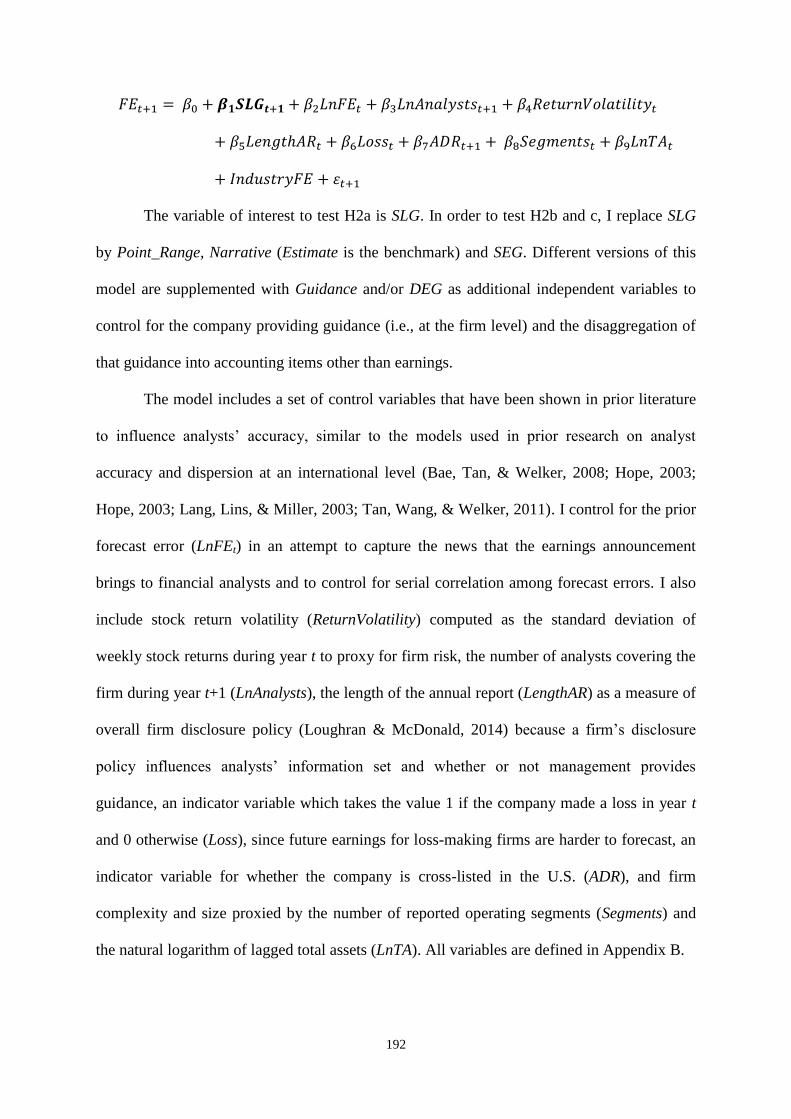
192
𝐹𝐸𝑡+1 = 𝛽0 + 𝜷𝟏𝑺𝑳𝑮𝒕+𝟏 + 𝛽2𝐿𝑛𝐹𝐸𝑡 + 𝛽3𝐿𝑛𝐴𝑛𝑎𝑙𝑦𝑠𝑡𝑠𝑡+1 + 𝛽4𝑅𝑒𝑡𝑢𝑟𝑛𝑉𝑜𝑙𝑎𝑡𝑖𝑙𝑖𝑡𝑦𝑡
+ 𝛽5𝐿𝑒𝑛𝑔𝑡ℎ𝐴𝑅𝑡 + 𝛽6𝐿𝑜𝑠𝑠𝑡 + 𝛽7𝐴𝐷𝑅𝑡+1 + 𝛽8𝑆𝑒𝑔𝑚𝑒𝑛𝑡𝑠𝑡 + 𝛽9𝐿𝑛𝑇𝐴𝑡
+ 𝐼𝑛𝑑𝑢𝑠𝑡𝑟𝑦𝐹𝐸 + 휀𝑡+1
The variable of interest to test H2a is SLG. In order to test H2b and c, I replace SLG
by Point_Range, Narrative (Estimate is the benchmark) and SEG. Different versions of this
model are supplemented with Guidance and/or DEG as additional independent variables to
control for the company providing guidance (i.e., at the firm level) and the disaggregation of
that guidance into accounting items other than earnings.
The model includes a set of control variables that have been shown in prior literature
to influence analysts’ accuracy, similar to the models used in prior research on analyst
accuracy and dispersion at an international level (Bae, Tan, & Welker, 2008; Hope, 2003;
Hope, 2003; Lang, Lins, & Miller, 2003; Tan, Wang, & Welker, 2011). I control for the prior
forecast error (LnFEt) in an attempt to capture the news that the earnings announcement
brings to financial analysts and to control for serial correlation among forecast errors. I also
include stock return volatility (ReturnVolatility) computed as the standard deviation of
weekly stock returns during year t to proxy for firm risk, the number of analysts covering the
firm during year t+1 (LnAnalysts), the length of the annual report (LengthAR) as a measure of
overall firm disclosure policy (Loughran & McDonald, 2014) because a firm’s disclosure
policy influences analysts’ information set and whether or not management provides
guidance, an indicator variable which takes the value 1 if the company made a loss in year t
and 0 otherwise (Loss), since future earnings for loss-making firms are harder to forecast, an
indicator variable for whether the company is cross-listed in the U.S. (ADR), and firm
complexity and size proxied by the number of reported operating segments (Segments) and
the natural logarithm of lagged total assets (LnTA). All variables are defined in Appendix B.
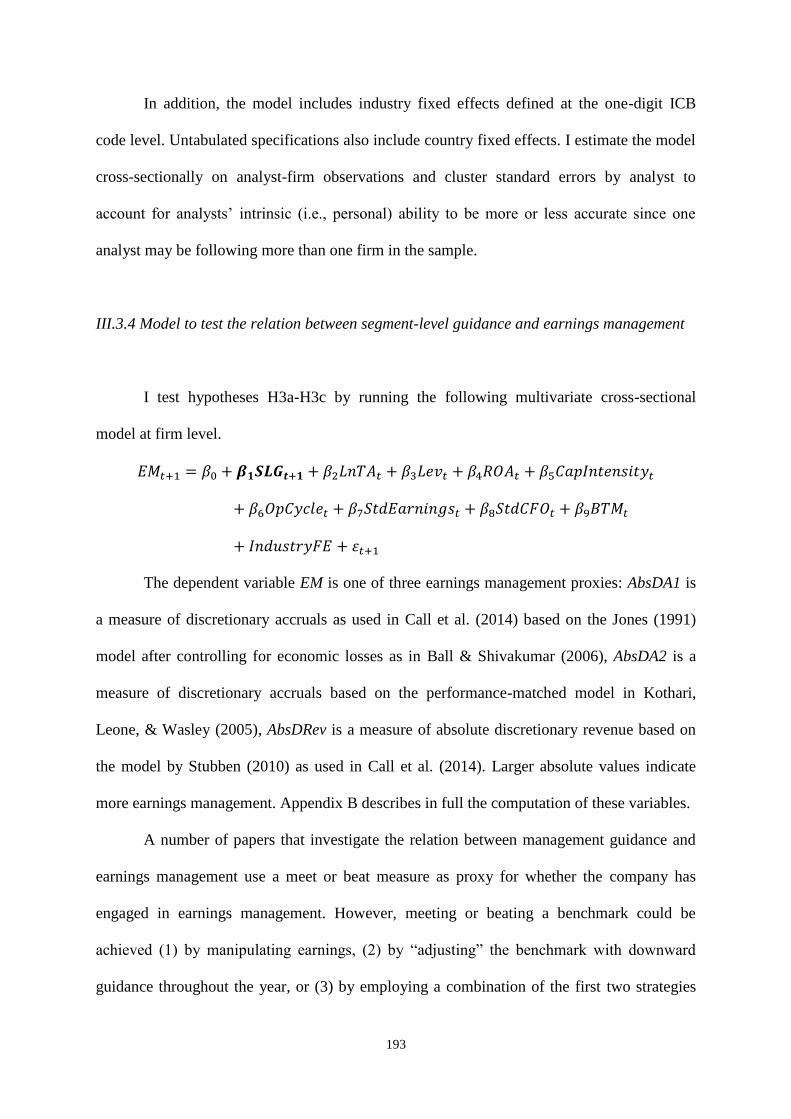
193
In addition, the model includes industry fixed effects defined at the one-digit ICB
code level. Untabulated specifications also include country fixed effects. I estimate the model
cross-sectionally on analyst-firm observations and cluster standard errors by analyst to
account for analysts’ intrinsic (i.e., personal) ability to be more or less accurate since one
analyst may be following more than one firm in the sample.
III.3.4 Model to test the relation between segment-level guidance and earnings management
I test hypotheses H3a-H3c by running the following multivariate cross-sectional
model at firm level.
𝐸𝑀𝑡+1 = 𝛽0 + 𝜷𝟏𝑺𝑳𝑮𝒕+𝟏 + 𝛽2𝐿𝑛𝑇𝐴𝑡 + 𝛽3𝐿𝑒𝑣𝑡 + 𝛽4𝑅𝑂𝐴𝑡 + 𝛽5𝐶𝑎𝑝𝐼𝑛𝑡𝑒𝑛𝑠𝑖𝑡𝑦𝑡
+ 𝛽6𝑂𝑝𝐶𝑦𝑐𝑙𝑒𝑡 + 𝛽7𝑆𝑡𝑑𝐸𝑎𝑟𝑛𝑖𝑛𝑔𝑠𝑡 + 𝛽8𝑆𝑡𝑑𝐶𝐹𝑂𝑡 + 𝛽9𝐵𝑇𝑀𝑡
+ 𝐼𝑛𝑑𝑢𝑠𝑡𝑟𝑦𝐹𝐸 + 휀𝑡+1
The dependent variable EM is one of three earnings management proxies: AbsDA1 is
a measure of discretionary accruals as used in Call et al. (2014) based on the Jones (1991)
model after controlling for economic losses as in Ball & Shivakumar (2006), AbsDA2 is a
measure of discretionary accruals based on the performance-matched model in Kothari,
Leone, & Wasley (2005), AbsDRev is a measure of absolute discretionary revenue based on
the model by Stubben (2010) as used in Call et al. (2014). Larger absolute values indicate
more earnings management. Appendix B describes in full the computation of these variables.
A number of papers that investigate the relation between management guidance and
earnings management use a meet or beat measure as proxy for whether the company has
engaged in earnings management. However, meeting or beating a benchmark could be
achieved (1) by manipulating earnings, (2) by “adjusting” the benchmark with downward
guidance throughout the year, or (3) by employing a combination of the first two strategies
194
(Athanasakou, Strong, & Walker, 2009). Prior literature uses the difference between the last
and the first analyst forecast as proxy for downward guidance. I regard this measure rather as
“implied” downward guidance since there could be other factors besides managers explicitly
providing downward guidance during the year that could explain the revision of analyst
forecasts. Analysts could be revising their forecasts during the year in response to a multitude
of factors of which explicit, public downward guidance (Cotter, Tuna, & Wysocki, 2006) that
could be observed by going through the companies’ press releases, is only one. Analysts
could get information from other sources, get private information from management, which is
not observable in a research setting, respond to macroeconomic events, or “walk-down” their
forecasts at their own initiative in order to maintain good relations with the management. For
example, Hutton (2005) compared guided and unguided analyst forecasts and found that over
the entire year, analyst earnings forecasts experience a “walk-down” regardless of whether
the company provides guidance or not.
Moreover, management forecasts during the year could be the result of either an
expectations management strategy or simply a communications strategy (Kim & Park, 2011).
Therefore, since meet-or-beat could be the result of other actions besides earnings
manipulation that I cannot completely measure and/or control for, I choose to focus only on
earnings management as proxied by discretionary accruals measures. Call et al. (2014)
similarly argue that the critics of earnings guidance are particularly concerned with managers
resorting to accounting shenanigans to manage earnings, regardless of the outcome, so
discretionary accruals are a more appropriate measure to capture this behavior than meet or
beat.
The variable of interest to test H2a is SLG. To test H2b and H2c, I replace SLG in the
model above with Precision and SEG and run the model on the sample of companies that

195
provide segment-level guidance.15
The model includes industry fixed effects defined at the
one-digit ICB code level and a set of control variables to account for the possibility that the
firm’s operating environment is associated with both earnings management and manager’s
decision to provide segment-level guidance. The variables capturing firm fundamentals are
size measured as the natural logarithm of lagged total assets (LnTA), the leverage ratio
computed as the percent of total debt to total assets (Lev) (Defond & Jiambalvo, 1994), firm
profitability (ROA), capital intensity computed as net property, plant, and equipment divided
by average total assets (CapIntensity), the length of the firm’s operating cycle computed as
the natural logarithm of the number of days it takes for the turnover of accounts receivables
and inventory (OpCycle) (Dechow & Dichev, 2002), the standard deviation of earnings
(StdEarnings) and of operating cash flows (StdCFO) to control for operating volatility
(Hribar & Nichols, 2007), and the book-to-market ratio (BTM) to account for the firm’s
growth opportunities since high growth firms have more incentives to manage earnings
(Skinner & Sloan, 2002).
III.4 Results interpretation
III.4.1 Descriptive statistics
I start from the companies included in the STOXX Europe 600 index at the end of
2009, and end up with a sample that contains 396 multi-segment non-financial European
companies with press releases announcing 2009 earnings available on their websites. I have
deleted companies that were taken over after 2009 for which financial data are no longer
15
I use the summary variable Precision instead of Point_Range, Narrative, and Estimate in order to reduce the
number of variables in the model given the small sample.

196
available in Thomson Reuters, and companies that follow U.S. GAAP.16
Table III.1 panel A
details the sample construction. The sample companies represent 17 European countries. The
per-country distribution of the sample companies is similar to the distribution of the
companies in the full STOXX Europe 600 index. UK companies represent 30% of the
sample, followed by French (16%) and German companies (12%). All other countries
represent less than 7% of the sample. Table III.1 panel B details the country distribution of
the sample.
Table III.2 presents descriptive statistics for the main variables. Out of the sample
companies, 73% disclose guidance in their earnings announcement press release. A survey
conducted by the IR Magazine in 2012 reports that approximately 70% of U.S. and European
companies provide guidance at least once a year (IR Magazine, 2012) which increases my
confidence that the sample is representative of the population of large European firms.
Guidance on the firm-level earnings number is provided by 54% of the guiding firms, 38%
guide on sales and revenue, 10% guide on at least one expense item (e.g., cost of goods sold,
amortization and depreciation expense, effective tax rate etc.), and 16% guide on at least a
cash flow item, usually capital expenditures.17
The proportions are similar to what Lansford
et al. (2013) find when coding the guidance provided by a sample of S&P 500 firms.
Out of the 288 companies that provide guidance, 127 (44%) disclose segment
information in the guidance section. Most of these firms provide guidance on the segments in
a narrative, qualitative way (104 companies, 82%), and give only non-financial information
(73 companies, 57%). The SEG distribution reveals that 13 companies (10%) provide
guidance about segment revenues and/or expense items without guiding on a segment
16
For the analyst-firm level analyses, I lose two more companies that in 2010 (i.e., year t+1) have changed their
fiscal year end. 17
Lansford et al. (2013) do not include a cash flow items category in their disaggregated earnings guidance
scheme. While reading the guidance sections, however, I observed companies that guided on items such as
capital expenditures or operating cash flow and as a result decided to enhance the scheme used by Lansford et
al. (2013).
197
earnings number, 18 companies (14%) provide guidance only about segment earnings
without further disaggregation, and 23 companies (18%) guide on segment earnings and at
least one other accounting item.
Table III.2 panel F presents the industry distribution of sample companies, guiders,
and segment-level guidance providers. Industry is defined at the one-digit Industry
Classification Benchmark (ICB) level. Most companies are industrials and around 40% of
them provide segment-level guidance (10.86/27.53=0.39). The highest proportion of SLG
providers per industry is for oil and gas companies (3.28/8.08=0.41), and the lowest for
utilities (0.76/6.06=0.13). Companies in high tech industries provide segment-level guidance
25% of the time (3.54/14.39=0.25), although they provide guidance 70% of the time which
provides some initial support for hypothesis H1 that high tech firms are less likely to provide
SLG.
Table III.3 panel A provides descriptive statistics for the other variables used in the
analyses. The models used to test H1 and H3a-H3c are run cross-sectionally at the firm level
on a sample of 396 observations. Models used to test H2a-H2c are run cross-sectionally at the
firm-analyst level, on a sample of 4706 observations. Sample companies have on average 4
segments, 5 billion euros in total assets, 21 analysts following them, a BTM ratio of 0.5, ROA
of 5%, debt to total assets ratio of 26%. Companies in high tech industries represent 14% of
the sample. Companies that have made a loss in 2009 are 10% of the sample. A fifth of the
sample is also listed in the US.
Table III.3 panels B to E report descriptive statistics on groups of guiders and non-
guiders, and SLG and non-SLG, conditional on the firms providing guidance, along with t-
tests for difference in means between groups. Compared to non-guiders, guiders are less
closely held, have lower leverage, longer operating cycles and higher ROA. Guiding firms
have, on average, lower forecast errors and fewer analysts following, but the analysts put in
198
more effort to forecast earnings. Compared to non-guiders, guiders are smaller, have fewer
segments, and are less likely to have made a loss during the year. Conditional on providing
guidance, companies that disclose segment information in their guidance section are less
closely held, with less management ownership, higher absolute discretionary accruals and
higher absolute discretionary revenues. They also have lower forecast errors, are smaller, and
more likely to have made a loss during the year and to be cross-listed in the US.
Table III.4 presents the correlation matrices, Pearson above the diagonal and
Spearman below. Our two measures of discretionary accruals are correlated at 38% meaning
that, to some extent, they capture different aspects of earnings management. The standard
deviations of cash flows and earnings are correlated at 57%. The size of the company
measured as LnTA is correlated at 52% with the length of the annual report, since larger,
more complex companies have more to disclose, and at 62% with the number of analysts
covering the firm. Size is also correlated with the number of segments (35%) and cross-
listing in the U.S. (37%). All other correlation coefficients are below 30%.
I now turn to the results of the main analyses of the paper.
III.4.2 Determinants of segment-level guidance
Table III.5 reports the results from a logistic model used to test the role of the firm’s
main industry in the manager’s decision to provide segment-level guidance. The sample
includes only companies that provide guidance and the likelihood ratio of the model is
significant at 1%. Our model is able to predict 65% of the sample observations. The
dependent variable is SLG, and the test variable is HighTech. As predicted, the coefficient on
HighTech is negative and significant at 10%, indicating that companies in high tech industries
are less likely to provide segment-level guidance. Due to their business model, companies in
199
high tech industries have more uncertain cash flows (Barron et al., 2002) which, as our results
suggest, reflects into lower predictability of earnings even by those intimately familiar with
the company. The proxies for proprietary costs – Herf and R&D – are not significant which
does not support the proprietary cost explanation for high tech firms being less likely to
disclose SLG.
Without formulating hypotheses per se, the logistic model includes a number of
control variables that could potentially be determinants of SLG. The association between the
percent of closely held shares (CHS) and SLG is negative and significant at 1% meaning that
the more concentrated the ownership of the firm, the less likely it is to provide segment-level
guidance. When ownership is more concentrated, shareholders can monitor managers more
closely by private access. As such, this diminishes the external demand for guidance which
explains why closely held firms in the sample are less likely to guide at the segment level. If
managers hold more shares (LnMgOwners), they are again less likely to provide SLG, the
coefficient is negative and significant at 10%. The book-to-market ratio (BTM) is also
negatively and significantly related (at 10%) to SLG, which suggests that more mature,
established companies are less likely to provide guidance at the segment level.
III.4.3 Segment-level guidance and analysts’ earnings forecast accuracy
In table III.6, panel A I report results from multivariate cross-sectional regressions of
analyst earnings forecast error (FE) on SLG. The models are run at the analyst-firm level and
include industry fixed effects. Including country fixed effects does not significantly change
the results. Standard errors are clustered at analyst level. Control variables generally have the
expected sign or are insignificant. All models are significant at 1%.
200
Model 1 is run on the full sample with SLG and the standard set of control variables
as independent variables. The negative coefficient on SLG suggests that, compared to all
other sample companies, regardless of whether they provide guidance or not, for those
companies that provide SLG analysts’ earnings forecast error is lower (t-stat -9.95). Model 2
includes the indicator variable Guidance as independent variable for which the regression
coefficient is negative but insignificant. The coefficient on SLG remains negative and
strongly significant (t-stat -7.99) meaning that compared to all sample companies, the
negative effect on forecast error for those that provide segment-level guidance is above and
beyond the effect of providing management guidance.
In models 3 and 4, the sample is conditional on companies providing guidance.
Therefore, I compare the companies that provide segment information in their guidance
section to companies that provide management guidance without mentioning their segments.
In this way, the comparison is cleaner than when segment-level guiders are compared to the
whole sample. In model 3, the negative coefficient on SLG (t-stat -7.15) suggests that, within
the sample of guiders, the companies that provide SLG have lower analyst forecast errors. In
model 4, even after controlling for DEG (t-stat -9.34) as a characteristic of firm-level
management guidance, the coefficient on SLG remains negative and strongly significant (t-
stat -7.11). Therefore, disaggregation of guidance per segment appears as distinct from the
guidance disaggregation into accounting items and is useful information for financial analysts
above and beyond the firm-level information contained in the management guidance section.
Panel B in table III.5 tests the role of the form and disaggregation of the segment-
related information in the guidance section for analysts’ forecasting accuracy. I include
variables for these two characteristics: Point_Range, Narrative, Estimate, and SEG,
respectively, in separate models, as well as together in one model. All models are run on
analyst-firm observations conditional on the firm providing segment-level guidance, include

201
DEG as control variable, and are significant at 1%. The adjusted R2 is around 32% for all
models. Model (1) includes only the variables related to the form of segment-level guidance,
Point_Range, Narrative, and Estimate as benchmark group. The regression coefficients are
not significant for any of these variables of interest. Model (2) includes the SEG as variable
of interest, and the coefficient is negative and marginally significant at 10%.
Model (3) includes all these variables. The coefficient on Point_Range remains
insignificant, which suggests that more precise guidance on operating segments compared to
an Estimate does not particularly help financial analysts to be more accurate. The coefficient
on Narrative is negative and becomes strongly significant (t-stat -2.72), meaning that
financial analysts find qualitative guidance more informative than a low-precision estimate.
This result confirms the interpretation of the coefficient on Point_Range that the specificity
of the segment-level guidance does not seem to be important for financial analysts’ ability to
forecast earnings. In other words, providing narrative, qualitative guidance on segments,
which is the case for most of the companies in our sample, is no different from providing
more specific guidance, which lends support to the opinion expressed by the IR Society in
Europe that “[qualitative guidance] is just as effective [as numeric point or range guidance]”
(Roach, 2013b). The item disaggregation of segment guidance (SEG) is negatively associated
with forecast error at 1% significance level (t-stat -3.61), confirming H2c. The more
accounting item information companies provide as guidance at the segment level, the more
accurately are analysts able to forecast earnings. This result is in line with analysts’ work
procedures to forecast earnings for multi-segment companies. If managers disclose segment
items guidance, then analysts can use these items as direct inputs into their segment-level
forecasting spreadsheets or can use them to adjust their own segment-level forecasts based on
historical data. Either way, companies benefit by guiding the analysts closer to their actual
earnings.
202
III.4.4 Segment-level guidance and earnings management
In table III.7, I test H3a-H3c on the relation between providing segment-level
guidance about year t+1 and earnings management in year t+1. In panel A, the sample is
restricted to companies providing guidance, and the variable of interest is SLG. I run three
models with different proxies for earnings management as dependent variables. All models
include industry fixed effects and are significant at 1%.18
Standard errors are adjusted for
heteroskedasticity. The adjusted-R2 for model 2 is 37%, while for models 1 and 3 it is around
10%. Since in model 2 I use the performance-matched discretionary accruals (Kothari et al.,
2005) as dependent variable, a proxy that is generally very popular in the earnings
management literature, the difference in adj-R2
is most likely arising from a better model
calibration (i.e., choice of the set of control variables) based on prior literature.
The coefficient on SLG is positive and significant in models 2 and 3 where the
dependent variables are AbsDA2 (i.e., performance-matched discretionary accruals) and
AbsDRev at 5% (t-stat 2.09) and 10% (t-stat 1.76), respectively.19
These results confirm H3a
and suggest that when managers guide at the segment level, the earnings management during
that year is higher. This result is in line with the literature indicating that earnings
management does not happen just at the headquarter level, but also at the divisional level
when mid-tier managers are incentivized in a manner conducive to earnings management
(Guidry et al., 1999).
In panel B of table III.6 I restrict the sample to the 127 firms that provide segment-
level guidance to investigate the role that Precision and SEG have on earnings management
behavior. Model 3 is not significant so I do no rely on it to draw conclusions about this
18
Including country fixed effects instead leaves the results qualitatively similar. 19
In model 1, where the dependent variable is AbsDA1, the coefficient on SLG is positive but not significant at
conventional levels.
203
relation. As expected, Precision is significantly positively associated with earnings
management (t-stat 2.26 in model 1 and 2.14 in model 2). More specific benchmarks lead
managers to fixate more on those numbers and aim to achieve them even by manipulating
earnings. The coefficient on SEG is negative and significant at 1% (t-stat -2.64) in model 1
and negative but insignificant (t-stat -1.53) in model 2. These results lend some support to
hypothesis H3c that more segment item disaggregation decreases managers’ fixation on
earnings and therefore is negatively related to earnings management.
III.5 Conclusions
I identify instances when managers of multi-segment companies provide guidance
disaggregated at the segment level and test the usefulness of this information for financial
analysts and whether it curbs or encourages earnings management. My findings suggest that
forward-looking information on segments improves analysts’ earnings forecast accuracy
regardless of its precision, and more so when the item-disaggregation per segment increases.
Providing guidance on segments is positively related to earnings management, most likely
because it creates benchmarks for divisional managers to meet or beat, and this effect is more
pronounced when guidance is more precise, but decreases with segment item-disaggregation.
This paper contributes to prior literature on the characteristics of management
guidance. On top of the evidence already provided in Hutton et al. (2003), I limit the sample
to multi-segment firms for which providing SLG is a viable option which allows me to go
into more details on how and what makes this type of information important in the guidance
section. I also contribute to the literature on segment reporting that has an exclusively
historical view on segment disclosures by examining forward-looking segment information in
an unregulated, voluntary setting.
204
My findings also have implications for managers, financial analysts, and all other
parties involved in the debate on whether companies should provide management forecasts at
all. Guidance on segments is useful for financial analysts but at the same time encourages
managers to engage in earnings management. At first view, the choice would seem a black
and white one between providing this type of information in the guidance or not. However,
by analyzing SLG in depth, I am able to qualify this and conclude that the precision of this
information is conducive to earnings management while it is not significantly useful for
analysts. The item-disaggregation of SLG, however, is both beneficial for analysts and is
negatively related to earnings management. Therefore, companies could combine a low-
precision, qualitative guidance with more items forecasted at the segment level to contribute
to their reputation of truthfulness and credibility.
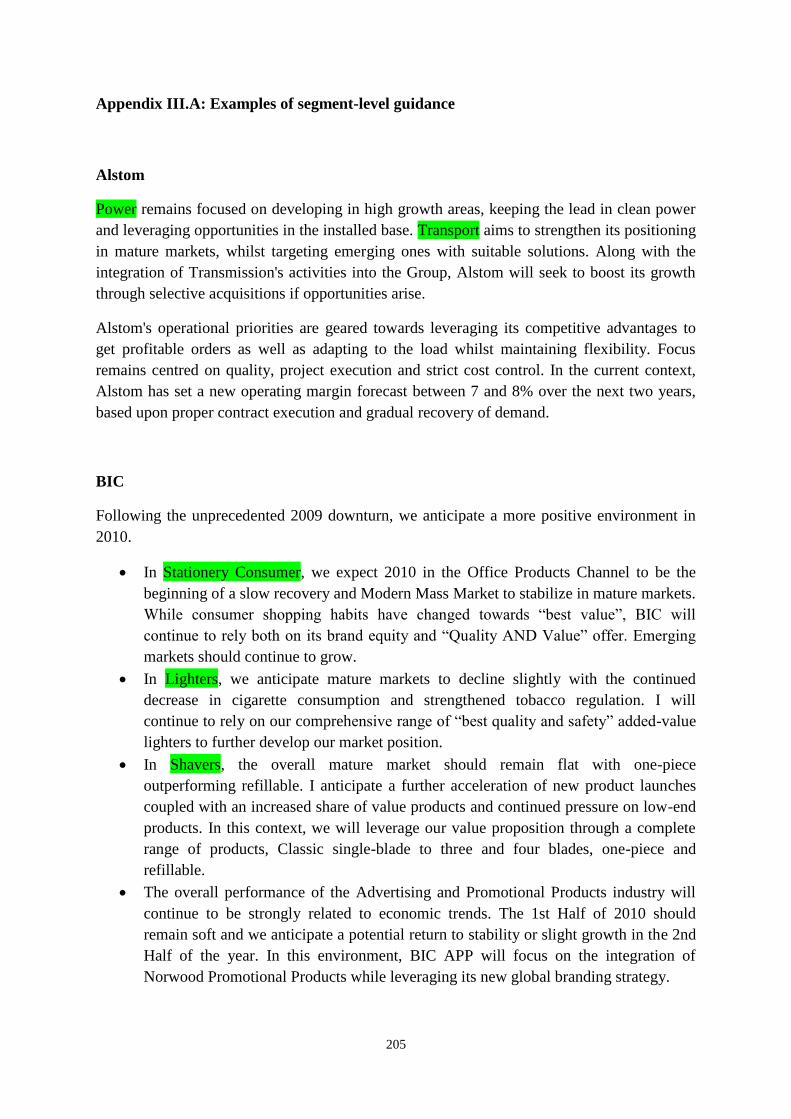
205
Appendix III.A: Examples of segment-level guidance
Alstom
Power remains focused on developing in high growth areas, keeping the lead in clean power
and leveraging opportunities in the installed base. Transport aims to strengthen its positioning
in mature markets, whilst targeting emerging ones with suitable solutions. Along with the
integration of Transmission's activities into the Group, Alstom will seek to boost its growth
through selective acquisitions if opportunities arise.
Alstom's operational priorities are geared towards leveraging its competitive advantages to
get profitable orders as well as adapting to the load whilst maintaining flexibility. Focus
remains centred on quality, project execution and strict cost control. In the current context,
Alstom has set a new operating margin forecast between 7 and 8% over the next two years,
based upon proper contract execution and gradual recovery of demand.
BIC
Following the unprecedented 2009 downturn, we anticipate a more positive environment in
2010.
In Stationery Consumer, we expect 2010 in the Office Products Channel to be the
beginning of a slow recovery and Modern Mass Market to stabilize in mature markets.
While consumer shopping habits have changed towards “best value”, BIC will
continue to rely both on its brand equity and “Quality AND Value” offer. Emerging
markets should continue to grow.
In Lighters, we anticipate mature markets to decline slightly with the continued
decrease in cigarette consumption and strengthened tobacco regulation. I will
continue to rely on our comprehensive range of “best quality and safety” added-value
lighters to further develop our market position.
In Shavers, the overall mature market should remain flat with one-piece
outperforming refillable. I anticipate a further acceleration of new product launches
coupled with an increased share of value products and continued pressure on low-end
products. In this context, we will leverage our value proposition through a complete
range of products, Classic single-blade to three and four blades, one-piece and
refillable.
The overall performance of the Advertising and Promotional Products industry will
continue to be strongly related to economic trends. The 1st Half of 2010 should
remain soft and we anticipate a potential return to stability or slight growth in the 2nd
Half of the year. In this environment, BIC APP will focus on the integration of
Norwood Promotional Products while leveraging its new global branding strategy.
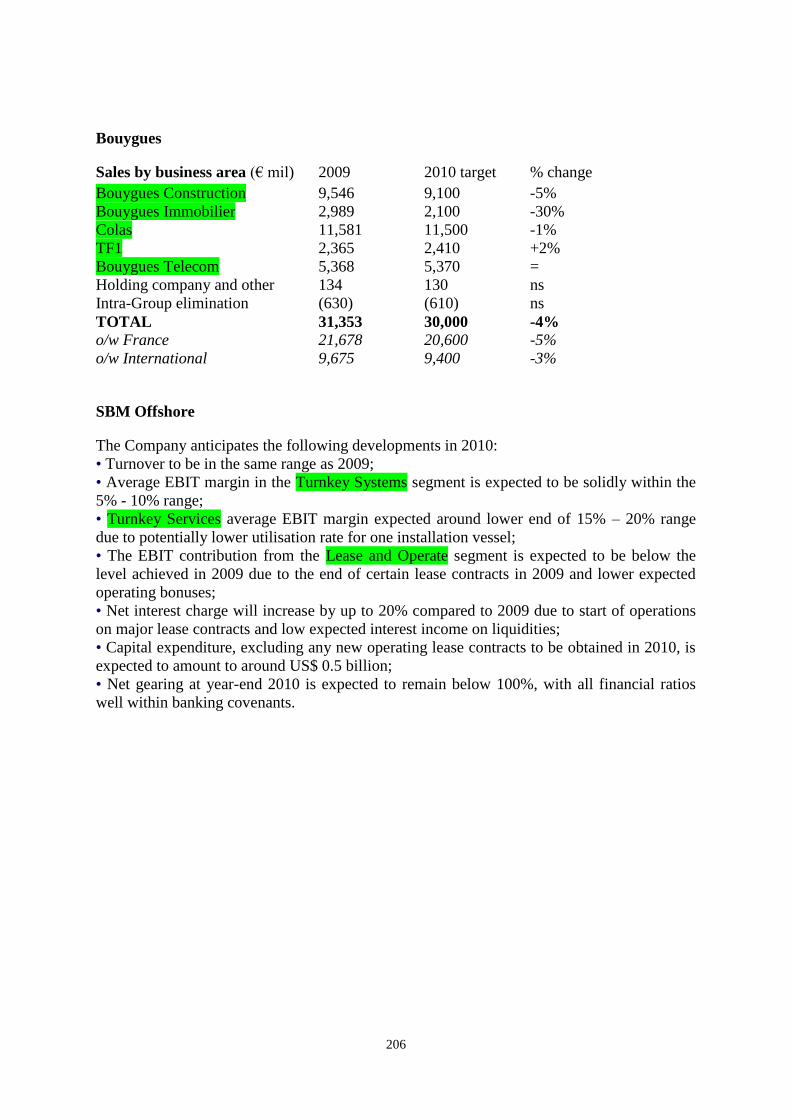
206
Bouygues
Sales by business area (€ mil) 2009 2010 target % change
Bouygues Construction 9,546 9,100 -5%
Bouygues Immobilier 2,989 2,100 -30%
Colas 11,581 11,500 -1%
TF1 2,365 2,410 +2%
Bouygues Telecom 5,368 5,370 =
Holding company and other 134 130 ns
Intra-Group elimination (630) (610) ns
TOTAL 31,353 30,000 -4% o/w France 21,678 20,600 -5%
o/w International 9,675 9,400 -3%
SBM Offshore
The Company anticipates the following developments in 2010:
• Turnover to be in the same range as 2009;
• Average EBIT margin in the Turnkey Systems segment is expected to be solidly within the
5% - 10% range;
• Turnkey Services average EBIT margin expected around lower end of 15% – 20% range
due to potentially lower utilisation rate for one installation vessel;
• The EBIT contribution from the Lease and Operate segment is expected to be below the
level achieved in 2009 due to the end of certain lease contracts in 2009 and lower expected
operating bonuses;
• Net interest charge will increase by up to 20% compared to 2009 due to start of operations
on major lease contracts and low expected interest income on liquidities;
• Capital expenditure, excluding any new operating lease contracts to be obtained in 2010, is
expected to amount to around US$ 0.5 billion;
• Net gearing at year-end 2010 is expected to remain below 100%, with all financial ratios
well within banking covenants.
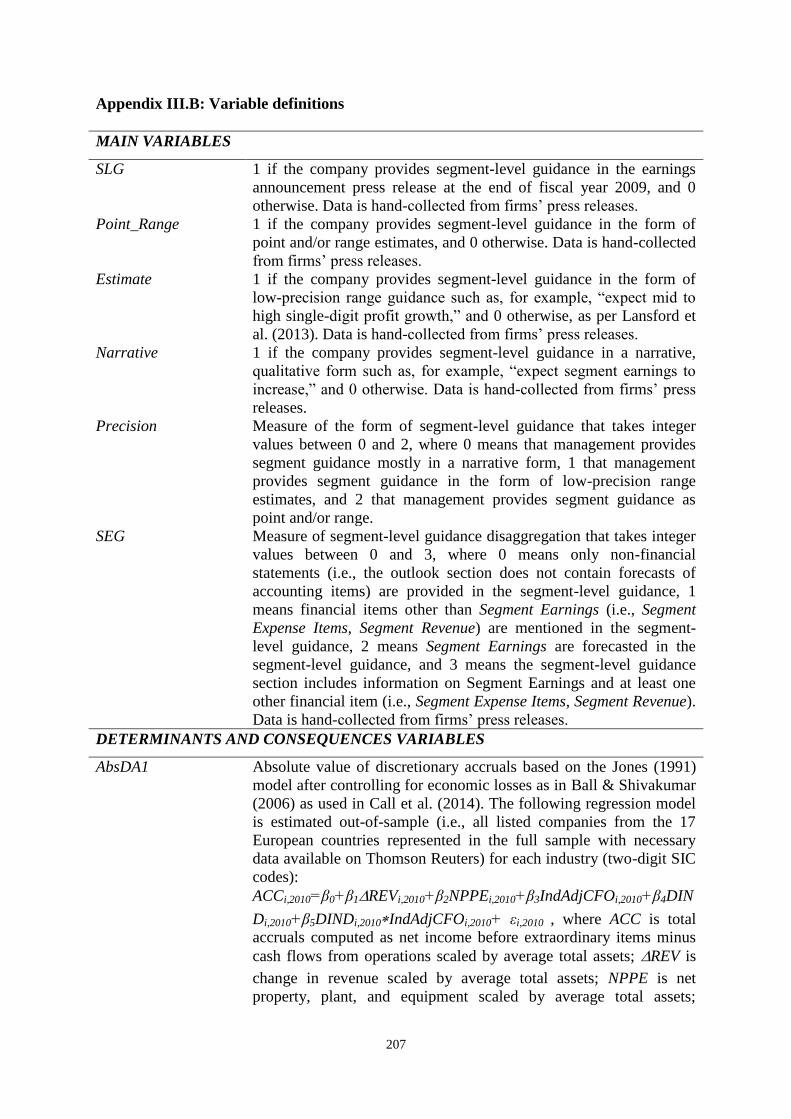
207
Appendix III.B: Variable definitions
MAIN VARIABLES
SLG 1 if the company provides segment-level guidance in the earnings
announcement press release at the end of fiscal year 2009, and 0
otherwise. Data is hand-collected from firms’ press releases.
Point_Range 1 if the company provides segment-level guidance in the form of
point and/or range estimates, and 0 otherwise. Data is hand-collected
from firms’ press releases.
Estimate 1 if the company provides segment-level guidance in the form of
low-precision range guidance such as, for example, “expect mid to
high single-digit profit growth,” and 0 otherwise, as per Lansford et
al. (2013). Data is hand-collected from firms’ press releases.
Narrative 1 if the company provides segment-level guidance in a narrative,
qualitative form such as, for example, “expect segment earnings to
increase,” and 0 otherwise. Data is hand-collected from firms’ press
releases.
Precision
Measure of the form of segment-level guidance that takes integer
values between 0 and 2, where 0 means that management provides
segment guidance mostly in a narrative form, 1 that management
provides segment guidance in the form of low-precision range
estimates, and 2 that management provides segment guidance as
point and/or range.
SEG Measure of segment-level guidance disaggregation that takes integer
values between 0 and 3, where 0 means only non-financial
statements (i.e., the outlook section does not contain forecasts of
accounting items) are provided in the segment-level guidance, 1
means financial items other than Segment Earnings (i.e., Segment
Expense Items, Segment Revenue) are mentioned in the segment-
level guidance, 2 means Segment Earnings are forecasted in the
segment-level guidance, and 3 means the segment-level guidance
section includes information on Segment Earnings and at least one
other financial item (i.e., Segment Expense Items, Segment Revenue).
Data is hand-collected from firms’ press releases.
DETERMINANTS AND CONSEQUENCES VARIABLES
AbsDA1 Absolute value of discretionary accruals based on the Jones (1991)
model after controlling for economic losses as in Ball & Shivakumar
(2006) as used in Call et al. (2014). The following regression model
is estimated out-of-sample (i.e., all listed companies from the 17
European countries represented in the full sample with necessary
data available on Thomson Reuters) for each industry (two-digit SIC
codes):
ACCi,2010=β0+β1∆REVi,2010+β2NPPEi,2010+β3IndAdjCFOi,2010+β4DIN
Di,2010+β5DINDi,2010IndAdjCFOi,2010+ εi,2010 , where ACC is total
accruals computed as net income before extraordinary items minus
cash flows from operations scaled by average total assets; ∆REV is
change in revenue scaled by average total assets; NPPE is net
property, plant, and equipment scaled by average total assets;
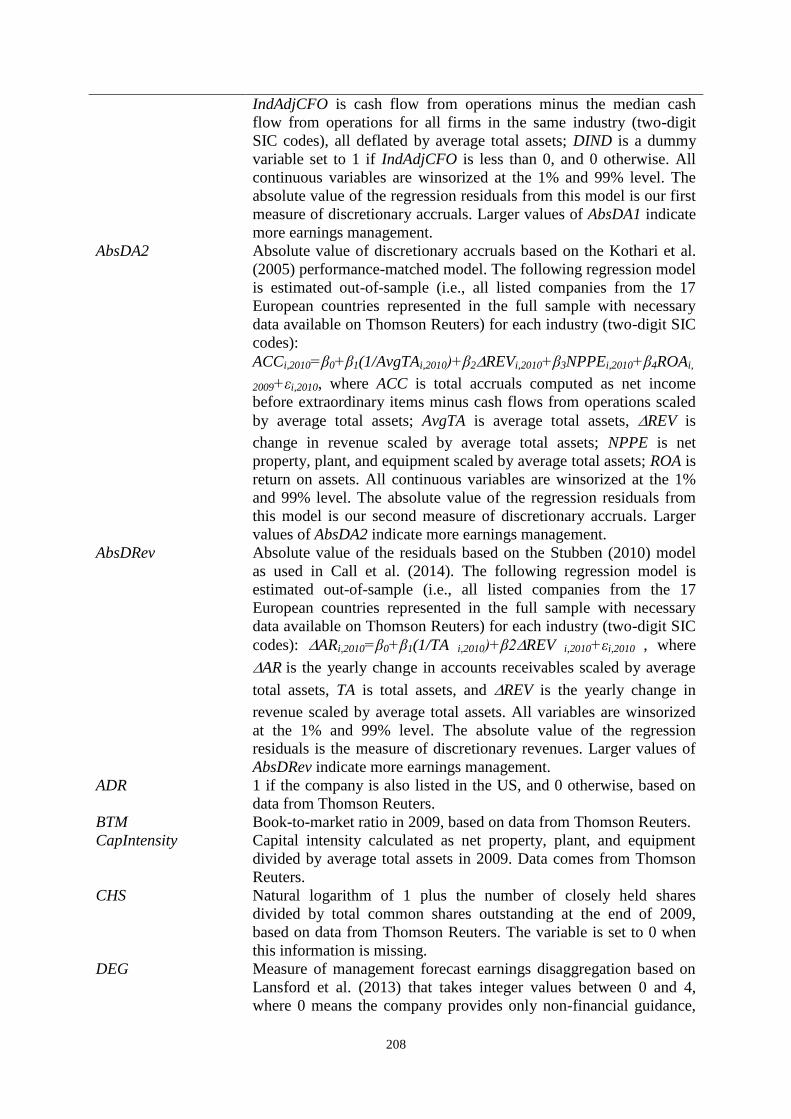
208
IndAdjCFO is cash flow from operations minus the median cash
flow from operations for all firms in the same industry (two-digit
SIC codes), all deflated by average total assets; DIND is a dummy
variable set to 1 if IndAdjCFO is less than 0, and 0 otherwise. All
continuous variables are winsorized at the 1% and 99% level. The
absolute value of the regression residuals from this model is our first
measure of discretionary accruals. Larger values of AbsDA1 indicate
more earnings management.
AbsDA2 Absolute value of discretionary accruals based on the Kothari et al.
(2005) performance-matched model. The following regression model
is estimated out-of-sample (i.e., all listed companies from the 17
European countries represented in the full sample with necessary
data available on Thomson Reuters) for each industry (two-digit SIC
codes):
ACCi,2010=β0+β1(1/AvgTAi,2010)+β2∆REVi,2010+β3NPPEi,2010+β4ROAi,
2009+εi,2010, where ACC is total accruals computed as net income
before extraordinary items minus cash flows from operations scaled
by average total assets; AvgTA is average total assets, ∆REV is
change in revenue scaled by average total assets; NPPE is net
property, plant, and equipment scaled by average total assets; ROA is
return on assets. All continuous variables are winsorized at the 1%
and 99% level. The absolute value of the regression residuals from
this model is our second measure of discretionary accruals. Larger
values of AbsDA2 indicate more earnings management.
AbsDRev Absolute value of the residuals based on the Stubben (2010) model
as used in Call et al. (2014). The following regression model is
estimated out-of-sample (i.e., all listed companies from the 17
European countries represented in the full sample with necessary
data available on Thomson Reuters) for each industry (two-digit SIC
codes): ∆ARi,2010=β0+β1(1/TA i,2010)+β2∆REV i,2010+εi,2010 , where
∆AR is the yearly change in accounts receivables scaled by average
total assets, TA is total assets, and ∆REV is the yearly change in
revenue scaled by average total assets. All variables are winsorized
at the 1% and 99% level. The absolute value of the regression
residuals is the measure of discretionary revenues. Larger values of
AbsDRev indicate more earnings management.
ADR 1 if the company is also listed in the US, and 0 otherwise, based on
data from Thomson Reuters.
BTM Book-to-market ratio in 2009, based on data from Thomson Reuters.
CapIntensity Capital intensity calculated as net property, plant, and equipment
divided by average total assets in 2009. Data comes from Thomson
Reuters.
CHS Natural logarithm of 1 plus the number of closely held shares
divided by total common shares outstanding at the end of 2009,
based on data from Thomson Reuters. The variable is set to 0 when
this information is missing.
DEG Measure of management forecast earnings disaggregation based on
Lansford et al. (2013) that takes integer values between 0 and 4,
where 0 means the company provides only non-financial guidance,
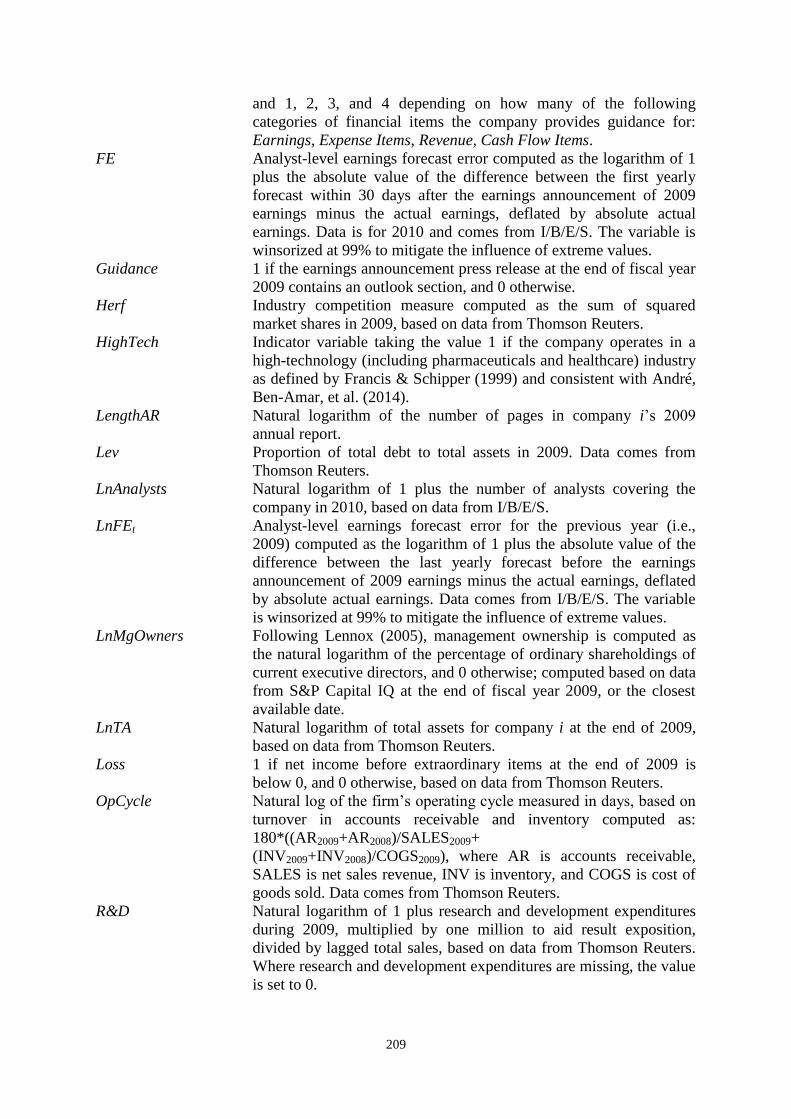
209
and 1, 2, 3, and 4 depending on how many of the following
categories of financial items the company provides guidance for:
Earnings, Expense Items, Revenue, Cash Flow Items.
FE Analyst-level earnings forecast error computed as the logarithm of 1
plus the absolute value of the difference between the first yearly
forecast within 30 days after the earnings announcement of 2009
earnings minus the actual earnings, deflated by absolute actual
earnings. Data is for 2010 and comes from I/B/E/S. The variable is
winsorized at 99% to mitigate the influence of extreme values.
Guidance 1 if the earnings announcement press release at the end of fiscal year
2009 contains an outlook section, and 0 otherwise.
Herf Industry competition measure computed as the sum of squared
market shares in 2009, based on data from Thomson Reuters.
HighTech Indicator variable taking the value 1 if the company operates in a
high-technology (including pharmaceuticals and healthcare) industry
as defined by Francis & Schipper (1999) and consistent with André,
Ben-Amar, et al. (2014).
LengthAR Natural logarithm of the number of pages in company i’s 2009
annual report.
Lev Proportion of total debt to total assets in 2009. Data comes from
Thomson Reuters.
LnAnalysts Natural logarithm of 1 plus the number of analysts covering the
company in 2010, based on data from I/B/E/S.
LnFEt Analyst-level earnings forecast error for the previous year (i.e.,
2009) computed as the logarithm of 1 plus the absolute value of the
difference between the last yearly forecast before the earnings
announcement of 2009 earnings minus the actual earnings, deflated
by absolute actual earnings. Data comes from I/B/E/S. The variable
is winsorized at 99% to mitigate the influence of extreme values.
LnMgOwners Following Lennox (2005), management ownership is computed as
the natural logarithm of the percentage of ordinary shareholdings of
current executive directors, and 0 otherwise; computed based on data
from S&P Capital IQ at the end of fiscal year 2009, or the closest
available date.
LnTA Natural logarithm of total assets for company i at the end of 2009,
based on data from Thomson Reuters.
Loss 1 if net income before extraordinary items at the end of 2009 is
below 0, and 0 otherwise, based on data from Thomson Reuters.
OpCycle Natural log of the firm’s operating cycle measured in days, based on
turnover in accounts receivable and inventory computed as:
180*((AR2009+AR2008)/SALES2009+
(INV2009+INV2008)/COGS2009), where AR is accounts receivable,
SALES is net sales revenue, INV is inventory, and COGS is cost of
goods sold. Data comes from Thomson Reuters.
R&D Natural logarithm of 1 plus research and development expenditures
during 2009, multiplied by one million to aid result exposition,
divided by lagged total sales, based on data from Thomson Reuters.
Where research and development expenditures are missing, the value
is set to 0.
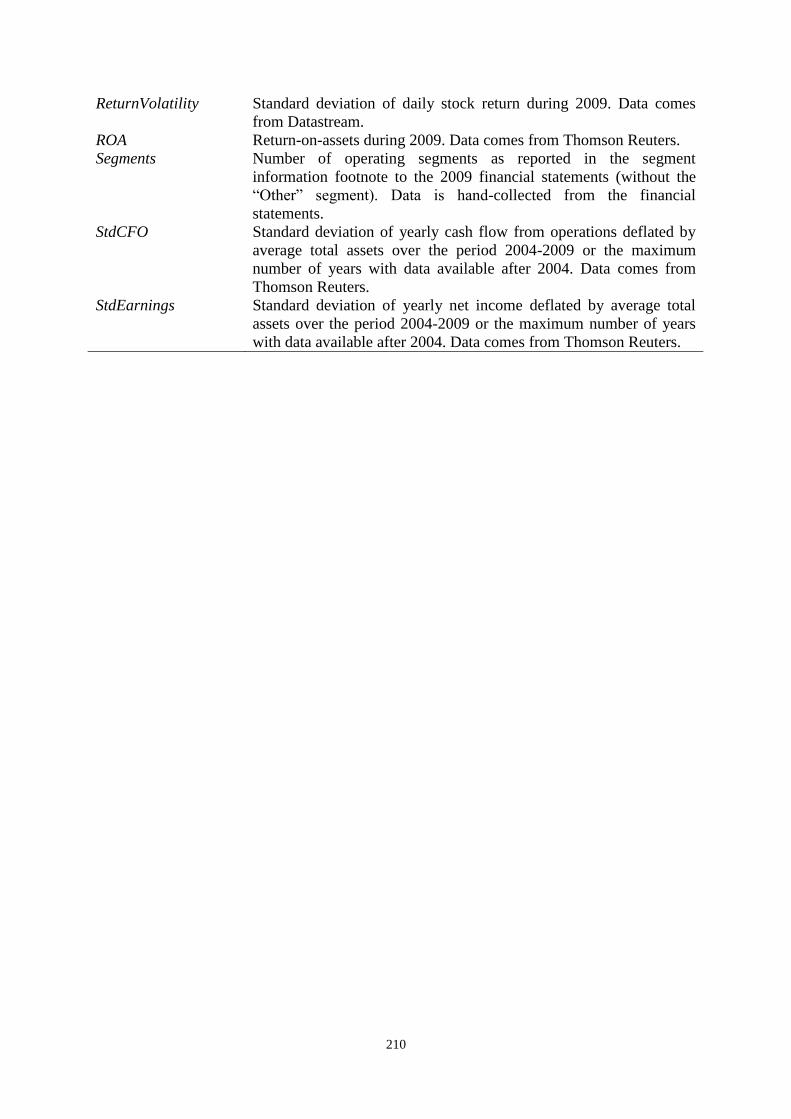
210
ReturnVolatility Standard deviation of daily stock return during 2009. Data comes
from Datastream.
ROA Return-on-assets during 2009. Data comes from Thomson Reuters.
Segments Number of operating segments as reported in the segment
information footnote to the 2009 financial statements (without the
“Other” segment). Data is hand-collected from the financial
statements.
StdCFO Standard deviation of yearly cash flow from operations deflated by
average total assets over the period 2004-2009 or the maximum
number of years with data available after 2004. Data comes from
Thomson Reuters.
StdEarnings Standard deviation of yearly net income deflated by average total
assets over the period 2004-2009 or the maximum number of years
with data available after 2004. Data comes from Thomson Reuters.
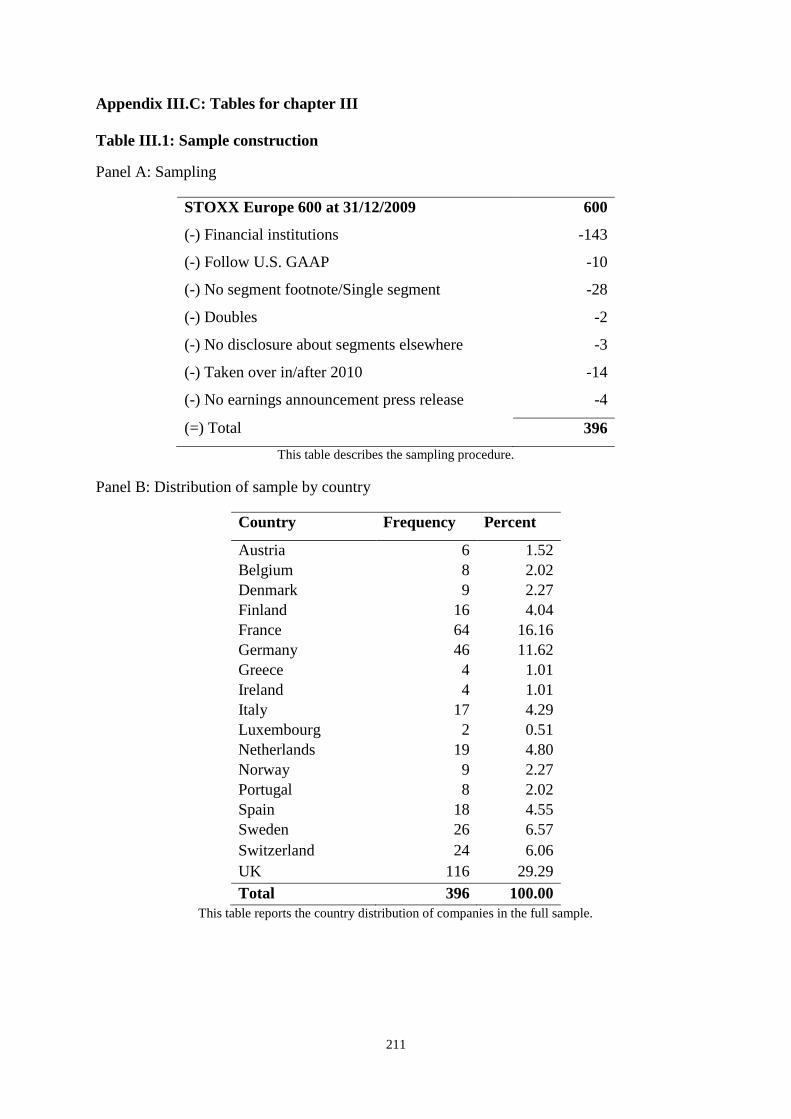
211
Appendix III.C: Tables for chapter III
Table III.1: Sample construction
Panel A: Sampling
STOXX Europe 600 at 31/12/2009 600
(-) Financial institutions -143
(-) Follow U.S. GAAP -10
(-) No segment footnote/Single segment -28
(-) Doubles -2
(-) No disclosure about segments elsewhere -3
(-) Taken over in/after 2010 -14
(-) No earnings announcement press release -4
(=) Total 396
This table describes the sampling procedure.
Panel B: Distribution of sample by country
Country Frequency Percent
Austria 6 1.52
Belgium 8 2.02
Denmark 9 2.27
Finland 16 4.04
France 64 16.16
Germany 46 11.62
Greece 4 1.01
Ireland 4 1.01
Italy 17 4.29
Luxembourg 2 0.51
Netherlands 19 4.80
Norway 9 2.27
Portugal 8 2.02
Spain 18 4.55
Sweden 26 6.57
Switzerland 24 6.06
UK 116 29.29
Total 396 100.00
This table reports the country distribution of companies in the full sample.
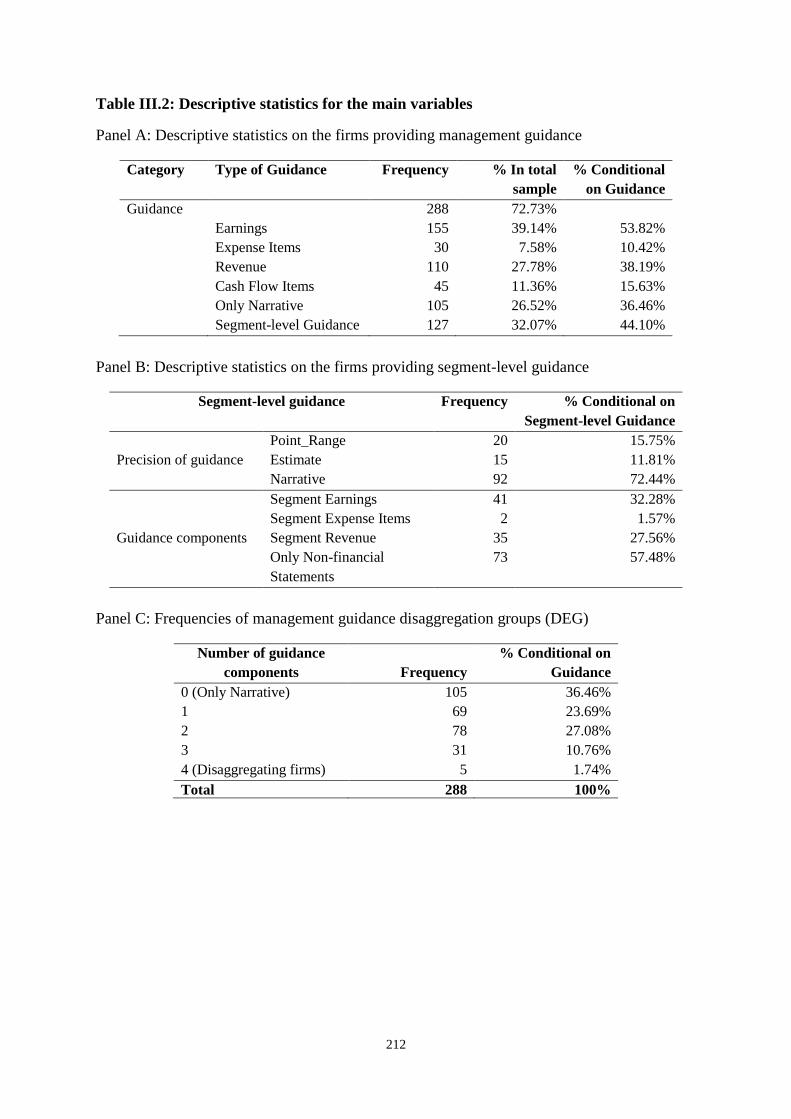
212
Table III.2: Descriptive statistics for the main variables
Panel A: Descriptive statistics on the firms providing management guidance
Category Type of Guidance Frequency % In total
sample
% Conditional
on Guidance
Guidance 288 72.73%
Earnings 155 39.14% 53.82%
Expense Items 30 7.58% 10.42%
Revenue 110 27.78% 38.19%
Cash Flow Items 45 11.36% 15.63%
Only Narrative 105 26.52% 36.46%
Segment-level Guidance 127 32.07% 44.10%
Panel B: Descriptive statistics on the firms providing segment-level guidance
Segment-level guidance Frequency % Conditional on
Segment-level Guidance
Precision of guidance
Point_Range 20 15.75%
Estimate 15 11.81%
Narrative 92 72.44%
Guidance components
Segment Earnings 41 32.28%
Segment Expense Items 2 1.57%
Segment Revenue 35 27.56%
Only Non-financial
Statements
73 57.48%
Panel C: Frequencies of management guidance disaggregation groups (DEG)
Number of guidance
components Frequency
% Conditional on
Guidance
0 (Only Narrative) 105 36.46%
1 69 23.69%
2 78 27.08%
3 31 10.76%
4 (Disaggregating firms) 5 1.74%
Total 288 100%
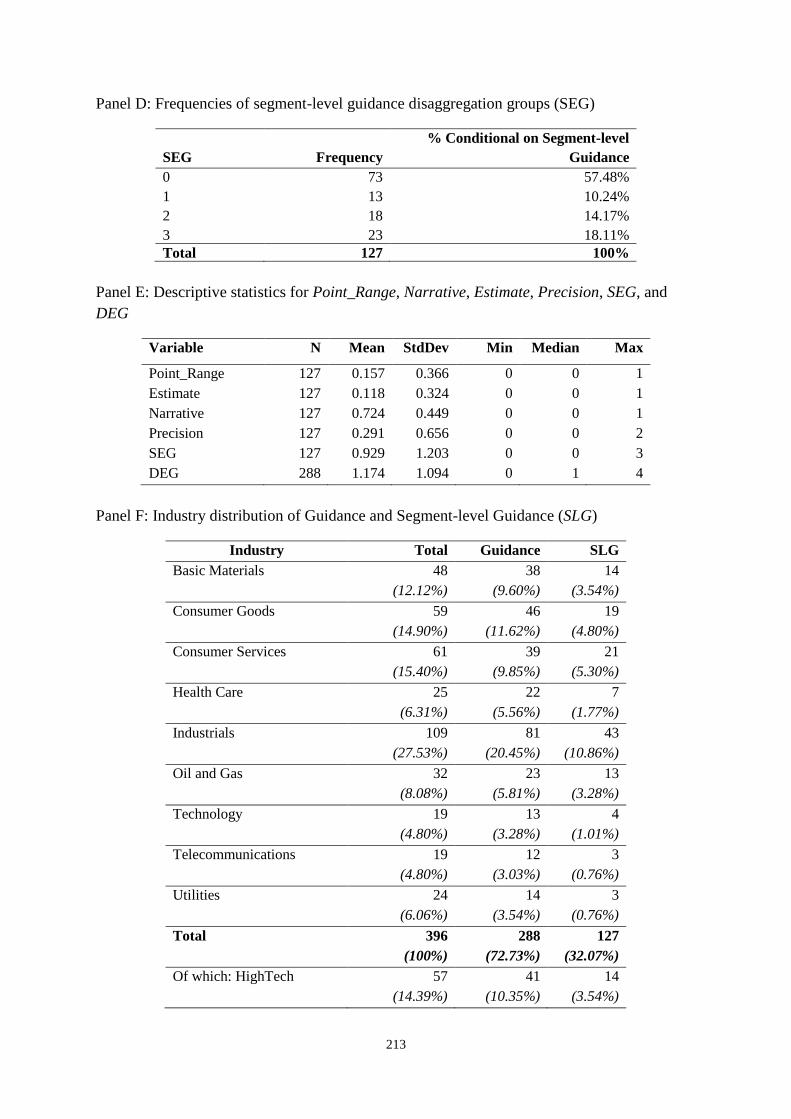
213
Panel D: Frequencies of segment-level guidance disaggregation groups (SEG)
SEG Frequency
% Conditional on Segment-level
Guidance
0 73 57.48%
1 13 10.24%
2 18 14.17%
3 23 18.11%
Total 127 100%
Panel E: Descriptive statistics for Point_Range, Narrative, Estimate, Precision, SEG, and
DEG
Variable N Mean StdDev Min Median Max
Point_Range 127 0.157 0.366 0 0 1
Estimate 127 0.118 0.324 0 0 1
Narrative 127 0.724 0.449 0 0 1
Precision 127 0.291 0.656 0 0 2
SEG 127 0.929 1.203 0 0 3
DEG 288 1.174 1.094 0 1 4
Panel F: Industry distribution of Guidance and Segment-level Guidance (SLG)
Industry Total Guidance SLG
Basic Materials 48 38 14
(12.12%) (9.60%) (3.54%)
Consumer Goods 59 46 19
(14.90%) (11.62%) (4.80%)
Consumer Services 61 39 21
(15.40%) (9.85%) (5.30%)
Health Care 25 22 7
(6.31%) (5.56%) (1.77%)
Industrials 109 81 43
(27.53%) (20.45%) (10.86%)
Oil and Gas 32 23 13
(8.08%) (5.81%) (3.28%)
Technology 19 13 4
(4.80%) (3.28%) (1.01%)
Telecommunications 19 12 3
(4.80%) (3.03%) (0.76%)
Utilities 24 14 3
(6.06%) (3.54%) (0.76%)
Total 396 288 127
(100%) (72.73%) (32.07%)
Of which: HighTech 57 41 14
(14.39%) (10.35%) (3.54%)

214
This table presents the industry distribution of the companies included in the sample, based on the ICB industry
classification codes. HighTech is and indicator variable taking the value 1 if the company operates in a high-
technology (including pharmaceuticals and healthcare) industry as defined by Francis & Schipper (1999), and 0
otherwise.
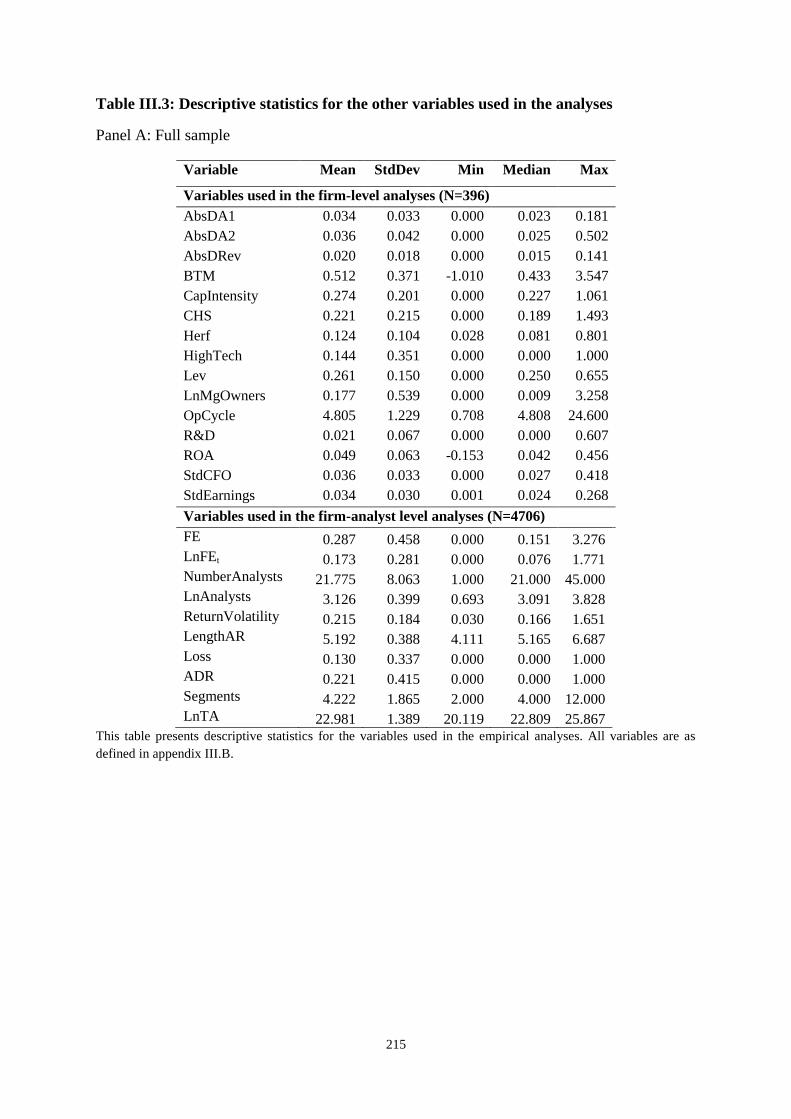
215
Table III.3: Descriptive statistics for the other variables used in the analyses
Panel A: Full sample
Variable Mean StdDev Min Median Max
Variables used in the firm-level analyses (N=396)
AbsDA1 0.034 0.033 0.000 0.023 0.181
AbsDA2 0.036 0.042 0.000 0.025 0.502
AbsDRev 0.020 0.018 0.000 0.015 0.141
BTM 0.512 0.371 -1.010 0.433 3.547
CapIntensity 0.274 0.201 0.000 0.227 1.061
CHS 0.221 0.215 0.000 0.189 1.493
Herf 0.124 0.104 0.028 0.081 0.801
HighTech 0.144 0.351 0.000 0.000 1.000
Lev 0.261 0.150 0.000 0.250 0.655
LnMgOwners 0.177 0.539 0.000 0.009 3.258
OpCycle 4.805 1.229 0.708 4.808 24.600
R&D 0.021 0.067 0.000 0.000 0.607
ROA 0.049 0.063 -0.153 0.042 0.456
StdCFO 0.036 0.033 0.000 0.027 0.418
StdEarnings 0.034 0.030 0.001 0.024 0.268
Variables used in the firm-analyst level analyses (N=4706)
FE 0.287 0.458 0.000 0.151 3.276
LnFEt 0.173 0.281 0.000 0.076 1.771
NumberAnalysts 21.775 8.063 1.000 21.000 45.000
LnAnalysts 3.126 0.399 0.693 3.091 3.828
ReturnVolatility 0.215 0.184 0.030 0.166 1.651
LengthAR 5.192 0.388 4.111 5.165 6.687
Loss 0.130 0.337 0.000 0.000 1.000
ADR 0.221 0.415 0.000 0.000 1.000
Segments 4.222 1.865 2.000 4.000 12.000
LnTA 22.981 1.389 20.119 22.809 25.867 This table presents descriptive statistics for the variables used in the empirical analyses. All variables are as
defined in appendix III.B.
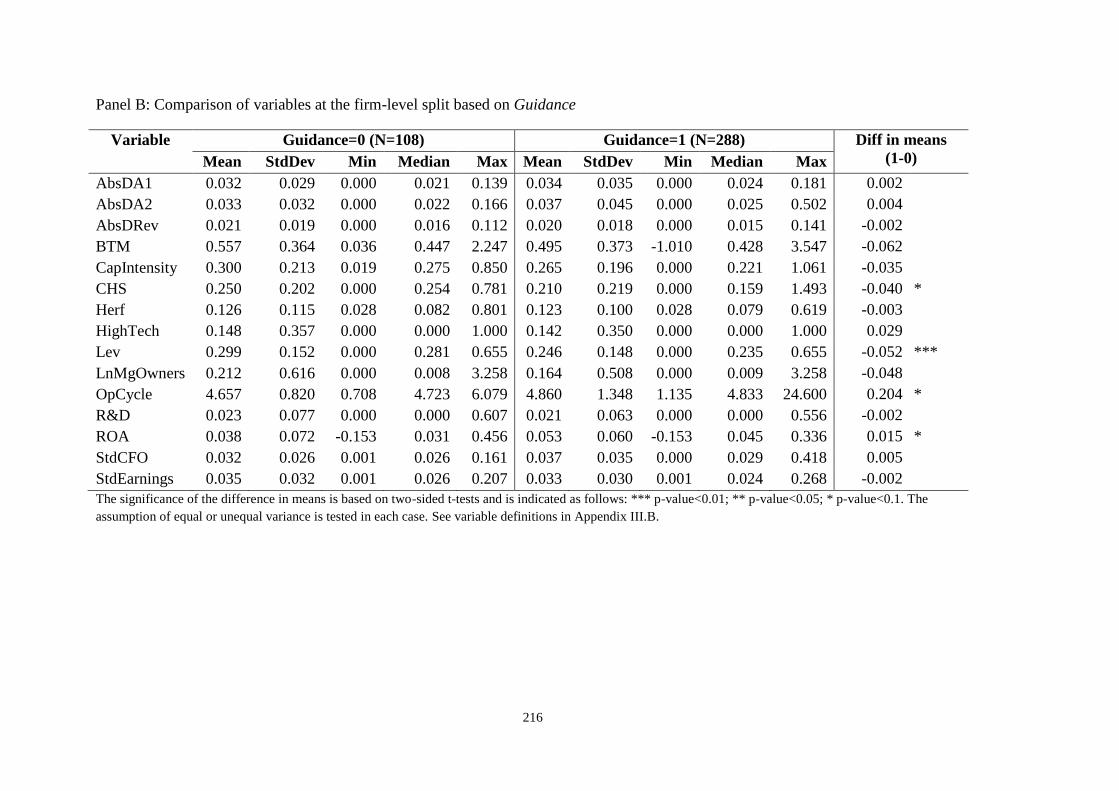
216
Panel B: Comparison of variables at the firm-level split based on Guidance
Variable Guidance=0 (N=108) Guidance=1 (N=288) Diff in means
(1-0) Mean StdDev Min Median Max Mean StdDev Min Median Max
AbsDA1 0.032 0.029 0.000 0.021 0.139 0.034 0.035 0.000 0.024 0.181 0.002
AbsDA2 0.033 0.032 0.000 0.022 0.166 0.037 0.045 0.000 0.025 0.502 0.004
AbsDRev 0.021 0.019 0.000 0.016 0.112 0.020 0.018 0.000 0.015 0.141 -0.002
BTM 0.557 0.364 0.036 0.447 2.247 0.495 0.373 -1.010 0.428 3.547 -0.062
CapIntensity 0.300 0.213 0.019 0.275 0.850 0.265 0.196 0.000 0.221 1.061 -0.035
CHS 0.250 0.202 0.000 0.254 0.781 0.210 0.219 0.000 0.159 1.493 -0.040 *
Herf 0.126 0.115 0.028 0.082 0.801 0.123 0.100 0.028 0.079 0.619 -0.003
HighTech 0.148 0.357 0.000 0.000 1.000 0.142 0.350 0.000 0.000 1.000 0.029
Lev 0.299 0.152 0.000 0.281 0.655 0.246 0.148 0.000 0.235 0.655 -0.052 ***
LnMgOwners 0.212 0.616 0.000 0.008 3.258 0.164 0.508 0.000 0.009 3.258 -0.048
OpCycle 4.657 0.820 0.708 4.723 6.079 4.860 1.348 1.135 4.833 24.600 0.204 *
R&D 0.023 0.077 0.000 0.000 0.607 0.021 0.063 0.000 0.000 0.556 -0.002
ROA 0.038 0.072 -0.153 0.031 0.456 0.053 0.060 -0.153 0.045 0.336 0.015 *
StdCFO 0.032 0.026 0.001 0.026 0.161 0.037 0.035 0.000 0.029 0.418 0.005
StdEarnings 0.035 0.032 0.001 0.026 0.207 0.033 0.030 0.001 0.024 0.268 -0.002
The significance of the difference in means is based on two-sided t-tests and is indicated as follows: *** p-value<0.01; ** p-value<0.05; * p-value<0.1. The
assumption of equal or unequal variance is tested in each case. See variable definitions in Appendix III.B.

217
Panel C: Comparison of variables at the analyst-firm level split based on Guidance
Variable Guidance=0 (N=1312) Guidance=1 (N=3394) Diff in means
(1-0) Mean StdDev Min Median Max Mean StdDev Min Median Max
FE 0.371 0.564 0.000 0.190 3.276 0.255 0.405 0.000 0.139 3.276 -0.117 ***
LnFEt 0.210 0.314 0.000 0.111 1.771 0.159 0.265 0.000 0.067 1.771 -0.052 ***
LnAnalysts 3.513 0.383 1.386 3.611 4.025 3.438 0.404 1.386 3.497 4.190 -0.075 ***
ReturnVolatility 0.239 0.245 0.046 0.173 1.566 0.206 0.153 0.030 0.159 1.651 -0.033 ***
LengthAR 5.187 0.410 4.111 5.147 6.261 5.194 0.379 4.159 5.193 6.687 0.007
Loss 0.204 0.403 0.000 0.000 1.000 0.102 0.303 0.000 0.000 1.000 -0.101 ***
ADR 0.211 0.408 0.000 0.000 1.000 0.225 0.417 0.000 0.000 1.000 0.013
Segments 4.634 2.217 2.000 4.000 12.000 4.062 1.683 2.000 4.000 11.000 -0.572 ***
LnTA 23.159 1.282 20.182 23.148 25.867 22.913 1.423 20.119 22.719 25.867 -0.246 ***
The significance of the difference in means is based on two-sided t-tests and is indicated as follows: *** p-value<0.01; ** p-value<0.05; * p-value<0.1. The
assumption of equal or unequal variance is tested in each case. See variable definitions in Appendix III.B.
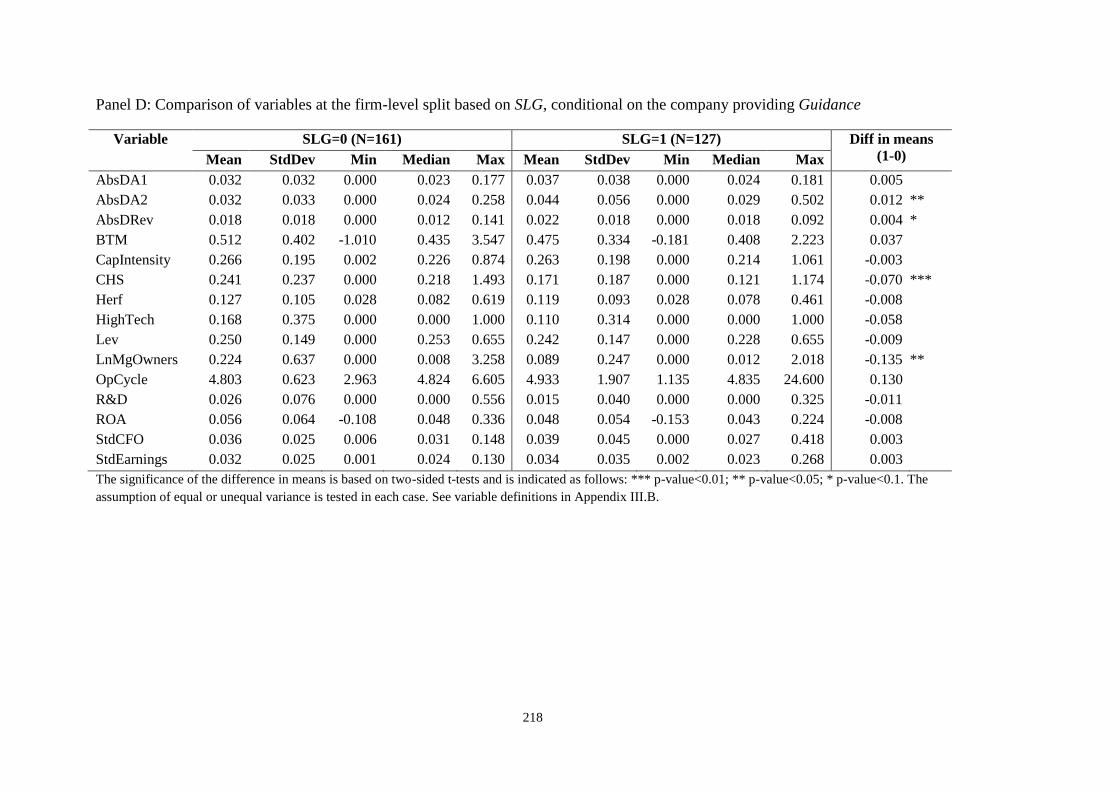
218
Panel D: Comparison of variables at the firm-level split based on SLG, conditional on the company providing Guidance
Variable SLG=0 (N=161) SLG=1 (N=127) Diff in means
(1-0) Mean StdDev Min Median Max Mean StdDev Min Median Max
AbsDA1 0.032 0.032 0.000 0.023 0.177 0.037 0.038 0.000 0.024 0.181 0.005
AbsDA2 0.032 0.033 0.000 0.024 0.258 0.044 0.056 0.000 0.029 0.502 0.012 **
AbsDRev 0.018 0.018 0.000 0.012 0.141 0.022 0.018 0.000 0.018 0.092 0.004 *
BTM 0.512 0.402 -1.010 0.435 3.547 0.475 0.334 -0.181 0.408 2.223 0.037
CapIntensity 0.266 0.195 0.002 0.226 0.874 0.263 0.198 0.000 0.214 1.061 -0.003
CHS 0.241 0.237 0.000 0.218 1.493 0.171 0.187 0.000 0.121 1.174 -0.070 ***
Herf 0.127 0.105 0.028 0.082 0.619 0.119 0.093 0.028 0.078 0.461 -0.008
HighTech 0.168 0.375 0.000 0.000 1.000 0.110 0.314 0.000 0.000 1.000 -0.058
Lev 0.250 0.149 0.000 0.253 0.655 0.242 0.147 0.000 0.228 0.655 -0.009
LnMgOwners 0.224 0.637 0.000 0.008 3.258 0.089 0.247 0.000 0.012 2.018 -0.135 **
OpCycle 4.803 0.623 2.963 4.824 6.605 4.933 1.907 1.135 4.835 24.600 0.130
R&D 0.026 0.076 0.000 0.000 0.556 0.015 0.040 0.000 0.000 0.325 -0.011
ROA 0.056 0.064 -0.108 0.048 0.336 0.048 0.054 -0.153 0.043 0.224 -0.008
StdCFO 0.036 0.025 0.006 0.031 0.148 0.039 0.045 0.000 0.027 0.418 0.003
StdEarnings 0.032 0.025 0.001 0.024 0.130 0.034 0.035 0.002 0.023 0.268 0.003
The significance of the difference in means is based on two-sided t-tests and is indicated as follows: *** p-value<0.01; ** p-value<0.05; * p-value<0.1. The
assumption of equal or unequal variance is tested in each case. See variable definitions in Appendix III.B.
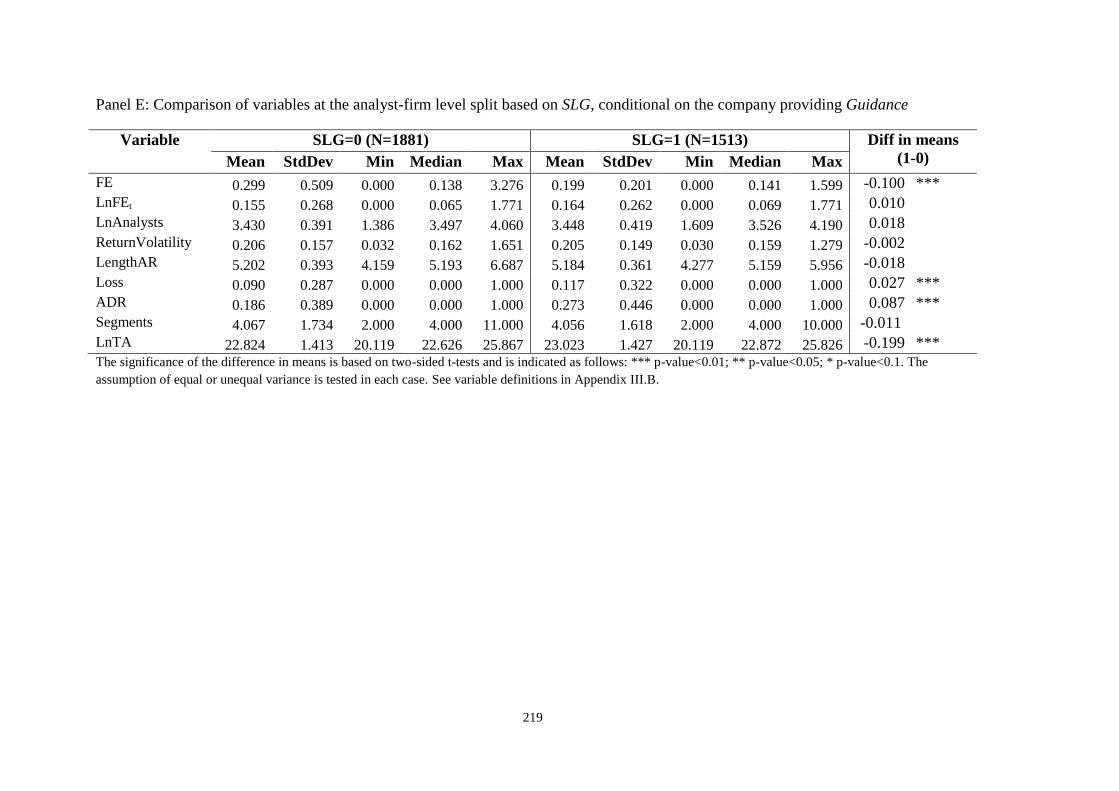
219
Panel E: Comparison of variables at the analyst-firm level split based on SLG, conditional on the company providing Guidance
Variable SLG=0 (N=1881) SLG=1 (N=1513) Diff in means
(1-0) Mean StdDev Min Median Max Mean StdDev Min Median Max
FE 0.299 0.509 0.000 0.138 3.276 0.199 0.201 0.000 0.141 1.599 -0.100 ***
LnFEt 0.155 0.268 0.000 0.065 1.771 0.164 0.262 0.000 0.069 1.771 0.010
LnAnalysts 3.430 0.391 1.386 3.497 4.060 3.448 0.419 1.609 3.526 4.190 0.018
ReturnVolatility 0.206 0.157 0.032 0.162 1.651 0.205 0.149 0.030 0.159 1.279 -0.002
LengthAR 5.202 0.393 4.159 5.193 6.687 5.184 0.361 4.277 5.159 5.956 -0.018
Loss 0.090 0.287 0.000 0.000 1.000 0.117 0.322 0.000 0.000 1.000 0.027 ***
ADR 0.186 0.389 0.000 0.000 1.000 0.273 0.446 0.000 0.000 1.000 0.087 ***
Segments 4.067 1.734 2.000 4.000 11.000 4.056 1.618 2.000 4.000 10.000 -0.011
LnTA 22.824 1.413 20.119 22.626 25.867 23.023 1.427 20.119 22.872 25.826 -0.199 ***
The significance of the difference in means is based on two-sided t-tests and is indicated as follows: *** p-value<0.01; ** p-value<0.05; * p-value<0.1. The
assumption of equal or unequal variance is tested in each case. See variable definitions in Appendix III.B.
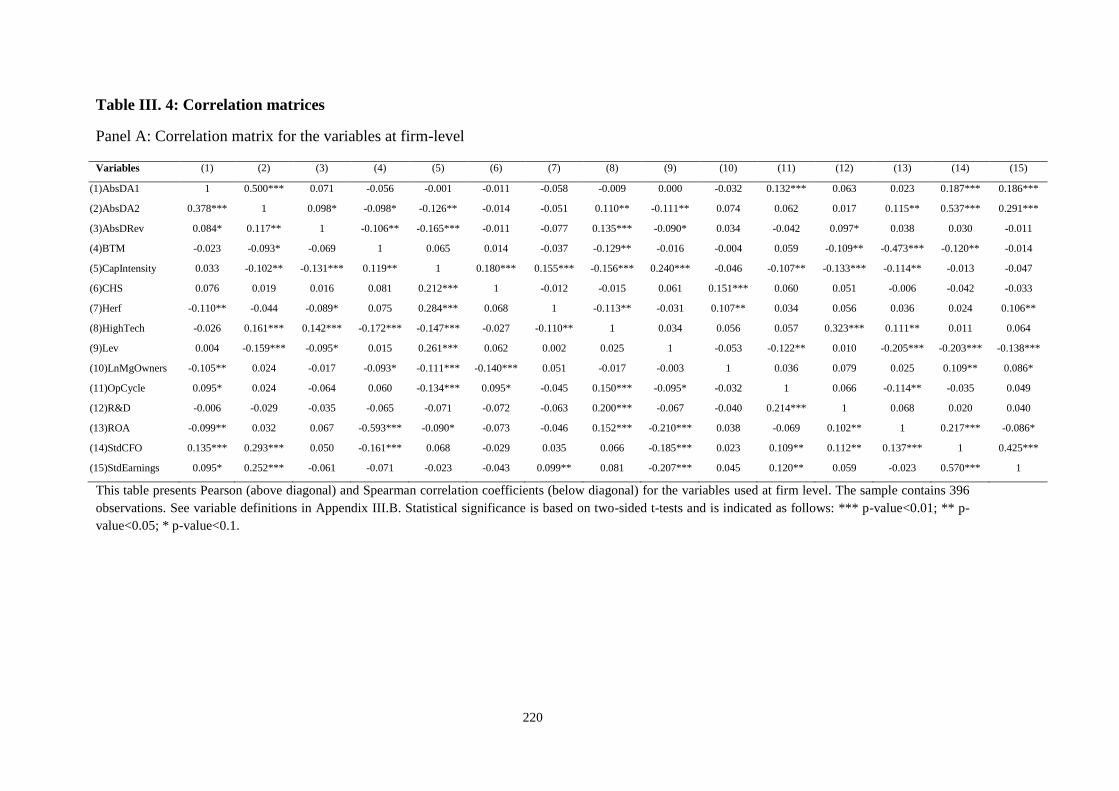
220
Table III. 4: Correlation matrices
Panel A: Correlation matrix for the variables at firm-level
Variables (1) (2) (3) (4) (5) (6) (7) (8) (9) (10) (11) (12) (13) (14) (15)
(1)AbsDA1 1 0.500*** 0.071 -0.056 -0.001 -0.011 -0.058 -0.009 0.000 -0.032 0.132*** 0.063 0.023 0.187*** 0.186***
(2)AbsDA2 0.378*** 1 0.098* -0.098* -0.126** -0.014 -0.051 0.110** -0.111** 0.074 0.062 0.017 0.115** 0.537*** 0.291***
(3)AbsDRev 0.084* 0.117** 1 -0.106** -0.165*** -0.011 -0.077 0.135*** -0.090* 0.034 -0.042 0.097* 0.038 0.030 -0.011
(4)BTM -0.023 -0.093* -0.069 1 0.065 0.014 -0.037 -0.129** -0.016 -0.004 0.059 -0.109** -0.473*** -0.120** -0.014
(5)CapIntensity 0.033 -0.102** -0.131*** 0.119** 1 0.180*** 0.155*** -0.156*** 0.240*** -0.046 -0.107** -0.133*** -0.114** -0.013 -0.047
(6)CHS 0.076 0.019 0.016 0.081 0.212*** 1 -0.012 -0.015 0.061 0.151*** 0.060 0.051 -0.006 -0.042 -0.033
(7)Herf -0.110** -0.044 -0.089* 0.075 0.284*** 0.068 1 -0.113** -0.031 0.107** 0.034 0.056 0.036 0.024 0.106**
(8)HighTech -0.026 0.161*** 0.142*** -0.172*** -0.147*** -0.027 -0.110** 1 0.034 0.056 0.057 0.323*** 0.111** 0.011 0.064
(9)Lev 0.004 -0.159*** -0.095* 0.015 0.261*** 0.062 0.002 0.025 1 -0.053 -0.122** 0.010 -0.205*** -0.203*** -0.138***
(10)LnMgOwners -0.105** 0.024 -0.017 -0.093* -0.111*** -0.140*** 0.051 -0.017 -0.003 1 0.036 0.079 0.025 0.109** 0.086*
(11)OpCycle 0.095* 0.024 -0.064 0.060 -0.134*** 0.095* -0.045 0.150*** -0.095* -0.032 1 0.066 -0.114** -0.035 0.049
(12)R&D -0.006 -0.029 -0.035 -0.065 -0.071 -0.072 -0.063 0.200*** -0.067 -0.040 0.214*** 1 0.068 0.020 0.040
(13)ROA -0.099** 0.032 0.067 -0.593*** -0.090* -0.073 -0.046 0.152*** -0.210*** 0.038 -0.069 0.102** 1 0.217*** -0.086*
(14)StdCFO 0.135*** 0.293*** 0.050 -0.161*** 0.068 -0.029 0.035 0.066 -0.185*** 0.023 0.109** 0.112** 0.137*** 1 0.425***
(15)StdEarnings 0.095* 0.252*** -0.061 -0.071 -0.023 -0.043 0.099** 0.081 -0.207*** 0.045 0.120** 0.059 -0.023 0.570*** 1
This table presents Pearson (above diagonal) and Spearman correlation coefficients (below diagonal) for the variables used at firm level. The sample contains 396
observations. See variable definitions in Appendix III.B. Statistical significance is based on two-sided t-tests and is indicated as follows: *** p-value<0.01; ** p-
value<0.05; * p-value<0.1.
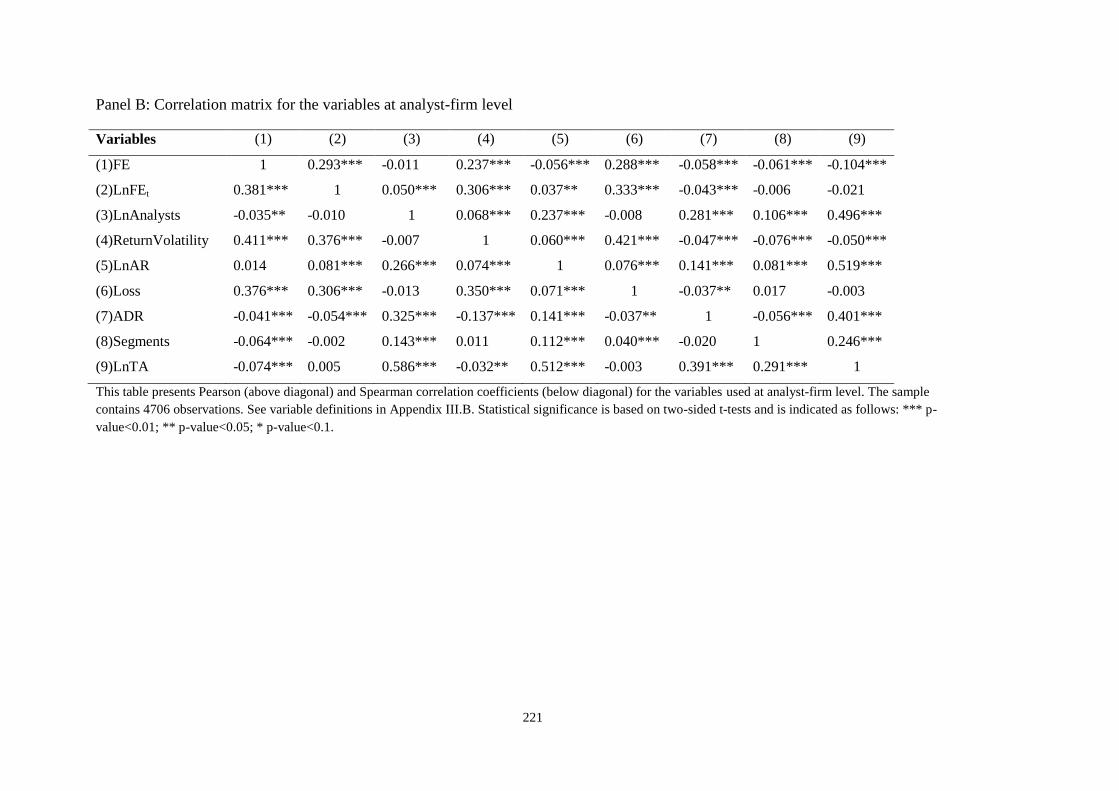
221
Panel B: Correlation matrix for the variables at analyst-firm level
Variables (1) (2) (3) (4) (5) (6) (7) (8) (9)
(1)FE 1 0.293*** -0.011 0.237*** -0.056*** 0.288*** -0.058*** -0.061*** -0.104***
(2)LnFEt 0.381*** 1 0.050*** 0.306*** 0.037** 0.333*** -0.043*** -0.006 -0.021
(3)LnAnalysts -0.035** -0.010 1 0.068*** 0.237*** -0.008 0.281*** 0.106*** 0.496***
(4)ReturnVolatility 0.411*** 0.376*** -0.007 1 0.060*** 0.421*** -0.047*** -0.076*** -0.050***
(5)LnAR 0.014 0.081*** 0.266*** 0.074*** 1 0.076*** 0.141*** 0.081*** 0.519***
(6)Loss 0.376*** 0.306*** -0.013 0.350*** 0.071*** 1 -0.037** 0.017 -0.003
(7)ADR -0.041*** -0.054*** 0.325*** -0.137*** 0.141*** -0.037** 1 -0.056*** 0.401***
(8)Segments -0.064*** -0.002 0.143*** 0.011 0.112*** 0.040*** -0.020 1 0.246***
(9)LnTA -0.074*** 0.005 0.586*** -0.032** 0.512*** -0.003 0.391*** 0.291*** 1
This table presents Pearson (above diagonal) and Spearman correlation coefficients (below diagonal) for the variables used at analyst-firm level. The sample
contains 4706 observations. See variable definitions in Appendix III.B. Statistical significance is based on two-sided t-tests and is indicated as follows: *** p-
value<0.01; ** p-value<0.05; * p-value<0.1.
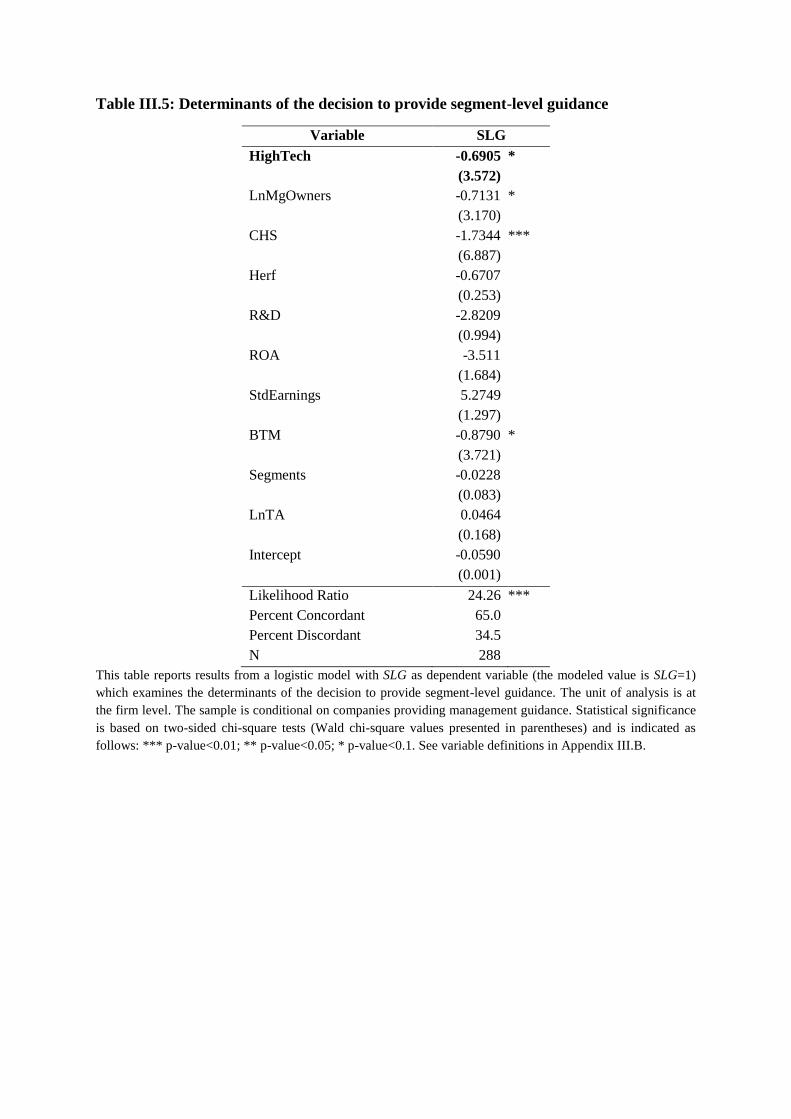
Table III.5: Determinants of the decision to provide segment-level guidance
Variable SLG
HighTech -0.6905 *
(3.572)
LnMgOwners -0.7131 *
(3.170)
CHS -1.7344 ***
(6.887)
Herf -0.6707
(0.253)
R&D -2.8209
(0.994)
ROA -3.511
(1.684)
StdEarnings 5.2749
(1.297)
BTM -0.8790 *
(3.721)
Segments -0.0228
(0.083)
LnTA 0.0464
(0.168)
Intercept -0.0590
(0.001)
Likelihood Ratio 24.26 ***
Percent Concordant 65.0
Percent Discordant 34.5
N 288
This table reports results from a logistic model with SLG as dependent variable (the modeled value is SLG=1)
which examines the determinants of the decision to provide segment-level guidance. The unit of analysis is at
the firm level. The sample is conditional on companies providing management guidance. Statistical significance
is based on two-sided chi-square tests (Wald chi-square values presented in parentheses) and is indicated as
follows: *** p-value<0.01; ** p-value<0.05; * p-value<0.1. See variable definitions in Appendix III.B.
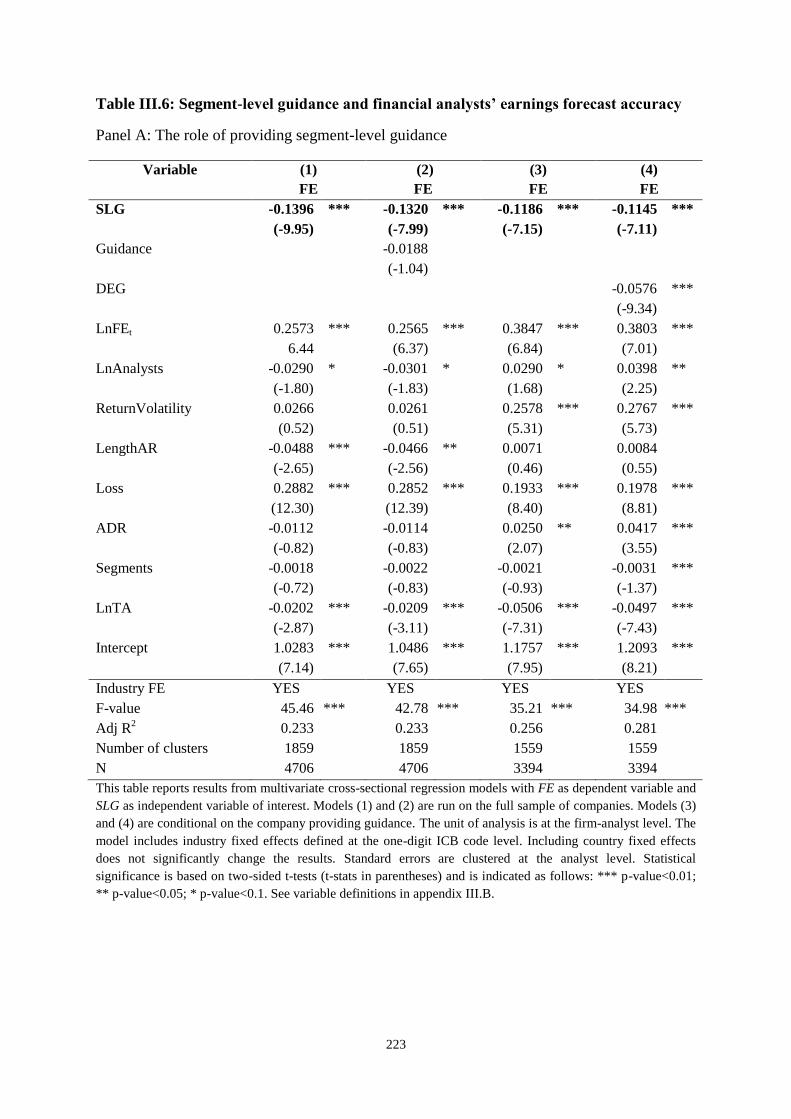
223
Table III.6: Segment-level guidance and financial analysts’ earnings forecast accuracy
Panel A: The role of providing segment-level guidance
Variable (1)
FE
(2)
FE
(3)
FE
(4)
FE
SLG -0.1396 *** -0.1320 *** -0.1186 *** -0.1145 ***
(-9.95) (-7.99) (-7.15) (-7.11)
Guidance -0.0188
(-1.04)
DEG -0.0576 ***
(-9.34)
LnFEt 0.2573 *** 0.2565 *** 0.3847 *** 0.3803 ***
6.44 (6.37) (6.84) (7.01)
LnAnalysts -0.0290 * -0.0301 * 0.0290 * 0.0398 **
(-1.80) (-1.83) (1.68) (2.25)
ReturnVolatility 0.0266 0.0261 0.2578 *** 0.2767 ***
(0.52) (0.51) (5.31) (5.73)
LengthAR -0.0488 *** -0.0466 ** 0.0071 0.0084
(-2.65) (-2.56) (0.46) (0.55)
Loss 0.2882 *** 0.2852 *** 0.1933 *** 0.1978 ***
(12.30) (12.39) (8.40) (8.81)
ADR -0.0112 -0.0114 0.0250 ** 0.0417 ***
(-0.82) (-0.83) (2.07) (3.55)
Segments -0.0018 -0.0022 -0.0021 -0.0031 ***
(-0.72) (-0.83) (-0.93) (-1.37)
LnTA -0.0202 *** -0.0209 *** -0.0506 *** -0.0497 ***
(-2.87) (-3.11) (-7.31) (-7.43)
Intercept 1.0283 *** 1.0486 *** 1.1757 *** 1.2093 ***
(7.14) (7.65) (7.95) (8.21)
Industry FE YES YES YES YES
F-value 45.46 *** 42.78 *** 35.21 *** 34.98 ***
Adj R2 0.233 0.233 0.256 0.281
Number of clusters 1859 1859 1559 1559
N 4706 4706 3394 3394
This table reports results from multivariate cross-sectional regression models with FE as dependent variable and
SLG as independent variable of interest. Models (1) and (2) are run on the full sample of companies. Models (3)
and (4) are conditional on the company providing guidance. The unit of analysis is at the firm-analyst level. The
model includes industry fixed effects defined at the one-digit ICB code level. Including country fixed effects
does not significantly change the results. Standard errors are clustered at the analyst level. Statistical
significance is based on two-sided t-tests (t-stats in parentheses) and is indicated as follows: *** p-value<0.01;
** p-value<0.05; * p-value<0.1. See variable definitions in appendix III.B.
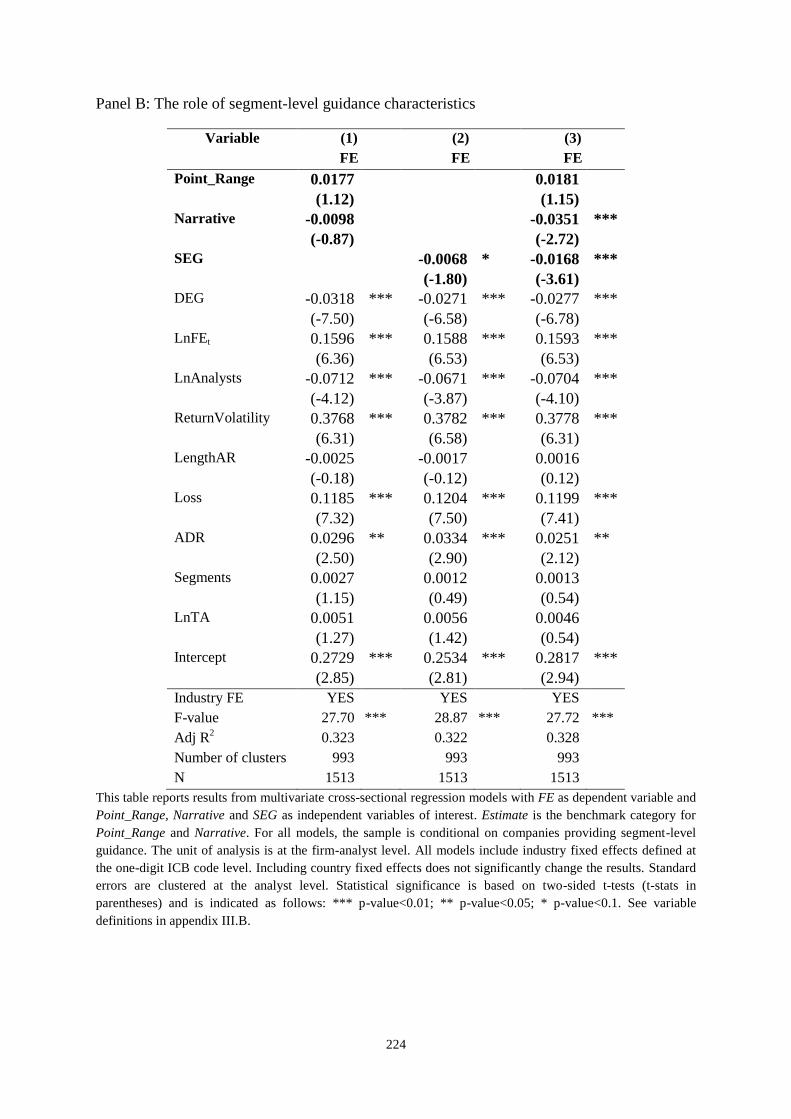
224
Panel B: The role of segment-level guidance characteristics
Variable (1) (2) (3)
FE FE FE
Point_Range 0.0177 0.0181
(1.12) (1.15)
Narrative -0.0098 -0.0351 ***
(-0.87) (-2.72)
SEG -0.0068 * -0.0168 ***
(-1.80) (-3.61)
DEG -0.0318 *** -0.0271 *** -0.0277 ***
(-7.50) (-6.58) (-6.78)
LnFEt 0.1596 *** 0.1588 *** 0.1593 ***
(6.36) (6.53) (6.53)
LnAnalysts -0.0712 *** -0.0671 *** -0.0704 ***
(-4.12) (-3.87) (-4.10)
ReturnVolatility 0.3768 *** 0.3782 *** 0.3778 ***
(6.31) (6.58) (6.31)
LengthAR -0.0025 -0.0017 0.0016
(-0.18) (-0.12) (0.12)
Loss 0.1185 *** 0.1204 *** 0.1199 ***
(7.32) (7.50) (7.41)
ADR 0.0296 ** 0.0334 *** 0.0251 **
(2.50) (2.90) (2.12)
Segments 0.0027 0.0012 0.0013
(1.15) (0.49) (0.54)
LnTA 0.0051 0.0056 0.0046
(1.27) (1.42) (0.54)
Intercept 0.2729 *** 0.2534 *** 0.2817 ***
(2.85) (2.81) (2.94)
Industry FE YES YES YES
F-value 27.70 *** 28.87 *** 27.72 ***
Adj R2 0.323 0.322 0.328
Number of clusters 993 993 993
N 1513 1513 1513
This table reports results from multivariate cross-sectional regression models with FE as dependent variable and
Point_Range, Narrative and SEG as independent variables of interest. Estimate is the benchmark category for
Point_Range and Narrative. For all models, the sample is conditional on companies providing segment-level
guidance. The unit of analysis is at the firm-analyst level. All models include industry fixed effects defined at
the one-digit ICB code level. Including country fixed effects does not significantly change the results. Standard
errors are clustered at the analyst level. Statistical significance is based on two-sided t-tests (t-stats in
parentheses) and is indicated as follows: *** p-value<0.01; ** p-value<0.05; * p-value<0.1. See variable
definitions in appendix III.B.
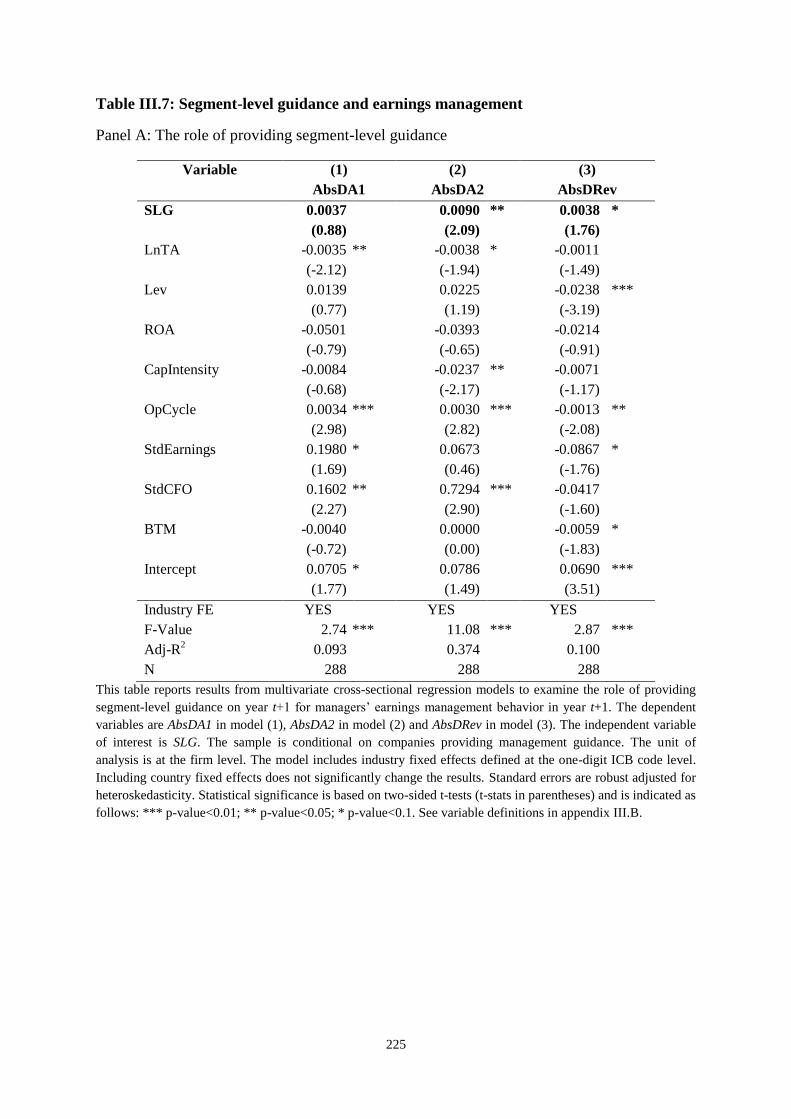
225
Table III.7: Segment-level guidance and earnings management
Panel A: The role of providing segment-level guidance
Variable (1) (2) (3)
AbsDA1 AbsDA2 AbsDRev
SLG 0.0037 0.0090 ** 0.0038 *
(0.88) (2.09) (1.76)
LnTA -0.0035 ** -0.0038 * -0.0011
(-2.12) (-1.94) (-1.49)
Lev 0.0139 0.0225 -0.0238 ***
(0.77) (1.19) (-3.19)
ROA -0.0501 -0.0393 -0.0214
(-0.79) (-0.65) (-0.91)
CapIntensity -0.0084 -0.0237 ** -0.0071
(-0.68) (-2.17) (-1.17)
OpCycle 0.0034 *** 0.0030 *** -0.0013 **
(2.98) (2.82) (-2.08)
StdEarnings 0.1980 * 0.0673 -0.0867 *
(1.69) (0.46) (-1.76)
StdCFO 0.1602 ** 0.7294 *** -0.0417
(2.27) (2.90) (-1.60)
BTM -0.0040 0.0000 -0.0059 *
(-0.72) (0.00) (-1.83)
Intercept 0.0705 * 0.0786 0.0690 ***
(1.77) (1.49) (3.51)
Industry FE YES YES YES
F-Value 2.74 *** 11.08 *** 2.87 ***
Adj-R2 0.093 0.374 0.100
N 288 288 288
This table reports results from multivariate cross-sectional regression models to examine the role of providing
segment-level guidance on year t+1 for managers’ earnings management behavior in year t+1. The dependent
variables are AbsDA1 in model (1), AbsDA2 in model (2) and AbsDRev in model (3). The independent variable
of interest is SLG. The sample is conditional on companies providing management guidance. The unit of
analysis is at the firm level. The model includes industry fixed effects defined at the one-digit ICB code level.
Including country fixed effects does not significantly change the results. Standard errors are robust adjusted for
heteroskedasticity. Statistical significance is based on two-sided t-tests (t-stats in parentheses) and is indicated as
follows: *** p-value<0.01; ** p-value<0.05; * p-value<0.1. See variable definitions in appendix III.B.
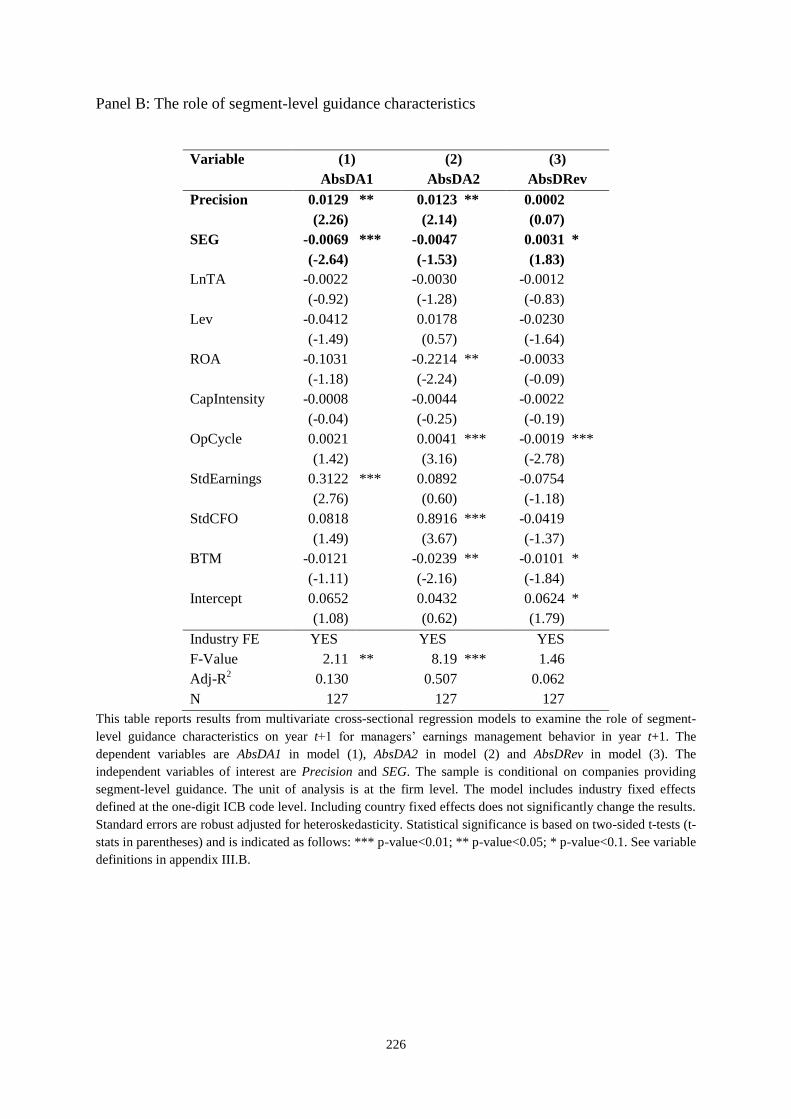
226
Panel B: The role of segment-level guidance characteristics
Variable (1) (2) (3)
AbsDA1 AbsDA2 AbsDRev
Precision 0.0129 ** 0.0123 ** 0.0002
(2.26) (2.14) (0.07)
SEG -0.0069 *** -0.0047 0.0031 *
(-2.64) (-1.53) (1.83)
LnTA -0.0022 -0.0030 -0.0012
(-0.92) (-1.28) (-0.83)
Lev -0.0412 0.0178 -0.0230
(-1.49) (0.57) (-1.64)
ROA -0.1031 -0.2214 ** -0.0033
(-1.18) (-2.24) (-0.09)
CapIntensity -0.0008 -0.0044 -0.0022
(-0.04) (-0.25) (-0.19)
OpCycle 0.0021 0.0041 *** -0.0019 ***
(1.42) (3.16) (-2.78)
StdEarnings 0.3122 *** 0.0892 -0.0754
(2.76) (0.60) (-1.18)
StdCFO 0.0818 0.8916 *** -0.0419
(1.49) (3.67) (-1.37)
BTM -0.0121 -0.0239 ** -0.0101 *
(-1.11) (-2.16) (-1.84)
Intercept 0.0652 0.0432 0.0624 *
(1.08) (0.62) (1.79)
Industry FE YES YES YES
F-Value 2.11 ** 8.19 *** 1.46
Adj-R2 0.130 0.507 0.062
N 127 127 127
This table reports results from multivariate cross-sectional regression models to examine the role of segment-
level guidance characteristics on year t+1 for managers’ earnings management behavior in year t+1. The
dependent variables are AbsDA1 in model (1), AbsDA2 in model (2) and AbsDRev in model (3). The
independent variables of interest are Precision and SEG. The sample is conditional on companies providing
segment-level guidance. The unit of analysis is at the firm level. The model includes industry fixed effects
defined at the one-digit ICB code level. Including country fixed effects does not significantly change the results.
Standard errors are robust adjusted for heteroskedasticity. Statistical significance is based on two-sided t-tests (t-
stats in parentheses) and is indicated as follows: *** p-value<0.01; ** p-value<0.05; * p-value<0.1. See variable
definitions in appendix III.B.
Conclusion
This thesis contains three stand-alone essays on the operating segment disclosures that
European multi-segment companies make under IFRS 8. Each essay aims to improve our
collective understanding about managers’ overall disclosure and communication strategy by
examining various characteristics of operating segment disclosure. Information about
companies’ operating segments is important because it allows capital market participants to
have a view over the company’s activities and their contributions to total earnings, and over
managers’ diversification policy. From the standard setters’ perspective, segment reporting is
a standard of particular interest not just due to the importance of segment information for
capital markets, but also due to the business-model orientation first implemented with this
standard which the IASB is beginning to adopt more widely (Leisenring et al., 2012).
Therefore, understanding the role of managers’ choices when disclosing this type of
information potentially contributes (1) towards standard setters and regulators’ decisions and
practices, (2) towards investors and financial analysts’ attitudes related to, and insights into,
companies’ disclosure, and (3) towards managers’ considerations over their future disclosure
strategies. The next section summarizes the main findings of this thesis and its contribution
and practical implications.
1. Summary of findings and practical implications
In chapter I, I find that managers disclose fewer accounting line-items in the segment
reporting note, than what the standard suggests, due to proprietary concerns, and that high
financial performance is associated with higher than average quality of disclosed operating
segments. When the management does follow standard suggestions in terms of the quantity of
228
information, they solve proprietary concerns by disclosing lower quality operating segments.
Financial analysts are less accurate when managers over-disclose in terms of segment line-
items, and do not seem to pick up high quality operating segments from average quality.
The first set of findings raises questions on and has implications for overall disclosure
informativeness, i.e., for the combination between quantity and quality as disclosure
characteristics and their contribution to disclosure informativeness. The findings are also in
line with investors and financial analysts’ opinion that high disclosure quantity may be used
as a smokescreen for low disclosure quality, one of the core arguments in the disclosure
overload debate (Barker et al., 2013).
The second set of findings suggests that financial analysts do not always pick up
segment reporting quality and too much quantity may increase information processing costs
and impair their ability to accurately forecast earnings. In light of standard setters’ increasing
interest for business-model based standards (Leisenring et al., 2012), these results advocate a
cautious approach since it appears that even sophisticated users have difficulties with
disclosure based on the management approach.
In chapter II, I find that earnings forecasts made for companies that disclose different
operating segments in different corporate documents are less accurate, and that earnings
forecasts made for companies that disaggregate their operating segments in some corporate
documents are more accurate. Forecast errors and forecast dispersion increase from before to
after the issuance of the annual report if the management discloses different segments in the
management discussion and analysis compared to the operating segments disclosed in the
note to financial statements.
These results have practical implications for managers and financial analysts. The
financial statements are one component of an array of disclosure “weapons” that managers
use to communicate to capital market participants, although financial information is present

229
in most of the other documents as well. Evidence on the role that financial information plays
when disclosed outside the financial statements and whether and how users assess it in
comparison to the financial statements enhances our understanding of the role of accounting
disclosures and the characteristics that make accounting disclosure useful. Since financial
analysts are an important link between the firm and the capital markets, managers want to
understand how to best communicate with them (Bradshaw, 2011). This paper shows the
effects that inconsistency as a characteristic of disclosure across documents has on analysts’
accuracy, so managers could use these results to adjust their disclosure strategy.
These findings also have implications for regulators and the current debate on a
disclosure framework. I supplement some existing survey evidence that points to the
importance investors and analysts attach to consistency in disclosure with empirical results
from a relatively large sample of firms. Given my findings, regulators and standard setters
may want to assess the need to consider the consistency of disclosure across documents as an
attribute of disclosure quality that companies should be encouraged to adhere to. My findings
also back up regulators’ existing practices of evaluating compliance with disclosure standards
by comparing mandated disclosure with voluntary disclosure on the same topic but in
different documents.
In chapter III, I find that providing management guidance at the segment level
increases analysts’ earnings forecast accuracy. Providing segment-level guidance is
associated with higher absolute discretionary accruals in the following year, and more so
when the segment-level guidance is more precise.
These findings have implications for the debate on whether companies should provide
management forecasts. Managers, financial analysts, investors, and regulators are all part of
this debate that has been ongoing for the best part of the last two decades. My findings
suggest that guidance on segments is useful for financial analysts, but at the same time
230
encourages managers’ earnings fixation and is associated with increases in earnings
management. At first view, the choice would seem a black-and-white one between providing
this type of information in the guidance or not. However, by examining the form and
disaggregation of segment-level guidance, I find that the precision of this information is
conducive to earnings management while it is not significantly useful for analysts. The item-
disaggregation of segment-level guidance, however, is both beneficial for analysts and is
negatively related to earnings management, most likely because it allows better monitoring of
how managers achieve certain results. Therefore, companies could combine a low-precision,
qualitative guidance with more items forecasted at the segment level to contribute to their
reputation of high quality disclosure and credibility.
To sum up, this thesis contributes to a richer understanding of the role of managers’
financial disclosure strategy by showing (1) that the relation between how much disclosure is
provided and its quality is not necessarily positive, but rather sometimes high quantity hides
low quality disclosures, (2) that disclosing different information on the same topic across
different venues introduces confusion for financial analysts, and (3) that forward-looking
information at the operating segment level is important for financial analysts without
inducing short-termism as long as it is presented in a qualitative, narrative manner. Although
each of the three essays is constructed as a stand-alone paper and discusses separately the
disclosure characteristic(s) of focus, since the disclosure topic is common, I also run
additional analyses that bring together the three essays.
2. Unifying analyses
Investigating different disclosure characteristics across the three research papers
raises the question of whether these characteristics are correlated, and whether perhaps they

231
are expressions of the same disclosure choice. To test and eliminate this concern, I run a set
of additional analyses that focus on financial analyst earnings forecast accuracy as the
dependent variable and include the variables for the disclosure characteristics examined
throughout this thesis as independent variables. A secondary purpose of these analyses is also
to provide a unifying view of the three essays.
The first set of unifying analyses brings together chapters I and II. The goal is to
assess whether inconsistency is merely an expression of segment disclosure quantity or
quality. In other words, I test whether SRQt and SRQl are correlated omitted variables in
chapter II. In table C1, I run the main analyses in chapter II where the inconsistency variables
(Inc_DiffSegmentation and Inc_AddDisclosure) are the variables of interest, while controlling
for segment disclosure quantity and quality as defined in chapter I.
Model (1) is the baseline model as it restates the main results obtained in chapter II,
with Inc_DiffSegmentation positively and significantly related to earnings forecast errors
(FE), and Inc_AddDisclosure negatively and significantly related to FE. In model (2), after
controlling for the continuous variables of segment reporting quantity (SRQt) and quality
(SRQl), the sign and significance of the inconsistency variables remains unchanged. In other
words, even after controlling for the quantity and quality of information in the segment
reporting note, the relation between the inconsistency variables and forecast accuracy still
holds. The coefficient on SRQt is not significant, while the coefficient on SRQl is negative
and significant at 1%, meaning that higher segment reporting quality decreases forecast
errors. The insignificant coefficient on SRQt is explained in model (3) where I include
variables for the groups to which the company belongs rather than the continuous variables
for SRQt and SRQl. Being in the Under-disclosers or in the Over-disclosers group, compared
to the Box-tickers group, is associated with higher forecast errors. Most likely these results
are due to too little information provided to analysts by Under-disclosers to allow them to
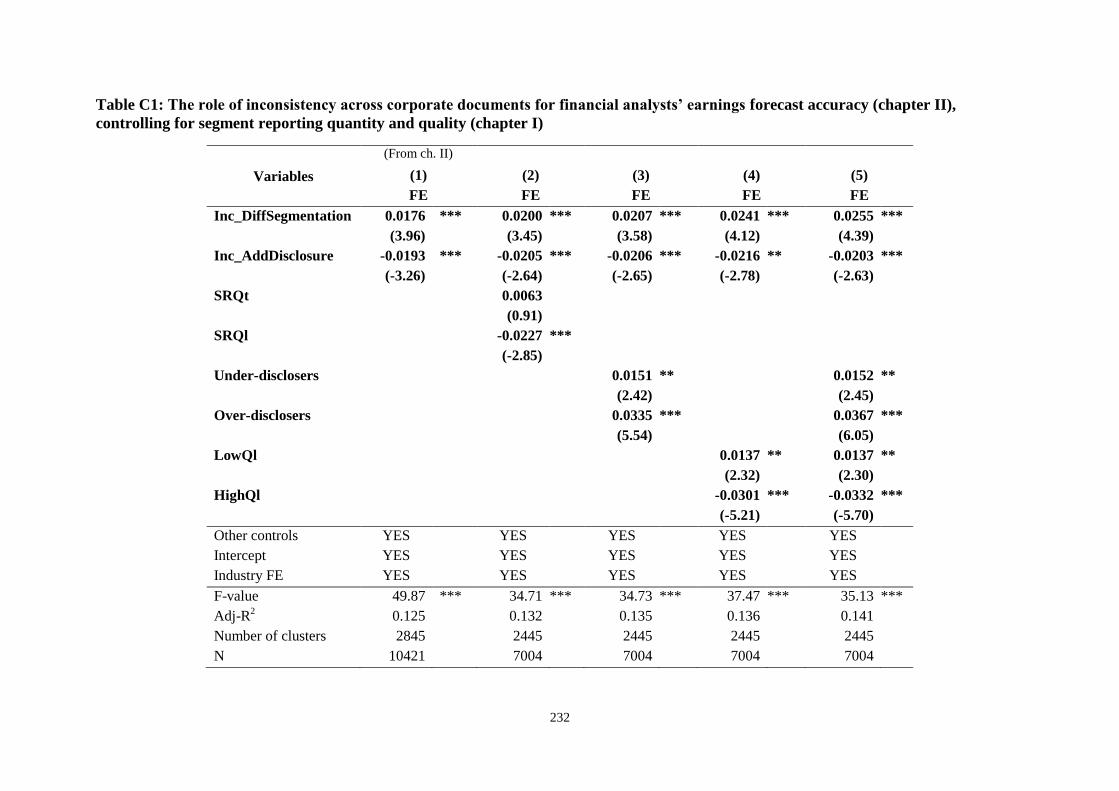
232
Table C1: The role of inconsistency across corporate documents for financial analysts’ earnings forecast accuracy (chapter II),
controlling for segment reporting quantity and quality (chapter I)
Variables
(From ch. II)
(1) (2) (3) (4) (5)
FE FE FE FE FE
Inc_DiffSegmentation 0.0176 *** 0.0200 *** 0.0207 *** 0.0241 *** 0.0255 ***
(3.96) (3.45) (3.58) (4.12) (4.39)
Inc_AddDisclosure -0.0193 *** -0.0205 *** -0.0206 *** -0.0216 ** -0.0203 ***
(-3.26) (-2.64) (-2.65) (-2.78) (-2.63)
SRQt 0.0063
(0.91)
SRQl -0.0227 ***
(-2.85)
Under-disclosers 0.0151 ** 0.0152 **
(2.42) (2.45)
Over-disclosers 0.0335 *** 0.0367 ***
(5.54) (6.05)
LowQl 0.0137 ** 0.0137 **
(2.32) (2.30)
HighQl -0.0301 *** -0.0332 ***
(-5.21) (-5.70)
Other controls YES YES YES YES YES
Intercept YES YES YES YES YES
Industry FE YES YES YES YES YES
F-value 49.87 *** 34.71 *** 34.73 *** 37.47 *** 35.13 ***
Adj-R2 0.125 0.132 0.135 0.136 0.141
Number of clusters 2845 2445 2445 2445 2445
N 10421 7004 7004 7004 7004
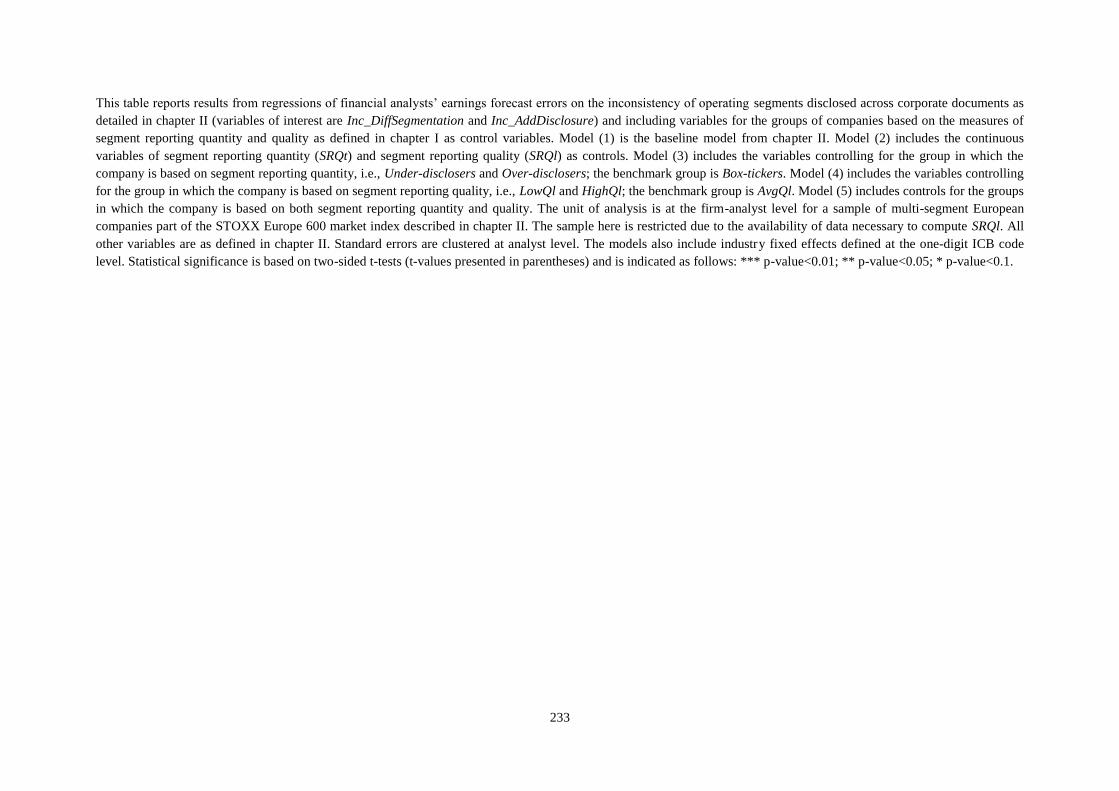
233
This table reports results from regressions of financial analysts’ earnings forecast errors on the inconsistency of operating segments disclosed across corporate documents as
detailed in chapter II (variables of interest are Inc_DiffSegmentation and Inc_AddDisclosure) and including variables for the groups of companies based on the measures of
segment reporting quantity and quality as defined in chapter I as control variables. Model (1) is the baseline model from chapter II. Model (2) includes the continuous
variables of segment reporting quantity (SRQt) and segment reporting quality (SRQl) as controls. Model (3) includes the variables controlling for the group in which the
company is based on segment reporting quantity, i.e., Under-disclosers and Over-disclosers; the benchmark group is Box-tickers. Model (4) includes the variables controlling
for the group in which the company is based on segment reporting quality, i.e., LowQl and HighQl; the benchmark group is AvgQl. Model (5) includes controls for the groups
in which the company is based on both segment reporting quantity and quality. The unit of analysis is at the firm-analyst level for a sample of multi-segment European
companies part of the STOXX Europe 600 market index described in chapter II. The sample here is restricted due to the availability of data necessary to compute SRQl. All
other variables are as defined in chapter II. Standard errors are clustered at analyst level. The models also include industry fixed effects defined at the one-digit ICB code
level. Statistical significance is based on two-sided t-tests (t-values presented in parentheses) and is indicated as follows: *** p-value<0.01; ** p-value<0.05; * p-value<0.1.
234
forecast accurately, and an information overload that impairs analysts’ accuracy in the case of
Over-disclosers. In model (4), when holding the inconsistency across corporate documents
constant, I find significant coefficients on both LowQl and HighQl, compared to AvgQl, in
the expected direction. Lower segment reporting quality is associated with higher forecast
errors (in chapter I, the coefficient on LowQl was positive but insignificant), while higher
quality is associated with lower forecast errors. Including the groups based on both disclosure
quantity and quality in model (5) results in similar inferences. The conclusion of this table is
that including SRQt or SRQl either as continuous variables or as indicator variables based on
the group to which the company belongs on for these two dimensions (Under-disclosers/Box-
tickers/Over-disclosers and LowQl/AvgQl/HighQl), the quantity, quality, and inconsistency
dimensions do not subsume each other.
In table C2, I use a determinants model similar to the one in chapter I to test whether
inconsistency across corporate documents is associated with SRQl for the group of Box-
tickers. I find no significant relations between either Inc_DiffSegmentation or
Inc_AddDisclosure, and SRQl, which suggests that managers’ choice to disclose
inconsistently across corporate documents does not play a significant role for their choice of
aggregating operating segments into reportable segments.
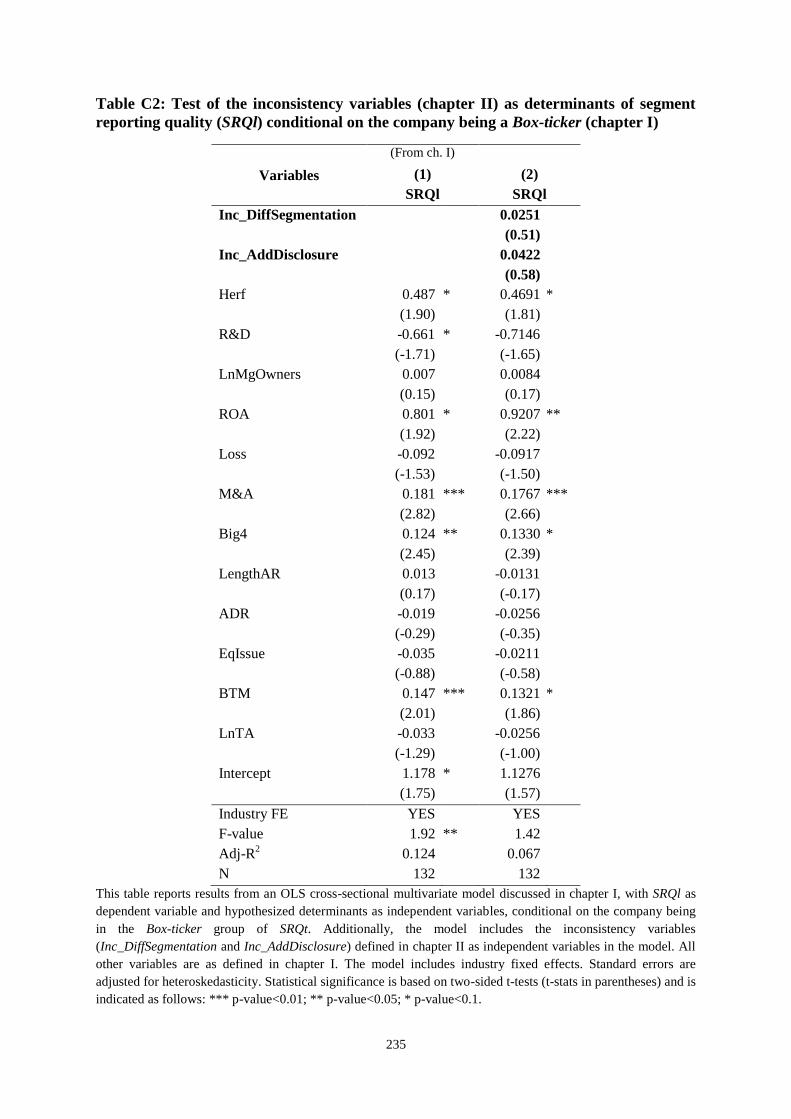
235
Table C2: Test of the inconsistency variables (chapter II) as determinants of segment
reporting quality (SRQl) conditional on the company being a Box-ticker (chapter I)
Variables
(From ch. I)
(1) (2)
SRQl SRQl
Inc_DiffSegmentation 0.0251
(0.51)
Inc_AddDisclosure 0.0422
(0.58)
Herf 0.487 * 0.4691 *
(1.90) (1.81)
R&D -0.661 * -0.7146
(-1.71) (-1.65)
LnMgOwners 0.007 0.0084
(0.15) (0.17)
ROA 0.801 * 0.9207 **
(1.92) (2.22)
Loss -0.092 -0.0917
(-1.53) (-1.50)
M&A 0.181 *** 0.1767 ***
(2.82) (2.66)
Big4 0.124 ** 0.1330 *
(2.45) (2.39)
LengthAR 0.013 -0.0131
(0.17) (-0.17)
ADR -0.019 -0.0256
(-0.29) (-0.35)
EqIssue -0.035 -0.0211
(-0.88) (-0.58)
BTM 0.147 *** 0.1321 *
(2.01) (1.86)
LnTA -0.033 -0.0256
(-1.29) (-1.00)
Intercept 1.178 * 1.1276
(1.75) (1.57)
Industry FE YES YES
F-value 1.92 ** 1.42
Adj-R2 0.124 0.067
N 132 132
This table reports results from an OLS cross-sectional multivariate model discussed in chapter I, with SRQl as
dependent variable and hypothesized determinants as independent variables, conditional on the company being
in the Box-ticker group of SRQt. Additionally, the model includes the inconsistency variables
(Inc_DiffSegmentation and Inc_AddDisclosure) defined in chapter II as independent variables in the model. All
other variables are as defined in chapter I. The model includes industry fixed effects. Standard errors are
adjusted for heteroskedasticity. Statistical significance is based on two-sided t-tests (t-stats in parentheses) and is
indicated as follows: *** p-value<0.01; ** p-value<0.05; * p-value<0.1.
236
The second set of unifying analyses brings together chapters II and III. In chapter III,
the focus is on forward-looking operating segment disclosure made in the earnings
announcement press release and one set of tests there examines financial analysts’ earnings
forecast accuracy after managers release this information. Immediately after (either in the
same day or the next day) issuing the press release, managers usually hold a conference call
with financial analysts and investors to discuss the company’s financial performance and
future prospects. One research question that arises in the context of chapters II and III is
whether the usefulness of segment-level guidance is influenced by the consistency, or
inconsistency, of the operating segments disclosed in the press release and presentation
slides. To test this, in table C3, I run the analyst-firm level analyses in chapter III while
controlling for the inconsistency of operating segments arising from either different
segmentation (DiffSeg_Press_Present) or from the further disaggregation
(AddDiscl_Press_Present) of some operating segments disclosed across these two
documents.
Models (1) and (2) in table C3 are the baseline models, re-stating the results obtained
in chapter III based on the full sample and on sample conditional on companies providing
guidance, respectively, with segment-level guidance (SLG) as independent variable of
interest. Models (3) and (4) mirror the previous two models but also include
DiffSeg_Press_Present and AddDiscl_Press_Present as control variables. The results show
that, even after taking into account the inconsistency of operating segments disclosed across
the press release and presentation, the negative and significant relation between providing
segment-level guidance and earnings forecast errors still holds. In both models, the
coefficients on DiffSeg_Press_Present are not significant suggesting that for the sample of
companies providing segment-level guidance, disclosing different segmentations across these
two documents does not have a significant role for analysts’ accuracy. However,
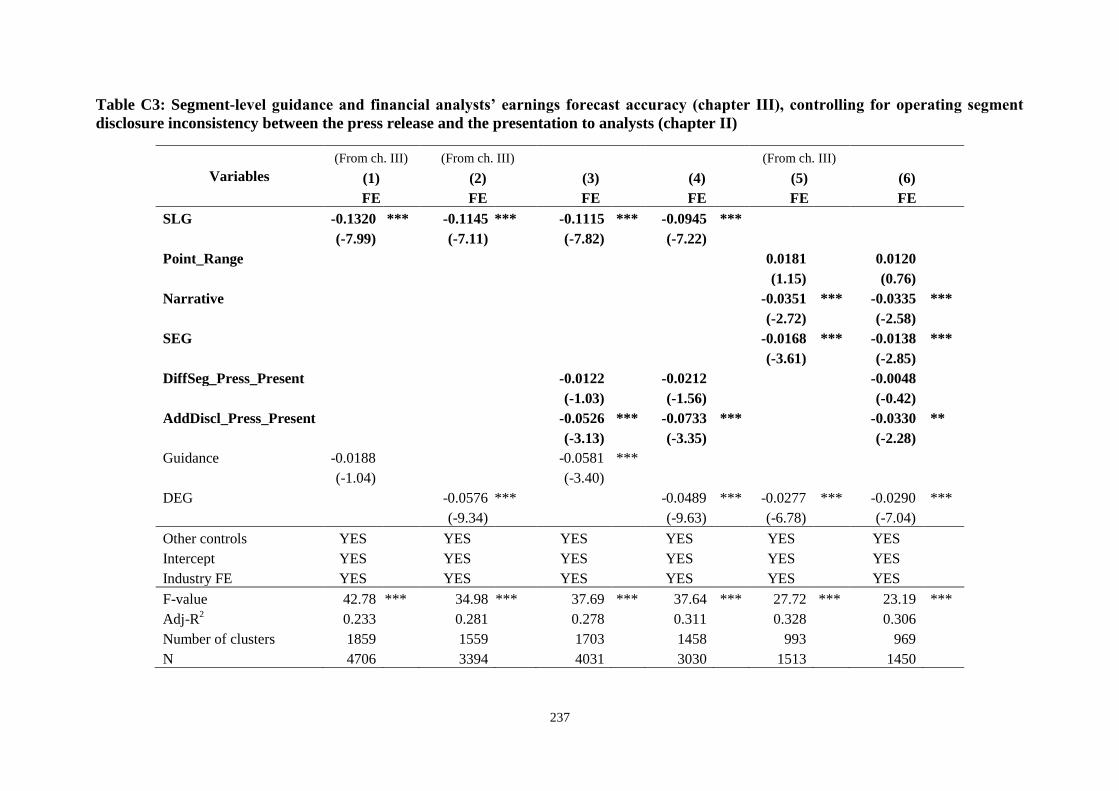
237
Table C3: Segment-level guidance and financial analysts’ earnings forecast accuracy (chapter III), controlling for operating segment
disclosure inconsistency between the press release and the presentation to analysts (chapter II)
Variables
(From ch. III) (From ch. III) (From ch. III)
(1) (2) (3) (4) (5) (6)
FE FE FE FE FE FE
SLG -0.1320 *** -0.1145 *** -0.1115 *** -0.0945 ***
(-7.99) (-7.11) (-7.82)
(-7.22)
Point_Range 0.0181 0.0120
(1.15) (0.76)
Narrative -0.0351 *** -0.0335 ***
(-2.72) (-2.58)
SEG -0.0168 *** -0.0138 ***
(-3.61) (-2.85)
DiffSeg_Press_Present -0.0122
-0.0212
-0.0048
(-1.03)
(-1.56)
(-0.42)
AddDiscl_Press_Present -0.0526 *** -0.0733 *** -0.0330 **
(-3.13)
(-3.35)
(-2.28)
Guidance -0.0188 -0.0581 ***
(-1.04) (-3.40)
DEG -0.0576 ***
-0.0489 *** -0.0277 *** -0.0290 ***
(-9.34)
(-9.63)
(-6.78) (-7.04)
Other controls YES YES YES YES YES YES
Intercept YES YES YES YES YES YES
Industry FE YES YES YES
YES
YES YES
F-value 42.78 *** 34.98 *** 37.69 *** 37.64 *** 27.72 *** 23.19 ***
Adj-R2 0.233 0.281 0.278
0.311
0.328 0.306
Number of clusters 1859 1559 1703
1458
993 969
N 4706 3394 4031
3030
1513 1450
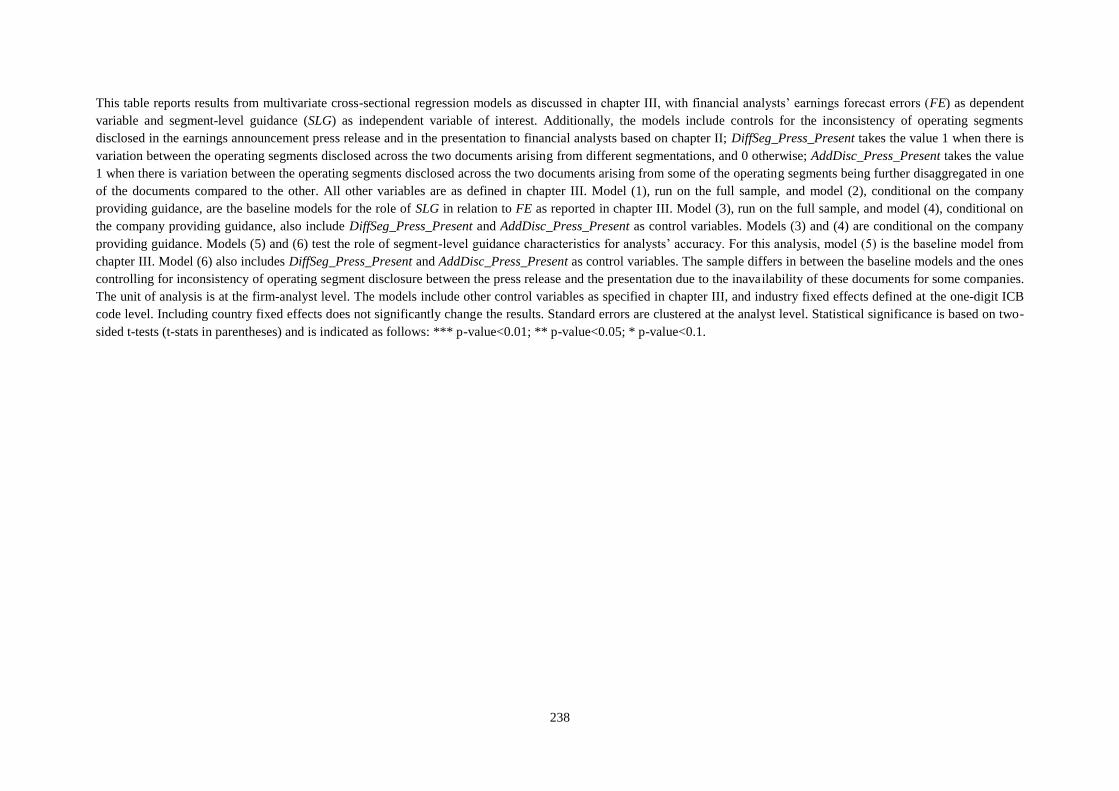
238
This table reports results from multivariate cross-sectional regression models as discussed in chapter III, with financial analysts’ earnings forecast errors (FE) as dependent
variable and segment-level guidance (SLG) as independent variable of interest. Additionally, the models include controls for the inconsistency of operating segments
disclosed in the earnings announcement press release and in the presentation to financial analysts based on chapter II; DiffSeg_Press_Present takes the value 1 when there is
variation between the operating segments disclosed across the two documents arising from different segmentations, and 0 otherwise; AddDisc_Press_Present takes the value
1 when there is variation between the operating segments disclosed across the two documents arising from some of the operating segments being further disaggregated in one
of the documents compared to the other. All other variables are as defined in chapter III. Model (1), run on the full sample, and model (2), conditional on the company
providing guidance, are the baseline models for the role of SLG in relation to FE as reported in chapter III. Model (3), run on the full sample, and model (4), conditional on
the company providing guidance, also include DiffSeg_Press_Present and AddDisc_Press_Present as control variables. Models (3) and (4) are conditional on the company
providing guidance. Models (5) and (6) test the role of segment-level guidance characteristics for analysts’ accuracy. For this analysis, model (5) is the baseline model from
chapter III. Model (6) also includes DiffSeg_Press_Present and AddDisc_Press_Present as control variables. The sample differs in between the baseline models and the ones
controlling for inconsistency of operating segment disclosure between the press release and the presentation due to the inavailability of these documents for some companies.
The unit of analysis is at the firm-analyst level. The models include other control variables as specified in chapter III, and industry fixed effects defined at the one-digit ICB
code level. Including country fixed effects does not significantly change the results. Standard errors are clustered at the analyst level. Statistical significance is based on two-
sided t-tests (t-stats in parentheses) and is indicated as follows: *** p-value<0.01; ** p-value<0.05; * p-value<0.1.
AddDiscl_Press_Present is negatively and significantly related to forecast errors, which
suggests that providing more disaggregated operating segments in one of these documents
contributes to lower forecast errors by providing more information to financial analysts.
Model (5) represents the baseline model from chapter III that examines the association
between segment-level guidance characteristics, i.e., Point_Range/Estimate/Narrative and
SEG, and forecast error. Model (6) suggests that the relations uncovered in chapter III remain
qualitatively similar even after controlling for the inconsistency of operating segments
disclosed across the press release and the presentation: (1) providing qualitative or narrative
segment-level guidance (Narrative), compared to the benchmark category of low-precision
estimates (Estimate), decreases forecast errors, but providing more precise segment-level
guidance (Point_Range) does not have a significant influence, and (2) more disaggregated
segment-level guidance (SEG) is negatively and significantly associated with forecast errors,
meaning that higher SEG improves analysts’ earnings forecast accuracy.
The overall take-away from these unifying analyses is that the disclosure
characteristics examined in the three chapters do not subsume each other and that the main
inferences in each of the chapters hold even after controlling for additional disclosure
characteristics. Nevertheless, the findings uncovered in this thesis must be interpreted
keeping in mind the inherent limitations of empirical archival methodology and in light of the
research design choices made in each of the essays (e.g., cross-sectional analyses, focus on a
sample of European companies, focus on 2009 as the first year of IFRS 8 adoption etc.)
Future research could extend our understanding of how and why these disclosure
characteristics matter by overcoming some of these limitations.
240
3. Avenues for future research
The analyses conducted in and the findings of this thesis could be used as a starting
point for future research that aims towards a deeper understanding of managers’ overall
disclosure and communication strategy for financial information (Miller & Skinner, 2015), be
it in the annual report or across various other venues that companies use to communicate with
capital markets. Future research that improves the research designs used in the three essays,
for example, in terms of extending the sample by looking at a different economic and legal
environment or by collecting data for additional years, could contribute to the literature by
adding to or confirming my findings. Other future research could explore the
interconnections between the disclosure characteristics investigated in this thesis and
characteristics such as readability (Li, 2008) or tone (e.g., Davis & Tama-Sweet, 2012)
identified in prior literature, the role that auditors play for disclosure, or how exactly financial
analysts use segment information.
3.1 Different economic and legal environment
Although based on a European sample of companies that apply IFRS 8, these findings
extend to the U.S. setting, as well, for two main reasons. First, the segment reporting
standards under IFRS and U.S. GAAP, IFRS 8 and SFAS 131, respectively, are completely
converged (IASB 2006; FASB 1997). Second, the companies in the sample are companies
listed on EU stock exchanges and included in STOXX Europe 600, a pan-European stock
market index similar in the type of composition to the S&P 1500. Therefore, given the
similarity of standard and representativeness of the sample, I believe that this thesis speaks to
the U.S. environment, too. Nevertheless, the differences in standard enforcement, the quality
241
of the financial reporting environment in general, and differences in the business and legal
environment (e.g., litigation risk) raise the question of whether these findings are indeed the
same in the U.S. environment. More interestingly, extensions of the research paper included
in chapter II could tackle the issue of inconsistency of operating segment disclosure in the
U.S. setting. For example, it could be that U.S. managers are more consistent when disclosing
operating segments in various documents than my findings about on the European sample
given the increased litigation risk compared to the European setting, and the SEC’s longer
experience of enforcing SFAS 131.
3.2 Extending the sample across time
Currently, the analyses in the three essays are run in cross-section with 2009, the first
year of adoption of IFRS 8, as the point of focus. This research design choice is discussed
and motivated in each essay, and is mostly due to the time restrictions imposed by manually
collecting the data for the main variables across all three papers. Nevertheless, extending the
sample across time may be a fruitful area of future investigation and may yield interesting,
and potentially complementary, insights to the current findings.
In chapter I, the sample contains one year of data in order to avoid the issue of
disclosure stickiness, and extending the sample to more years makes little sense. We know
from prior literature that disclosure tends to be sticky from one year to the other (Beyer et al.,
2010). Including more than one year of data could potentially limit the variation in our
measures of disclosure due to this phenomenon. Choosing the first year of IFRS 8 adoption as
sample year has the advantage of the “shake-up” that the change in standards brings to
disclosure. This is the time when managers, guided by auditors, need to decide how much
information and what operating segments to disclose under the requirements of the new
242
standard. Therefore, stickiness of disclosure from the previous year is less of a concern for
2009. At the same time, using data for the first year of adoption makes it more likely to find
results for the determinants of quality and quantity, if firm-level characteristics indeed matter.
To corroborate this argument, I compared the segment line item disclosure for 2009 with that
for 2010 for a random subsample of 27 firms (10% of the full sample) and there are no
significant differences in segment reporting quantity between the two years.
Extending the sample across time in the context of chapter II makes more sense and
would potentially complement the current results with a time-trend view of inconsistency in
disclosure. In a time-series, the focus of the research questions would necessarily change
from the current comparison between inconsistent and consistent disclosers to within-firm
investigations of the effects that changing from consistent to inconsistent disclosure has. For
example, it would be interesting to examine whether there is demand from financial analysts
for consistent disclosure in years subsequent to an “inconsistent disclosure” episode. A view
of the pattern of inconsistency across corporate documents in time would also allow an
examination of the reasons for which managers disclose inconsistently, and has the potential
to confirm the intuition that arises from looking at cross-sectional data that inconsistent
disclosure is a strategic choice that managers make in order to avoid disclosing some
sensitive information at the operating segment level.
For chapter III, extending the sample across multiple years is necessary to strengthen
the analyses since currently the sample for some of the tests is small which comes at the
expense of the power of the test. Additionally, prior literature on management guidance
typically employs data on several years, which allows better insights into the determinants of
the choice to provide a particular type of guidance, in this case, segment-level guidance.
243
3.3 The relation between disclosure characteristics
One potential avenue for future research, in the spirit of Francis, LaFond, Olsson, &
Schipper (2004), is to examine the relation between all (or a number of) disclosure
characteristics that prior literature has been looking at, including the ones examined in this
thesis. Francis et al. (2004) examine the relation between the cost of equity capital and seven
attributes of earnings: accrual quality, persistence, predictability, smoothness, value
relevance, timeliness, and conservatism. Their interest is to find which of these attributes has
a stronger relation to an important economic outcome and how these attributes behave when
considered interdependently rather than independently. In a similar fashion, future research
could investigate disclosure quantity, quality, readability, tone, inconsistency etc. in relation
to an outcome variable such as earnings forecast accuracy in an attempt to characterize the
relative importance of these disclosure characteristics, their interdependencies, and the role
each characteristic plays (if any) as part of an obfuscation strategy that managers may be
using, for example, in bad times. For example, is inconsistency used as part of an obfuscation
strategy? From this respect, chapter I represents a first step in this direction by investigating
the interplay between disclosure quantity and quality. The unifying analyses I report above
represent an additional step in this direction.
3.4 How do financial analysts use segment information?
Although there is extensive evidence on the usefulness of historical segment
information for financial analysts, as discussed throughout this thesis, there is little, if any,
direct evidence on exactly what information about a company’s operating segments analysts
use. Although some analyst reports contain earnings forecasts at the operating segment level,

244
there is no prior evidence on how analysts make these forecasts. In the interviews I have
conducted, the financial analysts seem to suggest that the secondary segmentation that some
companies provide in the spirit of the late IAS 14R is equally important to the (main)
operating segments disclosed as it is used to cross-check that forecasts for the operating
segments make sense (e.g., cross-check line-of-business earnings forecasts with geographical
forecasts), and that only a few of the accounting line items disclosed at the operating segment
level (i.e., those that are more likely to be disclosed by all companies, such as revenue and
EBITDA) are used in the valuation models. More insights can be drawn by looking at the
transcripts of a large sample of conference call Q&A sections. These transcripts may reveal
the questions that analysts ask about the firm’s segments, the additional information that
management is willing to give orally, but not in writing, and the areas related to operating
segments about which analysts challenge managers (e.g., questions to which managers do not
respond, or to which they give vague answers.)
3.5 Auditors’ influence on disclosure
Considering the variation in segment information disclosed in the note across
companies that I uncover in chapter I, some companies blatantly non-complying with
standard requirements, one question that arises relates to the role of auditors for disclosure.
For example, how much importance do auditors attach to the information provided in the
notes, and particularly how much importance do they attach to complying with disclosure
standards such as IFRS 8 or SFAS 131? Auditors are also reviewing, although not providing
an opinion on, the MD&A. In chapter II, I find that, in a significant number of cases, the
operating segments disclosed in the MD&A are not the operating segments disclosed in the
note to financial statements, i.e., there is inconsistency between the operating segments
245
disclosed in the annual report. It would be interesting to investigate the role that auditors play
in this matter. In an informal discussion, a former auditor suggested that auditors need “to
pick their battles” with management and oftentimes other aspects of applying financial
accounting take precedence over segment reporting. Litigation risk may also play a role on
auditors’ decision to challenge management on disclosure choices. While prior literature has
extensively investigated the role of auditors for earnings quality, there is less evidence on the
role that auditors play for accounting disclosures.
In conclusion, this thesis focuses on an important type of disclosure, segment
reporting, to provide insights into managers’ disclosure strategy and its usefulness for a
sophisticated category of users, sell-side equity analysts. By looking at the disclosure on
operating segments through an empirical archival lens and using manually-collected data,
from a quantity versus quality perspective, from an across multiple corporate documents
perspective, and from a forward-looking perspective, this thesis contributes to our
understanding of disclosure of operating segment information, in particular, and of financial
information, in general. Nevertheless, many aspects related to how and why managers make
certain choices when disclosing operating segment information remain a “black box.” Future
research could employ other research methodologies such as interviews or experiments with
managers and different categories of users to shed more light on the reasons behind
managers’ disclosure choices and the chain of causality between these choices and users’
decisions, and potentially support and/or complement the findings in this thesis.
246
Abstract
This thesis contains three stand-alone essays on the operating segment disclosures that
European multi-segment companies make under IFRS 8 Operating Segments. Each essay
aims to improve our collective understanding about managers’ disclosure strategy by
examining various characteristics of operating segment disclosure. Chapter I, entitled “The
Interplay between Segment Disclosure Quantity and Quality,” investigates managers’ choices
with respect to both disclosure quantity and disclosure quality, and the usefulness of these
two characteristics for financial analysts. Focusing on segment disclosures under the
management approach, I measure quantity as the number of segment-level line items and
quality as the cross-segment variation in profitability, and argue that greater managerial
discretion can be exercised over quality than over quantity. I hypothesize and find that
managers solve proprietary concerns either by deviating from the suggested line-item
disclosure in the standard, or if following standard guidance, by decreasing segment reporting
quality. Moreover, financial analysts do not always understand the quality of segment
disclosures, which suggests that a business-model type of standard creates difficulties even
for sophisticated users. My results inform standard setters as they start working on a
disclosure framework and as they seem to consider the business model approach to financial
reporting. Chapter II is entitled “Inconsistent Segment Disclosure across Corporate
Documents.” Market regulators in the U.S. and Europe investigate cases of inconsistent
disclosures when a company provides different information on the same topic in different
documents. Focusing on operating segments, this essay uses hand-collected data from four
different corporate documents of multi-segment firms to analyze the impact of inconsistent
disclosure on financial analysts’ earnings forecast accuracy. Inconsistencies that arise from
further disaggregation of operating segments in some documents seem to bring in new
information and increase analyst accuracy. However, when analysts must work with different,
difficult-to-reconcile segmentations, their information processing capacity and forecasts are
less accurate. These findings contribute to our understanding of the effects of managers’
disclosure strategy across multiple documents and have implications for regulators and
standard setters’ work on a disclosure framework. Chapter III is entitled “Management
Guidance at the Segment Level.” Prior research has found that managers add information to
their earnings guidance to justify, explain, or contextualize their forecasts. I identify segment-
level guidance (SLG) as a type of disaggregated information that multi-segment firms
provide with their management guidance, and investigate its usefulness for financial analysts’
earnings forecasting accuracy, as well as its influence on managers’ earnings fixation. I
further characterize the level of precision (point and range, maximum or minimum estimate,
or simply narrative) and of disaggregation of SLG. I find that companies in high tech
industries known for increased uncertainty in future performance are less likely to provide
SLG, and that SLG is associated with better forecasting accuracy. However, while providing
more item-disaggregated SLG improves accuracy, increased precision has no impact on
forecast accuracy. From the manager’s point of view, SLG creates incentives to engage in
earnings management, and the more precise the SLG is the greater the incentive. In contrast,
more item-disaggregated SLG discourages earnings management, perhaps by improving
monitoring. In a context where qualitative, narrative, and disaggregated guidance is regarded

247
as a solution to avoid earnings fixation and short termism, understanding which types of
information achieve this goal, and how, is relevant for managers, investors, and regulators
alike.
248
Résumé
Cette thèse contient trois essais distincts sur la publication d’information sectorielle que les
entreprises européennes ayant plusieurs secteurs opérationnels effectuent en vertu des IFRS 8
Secteurs Opérationnels. Chaque essai vise à améliorer notre compréhension collective sur la
politique de communication financière des cadres dirigeants en examinant diverses
caractéristiques des informations sectorielles. Le chapitre I, “L’interaction entre la qualité et
la quantité des publications sur l’information sectorielle” examine le choix des cadres
dirigeants à l'égard de la quantité et de la qualité, ainsi que l’utilité de ces deux
caractéristiques pour les analystes financiers. J’utilise le nombre de segments opérationnels
publiés comme mesure quantitative et la variation inter-sectorielle de la profitabilité comme
mesure qualitative et soutiens que plus de pouvoir discrétionnaire peut être exercé par les
dirigeants sur la qualité que sur la quantité. Je trouve que les cadres dirigeants résolvent les
préoccupations liées aux renseignements commerciaux de nature exclusive soit en déviant de
la quantité recommandée par la norme, ou, lorsqu’ils suivent la norme, en réduisant la qualité
de l’information sectorielle. Les analystes financiers n’apprécient pas toujours la qualité de
l’information sectorielle, ce qui suggère que le modèle business crée des difficultés même
pour des utilisateurs avertis. Mes résultats informent les normalisateurs lorsque ceux-ci
initient le développement d’un nouveau cadre conceptuel et lorsqu’ils semblent envisager
l’approche du modèle business pour le reporting. Le chapitre II s'intitule «La non-conformité
des secteurs opérationnels à travers des documents d'entreprise. » Les régulateurs de marché
examinent des cas de présentations lorsqu'une entreprise fournit des informations différentes
sur le même sujet dans différents documents. En mettant l’accent sur les secteurs
opérationnels, cet essai utilise des données recueillies manuellement auprès de quatre
documents d’entreprise afin d'analyser l'impact de la publication d’information non-conforme
sur l’exactitude des prévisions de résultat des analystes financiers. La non-conformité qui
découle de la déségrégation supplémentaire des secteurs semble introduire de nouveautés et
contribue à l’exactitude des prévisions. La publication des segmentations difficilement
réconciliables entraine une exactitude réduite des prévisions. Ces résultats contribuent à notre
compréhension des effets de la politique de communication des dirigeants à travers plusieurs
documents et ont des répercussions sur le travail les régulateurs. Le chapitre III s'intitule «
Prévisions managériales au niveau sectoriel. » Je considère les prévisions au niveau sectoriel
(PNS) comme un type d'information désagrégé que les entreprises fournissent ensemble avec
leur stratégie de gestion. J’examine l’utilité de cette information pour l’exactitude des
prévisions de résultat par les analystes ainsi que l’impact de cette information sur la
manipulation du résultat. Je constate que les entreprises de haute technologie réputées pour
l’incertitude supplémentaire liée à profitabilité sont moins susceptibles de fournir des PNS et
que le PNS est associé à une prévision améliorée. Cependant, alors que la communication de
davantage de PNS désagrégé par secteur a tendance à améliorer la précision, plus de
précision ne semble pas avoir d’importance. Du point de vue des cadres dirigeants, les PNS
les incitent à manipuler le résultat comptable, mais le PNS désagrégé par poste semble
décourager la manipulation, fort probablement due à une surveillance supplémentaire. Dans
un contexte où une orientation narrative et désagrégée est considérée comme la solution pour
empêcher la vision à court terme, comprendre quel type d'information permet d’atteindre cet

249
objectif, et de quelle manière, est tout autant pertinent pour les cadres dirigeants, les
investisseurs et les régulateurs.
250
Bibliography
Ajinkya, B. B., & Gift, M. J. (1984). Corporate Managers’ Earnings Forecasts and
Symmetrical Adjustments of Market Expectations. Journal of Accounting Research,
22(2), 425–444.
Akamah, H., Hope, O.-K., & Thomas, W. B. (2014). Tax Havens and Disclosure
Aggregation. Working Paper.
Ali, A., Klasa, S., & Yeung, P. E. (2014). Industry concentration and corporate disclosure
policy. Journal of Accounting and Economics, 58(2-3), 240–264.
André, P., Ben-Amar, W., & Saadi, S. (2014). Family firms and high technology Mergers &
Acquisitions. Journal of Management & Governance, 18(1), 129–158.
André, P., Broye, G., Pong, C., & Schatt, A. (2014). Are Joint Audits Associated with Higher
Fees? Working Paper.
Armstrong, C. S., Core, J. E., & Guay, W. R. (2014). Do independent directors cause
improvements in firm transparency? Journal of Financial Economics, 113(3), 383–403.
Ashbaugh, H., & Pincus, M. (2001). Domestic Accounting Standards, International
Accounting Standards, and the Predictability of Earnings. Journal of Accounting
Research, 39(3), 417–434.
Athanasakou, V. E., Strong, N. C., & Walker, M. (2009). Earnings management or forecast
guidance to meet analyst expectations? Accounting and Business Research, 39(1), 3–35.
Bae, K. H., Tan, H., & Welker, M. (2008). International GAAP Differences: The Impact on
Foreign Analysts. The Accounting Review, 83(3), 593–628.
Baginski, S. P., Conrad, E. J., & Hassell, J. M. (1993). The Effects of Management Forecast
Precision on Equity Pricing and on the Assessment of Earnings Uncertainty. The
Accounting Review, 68(4), 913–927.
Baginski, S. P., Hassell, J. M., & Hillison, W. A. (2000). Voluntary Causal Disclosures:
Tendencies and Capital Market Reaction. Review of Quantitative Finance and
Accounting, 15, 371–389.
Baginski, S. P., Hassell, J. M., & Kimbrough, M. D. (2004). Why do managers explain their
earnings forecasts? Journal of Accounting Research, 42(1), 1–29.
Baginski, S. P., & Rakow, K. C. (2011). Management earnings forecast disclosure policy and
the cost of equity capital. Review of Accounting Studies, 17(2), 279–321.
Baiman, S., & Verrecchia, R. E. (1996). The Relation Among Capital Markets, Financial
Disclosure, Production Efficiency, and Insider Trading. Journal of Accounting
Research, 34(1), 1.
251
Balakrishnan, R., Harris, T. S., & Sen, P. K. (1990). The Predictive Ability of Geographic
Segment Disclosures. Journal of Accounting Research, 28(2), 305–325.
Baldwin, B. A. (1984). Segment Earnings Disclosure and the Ability of Security Analysts to
Forecast Earnings Per Share. The Accounting Review, LIX(3), 376–389.
Ball, R., & Brown, P. (1968). An Empirical Evaluation of Accounting Income Numbers.
Journal of Accounting Research, 1(Autumn), 159–178.
Ball, R., & Shivakumar, L. (2006). The Role of Accruals in Asymmetrically Timely Gain and
Loss Recognition. Journal of Accounting Research, 44(2), 207–242.
Bamber, L. S., & Cheon, Y. S. (1998). Discretionary Management Earnings Forecast
Disclosures: Antecedents and Outcomes Associated with Forecast Venue and Forecast
Specificity Choices. Journal of Accounting Research, 36(2), 167–190.
Barker, R., Barone, E., Birt, J., Gaeremynck, A., Mcgeachin, A., Marton, J., & Moldovan, R.
(2013). Response of the EAA FRSC to the EFRAG/ANC/FRC Discussion Paper:
Towards a Disclosure Framework for the Notes. Accounting in Europe, 10(1), 1–26.
Barron, O. E., Byard, D., Kile, C., & Riedl, E. J. (2002). High-Technology Intangibles and
Analysts’ Forecasts. Journal of Accounting Research, 40(2), 289–312.
Barth, M., & Schipper, K. (2008). Financial reporting transparency. Journal of Accounting,
Auditing & Finance, 173–191.
BDO. (2011). ESMA’s review on the implementation of IFRS 8 - Operating Segments.
International FInancial Reporting Bulletin, 16.
Beattie, V. (2014). Accounting narratives and the narrative turn in accounting research:
Issues, theory, methodology, methods and a research framework. British Accounting
Review, 46(2), 111–134.
Beaver, W. H. (1968). The Information Content of Annual Earnings Announcements. Journal
of Accounting Research, 6, 67–92.
Behn, B. K., Nichols, N. B., & Street, D. L. (2002). The Predictive Ability of Geographic
Segment Disclosures by U.S. Companies: SFAS No. 131 vs. SFAS No. 14. Journal of
International Accounting Research, 1(1), 31–44.
Bens, D. A., Berger, P. G., & Monahan, S. J. (2011). Discretionary Disclosure in Financial
Reporting: An Examination Comparing Internal Firm Data to Externally Reported
Segment Data. The Accounting Review, 86(2), 417–449.
Bens, D. A., & Monahan, S. J. (2004). Disclosure Quality and the Excess Value of
Diversification. Journal of Accounting Research, 42(4), 691–731.
Beretta, S., & Bozzolan, S. (2004). A framework for the analysis of firm risk communication.
The International Journal of Accounting, 39(3), 265–288.
252
Berger, P. G. (2011). Challenges and opportunities in disclosure research—A discussion of
“The financial reporting environment: Review of the recent literature.” Journal of
Accounting and Economics, 51(1-2), 204–218.
Berger, P. G., & Hann, R. (2002). Segment Disclosures, Proprietary Costs, and the Market
for Corporate Control. Working Paper.
Berger, P. G., & Hann, R. (2003). The Impact of SFAS No. 131 on Information and
Monitoring. Journal of Accounting Research, 41(2), 163–223.
Berger, P. G., & Hann, R. (2007). Segment Profitability and the Proprietary and Agency
Costs of Disclosure. The Accounting Review, 82(4), 869–906.
Berger, P. G., & Ofek, E. (1995). Diversification’s effect on firm value. Journal of Financial
Economics, 37, 39–65.
Berger, P. G., & Ofek, E. (1999). Causes and Effects of Corporate Refocusing Programs.
Review of Financial Studies, 12(2), 311–345.
Berry, D. A. (1987). Logarithmic Transformations in ANOVA. Biometrics, 43(2), 439–456.
Beyer, A., Cohen, D. A., Lys, T. Z., & Walther, B. R. (2010). The financial reporting
environment: Review of the recent literature. Journal of Accounting and Economics,
50(2-3), 296–343.
Bhojraj, S., Libby, R., & Yang, H. (2012). Guidance frequency and guidance properties: The
effect of reputation-building and learning-by-doing. Working Paper.
Bhushan, R. (1989). Firm characteristics and analyst following. Journal of Accounting and
Economics, 11(2-3), 255–274.
Blacconiere, W. G., Frederickson, J. R., Johnson, M. F., & Lewis, M. F. (2011). Are
voluntary disclosures that disavow the reliability of mandated fair value information
informative or opportunistic? Journal of Accounting and Economics, 52(2-3), 235–251.
Blanco, B., Garcia Lara, J. M., & Tribo, J. A. (2015). Segment Disclosure and Cost of
Capital. Journal of Business Finance & Accounting, (January), 1–45.
Bloomfield, R., Hodge, F., Hopkins, P., & Rennekamp, K. (2015). Does Coordinated
Presentation Help Credit Analysts Identify Firm Characteristics? Contemporary
Accounting Research, forthcoming.
Bloomfield, R. J. (2002). The “Incomplete Revelation Hypothesis” and Financial Reporting.
Accounting Horizons, 16(3), 233–243.
Blouin, J. L., & Robinson, L. a. (2014). Insights from Academic Participation in the FAF’s
Initial PIR: The PIR of FIN 48. Accounting Horizons, 28(3), 479–500.
Boatsman, J. R., Behn, B. K., & Patz, D. H. (1994). A Test of the Use of Geographical
Segment Disclosures. Journal of Accounting Research, 31(Supplement), 46–65.

253
Botosan, C. A. (1997). Disclosure level and the cost of equity capital. The Accounting
Review, 72(3), 323–349.
Botosan, C. A. (2004). Discussion of a framework for the analysis of firm risk
communication. The International Journal of Accounting, 39(3), 289–295.
Botosan, C. A., & Harris, M. S. (2000). Motivations for a Change in Disclosure Frequency
and Its Consequences: An Examination of Voluntary Quarterly Segment Disclosures.
Journal of Accounting Research, 38(2), 329–353.
Botosan, C. A., & Stanford, M. (2005). Managers’ Motives to Withhold Segment Disclosures
and the Effect of SFAS No. 131 on Analysts’ Information Environment. The Accounting
Review, 80(3), 751–771.
Bozzolan, S., Trombetta, M., & Beretta, S. (2009). Forward-Looking Disclosures, Financial
Verifiability and Analysts’ Forecasts: A Study of Cross-Listed European Firms.
European Accounting Review, 18(3), 435–473.
Bradshaw, M. T. (2009). Analyst information processing, financial regulation, and academic
research. The Accounting Review, 84(4), 1073–1083.
Bradshaw, M. T. (2011). Analysts’ Forecasts: What Do We Know After Decades of Work?
Working Paper.
Bradshaw, M. T., Miller, G. S., & Serafeim, G. (2009). Accounting Method Heterogeneity
and Analysts’ Forecasts. Working Paper.
Bradshaw, M. T., Richardson, S. A., & Sloan, R. G. (2001). Do Analysts and Auditors Use
Information in Accruals? Journal of Accounting Research, 39(1), 45–74.
Bratten, B., Choudhary, P., & Schipper, K. (2013). Evidence that Market Participants Assess
Recognized and Disclosed Items Similarly when Reliability is Not an Issue. The
Accounting Review, 88(4), 1179–1210.
Brazel, J. F., Lail, B. E., & Pagach, D. P. (2013). The Role of Non-Financial Measures in
Management Forecasts. Working Paper.
Brown, L. D., Call, A. C., Clement, M. B., & Sharp, N. Y. (2015). Inside the “Black Box” of
Sell-Side Financial Analysts. Journal of Accounting Research, 53(1), 1–47.
Bugeja, M., Czernkowski, R., & Moran, D. (2014). The Impact of the Management Approach
on Segment Reporting. Journal of Business Finance & Accounting, (forthcoming).
Burgstahler, D. C., & Eames, M. J. (2003). Earnings Management to Avoid Losses and
Earnings Decreases: Are Analysts Fooled? Contemporary Accounting Research, 20(2),
253–294.
Call, A. C., Chen, S., Miao, B., & Tong, Y. H. (2014). Short-term earnings guidance and
accrual-based earnings management. Review of Accounting Studies, 19(2), 955–987.
254
Callen, J. L., Hope, O.-K., & Segal, D. (2005). Domestic and Foreign Earnings, Stock Return
Variability, and the Impact of Investor Sophistication. Journal of Accounting Research,
43(3), 377–412.
CFA Institute. (2007). A Comprehensive Business Reporting Model - Financial Reporting for
Investors. Report.
CFA Institute. (2013). Financial Reporting Disclosures: Investor Perspectives on
Transparency, Trust, and Volume. Report.
Chen, P. F., & Zhang, G. (2003). Heterogeneous Investment Opportunities in Multiple-
Segment Firms and the Incremental Value Relevance of Segment Accounting Data. The
Accounting Review, 78(2), 397–428.
Chen, P. F., & Zhang, G. (2007). Segment Profitability, Misvaluation, and Corporate
Divestment. The Accounting Review, 82(1), 1–26.
Chen, S., DeFond, M. L., & Park, C. W. (2002). Voluntary disclosure of balance sheet
information in quarterly earnings announcements. Journal of Accounting and
Economics, 33(2), 229–251.
Chen, S., Matsumoto, D., & Rajgopal, S. (2011). Is silence golden? An empirical analysis of
firms that stop giving quarterly earnings guidance. Journal of Accounting and
Economics, 51(1-2), 134–150.
Cheng, Q., Luo, T., & Yue, H. (2013). Managerial Incentives and Management Forecast
Precision. The Accounting Review, 88(5), 1575–1602.
Clarkson, P. M., Kao, J. L., & Richardson, G. D. (1999). Evidence That Management
Discussion and Analysis (MD&A) is a Part of a Firm’s Overall Disclosure Package.
Contemporary Accounting Research, 16(1), 111–134.
Clement, M. B. (1999). Analyst forecast accuracy: Do ability, resources, and portfolio
complexity matter? Journal of Accounting and Economics, 27, 285–303.
Coffee, J. C. (2002). Racing Towards the Top?: The Impact of Cross-Listings and Stock
Market Competition on International Corporate Governance. Working Paper.
Collins, D., & Henning, S. (2004). Write-Down Timeliness, Line-of-Business Disclosures
and Investors’ Interpretations of Segment Divestiture Announcements. Journal of
Business Finance & Accounting, 31(9&10), 1261–1300.
Collins, D. W. (1976). Predicting Earnings with Sub-Entity Data: Some Further Evidence.
Journal of Accounting Research, 14(1), 163–177.
Core, J. E. (2001). A review of the empirical disclosure literature: discussion. Journal of
Accounting and Economics, 31(1-3), 441–456.

255
Cormier, D. & Magnan, M. (2004). The impact of the Web on information and
communication modes: The case of corporate environmental disclosure. International
Journal of Technology Management, 27(4), 393-416.
Cotter, J., Tarca, A., & Wee, M. (2012). IFRS adoption and analysts’ earnings forecasts:
Australian evidence. Accounting and Finance, 52, 395–419.
Cotter, J., Tuna, J., & Wysocki, P. D. (2006). Expectations Management and Beatable
Targets: How Do Analysts React to Explicit Earnings Guidance? Contemporary
Accounting Research, 23(3), 593–624.
Crawford, L., Extance, H., Helliar, C., & Power, D. (2012). Operating segments: The
usefulness of IFRS 8. ICAS Insight Publication.
Custódio, C. (2014). Mergers and Acquisitions Accounting and the Diversification Discount.
Journal of Finance, 69(1), 219–240.
Das, S. (1998). Financial Analysts’ Earnings Forecasts For Loss Firms. Managerial Finance,
24(6), 37–46.
Davis, A. K., & Tama-Sweet, I. (2012). Managers’ Use of Language Across Alternative
Disclosure Outlets: Earnings Press Releases versus MD&A. Contemporary Accounting
Research, 29(3), 804–837.
Dechow, P. M., & Dichev, I. D. (2002). The Quality of Accruals and Earnings: The Role of
Accrual Estimation Errors. The Accounting Review, 77(s-1), 35–59.
Defond, M. L., & Jiambalvo, J. (1994). Debt covenant violation and manipulation of
accruals. Journal of Accounting and Economics, 7, 145–176.
Denis, D. J., Denis, D. K., & Sarin, A. (1997). Agency Problems, Equity Ownership, and
Corporate Diversification. The Journal of Finance, LII(1), 135–161.
Denis, D. J., Denis, D. K., & Yost, K. (2002). Global Diversification, Industrial
Diversification, and Firm Value. The Journal of Finance, LVII(5), 1951–1979.
Depoers, F., & Jeanjean, T. (2012). Determinants of Quantitative Information Withholding in
Annual Reports. European Accounting Review, 21(1), 115–151.
Dichev, I. D., Graham, J. R., Harvey, C. R., & Rajgopal, S. (2013). Earnings quality:
Evidence from the field. Journal of Accounting & Economics, 56(1), 1–33.
Diether, K. B., Malloy, C. J., & Scherbina, A. (2002). Differences of Opinion and the Cross
Section of Stock Returns. The Journal of Finance, LVII(5), 2113–2141.
Dixon, C. T. (2011). SEC Disclosure and Corporate Governance. Weil Gotshal Alert from the
Public Company Advisory Group at Weil, Gotshal & Manges LLP.
256
Doyle, J. T., & Magilke, M. J. (2009). The Timing of Earnings Announcements: An
Examination of the Strategic Disclosure Hypothesis. The Accounting Review, 84(1),
157–182.
Duffee, G. R. (1995). Stock returns and volatility - A firm-level analysis. Journal of
Financial Economics, 37, 399–420.
Dunn, K., & Nathan, S. (2005). Analyst Industry Diversification and Earnings Forecast
Accuracy. The Journal of Investing, 7–14.
Dutta, S., & Gigler, F. (2002). The Effect of Earnings Forecasts on Earnings Management.
Journal of Accounting Research, 40(3), 631–655.
Dye, R. A. (1986). Proprietary and Nonproprietary Disclosures. Journal of Business, 59(2),
331–366.
EFRAG. (2012). EFRAG, ANC & FRC Discussion Paper: Towards a Disclosure Framework
for the Notes. Discussion Paper.
Einhorn, E., & Ziv, A. (2008). Intertemporal Dynamics of Corporate Voluntary Disclosures.
Journal of Accounting Research, 46(3), 567–589.
Elliott, W. B., Hobson, J. L., & Jackson, K. E. (2011). Disaggregating Management Forecasts
to Reduce Investors’ Susceptibility to Earnings Fixation. The Accounting Review, 86(1),
185–208.
Ellis, J. A., Fee, C. E., & Thomas, S. E. (2012). Proprietary Costs and the Disclosure of
Information About Customers. Journal of Accounting Research, 50(3), 685–727.
ESMA. (2011). Review of European enforcers on the implementation of IFRS 8 – Operating
Segments. Report.
ESMA. (2012). Activity Report on IFRS Enforcement in the European Economic Area in
2011. Report.
Ettredge, M., Kwon, S. Y., & Smith, D. (2002a). Competitive Harm and Companies’
Positions on SFAS No. 131. Journal of Accounting, Auditing & Finance, 17(2), 93–109.
Ettredge, M., Kwon, S. Y., & Smith, D. (2002b). Security Market Effects Associated with
SFAS No. 131: Reported Business Segments. Review of Quantitative Finance and
Accounting, 18(4), 323–344.
Ettredge, M. L., Kwon, S. Y., Smith, D. B., & Stone, M. S. (2006). The Effect of SFAS No.
131 on the Cross-segment Variability of Profits Reported by Multiple Segment Firms.
Review of Accounting Studies, 11(1), 91–117.
Ettredge, M. L., Kwon, S. Y., Smith, D. B., & Zarowin, P. A. (2005). The Impact of SFAS
No . 131 Business Segment Data on the Market’s Ability to Anticipate Future Earnings.
The Accounting Review, 80(3), 773–804.

257
FAF. (2012). Post-implementation review report on FASB Statement No. 131, Disclosures
about Segments of an Enterprise and Related Information.
FAF. (2013). Post-implementation review process. Retrieved from
http://www.accountingfoundation.org/jsp/Foundation/Page/FAFBridgePage&cid=13510
27541571
FASB. (1997). Statement of Financial Accounting Standards No. 131 Disclosures about
Segments of an Enterprise and Related Information
Financial Reporting Council. (2012). Thinking about disclosures in a broader context.
Discussion Paper.
Fleming, D. M. (2009). Management Forecast Characteristics: Effects on Venture Capital
Investment Screening Judgments. Behavioral Research in Accounting, 21(2), 13–36.
Foster, G. (1975). Security Price Revaluation Implications of Sub-Earnings Disclosure.
Journal of Accounting Research, 13(2), 283–292.
Francis, J., LaFond, R., Olsson, P. M., & Schipper, K. (2004). Costs of Equity and Earnings
Attributes. The Accounting Review, 79(4), 967–1010.
Francis, J., Nanda, D., & Olsson, P. (2008). Voluntary Disclosure, Earnings Quality, and Cost
of Capital. Journal of Accounting Research, 46(1), 53–99.
Francis, J. R., Richard, C., & Vanstraelen, A. (2009). Assessing France’s Joint Audit
Requirement: Are Two Heads Better than One? Auditing: A Journal of Practice &
Theory, 28(2), 35–63.
Francis, J., & Schipper, K. (1999). Have Financial Statements Lost Their Relevance? Journal
of Accounting Research, 37(2), 319–352.
Franco, F., Urcan, O., & Vasvari, F. P. (2013). Debt Market Benefits of Corporate
Diversification and Segment Disclosures. Working Paper.
Frank, K. A. (2000). Impact of a Confounding Variable on a Regression Coefficient.
Sociological Methods & Research, 29(2), 147–194.
Givoly, D., Hayn, C., & D’Souza, J. (1999). Measurement Errors and Information Content of
Segment Reporting. Review of Accounting Studies, 4, 15–43.
Givoly, D., Hayn, C., & Yoder, T. (2011). Do Analysts Account for Earnings Management?
Working Paper.
Graham, J. R., Harvey, C. R., & Rajgopal, S. (2005). The economic implications of corporate
financial reporting. Journal of Accounting and Economics, 40(1-3), 3–73.
Greenstein, M. M., & Sami, H. (1994). The impact of SEC’s segment disclosure requirement
on bid-ask spreads. The Accounting Review, 69(1), 179–199.

258
Guidry, F., Leone, A. J., & Rock, S. (1999). Earnings-based bonus plans and earnings
management by business-unit managers. Journal of Accounting and Economics, 26(1-3),
113–142.
Harris, M. S. (1998). The Association between Competition and Managers’ Business
Segment Reporting Decisions. Journal of Accounting Research, 36(1), 111–128.
Hassell, J. M., Jennings, R. H., & Lasser, D. J. (1988). Management Earnings Forecasts:
Their Usefulness as a Source of Firm-Specific Information to Security Analysts. The
Journal of Financial Research, XI(4), 303–319.
Hayes, R. M., & Lundholm, R. (1996). Segment Reporting to the Capital Market in the
Presence of a Competitor. Journal of Accounting Research, 34(2), 261–280.
Healy, P. M., Hutton, A. P., & Palepu, K. G. (1999). Stock Performance and Intermediation
Changes Surrounding Sustained Increases in Disclosure. Contemporary Accounting
Research, 16(3), 485–520.
Healy, P. M., & Palepu, K. G. (1993). The Effect of Firms’ Financial Disclosure Strategies
on Stock Prices. Accounting Horizons, 7(1), 1–11.
Healy, P. M., & Palepu, K. G. (2001). Information asymmetry, corporate disclosure, and the
capital markets: A review of the empirical disclosure literature. Journal of Accounting
and Economics, 31(1-3), 405–440.
Herrmann, D., Kang, T., & Kim, J. (2010). International Diversification and Management
Earnings Guidance: The Effects of Reg FD. Journal of International Accounting
Research, 9(1), 1–22.
Herrmann, D., & Thomas, W. B. (1997). Reporting Disaggregated Information: A Critique
Based on Concepts Statement No. 2. Accounting Horizons, 11(3), 35–45.
Herrmann, D., & Thomas, W. B. (2000). An Analysis of Segment Disclosures under SFAS
No. 131 and SFAS No. 14. Accounting Horizons, 14(3), 287–302.
Hirst, D. E., Koonce, L., & Miller, J. (1999). The Joint Effect of Management’s Prior
Forecast Accuracy and the Form of Its Financial Forecasts on Investor Judgment.
Journal of Accounting Research, 37(Supplement), 101–124.
Hirst, D. E., Koonce, L., & Venkataraman, S. (2007). How Disaggregation Enhances the
Credibility of Management Earnings Forecasts. Journal of Accounting Research, 45(4),
811–837.
Hirst, D. E., Koonce, L., & Venkataraman, S. (2008). Management Earnings Forecasts: A
Review and Framework. Accounting Horizons, 22(3), 315–338.
doi:10.2308/acch.2008.22.3.315
Hobson, J. L., Mayew, W. J., & Venkatachalam, M. (2012). Analyzing Speech to Detect
Financial Misreporting. Journal of Accounting Research, 50(2), 349–392.

259
Hoffmann, C., & Fieseler, C. (2012). Investor relations beyond financials: Non-financial
factors and capital market image building. Corporate Communications: An International
Journal, 17(2), 138–155.
Hollander, S., Pronk, M., & Roelofsen, E. (2010). Does Silence Speak? An Empirical
Analysis of Disclosure Choices During Conference Calls. Journal of Accounting
Research, 48(3), 531–563.
Hong, H., & Kubik, J. D. (2003). Analyzing the Analysts: Career Concerns and Biased
Earnings Forecasts. The Journal of Finance, LVIII(1), 313–351.
Hope, O.-K. (2003a). Accounting Policy Disclosures and Analysts’ Forecasts. Contemporary
Accounting Research, 20(2), 295–321.
Hope, O.-K. (2003b). Disclosure Practices, Enforcement of Accounting Standards, and
Analysts’ Forecast Accuracy: An International Study. Journal of Accounting Research,
41(2), 235–272.
Hope, O.-K. (2003c). Firm-level Disclosures and the Relative Roles of Culture and Legal
Origin. Journal of International Financial Management and Accounting, 14(3), 218–
248.
Hope, O.-K., Kang, T., & Kim, J. W. (2013). Voluntary Disclosure Practices by Foreign
Firms Cross-Listed in the United States. Journal of Contemporary Accounting &
Economics, 9, 50–66.
Hope, O.-K., Kang, T., Thomas, W. B., & Vasvari, F. (2008a). Pricing and Mispricing
Effects of SFAS 131. Journal of Business Finance & Accounting, 35(3-4), 281–306.
Hope, O.-K., Kang, T., Thomas, W. B., & Vasvari, F. (2008b). The effects of SFAS 131
geographic segment disclosures by U.S. multinational companies on the valuation of
foreign earnings. Journal of International Business Studies, 40(3), 421–443.
Hope, O.-K., & Thomas, W. B. (2008). Managerial Empire Building and Firm Disclosure.
Journal of Accounting Research, 46(3), 591–626.
Hope, O.-K., Thomas, W. B., & Winterbotham, G. (2006). The Impact of Nondisclosure of
Geographic Segment Earnings on Earnings Predictability. Journal of Accounting,
Auditing & Finance, 323–347.
Horton, J., Serafeim, G., & Serafeim, I. (2013). Does Mandatory IFRS Adoption Improve the
Information Environment? Contemporary Accounting Research, 30(1), 388–423.
Houston, J. F., Lev, B., & Tucker, J. W. (2010). To Guide or Not to Guide? Causes and
Consequences of Stopping Quarterly Earnings Guidance. Contemporary Accounting
Research, 27(1), 143–185.
Hribar, P., & Nichols, C. D. (2007). The Use of Unsigned Earnings Quality Measures in
Tests of Earnings Management. Journal of Accounting Research, 45(5), 1017–1053.
260
Human, T. (2013). Will companies from beyond Europe start publishing their own consensus
figures? IR Magazine.
Hutton, A. P. (2005). Determinants of Managerial Earnings Guidance Prior to Regulation
Fair Disclosure and Bias in Analysts’ Earnings Forecasts. Contemporary Accounting
Research, 22(4), 867–914.
Hutton, A. P., Miller, G. S., & Skinner, D. J. (2003). The Role of Supplementary Statements
with Management Earnings Forecasts. Journal of Accounting Research, 41(5), 867–890.
Hutton, J. G., Goodman, M. B., Alexander, J. B., & Genest, C. M. (2001). Reputation
management: the new face of corporate public relations? Public Relations Review,
27(3), 247–261.
Hyland, D. C., & Diltz, J. D. (2002). Why firms diversify: An empirical examination.
Financial Management, 51–81.
IASB. (2006a). IFRS 8 Operating Segments.
IASB. (2006b). IFRS 8 Operating Segments Implementation Guidance.
IASB. (2013a). A Review of the Conceptual Framework for Financial Reporting. Discussion
Paper, (DP/2013/I).
IASB. (2013b). Discussion Forum - Financial Reporting Disclosure. Feedback Statement.
IASB. (2013c). IFRS 9 Financial Instruments.
IASB. (2013d). Post-implementation Review: IFRS 8 Operating Segments.
IR Magazine. (2012). Global Practice Report 2012.
Jacob, J., Lys, T. Z., & Neale, M. A. (1999). Expertise in forecasting performance of security
analysts. Journal of Accounting and Economics, 28, 51–82.
Jensen, M. C., & Meckling, W. H. (1976). Theory of the firm: Managerial behavior, agency
costs and ownership structure. Journal of Financial Economics, 3, 305–360.
Johnson, S. (2010). The SEC Has a Few Questions for You. CFO Magazine.
Jones, J. J. (1991). Earnings Management During Import Relief Investigations. Journal of
Accounting Research, 29(2), 193–228.
Karageorgiou, G., & Serafeim, G. (2014). Earnings Guidance - Part of the Future or the Past?
KKS Advisors Generation Foundation Report.
Kasznik, R. (1999). On the Association between Voluntary Disclosure and Earnings
Management. Journal of Accounting Research, 37(1), 57–81.
261
Kim, Y., & Park, M. S. (2011). Are all management earnings forecasts created equal?
Expectations management versus communication. Review of Accounting Studies, 17(4),
807–847.
King, R., Pownall, G., & Waymire, G. (1990). Expectations Adjustment via Timely
Management Forecasts: Review, Synthesis, and Suggestions for Future Research.
Journal of Accounting Literature, 9, 113–144.
Kinney Jr., W. R. (1971). Predicting Earnings: Entity versus Subentity Data. Journal of
Accounting Research, 9(1), 127–136.
Kirk, M. P., Reppenhagen, D. A., & Tucker, J. W. (2014). Meeting Individual Analyst
Expectations. The Accounting Review, 89(6), 2203–2231.
Kothari, S. P., Leone, A. J., & Wasley, C. E. (2005). Performance matched discretionary
accrual measures. Journal of Accounting and Economics, 39(1), 163–197.
Kothari, S. P., Li, X., & Short, J. E. (2009). The Effect of Disclosures by Management,
Analysts, and Business Press on Cost of Capital, Return Volatility, and Analyst
Forecasts: A Study Using Content Analysis. The Accounting Review, 84(5), 1639–1670.
Lail, B. E., Thomas, W. B., & Winterbotham, G. J. (2014). Classification Shifting Using the
“Corporate/Other” Segment. Accounting Horizons, 28(3), 455–477.
Lambert, R., Leuz, C., & Verrecchia, R. E. (2007). Accounting Information, Disclosure, and
the Cost of Capital. Journal of Accounting Research, 45(2), 385–420.
Lang, M. H., Lins, K. V., & Maffett, M. (2012). Transparency, Liquidity, and Valuation:
International Evidence on When Transparency Matters Most. Journal of Accounting
Research, 50(3), 729–774.
Lang, M. H., Lins, K. V., & Miller, D. P. (2003). ADRs, Analysts, and Accuracy: Does Cross
Listing in the United States Improve a Firm’s Information Environment and Increase
Market Value? Journal of Accounting Research, 41(2), 317–345.
Lang, M. H., & Lundholm, R. (1993). Cross-Sectional Determinants of Analyst Ratings of
Corporate Disclosures. Journal of Accounting Research, 31(2), 246–271.
Lang, M. H., & Lundholm, R. J. (1996). Corporate disclosure policy and analyst behavior.
The Accounting Review, 71(4), 467–492.
Lang, M. H., & Lundholm, R. J. (2000). Voluntary Disclosure and Equity Offerings:
Reducing Information Asymmetry or Hyping the Stock? Contemporary Accounting
Research, 17(4), 623–662.
Lansford, B., Lev, B., & Tucker, J. W. (2013). Causes and Consequences of Disaggregating
Earnings Guidance. Journal of Business Finance & Accounting, 40(1&2), 26–54.
Larcker, D. F., & Rusticus, T. O. (2010). On the use of instrumental variables in accounting
research. Journal of Accounting and Economics, 49(3), 186–205.
262
Lehavy, R., Li, F., & Merkley, K. (2011). The Effect of Annual Report Readability on
Analyst Following and the Properties of Their Earnings Forecasts. The Accounting
Review, 86(3), 1087–1115.
Leisenring, J., Linsmeier, T., Schipper, K., & Trott, E. (2012). Business-model (intent)-based
accounting. Accounting and Business Research, 42(3), 329–344.
Lennox, C. (2005). Management Ownership and Audit Firm Size. Contemporary Accounting
Research, 22(1), 205–227.
Leone, A. J., Minutti-Meza, M., & Wasley, C. (2014). Influential Observations and Inference
in Accounting Research. Working Paper.
Leung, E., & Verriest, A. (2014). The Impact of IFRS 8 on Geographical Segment
Information. Journal of Business Finance & Accounting, (forthcoming).
Li, F. (2008). Annual report readability, current earnings, and earnings persistence. Journal of
Accounting and Economics, 45(2-3), 221–247.
Li, F. (2010). The Information Content of Forward-Looking Statements in Corporate Filings-
A Naïve Bayesian Machine Learning Approach. Journal of Accounting Research, 48(5),
1049–1102.
Li, H. (2013). Repetitive Disclosures in the MD&A. Working Paper.
Libby, R., Tan, H., & Hunton, J. E. (2006). Does the Form of Management’s Earnings
Guidance Affect Analysts' Earnings Forecasts? The Accounting Review, 81(1), 207–225.
Lichtenberg, F. R. (1991). The managerial response to regulation of financial reporting for
segments of a business enterprise. Journal of Regulatory Economics, 3(3), 241–249.
Liu, A. Z. (2014). Can External Monitoring Affect Corporate Financial Reporting and
Disclosure? Evidence from Earnings and Expectations Management. Accounting
Horizons, 28(3), 529–559.
Liu, X. G., & Natarajan, R. (2012). The Effect of Financial Analysts’ Strategic Behavior on
Analysts' Forecast Dispersion. The Accounting Review, 87(6), 2123–2149.
Livnat, J., & Zhang, Y. (2012). Information interpretation or information discovery: which
role of analysts do investors value more? Review of Accounting Studies, 17(3), 612–641.
Lobo, G. J., Kwon, S. S., & Ndubizu, G. A. (1998). The Impact of SFAS No. 14 Segment
Information on Price Variability and Earnings Forecast Accuracy. Journal of Business
Finance & Accounting, 25(7&8), 969–986.
Loughran, T., & McDonald, B. (2014). Measuring Readability in Financial Disclosures. The
Journal of Finance, 69(4), 1643–1671.
Lui, D., Young, S., & Zeng, Y. (2011). Do Sell-Side Analysts Monitor Accounting Quality?
Working Paper.
263
Maines, L. A., & McDaniel, L. S. (2000). Effects of Comprehensive-Income Characteristics
on Nonprofessional Investors’ Judgments: The Role of Financial-Statement Presentation
Format. The Accounting Review, 75(2), 179–207.
Maines, L. A., McDaniel, L. S., & Harris, M. S. (1997). Implications of Proposed Segment
Reporting Standards for Financial Analysts’ Investment Judgments. Journal of
Accounting Research, 35(Supplement), 1–24.
Mangen, C. (2013). Discussion of “Are Analysts’ Cash Flow Forecasts Naïve Extensions of
Their Own Earnings Forecasts?” Contemporary Accounting Research, 30(2), 466–481.
Mayew, W. J. (2012). Disclosure Outlets and Corporate Financial Communication: A
Discussion of “Managers’ Use of Language Across Alternative Disclosure Outlets:
Earnings Press Releases versus MD&A.” Contemporary Accounting Research, 29(3),
838–844.
McCarthy, M. P., & Iannaconi, T. E. (2010). Audit Committee Roundup - Benchmarking
Key Disclosures Against Peers. NACD Directorship Magazine, (June/July), 71.
Mercer, M. (2004). How Do Investors Assess the Credibility of Management Disclosures?
Accounting Horizons, 18(3), 185–196.
Merkley, K. J., Bamber, L. S., & Christensen, T. E. (2012). Detailed management earnings
forecasts: do analysts listen? Review of Accounting Studies, 18(2), 479–521.
Miller, E. M. (1977). Risk, Uncertainty, and Divergence of Opinion. The Journal of Finance,
32(4), 1151–1168.
Miller, G. S. (2009). Should Managers Provide Forecasts of Earnings? A Review of the
Empirical Literature and Normative Policy Recommendations. Working Paper.
Miller, G. S., & Skinner, D. J. (2015). The evolving disclosure landscape: How changes in
technology, the media, and capital markets are affecting disclosure. Journal of
Accounting Research, (forthcoming).
Moldovan, R. (2014). Post-Implementation Reviews for IASB and FASB Standards: A
Comparison of the Process and Findings for the Operating Segments Standards.
Accounting in Europe, 11(1), 113–137.
Morck, R., Shleifer, A., & Vishny, R. W. (1988). Management Ownership and Market
Valuation - An Empirical Analysis. Journal of Financial Economics, 20, 293–315.
Myers, L. A., Scholz, S., & Sharp, N. Y. (2013). Restating under the radar? Determinants of
restatement disclosure choices and the related market reactions. Working Paper.
Nagarajan, N. J., & Sridhar, S. S. (1996). Corporate responses to segment disclosure
requirements. Journal of Accounting and Economics, 21(2), 253–275.
264
Nichols, N. B., & Street, D. L. (2007). The relationship between competition and business
segment reporting decisions under the management approach of IAS 14 Revised.
Journal of International Accounting, Auditing and Taxation, 16(1), 51–68.
Nichols, N. B., Street, D. L., & Cereola, S. J. (2012). An analysis of the impact of adopting
IFRS 8 on the segment disclosures of European blue chip companies. Journal of
International Accounting, Auditing and Taxation, 21(2), 79–105.
Nichols, N. B., Street, D. L., & Gray, S. J. (2000). Geographic Segment Disclosures in the
United States: Reporting Practices Enter A New Era. Journal of International
Accounting, Auditing & Taxation, 9(1), 59–82.
Nichols, N. B., Street, D. L., & Tarca, A. (2013). The Impact of Segment Reporting Under
the IFRS 8 and SFAS 131 Management Approach: A Research Review. Journal of
International Financial Management & Accounting, 24(3), 261–312.
Nikolaev, V., & van Lent, L. (2005). The endogeneity bias in the relation between cost-of-
debt capital and corporate disclosure policy. European Accounting Review, 14(4), 677–
724.
O’Brien, P. C. (1990). Forecast Accuracy of Individual Analysts in Nine Industries. Journal
of Accounting Research, 28(2), 286–304.
O’Brien, P. C., & Bhushan, R. (1990). Analyst Following and Institutional Ownership.
Journal of Accounting Research, 28(Supplement), 55–76.
Park, J. C., & Shin, Y.-C. (2009). The Impact of Increased Segment Disclosure on Insider
Trading Profits: Evidence from SFAS No. 131. Working Paper.
Penman, S. H. (1980). An Empirical Investigation of the Voluntary Disclosure of Corporate
Earnings Forecasts. Journal of Accounting Research, 18(1), 132–160.
Pippin, R. G. (2009). SEC Disclosures Checklists. Chicago, USA: CCH Wolters Kluwer.
Pownall, G., Wasley, C., & Waymire, G. (1993). The Stock Price of Effects of Alternative
Types of Management Earnings Forecasts. The Accounting Review, 68(4), 896–912.
Prather-Kinsey, J., & Meek, G. K. (2004). The effect of revised IAS 14 on segment reporting
by IAS companies. European Accounting Review, 13(2), 213–234.
Preiato, J. P., Brown, P. R., & Tarca, A. (2013). Mandatory adoption of IFRS and analysts’
forecasts: How much does enforcement matter? Working Paper.
Raffournier, B. (1995). The determinants of voluntary financial disclosure by Swiss listed
companies. European Accounting Review, 4(2), 261–280.
Ramnath, S., Rock, S., & Shane, P. (2008). The financial analyst forecasting literature: A
taxonomy with suggestions for further research. International Journal of Forecasting,
24(1), 34–75.
265
Roach, G. (2013a). Don’t shy away from guidance. IR Magazine.
Roach, G. (2013b). FTSE 100 shuns US-style earnings guidance. IR Magazine.
Rogers, J., & Buskirk, A. Van. (2013). Bundled forecasts in empirical accounting research.
Journal of Accounting and Economics, 55(1), 43–65.
Ronen, J., & Livnat, J. (1981). Incentives for Segment Reporting. Journal of Accounting
Research, 19(2), 459–481.
Schipper, K. (1991). Commentary on Analysts’ Forecasts. Accounting Horizons.
Seese, L. P., & Doupnik, T. S. (2003). The materiality of country-specific geographic
segment disclosures. Journal of International Accounting, Auditing and Taxation, 12(2),
85–103.
Shalev, R. (2009). The Information Content of Business Combination Disclosure Level. The
Accounting Review, 84(1), 239–270.
Shi, Y., Magnan, M., & Kim, J-B. (2012). Do countries matter for voluntary disclosure?
Evidence from cross-listed firms in the US. Journal of International Business Studies,
43(February-March), 143-165.
Skinner, D. J., & Sloan, R. G. (2002). Earnings Surprises, Growth Expectations, and Stock
Returns or Don’t Let an Earnings Torpedo Sink Your Portfolio. Review of Accounting
Studies, 7, 289–312.
Smith, J. E., & Smith, N. P. (1971). Readability: A Measure of the Performance of the
Communication Function of Financial Reporting. The Accounting Review, July, 552–
561.
Sobel, J. (1985). A Theory of Credibility. Review of Economic Studies, LII, 557–573.
Soltes, E. (2014). Private Interaction Between Firm Management and Sell-Side Analysts.
Journal of Accounting Research, 52(1), 245–272.
Soper, F. J., & Dolphin, R. (1964). Readability and Corporate Annual Reports. The
Accounting Review, April, 358–362.
Stephan, W. G., Stephan, C. W., & Gudykunst, W. B. (1999). Anxiety in intergroup relations:
A comparison of anxiety/uncertainty management theory and integrated threat theory.
International Journal of Intercultural Relations, 23(4), 613–628.
Stickel, S. E. (1992). Reputation and Performance Among Security Analysts. The Journal of
Finance, XI(5), 1811–1837.
Street, D. L., & Nichols, N. B. (2002). LOB and geographic segment disclosures: an analysis
of the impact of IAS 14 revised. Journal of International Accounting, Auditing and
Taxation, 11(2), 91–113.
266
Street, D. L., Nichols, N. B., & Gray, S. J. (2000). Segment Disclosures under SFAS No.
131: Has Business Segment Reporting Improved? Accounting Horizons, 14(3), 259–285.
Stubben, S. R. (2010). Discretionary Revenues as a Measure of Earnings Management. The
Accounting Review, 85(2), 695–717.
Swaminathan, S. (1991). The impact of SEC mandated segment data on price variability and
divergence of beliefs. The Accounting Review, 66(1), 23–41.
Tan, H., Wang, S., & Welker, M. (2011). Analyst Following and Forecast Accuracy After
Mandated IFRS Adoptions. Journal of Accounting Research, 49(5), 1307–1357.
Tang, M. M. (2014). Consistency in Management Earnings Guidance Patterns. Working
Paper.
Tarca, A., Street, D. L., & Aerts, W. (2011). Factors affecting MD&A disclosures by SEC
registrants: Views of practitioners. Journal of International Accounting, Auditing and
Taxation, 20(1), 45–59.
Thomas, W. B. (2000). A test of the market’s mispricing of domestic and foreign earnings.
Journal of Accounting and Economics, 28(3), 243–267.
Thomas, Z. (2014). U.S.disclosure overload hurts retail investors. International Financial
Law Review, 33(6), 94–94.
Tse, S. (1989). Attributes of industry, industry segment and firm-specific information in
security valuation. Contemporary Accounting Research, 5(2), 592–614.
Venkataraman, R. (2001). The impact of SFAS 131 on financial analysts’ information
environment. PhD Thesis.
Verrecchia, R. E. (1983). Discretionary disclosure. Journal of Accounting and Economics, 5,
179–194.
Verrecchia, R. E. (2001). Essays on disclosure. Journal of Accounting and Economics, 32(1-
3), 97–180.
Villalonga, B. (2004). Diversification Discount or Premium? New Evidence from the
Business Information Tracking Series. The Journal of Finance, 59(2), 479–506.
Wang, Q., Ettredge, M., Huang, Y., & Sun, L. (2011). Strategic revelation of differences in
segment earnings growth. Journal of Accounting and Public Policy, 30(4), 383–392.
Williams, P. A. (1996). The Relation Between a Prior Earnings Forecast by Management and
Analyst Response to a Current Management Forecast. The Accounting Review, 71(1),
103–113.
Wysocki, P. D. (1998). Real options and the informativeness of segment disclosures.
Working Paper.

267
Yang, H. (2012). Capital market consequences of managers' voluntary disclosure styles.
Journal of Accounting and Economics, 53, 167-184.
You, H. (2014). Valuation-Driven Profit Transfer among Corporate Segments. Review of
Accounting Studies, 19(2), 805–838.
Zechman, S. L. C. (2010). The Relation Between Voluntary Disclosure and Financial
Reporting: Evidence from Synthetic Leases. Journal of Accounting Research, 48(3),
725–765.