Embed Size (px)
Citation preview

Three Methods of SNe Ia Classification for PS1 and DES
Spectroscopic Photometric
Rest, 2011
PS1 Papers:
Scolnic, 2011
0 20 40 60 80�50
0
50
100
150
flux
[m25
]
z=0.14
0 20 40 60 80MJD - 55200
z=0.31
0 20 40 60 80�10
�5
0
5
10
15
20
25
flux
[m25
]
z=0.62 griz
SNACC
Scolnic,Brout,Stafford, 2011
Dan Scolnic, Adam Riess, Steve Rodney, JHU

Three Methods of SNe Ia Classification for PS1 and DES
Spectroscopic Photometric
0 20 40 60 80�50
0
50
100
150
flux
[m25
]
z=0.14
0 20 40 60 80MJD - 55200
z=0.31
0 20 40 60 80�10
�5
0
5
10
15
20
25
flux
[m25
]
z=0.62 griz
SNACC
(R~1000)high R
(R~5)low R
The spectral resolution:R=λ / Δλ
(R~30)
Dan Scolnic, Adam Riess, Steve Rodney, JHU
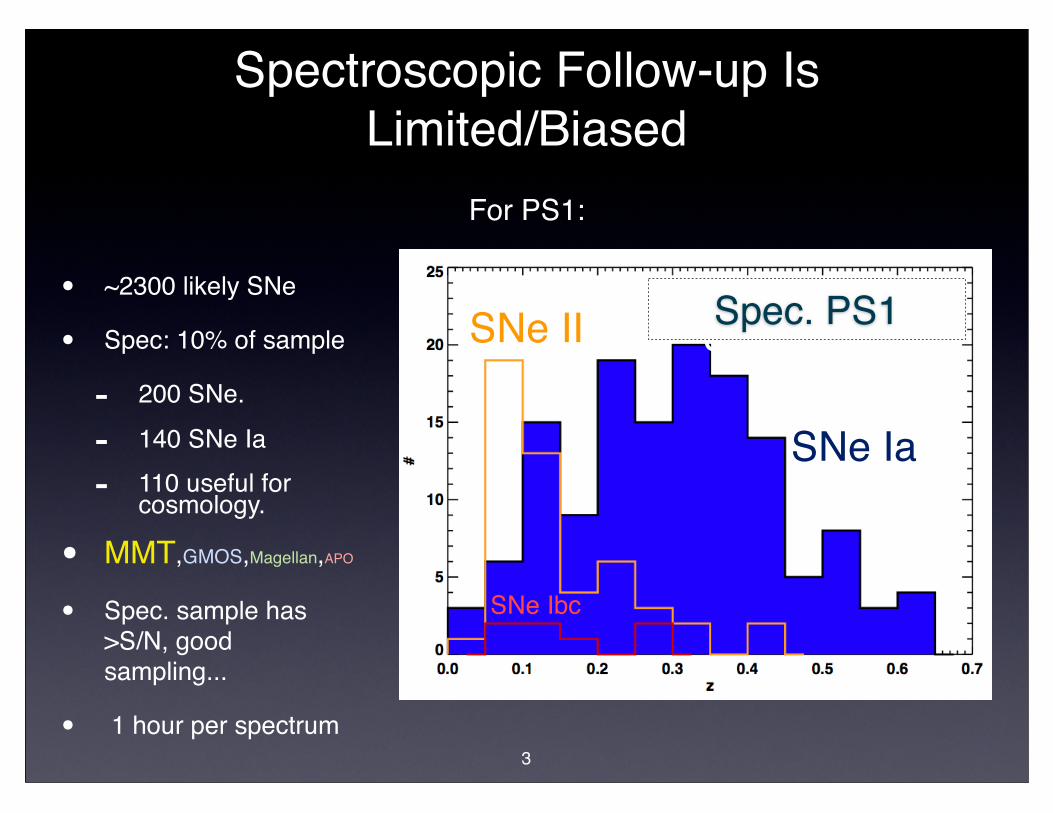
• ~2300 likely SNe
• Spec: 10% of sample
- 200 SNe.
- 140 SNe Ia
- 110 useful for cosmology.
• MMT,GMOS,Magellan,APO
• Spec. sample has >S/N, good sampling...
• 1 hour per spectrum
Spectroscopic Follow-up Is Limited/Biased
For PS1:
3
SNe IISpec. PS1
SampleSpec. PS1
SNe Ia
SNe Ibc

• On pace to 300 SNe Ia, confirmed
• 0.05<z<0.65
• In future, will have own low-z sample
How to use Limited Spectroscopic Follow-up for Cosmology
4
• Spectra are expensive
• Consider TACs approval (Incremental progress hard to show)
• Representative vs. Specific Sample vs. Training
Hicken,2009
Rest,2011
For PS1:

How well does photometric classification work?
For PS1, we analyze 4 Sets:
PS1 Spec. Set: Selection Bias: > S/N, >rad. sep., >samp.PS1 Full Set: Everything. 2260 SNeSim. PS1 Spec. Set: SNANA Sim. Best Match SetSim. PS1 Full Set: Full SNANA Sim.
Methods: SOFT (Rodney), PSNID (Sako), SNLS Color Cuts (Bazin)
SNIa CC
122 39? ?
244 782000 1436
Using light curve quality cuts for all sets.


The Photometric Classification (w/wo z) of PS1 Spectroscopic Set has purity in
90s
Purity is very highRedshift Prior does not significantly help.
> S/N, better sampling, not representative of full set
PSNID SOFT
P>0.9,Χ2<1.6
Spec
. Typ
eSp
ec. T
ype
Spec
. Typ
e
Spec
. Typ
e
Spec
. Typ
eSp
ec. T
ype
Spec
. Typ
e
Spec
. Typ
e
Pur=0.92Eff=0.91
Pur=0.93Eff=0.97
Pur=0.99Eff=0.80
Pur=0.99Eff=0.85

The Photometric Classification (w/wo z) of PS1 Spectroscopic Set has
purity in 90s
Ideally, only boxes along diagonalWorst is if small boxes everywherePur=
NIa
NIa + NIa falsetrue
true
Eff=NIa
NIa total
true

The Photometric Classification (w/wo z) of PS1 Spectroscopic Set has purity in
90s
Purity is very highRedshift Prior does not significantly help.
> S/N, better sampling, not representative of full set
PSNID SOFT
P>0.9,Χ2<1.6
Spec
. Typ
eSp
ec. T
ype
Spec
. Typ
e
Spec
. Typ
e
Spec
. Typ
eSp
ec. T
ype
Spec
. Typ
e
Spec
. Typ
e
Pur=0.92Eff=0.91
Pur=0.93Eff=0.97
Pur=0.99Eff=0.80
Pur=0.99Eff=0.85

Spec
. Typ
e
Simulating spec. set reproduces phot. class. results, Purity=89%-93%
PSNID: Spec. PS1 Set PSNID: Sim. Spec. PS1 Set
Simulated comparable, slightly worse, than Real.Efficiency improves with host galaxy prior.
Spec
. Typ
eSp
ec. T
ype
Spec
. Typ
eSp
ec. T
ype
Spec
. Typ
eSp
ec. T
ype
Spec
. Typ
eSp
ec. T
ype
Pur=0.92Eff=0.91
Pur=0.93Eff=0.97
Pur=0.88Eff=0.97
Pur=0.89Eff=0.98

Simulating the Full Set of SNe, Purity drops to 5-11%
SOFT: Sim. Spec. Conf. PS1 SetSOFT: Sim. Full PS1 Set
- higher # SNe II / # SNe Ia, lower S/N
Spec
. Typ
eSp
ec. T
ype
Spec
. Typ
eSp
ec. T
ype
Spec
. Typ
eSp
ec. T
ype
Spec
. Typ
eSp
ec. T
ype
Pur=0.87Eff=0.73
Pur=0.82Eff=0.98
Pur=0.93Eff=0.97
Pur=0.82Eff=0.98Pur=0.82Eff=0.98
Pur=0.92Eff=0.92

We could extrapolate success of classifiers
PSNID(z)
PSNID(no-z)
SOFT(z)
SOFT(no-z)
PS1 Spec. 93%,97% 92%,91% 98%,85% 99%,80%
Sim PS1 Spec. 89%,98% 88%,97% 93%,97% 92%,92%
Sim Full PS1 83%,97% 83%,79% 82%,98% 87%,73%
(Purity,Eff)
to full PS1 set, however...

We See Lower Classifier Agreement in Reality
PSNID v. SOFT: Sim. Full PS1 Set
PSNID v. SOFT: Full PS1 Set
Simulations overestimate agreement of classifiersMore SNe II in Full PS1 Set or More non-SNe in Full PS1 set
Ia/CC Agree=0.72Ia/CC Agree=0.79

Using SNLS Color Cuts gives high purity, but lower efficiency
Ia
Ia 250
CC 75PS
NID
Color
77% agree
Ia
Ia 171
CC 40
SOFT
Color
81% agree
(Purity,Eff) PSNID SOFT SNLS Color
PS1 Spec 93%,96% 99%,76% 97%,85%
Sim Spec PS1 89%,98% 93%,97% 95%,79%
Sim Full PS1 83%,97% 82%,98% 93%,73%
Bazin et al. 2011(requiring redshift):
x1,cg-ir-zi-z
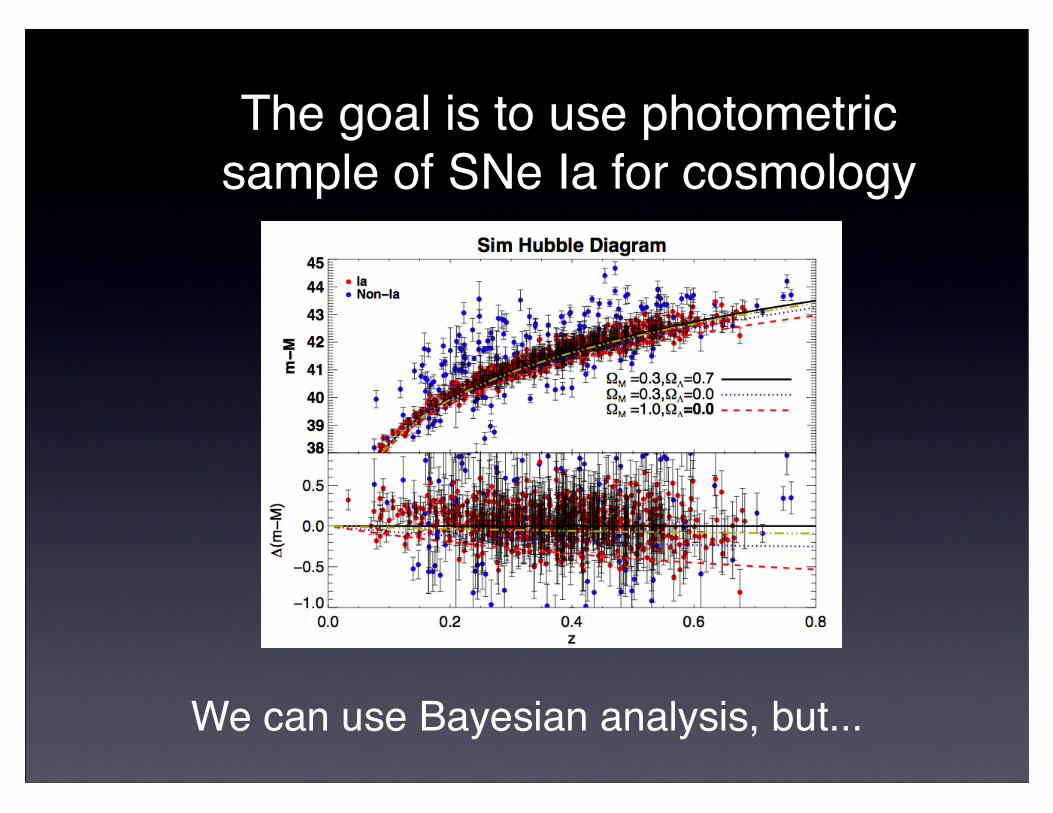
The goal is to use photometric sample of SNe Ia for cosmology
We can use Bayesian analysis, but...

Using SN Photometric Redshifts Degrades Cosmology
•σz/(1+z)=0.03
•σz ~0.04=>.17 mag error in μ. 3x more SNe needed with photo-zs than spec-zs for similar cosmology constraint
•>20% no clear host galaxy (McCrum,PS1,2011)
•Need closer to spectroscopic accuracy, i.e. host galaxy spec. z Degeneracy between fit z
and fit μ
μ(ph
ot)-μ
(sim
)μ(
phot
)-μ(s
pec)
z(phot)-z(sim)
z(phot)-z(sim)

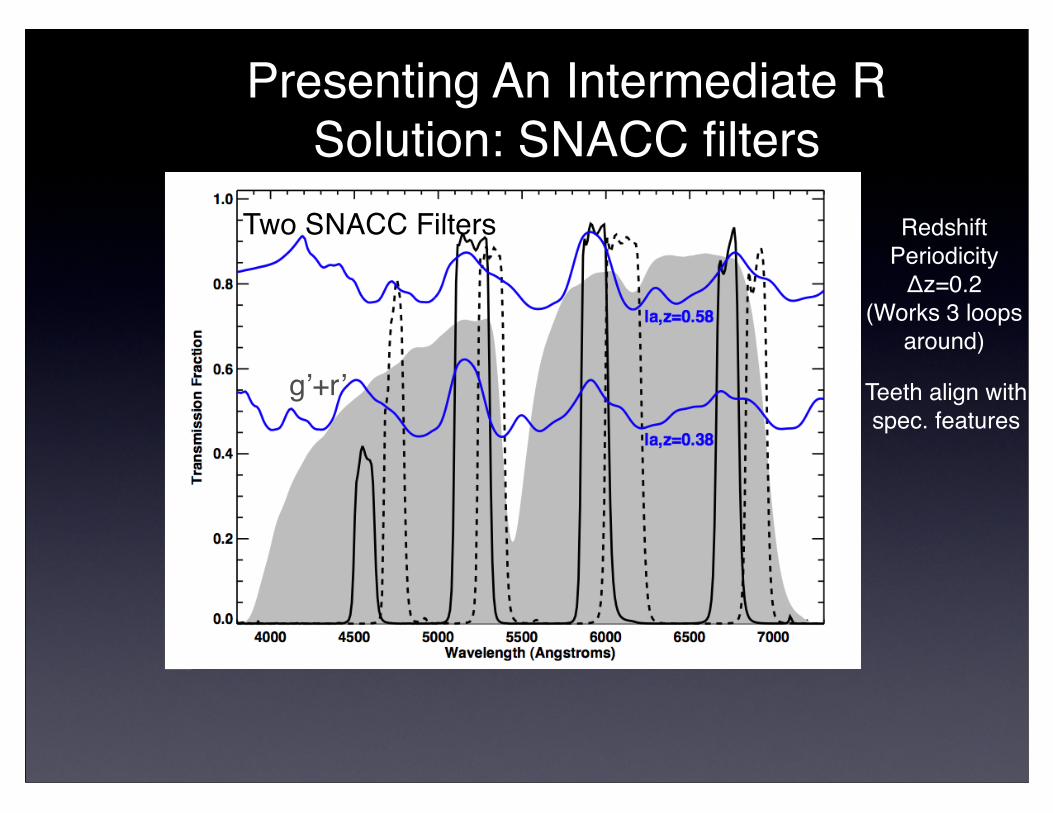
Presenting An Intermediate R Solution: SNACC filters
Two SNACC Filters
g’+r’

Two SNACC Filters
g’+r’
Presenting An Intermediate R Solution: SNACC filters
Teeth align with spec. features
Two SNACC Filters
g’+r’
Redshift PeriodicityΔz=0.2
(Works 3 loops around)
Presenting An Intermediate R Solution: SNACC filters
Teeth align with spec. features

Two SNACC Filters
g’+r’
SNe II - No Correlation
Redshift PeriodicityΔz=0.2
(Works 3 loops around)
Presenting An Intermediate R Solution: SNACC filters
Teeth align with spec. features

PS1/Subaru SNACC observing Program
•2 ‘Comb Filters’ on SuprimeCam
•600 Angstrom equivalent width, 60% of broadband filter.
•4 minutes per image, high S/N
•Multiplex ~ 10 SNe Ia per 1 deg2
•165 SNe followed-up, 5.5 nights(limited by available targets)

SNACC Classifications are Better than Photometric, ~95%
(Purity,Eff) SNACC
Simulated 95%,99%
Confirmed 95%,83%
•SNACC 95% compared to Photometric ~83%•Low S/N degrades efficiency, not purity•With host galaxy spec-z, purity improves to 99%
For Spec. Verified Candidates:
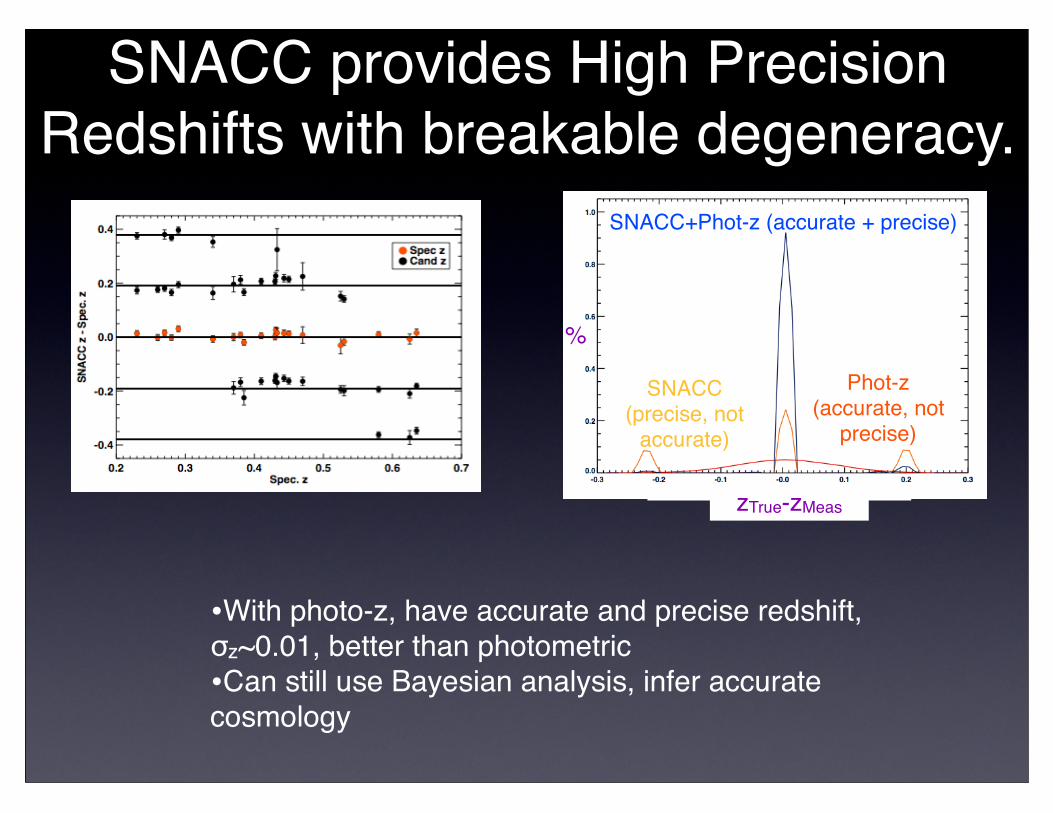
SNACC provides High Precision Redshifts with breakable degeneracy.
•With photo-z, have accurate and precise redshift, σz~0.01, better than photometric•Can still use Bayesian analysis, infer accurate cosmology
SNACC+Phot-z (accurate + precise)
SNACC (precise, not
accurate)
Phot-z (accurate, not
precise)
zTrue-zMeas
%

• Speed (Just 30% slower than broadband, 10x faster than spectroscopic)
• Makes use of cross correlation with spectral features
• Insensitive to reddening, because unlike colors, measurement comes from spectral features not continuum
• Independent of light curve data, fits
• Measurements derived from image subtraction reduce surface brightness bias compared to spectroscopy
The Operational Advantages of SNACC:
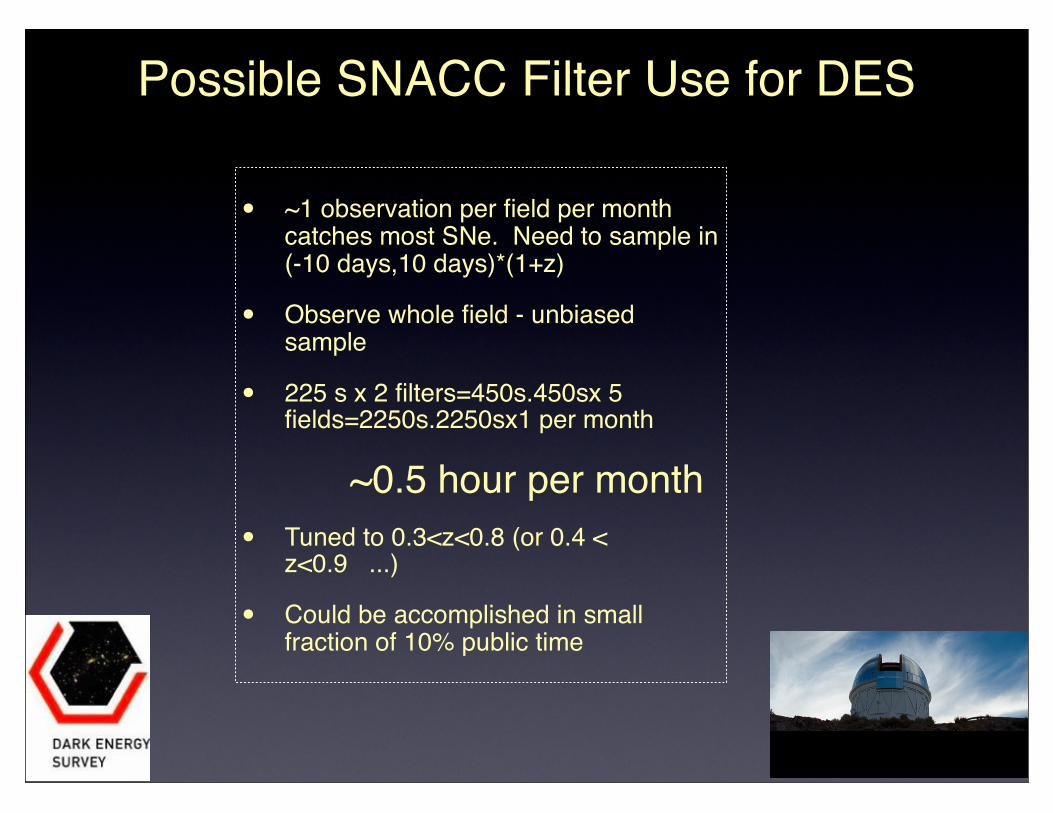
Possible SNACC Filter Use for DES
• ~1 observation per field per month catches most SNe. Need to sample in (-10 days,10 days)*(1+z)
• Observe whole field - unbiased sample
• 225 s x 2 filters=450s.450sx 5 fields=2250s.2250sx1 per month
~0.5 hour per month• Tuned to 0.3<z<0.8 (or 0.4 <
z<0.9 ...)
• Could be accomplished in small fraction of 10% public time

Summary
• Spectroscopic -Expensive, Need to choose between subsamples
• Photometric - Purities ~ mid 80s% for full set, need host galaxy redshifts
• SNACC - Hybrid, 95% purity, advantage if on DES
Should do all of the above.