Embed Size (px)
Citation preview
TRANSPORTATIONThree Revolutions in Urban
Lew Fulton, UC Davis Jacob Mason, ITDP
Dominique Meroux, UC Davis
May 2017
Research supported by: ClimateWorks Foundation, William and Flora Hewlett Foundation, Barr Foundation
How to achieve the full potential of vehicle electrifica-tion, automation and shared mobility in urban trans-
portation systems around the world by 2050
i Three Revolutions in Global Transportation
The authors wish to thank ClimateWorks Foundation, William and Flora Hewlett Foundation, and Barr Foundation for their generous financial support, which made this work possible. We also thank the individuals who participated in the advisory committee for this study and provided valuable comments. Members of that group included Pierpaolo Cazzola (IEA); Holger Dalkmann, Dario Hidalgo, and Diego Canales (WRI); Phillippe Crist (ITF); Shomik Raj Mehndiratta (World Bank); Tim Wallington (Ford); Jarret Walker (unaffiliated); Anthony Eggert (ClimateWorks); Margarita Parra (Hewlett Foundation); Colin Hughes, Aimee Gauthier, Clayton Lane, Kathleen Letchford, Ana Nassar, Bernardo Serra, Diego da Silva, Gabriel Oliveira, and Clarisse Linke (ITDP); and Dan Sperling, Susan Pike and Mollie D’Agostino (UC Davis).
Thanks also to Jacob Teter and other staff at the International Energy Agency for insights related to the urban analysis developed with the IEA Mobility Model (MoMo) that this analysis draws on. However, this analysis has been undertaken by the UC Davis and ITDP, and does not necessarily reflect the views of the International Energy Agency.
Finally, the authors thank all the members of the production teams at UC Davis and ITDP who carried out editing, proof reading, and layout of this report. This includes Stephen Kulieke, Beth Bourne, Rosa Dominguez-Faus, and Kelly Chang (UC Davis); Jamie Knapp (J Knapp Communications); and Jemilah Magnusson (ITDP).
Many other people too numerous to name helped this project succeed, and we thank them. Of course, any errors or flaws in the end product are the responsibility of the authors alone.
Acknowledgements
i Three Revolutions in Global Transportation
AcknowledgementsExecutive Summary1. Introduction2. Study Design, Methodology, and Scenarios3. The Three Revolutions: Status and Potential Electrification Automation Shared Mobility4. Future Scenarios: BAU, 2R, and 3R The BAU Scenario The 2R Scenario: Electrification and Automation The 3R Scenario: Adding Shared Mobility Results: Passenger Travel Projections Across the Scenarios Scenario Impacts on Energy and CO2 Emissions The Costs of 3 Revolutions5. Policy Narratives BAU Scenario Policy Narrative 2R Scenario Policy Narrative 3R Scenario Policy Narrative6. Conclusions, Uncertainties, Next Steps Bibliography
Contentsi1568891115151619212529323233343637
1 Three Revolutions in Global Transportation
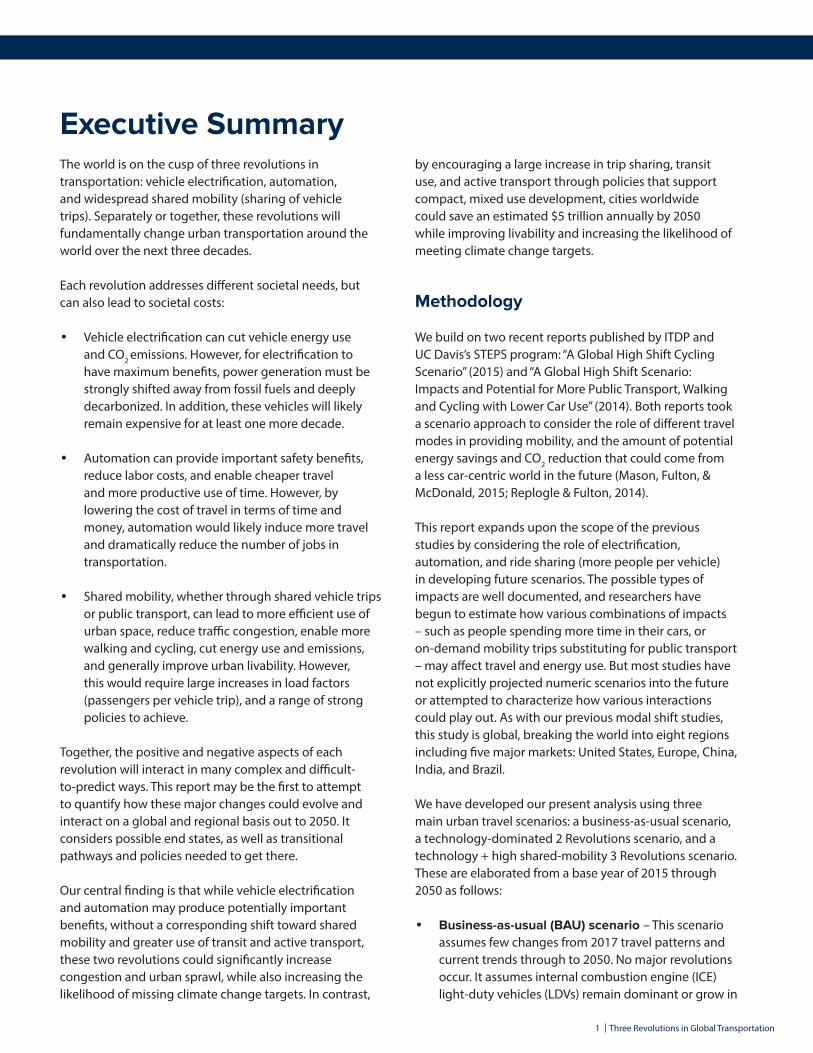
Executive SummaryThe world is on the cusp of three revolutions in transportation: vehicle electrification, automation, and widespread shared mobility (sharing of vehicle trips). Separately or together, these revolutions will fundamentally change urban transportation around the world over the next three decades.
Each revolution addresses different societal needs, but can also lead to societal costs:
• Vehicle electrification can cut vehicle energy use and CO2 emissions. However, for electrification to have maximum benefits, power generation must be strongly shifted away from fossil fuels and deeply decarbonized. In addition, these vehicles will likely remain expensive for at least one more decade.
• Automation can provide important safety benefits, reduce labor costs, and enable cheaper travel and more productive use of time. However, by lowering the cost of travel in terms of time and money, automation would likely induce more travel and dramatically reduce the number of jobs in transportation.
• Shared mobility, whether through shared vehicle trips or public transport, can lead to more efficient use of urban space, reduce traffic congestion, enable more walking and cycling, cut energy use and emissions, and generally improve urban livability. However, this would require large increases in load factors (passengers per vehicle trip), and a range of strong policies to achieve.
Together, the positive and negative aspects of each revolution will interact in many complex and difficult-to-predict ways. This report may be the first to attempt to quantify how these major changes could evolve and interact on a global and regional basis out to 2050. It considers possible end states, as well as transitional pathways and policies needed to get there.
Our central finding is that while vehicle electrification and automation may produce potentially important benefits, without a corresponding shift toward shared mobility and greater use of transit and active transport, these two revolutions could significantly increase congestion and urban sprawl, while also increasing the likelihood of missing climate change targets. In contrast,
by encouraging a large increase in trip sharing, transit use, and active transport through policies that support compact, mixed use development, cities worldwide could save an estimated $5 trillion annually by 2050 while improving livability and increasing the likelihood of meeting climate change targets.
Methodology
We build on two recent reports published by ITDP and UC Davis’s STEPS program: “A Global High Shift Cycling Scenario” (2015) and “A Global High Shift Scenario: Impacts and Potential for More Public Transport, Walking and Cycling with Lower Car Use” (2014). Both reports took a scenario approach to consider the role of different travel modes in providing mobility, and the amount of potential energy savings and CO2 reduction that could come from a less car-centric world in the future (Mason, Fulton, & McDonald, 2015; Replogle & Fulton, 2014).
This report expands upon the scope of the previous studies by considering the role of electrification, automation, and ride sharing (more people per vehicle) in developing future scenarios. The possible types of impacts are well documented, and researchers have begun to estimate how various combinations of impacts – such as people spending more time in their cars, or on-demand mobility trips substituting for public transport – may affect travel and energy use. But most studies have not explicitly projected numeric scenarios into the future or attempted to characterize how various interactions could play out. As with our previous modal shift studies, this study is global, breaking the world into eight regions including five major markets: United States, Europe, China, India, and Brazil.
We have developed our present analysis using three main urban travel scenarios: a business-as-usual scenario, a technology-dominated 2 Revolutions scenario, and a technology + high shared-mobility 3 Revolutions scenario. These are elaborated from a base year of 2015 through 2050 as follows:
• Business-as-usual (BAU) scenario – This scenario assumes few changes from 2017 travel patterns and current trends through to 2050. No major revolutions occur. It assumes internal combustion engine (ICE) light-duty vehicles (LDVs) remain dominant or grow in
2 Three Revolutions in Global Transportation
dominance, depending on the country, through 2050, and applies population and growth projections with these assumptions in mind.
• 2 Revolutions (2R) scenario – This is a technology-focused scenario that includes rapid vehicle electrification along with – but starting later – rapid automation. Electric vehicles (EVs) achieve a significant share of vehicle sales by 2025 in leading countries, with automated EVs reaching this stage about five years later. Both are dominant around the world by 2050. This scenario contains no significant increase of shared vehicle trips through new technology; it preserves the BAU trends toward a private-car-dominated world.
• 3 Revolutions (3R) scenario – This scenario includes widespread vehicle electrification and automation, and adds a major shift in mobility patterns by maximizing the use of shared vehicle trips. This scenario includes all three revolutions, and is a strongly multi-modal scenario, with increased availability of vehicles for shared trips, increased public transport availability and performance (including on-demand small bus services, larger buses and rail), and significant improvements in walking and cycling infrastructure and therefore in travel by these modes.
Other scenarios with different combinations of these revolutions could be considered; the choices made here are intended to simplify these complex scenarios and highlight certain features. And although we cannot accurately predict the interactions that each step of each revolution will have on the others, our scenarios create paradigms of travel that we can use to quantify the energy and CO2 impacts and begin to develop policies to guide the world toward the most societally optimal outcomes.
Findings
Our central finding is that the 3R scenario is the best option for reducing energy use and CO2, and performs significantly better than 2R in these respects as well as on total measured cost. The 3R scenario would also dramatically reduce the number of vehicles on the world’s roads. This finding is true worldwide and for each individual country or region studied.
The following summarizes all key findings:
• The 2R scenario, which includes electrification and automation but with a private-car-dominated world, may provide significant energy and CO 2
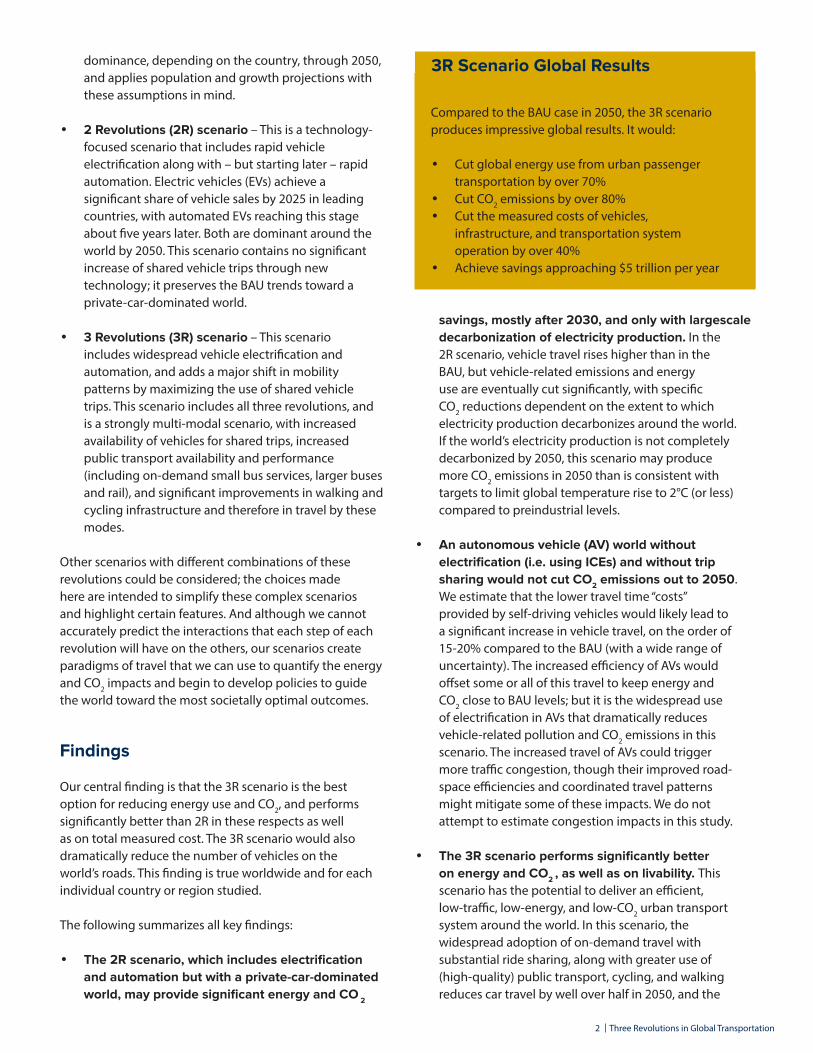
Compared to the BAU case in 2050, the 3R scenario produces impressive global results. It would:
• Cut global energy use from urban passenger transportation by over 70%
• Cut CO2 emissions by over 80% • Cut the measured costs of vehicles,
infrastructure, and transportation system operation by over 40%
• Achieve savings approaching $5 trillion per year
3R Scenario Global Results
savings, mostly after 2030, and only with largescale decarbonization of electricity production. In the 2R scenario, vehicle travel rises higher than in the BAU, but vehicle-related emissions and energy use are eventually cut significantly, with specific CO2 reductions dependent on the extent to which electricity production decarbonizes around the world. If the world’s electricity production is not completely decarbonized by 2050, this scenario may produce more CO2 emissions in 2050 than is consistent with targets to limit global temperature rise to 2°C (or less) compared to preindustrial levels.
• An autonomous vehicle (AV) world without electrification (i.e. using ICEs) and without trip sharing would not cut CO2 emissions out to 2050. We estimate that the lower travel time “costs” provided by self-driving vehicles would likely lead to a significant increase in vehicle travel, on the order of 15-20% compared to the BAU (with a wide range of uncertainty). The increased efficiency of AVs would offset some or all of this travel to keep energy and CO2 close to BAU levels; but it is the widespread use of electrification in AVs that dramatically reduces vehicle-related pollution and CO2 emissions in this scenario. The increased travel of AVs could trigger more traffic congestion, though their improved road-space efficiencies and coordinated travel patterns might mitigate some of these impacts. We do not attempt to estimate congestion impacts in this study.
• The 3R scenario performs significantly better on energy and CO2 , as well as on livability. This scenario has the potential to deliver an efficient, low-traffic, low-energy, and low-CO2 urban transport system around the world. In this scenario, the widespread adoption of on-demand travel with substantial ride sharing, along with greater use of (high-quality) public transport, cycling, and walking reduces car travel by well over half in 2050, and the
3 Three Revolutions in Global Transportation
number of cars by nearly three-quarters compared to our BAU. It would reduce traffic congestion and parking needs dramatically, opening up tremendous amounts of urban space for walking, cycling, and other uses. This scenario – with energy use and CO2
emissions in 2050 less than one-third of the BAU and about one-half that of the 2R scenario, and with fully decarbonized electricity production – yields a very low CO2 picture worldwide.
• Ride sharing must deliver high-occupancy-vehicle travel, both in light-duty taxi-style vehicles and in some larger vehicles such as minivans and small buses. Ride hailing services do not help bring about this scenario if they are dominated by single-occupant trips. Thus, we distinguish “ride hailing” from “ride sharing” where the latter means separate trips are shared in a single ride. Our assumed load factors (average passengers per trip) in ride-hailed vehicles rises over time in the 3R scenario and is about 30-40% higher than in the 2R or BAU scenarios by 2050.
• The 3R scenario also delivers large cost savings. The costs of urban travel would likely be much lower overall in the 3R scenario than in the 2R or BAU scenarios, considering a wide range of out-of-pocket costs, including vehicle purchase and operation, fuel purchase, the costs of operating transportation network companies (TNCs) as well as public transport systems, and the costs of building and maintaining road and transport infrastructure. These savings emerge mainly after 2030 and relate mainly to lower costs of vehicle purchase (given far fewer vehicles purchased), energy cost savings, and road and parking infrastructure cost savings. The 2R scenario saves some costs by 2050 compared to BAU from lower-cost EV and AV operation and by eliminating most drivers, but these savings are mostly offset by higher cost vehicles and induced, increased travel.
• Other potentially important benefits are more difficult to quantify. Though not specifically calculated, the value of CO2 and criteria pollutant emissions reductions are potentially important in the 2R scenario, along with the value of congestion reduction in the 3R scenario. Both scenarios should provide substantial safety benefits if automation lives up to its safety potential and given the much less car-dominant world in 3R. Quantifying these impacts is an important area for further research.
• The 3R scenario achieves its energy, CO2 and cost savings by creating a far more efficient transportation system than in the BAU or 2R scenarios, including:
* Lower overall travel demand due to shorter travel distances from more compact cities
* More transportation choices, with walking and cycling rising significantly over time given safer conditions and better infrastructure
* A much larger share of travel provided by more efficient modes (bus and rail systems as well as smaller, right-sized vehicles, whose size better matches travel demand)
* A higher average load factor (people per trip)* More intense vehicle use, requiring far fewer
vehicles to meet passenger travel needs (since personal vehicles currently remain idle 90+% of the time)
* Lower parking and road-building requirements from less vehicle travel), with associated cost savings.
• The 3R scenario would also dramatically reduce the number of vehicles on the world’s roads by 2050. The current global urban stock of LDVs, around 750 million (out of 1.1 billion total, urban + non-urban), reaches 2.1 billion by 2050 in our BAU and 2R scenarios. In the 3R scenario it drops instead, to about 500 million. In 3R these far fewer vehicles are highly productive, carrying many more people on more trips per day than average vehicles in the other scenarios. Fewer vehicles in 3R allows the world to build far fewer parking spaces and lots, and frees up considerable space for other activities. Total LDV travel also drops by half in the 3R scenario compared to the 2R scenario, meaning less congested and safer roads. In turn, the urban landscape can be repurposed and reoriented toward more cycling and walking.
• Our findings are broadly consistent across world regions, despite very different starting points. Since countries like the United States, with its car-dominated transportation system, are very different from, say, India, with its wide range of modes sharing the streets, these scenarios also look quite different. In fact, for India and most other emerging economies, the high levels of shared vehicle trips in the 3R scenario (at least in terms of the dominance of mass transit mobility) already largely exists, and the main challenge is to preserve it. In general, those regions with existing high levels of public transport, walking, and cycling see these travel modes decline in the BAU scenario as well as in the 2R scenario, as cars become dominant everywhere; in contrast, they retain or gain on public transport ridership in the 3R scenario, thanks to major investments in systems and strong linkages with shared vehicle trips. A 50% or
4 Three Revolutions in Global Transportation
greater reduction in both the numbers of vehicles and CO2 emissions in 2050 appears possible everywhere in the 3R scenario vs. the BAU scenario.
Policy Implications of the Scenarios
The intensity of policies likely required to achieve each scenario tends to increase moving from the BAU case to the 2R and 3R scenarios, with the latter scenario requiring the most ambitious policy scheme to achieve the maximum societal benefits. All policies envisioned in these scenarios would require some flexibility and iteration, as it cannot be fully known how various factors will interact with each other. They would also probably vary by country given local conditions and preferred policy strategies. The following summarizes our policy needs assessment:
• The 2R scenario will require a dual-policy focus incentivizing EV uptake and enabling automation. The scenario includes strong, proactive vehicle electrification policy incentives, resulting in the widespread adoption of EVs with steady 30% or more annual increases in these vehicles for the next 20 years and beyond, and particularly rapid growth between 2020 and 2035. Enabling policies include ongoing purchase incentives and public awareness campaigns, strong government coordination and support of expanded EV charging infrastructure, research support, elimination of petroleum subsidies, as well as electricity decarbonization policies such as carbon taxes or cap-and-trade systems.
• Achieving widespread driverless vehicles must focus on barrier removal. The commercial vehicle sector is eager to take advantage of the tremendous cost-saving potential of automation technologies. Therefore, the 2R scenario assumes that a relaxed regulatory environment will enable rapid adoption of driverless cars. This differs from the BAU scenario, where there is an assumption that heavy regulatory burdens delay adoption of AVs. In the 2R scenario the policy climate is favorable enough to ensure a widespread uptake of automation by commercial fleets by 2025, with households following suit shortly thereafter. But in 2R, on-demand mobility does not grow, and preferences for private vehicle ownership and solo driving endure, with longer trips and even zero-occupant driving becoming commonplace.
• The 3R scenario will require strong additional support for ride sharing, public and active transport, and land-use planning that helps to shorten most vehicle trips. In addition to including those policies assumed for the 2R scenario, the 3R scenario would
contain as a core policy on-demand ride sharing incentives, such as vehicle travel fees tied to vehicle occupancy (such fees could also be applied to private vehicles). These could also vary with the length of trips, vehicle carbon intensity, and level of congestion. Policies could also restrict or heavily charge for private ownership of AVs, and/or their undertaking of zero-occupant trips. Incentives would urge a better match between vehicle size and occupancy, which will make travel more efficient. Bicycle and e-bike sharing systems would be encouraged. Multimodal urban planning investments in walking, cycling, and public transit infrastructure and services would likely help reduce and shorten vehicle trips. These investments would be most effective if coupled with proven practices such as implementation of compact, mixed-use urban plans centered on linking concentrated development zones through public transit, and featuring designated cycling and walking zones.
• In 3R, governments play a central role. The 3R scenario may need governments to coordinate both AV infrastructure and management of public and private trips, broadening the definition of publicly funded transportation in favor of seamless regional travel networks. Central to this transition is the government role for filling gaps, and maintaining equitable access and mobility for all individuals, regardless of income, disability or access to a smartphone or vehicle.
Overall, this analysis suggests that a combination of electrification, automation, and multimodal shared vehicle trips would bring by far the greatest societal benefits for every country in this study. But achieving the full 3R scenario will require unprecedented levels of policy support; it will require creativity and vigilance to ensure that not one or two, but all three, revolutions move forward and to prepare cities around the world for a new era of travel.
5 Three Revolutions in Global Transportation
1. IntroductionDuring the 20th century, several revolutions occurred in transportation systems around the world – most notably the internal combustion engine (ICE), mass production of automobiles, high speed urban and interurban rail systems, and construction of major roadway and limited access expressway networks. However, in the latter part of the century innovation slowed. Now, in 2017, most people still move around cities primarily in vehicles with ICE gasoline or diesel engines, always with a driver, and often with the only occupant serving as driver.
This report will discuss how the following three advancements in technology are set to make dramatic changes:
• Electrification – After an initial surge and rapid decline in the late 19th century, the electric vehicle (EV), either hybridized with engines or entirely running on batteries, has re-emerged as a viable technology. By early 2017, 2 million electric and plug-in hybrid passenger cars (and 200 million 2-wheelers) are plying the world’s roads (Lutsey, 2017).
• Automation – Although they are not commercial yet, technologies to automate vehicles, eventually including eliminating the need for drivers, are moving rapidly. U.S. Society of Automotive Engineers (SAE) level 4 driverless cars appear on track to begin entering commercial fleets by the early 2020s (SAE, 2016).
• Shared vehicle trips – While public transport systems emerged around two centuries ago, and taxi services and carpooling have allowed people to share trips for decades, new technology creates the potential for nearly all trips to be easily shared among multiple riders. This development could revolutionize transportation. Cutting the cost of ride hailing in half or more, ride sharing has the potential to attract large numbers of travelers and dramatically cut the numbers of vehicles on the world’s roads. However, these benefits are only significant if they reduce the number of trips taken. Taxi services or transportation network companies (TNCs) that are not shared do not reduce trips.
These three revolutions are highly uncertain in many ways. They may happen soon, take decades to mature, or
never fully materialize. They may go in different directions and interact in unpredictable ways. They could lead to “heaven or hell” scenarios, depending on the impacts on travel, traffic congestion, safety, energy use, and emissions that result from their combined uptake (Chase, 2014).
Despite the uncertainty, there is a growing literature on these phenomena individually, and an emerging one on their potential interactions (Anair, 2017; Cohen & Shirazi, 2017; Handy, 2017; Ory, 2017; Polzin, 2017). However, this is one of the first studies that attempts to craft coherent future transitional scenarios. Via three scenarios we explore the potential impacts of the three revolutions on travel patterns, vehicle sales and stocks, energy use, CO2 emissions, and costs. We undertake this examination on a worldwide basis and with individual results for key countries and regions.
Many other scenarios could be developed, but the specific ones chosen for this report are designed to highlight a technology dominated world with and without an additional revolution in the travel patterns the world adopts.
6 Three Revolutions in Global Transportation
This report builds on two previous urban travel studies undertaken by UC Davis and ITDP: “A Global High Shift Cycling Scenario” (2015) and “A Global High Shift Scenario: Impacts and Potential for More Public Transport, Walking and Cycling with Lower Car Use” (2014). These reports developed an approach of comparing a business-as-usual (BAU) future to one that considers dramatically increasing investments into sustainable transportation infrastructure along with other measures to promote efficient modes, namely public transport, cycling, and walking. These “High Shift” studies envisioned cities that are far less car-dependent, energy- and CO2-intensive, and – perhaps surprisingly – far less expensive for society.
This study uses the same basic methodology as the previous studies, including the development of a BAU scenario and several high shift scenarios. However, here we are considering a more complex set of dynamics than in the previous studies, since this includes an effort to understand the combined impacts of three separate revolutions. And although this approach is built upon the foundation of the other studies, it is worthy of a different title than the other studies, hence our “3 Revolutions” frame.
This study specifically considers the following:
• Explicit pathways for increased electrification in all types of urban vehicles and modes, and plausible time frames for a “revolution” electrification case in each world region.
• Plausible pathways and time frames for the introduction of vehicle automation, and assumptions about the characteristics of these vehicles and how they may change over time.
• The potential for increased trip sharing outside of public transport systems, and better integration between smaller vehicles and public transport vehicles such as small and large buses, and trunk metro, bus rapid transit, and light rail systems.
• Levels of public transport ridership, cycling, and walking in our 3 Revolutions case that are consistent with those in our High Shift reports, though the massive expansion of shared trips in smaller commercial vehicles leads to some adjustments in public transport, cycling, and walking levels.
As we did in the previous two High Shift studies in this series, we utilize basic data and projections from the Mobility Model (MoMo) created by the International Energy Agency (IEA, 2016), though we have created a new spreadsheet tool specific to the current study, focused on modeling the three revolutions and considering scenarios where they are combined in different manners. Our projection system tracks the numbers of vehicles of all major types, their cost, daily and annual travel, average passenger loadings, fuel use, and CO2 emissions worldwide, broken into eight countries and regions.
These variables are linked using basic arithmetic relationships that allow, for example, the calculation of total vehicle and passenger kilometers for each mode and summed across modes, total numbers of vehicles in use, total vehicle and passenger kilometers (pkm) of travel, total fuel use and CO2 emissions, etc. The data have generally been validated for 2015, but in some cases broad assumptions are made, such as the average passenger loadings in buses in parts of the world. We track the stocks of all vehicles but only track sales of light-duty vehicles (LDVs), both household and commercial LDVs, and how changes in the number of vehicles needed to deliver the transportation service (measured in pkm) translates into sales, taking into account vehicle usage rates and lifetimes, such as the faster turnover of commercial vehicles given their much more intensive daily use than household vehicles.
The analysis is conducted across eight countries and world regions: United States, Organization for Economic Cooperation and Development (OECD) Europe, China, India, Brazil, Other Americas, Africa/Middle East, and Other Europe/Asia. The particulars of each region are reflected in the initial data and BAU projections for each. For example, some regions, such as India, already have very high levels of shared vehicle trips, including public transport use. Others, like the United States, have very low levels of shared vehicle trips, while Europe falls in the middle. Our results bring out some of these particularities of each region, though in this main report we focus on global totals and offer some examples from different countries. We plan to produce separate materials with more details on our results by country/region.
2. Study Design, Methodology, and Scenarios
7 Three Revolutions in Global Transportation
In this report, we consider three main scenarios:
• Business as Usual (BAU) – Current trends continue without any revolutions. ICE vehicles remain dominant through 2050. All vehicle trips continue to require drivers. In countries like the United States, 85% of trips remain in cars (of increasing size), most frequently with a single occupant. In other countries, public transport shares decline as ridership grows only slowly while car ownership and travel steadily rise. This scenario may or may not be likely, but in any case, it provides a useful basis for comparison with the other three scenarios.
• 2 Revolutions (2R) – In this scenario, we consider electrification and automation. It is natural to think that these revolutions will co-evolve because of their co-benefits; electric autonomous vehicles (AVs) can recharge themselves easily at convenient times, and EVs can easily supply power to the hardware needed to automate vehicles. EVs can also help to lower the per-kilometer travel cost of high-use AVs. Electric, driverless vehicles likely will be expensive to produce, at least over the next 10-20 years, but inexpensive to operate both privately and commercially. It is certainly possible to have one without the other (in either direction), but together they provide a true transformative technological and travel revolution.
Much of the analysis in this paper hinges on the types of synergies that could occur by combining these revolutions. Some of these synergies are listed below (Anair, 2017):
• Electrification can assist in the power and electronic demands of AVs. • Automation can assist electrification in terms of battery operation and recharging management, such
as automatically seeking opportunities to recharge during slow periods. • Similarly, AVs can help manage recharging of shared vehicles between trips and extend their effective
daily driving range in this manner. • Automation can lower the costs of sharing vehicle trips including public transport services by
eliminating driver costs, which can be 50% or more of ride-hailing costs. However, this also could lower the costs of non-shared ride-hailing trips enough that there is less incentive to share trips or even to take public transport.
• Trip sharing and strong public transport can help overcome the tendency of automation to trigger increases in travel, as consumers will pay for trips at the margin, and may continue to budget their time spent in travel in a similar way as they do today (rather than purchase more comfortable vehicles and spend more time in them).
• Widespread trip sharing and use of public transport can cut the number of vehicles in use dramatically and reduce traffic levels and congestion significantly, and (on a societal basis) provide cost savings that more than offset the higher purchase costs of automated EVs.
• 3 Revolutions (3R) – Here, the third revolution, an increase in shared vehicle trips, is overlaid on the first two. We view this revolution in an expansive sense: private vehicles replaced with ride hailing of TNC vehicles, shared vehicle trips leading to much higher average vehicle occupancy, and all this coupled with a strong role for public transport and active travel. These all fit together well since the world with more shared vehicle trips will see vastly fewer cars and open up an enormous amount of urban space for things like walking and cycling. Of the three revolutions, widespread shared mobility may be the most challenging to achieve and most dependent on strongly supportive policies. The potential for getting large numbers of people to share rides is highly uncertain, especially as travel costs drop from the other two revolutions. Strong financial incentives will likely be needed to encourage trip sharing and use of public transport in the face of otherwise cheap point-to-point services in single-occupant services.
We also briefly consider the potential impacts of the revolutions individually, and as suboptimized versions of the main scenarios.
Synergies Achieved by Combining Revolutions
8 Three Revolutions in Global Transportation
This section provides a brief introduction and status report on each of the three revolutions, taking into account technology development, extent of market development, and various barriers that the revolution faces to achieving large scale adoption.
ElectrificationElectric vehicles have already arrived: in 2016, the number of different (4-wheel) models available in countries around the world exceeded 100, including everything from electric minicars to plug-in hybrid sport-utility vehicles (Fulton, Seleem, Boshell, Salgado, & Saygin, 2017). In 2017, several 200+ mile (300 kilometer) all-electric models will be introduced, possibly ushering a new era of higher range EVs, and reducing what has been a major barrier to widespread adoption. And yet the global market share of EVs is less than 1%. Are they succeeding or failing? Here we briefly review their status and consider their future potential.
Global Electric Vehicle Market
Varying levels of vehicle electrification, including traditional hybrid vehicles (that don’t plug in), have become available across popular vehicle platforms over the last two decades. The year 2011 stands as the beginning of the modern era of lithium-ion battery electric and plug-in hybrid vehicles, with the introduction of the Nissan Leaf and Chevy Volt. Since then there has been a steady increase in global sales, with cumulative global sales reaching 1 million in 2015 and recently passing 2 million. In 2016, China led the world in EV sales at about 630,000, while Norway led in EV market share of its country’s total auto sales at 29% (Lutsey, 2017).
Although they are not plug-in vehicles, hybrids have proven both cost-effective and popular for taxi fleets. As an example, nearly 66% of the New York City medallion taxis were hybrids in November 2016 (calculated from NYC Open Data). Meanwhile plug-in vehicles have no significant presence in taxi fleets and mixed success in car share fleets.
Vehicle Technology Challenges
Despite the progress in EV sales, growth has been inhibited by several factors, including limited driving range (of most fully-electric vehicles), higher vehicle purchase
cost, greater time to charge an electric battery, a lack of public charging stations, and a recent decline in oil prices worldwide.
Increased driving range would enable more effective deployment of EVs, especially in car share and ride share fleets, because range is inversely related to frequency of needing to pull a vehicle out of operation to recharge. The recent and expected future trend in EV models is in this direction. Among the many examples, the 2017 BMW i3 EV with a 94 Amp-hour battery offers 114 miles of electric range, up from 81 miles in the 2016 model. Notably, the 2017 Chevrolet Bolt EV offers 238 miles of range, a substantial improvement over the 82-mile range of the smaller 2016 Chevrolet Spark EV.
Charging Infrastructure
Greater density of charging infrastructure makes EVs a more viable option. More specifically, availability of fast-charging stations is necessary for car share – and even more so for ride share – fleets to minimize recharging downtime. Car share and ride share fleets have lower handling costs if their vehicles are closer to EV charging.
BMW ReachNow’s European sibling, DriveNow, and Daimler’s car2go electric fleets operate in some cities with a high density of charging infrastructure, including Copenhagen, Vienna, and Amsterdam. In Seattle and Portland, ReachNow’s fleet is composed of roughly 20% BMW i3 EVs, with the balance in other BMW and Mini gasoline cars.
In contrast to these success stories, in 2016 car2go replaced approximately 400 Smart EVs serving 40,000 members in San Diego with gasoline Smart cars, citing a lack of charging stations, range anxiety, and a 20% unavailability rate due to charging time or a low state of charge (Garrick, 2016). This outcome speaks to charging density as a prerequisite for EV use in car share fleets.
Overall the technology and market outlook for EVs appears promising, though the timing of when the technology will translate into a “revolution” remains to be seen. As we discuss in the policy sections of this paper, it seems likely that strong supporting policies will be needed for many years to achieve a full transition from today’s dominant ICE vehicles.
3. The Three Revolutions: Status and Potential
9 Three Revolutions in Global Transportation
AutomationThe technology to enable vehicle automation has emerged rapidly, causing much excitement and generating much attention, but currently little driving automation is used in commercially available vehicles. Significant technological, legal, and cultural hurdles must be addressed before fully automated vehicles take to the roads. This section describes the types of automation available, discusses associated costs, and provides insights on when these technologies are anticipated to move forward.
Automated Technology
The U.S. Society of Automotive Engineers (SAE) (U.S. Department of Transportation, 2016) defines a full range of automation levels (SAE, 2016). Level 1 is widespread and level 2 is rapidly being introduced in many models. Level 3, including hands-free driving, is just emerging and only legal in some areas. Levels 4 and 5, with true full-time driverless operation, is not known to be fully legal anywhere in the world as of early 2017, except for operation by test fleets.
For this study, when characterizing and projecting automation we only consider levels 4 and 5 driverless
vehicle operation. This choice reflects a necessity to reach complete automation to see the types of major impacts on travel patterns that we assume are associated with automation, such as people willing to spend more time in vehicles, and vehicles designed with passengers much more than with drivers in mind. In a fully AV world, especially where these vehicles are privately owned and operated, we expect to see some larger, more comfortable vehicles (perhaps even some with sleeping capability), and expect to see some increase in the amount of driving these vehicles (and people who own them) do each year. Empty running (i.e. zero-occupant) vehicles may also emerge as a significant new source of traffic.
Incremental Purchase Cost of Automation
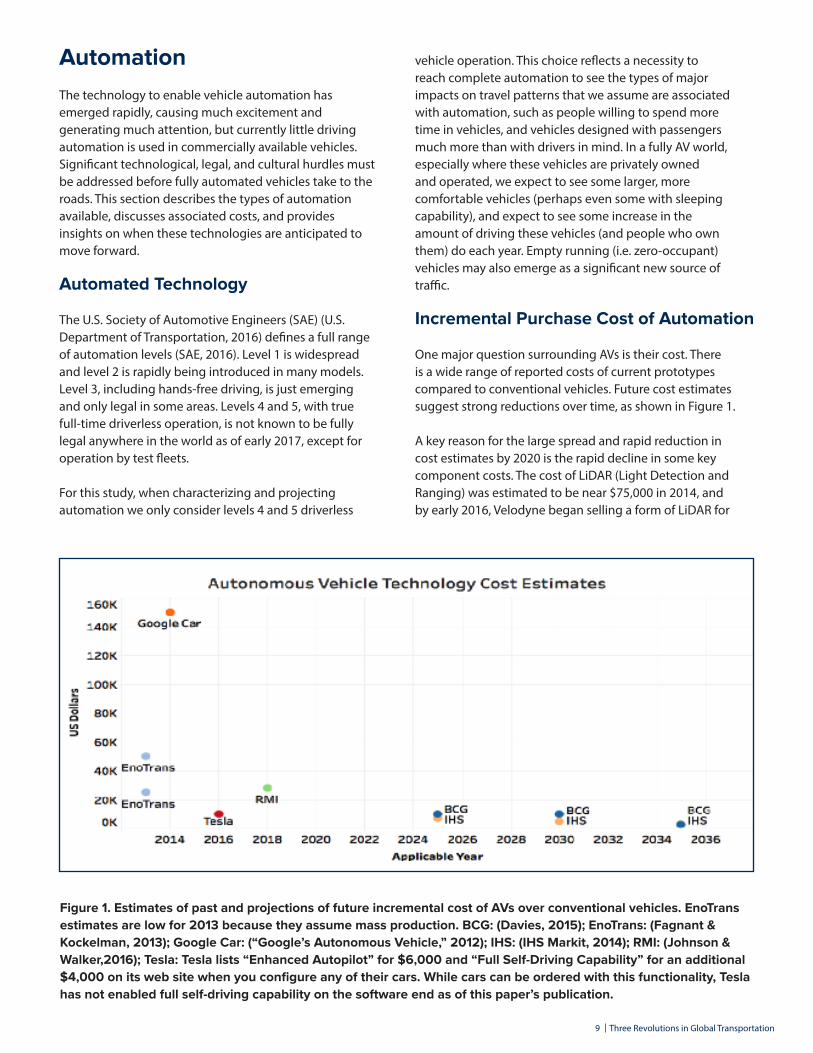
One major question surrounding AVs is their cost. There is a wide range of reported costs of current prototypes compared to conventional vehicles. Future cost estimates suggest strong reductions over time, as shown in Figure 1.
A key reason for the large spread and rapid reduction in cost estimates by 2020 is the rapid decline in some key component costs. The cost of LiDAR (Light Detection and Ranging) was estimated to be near $75,000 in 2014, and by early 2016, Velodyne began selling a form of LiDAR for
Figure 1. Estimates of past and projections of future incremental cost of AVs over conventional vehicles. EnoTransestimates are low for 2013 because they assume mass production. BCG: (Davies, 2015); EnoTrans: (Fagnant &Kockelman, 2013); Google Car: (“Google’s Autonomous Vehicle,” 2012); IHS: (IHS Markit, 2014); RMI: (Johnson & Walker,2016); Tesla: Tesla lists “Enhanced Autopilot” for $6,000 and “Full Self-Driving Capability” for an additional $4,000 on its web site when you configure any of their cars. While cars can be ordered with this functionality, Tesla has not enabled full self-driving capability on the software end as of this paper’s publication.

10 Three Revolutions in Global Transportation
$500 per unit to Ford (McFarland, 2015). Furthermore, the components used for full automation may change over time, or may vary by manufacturer. For example, Tesla has indicated no plans to use LiDAR. It seems reasonable that by 2025, AVs will cost, at most, $10,000 more than equivalent conventional vehicles. Similarly, electrification of the drivetrain and cost of batteries together may cost about $10,000 more than a conventional vehicle, reflecting declining battery costs but rising energy storage of batteries on the average EV. Our EV cost projections are roughly consistent with reports such as (McKerracher et al., 2016), though somewhat lower than reports that use higher future battery cost projections such as (Elgowainy et al., 2016).
We assume that the two together cost about $18,000 more than a comparable ICE vehicle. This drops to about $10,000 by 2050. Even by 2030, autonomous EVs used intensively in car sharing roles are estimated to earn back the higher purchase cost from energy savings within their first three years of operation.
Timing of Autonomous Vehicles
Perhaps the biggest question with AVs is when they will really hit the streets. While some analysts still believe it may be decades before these vehicles overcome all technical and legal barriers, many automakers are stating they will have models ready in the near future, including some indicating a 2020 or 2021 time frame, as shown in Table 1.
AVs are restricted in most countries at this time, however, policies to reduce some restrictions are emerging. Hands-free driving and testing of fully driverless vehicles are allowed in certain areas. In the United States, the Michigan state legislature recently passed a law permitting automakers to operate networks of self-driving taxis within the state, perhaps one of the first jurisdictions in the world to do so. Overall we assume a limited rollout of driverless vehicles through the early 2020s in leading countries, followed by mass market rollouts beginning about 2025.
Company Vehicle Brand Model Powertrain Production Goal
Notes
Nissan Nissan Leaf Electric 2020
GM Chevrolet Bolt Electric Testing 40 cars in San Francisco and Scottsdale
FCA Chrysler Pacifica Hybrid Plug-in Hybrid Testing 100 vehicles with Google
Ford Ford Fusion Hybrid 2021
Volvo Volvo XC90 Hybrid
Uber Ford Fusion Energi Plug-in Hybrid
Uber Volvo XC90 Hybrid
Daimler Mercedes-Benz
F 015 Luxury in Motion
Hydrogen Fuel Cell Plug-In Hybrid
Research Vehicle
Hyundai Hyundai Ioniq Electric Testing 3 vehicles in South Korea
Hyundai Hyundai Tucson Hydrogen Fuel Cell
Testing 2 vehicles in South Korea
Table 1. Examples of AVs in development
11 Three Revolutions in Global Transportation
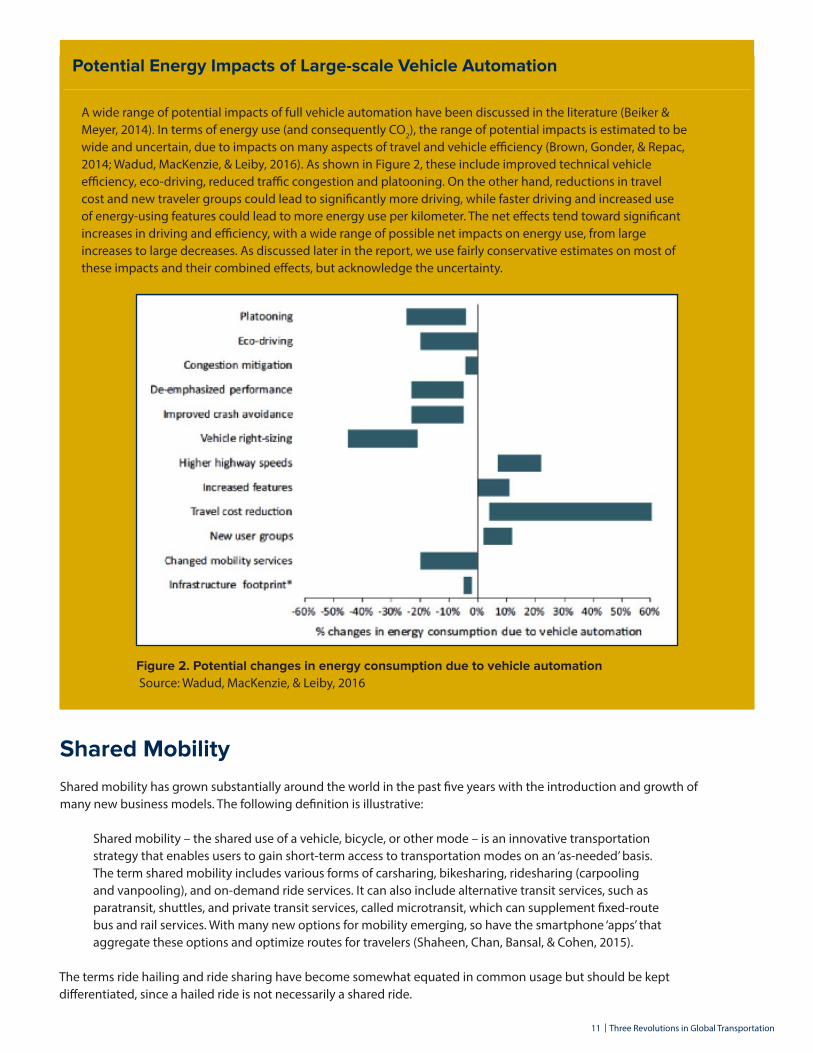
Potential Energy Impacts of Large-scale Vehicle Automation
A wide range of potential impacts of full vehicle automation have been discussed in the literature (Beiker & Meyer, 2014). In terms of energy use (and consequently CO2), the range of potential impacts is estimated to be wide and uncertain, due to impacts on many aspects of travel and vehicle efficiency (Brown, Gonder, & Repac, 2014; Wadud, MacKenzie, & Leiby, 2016). As shown in Figure 2, these include improved technical vehicle efficiency, eco-driving, reduced traffic congestion and platooning. On the other hand, reductions in travel cost and new traveler groups could lead to significantly more driving, while faster driving and increased use of energy-using features could lead to more energy use per kilometer. The net effects tend toward significant increases in driving and efficiency, with a wide range of possible net impacts on energy use, from large increases to large decreases. As discussed later in the report, we use fairly conservative estimates on most of these impacts and their combined effects, but acknowledge the uncertainty.
Figure 2. Potential changes in energy consumption due to vehicle automation Source: Wadud, MacKenzie, & Leiby, 2016
Shared MobilityShared mobility has grown substantially around the world in the past five years with the introduction and growth of many new business models. The following definition is illustrative:
Shared mobility – the shared use of a vehicle, bicycle, or other mode – is an innovative transportation strategy that enables users to gain short-term access to transportation modes on an ‘as-needed’ basis. The term shared mobility includes various forms of carsharing, bikesharing, ridesharing (carpooling and vanpooling), and on-demand ride services. It can also include alternative transit services, such as paratransit, shuttles, and private transit services, called microtransit, which can supplement fixed-route bus and rail services. With many new options for mobility emerging, so have the smartphone ‘apps’ that aggregate these options and optimize routes for travelers (Shaheen, Chan, Bansal, & Cohen, 2015).
The terms ride hailing and ride sharing have become somewhat equated in common usage but should be kept differentiated, since a hailed ride is not necessarily a shared ride.
12 Three Revolutions in Global Transportation
Ride Sharing Versus Ride Hailing, and Related Terms
There has become considerable confusion around and misuse of the terms “ride sharing” and “shared mobility” in recent years. We clarify these terms here, and contrast these with “ride hailing.” We also introduce the term “trip sharing.” There are two basic concepts:
• Ride sharing (or trip sharing or shared mobility) – This refers to rides or trips that are actually shared between different individuals or different parties and paid separately. It can also more broadly include public transit services.
• Ride hailing (or ride booking) – This refers to any app-based system to secure a ride from a taxi or other
“on-demand” ride service provider such as GrabTaxi, Uber, Lyft, Ola, Easy Taxi or other TNCs. These rides may or may not be shared.
It is important to keep the two concepts separate. On-demand ride-hailing services are not ride-sharing services unless they exclusively offer shared rides (such as a micro transit bus system). We consider it misleading to use the terms “ride sharing” and “shared mobility” to refer to a ride-hailing service in a generalized manner, and while we use these terms to refer to any situation with truly shared trips, we try to avoid their use for the more general situation of ride hailing, throughout this report. We also use “trip sharing” in this report to emphasize true shared mobility, and to avoid overuse of the terms ride sharing and shared mobility.
The following section discusses the future potential of each shared mobility type and explores the ability of sharing to decrease the total number of vehicle kilometers traveled on streets by increasing the occupancy of vehicles for trips.
Ride Hailing and Ride Sharing
The rise of TNCs like Ola, GrabTaxi, Uber, and Lyft has been especially rapid since about 2012. Launched in 2009, Uber reached 1 billion trips worldwide by the end of 2015, and 2 billion within the following six months. Currently, the environmental impact of ride-hailing
services is receiving considerable attention in the United States, with a key question being whether rides tend to substitute for higher CO2 trips. At issue is whether TNCs help cut car ownership and use rates generally, or whether they compete with public transport, thereby undermining CO2 benefits (Alba, 2015). Another question is whether shared rides account for a significant share of trips.
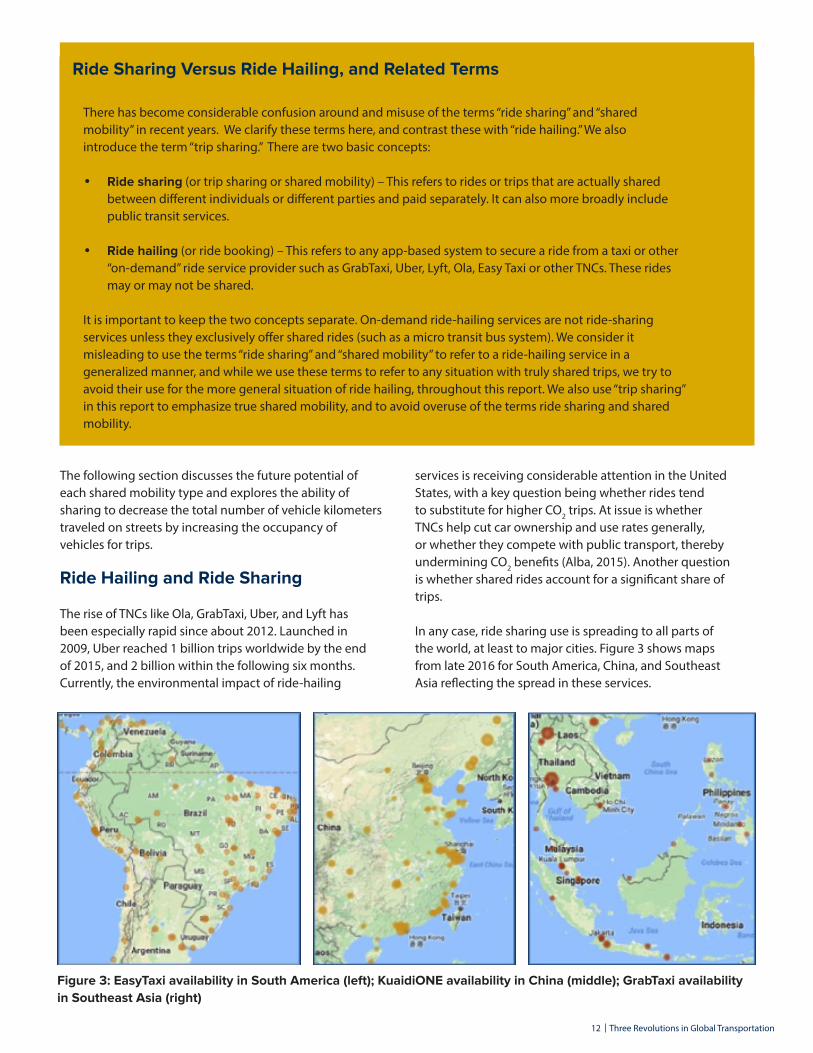
In any case, ride sharing use is spreading to all parts of the world, at least to major cities. Figure 3 shows maps from late 2016 for South America, China, and Southeast Asia reflecting the spread in these services.
Figure 3: EasyTaxi availability in South America (left); KuaidiONE availability in China (middle); GrabTaxi availability in Southeast Asia (right)
13 Three Revolutions in Global Transportation
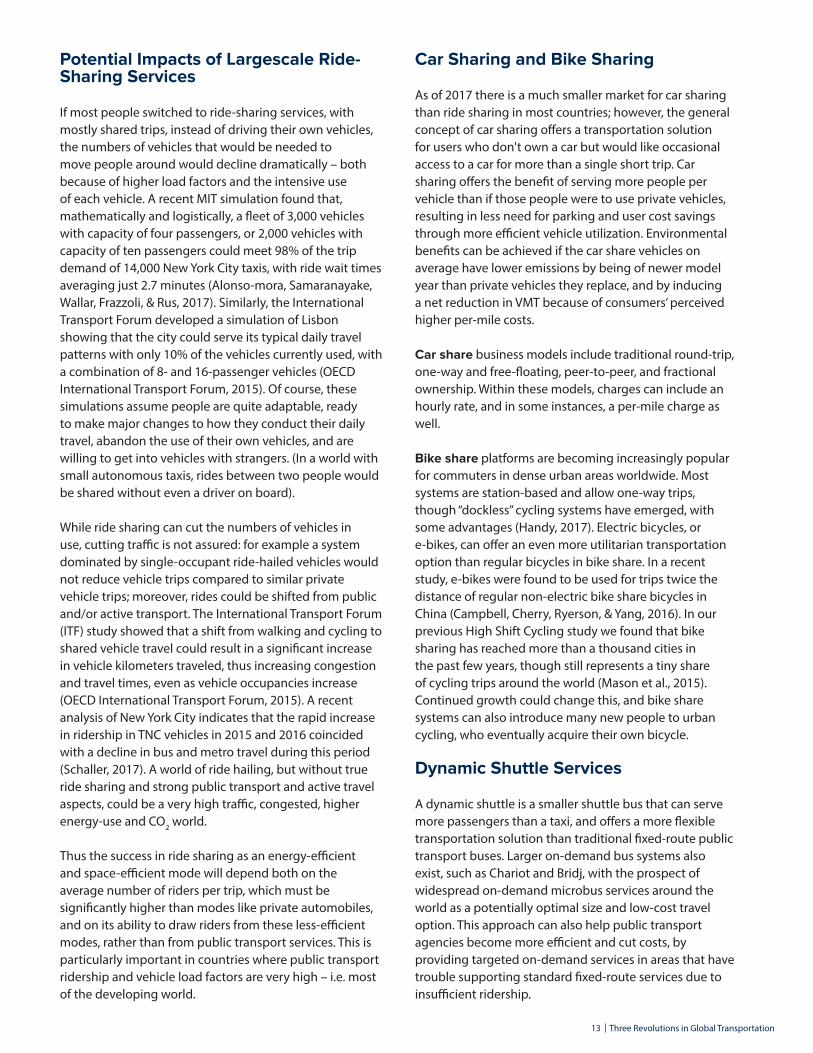
Potential Impacts of Largescale Ride-Sharing Services
If most people switched to ride-sharing services, with mostly shared trips, instead of driving their own vehicles, the numbers of vehicles that would be needed to move people around would decline dramatically – both because of higher load factors and the intensive use of each vehicle. A recent MIT simulation found that, mathematically and logistically, a fleet of 3,000 vehicles with capacity of four passengers, or 2,000 vehicles with capacity of ten passengers could meet 98% of the trip demand of 14,000 New York City taxis, with ride wait times averaging just 2.7 minutes (Alonso-mora, Samaranayake, Wallar, Frazzoli, & Rus, 2017). Similarly, the International Transport Forum developed a simulation of Lisbon showing that the city could serve its typical daily travel patterns with only 10% of the vehicles currently used, with a combination of 8- and 16-passenger vehicles (OECD International Transport Forum, 2015). Of course, these simulations assume people are quite adaptable, ready to make major changes to how they conduct their daily travel, abandon the use of their own vehicles, and are willing to get into vehicles with strangers. (In a world with small autonomous taxis, rides between two people would be shared without even a driver on board).
While ride sharing can cut the numbers of vehicles in use, cutting traffic is not assured: for example a system dominated by single-occupant ride-hailed vehicles would not reduce vehicle trips compared to similar private vehicle trips; moreover, rides could be shifted from public and/or active transport. The International Transport Forum (ITF) study showed that a shift from walking and cycling to shared vehicle travel could result in a significant increase in vehicle kilometers traveled, thus increasing congestion and travel times, even as vehicle occupancies increase (OECD International Transport Forum, 2015). A recent analysis of New York City indicates that the rapid increase in ridership in TNC vehicles in 2015 and 2016 coincided with a decline in bus and metro travel during this period (Schaller, 2017). A world of ride hailing, but without true ride sharing and strong public transport and active travel aspects, could be a very high traffic, congested, higher energy-use and CO2 world.
Thus the success in ride sharing as an energy-efficient and space-efficient mode will depend both on the average number of riders per trip, which must be significantly higher than modes like private automobiles, and on its ability to draw riders from these less-efficient modes, rather than from public transport services. This is particularly important in countries where public transport ridership and vehicle load factors are very high – i.e. most of the developing world.
Car Sharing and Bike Sharing
As of 2017 there is a much smaller market for car sharing than ride sharing in most countries; however, the general concept of car sharing offers a transportation solution for users who don't own a car but would like occasional access to a car for more than a single short trip. Car sharing offers the benefit of serving more people per vehicle than if those people were to use private vehicles, resulting in less need for parking and user cost savings through more efficient vehicle utilization. Environmental benefits can be achieved if the car share vehicles on average have lower emissions by being of newer model year than private vehicles they replace, and by inducing a net reduction in VMT because of consumers’ perceived higher per-mile costs.
Car share business models include traditional round-trip, one-way and free-floating, peer-to-peer, and fractional ownership. Within these models, charges can include an hourly rate, and in some instances, a per-mile charge as well.
Bike share platforms are becoming increasingly popular for commuters in dense urban areas worldwide. Most systems are station-based and allow one-way trips, though “dockless” cycling systems have emerged, with some advantages (Handy, 2017). Electric bicycles, or e-bikes, can offer an even more utilitarian transportation option than regular bicycles in bike share. In a recent study, e-bikes were found to be used for trips twice the distance of regular non-electric bike share bicycles in China (Campbell, Cherry, Ryerson, & Yang, 2016). In our previous High Shift Cycling study we found that bike sharing has reached more than a thousand cities in the past few years, though still represents a tiny share of cycling trips around the world (Mason et al., 2015). Continued growth could change this, and bike share systems can also introduce many new people to urban cycling, who eventually acquire their own bicycle.
Dynamic Shuttle Services
A dynamic shuttle is a smaller shuttle bus that can serve more passengers than a taxi, and offers a more flexible transportation solution than traditional fixed-route public transport buses. Larger on-demand bus systems also exist, such as Chariot and Bridj, with the prospect of widespread on-demand microbus services around the world as a potentially optimal size and low-cost travel option. This approach can also help public transport agencies become more efficient and cut costs, by providing targeted on-demand services in areas that have trouble supporting standard fixed-route services due to insufficient ridership.
14 Three Revolutions in Global Transportation
However, in the event of an increase in the use of on-demand services, it will be important that systems and governments ensure that shared mobility remains affordable for a range of people who depend on public transport, including people with disabilities, older adults, and low-income passengers who have benefited from subsidized public transit services (Polzin, 2017).
Increased use of shared mobility systems, public transport and active travel (walking and cycling) may present the greatest potential of the three revolutions to usher in an era of sustainable transportation in cities. The benefits they offer include traffic reduction, energy and emissions reductions, and lower overall systems costs (Handy, 2017). We explore this in the scenarios presentation that follows.
15 Three Revolutions in Global Transportation
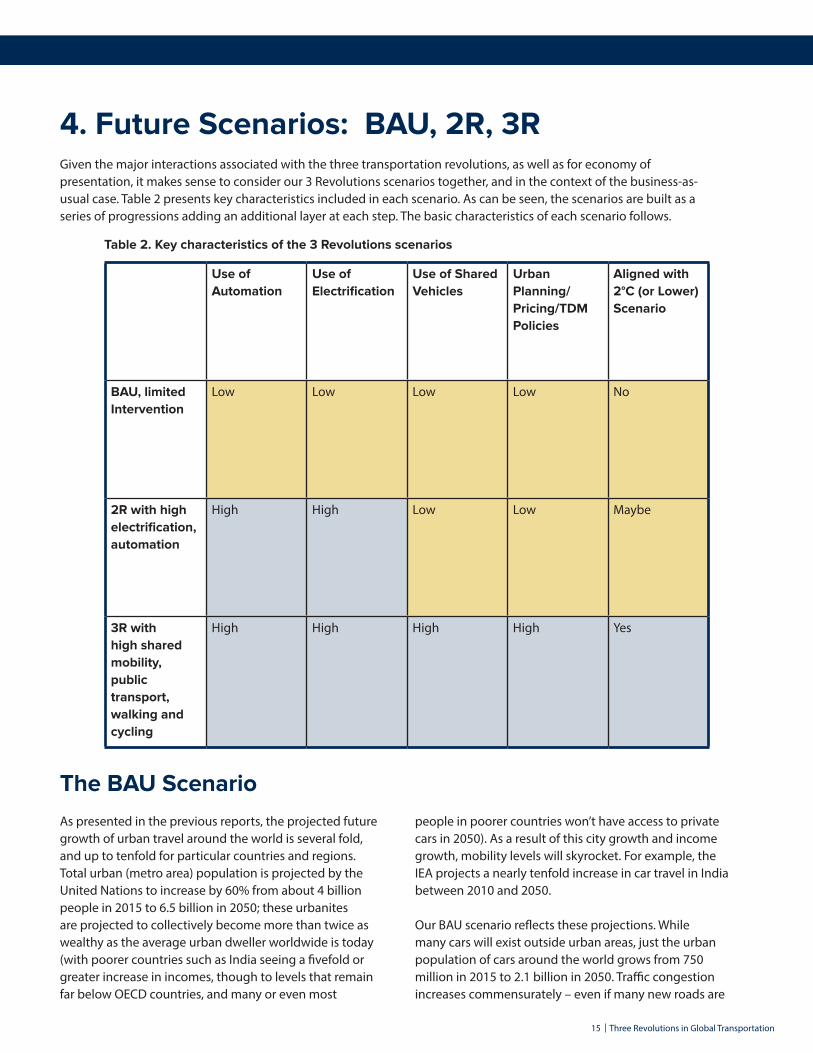
4. Future Scenarios: BAU, 2R, 3RGiven the major interactions associated with the three transportation revolutions, as well as for economy of presentation, it makes sense to consider our 3 Revolutions scenarios together, and in the context of the business-as-usual case. Table 2 presents key characteristics included in each scenario. As can be seen, the scenarios are built as a series of progressions adding an additional layer at each step. The basic characteristics of each scenario follows.
The BAU ScenarioAs presented in the previous reports, the projected future growth of urban travel around the world is several fold, and up to tenfold for particular countries and regions. Total urban (metro area) population is projected by the United Nations to increase by 60% from about 4 billion people in 2015 to 6.5 billion in 2050; these urbanites are projected to collectively become more than twice as wealthy as the average urban dweller worldwide is today (with poorer countries such as India seeing a fivefold or greater increase in incomes, though to levels that remain far below OECD countries, and many or even most
people in poorer countries won’t have access to private cars in 2050). As a result of this city growth and income growth, mobility levels will skyrocket. For example, the IEA projects a nearly tenfold increase in car travel in India between 2010 and 2050.
Our BAU scenario reflects these projections. While many cars will exist outside urban areas, just the urban population of cars around the world grows from 750 million in 2015 to 2.1 billion in 2050. Traffic congestion increases commensurately – even if many new roads are
Use of Automation
Use of Electrification
Use of Shared Vehicles
Urban Planning/Pricing/TDM Policies
Aligned with 2°C (or Lower) Scenario
BAU, limited Intervention
Low Low Low Low No
2R with high electrification, automation
High High Low Low Maybe
3R with high shared mobility, public transport, walking and cycling
High High High High Yes
Table 2. Key characteristics of the 3 Revolutions scenarios
16 Three Revolutions in Global Transportation
built to accommodate traffic increases, countries will have a very hard time keeping up. Cities around the world are already heavily congested with car traffic, sometimes with only a very small level of car ownership. Whether the BAU projection of cars and car travel can be accommodated without complete seizures of road traffic networks is itself a fair question, and thus our BAU scenario that assumes functional road systems may be unrealistic in this regard.
This future also assumes that investments into alternative transportation modes – everything from buses and rail systems, to bicycles and even an extensive system of safe sidewalks in cities – lags behind what is needed to retain current mode shares, as more people gain access to cars (as well as motorized 2-wheelers). This is a world where people fear crossing the street due to traffic, fear cycling due to lack of safe cycling infrastructure, and sometimes fear taking public transport due to personal safety concerns. This is also a world where public transport systems are not well designed and do not have adequate investment to ensure they are of high quality and high capacity. We do not see rapid growth, for example, in bus rapid transit systems, which allow buses to cut through gridlocked car traffic and move people faster than they can in private vehicles.
This future results not only in possible gridlock in the world’s cities, it likely fails to stem the trend of high injury and death rates on the world’s roads – over 1.2 million deaths in 2015 alone. And a world that continues to rely on ICE vehicles, even though these will continue to become cleaner, may have trouble achieving truly clean air in its larger cities. This is on top of our BAU projection of a 50% increase in energy use and CO2 emissions during a period where CO2 emissions must drop dramatically to achieve a 2˚C or lower temperature limit to arrest climate change.
The 2R Scenario: Electrification and AutomationThis scenario includes both a rapid increase in electric (non-autonomous) vehicles and, later, autonomous EVs. There are many important assumptions and these are laid out below.
Assumptions for EVs
• By 2020, 5 million EVs are sold annually worldwide (compared to 750,000 in 2016), with sales continuing to rise sharply thereafter. The steep part of the “S-curve” of sales for EVs occurs between 2020 and 2030 in the world’s leading nations and
regions (the United States, Europe, China and Japan). Other nations follow and by 2040 automated EVs dominate LDV sales worldwide. EVs also dominate sales of 2-wheelers and buses after 2030 worldwide.
• By 2050 few non-EVs are sold anywhere. Some EVs may well be plug-in hybrids, but even these we assume are basically phased out by 2050 as longer range EVs and fast charging become ubiquitous.
• By 2030, EVs will have an average range of 250 miles (400 kilometers) and an incremental cost of about $10,000 per vehicle. Costs could decline more than this, but our assumed increase in driving range requires larger battery packs, which we take into account in our cost estimates. These incremental costs continue to decline to near zero in 2050. EVs in 2030 save enough on energy costs to pay back within five years, even less for high-distance drivers.
• By 2050 electricity grids are substantially decarbonized worldwide. In our main 2R scenario, we assume that electricity grids are decarbonized at a steady rate, consistent with the IEA “4DS” (4˚C scenario). This means that electric AVs can achieve significant CO2 reductions, even if they drive many trillion kilometers per year. However, as we show below, in a 2˚C or lower world, grids must be nearly completely decarbonized worldwide by 2050. We consider this as a sensitivity case where EVs worldwide become truly zero-carbon vehicles by 2050.
• A critical assumption is supportive government policies. This scenario probably does not happen without strong policies to encourage uptake of EVs as they continue to mature. A range of policies are already in place in many countries (including incentives for installing charging infrastructure, access and parking advantages, and tax incentives) and these must continue as EV markets develop. In particular, it seems likely that vehicle price incentives will be needed through 2025 or 2030 given ongoing incremental first costs, though what levels will be needed over this time frame to spark and sustain an “S-curve” revolution are far from clear.
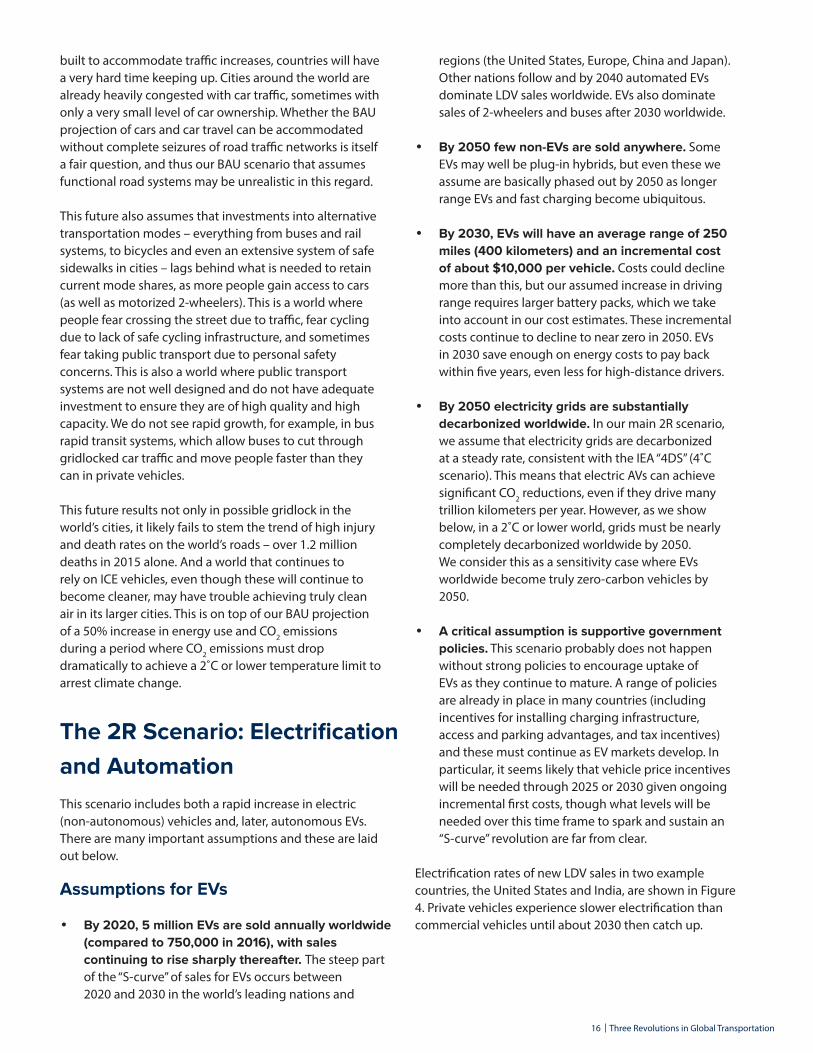
Electrification rates of new LDV sales in two example countries, the United States and India, are shown in Figure 4. Private vehicles experience slower electrification than commercial vehicles until about 2030 then catch up.
17 Three Revolutions in Global Transportation
Figure 4. EV sales shares for selected countries, vehicle type, years and scenarios
Assumptions for Automated EVs
• Commercial availability of fully driverless vehicles begins shortly after 2020. In the more advanced economies such as the United States, Europe, Japan and China, vehicle automation (and policies that allow or promote it) advance in the coming five years through various levels, such as hands-free driving, fully autonomous capability but with a driver in the seat, to fully driverless (SAE level 4: no steering wheel or pedals) by 2020 or soon after (SAE, 2016). Such vehicles enter full commercial operation with largescale production by 2025.
• The cost of driverless vehicles declines rapidly, as it has already started doing. While in small volumes these vehicles may costs tens of thousands of dollars more than conventional vehicles, we assume that by 2030, in reasonably large volumes these vehicles are about $10,000 more expensive than conventional vehicles, and down to $5,000 more by 2040, apart from possible new features such as entertainment systems in more comfortable, larger interiors. The combination of electrification and automation is estimated to cost close to $20,000 more than conventional vehicles in 2030, declining to below $10,000 more in 2040. Energy savings over the life of the vehicle offset some of the higher first costs, especially for commercial, high travel, vehicles.
• Due to policies described below, fully driverless vehicle sales in leading countries ramp up rapidly
after 2025. By 2030 sales are entering a steep “S-curve” phase, where most commercial enterprises go driverless, and where most households in leading countries choose to buy a driverless car by 2035. Other countries follow by five or at most 10 years, with a high level of driverless vehicle sales in all countries by 2045.
• AV sales start with commercial operations, but households follow soon after. It appears likely that the strongest business cases for adopting driverless vehicles will be commercial operators who otherwise pay their drivers, so it can be expected that these (including TNCs and some public transport operations) will be early adopters. However, it also seems likely that “pioneer” households will adopt these vehicles as soon as possible. Thus we have them follow soon after, and as part of the 2R scenario, these households use their own AVs into the future rather than significantly increase use of shared mobility systems.
18 Three Revolutions in Global Transportation
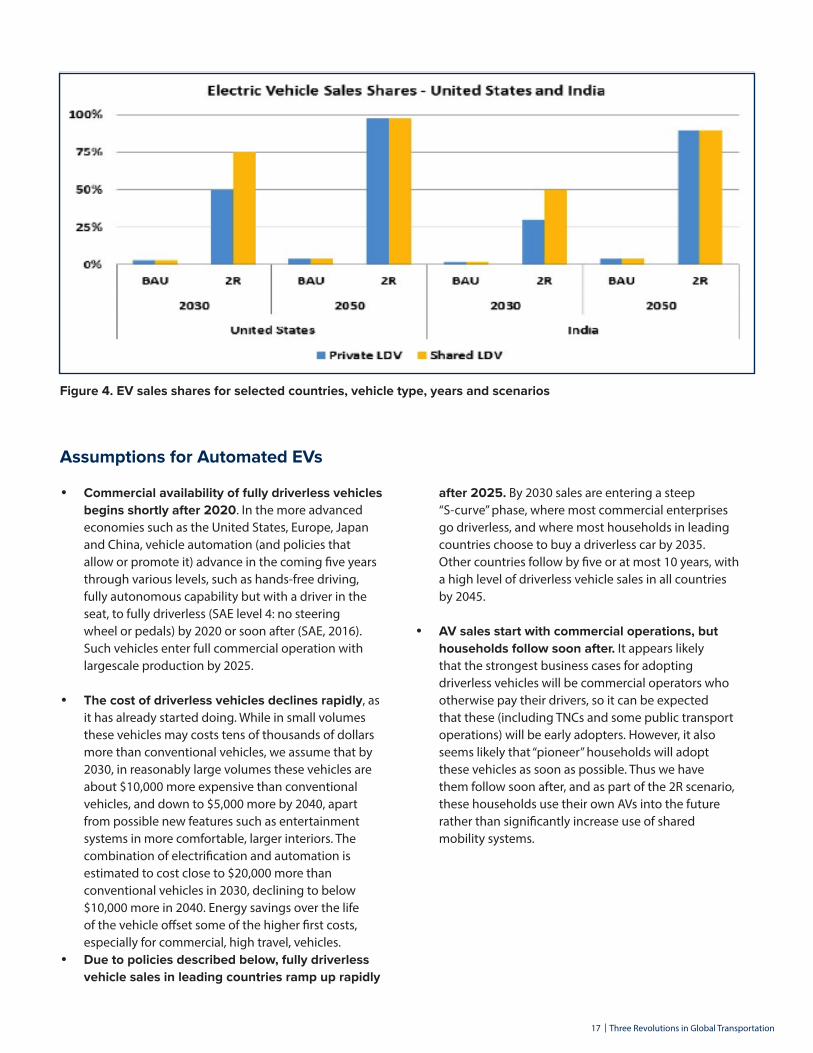
As shown in Figure 5, AV sales are assumed to increase rapidly after 2025 in the 2R scenario and reach up to 25% market share in 2030 in leading countries. Commercial vehicle fleets are assumed to be rapid adopters and reach higher shares by 2030, but since there are many more private vehicles in the 2R scenario, the total numbers of AVs in households eventually far surpasses those in commercial fleets. In trailing countries such as India the process happens more slowly, but sales of AVs to commercial operations still approach 20% by 2030, with households and fleets reaching 50% or more by 2050.
Figure 5. AV sales shares for selected countries, vehicle types, years, and scenarios
• Household-owned driverless cars will be larger and more comfortable. AVs may be designed to be much more comfortable and to better support non-driving activities, with amenities such as “mobile offices” or with home theatre video systems. We assume a significant increase in SUV-sized vehicles (or even larger vehicles such as vans but with similar weight and fuel economy as today’s larger SUVs), offsetting some of the energy savings of electrification. And with the increased comfort and elimination of driving, the time cost of driving in AVs will be significantly lower, since people won’t mind being in their vehicles for longer periods of time when they do not have to drive them, and can conduct other activities.
• Given the reduction in time cost, people will drive in their vehicles significantly more than they do today. In all regions of the world, we assume a 10-15% increase in driving per capita (and per vehicle) in personal AVs relative to BAU. This could also include increases in zero-occupant vehicle travel, as people assign vehicles to conduct tasks such as retrieving family members or even packages. We assume another 5% increase in vehicle travel from this in our scenarios, resulting in an overall 15-20% increase in vehicle travel, though we acknowledge the effect could be more significant. (As described for 3R below,
in contrast to privately owned vehicles, we assume only a small travel increase for publicly shared AVs since their use will be paid per kilometer of travel.)
• The rapid rise in the use of driverless cars in households precludes a rapid growth in shared mobility. People are content to continue to travel in their own vehicles, which are now more comfortable and can be sent on errands without occupants. This reinforces the ownership model that is already attractive and leads to high car ownership rates worldwide by 2050, similar to the BAU. Ride hailing serves a niche activity in cities as it does today.
• During the transitional (roughly 2025 to 2050) time frame there remain many legacy vehicles that require drivers. We estimate that even with a 10- to 15-year transition in sales in the leading countries, there would remain significant non-AVs on roads in 2040 and still some remaining by 2050. The mixture of the two types of vehicles will create its own issues and perhaps hamper some of the efficiency and congestion reduction benefits of the driverless cars. We do not attempt a detailed analysis of this issue but flag it for further study.
19 Three Revolutions in Global Transportation
The 3R Scenario: Adding Shared MobilityThe third scenario overlays shared mobility and strong policies for urban planning that favor compact cities, walking, cycling, and public transport. In the 2R scenario, solo car travel becomes more convenient and cheaper per mile. Public transport systems also get cheaper, with drivers eventually eliminated, but still have a difficult time competing with private cars and 2-wheelers. In the 3R scenario, we assume the opposite is true: sharing rides (in the form of on-demand ride hailing services as well as public transport) becomes extremely popular. Some of this may occur just from a cultural change in countries around the world, though as we describe in the policy section below, we don’t expect this type of scenario to occur without strong policies to give shared mobility, especially high occupancy public transport, cycling, and walking, a distinct advantage over private, single-occupant travel.
Assumptions for the 3R Scenario
• By 2020 shared mobility represents a significant share of urban travel in most major cities of the world. Thus shared mobility gains substantial traction before automation even begins. This includes a range of ride-hailing services and vehicle types, with more right-sized vehicles for different types of trips. Average load factors (people per trip) rise significantly in countries (such as the United States) where it is currently below two, and stays high in countries (such as India) where it is already high. In 2015, most of the world experienced well over two people per ride in LDVs. This is preserved and even increased in the 3R scenario.
• Car sharing also grows, but since automation begins to increase rapidly after 2020, we assume that by 2030 car sharing is indistinct from ride sharing – in both cases an empty vehicle is hailed on the street or summoned from a parking place to provide mobility services. We also assume that taxis become indistinct from TNCs – all ride-sharing services use apps and encourage sharing via pricing systems.
• One result of this revolution in on-demand mobility is a steady decline in privately owned vehicles. After 2020 sales and use of commercial TNC vehicles rises rapidly and by 2025 there is a resulting decline in purchases of household vehicles, although legacy stocks of household cars remain for over two decades and could create a glut of unneeded private vehicles. We assume these cars are driven less and less over time.
• Another feature of the 3R scenario is a revolution in types and roles of public transport, along with a steady increase in its use around the world. After 2020, public transport services become more tailored to a shared vehicle world. Major travel corridors continue to be served by efficient bus systems such as bus rapid transit, and major cities continue to build rail systems for the busiest travel routes. Smaller buses, with 8-16 seats, grow in number, as these are almost capable of providing point-to-point services and can be summoned – at least to locations nearby specific residences if not to the door. Even with a driver, on-demand small bus and van services provide a very low-cost, convenient travel option for many types of intermediate trips in dense areas. As vehicles become automated, the cost of small-bus travel drops further to become the cheapest per-passenger-kilometer on-demand travel option in the world.
• The result of all these changes in 3R is an “ecosystem” of public transport and ride hailing services that are harmonious and complementary. Small vehicle ride hailing does not displace trips from larger public transport services, except where currently large vehicle public transport is poorly utilized and inappropriate given corridor demand. One result of this ecosystem is significantly higher load factors (average passengers per trip) in all vehicular modes.
• This scenario also features a range of policy and planning initiatives to make cities much more cycling and pedestrian friendly. Sidewalks and bike lanes are added to create continuous networks and ensure maximum safety for these travelers. A general effort to develop more compact cities with shorter trip requirements is also assumed, with trip lengths dropping by 10-15% compared to the BAU scenario, rather than increasing as they do in the 2R scenario. These efforts are crucial to preventing new vehicular travel options from displacing large numbers of walking and cycling trips by lower costs and inducing more dispersed development patterns which increase travel distances and make cycling and walking infeasible.
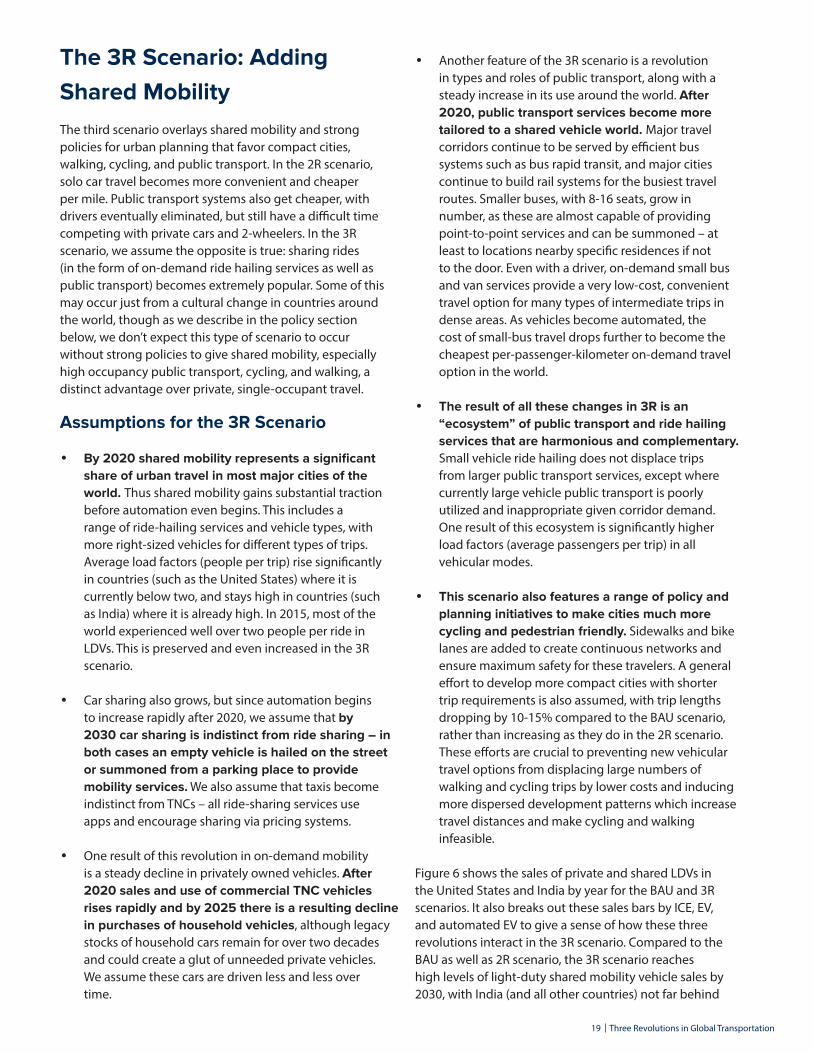
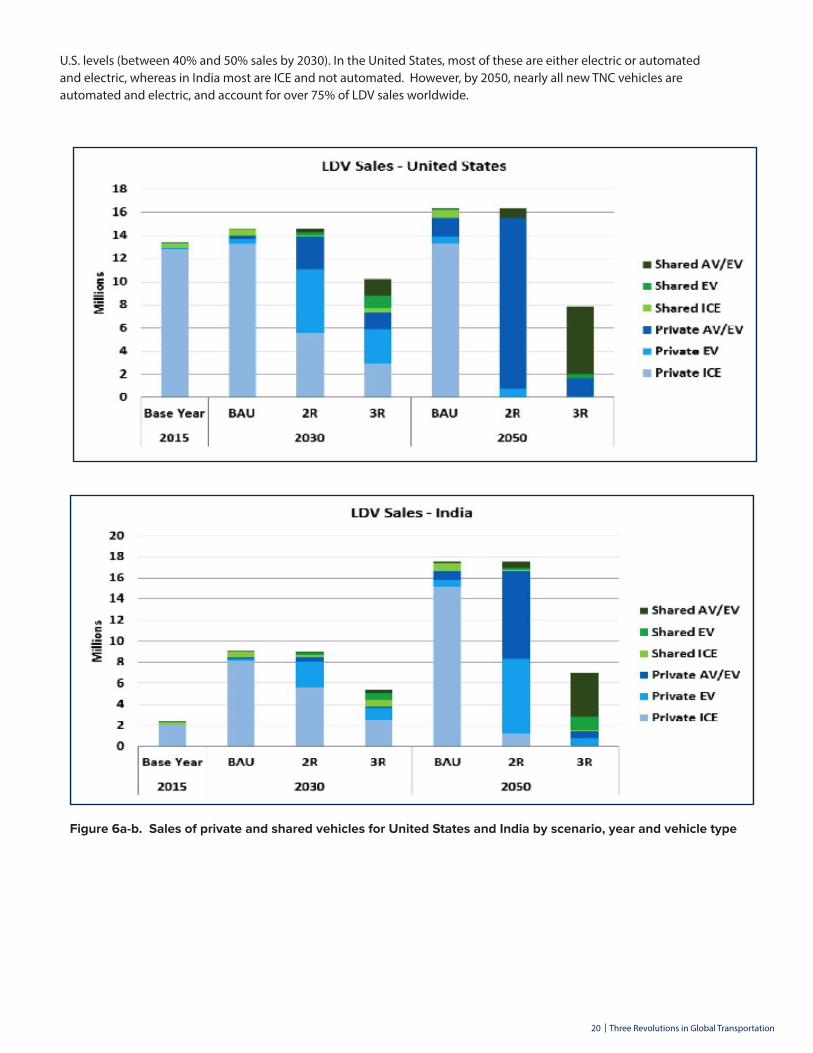
Figure 6 shows the sales of private and shared LDVs in the United States and India by year for the BAU and 3R scenarios. It also breaks out these sales bars by ICE, EV, and automated EV to give a sense of how these three revolutions interact in the 3R scenario. Compared to the BAU as well as 2R scenario, the 3R scenario reaches high levels of light-duty shared mobility vehicle sales by 2030, with India (and all other countries) not far behind
20 Three Revolutions in Global Transportation
U.S. levels (between 40% and 50% sales by 2030). In the United States, most of these are either electric or automated and electric, whereas in India most are ICE and not automated. However, by 2050, nearly all new TNC vehicles are automated and electric, and account for over 75% of LDV sales worldwide.
Figure 6a-b. Sales of private and shared vehicles for United States and India by scenario, year and vehicle type
21 Three Revolutions in Global Transportation
True Shared Mobility?
One major question across these types of shared mobility, in particular for ride sharing, is whether many of these trips are truly shared – i.e. by separate travelers – making these services really different from classic taxi services. The extent to which rides are shared in services in different parts of the world is not well documented. A typical car trip in the United States has fewer than 1.3 people, while in a country like India it might have well over two.
Many TNCs offer incentives for ride sharing, passing through the savings inherent in adding people to the ride. Lyft has reported that up to 50% of their riders have opted for their lower-cost carpool Lyft Line platform in cities where that option is available. If this type of sharing occurred at much higher volumes in the future and was not the result of fewer people walking, cycling, or taking public transport, the impacts on travel would be profound. Far fewer vehicles would be needed to move a given number of travelers.
But it is not clear this will occur, at least without policy support to encourage it. For example, one dynamic between shared mobility and automation is that driverless ride-hailing services may become so inexpensive that the incentive to share rides to save cost will be substantially reduced. Even if most vehicle trips are shared, if a significant portion of those trips were formerly made by walking, cycling, or public transport, the amount of vehicle travel could increase significantly, increasing congestion and reducing the ability of many people to access opportunities.
In designing our 3R scenario, we assume that a range of policies are implemented that promote true ride sharing and result in 30-40% more passengers per vehicle in 2050 than in the other scenarios. (In the United States, for example, this would represent an increase from 1.3 to 1.8 passengers per car trip.)
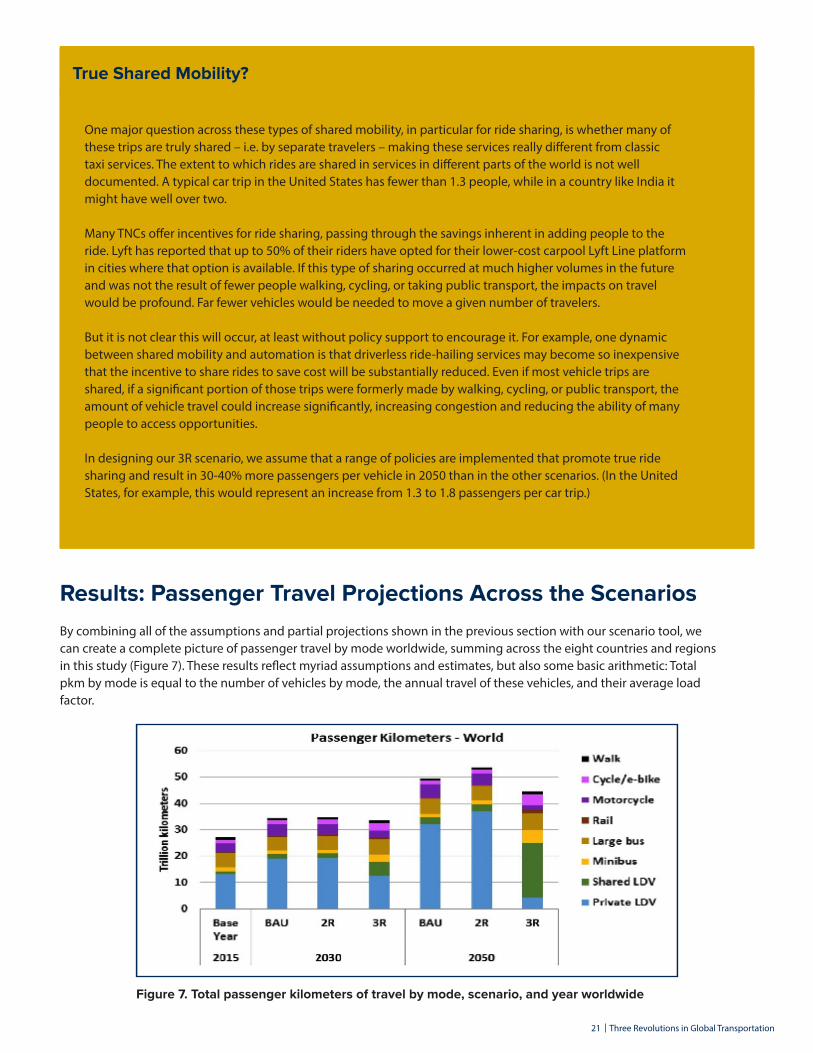
Results: Passenger Travel Projections Across the Scenarios By combining all of the assumptions and partial projections shown in the previous section with our scenario tool, we can create a complete picture of passenger travel by mode worldwide, summing across the eight countries and regions in this study (Figure 7). These results reflect myriad assumptions and estimates, but also some basic arithmetic: Total pkm by mode is equal to the number of vehicles by mode, the annual travel of these vehicles, and their average load factor.
Figure 7. Total passenger kilometers of travel by mode, scenario, and year worldwide
22 Three Revolutions in Global Transportation
On closer examination, a number of notable results are shown in Figure 7. In 2030, across all eight regions studied, there are still relatively few AVs plying the world’s roads. This reflects the fact that only leading countries are deeply into selling these vehicles in that year, and the vehicles still represent a small share of stocks even in these countries. However, by 2050 in the 2R scenario, well more than half of private vehicles are driverless. This has the effect of increasing driving rates significantly in 2R compared to both the BAU and 3R scenarios. Assuming the time cost of travel is halved, along with the possibility of zero-occupant trips, we assume a 15-20% increase in driving per automated car vs. non-automated car, around the world.
In the 3R scenario, significant shared travel does occur by 2030, along with increased travel by minibus and other forms of public transport, cycling and walking (in
comparison to both the 2R and BAU scenarios). This is the numerical manifestation of the ecosystem of harmonious and complementary travel modes mentioned above. By 2050 the vast majority of urban LDV travel takes place in on-demand shared mobility services, with private vehicle travel declining steadily over the two-decade period as private cars eventually are scrapped and not replaced.
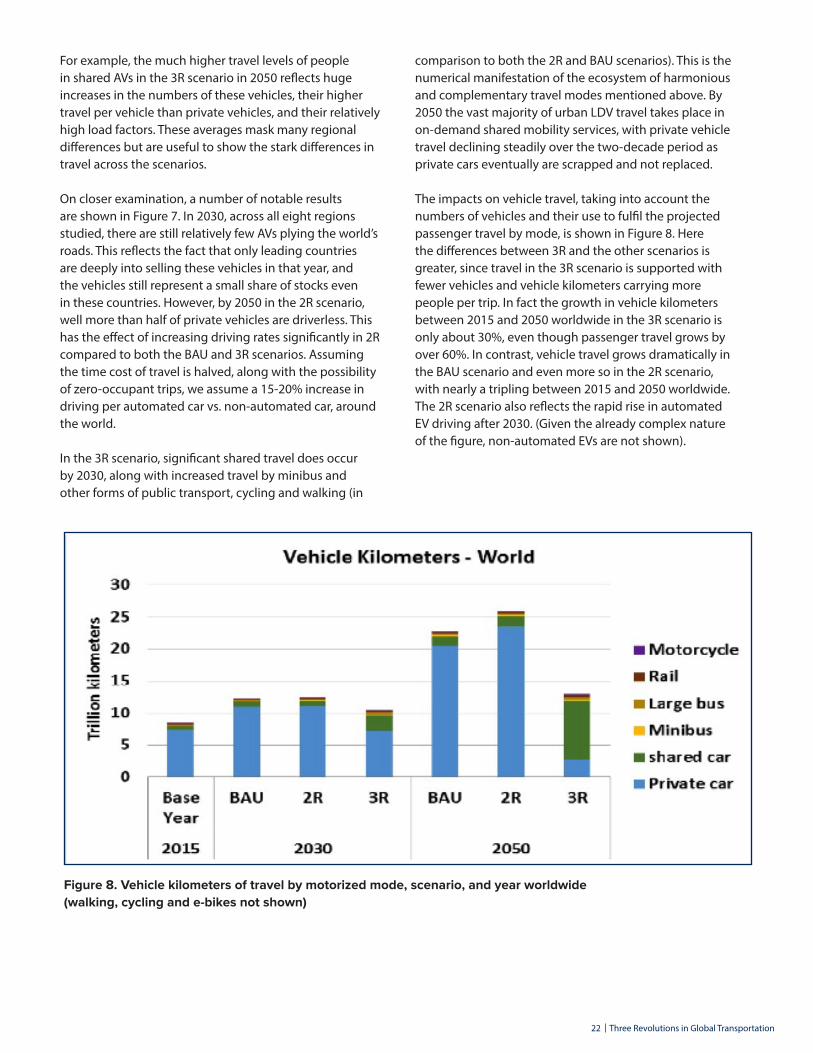
The impacts on vehicle travel, taking into account the numbers of vehicles and their use to fulfil the projected passenger travel by mode, is shown in Figure 8. Here the differences between 3R and the other scenarios is greater, since travel in the 3R scenario is supported with fewer vehicles and vehicle kilometers carrying more people per trip. In fact the growth in vehicle kilometers between 2015 and 2050 worldwide in the 3R scenario is only about 30%, even though passenger travel grows by over 60%. In contrast, vehicle travel grows dramatically in the BAU scenario and even more so in the 2R scenario, with nearly a tripling between 2015 and 2050 worldwide. The 2R scenario also reflects the rapid rise in automated EV driving after 2030. (Given the already complex nature of the figure, non-automated EVs are not shown).
Figure 8. Vehicle kilometers of travel by motorized mode, scenario, and year worldwide (walking, cycling and e-bikes not shown)
For example, the much higher travel levels of people in shared AVs in the 3R scenario in 2050 reflects huge increases in the numbers of these vehicles, their higher travel per vehicle than private vehicles, and their relatively high load factors. These averages mask many regional differences but are useful to show the stark differences in travel across the scenarios.
23 Three Revolutions in Global Transportation
Considering Rapid Transitions
The scenarios in this report depict very rapid transitions to a different future. How do such rapid transitions occur? Clearly the new technologies and travel services must be compelling for consumers. The “tipping point” concept is important here – trends start slowly, technologies improve, more people learn about them, and at some point sales expand beyond pioneers and early adopters to mass market. We depict about a 10-year period when the market share of AVs moves from about 10-90%. This certainly reflects a rapid increase in mass awareness of and desire to own such vehicles. Is this likely? Perhaps not, but if these vehicles offer enough advantages at an acceptable price, this scenario seems quite possible.
Another question is whether the suite of electrification and automation technologies can evolve this quickly and costs can come down by, let’s say 2025, to support this revolution. It also depends on enabling policies. Finally, it will depend on the ability of vehicle manufacturers to shift plants and equipment, an investment challenge on the order of trillions of dollars. The faster this must happen, the more expensive it could be – from the point of view of both retiring useful equipment and raising capital.
Vehicle Sales and Stocks
As shown for electrification, automation and shared mobility in a previous section, the sales increases and changes in mode shares assumed in these scenarios are rapid and can have fairly profound effects on vehicle stocks. In fact, personal and business decisions around vehicle holdings are what determine sales in the first place. Using an annual stock adjustment model and typical scrappage rates for LDVs, we estimated the impacts on stocks from the LDV sales trends in our scenarios. In Figure 9 we show the sales and stock effects for the 2R and 3R scenarios in the United States, as an example.
Figure 9a-d. LDV sales and stock evolution in the 2R and 3R scenarios, U.S. example
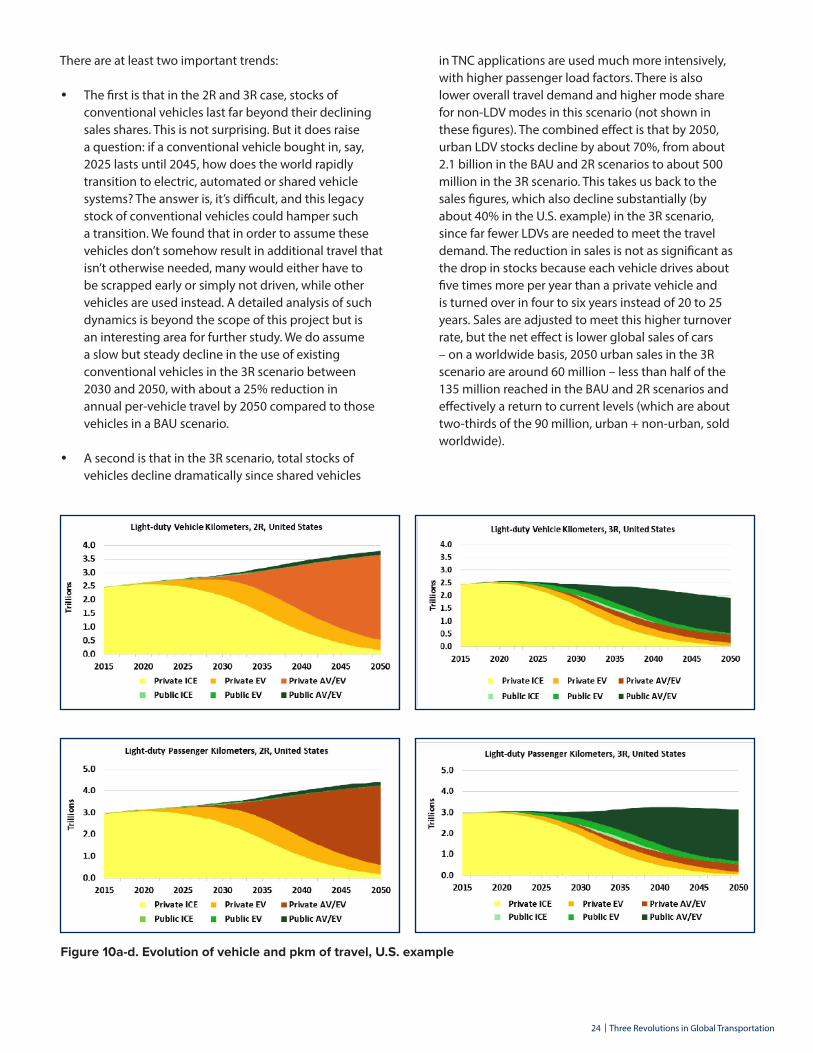
24 Three Revolutions in Global Transportation
There are at least two important trends:
• The first is that in the 2R and 3R case, stocks of conventional vehicles last far beyond their declining sales shares. This is not surprising. But it does raise a question: if a conventional vehicle bought in, say, 2025 lasts until 2045, how does the world rapidly transition to electric, automated or shared vehicle systems? The answer is, it’s difficult, and this legacy stock of conventional vehicles could hamper such a transition. We found that in order to assume these vehicles don’t somehow result in additional travel that isn’t otherwise needed, many would either have to be scrapped early or simply not driven, while other vehicles are used instead. A detailed analysis of such dynamics is beyond the scope of this project but is an interesting area for further study. We do assume a slow but steady decline in the use of existing conventional vehicles in the 3R scenario between 2030 and 2050, with about a 25% reduction in annual per-vehicle travel by 2050 compared to those vehicles in a BAU scenario.
• A second is that in the 3R scenario, total stocks of vehicles decline dramatically since shared vehicles
in TNC applications are used much more intensively, with higher passenger load factors. There is also lower overall travel demand and higher mode share for non-LDV modes in this scenario (not shown in these figures). The combined effect is that by 2050, urban LDV stocks decline by about 70%, from about 2.1 billion in the BAU and 2R scenarios to about 500 million in the 3R scenario. This takes us back to the sales figures, which also decline substantially (by about 40% in the U.S. example) in the 3R scenario, since far fewer LDVs are needed to meet the travel demand. The reduction in sales is not as significant as the drop in stocks because each vehicle drives about five times more per year than a private vehicle and is turned over in four to six years instead of 20 to 25 years. Sales are adjusted to meet this higher turnover rate, but the net effect is lower global sales of cars – on a worldwide basis, 2050 urban sales in the 3R scenario are around 60 million – less than half of the 135 million reached in the BAU and 2R scenarios and effectively a return to current levels (which are about two-thirds of the 90 million, urban + non-urban, sold worldwide).
Figure 10a-d. Evolution of vehicle and pkm of travel, U.S. example
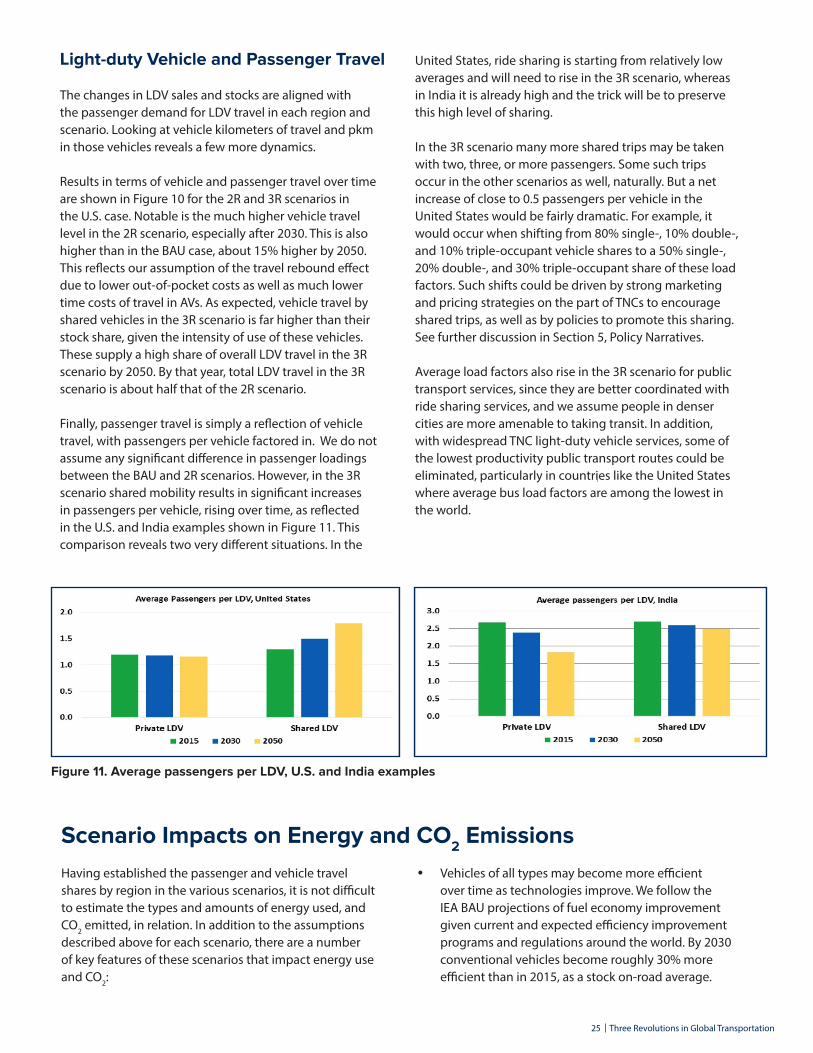
25 Three Revolutions in Global Transportation
Light-duty Vehicle and Passenger Travel
The changes in LDV sales and stocks are aligned with the passenger demand for LDV travel in each region and scenario. Looking at vehicle kilometers of travel and pkm in those vehicles reveals a few more dynamics.
Results in terms of vehicle and passenger travel over time are shown in Figure 10 for the 2R and 3R scenarios in the U.S. case. Notable is the much higher vehicle travel level in the 2R scenario, especially after 2030. This is also higher than in the BAU case, about 15% higher by 2050. This reflects our assumption of the travel rebound effect due to lower out-of-pocket costs as well as much lower time costs of travel in AVs. As expected, vehicle travel by shared vehicles in the 3R scenario is far higher than their stock share, given the intensity of use of these vehicles. These supply a high share of overall LDV travel in the 3R scenario by 2050. By that year, total LDV travel in the 3R scenario is about half that of the 2R scenario.
Finally, passenger travel is simply a reflection of vehicle travel, with passengers per vehicle factored in. We do not assume any significant difference in passenger loadings between the BAU and 2R scenarios. However, in the 3R scenario shared mobility results in significant increases in passengers per vehicle, rising over time, as reflected in the U.S. and India examples shown in Figure 11. This comparison reveals two very different situations. In the
United States, ride sharing is starting from relatively low averages and will need to rise in the 3R scenario, whereas in India it is already high and the trick will be to preserve this high level of sharing.
In the 3R scenario many more shared trips may be taken with two, three, or more passengers. Some such trips occur in the other scenarios as well, naturally. But a net increase of close to 0.5 passengers per vehicle in the United States would be fairly dramatic. For example, it would occur when shifting from 80% single-, 10% double-, and 10% triple-occupant vehicle shares to a 50% single-, 20% double-, and 30% triple-occupant share of these load factors. Such shifts could be driven by strong marketing and pricing strategies on the part of TNCs to encourage shared trips, as well as by policies to promote this sharing. See further discussion in Section 5, Policy Narratives.
Average load factors also rise in the 3R scenario for public transport services, since they are better coordinated with ride sharing services, and we assume people in denser cities are more amenable to taking transit. In addition, with widespread TNC light-duty vehicle services, some of the lowest productivity public transport routes could be eliminated, particularly in countries like the United States where average bus load factors are among the lowest in the world.
Figure 11. Average passengers per LDV, U.S. and India examples
Scenario Impacts on Energy and CO2 EmissionsHaving established the passenger and vehicle travel shares by region in the various scenarios, it is not difficult to estimate the types and amounts of energy used, and CO2 emitted, in relation. In addition to the assumptions described above for each scenario, there are a number of key features of these scenarios that impact energy use and CO2:
• Vehicles of all types may become more efficient over time as technologies improve. We follow the IEA BAU projections of fuel economy improvement given current and expected efficiency improvement programs and regulations around the world. By 2030 conventional vehicles become roughly 30% more efficient than in 2015, as a stock on-road average.
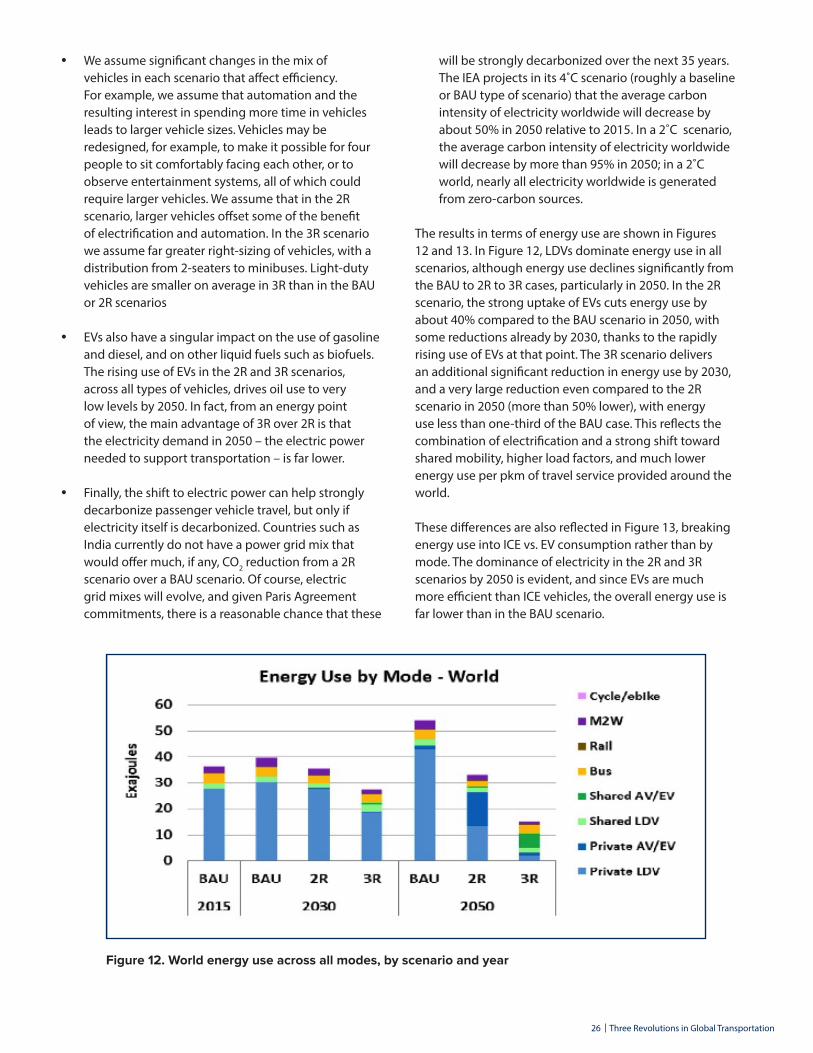
26 Three Revolutions in Global Transportation
• We assume significant changes in the mix of vehicles in each scenario that affect efficiency. For example, we assume that automation and the resulting interest in spending more time in vehicles leads to larger vehicle sizes. Vehicles may be redesigned, for example, to make it possible for four people to sit comfortably facing each other, or to observe entertainment systems, all of which could require larger vehicles. We assume that in the 2R scenario, larger vehicles offset some of the benefit of electrification and automation. In the 3R scenario we assume far greater right-sizing of vehicles, with a distribution from 2-seaters to minibuses. Light-duty vehicles are smaller on average in 3R than in the BAU or 2R scenarios
• EVs also have a singular impact on the use of gasoline and diesel, and on other liquid fuels such as biofuels. The rising use of EVs in the 2R and 3R scenarios, across all types of vehicles, drives oil use to very low levels by 2050. In fact, from an energy point of view, the main advantage of 3R over 2R is that the electricity demand in 2050 – the electric power needed to support transportation – is far lower.
• Finally, the shift to electric power can help strongly decarbonize passenger vehicle travel, but only if electricity itself is decarbonized. Countries such as India currently do not have a power grid mix that would offer much, if any, CO2 reduction from a 2R scenario over a BAU scenario. Of course, electric grid mixes will evolve, and given Paris Agreement commitments, there is a reasonable chance that these
will be strongly decarbonized over the next 35 years. The IEA projects in its 4˚C scenario (roughly a baseline or BAU type of scenario) that the average carbon intensity of electricity worldwide will decrease by about 50% in 2050 relative to 2015. In a 2˚C scenario, the average carbon intensity of electricity worldwide will decrease by more than 95% in 2050; in a 2˚C world, nearly all electricity worldwide is generated from zero-carbon sources.
The results in terms of energy use are shown in Figures 12 and 13. In Figure 12, LDVs dominate energy use in all scenarios, although energy use declines significantly from the BAU to 2R to 3R cases, particularly in 2050. In the 2R scenario, the strong uptake of EVs cuts energy use by about 40% compared to the BAU scenario in 2050, with some reductions already by 2030, thanks to the rapidly rising use of EVs at that point. The 3R scenario delivers an additional significant reduction in energy use by 2030, and a very large reduction even compared to the 2R scenario in 2050 (more than 50% lower), with energy use less than one-third of the BAU case. This reflects the combination of electrification and a strong shift toward shared mobility, higher load factors, and much lower energy use per pkm of travel service provided around the world.
These differences are also reflected in Figure 13, breaking energy use into ICE vs. EV consumption rather than by mode. The dominance of electricity in the 2R and 3R scenarios by 2050 is evident, and since EVs are much more efficient than ICE vehicles, the overall energy use is far lower than in the BAU scenario.
Figure 12. World energy use across all modes, by scenario and year
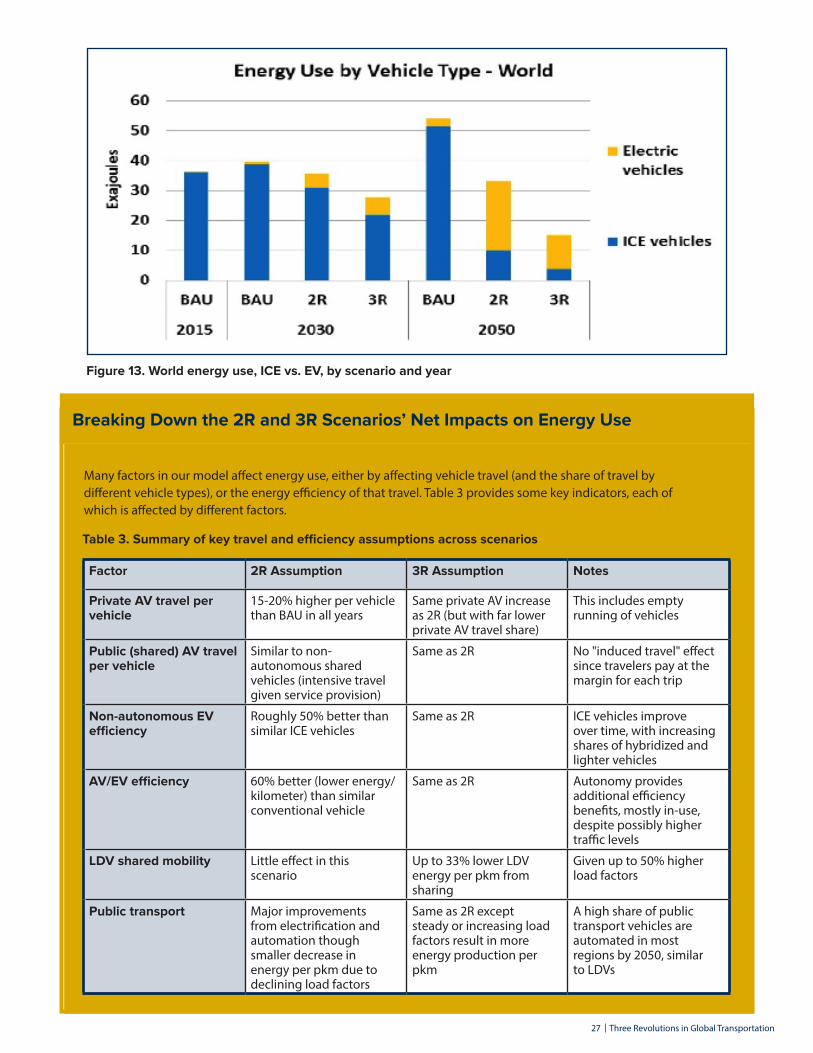
27 Three Revolutions in Global Transportation
Breaking Down the 2R and 3R Scenarios’ Net Impacts on Energy Use
Many factors in our model affect energy use, either by affecting vehicle travel (and the share of travel by different vehicle types), or the energy efficiency of that travel. Table 3 provides some key indicators, each of which is affected by different factors.
Factor 2R Assumption 3R Assumption Notes
Private AV travel per vehicle
15-20% higher per vehicle than BAU in all years
Same private AV increase as 2R (but with far lower private AV travel share)
This includes empty running of vehicles
Public (shared) AV travel per vehicle
Similar to non-autonomous shared vehicles (intensive travel given service provision)
Same as 2R No "induced travel" effect since travelers pay at the margin for each trip
Non-autonomous EV efficiency
Roughly 50% better than similar ICE vehicles
Same as 2R ICE vehicles improve over time, with increasing shares of hybridized and lighter vehicles
AV/EV efficiency 60% better (lower energy/kilometer) than similar conventional vehicle
Same as 2R Autonomy provides additional efficiency benefits, mostly in-use, despite possibly higher traffic levels
LDV shared mobility Little effect in this scenario
Up to 33% lower LDV energy per pkm from sharing
Given up to 50% higher load factors
Public transport Major improvements from electrification and automation though smaller decrease in energy per pkm due to declining load factors
Same as 2R except steady or increasing load factors result in more energy production per pkm
A high share of public transport vehicles are automated in most regions by 2050, similar to LDVs
Table 3. Summary of key travel and efficiency assumptions across scenarios
Figure 13. World energy use, ICE vs. EV, by scenario and year
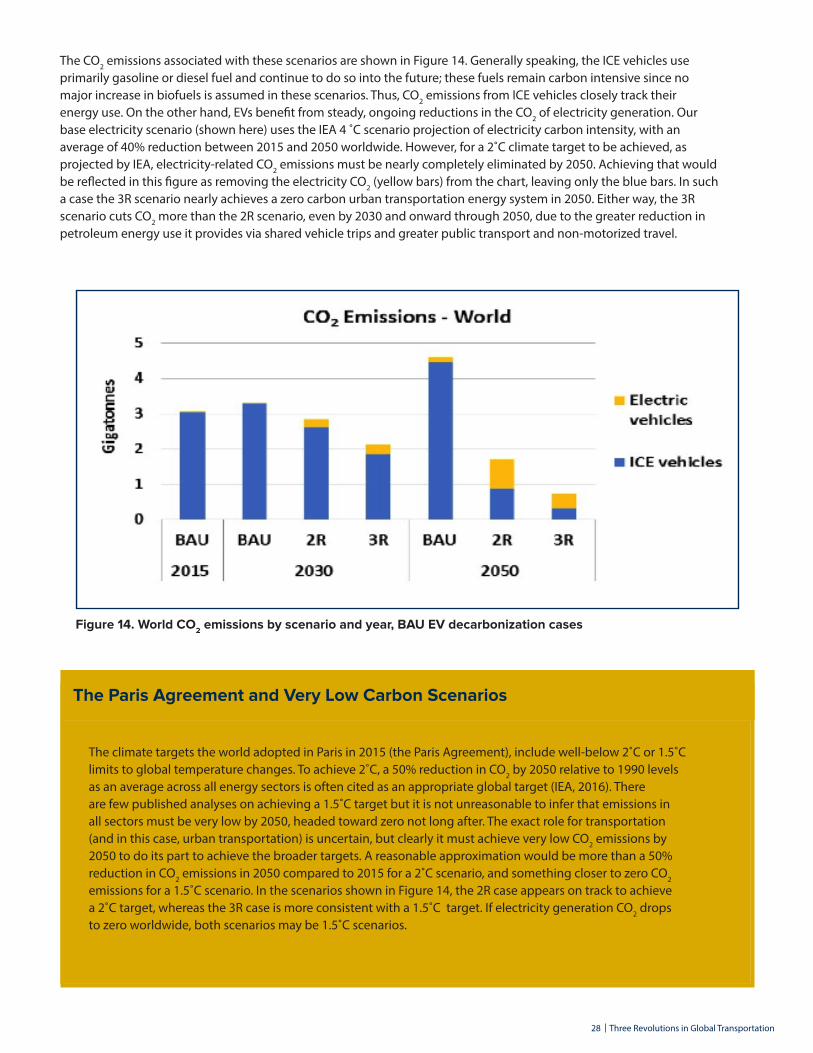
28 Three Revolutions in Global Transportation
The CO2 emissions associated with these scenarios are shown in Figure 14. Generally speaking, the ICE vehicles use primarily gasoline or diesel fuel and continue to do so into the future; these fuels remain carbon intensive since no major increase in biofuels is assumed in these scenarios. Thus, CO2 emissions from ICE vehicles closely track their energy use. On the other hand, EVs benefit from steady, ongoing reductions in the CO2 of electricity generation. Our base electricity scenario (shown here) uses the IEA 4 ˚C scenario projection of electricity carbon intensity, with an average of 40% reduction between 2015 and 2050 worldwide. However, for a 2˚C climate target to be achieved, as projected by IEA, electricity-related CO2 emissions must be nearly completely eliminated by 2050. Achieving that would be reflected in this figure as removing the electricity CO2 (yellow bars) from the chart, leaving only the blue bars. In such a case the 3R scenario nearly achieves a zero carbon urban transportation energy system in 2050. Either way, the 3R scenario cuts CO2 more than the 2R scenario, even by 2030 and onward through 2050, due to the greater reduction in petroleum energy use it provides via shared vehicle trips and greater public transport and non-motorized travel.
The Paris Agreement and Very Low Carbon Scenarios
The climate targets the world adopted in Paris in 2015 (the Paris Agreement), include well-below 2˚C or 1.5˚C limits to global temperature changes. To achieve 2˚C, a 50% reduction in CO2 by 2050 relative to 1990 levels as an average across all energy sectors is often cited as an appropriate global target (IEA, 2016). There are few published analyses on achieving a 1.5˚C target but it is not unreasonable to infer that emissions in all sectors must be very low by 2050, headed toward zero not long after. The exact role for transportation (and in this case, urban transportation) is uncertain, but clearly it must achieve very low CO2 emissions by 2050 to do its part to achieve the broader targets. A reasonable approximation would be more than a 50% reduction in CO2 emissions in 2050 compared to 2015 for a 2˚C scenario, and something closer to zero CO2 emissions for a 1.5˚C scenario. In the scenarios shown in Figure 14, the 2R case appears on track to achieve a 2˚C target, whereas the 3R case is more consistent with a 1.5˚C target. If electricity generation CO2 drops to zero worldwide, both scenarios may be 1.5˚C scenarios.
Figure 14. World CO2 emissions by scenario and year, BAU EV decarbonization cases
29 Three Revolutions in Global Transportation
The Costs of 3 RevolutionsTransportation is expensive. There are costs associated with constructing and operating vehicles; extracting and converting energy to its final form as fuel; building and maintaining roadways and vehicle fueling infrastructure; operating public transport and other systems; and paid drivers.
In our previous High Shift studies (and in IEA’s Energy Technology Perspectives series), most of these costs were estimated and projected out to 2050 for countries around the world. Here we reorganize this cost analysis around our 2R and 3R scenarios, and add some important elements. We continue to use average costs (as final prices) for all cost components within each of our regional breakouts, and adjust prices into the future.
Beyond the cost of purchasing and fueling vehicles, one of the most important costs, it turns out, is the labor associated with paid drivers. Nearly as important, at least in the 3R scenario, is the cost of running companies that manage shared mobility networks (the TNCs of the world). Finally, the additional cost of EVs and automated EVs over conventional ICE vehicles is not minor, though this is offset over time by fuel cost savings.
Specifically, the costs in our estimates include:
• Purchase cost, maintenance cost, energy cost of private vehicles (everything from bicycles to large SUVs)
• All costs associated with operating TNC services • All costs associated with operating public transport
services • Costs of constructing and maintaining roads,
sidewalks, bike paths, and parking facilities
We have not attempted to quantify the costs of:
• Traffic congestion and the associated time delays • Traffic safety, in the form of crashes, injuries, and
deaths • Air pollution and its impacts on health • Noise and its impacts on health • CO2 and its impacts on the climate – though we
do make some cost estimates associated with this pollutant, in the form of cost-per-ton of CO2 reduced.
However, these are all important forms of societal cost that are affected by the different scenarios, and we consider some of the possible impacts below.
Most of the cost assumptions per unit (such as building
one kilometer of highway, one square kilometer of parking, or one bus, or running a bus system per pkm of service) are retained from our previous High Shift studies. Three new estimates are included here:
• The cost of EVs and AVs, as noted in the assumptions for the 2R scenario. These costs decline over time but remain fairly expensive through 2030.
• The cost of paid drivers. Vehicle drivers, including for taxis, TNC vehicles, buses, and trains, can account for up to 50% of the cost of operating these enterprises. We did include this cost in previous studies for public transport systems, but taxi and TNC services were neglected. We have estimated the average cost per driver plus overhead for OECD and non-OECD countries taking into account typical wage rates. This is naturally an important element in lowering the cost of operating AVs.
• The cost of operating and managing TNC systems. This is difficult to estimate, given the fairly early stage of operating such systems, but it appears potentially very important in a world with high levels of use of such vehicles. The current 20-25% overhead rate (fee charged per unit revenue charged by drivers) that is typical of systems today is assumed to decline somewhat as these systems expand, but is kept close to 20% from 2020 to 2050.
Finally, the method for estimating and tracking costs here is based on societal costs. We look at the fuel use over the entire 20-year operating span of a vehicle, and allocate its capital cost over that same span. We do not discount costs into the future, though we use real rather than nominal cost estimates, accounting for inflation. Of course, private actors make decisions very differently, using short-term considerations, rapid payback requirements and such. Our cost comparisons do not provide such context, and thus costs that may be lower from a long-term, societal point of view, may not appear lower to these agents. Thus policies may (among other things) need to help better align private costs with societal costs in order to achieve the scenarios we present here.
A full set of costs across cost categories and comparing across modes, for two example countries (the United States and India) in 2030 is shown in Figure 15. These are estimates for BAU scenarios, and the per unit costs per pkm do change somewhat for other scenarios, but generally not by a lot. These figures show some of the main differences across modes and situations worthy of note.
Modes in OECD countries with paid drivers are nearly
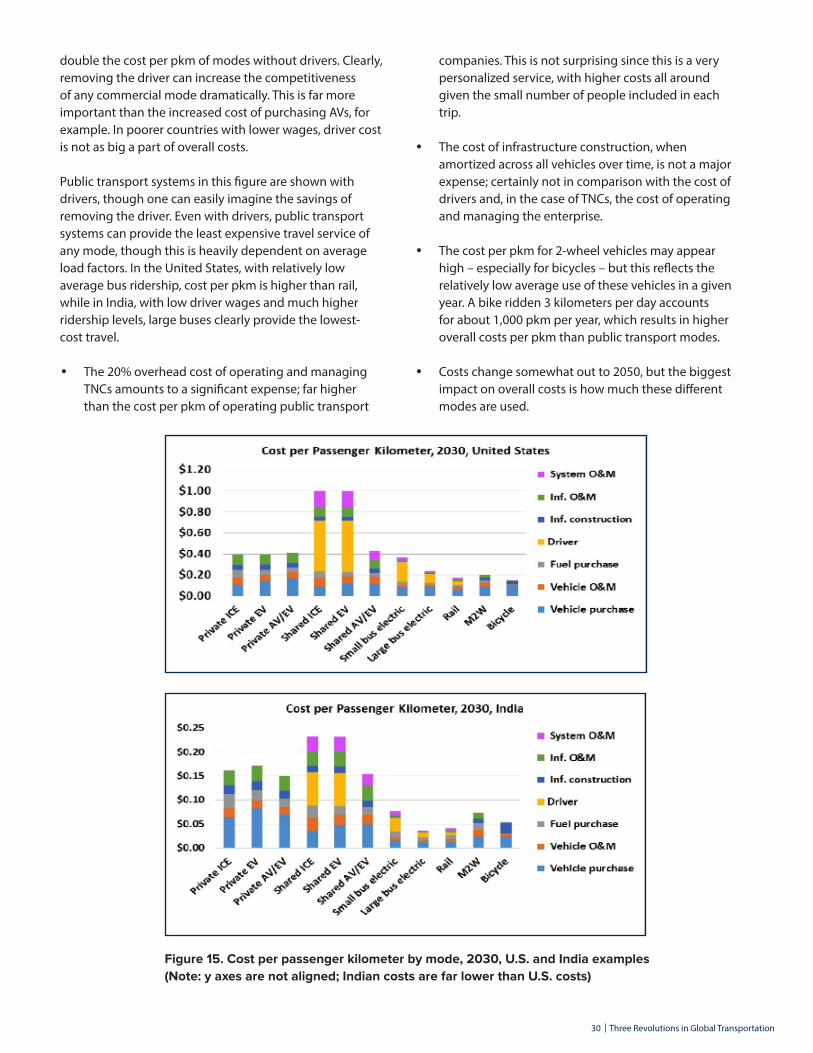
30 Three Revolutions in Global Transportation
double the cost per pkm of modes without drivers. Clearly, removing the driver can increase the competitiveness of any commercial mode dramatically. This is far more important than the increased cost of purchasing AVs, for example. In poorer countries with lower wages, driver cost is not as big a part of overall costs.
Public transport systems in this figure are shown with drivers, though one can easily imagine the savings of removing the driver. Even with drivers, public transport systems can provide the least expensive travel service of any mode, though this is heavily dependent on average load factors. In the United States, with relatively low average bus ridership, cost per pkm is higher than rail, while in India, with low driver wages and much higher ridership levels, large buses clearly provide the lowest-cost travel.
• The 20% overhead cost of operating and managing TNCs amounts to a significant expense; far higher than the cost per pkm of operating public transport
companies. This is not surprising since this is a very personalized service, with higher costs all around given the small number of people included in each trip.
• The cost of infrastructure construction, when amortized across all vehicles over time, is not a major expense; certainly not in comparison with the cost of drivers and, in the case of TNCs, the cost of operating and managing the enterprise.
• The cost per pkm for 2-wheel vehicles may appear high – especially for bicycles – but this reflects the relatively low average use of these vehicles in a given year. A bike ridden 3 kilometers per day accounts for about 1,000 pkm per year, which results in higher overall costs per pkm than public transport modes.
• Costs change somewhat out to 2050, but the biggest impact on overall costs is how much these different modes are used.
Figure 15. Cost per passenger kilometer by mode, 2030, U.S. and India examples(Note: y axes are not aligned; Indian costs are far lower than U.S. costs)
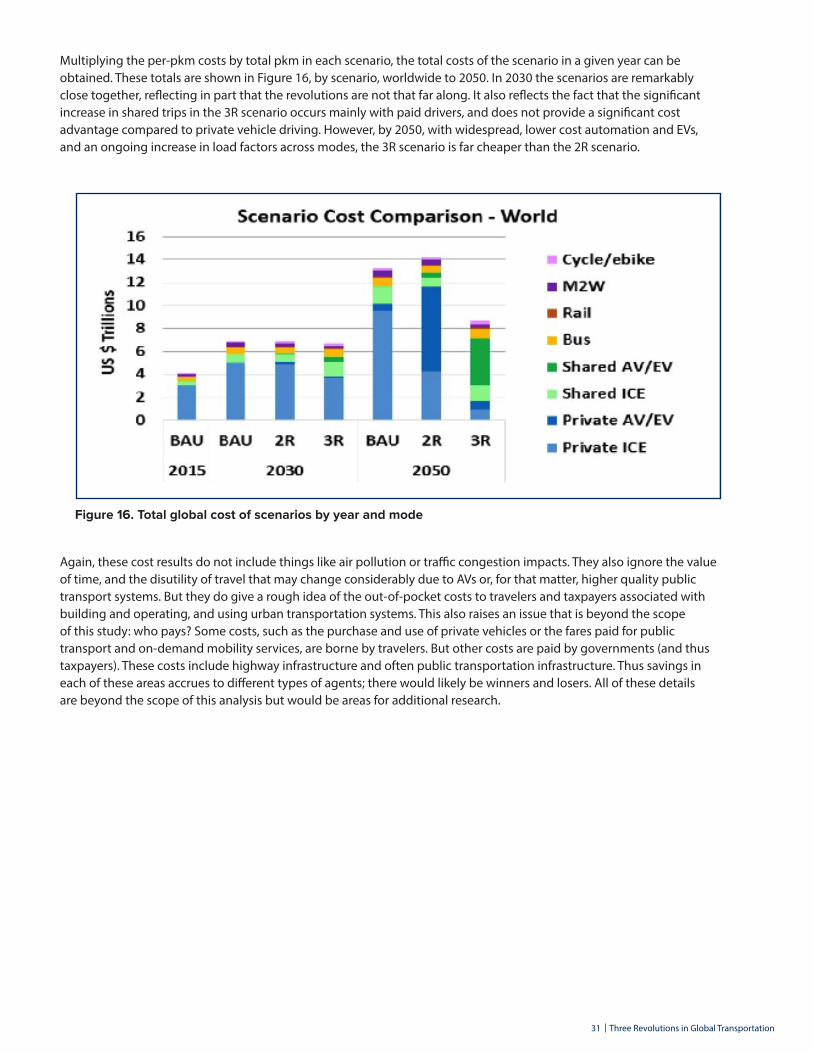
31 Three Revolutions in Global Transportation
Multiplying the per-pkm costs by total pkm in each scenario, the total costs of the scenario in a given year can be obtained. These totals are shown in Figure 16, by scenario, worldwide to 2050. In 2030 the scenarios are remarkably close together, reflecting in part that the revolutions are not that far along. It also reflects the fact that the significant increase in shared trips in the 3R scenario occurs mainly with paid drivers, and does not provide a significant cost advantage compared to private vehicle driving. However, by 2050, with widespread, lower cost automation and EVs, and an ongoing increase in load factors across modes, the 3R scenario is far cheaper than the 2R scenario.
Figure 16. Total global cost of scenarios by year and mode
Again, these cost results do not include things like air pollution or traffic congestion impacts. They also ignore the value of time, and the disutility of travel that may change considerably due to AVs or, for that matter, higher quality public transport systems. But they do give a rough idea of the out-of-pocket costs to travelers and taxpayers associated with building and operating, and using urban transportation systems. This also raises an issue that is beyond the scope of this study: who pays? Some costs, such as the purchase and use of private vehicles or the fares paid for public transport and on-demand mobility services, are borne by travelers. But other costs are paid by governments (and thus taxpayers). These costs include highway infrastructure and often public transportation infrastructure. Thus savings in each of these areas accrues to different types of agents; there would likely be winners and losers. All of these details are beyond the scope of this analysis but would be areas for additional research.
32 Three Revolutions in Global Transportation
5. Policy NarrativesThe three scenarios we describe represent very different futures. The course of events that cities and urban transportation take will be highly dependent on the policies that city and national governments implement.
Here we describe a set of policies that seems likely to be needed in order to realize each scenario, and present the scenarios roughly in order of the level of policy intervention required. The BAU scenario, while perhaps increasingly unlikely due to its increases in travel, energy use and CO2 emissions, represents no significant change in policy trajectory (and relatively limited success of the new technologies in question); the 2R scenario would require important policies to enable automation and encourage electrification; and the 3R scenario would likely require the broadest array of policy interventions and change as it affects fundamental mobility systems and patterns around the world.
BAU Scenario Policy NarrativeThe BAU scenario includes no major changes to the course of current policies affecting urban transport or land use. In the more advanced countries (United States, Europe, China, Japan), this typically includes continuing existing policies to support new technologies (electrification, sharing, and automation), urban development and transportation planning. In most developing countries, the BAU scenario includes almost no support for new technologies, limited capacity for urban policy implementation, and generally continued policy support of (or failure to prevent) strong increases in private motorized travel, with transport infrastructure provision continuing to lag far behind urban growth. We describe the policy assumptions for BAU in some detail here as these are likely to be just as important in determining future directions as the new policy initiatives we discuss for the other scenarios.
BAU: Automation
In OECD countries, most existing regulatory obstacles to automation remain in place for many years. Even if automation technologies improve and mature, legal liability, privacy, and ethics concerns are resolved only slowly over the course of many years, and existing restrictions on AVs are only removed after these issues are resolved. In some places, new restrictions on AVs are enacted in response to growing concerns about job
losses. In many non-OECD countries, low labor costs dampen demand for vehicle automation for many years. When demand increases, restrictions are enacted once AVs challenge labor markets.
BAU: Electrification
In the BAU scenario, electrification does not receive additional government support to encourage widespread adoption, beyond what is already in place and planned. In most OECD countries, this includes some modest support for EVs in the form of purchase incentives, new charging infrastructure, and some movement toward decarbonizing electricity generation. These policies, however, have only a limited impact and are not enough to help EVs break out of the 1-2% sales share position they are currently in. In most non-OECD countries little or no support is given to either the electrification of vehicles or the decarbonization of electricity production.
BAU: Sharing
New technologies permitting the sharing of trips continue to receive some ongoing support in OECD countries. A few cities and countries continue to experiment with mobility-as-a-service platforms that better link public, private, and shared mobility services into a cohesive network. However, these efforts are limited and do not reach a large scale. Few governments actively encourage the sharing of trips in any meaningful way beyond current policies supporting carpooling and public transport. In non-OECD countries, even less is done, and some policies to actively restrict the sharing of trips via new technology continue.
BAU: Urban Planning
Around the world, existing urban planning practices continue into the future. In OECD countries in western Europe, and east Asia, existing policies that support dense urban settlement tied to a strong network of public transport, cycling, and walking continue. In more car-centric OECD countries, such as those in North America and Australia, policies supporting low-density urban development tied primarily to automobile travel will continue, maintaining high mode shares of single-occupant car travel over increasingly long distances. In non-OECD countries, current urban planning trends such as spending that is primarily focused on new roads,
33 Three Revolutions in Global Transportation
flyovers, and limited access highways continues. Auto-centric and poorly-coordinated land use planning also continues in many areas, leading to more low-density, vehicle-centric settlement patterns that follow large arterials as they radiate out of cities. The speed of urban growth in non-OECD countries will continue to surpass transport infrastructure provision. This, coupled with growing wealth and ability to purchase private vehicles, results in a large increase in congestion and decrease in access. While a few countries will continue to invest in public transport and maintain compact cities, most will not.
BAU Scenario: Assumed Policy Summary
• Vehicle automation* Maintain or slowly relax existing barriers to automation* New restrictions added in some places to protect jobs
• Vehicle electrification and decarbonization of electricity production* Limited support for electrification and decarbonization in OECD countries* Very low support for electrification and decarbonization in non-OECD countries
• Shared mobility services* Limited ongoing support for shared mobility, in select cities in OECD countries* Low support for new vehicle sharing in non-OECD countries* Continued support for compact cities, public transport, cycling, and walking in OECD countries where
this is already a focus* Continued low-density car-centric development in the rest of the world
2R Scenario Policy NarrativeThe 2R scenario is focused on achieving rapid global adoption of EVs from 2020 onward, and a breakout and rapid growth trajectory for AVs beginning around 2025. This scenario is otherwise similar to the BAU scenario in the continuation of existing trends for vehicle sharing, public transport use, and urban planning. Many of the measures described here would logically be undertaken at a national level; however some (such as restrictions on ICE vehicles, coordination of EV charging infrastructure, etc.) would more logically be implemented by cities themselves.
Electrification
In both OECD and non-OECD countries, the short term push for electrification takes the form of policies that reduce barriers to electrification and actively, often directly, support the decarbonization of electricity production. This includes government support and direct provision of EV and clean power infrastructure. It also includes taxes and other market-driven schemes that restrict more polluting vehicles and power sources.
Countries like Norway, with very high incentives to purchase EVs, have shown that it is possible to achieve high market shares (EV sales shares there reached 30% in 2016 (Lutsey, 2017). In major markets, ongoing strong purchase incentives must be accompanied by significant use advantages (such as preferential parking) and an ongoing increase in public and workplace charging. These types of incentives must continue until EVs become market dominant and the costs of the incentive systems become unworkably high. Hopefully by that point the tipping point toward a rapid increase in sales will be reached. Much of this cost of maintaining incentive systems can be funded through differential taxation systems, for example, feebates or French style bonus-malus policies that tax the highest-emitting vehicles and subsidize the lowest-emitting vehicles, which would include EVs (at least in countries with clean electricity).
In the longer term, completely decarbonizing electricity generation may require active closure of all carbon-emitting power plants and their replacement with renewable power sources. Transitioning to a 100% EV fleet may require banning ICEs and government buyouts of existing vehicle fleets.
34 Three Revolutions in Global Transportation
Automation
As mentioned earlier, the potential cost savings from vehicle automation makes it an attractive technology for businesses operating transportation services, especially in high wage environments, such as in OECD countries. Thus the most crucial policies for automation to become widespread are those that remove restrictions to vehicle automation.
The scenario envisions OECD countries leading the creation of a policy environment that supports automation. In addition to removing barriers to automation, governments might also support research and testing of automation technologies and set legal and safety frameworks to allay public fears about personal data privacy and liability in the event of crashes. As labor prices rise and technology prices fall in non-OECD countries,
2R Scenario: Assumed Policy Summary
• Continuation of existing policies on sharing, public transport, urban planning (see BAU scenario) • No particular policy preference to increase EV or AV uptake by commercial operations over households • New policies supporting vehicle electrification and decarbonization of electricity production
* Carbon tax and heavy investment in very low carbon (e.g. renewable) electricity generation* Subsidies to offset EV purchase costs; could be generated via cap-and-trade, feebates or other
market-driven schemes* Elimination of subsidies for fossil fuels, making EVs more cost-competitive* Require automated vehicles to be electric drive* Support for public EV charging infrastructure* Policies dedicating space for EV charging in cities* Encourage “smart charging” of private and commercial EVs, at off peak times or otherwise in better
concert with electricity grid management systems* Low emission zones and other policies to encourage EV use and/or restrict operation of ICE vehicles
in cities or their central business districts, or even broader bans on ICE vehicles* Government research support for battery development and other new technologies such as
contactless charging to reduce charge time and increase driving range* Government buyouts of polluting vehicles and subsidies for vehicle replacement
• New policies supporting vehicle automation* Remove major legal restrictions to AV use* Develop comprehensive safety and liability regulations as consistently as possible across
jurisdictions * Develop data policies to protect private travel data* Support research into automation technology* Set framework for AV testing and type approval
3R Scenario Policy NarrativeThe 3R scenario builds on the 2R scenario, with policy support for both electrification and automation, but also substantial policy support for shared-use mobility and urban planning that supports shorter trip lengths and high levels
AVs become more cost competitive. When this happens, these countries follow the lead of OECD countries in the development of policies that enable and support vehicle automation.
An important question is whether driverless cars are first and most significantly deployed in commercial fleets, taxi companies or TNCs, or in households. In this scenario, we assume that restrictions are removed for all potential purchasers in an even manner and that, while there may be some early uptake commercially (given the high commercial advantages of driverless cars), households are also quick to begin purchasing such vehicles. Thus by 2030 there is not a major difference in use patterns, except that intensively used commercial vehicles are turned over much sooner, giving both more purchase opportunities to shift to AVs, and a faster penetration through the stock.
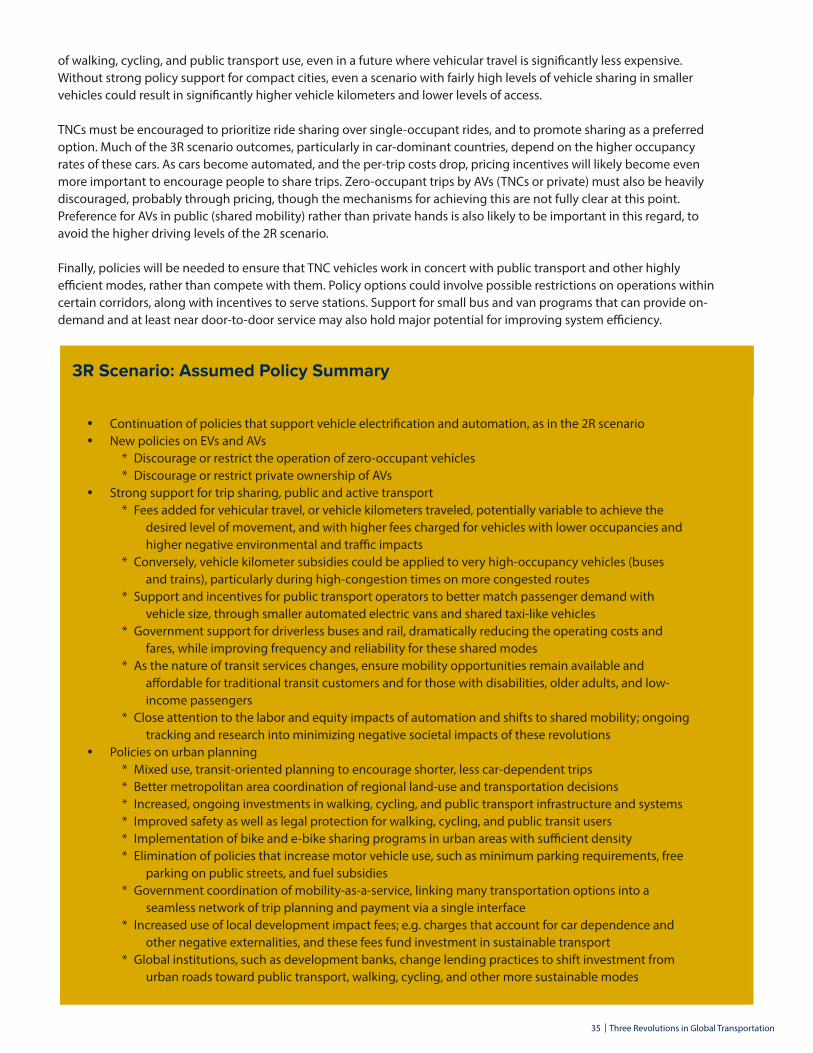
35 Three Revolutions in Global Transportation
of walking, cycling, and public transport use, even in a future where vehicular travel is significantly less expensive. Without strong policy support for compact cities, even a scenario with fairly high levels of vehicle sharing in smaller vehicles could result in significantly higher vehicle kilometers and lower levels of access.
TNCs must be encouraged to prioritize ride sharing over single-occupant rides, and to promote sharing as a preferred option. Much of the 3R scenario outcomes, particularly in car-dominant countries, depend on the higher occupancy rates of these cars. As cars become automated, and the per-trip costs drop, pricing incentives will likely become even more important to encourage people to share trips. Zero-occupant trips by AVs (TNCs or private) must also be heavily discouraged, probably through pricing, though the mechanisms for achieving this are not fully clear at this point. Preference for AVs in public (shared mobility) rather than private hands is also likely to be important in this regard, to avoid the higher driving levels of the 2R scenario.
Finally, policies will be needed to ensure that TNC vehicles work in concert with public transport and other highly efficient modes, rather than compete with them. Policy options could involve possible restrictions on operations within certain corridors, along with incentives to serve stations. Support for small bus and van programs that can provide on-demand and at least near door-to-door service may also hold major potential for improving system efficiency.
3R Scenario: Assumed Policy Summary
• Continuation of policies that support vehicle electrification and automation, as in the 2R scenario • New policies on EVs and AVs
* Discourage or restrict the operation of zero-occupant vehicles* Discourage or restrict private ownership of AVs
• Strong support for trip sharing, public and active transport* Fees added for vehicular travel, or vehicle kilometers traveled, potentially variable to achieve the
desired level of movement, and with higher fees charged for vehicles with lower occupancies and higher negative environmental and traffic impacts
* Conversely, vehicle kilometer subsidies could be applied to very high-occupancy vehicles (buses and trains), particularly during high-congestion times on more congested routes
* Support and incentives for public transport operators to better match passenger demand with vehicle size, through smaller automated electric vans and shared taxi-like vehicles
* Government support for driverless buses and rail, dramatically reducing the operating costs and fares, while improving frequency and reliability for these shared modes
* As the nature of transit services changes, ensure mobility opportunities remain available and affordable for traditional transit customers and for those with disabilities, older adults, and low- income passengers
* Close attention to the labor and equity impacts of automation and shifts to shared mobility; ongoing tracking and research into minimizing negative societal impacts of these revolutions
• Policies on urban planning* Mixed use, transit-oriented planning to encourage shorter, less car-dependent trips* Better metropolitan area coordination of regional land-use and transportation decisions * Increased, ongoing investments in walking, cycling, and public transport infrastructure and systems* Improved safety as well as legal protection for walking, cycling, and public transit users* Implementation of bike and e-bike sharing programs in urban areas with sufficient density * Elimination of policies that increase motor vehicle use, such as minimum parking requirements, free
parking on public streets, and fuel subsidies* Government coordination of mobility-as-a-service, linking many transportation options into a
seamless network of trip planning and payment via a single interface * Increased use of local development impact fees; e.g. charges that account for car dependence and
other negative externalities, and these fees fund investment in sustainable transport* Global institutions, such as development banks, change lending practices to shift investment from
urban roads toward public transport, walking, cycling, and other more sustainable modes
36 Three Revolutions in Global Transportation
The scenarios presented in this report are one way to construct alternative possible futures for urban passenger transport. There are many other possible approaches. This study attempts to identify how we can envision the three revolutions in order to:
• Understand whether combining electrification with automation can deliver a low CO2 and otherwise sustainable world cost-effectively
• Understand whether further revolutionizing the manner in which we travel, rather than just the technologies on vehicles, can contribute significantly to achieving our environmental goals.
Ultimately the findings shown here are not that surprising. While automation may produce some efficiencies and road congestion benefits, it may also trigger increases in travel, and by itself does not seem likely to result in a low-energy future. But when paired with electrification, the combination does seem capable of providing deep energy and CO2 cuts (and thus nearly all of these cuts, on balance, can be attributed to electrification). Even then, the net effects of electrification depend on decarbonizing electric power.
We also find that there are fairly enormous efficiencies associated with shared mobility, including ride sharing in LDVs along with the use of small and large buses and urban rail systems. Shared mobility in ride-hailing vehicles must achieve relatively high average occupancy (load factor) levels in order to really contribute to reductions in traffic and energy use; for their part, public transport modes must provide efficient, comfortable service for this 3R scenario to succeed. There is evidence that such high quality public transport is achievable, but there are no guarantees and considerable policy pressure and investments will be needed.
If successfully achieved, a 3R scenario with its ecosystem of shared vehicle trips, public transport, and active travel use can provide high quality and sufficient urban mobility (indicated in this study as pkm) with far fewer vehicles on the road, and even fewer vehicles parked, compared to our BAU or 2R scenarios. Energy and CO2 emissions in the 3R scenario are about half those of the 2R scenario, and costs – perhaps surprisingly – are far lower as well. The 3R scenario also seems very likely to provide the biggest benefits in cutting traffic congestion and likely
would have large safety benefits, though these have not been quantified in this study.
To achieve the 3R scenario, pricing policies will likely need to play an important role. Such policies can help avoid widespread use of zero-occupant vehicles and even single-occupant vehicles, and encourage enough on-demand mobility to get people around the world to shift away from private car ownership. The cost savings associated with the 3R scenario are due mostly to factors that are not apparent and don’t feature in much decision-making today. For example, lower car ownership means people save enormous amounts on buying and maintaining vehicles that are unused at least 90% of the time.
Similarly, savings from fewer roads and parking lots may only become apparent as savings opportunities once the world is strongly on a 3R path.
Overall, while our pathway to a revolutionary future appears to have low direct costs and likely high societal benefits, it may require aggressive, visionary policymaking to achieve policymaking to achieve.
6. Conclusions, Uncertainties, Next Steps
37 Three Revolutions in Global Transportation
BibliographyAlonso-mora, J., Samaranayake, S., Wallar, A., Frazzoli, E., & Rus, D. (2017). Trip-Vehicle Assignment. https://doi.org/10.1073/pnas.1611675114/-/DCSupplemental.www.pnas.org/cgi/doi/10.1073/pnas.1611675114
Anair, D. (2017). Capturing the Climate Benefits of Autonomous Vehicles. Retrieved from https://3rev.ucdavis.edu/wp-content/uploads/2017/03/3R.Climate.Indesign.Final_.pdf
Automated Driving: Levels Of Driving Automation Are Defined In New SAE International Standard J3016. (2016). Global Ground Vehicle Standards. Retrieved from https://www.sae.org/misc/pdfs/automated_driving.pdf
Beiker, S., & Meyer, G. (2014). Disruptive Innovation on the Path to Sustainable Mobility. Road Vehicle Automation. https://doi.org/10.1007/978-3-319-05990-7
Brown, A., Gonder, J., & Repac, B. (2014). An Analysis of Possible Energy Impacts of Automated Vehicle. Road Vehicle Automation, 61–70. https://doi.org/10.1007/978-3-319-05990-7
Campbell, A. A., Cherry, C. R., Ryerson, M. S., & Yang, X. (2016). Factors influencing the choice of shared bicycles and shared electric bikes in Beijing. Transportation Research Part C: Emerging Technologies, 67, 399–414. https://doi.org/10.1016/j.trc.2016.03.004
Cohen, S., & Shirazi, S. (2017). Can We Advance Social Equity with Shared, Autonomous and Electric Vehicles? Retrieved March 20, 2017, from https://3rev.ucdavis.edu/wp-content/uploads/2017/03/3R.Equity.Indesign.Final_.pdf
Davies, A. (2015). Turns out the hardware in self-driving cars is pretty cheap. Retrieved from https://www.wired.com/2015/04/ cost-of-sensors-autonomous-cars/
Elgowainy, A., Han, J., Ward, J., Joseck, F., Gohike, D., Lindauer, A., … Wallington, T. J. (2016). Cradle-to-Grave Lifecycle Analysis of U.S. Light-Duty Vehicle-Fuel Pathways: A Greenhouse Gas Emissions and Economic Assessment of Current (2015) and Future (2025-2030) Technologies.
Fagnant, D. J., & Kockelman, K. M. (2013). Preparing a nation for autonomous vehicles. Transportation Research Part A Journal, 77(October), 1–32. https://doi.org/10.1016/j.tra.2015.04.003
Fulton, L. M., Seleem, A., Boshell, F., Salgado, A., & Saygin, D. (2017). Electric Vehicles: Technology Brief.
Garrick, D. (2016). Car2Go switching electric cars to gas. Retrieved March 20, 2017, from https://www.iea.org/topics/ transport/subtopics/mobilitymodelpartnership/
Google’s Autonomous Vehicle. (2012). Retrieved March 23, 2017, from http://googlesautonomousvehicle.weebly.com/ technology-and-costs.html
Handy, S. (2017). Active Transportation in an Era of Sharing, Electrification and Automation. Retrieved from https://3rev. ucdavis.edu/wp-content/uploads/2017/03/3R.Active.InDesign.Final_.pdf
IEA. (2016). Energy Technology Perspectives 2016 Towards sustainable urban energy systems. Executive Summary. Retrieved March 20, 2017, from https://www.iea.org/etp/etp2016/
IHS Markit. (2014). Self-Driving Cars Moving into the Industry's Driver's Seat. Retrieved March 23, 2017, from http://news. ihsmarkit.com/press-release/automotive/self-driving-cars-moving-industrys-drivers-seat
38 Three Revolutions in Global Transportation
Johnson, C., & Walker, J. (2016). Peak car ownership. Rocky Mountain Institute.
Lutsey, N. (2017). The rise of electric vehicles: The second million. Retrieved March 1, 2017, from http://search.proquest.com/docview/1266038343?accountid=14549%5Cnhttp:hl5yy 6xn2p.search.serialssolutions.com/?genre=article&sid=ProQ:&atitle=From+the+blogs&title=Financial+Management&i ssn=14719185&date=2012-11-01&volume=&issue=&spage=16&author=Barman,+T
Mason, J., Fulton, L., & McDonald, Z. (2015). A Global High Shift Cycling Scenario: The Potential for Dramatically Increasing Bicycle and E-bike Use in Cities Around the World, with Estimated Energy, CO2, and Cost Impacts. Institute for Transportation & Development Policy.
McFarland, M. (2015). The $75,000 problem for self-driving cars is going away. Retrieved March 1, 2017, from https://www.washingtonpost.com/news/innovations/wp/2015/12/04/the-75000- problem-for-self-driving-cars-is-going-away/?utm_term=.1d1814825145
McKerracher, C., Itamar, O., Wilshire, M., Tryggestad, C., Mohr, D., Hannon, E., … Moeller, T. (2016). An integrated perspective on the future of mobility. Retrieved from https://www.bbhub.io/bnef/sites/4/2016/10/BNEF_McKinsey_The-Future-of- Mobility_11-10-16.pdf
OECD - International Transport Forum. (2015). Urban Mobility System Upgrade: How shared self-driving cars could change city traffic. Corporate Partnership Board Report, 1–36. https://doi.org/10.1007/s10273-016-2048-3
Ory, D. (2017). Governance: Who’s in Charge Here? Retrieved from https://3rev.ucdavis.edu/wp-content/uploads/2017/03/3R. Governance.Indesign.Final_.pdf
Polzin, S. E. (2017). Three Transportation Revolutions: Synergies with Transit. Retrieved March 20, 2017, from https://3rev. ucdavis.edu/wp-content/uploads/2017/03/3R.Transit.Indesign.Final_.pdf
Replogle, M. A., & Fulton, L. M. (2014). A Global High Shift Scenario: Impacts and Potential for More Public Transport, Walking, And Cycling With Lower Car Use. Institute for Transportation & Development Policy.
Schaller, B. (2017). Unsustainable? The Growth of App-Based Ride Services and Traffic, Travel and the Future of New York City. Retrieved March 20, 2017, from https://www.iea.org/topics/transport/subtopics/mobilitymodelpartnership/
Shaheen, S., Chan, N., Bansal, A., & Cohen, A. (2015). Definitions, Industry Developments, and Early Understanding. Retrieved from http://innovativemobility.org/wp-content/uploads/2015/11/SharedMobility_WhitePaper_FINAL.pdf
Wadud, Z., MacKenzie, D., & Leiby, P. (2016). Help or hindrance? The travel, energy and carbon impacts of highly automated vehicles. Transportation Research Part A: Policy and Practice, 86, 1–18. https://doi.org/10.1016/j.tra.2015.12.001