Embed Size (px)
Citation preview
Three-Year Education Plan & Annual Education Results Report
2017 - 2020
Foothills School Division No. 38
Page 1
Table of Contents Message from the Board Chair & Superintendent ....................................................................................... 2
Accountability Statement ............................................................................................................................. 3
Foundation Statements ................................................................................................................................ 4
Division Profile .............................................................................................................................................. 4
FSD Vision for Leading and Supporting Learning .......................................................................................... 4
Key Priorities ................................................................................................................................................. 4
Divisional Learning Goals .............................................................................................................................. 5
Trends and Issues .......................................................................................................................................... 6
Division Highlights ......................................................................................................................................... 9
Students: ................................................................................................................................................... 9
Staff: ........................................................................................................................................................ 11
Measure Evaluation Reference ................................................................................................................... 12
Combined 2017 Accountability Pillar Overall Summary ............................................................................. 13
Strategies ................................................................................................................................................ 14
Outcome One: Alberta’s students are successful ....................................................................................... 17
Outcome One: Alberta’s students are successful (continued) ................................................................... 19
Outcome One: Alberta’s students are successful (continued) ................................................................... 21
Outcome Two: The achievement gap between FNMI students and all other students is eliminated ....... 23
Outcome Three: Alberta’s education system is inclusive ........................................................................... 26
Outcome Four: Alberta has excellent teachers, school and school authority leaders ............................... 28
Outcome Five: The education system is well governed and managed ...................................................... 30
Future Challenges ....................................................................................................................................... 32
Summary of Financial Results ..................................................................................................................... 33
Budget Summary .......................................................................................................................................... 34
Capital and Facilities Projects ........................................................................................................................ 35
Summary of Facility and Capital Plans ........................................................................................................... 36
Parental Involvement .................................................................................................................................. 37
Timelines and Communication ................................................................................................................... 38
Whistleblower Protection ........................................................................................................................... 39
APPENDIX – Measure Details ...................................................................................................................... 40
Foothills School Division No. 38
Page 2
Message from the Board Chair & Superintendent
Student learning and preparing our students for future success is at the very core of our work in Foothills School Division (FSD).
In this Three Year Education Plan (3YEP)/Annual Education Results Report (AERR), you will see that several overall measures related to student learning and achievement in FSD remained strong, or improved last year, according to provincial assessment results for the 2016-2017 school year. Among them: education quality; safe and caring schools; program of studies; high school completion rate; very low dropout rate; Provincial Achievement Test (PAT) Acceptable level; and Diploma Exam (DIP) Acceptable level.
As an organization dedicated to continuous growth and improvement in student achievement, we invest a lot of effort in evaluating data with our schools to identify focus areas for improvement in the year ahead at both the system and individual school levels. Priorities for this year include:
• Ensure learning is designed for deep understanding and engagement which we will believe will contribute to student success.
• Ensure students have the appropriate supports and interventions to achieve personal success. • Ensure learners are literate and numerate. • Improve student achievement in high school Math and Science courses, excellence and
participation rates.
There are also several other factors that contribute to student achievement, such as:
• High quality staff and excellent teaching. In this regard we provide our staff with ongoing, strategic professional development aimed at improving student learning and success; and
• A continuing focus on ensuring safe, caring and inclusive learning environments; • Communicating openly and engaging often with parents regarding their child’s progress.
We want to thank our staff, parents and students in Foothills School Division for their ongoing efforts to improve student learning across the division.
We also want to assure parents that every decision – whether it concerns classroom teaching and supports or transportation – is made through the lens of how it will improve student learning and success. We look forward to continuing to work in partnership with school families to provide their children with a high quality education and prepare them for their future as contributing members of society and exceptional citizens.
Larry Albrecht John Bailey Chair, Board of Trustees Superintendent of Schools Foothills School Division Foothills School Division
Foothills School Division No. 38
Page 3
Accountability Statement
The Annual Education Results Report for the 2016-2017 school year and the Education Plan for the three years commencing September 1, 2017 for Foothills School Division No. 38 were prepared under the direction of the Board in accordance with its responsibilities under the School Act and the Fiscal Management Act. This document was developed in the context of the provincial government’s business and fiscal plans. The Board has used the results reported in the document, to the best of its abilities, to develop the Education Plan and is committed to implementing the strategies contained within the Education Plan to improve student learning and results.
The Board approved this combined Annual Education Results Report for the 2016-2017 school year and the Three-Year Education Plan for 2017-2020 on December 6, 2017.
Larry Albrecht Chair, Board of Trustees Foothills School Division
Foothills School Division No. 38
Page 4
Foundation Statements FSD’s Board of Trustees reviews its foundational statements – Mission, Core Values and Guiding Principles – on an annual basis and revises them as required. To view, please visit www.fsd38.ab.ca/Mission.php.
Division Profile To learn more about FSD please visit www.fsd38.ab.ca/About.php or contact our Communications Manager at 403-652-6502 or [email protected].
FSD Vision for Leading and Supporting Learning Foothills School Division (FSD) focuses on improving learning for ALL students by immersing them in an environment that commits to intellectually engaging each learner and promotes healthy relationships among all stakeholders. As a Division we strive to leverage the research in education to advance “Best Teaching Practice” in the following areas: • Understanding and implementing the curricula;
• Embedding quality assessment; • Infusing technology effectively into well designed instruction; and
• Ensuring a systemic and purposeful response to intervention for students requiring assistance. Our culture remains focused on learning at all levels of the system through collaborative, action-oriented professional learning teams and building capacity through distributed leadership development across the organization.
Our Divisional Goals are focused on achieving the key priorities of the board
Key Priorities Priority One: Ensure broader access to consistent and high quality learning for all students.
Priority Two: Establish system-wide excellence in teaching and leadership.
Priority Three: Ensure that all students learn at high levels and are held to high standards.
Priority Four: Establish system-wide capacity to engage parents and the broader community as partners in promoting, supporting and informing educational excellence.
Foothills School Division No. 38
Page 5
Divisional Learning Goals
• Goal One - ALL students develop the necessary knowledge, skills, understanding and attitudes to achieve personal excellence
• Goal Two - ALL students contribute to and are provided safe, caring, and welcoming learning environments to achieve personal excellence.
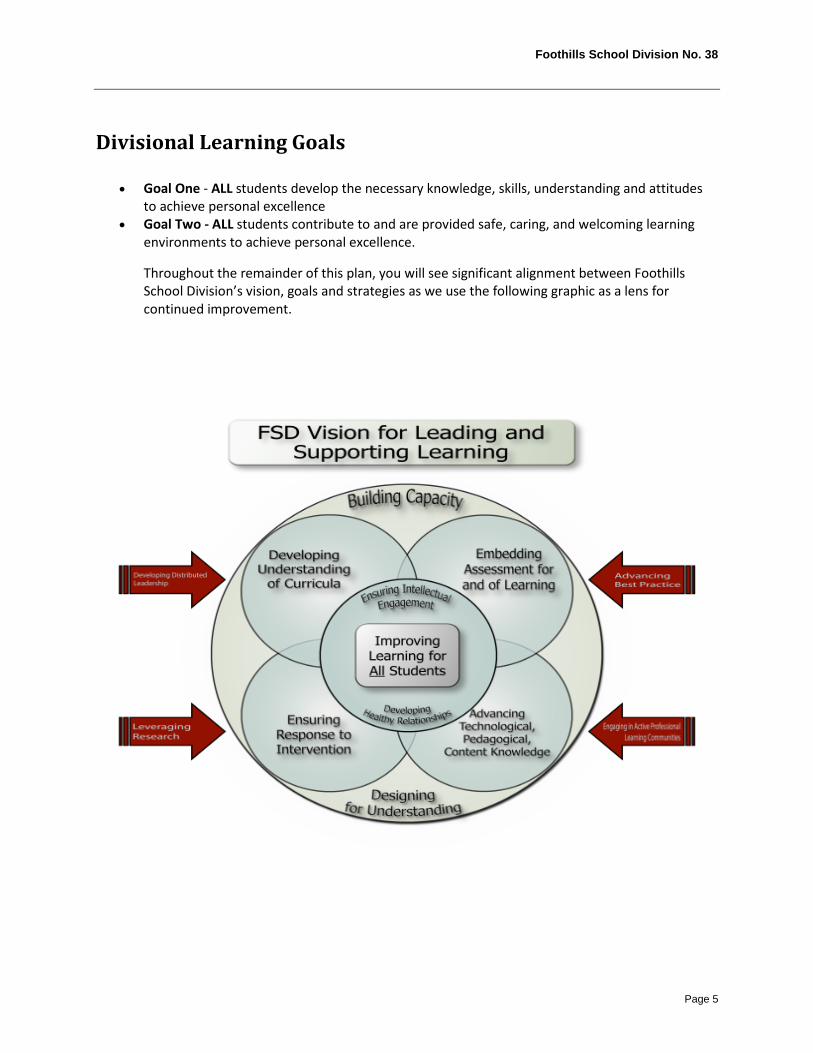
Throughout the remainder of this plan, you will see significant alignment between Foothills School Division’s vision, goals and strategies as we use the following graphic as a lens for continued improvement.
Foothills School Division No. 38
Page 6
Trends and Issues
• Foothills School Division is in the procurement stage of selecting a general contractor for construction on a new K-9 school, 700 student capacity upon opening, in the recently annexed NE area of Okotoks. The school will begin construction in 2017/18 and we are excited about the growth and opportunities that this will afford to students and the community. École Foothills Composite High School modernization work started in 2016 and is slated to be completed early in 2018. This will bring the current school up to current building code and provide upgraded learning spaces so that students are better able to realize the benefits of these changes.
• We have seen a significant increase in the increasing number of students in our division with diverse learning needs. Of particular significance is the number of students requiring supports for their mental health and wellbeing. Foothills School Division continues to reach out to other ministries to partner and support our students and staff in this area. In addition, we are continuing to build the capacity across the system through a continuum of supports and services to ensure these students have opportunities to be successful.
• Technology continues to provide both challenges and opportunities for all of our stakeholders.
Significant resources have been put into developing wired and wireless infrastructure to support the ever-growing number of devices connecting to our network. Replacement of aging technologies is underway to provide updated large screen display technologies as well as devices for student and staff use.
• FSD provides high quality professional development for teachers. Our focus continues to be on designing engaging learning for students through real, authentic relevant learning opportunities, providing differentiated instruction as well as quality assessment practices. Our System Learning Days have focused on utilizing high quality teaching approaches to provide all students with opportunities to reach personal excellence. We also support ongoing and high quality professional development for support staff, including a dedicated learning day to ensure capacity building in all roles in the division.
• In 2016/2017 enrolment was stable with a total of 7,635 (FTE) students registered at the September 30 enrolment count date with the municipalities of Okotoks and High River showing marginal growth.
• With growth and deficit spending of the Divisional reserves as part of the staffing plan for the 2017-2018 school year, FSD continued to hire new staff into the district including 8 new-to-the-profession teachers and new to the Division teachers. In addition, funding allocated from the Classroom Improvement Fund (CIF) grant for both certificated staff and support staff has also resulted in increased allocations and targeted staffing decisions across the Division at the outset of the 2017-2018 school year.
Foothills School Division No. 38
Page 7
• At the time this report was submitted Foothills School Division has signed a Memorandum of Agreement with Foothills School Division No. 38 School Bus Drivers Association and were moving towards completion of negotiations with Alberta Teacher’s Association Local 16, CUP 5040 and Foothills School Division Maintenance Association.
Accomplishments:
• French Partnership with Nancy Metz Region of France
On April 1, 2017, Foothills School Division signed a partnership agreement with the académie of Nancy-Metz in France. This program aims to allow for student and teacher exchanges along with other collaborative educational opportunities. http://www.highrivertimes.com/2017/04/27/fsd-ratifies-french-exchange-program-agreement
• Classroom Innovative Program Initiative (CPIP)
The Board of Trustees believe in and support innovation in learning. They believe innovation happens at the classroom and school level. With this in mind they have decided to initiate the Classroom Innovation Program Initiative (CPIP), they have set aside $1,000,000 for a five-year period to support grassroots action research projects led by teachers, students and or parents that demonstrate innovative ways to improve learning outcomes for students. The first projects were completed in June 2017. A new slate or projects have begun in September 2017. These projects ranged from classroom based projects to whole school and multi school projects. All the projects focused on innovative ways to engage students in learning. The data and evidence that we are gathering from these projects will help to inform best practice and learning practices that might be scaled up at a division level. Some of the 2016-17 projects included;
The Human Library – a multi school high school and junior high four-day program that was hosted at Oilfields Junior Senior High School that focused on utilizing “human books” to use oral storytelling and discussion to build competencies in communication, career and lifelong learning and build strong community connections. http://www.westernwheel.com/article/Library-provides-a-powerful-human-touch-20170405
Com Tech Program / Cross Curricular Film Project – This project at Foothills Composite High School was focused on using the development of a student led film project to engage students in using their creativity, technology and film expertise as well as collaboration to create a full length web film project. The project supported the purchase of film, computer and video technology that ensured the students had the tools to create a high quality project. Students took on every aspect of the films development including production, writing, directing and editing. This project now has left a legacy of a strong infrastructure to continue to develop the creative film and videographers of tomorrow. https://www.youtube.com/watch?v=AvuRZzLp9Y0&feature=youtu.be
Wetland Project - A cross grade project at Westmount School focused on learning more about our local wetlands and what problems these important habitats face. Students worked with local experts and engaged in hands on learning – testing watersheds and collecting data. They collaboratively developed solutions to share with community members on how best to protect and preserve these watersheds.
Foothills School Division No. 38
Page 8
Foothills School Division No. 38
Page 9
Division Highlights Foothills School Division is proud of its students, schools, and staff and the many accomplishments we have to celebrate throughout the school year. Following are some highlights from the 2016-2017 school year.
Students: Congratulations to Chloe Dixon of Oilfields School. Chloe was the 2016 recipient of the Aspire Southern Alberta Indigenous Youth Award (SAIYA). This award celebrates Indigenous youth who are making a difference in their communities, developing healthy solutions and growing into successful leaders and ambassadors. Chloe has been recognized for going above and beyond to build bridges between cultures and to develop a stronger community for all humanity. Kristiyan, an Alberta High School of Fine Arts graduate was accepted to the prestigious Max The Mutt College of Animation! www.westernwheel.com/article/Student-captures-the-anatomy-at-work-20170705 The students and staff of Spitzee School in High River wanted to help the students and staff in Fort McMurray celebrate their Christmas season. "We understand what it feels like to lose things that are special and important to us. We also know what it feels like to have others care for us and do nice things to help us feel better. We are paying it forward by making Christmas ornament kits to be put together as well as ornaments to hang on their trees. It is an amazing feeling to do something kind for others." Students from Cayley School brought have a popular violin program within the community, they played a number of concerts within the community. Grade 6 Westmount students presented to the Town of Okotoks council, received approval, built and continue to stock a Little Free Pantry within Okotoks. https://globalnews.ca/news/3543780/okotoks-elementary-students-build-little-free-pantries/?utm_source=GlobalCalgary École Joe Clark School students continue to promote literacy through their Book Bungalow in High River. These were built by a Grade 10 Highwood High School construction class. Grade 8 Millarville students participate in their Legacy projects, giving back to their local community. https://okotoksonline.com/local/millarville-students-leaving-big-legacy-behind Foothills Lions rugby players represented Team Canada in the Youth Commonwealth Games http://www.westernwheel.com/article/Lions-duo-roll-sevens-to-Youth-Commonwealth-Games-20170607 Meagan Quigley from Foothills Composite High School received a $500 Award from Foothills School Division for achieving the highest DELF (Diplôme d'Etudes en Langue Française) B2 mark. Meagan
Foothills School Division No. 38
Page 10
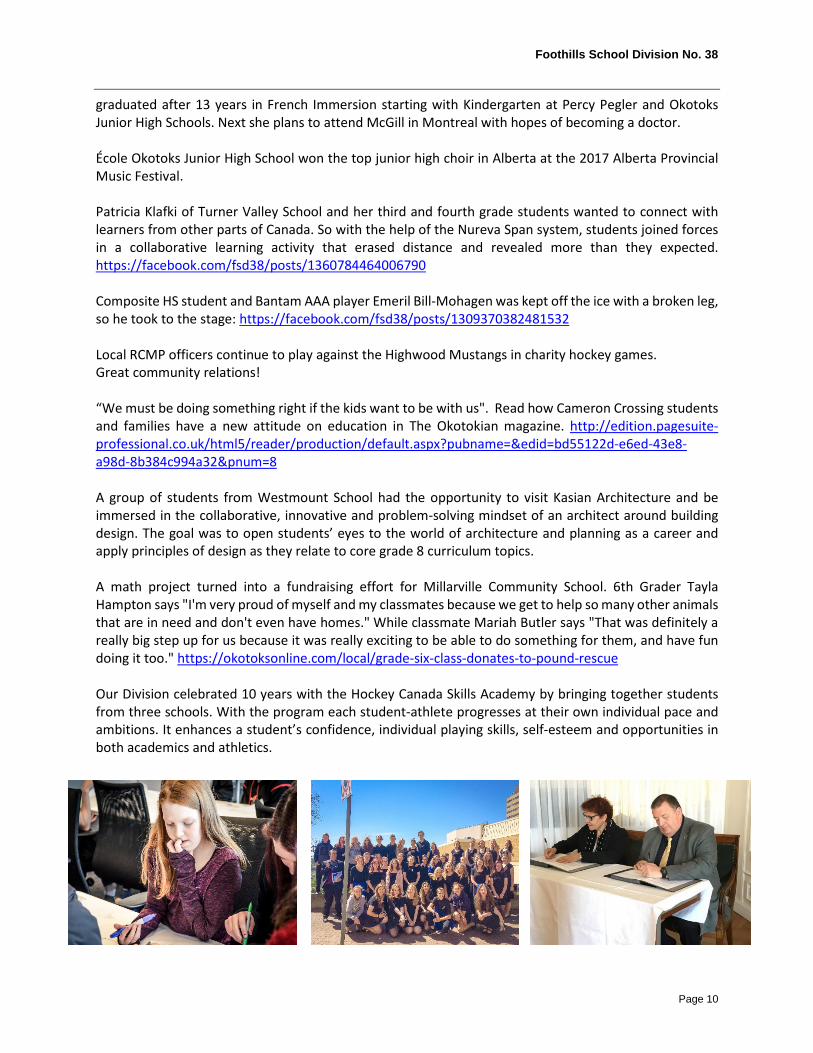
graduated after 13 years in French Immersion starting with Kindergarten at Percy Pegler and Okotoks Junior High Schools. Next she plans to attend McGill in Montreal with hopes of becoming a doctor. École Okotoks Junior High School won the top junior high choir in Alberta at the 2017 Alberta Provincial Music Festival. Patricia Klafki of Turner Valley School and her third and fourth grade students wanted to connect with learners from other parts of Canada. So with the help of the Nureva Span system, students joined forces in a collaborative learning activity that erased distance and revealed more than they expected. https://facebook.com/fsd38/posts/1360784464006790 Composite HS student and Bantam AAA player Emeril Bill-Mohagen was kept off the ice with a broken leg, so he took to the stage: https://facebook.com/fsd38/posts/1309370382481532 Local RCMP officers continue to play against the Highwood Mustangs in charity hockey games. Great community relations! “We must be doing something right if the kids want to be with us". Read how Cameron Crossing students and families have a new attitude on education in The Okotokian magazine. http://edition.pagesuite-professional.co.uk/html5/reader/production/default.aspx?pubname=&edid=bd55122d-e6ed-43e8-a98d-8b384c994a32&pnum=8 A group of students from Westmount School had the opportunity to visit Kasian Architecture and be immersed in the collaborative, innovative and problem-solving mindset of an architect around building design. The goal was to open students’ eyes to the world of architecture and planning as a career and apply principles of design as they relate to core grade 8 curriculum topics. A math project turned into a fundraising effort for Millarville Community School. 6th Grader Tayla Hampton says "I'm very proud of myself and my classmates because we get to help so many other animals that are in need and don't even have homes." While classmate Mariah Butler says "That was definitely a really big step up for us because it was really exciting to be able to do something for them, and have fun doing it too." https://okotoksonline.com/local/grade-six-class-donates-to-pound-rescue Our Division celebrated 10 years with the Hockey Canada Skills Academy by bringing together students from three schools. With the program each student-athlete progresses at their own individual pace and ambitions. It enhances a student’s confidence, individual playing skills, self-esteem and opportunities in both academics and athletics.
Foothills School Division No. 38
Page 11
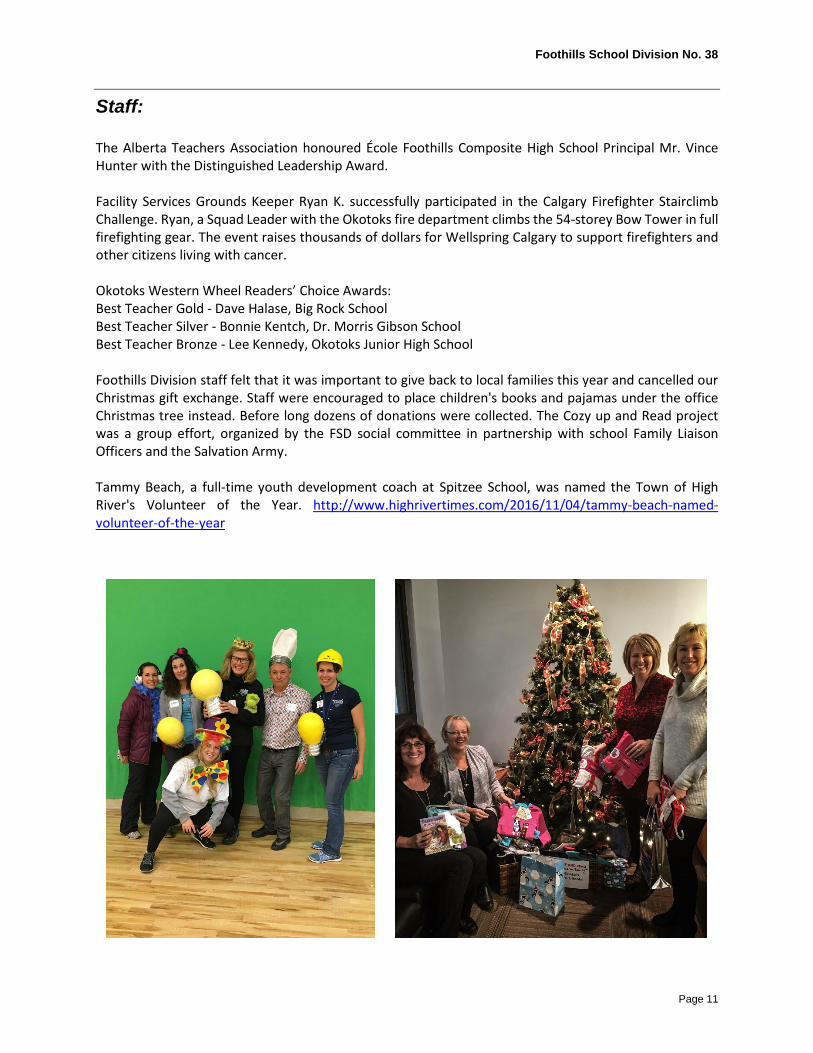
Staff: The Alberta Teachers Association honoured École Foothills Composite High School Principal Mr. Vince Hunter with the Distinguished Leadership Award. Facility Services Grounds Keeper Ryan K. successfully participated in the Calgary Firefighter Stairclimb Challenge. Ryan, a Squad Leader with the Okotoks fire department climbs the 54-storey Bow Tower in full firefighting gear. The event raises thousands of dollars for Wellspring Calgary to support firefighters and other citizens living with cancer. Okotoks Western Wheel Readers’ Choice Awards: Best Teacher Gold - Dave Halase, Big Rock School Best Teacher Silver - Bonnie Kentch, Dr. Morris Gibson School Best Teacher Bronze - Lee Kennedy, Okotoks Junior High School Foothills Division staff felt that it was important to give back to local families this year and cancelled our Christmas gift exchange. Staff were encouraged to place children's books and pajamas under the office Christmas tree instead. Before long dozens of donations were collected. The Cozy up and Read project was a group effort, organized by the FSD social committee in partnership with school Family Liaison Officers and the Salvation Army. Tammy Beach, a full-time youth development coach at Spitzee School, was named the Town of High River's Volunteer of the Year. http://www.highrivertimes.com/2016/11/04/tammy-beach-named-volunteer-of-the-year
Foothills School Division No. 38
Page 12
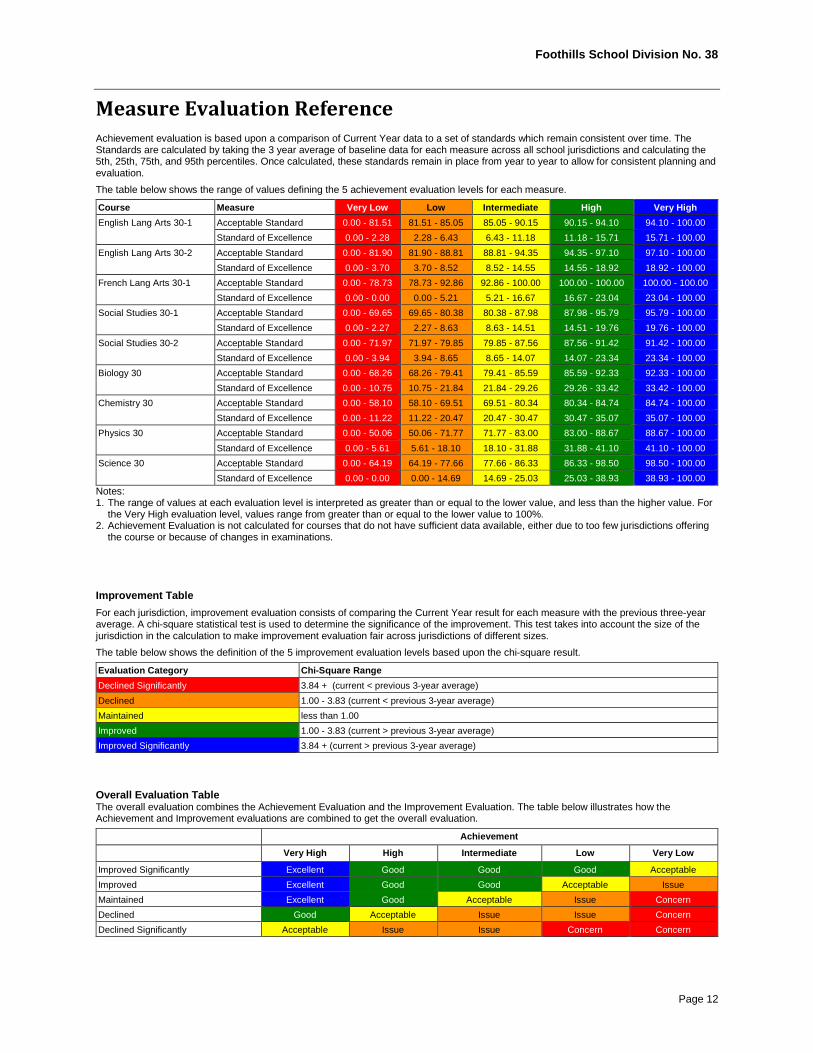
Measure Evaluation Reference Achievement evaluation is based upon a comparison of Current Year data to a set of standards which remain consistent over time. The Standards are calculated by taking the 3 year average of baseline data for each measure across all school jurisdictions and calculating the 5th, 25th, 75th, and 95th percentiles. Once calculated, these standards remain in place from year to year to allow for consistent planning and evaluation. The table below shows the range of values defining the 5 achievement evaluation levels for each measure.
Course Measure Very Low Low Intermediate High Very High English Lang Arts 30-1 Acceptable Standard 0.00 - 81.51 81.51 - 85.05 85.05 - 90.15 90.15 - 94.10 94.10 - 100.00
Standard of Excellence 0.00 - 2.28 2.28 - 6.43 6.43 - 11.18 11.18 - 15.71 15.71 - 100.00 English Lang Arts 30-2 Acceptable Standard 0.00 - 81.90 81.90 - 88.81 88.81 - 94.35 94.35 - 97.10 97.10 - 100.00
Standard of Excellence 0.00 - 3.70 3.70 - 8.52 8.52 - 14.55 14.55 - 18.92 18.92 - 100.00 French Lang Arts 30-1 Acceptable Standard 0.00 - 78.73 78.73 - 92.86 92.86 - 100.00 100.00 - 100.00 100.00 - 100.00
Standard of Excellence 0.00 - 0.00 0.00 - 5.21 5.21 - 16.67 16.67 - 23.04 23.04 - 100.00 Social Studies 30-1 Acceptable Standard 0.00 - 69.65 69.65 - 80.38 80.38 - 87.98 87.98 - 95.79 95.79 - 100.00
Standard of Excellence 0.00 - 2.27 2.27 - 8.63 8.63 - 14.51 14.51 - 19.76 19.76 - 100.00 Social Studies 30-2 Acceptable Standard 0.00 - 71.97 71.97 - 79.85 79.85 - 87.56 87.56 - 91.42 91.42 - 100.00
Standard of Excellence 0.00 - 3.94 3.94 - 8.65 8.65 - 14.07 14.07 - 23.34 23.34 - 100.00 Biology 30 Acceptable Standard 0.00 - 68.26 68.26 - 79.41 79.41 - 85.59 85.59 - 92.33 92.33 - 100.00
Standard of Excellence 0.00 - 10.75 10.75 - 21.84 21.84 - 29.26 29.26 - 33.42 33.42 - 100.00 Chemistry 30 Acceptable Standard 0.00 - 58.10 58.10 - 69.51 69.51 - 80.34 80.34 - 84.74 84.74 - 100.00
Standard of Excellence 0.00 - 11.22 11.22 - 20.47 20.47 - 30.47 30.47 - 35.07 35.07 - 100.00 Physics 30 Acceptable Standard 0.00 - 50.06 50.06 - 71.77 71.77 - 83.00 83.00 - 88.67 88.67 - 100.00
Standard of Excellence 0.00 - 5.61 5.61 - 18.10 18.10 - 31.88 31.88 - 41.10 41.10 - 100.00 Science 30 Acceptable Standard 0.00 - 64.19 64.19 - 77.66 77.66 - 86.33 86.33 - 98.50 98.50 - 100.00
Standard of Excellence 0.00 - 0.00 0.00 - 14.69 14.69 - 25.03 25.03 - 38.93 38.93 - 100.00 Notes: 1. The range of values at each evaluation level is interpreted as greater than or equal to the lower value, and less than the higher value. For
the Very High evaluation level, values range from greater than or equal to the lower value to 100%. 2. Achievement Evaluation is not calculated for courses that do not have sufficient data available, either due to too few jurisdictions offering
the course or because of changes in examinations. Improvement Table For each jurisdiction, improvement evaluation consists of comparing the Current Year result for each measure with the previous three-year average. A chi-square statistical test is used to determine the significance of the improvement. This test takes into account the size of the jurisdiction in the calculation to make improvement evaluation fair across jurisdictions of different sizes. The table below shows the definition of the 5 improvement evaluation levels based upon the chi-square result.
Evaluation Category Chi-Square Range Declined Significantly 3.84 + (current < previous 3-year average) Declined 1.00 - 3.83 (current < previous 3-year average) Maintained less than 1.00 Improved 1.00 - 3.83 (current > previous 3-year average) Improved Significantly 3.84 + (current > previous 3-year average) Overall Evaluation Table The overall evaluation combines the Achievement Evaluation and the Improvement Evaluation. The table below illustrates how the Achievement and Improvement evaluations are combined to get the overall evaluation.
Achievement Very High High Intermediate Low Very Low Improved Significantly Excellent Good Good Good Acceptable Improved Excellent Good Good Acceptable Issue Maintained Excellent Good Acceptable Issue Concern Declined Good Acceptable Issue Issue Concern Declined Significantly Acceptable Issue Issue Concern Concern
Foothills School Division No. 38
Page 13
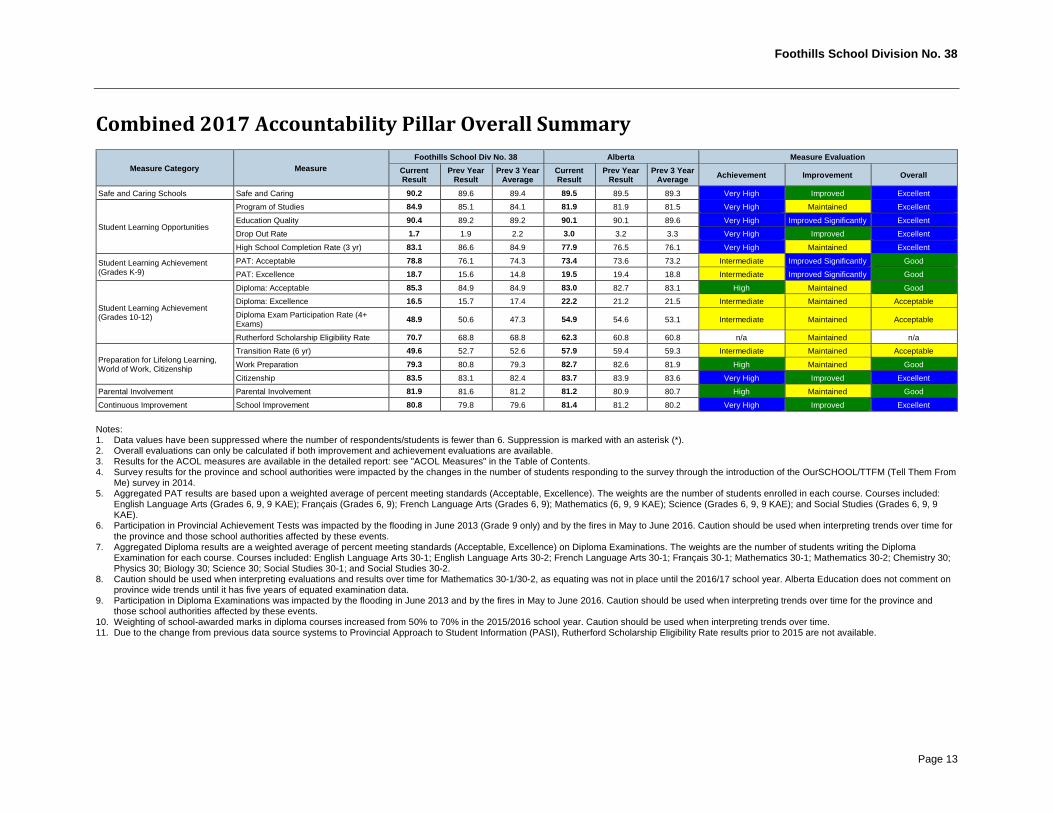
Combined 2017 Accountability Pillar Overall Summary
Measure Category Measure Foothills School Div No. 38 Alberta Measure Evaluation
Current Result Prev Year
Result Prev 3 Year Average Current
Result Prev Year Result Prev 3 Year
Average Achievement Improvement Overall Safe and Caring Schools Safe and Caring 90.2 89.6 89.4 89.5 89.5 89.3 Very High Improved Excellent
Student Learning Opportunities Program of Studies 84.9 85.1 84.1 81.9 81.9 81.5 Very High Maintained Excellent Education Quality 90.4 89.2 89.2 90.1 90.1 89.6 Very High Improved Significantly Excellent Drop Out Rate 1.7 1.9 2.2 3.0 3.2 3.3 Very High Improved Excellent High School Completion Rate (3 yr) 83.1 86.6 84.9 77.9 76.5 76.1 Very High Maintained Excellent
Student Learning Achievement (Grades K-9)
PAT: Acceptable 78.8 76.1 74.3 73.4 73.6 73.2 Intermediate Improved Significantly Good PAT: Excellence 18.7 15.6 14.8 19.5 19.4 18.8 Intermediate Improved Significantly Good
Student Learning Achievement (Grades 10-12)
Diploma: Acceptable 85.3 84.9 84.9 83.0 82.7 83.1 High Maintained Good Diploma: Excellence 16.5 15.7 17.4 22.2 21.2 21.5 Intermediate Maintained Acceptable Diploma Exam Participation Rate (4+ Exams) 48.9 50.6 47.3 54.9 54.6 53.1 Intermediate Maintained Acceptable Rutherford Scholarship Eligibility Rate 70.7 68.8 68.8 62.3 60.8 60.8 n/a Maintained n/a
Preparation for Lifelong Learning, World of Work, Citizenship
Transition Rate (6 yr) 49.6 52.7 52.6 57.9 59.4 59.3 Intermediate Maintained Acceptable Work Preparation 79.3 80.8 79.3 82.7 82.6 81.9 High Maintained Good Citizenship 83.5 83.1 82.4 83.7 83.9 83.6 Very High Improved Excellent
Parental Involvement Parental Involvement 81.9 81.6 81.2 81.2 80.9 80.7 High Maintained Good Continuous Improvement School Improvement 80.8 79.8 79.6 81.4 81.2 80.2 Very High Improved Excellent Notes: 1. Data values have been suppressed where the number of respondents/students is fewer than 6. Suppression is marked with an asterisk (*). 2. Overall evaluations can only be calculated if both improvement and achievement evaluations are available. 3. Results for the ACOL measures are available in the detailed report: see "ACOL Measures" in the Table of Contents. 4. Survey results for the province and school authorities were impacted by the changes in the number of students responding to the survey through the introduction of the OurSCHOOL/TTFM (Tell Them From
Me) survey in 2014. 5. Aggregated PAT results are based upon a weighted average of percent meeting standards (Acceptable, Excellence). The weights are the number of students enrolled in each course. Courses included:
English Language Arts (Grades 6, 9, 9 KAE); Français (Grades 6, 9); French Language Arts (Grades 6, 9); Mathematics (6, 9, 9 KAE); Science (Grades 6, 9, 9 KAE); and Social Studies (Grades 6, 9, 9 KAE).
6. Participation in Provincial Achievement Tests was impacted by the flooding in June 2013 (Grade 9 only) and by the fires in May to June 2016. Caution should be used when interpreting trends over time for the province and those school authorities affected by these events.
7. Aggregated Diploma results are a weighted average of percent meeting standards (Acceptable, Excellence) on Diploma Examinations. The weights are the number of students writing the Diploma Examination for each course. Courses included: English Language Arts 30-1; English Language Arts 30-2; French Language Arts 30-1; Français 30-1; Mathematics 30-1; Mathematics 30-2; Chemistry 30; Physics 30; Biology 30; Science 30; Social Studies 30-1; and Social Studies 30-2.
8. Caution should be used when interpreting evaluations and results over time for Mathematics 30-1/30-2, as equating was not in place until the 2016/17 school year. Alberta Education does not comment on province wide trends until it has five years of equated examination data.
9. Participation in Diploma Examinations was impacted by the flooding in June 2013 and by the fires in May to June 2016. Caution should be used when interpreting trends over time for the province and those school authorities affected by these events.
10. Weighting of school-awarded marks in diploma courses increased from 50% to 70% in the 2015/2016 school year. Caution should be used when interpreting trends over time. 11. Due to the change from previous data source systems to Provincial Approach to Student Information (PASI), Rutherford Scholarship Eligibility Rate results prior to 2015 are not available.
Foothills School Division No. 38
Page 14
Foothills School Division (FSD) has continued to show growth and improvement in a number of key areas in provincial Accountability Pillar measures. FSD exceeds the provincial average in 9/16 of the key measures. Of particular note is our low drop rate and our High School Completion rate. These two measures are two of the most important factors for life long success for students. We continue to see significant growth in Provincial Achievement Test (PAT) achievement rates in the acceptable category (78.8%) exceeding provincial rates, as well as an increase in our Diploma Acceptable rate (85.3%), again exceeding provincial averages. FSD continues to be well above provincial rates of students attaining Rutherford Scholarship at 70.7 %. One of our key goals and focus has been on ensuring each student, their parents and teachers feel that FSD provides safe, caring schools, we are pleased that we have achieved a very high result of 90.2%. Foothills School Division continues to ensure that we offer high quality educational opportunities and program of studies, both of these measure exceed provincial rates. We continue to see a key area of improvement to be students that attain a level of excellence both in the PAT and Diploma Exams. We believe that a continued and focused emphasis on literacy and numeracy, and a focus on quality instructional practices will support an increase in this category. In addition, we are continuing to build the capacity of our teachers to design learning that provides students with opportunities for achieving personal excellence.
Strategies • Support the capacity of schools to leverage data informed decision making to improve levels of
excellence. Identify and organize key leading data in benchmark, diagnostic and progress monitoring assessments to inform instruction and intervention as well as classroom-based assessments that allow the opportunity for Mastery.
• Support a collaborative learning culture through Professional Learning Communities (PLCs) where classroom teachers focus on student data to inform teaching and instructional design for student competencies as outlined in the Ministerial Order on Student Learning (https://education.alberta.ca/department/policy/standards/goals.aspx). A baseline survey administered in June to every teaching staff indicates that teachers feel a collaborative culture of planning together is being built. School leaders are given ongoing support and learning on how to continue to build collaborative systems and structures in their building to support student success in all areas.
• School Improvement plans for each school have been streamlined to focus on two to three key goals that align with board and division priorities and goals.
• A Support Team has been assigned to each school. This team consists of one superintendent and at least one member of District Learning Services team. This team meets with school administration at least once every 5 weeks to discuss school improvement and growth and to provide timely and continued support to school teams. This work is in partnership with the University of Lethbridge and two other school divisions across Alberta, as a result of a grant from Alberta Education Research Branch. This work focuses on building the capacity of school and system leaders to build readiness for the implementation of the new Draft Standards for School and System Leaders that will be regulated in all Alberta schools.
Foothills School Division No. 38
Page 15
• All schools are continuing to build on and ensure that they have a strong continuum of support in their schools. This starts with a strong universal approach to instruction in every classroom, intervention supports for students that require targeted or individualized instruction, particularly in literacy and numeracy. In ensuring we are meeting the needs of the whole child, every school is focusing on an evidence based approach to positive behaviour supports and/or social emotional learning. They are also building strong intervention teams that partner closely with families and outside agencies, should students require ongoing support for their social emotional or behavioural needs.
• Foothills School Division has implemented across all applicable schools, benchmark assessments
for reading for Grades K-9. We wanted to ensure that every child that might be flagged as struggling with the reading process is provided further attention and or diagnostic assessment to target specific instruction to any part of the reading process. We continue to implement Levelled Literacy Intervention and other interventions to ensure students have the literacy skills to be successful in high school.
• Develop instructional leaders’ understanding of universal strategies for literacy such as comprehensive approach to literacy, gradual release of responsibility, content area literacy and disciplinary literacy.
• To ensure success in high school and improve our successful high school completion rates all
High schools are focusing on the pillars of High School Redesign. Schools are looking deeply at assessment practices that improve learning outcomes for students and continue to design flexible learning that meeting the needs of a diverse student population. We see continued growth of distributed learning opportunities such as HUB and Summer School so that students have a variety of avenues to complete and excel in high school courses.
• Action Research is in its third and final year of understanding how to design and assess competencies to improve academic achievement and intellectual engagement.
• Foothills School Division supports Learning Coaches and Instructional Coaches in every school to support student learning and interventions. These coaches are learning to implement the student-centered coaching model to better support learning in the classroom. Student centered coaching focuses on putting student learning at the center and using data and evidence to help teachers make informed decision around instruction. Our Instructional Coaches work closely with teachers in designing learning using strong universal approaches
• Learning Coaches work to support and implement intervention systems for students that require more support. Coaches also support teachers in meeting the diverse needs of students in their classrooms.
• Progressive Discipline Continuum for each school have been developed to support schools in a common understanding of positive behavior supports. A continued emphasis and capacity building on using tools such as Restorative Practice, Positive Behaviour Supports, Social Emotional Learning and Mentorship to support a safe and caring school environment. FSD continues to see a decline in Out of School Suspensions as we implement these approaches division wide.
Foothills School Division No. 38
Page 16
• Through the work of a French Immersion Facilitator/Instructional Coach, we are ensuring targeted, cross school collaborative capacity building around our French Immersion programming. French Immersion teachers have regular access to high quality professional development opportunities.
• We are building the foundational knowledge and understanding of all staff in the area of First
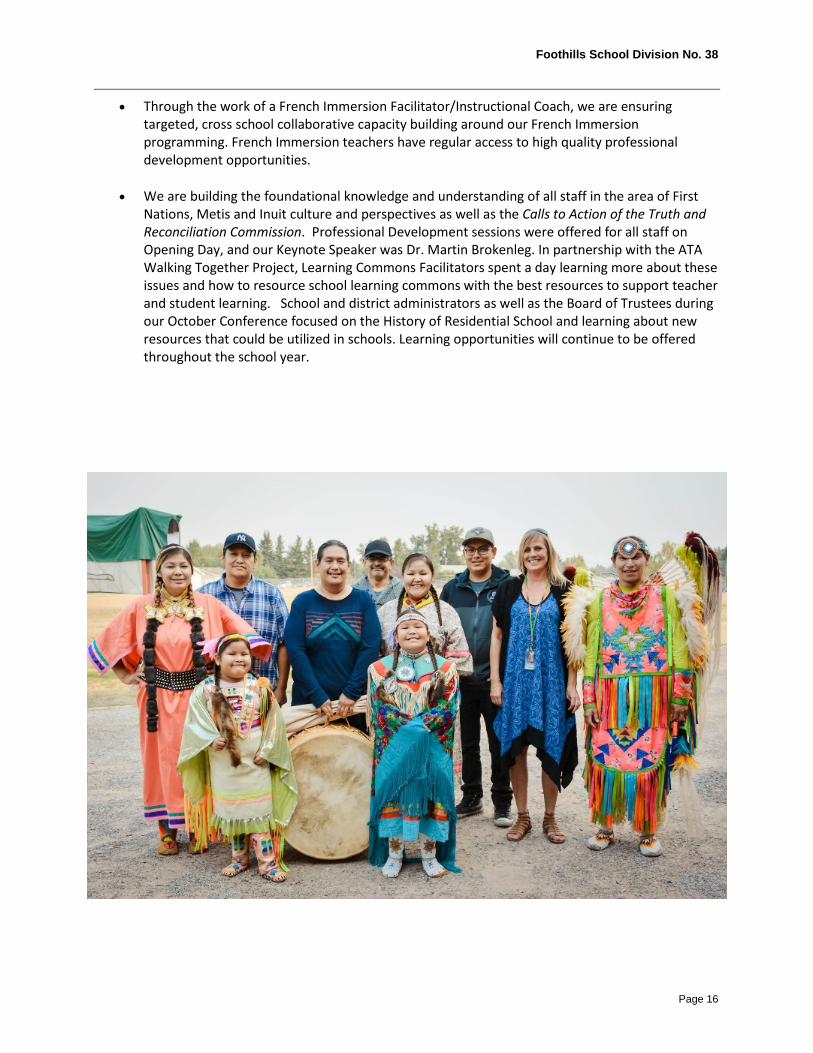
Nations, Metis and Inuit culture and perspectives as well as the Calls to Action of the Truth and Reconciliation Commission. Professional Development sessions were offered for all staff on Opening Day, and our Keynote Speaker was Dr. Martin Brokenleg. In partnership with the ATA Walking Together Project, Learning Commons Facilitators spent a day learning more about these issues and how to resource school learning commons with the best resources to support teacher and student learning. School and district administrators as well as the Board of Trustees during our October Conference focused on the History of Residential School and learning about new resources that could be utilized in schools. Learning opportunities will continue to be offered throughout the school year.
Foothills School Division No. 38
Page 17
Outcome One: Alberta’s students are successful
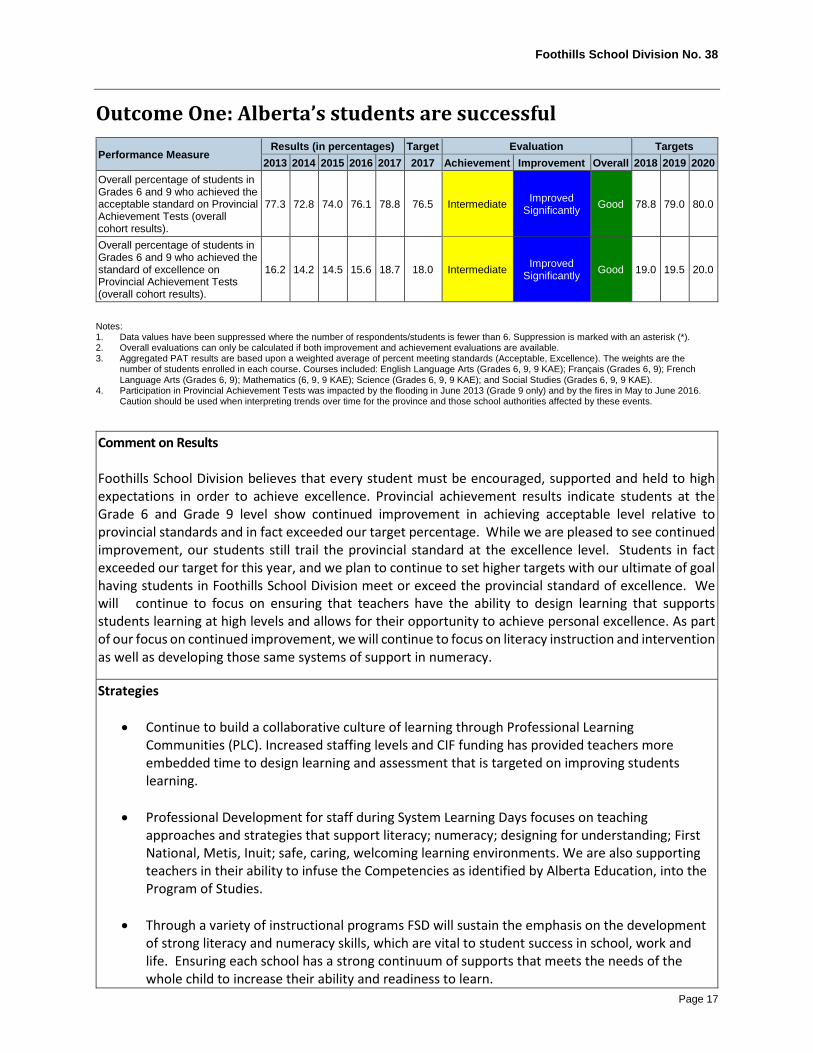
Performance Measure Results (in percentages) Target Evaluation Targets 2013 2014 2015 2016 2017 2017 Achievement Improvement Overall 2018 2019 2020
Overall percentage of students in Grades 6 and 9 who achieved the acceptable standard on Provincial Achievement Tests (overall cohort results).
77.3 72.8 74.0 76.1 78.8 76.5 Intermediate Improved Significantly Good 78.8 79.0 80.0
Overall percentage of students in Grades 6 and 9 who achieved the standard of excellence on Provincial Achievement Tests (overall cohort results).
16.2 14.2 14.5 15.6 18.7 18.0 Intermediate Improved Significantly Good 19.0 19.5 20.0
Notes: 1. Data values have been suppressed where the number of respondents/students is fewer than 6. Suppression is marked with an asterisk (*). 2. Overall evaluations can only be calculated if both improvement and achievement evaluations are available. 3. Aggregated PAT results are based upon a weighted average of percent meeting standards (Acceptable, Excellence). The weights are the
number of students enrolled in each course. Courses included: English Language Arts (Grades 6, 9, 9 KAE); Français (Grades 6, 9); French Language Arts (Grades 6, 9); Mathematics (6, 9, 9 KAE); Science (Grades 6, 9, 9 KAE); and Social Studies (Grades 6, 9, 9 KAE).
4. Participation in Provincial Achievement Tests was impacted by the flooding in June 2013 (Grade 9 only) and by the fires in May to June 2016. Caution should be used when interpreting trends over time for the province and those school authorities affected by these events.
Comment on Results Foothills School Division believes that every student must be encouraged, supported and held to high expectations in order to achieve excellence. Provincial achievement results indicate students at the Grade 6 and Grade 9 level show continued improvement in achieving acceptable level relative to provincial standards and in fact exceeded our target percentage. While we are pleased to see continued improvement, our students still trail the provincial standard at the excellence level. Students in fact exceeded our target for this year, and we plan to continue to set higher targets with our ultimate of goal having students in Foothills School Division meet or exceed the provincial standard of excellence. We will continue to focus on ensuring that teachers have the ability to design learning that supports students learning at high levels and allows for their opportunity to achieve personal excellence. As part of our focus on continued improvement, we will continue to focus on literacy instruction and intervention as well as developing those same systems of support in numeracy.
Strategies • Continue to build a collaborative culture of learning through Professional Learning
Communities (PLC). Increased staffing levels and CIF funding has provided teachers more embedded time to design learning and assessment that is targeted on improving students learning.
• Professional Development for staff during System Learning Days focuses on teaching approaches and strategies that support literacy; numeracy; designing for understanding; First National, Metis, Inuit; safe, caring, welcoming learning environments. We are also supporting teachers in their ability to infuse the Competencies as identified by Alberta Education, into the Program of Studies.
• Through a variety of instructional programs FSD will sustain the emphasis on the development of strong literacy and numeracy skills, which are vital to student success in school, work and life. Ensuring each school has a strong continuum of supports that meets the needs of the whole child to increase their ability and readiness to learn.
Foothills School Division No. 38
Page 18
• In the area of Numeracy, we are continuing to develop and pilot common pre-assessments for
elementary mathematics to identify student needs. Continue to build capacity in high yield strategies for effective mathematics instruction K-12.
• Build the capacity of Instructional Coaches in the area of numeracy instruction so that they can provide modelling and support for classroom teachers.
• Collect and examples of numeracy design plans across the content areas and explicitly align them to the provincial numeracy benchmarks. These will be posted on Teacher Portfolio to ensure all teachers have access to them.
• Continue to build assessment, grading and reporting capacity through our reporting software pilot. Presently there are 10 schools in the pilot program focusing on using Maplewood software to report student achievement and construct Learner Profiles. Kindergarten Assessment Advisory Committee established to review and make recommendations about effective assessment practices, reporting and communicating learning to parents of children in kindergarten
• District Benchmark Assessments - The Reading Readiness Screening Tool will be administered to all students early in grade one so that targeted interventions are put in place for the development of identified components of reading. District wide use of literacy benchmark assessment GRADE for grades 2-9 to flag students for further diagnostic assessment and intervention was implanted this year. Data will continue to be collected to measure impact of instruction and interventions.
• Use of diagnostic assessments for reading to determine where the reading process is breaking down and identify next steps. The Fountas and Pinnell Levelled Literacy Intervention Program is now being implemented throughout the division to support reading intervention for students that are struggling.
• Systems and structures for organizing and analyzing benchmark and diagnostic data for reading to ensure data is leading to action and intervention. Development of an FSD Reading Intervention Continuum document has been completed. Strategies to support reading at the universal, targeted and individualized level are supported by Learning Coaches and Instructional Coaches division wide.
• Implementation of the Early Years Evaluation-Teacher Assessment (EYE-TA) tool, district wide,
provides early identification of developmental areas requiring attention in kindergarten students that both teachers and parents can support through intervention and growth.
• As school attendance is critical to student success, we have developed an Attendance Toolkit
highlighting universal supports, diagnostic tools to determine function of behaviour, targeted interventions and attendance improvement plans. The effectiveness of this strategy will be determined through attendance data in June 2017.
Foothills School Division No. 38
Page 19
Outcome One: Alberta’s students are successful (continued)
Performance Measure Results (in percentages) Target Evaluation Targets 2013 2014 2015 2016 2017 2017 Achievement Improvement Overall 2018 2019 2020
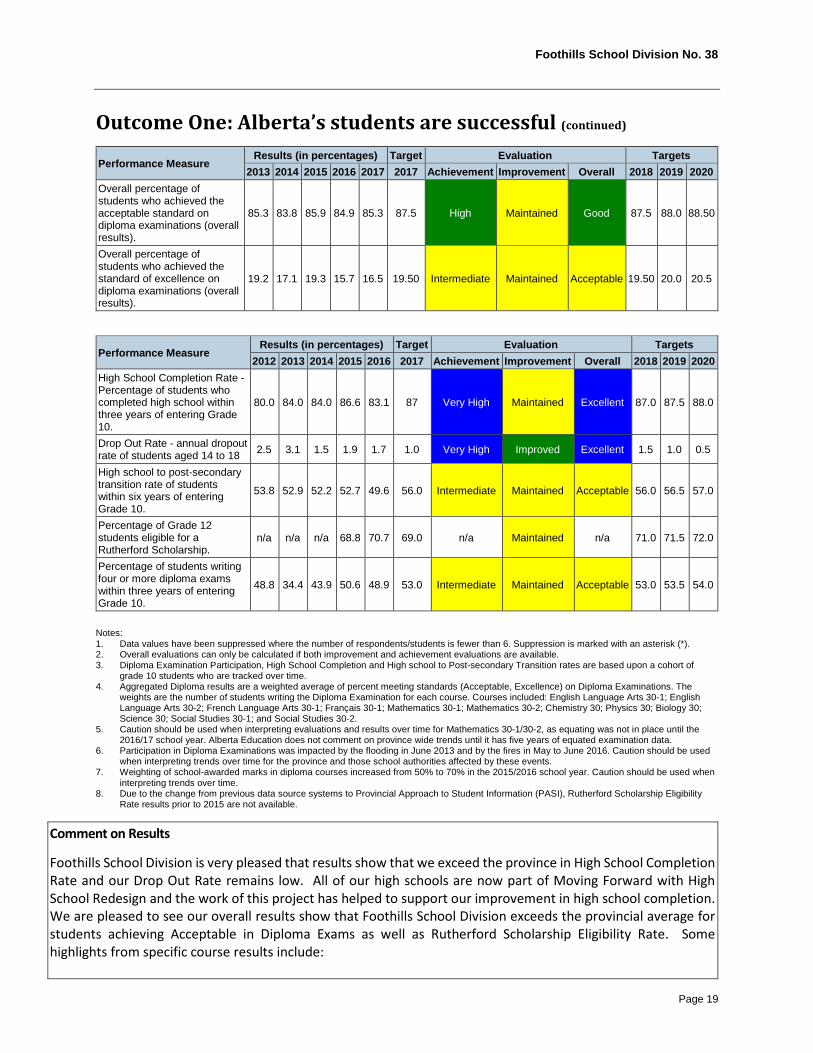
Overall percentage of students who achieved the acceptable standard on diploma examinations (overall results).
85.3 83.8 85.9 84.9 85.3 87.5 High Maintained Good 87.5 88.0 88.50
Overall percentage of students who achieved the standard of excellence on diploma examinations (overall results).
19.2 17.1 19.3 15.7 16.5 19.50 Intermediate Maintained Acceptable 19.50 20.0 20.5
Performance Measure Results (in percentages) Target Evaluation Targets 2012 2013 2014 2015 2016 2017 Achievement Improvement Overall 2018 2019 2020
High School Completion Rate - Percentage of students who completed high school within three years of entering Grade 10.
80.0 84.0 84.0 86.6 83.1 87 Very High Maintained Excellent 87.0 87.5 88.0
Drop Out Rate - annual dropout rate of students aged 14 to 18 2.5 3.1 1.5 1.9 1.7 1.0 Very High Improved Excellent 1.5 1.0 0.5
High school to post-secondary transition rate of students within six years of entering Grade 10.
53.8 52.9 52.2 52.7 49.6 56.0 Intermediate Maintained Acceptable 56.0 56.5 57.0
Percentage of Grade 12 students eligible for a Rutherford Scholarship.
n/a n/a n/a 68.8 70.7 69.0 n/a Maintained n/a 71.0 71.5 72.0
Percentage of students writing four or more diploma exams within three years of entering Grade 10.
48.8 34.4 43.9 50.6 48.9 53.0 Intermediate Maintained Acceptable 53.0 53.5 54.0
Notes: 1. Data values have been suppressed where the number of respondents/students is fewer than 6. Suppression is marked with an asterisk (*). 2. Overall evaluations can only be calculated if both improvement and achievement evaluations are available. 3. Diploma Examination Participation, High School Completion and High school to Post-secondary Transition rates are based upon a cohort of
grade 10 students who are tracked over time. 4. Aggregated Diploma results are a weighted average of percent meeting standards (Acceptable, Excellence) on Diploma Examinations. The
weights are the number of students writing the Diploma Examination for each course. Courses included: English Language Arts 30-1; English Language Arts 30-2; French Language Arts 30-1; Français 30-1; Mathematics 30-1; Mathematics 30-2; Chemistry 30; Physics 30; Biology 30; Science 30; Social Studies 30-1; and Social Studies 30-2.
5. Caution should be used when interpreting evaluations and results over time for Mathematics 30-1/30-2, as equating was not in place until the 2016/17 school year. Alberta Education does not comment on province wide trends until it has five years of equated examination data.
6. Participation in Diploma Examinations was impacted by the flooding in June 2013 and by the fires in May to June 2016. Caution should be used when interpreting trends over time for the province and those school authorities affected by these events.
7. Weighting of school-awarded marks in diploma courses increased from 50% to 70% in the 2015/2016 school year. Caution should be used when interpreting trends over time.
8. Due to the change from previous data source systems to Provincial Approach to Student Information (PASI), Rutherford Scholarship Eligibility Rate results prior to 2015 are not available.
Comment on Results
Foothills School Division is very pleased that results show that we exceed the province in High School Completion Rate and our Drop Out Rate remains low. All of our high schools are now part of Moving Forward with High School Redesign and the work of this project has helped to support our improvement in high school completion. We are pleased to see our overall results show that Foothills School Division exceeds the provincial average for students achieving Acceptable in Diploma Exams as well as Rutherford Scholarship Eligibility Rate. Some highlights from specific course results include:
Foothills School Division No. 38
Page 20
• English Language Arts 30-1 (FSD 90%; Prov. 86.5%) and English Language Arts 30-2 (FSD 78.7%; Prov 74.7%) surpassed the provincial average at the acceptable level and were slightly below the province in the excellence category.
• Mathematics 30-2 surpassed the provincial average at both the acceptable level (FSD 95.5%; Prov. 89.5%) and excellence level (FSD 12.7%; Prov.11.4%)
• Social Studies 30-1 and 30-2 exceeded provincial average in acceptable. Social Students 30-2 exceeded the provincial average in the excellence category.
• Chemistry 30 continues to improve in the acceptable category exceeding the province (FSD 86.2%; Prov. 83.1%)
• We continue to be looking for improvement in both Math 30-1 (FSD 70%; Prov. 73.1%) and in Physics (FSD 69.6%; Prov. 85.4%)
One of our areas of focus for this year was that more students would be achieving Excellence in Diploma Exams. We have seen an increase in some courses, however, we continue to lag behind the provincial excellence rates. We will continue to support teachers in designing instruction that challenges students to achieve personal excellence.
Strategies
• All high schools in Foothills School Division are Moving Forward with High School Redesign and are focusing on the foundational principle of assessment while continuing to monitor and refine structures for flexibility and personalization of learning.
• Continue to build a collaborative culture of learning through Professional Learning Communities (PLC). Increased staffing levels and CIF funding has provided teachers more embedded time to design learning and assessment that is targeted on improving students learning. Instructional Coaches and Administrators are supporting the growth of Professional Learning Communities within high schools to support teachers in improving outcomes in student learning.
• Professional Development for staff during System Learning Days focuses on teaching approaches and strategies that support literacy; numeracy; designing for understanding; First National, Metis, Inuit; safe, caring, welcoming learning environments. We are also supporting teachers in their ability to infuse the Competencies as identified by Alberta Education, into the Program of Studies.
• High School Administrators meet regularly in Administrators PLC or during High School Administrators meetings to share best practice and support each school in achieving the outcomes of High School Redesign.
• Schools are developing better structures to support students in their mental health, wellbeing and behavioural needs. Success coaches, learning coaches and counsellors are providing programming such as mental health literacy; Fourth R – Healthy Relationships; Mindfulness and dealing with anxiety and depression at the universal, targeted and individualized level.
Foothills School Division No. 38
Page 21
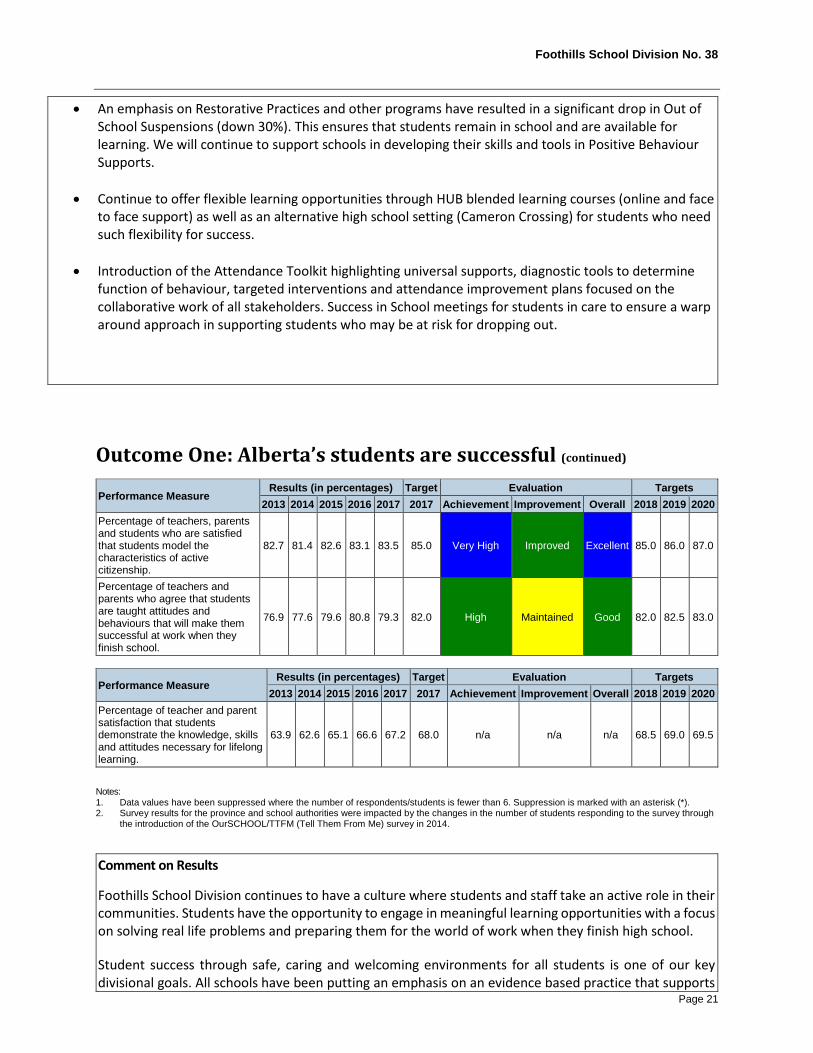
• An emphasis on Restorative Practices and other programs have resulted in a significant drop in Out of School Suspensions (down 30%). This ensures that students remain in school and are available for learning. We will continue to support schools in developing their skills and tools in Positive Behaviour Supports.
• Continue to offer flexible learning opportunities through HUB blended learning courses (online and face
to face support) as well as an alternative high school setting (Cameron Crossing) for students who need such flexibility for success.
• Introduction of the Attendance Toolkit highlighting universal supports, diagnostic tools to determine function of behaviour, targeted interventions and attendance improvement plans focused on the collaborative work of all stakeholders. Success in School meetings for students in care to ensure a warp around approach in supporting students who may be at risk for dropping out.
Outcome One: Alberta’s students are successful (continued)
Performance Measure Results (in percentages) Target Evaluation Targets 2013 2014 2015 2016 2017 2017 Achievement Improvement Overall 2018 2019 2020
Percentage of teachers, parents and students who are satisfied that students model the characteristics of active citizenship.
82.7 81.4 82.6 83.1 83.5 85.0 Very High Improved Excellent 85.0 86.0 87.0
Percentage of teachers and parents who agree that students are taught attitudes and behaviours that will make them successful at work when they finish school.
76.9 77.6 79.6 80.8 79.3 82.0 High Maintained Good 82.0 82.5 83.0
Performance Measure Results (in percentages) Target Evaluation Targets 2013 2014 2015 2016 2017 2017 Achievement Improvement Overall 2018 2019 2020
Percentage of teacher and parent satisfaction that students demonstrate the knowledge, skills and attitudes necessary for lifelong learning.
63.9 62.6 65.1 66.6 67.2 68.0 n/a n/a n/a 68.5 69.0 69.5
Notes: 1. Data values have been suppressed where the number of respondents/students is fewer than 6. Suppression is marked with an asterisk (*). 2. Survey results for the province and school authorities were impacted by the changes in the number of students responding to the survey through
the introduction of the OurSCHOOL/TTFM (Tell Them From Me) survey in 2014.
Comment on Results Foothills School Division continues to have a culture where students and staff take an active role in their communities. Students have the opportunity to engage in meaningful learning opportunities with a focus on solving real life problems and preparing them for the world of work when they finish high school.
Student success through safe, caring and welcoming environments for all students is one of our key divisional goals. All schools have been putting an emphasis on an evidence based practice that supports
Foothills School Division No. 38
Page 22
the growth of the whole child. As part of our Comprehensive School Health work each school is building their capacity in implementing an evidence based practice such as Restorative Practice, Social Emotional Learning, Positive Behaviour Supports, Trauma Informed Practice or Mentorship. Schools have fully implemented a Student Code of Conduct and a Progressive Discipline Continuum to ensure that all students feel safe and are supported in developing behaviours and attitudes that support their readiness and ability to learn.
We continue to support, through professional development and the work of the Learning Services team, a focus on competencies and curriculum in all grade levels. All schools have aligned their school’s goals to meet the divisional goal that students will be the skills, knowledge and attitudes that so that they may achieve personal excellence.
Strategies
• Strategic focus on safe, caring, welcoming and inclusive schools that include concentrating on the competencies that support student success.
• Each school has chosen an evidence based practice in supporting safe and caring schools, is provided with professional development around that evidence based practice and has engaged in strategic planning in the implementation of it within their schools which is evidence in their Education Plans.
• All school administrators and Family School Liaison Counsellors have received training in Restorative Justice Practices to support culture building at each school.
• Strategic focus on designing learning to ensure students have the necessary competencies to be successful citizens who are prepared for the world of work.
• Ensure all schools have the capacity to deliver the new CTF/CTS curriculum to ensure students demonstrate and understanding of the opportunities in the world of work and or post-secondary that they might explore upon completion of high school.
• A district wide Student Advisory Committee (Students’ Matters) meets at least twice a year to provide advice and input in the direction and programs offered in Foothills School Division.
• Ensuring learning is designed so it is relevant, deepens understanding, and supports a culture of thinking. Through the Board of Trustees CPIP Grant, 25 teachers are taking courses from Harvard University, Creating Cultures of Thinking and Making Thinking Visible. The strategies and approaches that they implement in their classrooms will be shared division wide.
Foothills School Division No. 38
Page 23
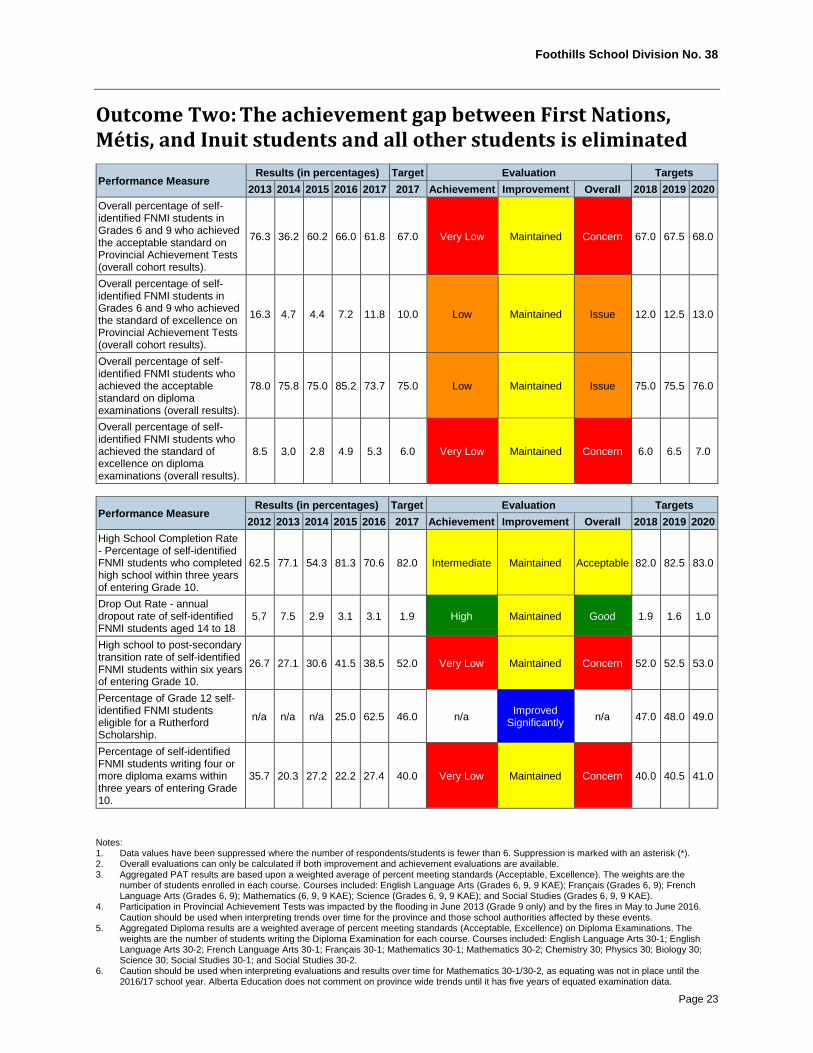
Outcome Two: The achievement gap between First Nations, Métis, and Inuit students and all other students is eliminated
Performance Measure Results (in percentages) Target Evaluation Targets 2013 2014 2015 2016 2017 2017 Achievement Improvement Overall 2018 2019 2020
Overall percentage of self-identified FNMI students in Grades 6 and 9 who achieved the acceptable standard on Provincial Achievement Tests (overall cohort results).
76.3 36.2 60.2 66.0 61.8 67.0 Very Low Maintained Concern 67.0 67.5 68.0
Overall percentage of self-identified FNMI students in Grades 6 and 9 who achieved the standard of excellence on Provincial Achievement Tests (overall cohort results).
16.3 4.7 4.4 7.2 11.8 10.0 Low Maintained Issue 12.0 12.5 13.0
Overall percentage of self-identified FNMI students who achieved the acceptable standard on diploma examinations (overall results).
78.0 75.8 75.0 85.2 73.7 75.0 Low Maintained Issue 75.0 75.5 76.0
Overall percentage of self-identified FNMI students who achieved the standard of excellence on diploma examinations (overall results).
8.5 3.0 2.8 4.9 5.3 6.0 Very Low Maintained Concern 6.0 6.5 7.0
Performance Measure Results (in percentages) Target Evaluation Targets 2012 2013 2014 2015 2016 2017 Achievement Improvement Overall 2018 2019 2020
High School Completion Rate - Percentage of self-identified FNMI students who completed high school within three years of entering Grade 10.
62.5 77.1 54.3 81.3 70.6 82.0 Intermediate Maintained Acceptable 82.0 82.5 83.0
Drop Out Rate - annual dropout rate of self-identified FNMI students aged 14 to 18
5.7 7.5 2.9 3.1 3.1 1.9 High Maintained Good 1.9 1.6 1.0
High school to post-secondary transition rate of self-identified FNMI students within six years of entering Grade 10.
26.7 27.1 30.6 41.5 38.5 52.0 Very Low Maintained Concern 52.0 52.5 53.0
Percentage of Grade 12 self-identified FNMI students eligible for a Rutherford Scholarship.
n/a n/a n/a 25.0 62.5 46.0 n/a Improved Significantly n/a 47.0 48.0 49.0
Percentage of self-identified FNMI students writing four or more diploma exams within three years of entering Grade 10.
35.7 20.3 27.2 22.2 27.4 40.0 Very Low Maintained Concern 40.0 40.5 41.0
Notes: 1. Data values have been suppressed where the number of respondents/students is fewer than 6. Suppression is marked with an asterisk (*). 2. Overall evaluations can only be calculated if both improvement and achievement evaluations are available. 3. Aggregated PAT results are based upon a weighted average of percent meeting standards (Acceptable, Excellence). The weights are the
number of students enrolled in each course. Courses included: English Language Arts (Grades 6, 9, 9 KAE); Français (Grades 6, 9); French Language Arts (Grades 6, 9); Mathematics (6, 9, 9 KAE); Science (Grades 6, 9, 9 KAE); and Social Studies (Grades 6, 9, 9 KAE).
4. Participation in Provincial Achievement Tests was impacted by the flooding in June 2013 (Grade 9 only) and by the fires in May to June 2016. Caution should be used when interpreting trends over time for the province and those school authorities affected by these events.
5. Aggregated Diploma results are a weighted average of percent meeting standards (Acceptable, Excellence) on Diploma Examinations. The weights are the number of students writing the Diploma Examination for each course. Courses included: English Language Arts 30-1; English Language Arts 30-2; French Language Arts 30-1; Français 30-1; Mathematics 30-1; Mathematics 30-2; Chemistry 30; Physics 30; Biology 30; Science 30; Social Studies 30-1; and Social Studies 30-2.
6. Caution should be used when interpreting evaluations and results over time for Mathematics 30-1/30-2, as equating was not in place until the 2016/17 school year. Alberta Education does not comment on province wide trends until it has five years of equated examination data.
Foothills School Division No. 38
Page 24
7. Participation in Diploma Examinations was impacted by the flooding in June 2013 and by the fires in May to June 2016. Caution should be used when interpreting trends over time for the province and those school authorities affected by these events.
8. Weighting of school-awarded marks in diploma courses increased from 50% to 70% in the 2015/2016 school year. Caution should be used when interpreting trends over time.
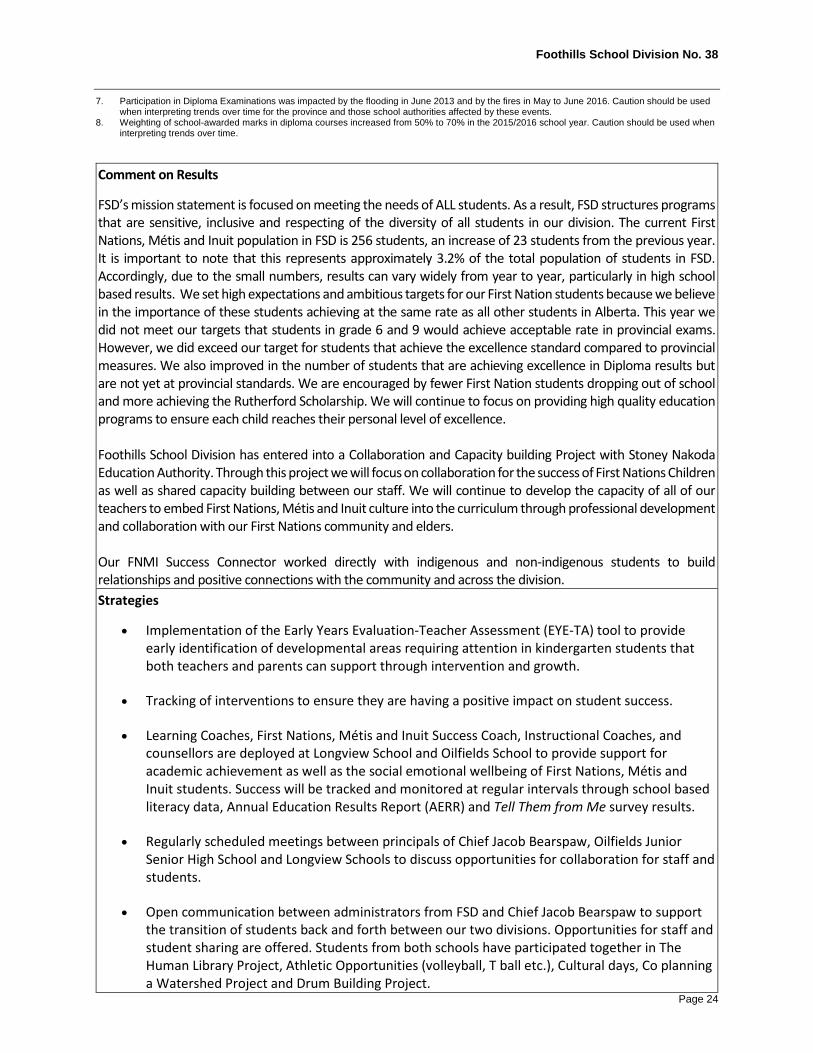
Comment on Results FSD’s mission statement is focused on meeting the needs of ALL students. As a result, FSD structures programs that are sensitive, inclusive and respecting of the diversity of all students in our division. The current First Nations, Métis and Inuit population in FSD is 256 students, an increase of 23 students from the previous year. It is important to note that this represents approximately 3.2% of the total population of students in FSD. Accordingly, due to the small numbers, results can vary widely from year to year, particularly in high school based results. We set high expectations and ambitious targets for our First Nation students because we believe in the importance of these students achieving at the same rate as all other students in Alberta. This year we did not meet our targets that students in grade 6 and 9 would achieve acceptable rate in provincial exams. However, we did exceed our target for students that achieve the excellence standard compared to provincial measures. We also improved in the number of students that are achieving excellence in Diploma results but are not yet at provincial standards. We are encouraged by fewer First Nation students dropping out of school and more achieving the Rutherford Scholarship. We will continue to focus on providing high quality education programs to ensure each child reaches their personal level of excellence. Foothills School Division has entered into a Collaboration and Capacity building Project with Stoney Nakoda Education Authority. Through this project we will focus on collaboration for the success of First Nations Children as well as shared capacity building between our staff. We will continue to develop the capacity of all of our teachers to embed First Nations, Métis and Inuit culture into the curriculum through professional development and collaboration with our First Nations community and elders. Our FNMI Success Connector worked directly with indigenous and non-indigenous students to build relationships and positive connections with the community and across the division. Strategies
• Implementation of the Early Years Evaluation-Teacher Assessment (EYE-TA) tool to provide early identification of developmental areas requiring attention in kindergarten students that both teachers and parents can support through intervention and growth.
• Tracking of interventions to ensure they are having a positive impact on student success.
• Learning Coaches, First Nations, Métis and Inuit Success Coach, Instructional Coaches, and counsellors are deployed at Longview School and Oilfields School to provide support for academic achievement as well as the social emotional wellbeing of First Nations, Métis and Inuit students. Success will be tracked and monitored at regular intervals through school based literacy data, Annual Education Results Report (AERR) and Tell Them from Me survey results.
• Regularly scheduled meetings between principals of Chief Jacob Bearspaw, Oilfields Junior Senior High School and Longview Schools to discuss opportunities for collaboration for staff and students.
• Open communication between administrators from FSD and Chief Jacob Bearspaw to support the transition of students back and forth between our two divisions. Opportunities for staff and student sharing are offered. Students from both schools have participated together in The Human Library Project, Athletic Opportunities (volleyball, T ball etc.), Cultural days, Co planning a Watershed Project and Drum Building Project.
Foothills School Division No. 38
Page 25
• Schools are required to create safe, caring, welcoming and inclusive environments, which are
respectful of culture, histories and diversity, and hold high expectations for the success of First Nations, Métis and Inuit students. All FSD administrators and Board of Trustees engaged in a one-day conference on learning more about the history of residential schools and resources to support the foundational knowledge of First Nations, culture, history and perspectives.
• Students from Oilfields High School under the guidance of our First Nations Success Coach are conducting Blanket Exercises at schools across the division.
• Learning Commons Facilitators are learning and working together to ensure our learning commons have culturally sensitive and important resources to support the foundation knowledge and understanding of First Nations, Metis Inuit perspectives and history for teachers and students.
• Attendance will be carefully tracked. School administrators and the Success Coach will follow up with absent students to help eliminate barriers that may cause a lack of attendance. Success Coach regularly communicates with parents to offer support in attendance matters.
• Schools with a First Nations, Métis and Inuit population are implementing a school-wide focus on literacy and numeracy for these students. Data is being tracked through benchmark assessments, learner profiles and AERR results.
• The division will provide flexibility in programming and course completion (e.g. course completion through the HUB, online and blended coursework) to support and improve the high school completion rate for First Nations, Métis and Inuit students. Student progress in these courses is tracked and monitored by teachers of HUB courses.
• Administrators and the First Nations, Métis and Inuit Success Coach will facilitate community engagement sessions to share data on student results and experiences. Feedback from parents, elders and community members will be collected and addressed.
• FSD will ensure that a continuum of supports is available to all students according to their needs in the areas of social-emotional learning, behaviour and academics. Success is tracked through school based data (literacy benchmarks and assessments, school based data, office referrals, etc.), and provincial test results.
• FSD will provide opportunities during system and school based learning days to build capacity on effectively embedding First Nations, Métis and Inuit content into courses. Opening Day in September focused on building relationships and community. The entire staff of Chief Jacob Bearspaw School attended our learning day. Opening keynote was Dr. Martin Brokenleg and sessions were offered by the ATA Walking Together Project leaders.
• Oilfields Junior Senior High School and Longview School are offering Stoney Language Clubs in partnership with elders from Eden Valley – Stoney Nakoda Nations.
Foothills School Division No. 38
Page 26
Outcome Three: Alberta’s education system is inclusive
Performance Measure Results (in percentages) Target Evaluation Targets 2013 2014 2015 2016 2017 2017 Achievement Improvement Overall 2018 2019 2020
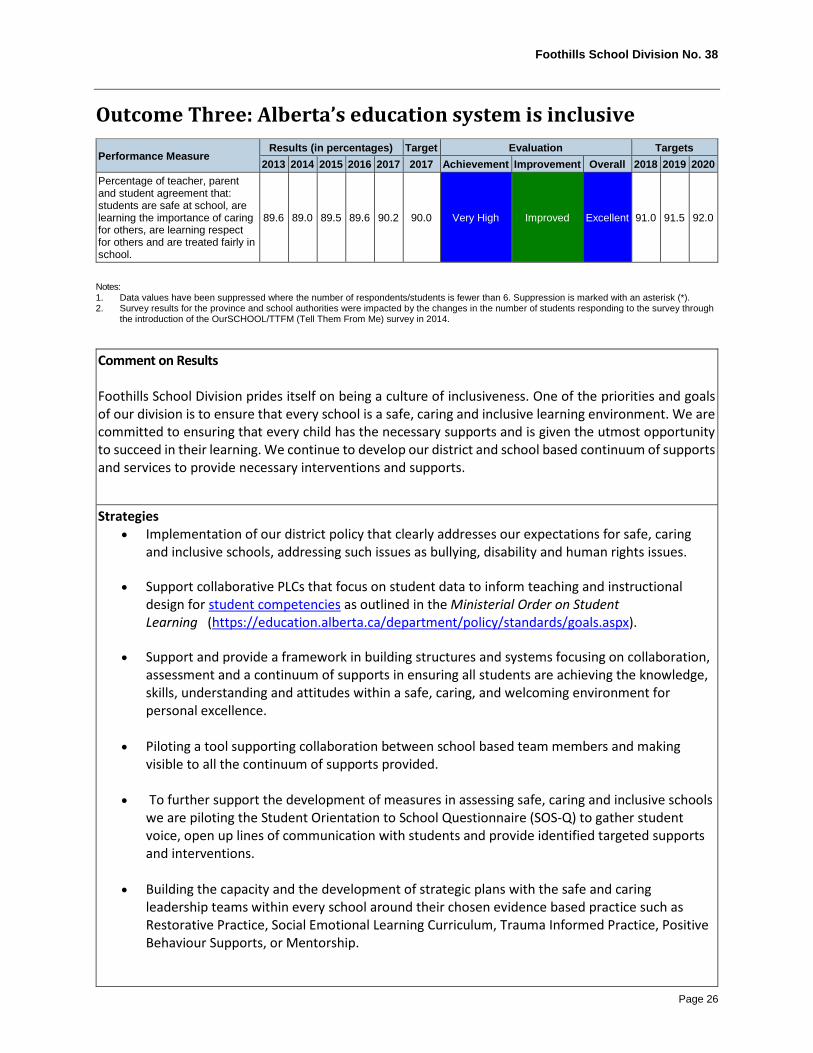
Percentage of teacher, parent and student agreement that: students are safe at school, are learning the importance of caring for others, are learning respect for others and are treated fairly in school.
89.6 89.0 89.5 89.6 90.2 90.0 Very High Improved Excellent 91.0 91.5 92.0
Notes: 1. Data values have been suppressed where the number of respondents/students is fewer than 6. Suppression is marked with an asterisk (*). 2. Survey results for the province and school authorities were impacted by the changes in the number of students responding to the survey through
the introduction of the OurSCHOOL/TTFM (Tell Them From Me) survey in 2014.
Comment on Results Foothills School Division prides itself on being a culture of inclusiveness. One of the priorities and goals of our division is to ensure that every school is a safe, caring and inclusive learning environment. We are committed to ensuring that every child has the necessary supports and is given the utmost opportunity to succeed in their learning. We continue to develop our district and school based continuum of supports and services to provide necessary interventions and supports.
Strategies • Implementation of our district policy that clearly addresses our expectations for safe, caring
and inclusive schools, addressing such issues as bullying, disability and human rights issues.
• Support collaborative PLCs that focus on student data to inform teaching and instructional design for student competencies as outlined in the Ministerial Order on Student Learning (https://education.alberta.ca/department/policy/standards/goals.aspx).
• Support and provide a framework in building structures and systems focusing on collaboration, assessment and a continuum of supports in ensuring all students are achieving the knowledge, skills, understanding and attitudes within a safe, caring, and welcoming environment for personal excellence.
• Piloting a tool supporting collaboration between school based team members and making visible to all the continuum of supports provided.
• To further support the development of measures in assessing safe, caring and inclusive schools we are piloting the Student Orientation to School Questionnaire (SOS-Q) to gather student voice, open up lines of communication with students and provide identified targeted supports and interventions.
• Building the capacity and the development of strategic plans with the safe and caring leadership teams within every school around their chosen evidence based practice such as Restorative Practice, Social Emotional Learning Curriculum, Trauma Informed Practice, Positive Behaviour Supports, or Mentorship.
Foothills School Division No. 38
Page 27
• Learning Coaches work collaboratively with teachers to support the diversity of the students in their classrooms. For students that require more individualized supports through alternative programming we are building on our online blended learning offerings through the HUB, students and an alternative setting for high school can attend our outreach school, Cameron Crossing.
• For students that require a higher level of intervention and support for their mental health needs we continue to support those students through our specialized supports at Okotoks Junior High School. Partnerships with key agencies continue to be key to the success of this program.
• Building staff capacity in the area of mental health through Go to Educator – Mental Health Literacy and a basic foundational knowledge in trauma informed practices. By the end of 2017-18 school year, all school staff will have participated in this training.
• As a member of Bow River RCSD we collaborate with Human and Health Services to provide mental health and rehabilitation services to our children, youth and families. We continue to build more partnerships with key outside agencies to ensure a safe, caring and welcoming environment for all students (i.e. Hull Service, CONeX, Tri region Partnership, Foothills Children’s Wellness Network)
• Foothills School Division is part of the collaboration of the Inclusive Education Partnership
which includes parent and family representation as well as other outside agencies.
Foothills School Division No. 38
Page 28
Outcome Four: Alberta has excellent teachers, school and school authority leaders
Performance Measure Results (in percentages) Target Evaluation Targets 2013 2014 2015 2016 2017 2017 Achievement Improvement Overall 2018 2019 2020
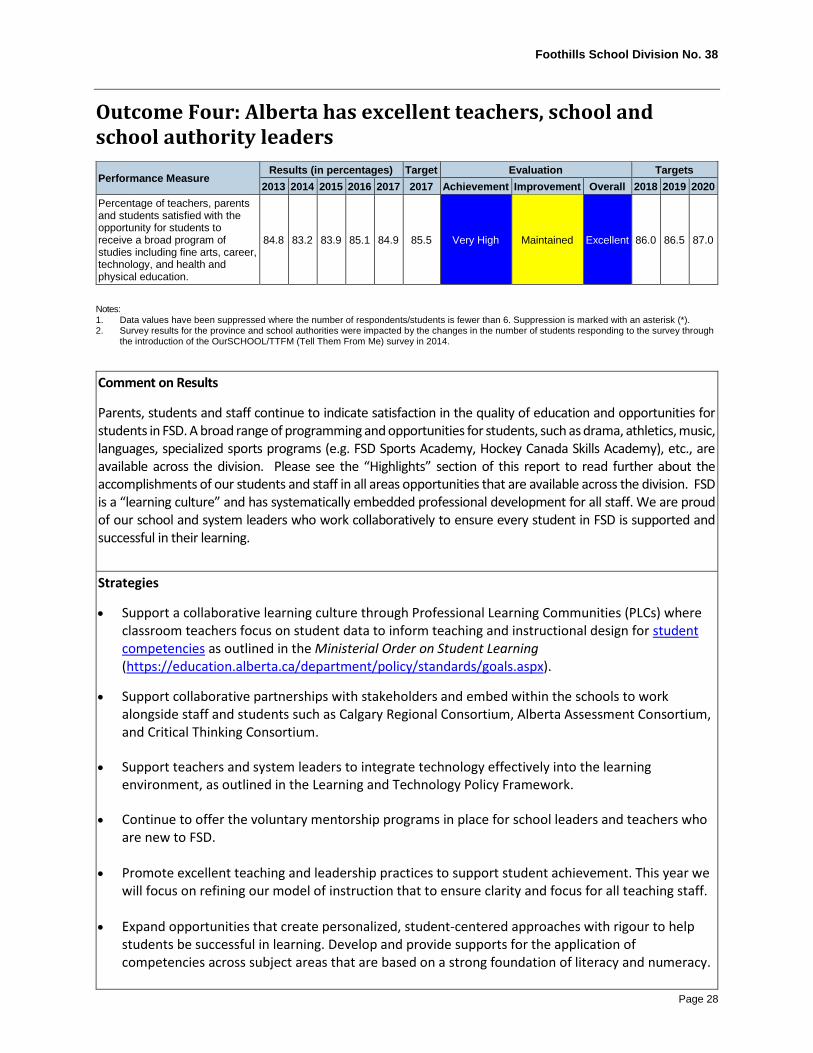
Percentage of teachers, parents and students satisfied with the opportunity for students to receive a broad program of studies including fine arts, career, technology, and health and physical education.
84.8 83.2 83.9 85.1 84.9 85.5 Very High Maintained Excellent 86.0 86.5 87.0
Notes: 1. Data values have been suppressed where the number of respondents/students is fewer than 6. Suppression is marked with an asterisk (*). 2. Survey results for the province and school authorities were impacted by the changes in the number of students responding to the survey through
the introduction of the OurSCHOOL/TTFM (Tell Them From Me) survey in 2014.
Comment on Results Parents, students and staff continue to indicate satisfaction in the quality of education and opportunities for students in FSD. A broad range of programming and opportunities for students, such as drama, athletics, music, languages, specialized sports programs (e.g. FSD Sports Academy, Hockey Canada Skills Academy), etc., are available across the division. Please see the “Highlights” section of this report to read further about the accomplishments of our students and staff in all areas opportunities that are available across the division. FSD is a “learning culture” and has systematically embedded professional development for all staff. We are proud of our school and system leaders who work collaboratively to ensure every student in FSD is supported and successful in their learning.
Strategies • Support a collaborative learning culture through Professional Learning Communities (PLCs) where
classroom teachers focus on student data to inform teaching and instructional design for student competencies as outlined in the Ministerial Order on Student Learning (https://education.alberta.ca/department/policy/standards/goals.aspx).
• Support collaborative partnerships with stakeholders and embed within the schools to work alongside staff and students such as Calgary Regional Consortium, Alberta Assessment Consortium, and Critical Thinking Consortium.
• Support teachers and system leaders to integrate technology effectively into the learning
environment, as outlined in the Learning and Technology Policy Framework. • Continue to offer the voluntary mentorship programs in place for school leaders and teachers who
are new to FSD.
• Promote excellent teaching and leadership practices to support student achievement. This year we will focus on refining our model of instruction that to ensure clarity and focus for all teaching staff.
• Expand opportunities that create personalized, student-centered approaches with rigour to help
students be successful in learning. Develop and provide supports for the application of competencies across subject areas that are based on a strong foundation of literacy and numeracy.
Foothills School Division No. 38
Page 29
• A district commitment to System and School Based Learning days to build the capacity of all staff in the areas of focus identified by the division. We also commit to providing Instructional and Learning Coaches that work elbow to elbow with teachers to support instructional practice that improves student learning.
• Building the capacity of school safe and caring leadership teams around evidence based practices.
Family School Liaison Counselors work in classrooms with teachers to build their capacity on supporting the social emotional needs of students.
• Developing connections with partners and outside agencies (i.e. Alberta Health Services, Safer
Schools, RCMP, Literacy for Life, SNAPS, etc.) to build the capacity of staff and parents and offer further opportunities to students.
• Learning Coach/Administration meetings focused on collaboration in building a strong continuum
of supports which includes a strong focus on collaboration, assessment and high yield approaches and interventions.
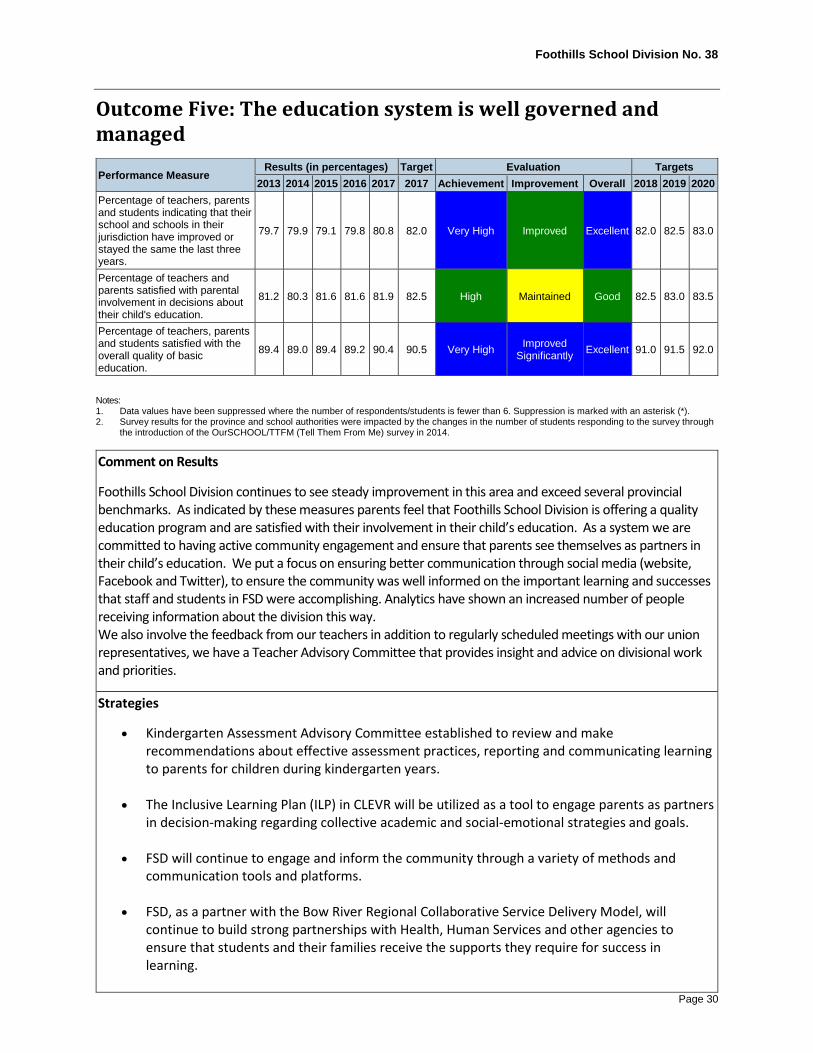
Foothills School Division No. 38
Page 30
Outcome Five: The education system is well governed and managed
Performance Measure Results (in percentages) Target Evaluation Targets 2013 2014 2015 2016 2017 2017 Achievement Improvement Overall 2018 2019 2020
Percentage of teachers, parents and students indicating that their school and schools in their jurisdiction have improved or stayed the same the last three years.
79.7 79.9 79.1 79.8 80.8 82.0 Very High Improved Excellent 82.0 82.5 83.0
Percentage of teachers and parents satisfied with parental involvement in decisions about their child's education.
81.2 80.3 81.6 81.6 81.9 82.5 High Maintained Good 82.5 83.0 83.5
Percentage of teachers, parents and students satisfied with the overall quality of basic education.
89.4 89.0 89.4 89.2 90.4 90.5 Very High Improved Significantly Excellent 91.0 91.5 92.0
Notes: 1. Data values have been suppressed where the number of respondents/students is fewer than 6. Suppression is marked with an asterisk (*). 2. Survey results for the province and school authorities were impacted by the changes in the number of students responding to the survey through
the introduction of the OurSCHOOL/TTFM (Tell Them From Me) survey in 2014.
Comment on Results Foothills School Division continues to see steady improvement in this area and exceed several provincial benchmarks. As indicated by these measures parents feel that Foothills School Division is offering a quality education program and are satisfied with their involvement in their child’s education. As a system we are committed to having active community engagement and ensure that parents see themselves as partners in their child’s education. We put a focus on ensuring better communication through social media (website, Facebook and Twitter), to ensure the community was well informed on the important learning and successes that staff and students in FSD were accomplishing. Analytics have shown an increased number of people receiving information about the division this way. We also involve the feedback from our teachers in addition to regularly scheduled meetings with our union representatives, we have a Teacher Advisory Committee that provides insight and advice on divisional work and priorities.
Strategies
• Kindergarten Assessment Advisory Committee established to review and make recommendations about effective assessment practices, reporting and communicating learning to parents for children during kindergarten years.
• The Inclusive Learning Plan (ILP) in CLEVR will be utilized as a tool to engage parents as partners in decision-making regarding collective academic and social-emotional strategies and goals.
• FSD will continue to engage and inform the community through a variety of methods and communication tools and platforms.
• FSD, as a partner with the Bow River Regional Collaborative Service Delivery Model, will continue to build strong partnerships with Health, Human Services and other agencies to ensure that students and their families receive the supports they require for success in learning.
Foothills School Division No. 38
Page 31
• Foothills School Division is part of the collaboration of the Inclusive Education partnership with includes parent and family representation as well as other outside agencies.
• FSD, as a partner with the Foothills Children’s Wellness Network, will continue to build partnership with local agencies to ensure happy, healthy children that have access to the network of support in the early years.
• Parent information evenings are regularly held to share information on programming happening in the division and to build their understanding and capacity. (i.e. Social Emotional Curriculums; math information nights; dealing with teen anxiety)
Foothills School Division No. 38
Page 32
Future Challenges
1. FSD continues to face significant challenges associated with increasing enrolment and a lack of facility space across the division. The pressure is greatest in the growing community of Okotoks and this extends to the west, in the community of Turner Valley, where approval of a modular classroom is addressing an immediate demand.
2. FSD is seeing an increasing number of students that are presenting with serious social-emotional and mental health needs. Some of these students are also presenting with a need for increasing supports to ensure their behaviour needs are met and are not a barrier to their learning. Schools, students and their families indicate an increasing need for embedded resources and expertise for issues such as anxiety and depression. Due to the rural nature of parts of our school division, some of the types of mental health supports that are required for our most complex learners are not readily available. Teachers and school principals need more timely and appropriate supports to support the needs of these students.
3. We are also concerned with the reduction in funding and support that is provided through Bow River RCSD. Due to the lack of baseline services in this area, we are very dependent on the work of the RCSD to fill that gap. This reduction has an impact on services available to students and their families and impacts student learning.
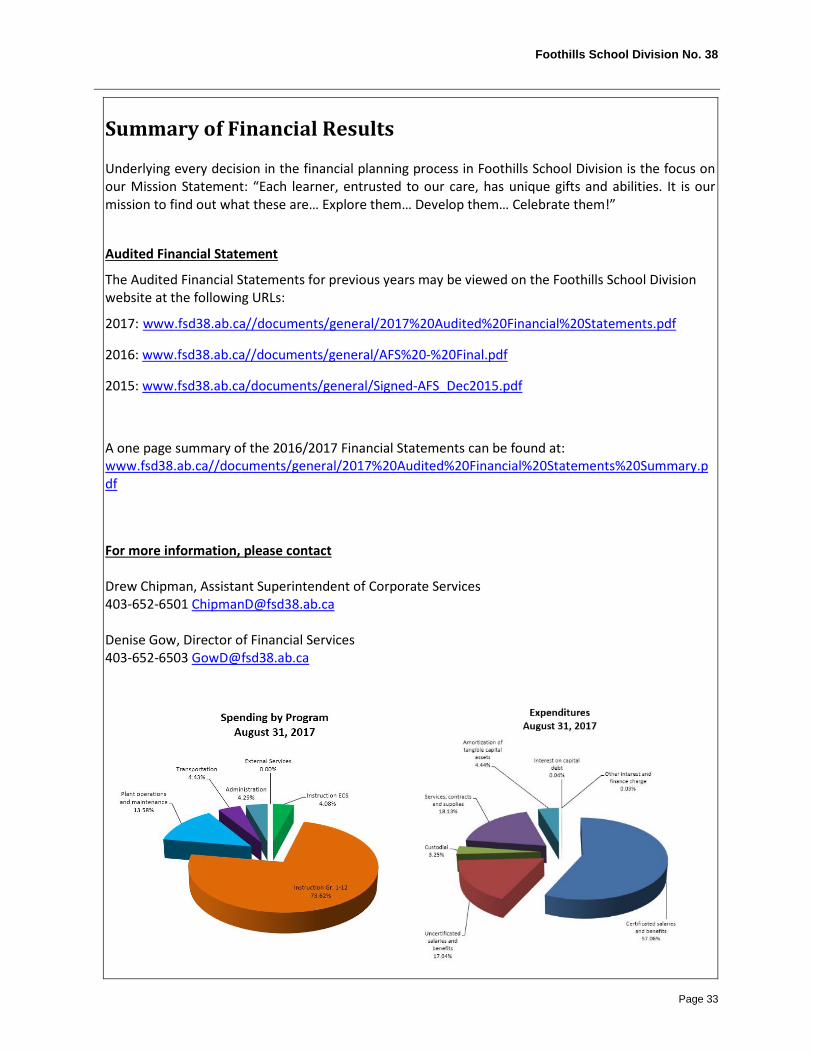
Foothills School Division No. 38
Page 33
Summary of Financial Results
Underlying every decision in the financial planning process in Foothills School Division is the focus on our Mission Statement: “Each learner, entrusted to our care, has unique gifts and abilities. It is our mission to find out what these are… Explore them… Develop them… Celebrate them!”
Audited Financial Statement The Audited Financial Statements for previous years may be viewed on the Foothills School Division website at the following URLs:
2017: www.fsd38.ab.ca//documents/general/2017%20Audited%20Financial%20Statements.pdf
2016: www.fsd38.ab.ca//documents/general/AFS%20-%20Final.pdf
2015: www.fsd38.ab.ca/documents/general/Signed-AFS_Dec2015.pdf
A one page summary of the 2016/2017 Financial Statements can be found at: www.fsd38.ab.ca//documents/general/2017%20Audited%20Financial%20Statements%20Summary.pdf
For more information, please contact Drew Chipman, Assistant Superintendent of Corporate Services 403-652-6501 [email protected] Denise Gow, Director of Financial Services 403-652-6503 [email protected]
Foothills School Division No. 38
Page 34
Budget Summary Budget Report The Budget Report for the Year Ending August 31, 2017 may be viewed on the Foothills School Division website at the following URL: www.fsd38.ab.ca//documents/general/BRF%20-%20Final.pdf
For more information, please contact Drew Chipman, Assistant Superintendent of Corporate Services 403-652-6501 [email protected] Denise Gow, Director of Financial Services 403-652-6503 [email protected]
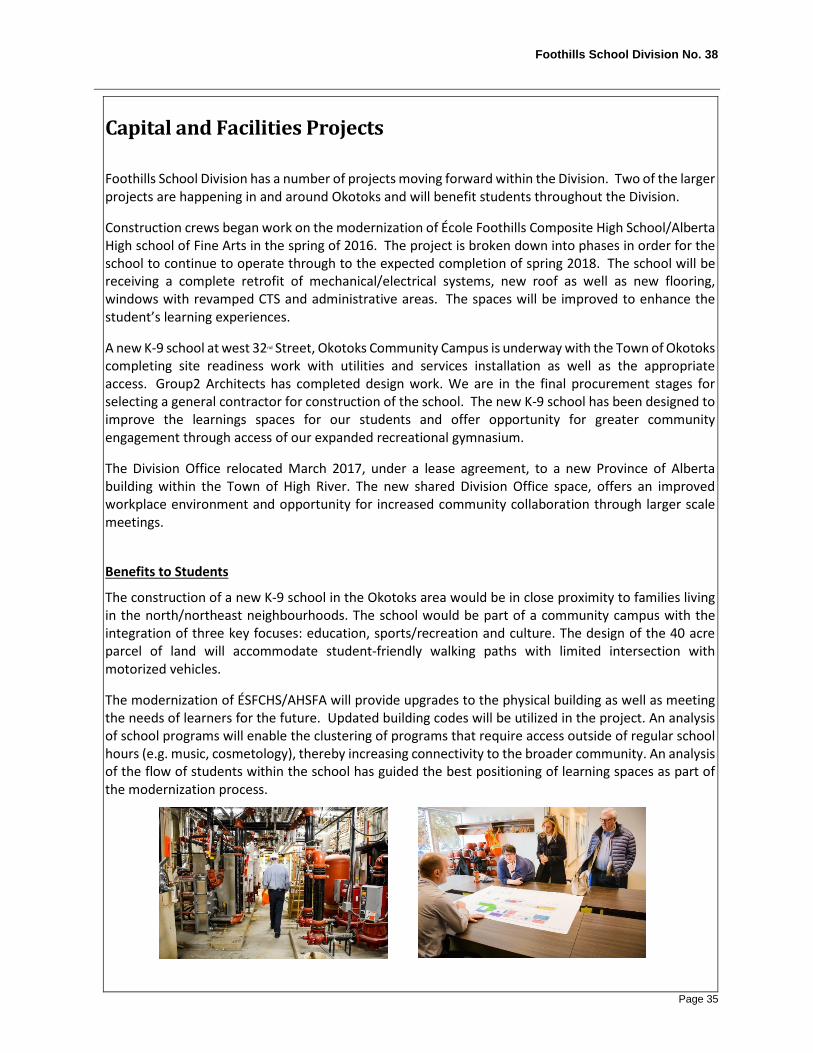
Foothills School Division No. 38
Page 35
Capital and Facilities Projects
Foothills School Division has a number of projects moving forward within the Division. Two of the larger projects are happening in and around Okotoks and will benefit students throughout the Division.
Construction crews began work on the modernization of École Foothills Composite High School/Alberta High school of Fine Arts in the spring of 2016. The project is broken down into phases in order for the school to continue to operate through to the expected completion of spring 2018. The school will be receiving a complete retrofit of mechanical/electrical systems, new roof as well as new flooring, windows with revamped CTS and administrative areas. The spaces will be improved to enhance the student’s learning experiences.
A new K-9 school at west 32nd Street, Okotoks Community Campus is underway with the Town of Okotoks completing site readiness work with utilities and services installation as well as the appropriate access. Group2 Architects has completed design work. We are in the final procurement stages for selecting a general contractor for construction of the school. The new K-9 school has been designed to improve the learnings spaces for our students and offer opportunity for greater community engagement through access of our expanded recreational gymnasium.
The Division Office relocated March 2017, under a lease agreement, to a new Province of Alberta building within the Town of High River. The new shared Division Office space, offers an improved workplace environment and opportunity for increased community collaboration through larger scale meetings.
Benefits to Students The construction of a new K-9 school in the Okotoks area would be in close proximity to families living in the north/northeast neighbourhoods. The school would be part of a community campus with the integration of three key focuses: education, sports/recreation and culture. The design of the 40 acre parcel of land will accommodate student-friendly walking paths with limited intersection with motorized vehicles.
The modernization of ÉSFCHS/AHSFA will provide upgrades to the physical building as well as meeting the needs of learners for the future. Updated building codes will be utilized in the project. An analysis of school programs will enable the clustering of programs that require access outside of regular school hours (e.g. music, cosmetology), thereby increasing connectivity to the broader community. An analysis of the flow of students within the school has guided the best positioning of learning spaces as part of the modernization process.
Foothills School Division No. 38
Page 36
Summary of Facility and Capital Plans 1. New K-9 schools in Okotoks: Population growth in the Calgary Corridor along Highway 2 – and associated enrolment growth in grades K-9 in the areas adjacent to Calgary, including Okotoks – continues to put pressure on FSD. As residential developments such as northwest D’Arcy and Wind Walk to the south, expand the population of the Town of Okotoks, FSD is reviewing enrolment projections and planning for new schools (e.g. a new K-9, K-6 and high school) in these new areas. 2. New high school in Okotoks: The Town of Okotoks has experienced significant and sustained population growth since 2001. As such, most of FSD’s Okotoks schools are operating at or above their capacities. FSD continues to plan for additional student capacity, including new high schools within Okotoks, in order to meet demand. 3. New school in High River: High River is part of the Calgary Regional Partnership planning area and has the potential to grow rapidly as a feeder location to the City of Calgary. While the June 2013 flood may slow the growth rate in the short term, new school sites have been identified and growth patterns are being monitored to ensure planning is in place for a new school as population patterns warrant.
Modernization Priorities 1. Blackie School – Blackie 2. Cayley School – Cayley 3. Longview School – Longview 4. C. Ian McLaren School – Black Diamond 5. Turner Valley School – Turner Valley 6. École Joe Clark School – High River
7.Big Rock School – Okotoks
Overall Priority List 1. Blackie School modernization 2. Cayley School modernization 3. New K-9 School in Okotoks in northwest – D’Arcy. 4. New 10-12 School in Okotoks – 1,200 Capacity on 32nd Street Okotoks Community Campus 5. New school – Configuration TBD at Spitzee Crossing Development, High River 6. Longview school modernization 7. C. Ian McLaren School modernization 8. Turner Valley School modernization 9. Ecole Joe Clark School – High River 10. Big Rock School - Okotoks
A summary of Facility and Capital Plans may be viewed on the Foothills School Division website at the following URL: www.fsd38.ab.ca/Capital%20Plan.php
Foothills School Division No. 38
Page 37
Parental Involvement FSD Administrative Procedure 102 guides the work of School Annual Education Plans and Results Reports. Specifically, there are two areas that address the Provincial government expectation of parental involvement:
1. Procedure #1 states that “All plans and results reports must satisfy the requirements” as set forth by Alberta Education; and
2. Procedure #3 states “School plans, results reports…must be prepared by the Principal in consultation with staff, School Council and, where appropriate, students… and must be reported on the school’s website.”
Each FSD school builds their individual school plans and reporting structures, and, as noted above, all schools are required to utilize school council input within their planning processes.
School administrators also collaborate with FSD’s Division Office to disaggregate their data from PATs, diploma exams and survey results as an integral part of their review and planning. This process informs planning to address areas of concern and identify strategies to help yield positive results. In addition, this data is shared within each school community to promote discussions concerning potential strategies that may be implemented in each school’s plan.
FSD’s Board of Trustees reviews school plans on a three-year cycle and is informed of the processes that are used at the school community level to ensure parental involvement.
In addition, all plans are shared within cohort groups of the Foothills Administrators’ Association (FAA) and senior leadership. These processes are designed to ensure accountability and solicit professional input into planning as well as to facilitate transparency in the planning and sharing of best practices throughout the Division.
Furthermore, all FSD schools utilize the Tell Them from Me survey to assist in incorporating student input into their school improvement processes. Many of our schools also distribute their own parent surveys, which are designed to garner additional input from their communities and help further inform their planning.
Foothills School Division No. 38
Page 38
Timelines and Communication The FSD Plan is subject to the following timelines:
• Provincial Education Budget release.
• Budget consultations with multiple stakeholders commence shortly after the release of the budget to determine priorities for the next year.
• School planning processes begin in the spring, reviewing progress made in the yearly plan, utilizing data from the Accountability Pillar Report, and examining pertinent school and divisional survey data. FSD three-year planning (3YEP) processes also commence at this time.
• Provincial Exam results are released in the fall to the division. School and divisional disaggregation of data take place thereafter. Plans are adjusted accordingly.
• Input for school plans is received from School Councils in the fall.
• Foothills Administrators’ Association (FAA) and FSD’s Board of Trustees planning sessions take place during the fall season.
• Annual School Education Plans and Results Reports are due November 15 to ensure that their
input is utilized in the FSD 3YEP.
• Audited Financial Statement (for the Year Ended August 31) and Budget Summary is typically approved by the Board of Trustees at their regularly scheduled meeting during the first week of December.
• FSD 3YEP to be reviewed by the Board of Trustees and posted on the FSD website the first week of December based on the timing of Board meetings.
The Foothills School Division 2017/2018 average class size report can be found on the Division website at: www.fsd38.ab.ca/Class%20Size%20Initiative.php
This Foothills School Division AERR and AERR Summary page can be found on the Division website at: www.fsd38.ab.ca/Education%20Plan.php
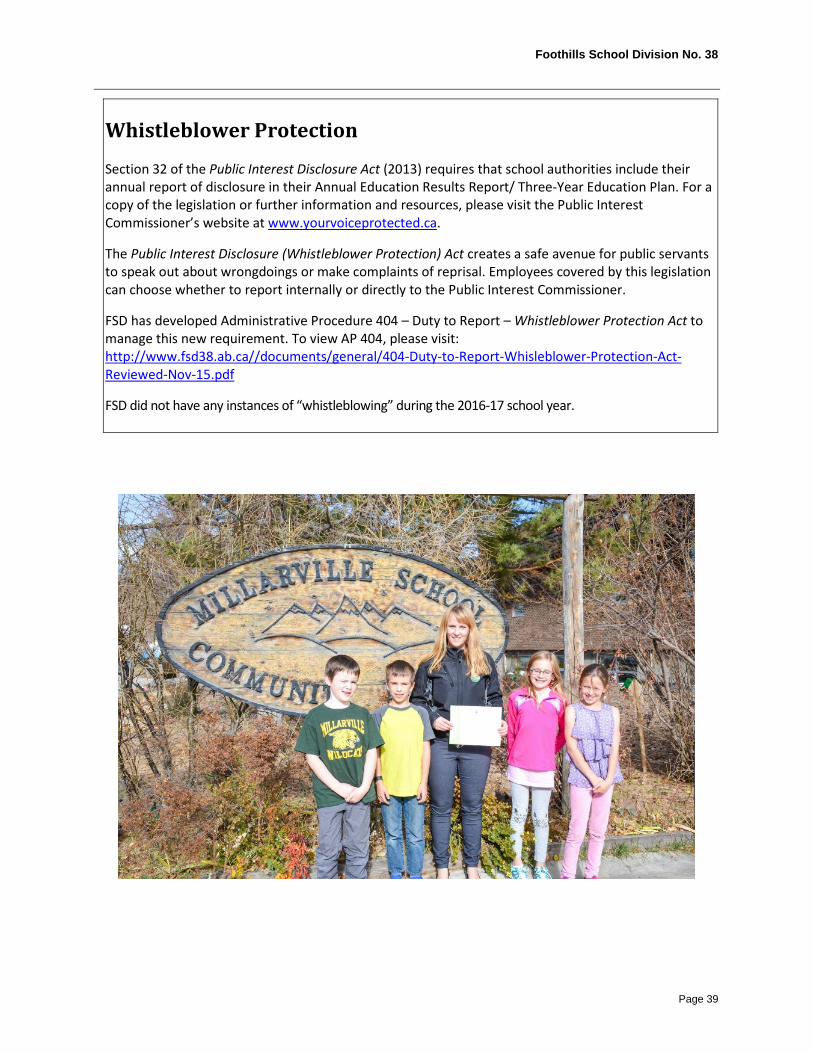
Foothills School Division No. 38
Page 39
Whistleblower Protection Section 32 of the Public Interest Disclosure Act (2013) requires that school authorities include their annual report of disclosure in their Annual Education Results Report/ Three-Year Education Plan. For a copy of the legislation or further information and resources, please visit the Public Interest Commissioner’s website at www.yourvoiceprotected.ca.
The Public Interest Disclosure (Whistleblower Protection) Act creates a safe avenue for public servants to speak out about wrongdoings or make complaints of reprisal. Employees covered by this legislation can choose whether to report internally or directly to the Public Interest Commissioner.
FSD has developed Administrative Procedure 404 – Duty to Report – Whistleblower Protection Act to manage this new requirement. To view AP 404, please visit: http://www.fsd38.ab.ca//documents/general/404-Duty-to-Report-Whisleblower-Protection-Act-Reviewed-Nov-15.pdf
FSD did not have any instances of “whistleblowing” during the 2016-17 school year.
Foothills School Division No. 38
Page 40
APPENDIX – Measure Details
The following pages include tables and graphs that provide detailed data for the performance measures.
Diploma Examination Results – Measure Details ....................................................................................... 46
High School Completion Rate – Measure Details ....................................................................................... 46
Drop Out Rate – Measure Details ............................................................................................................... 47
High School to Post-secondary Transition Rate – Measure Details .......................................................... 488
Rutherford Eligibility Rate – Measure Details ............................................................................................. 49
Diploma Examination Participation Rate – Measure Details ...................................................................... 50
Citizenship – Measure Details ..................................................................................................................... 51
Work Preparation – Measure Details ......................................................................................................... 52
Lifelong Learning – Measure Details ........................................................................................................... 52
Provincial Achievement Test Results – Measure Details ............................................................................ 53
PAT Results Course By Course Summary By Enrolled With Measure Evaluation ....................................... 58
Program of Studies – Measure Details........................................................................................................ 61
Parental Involvement – Measure Details .................................................................................................... 61
Education Quality – Measure Details .......................................................................................................... 62
Safe and Caring – Measure Details ............................................................................................................. 62
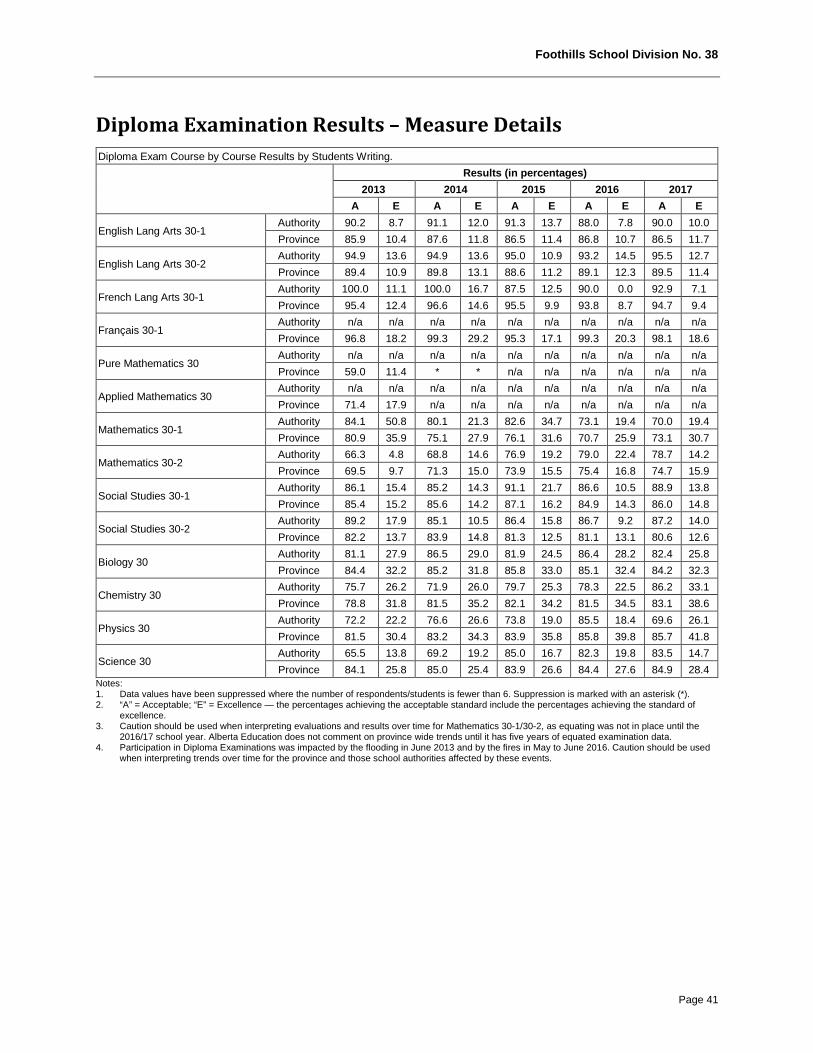
Foothills School Division No. 38
Page 41
Diploma Examination Results – Measure Details Diploma Exam Course by Course Results by Students Writing. Results (in percentages)
2013 2014 2015 2016 2017 A E A E A E A E A E
English Lang Arts 30-1 Authority 90.2 8.7 91.1 12.0 91.3 13.7 88.0 7.8 90.0 10.0 Province 85.9 10.4 87.6 11.8 86.5 11.4 86.8 10.7 86.5 11.7
English Lang Arts 30-2 Authority 94.9 13.6 94.9 13.6 95.0 10.9 93.2 14.5 95.5 12.7 Province 89.4 10.9 89.8 13.1 88.6 11.2 89.1 12.3 89.5 11.4
French Lang Arts 30-1 Authority 100.0 11.1 100.0 16.7 87.5 12.5 90.0 0.0 92.9 7.1 Province 95.4 12.4 96.6 14.6 95.5 9.9 93.8 8.7 94.7 9.4
Français 30-1 Authority n/a n/a n/a n/a n/a n/a n/a n/a n/a n/a Province 96.8 18.2 99.3 29.2 95.3 17.1 99.3 20.3 98.1 18.6
Pure Mathematics 30 Authority n/a n/a n/a n/a n/a n/a n/a n/a n/a n/a Province 59.0 11.4 * * n/a n/a n/a n/a n/a n/a
Applied Mathematics 30 Authority n/a n/a n/a n/a n/a n/a n/a n/a n/a n/a Province 71.4 17.9 n/a n/a n/a n/a n/a n/a n/a n/a
Mathematics 30-1 Authority 84.1 50.8 80.1 21.3 82.6 34.7 73.1 19.4 70.0 19.4 Province 80.9 35.9 75.1 27.9 76.1 31.6 70.7 25.9 73.1 30.7
Mathematics 30-2 Authority 66.3 4.8 68.8 14.6 76.9 19.2 79.0 22.4 78.7 14.2 Province 69.5 9.7 71.3 15.0 73.9 15.5 75.4 16.8 74.7 15.9
Social Studies 30-1 Authority 86.1 15.4 85.2 14.3 91.1 21.7 86.6 10.5 88.9 13.8 Province 85.4 15.2 85.6 14.2 87.1 16.2 84.9 14.3 86.0 14.8
Social Studies 30-2 Authority 89.2 17.9 85.1 10.5 86.4 15.8 86.7 9.2 87.2 14.0 Province 82.2 13.7 83.9 14.8 81.3 12.5 81.1 13.1 80.6 12.6
Biology 30 Authority 81.1 27.9 86.5 29.0 81.9 24.5 86.4 28.2 82.4 25.8 Province 84.4 32.2 85.2 31.8 85.8 33.0 85.1 32.4 84.2 32.3
Chemistry 30 Authority 75.7 26.2 71.9 26.0 79.7 25.3 78.3 22.5 86.2 33.1 Province 78.8 31.8 81.5 35.2 82.1 34.2 81.5 34.5 83.1 38.6
Physics 30 Authority 72.2 22.2 76.6 26.6 73.8 19.0 85.5 18.4 69.6 26.1 Province 81.5 30.4 83.2 34.3 83.9 35.8 85.8 39.8 85.7 41.8
Science 30 Authority 65.5 13.8 69.2 19.2 85.0 16.7 82.3 19.8 83.5 14.7 Province 84.1 25.8 85.0 25.4 83.9 26.6 84.4 27.6 84.9 28.4
Notes: 1. Data values have been suppressed where the number of respondents/students is fewer than 6. Suppression is marked with an asterisk (*). 2. “A” = Acceptable; “E” = Excellence — the percentages achieving the acceptable standard include the percentages achieving the standard of
excellence. 3. Caution should be used when interpreting evaluations and results over time for Mathematics 30-1/30-2, as equating was not in place until the
2016/17 school year. Alberta Education does not comment on province wide trends until it has five years of equated examination data. 4. Participation in Diploma Examinations was impacted by the flooding in June 2013 and by the fires in May to June 2016. Caution should be used
when interpreting trends over time for the province and those school authorities affected by these events.
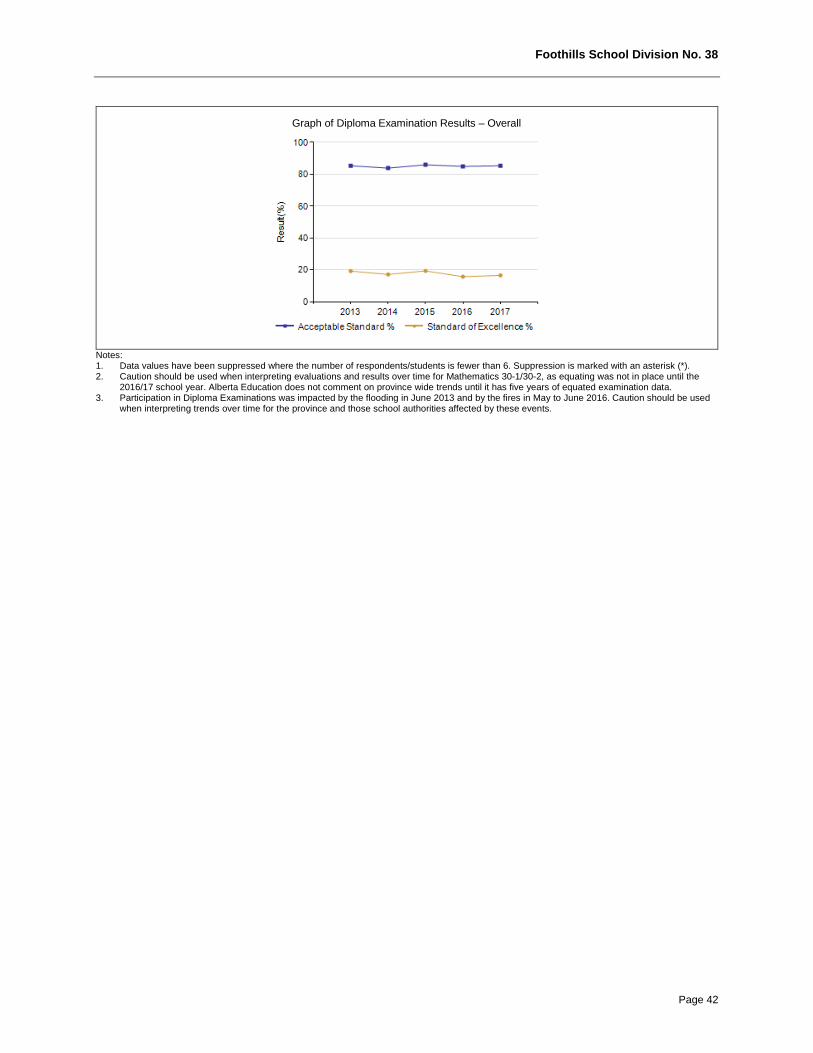
Foothills School Division No. 38
Page 42
Graph of Diploma Examination Results – Overall
Notes: 1. Data values have been suppressed where the number of respondents/students is fewer than 6. Suppression is marked with an asterisk (*). 2. Caution should be used when interpreting evaluations and results over time for Mathematics 30-1/30-2, as equating was not in place until the
2016/17 school year. Alberta Education does not comment on province wide trends until it has five years of equated examination data. 3. Participation in Diploma Examinations was impacted by the flooding in June 2013 and by the fires in May to June 2016. Caution should be used
when interpreting trends over time for the province and those school authorities affected by these events.
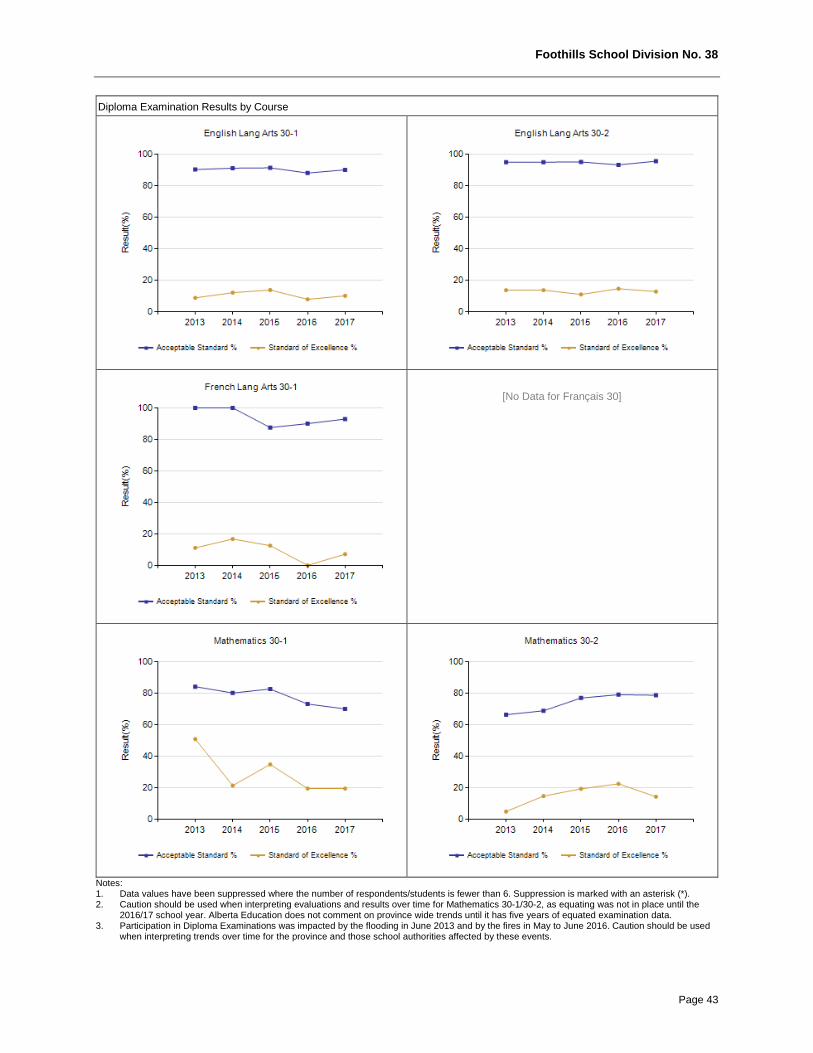
Foothills School Division No. 38
Page 43
Diploma Examination Results by Course
[No Data for Français 30]
Notes:
1. Data values have been suppressed where the number of respondents/students is fewer than 6. Suppression is marked with an asterisk (*). 2. Caution should be used when interpreting evaluations and results over time for Mathematics 30-1/30-2, as equating was not in place until the
2016/17 school year. Alberta Education does not comment on province wide trends until it has five years of equated examination data. 3. Participation in Diploma Examinations was impacted by the flooding in June 2013 and by the fires in May to June 2016. Caution should be used
when interpreting trends over time for the province and those school authorities affected by these events.
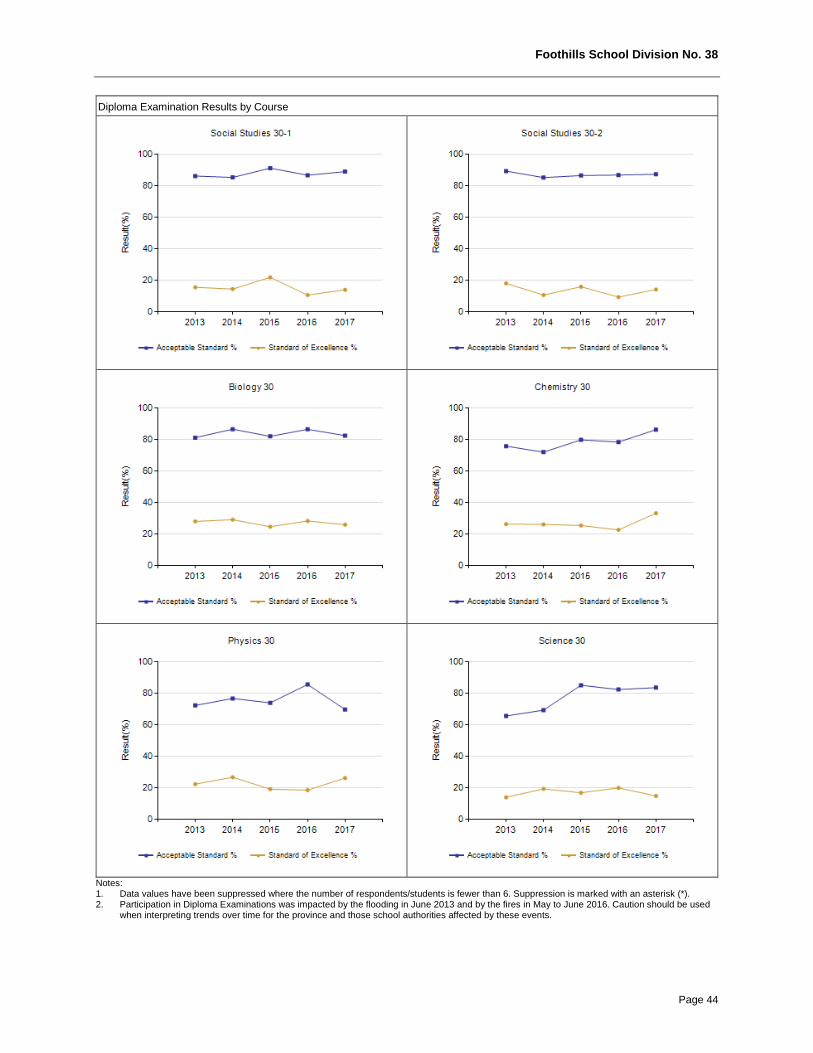
Foothills School Division No. 38
Page 44
Diploma Examination Results by Course
Notes: 1. Data values have been suppressed where the number of respondents/students is fewer than 6. Suppression is marked with an asterisk (*). 2. Participation in Diploma Examinations was impacted by the flooding in June 2013 and by the fires in May to June 2016. Caution should be used
when interpreting trends over time for the province and those school authorities affected by these events.
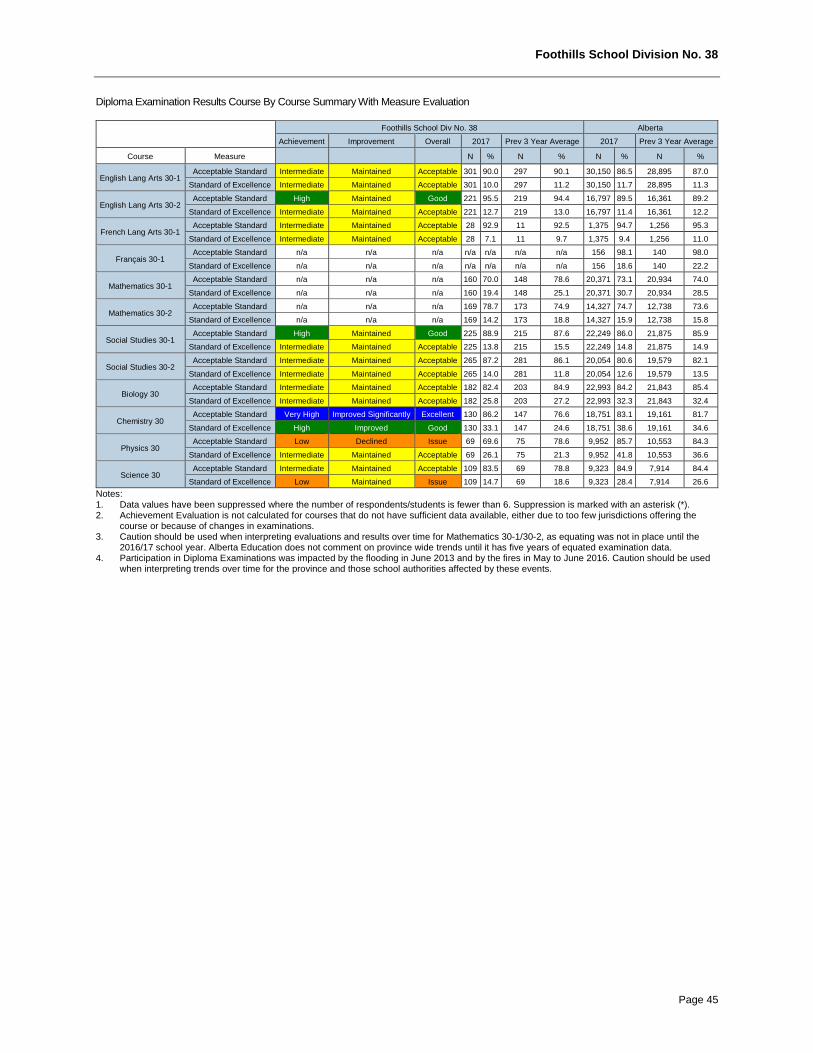
Foothills School Division No. 38
Page 45
Diploma Examination Results Course By Course Summary With Measure Evaluation
Foothills School Div No. 38 Alberta
Achievement Improvement Overall 2017 Prev 3 Year Average 2017 Prev 3 Year Average Course Measure N % N % N % N %
English Lang Arts 30-1 Acceptable Standard Intermediate Maintained Acceptable 301 90.0 297 90.1 30,150 86.5 28,895 87.0 Standard of Excellence Intermediate Maintained Acceptable 301 10.0 297 11.2 30,150 11.7 28,895 11.3
English Lang Arts 30-2 Acceptable Standard High Maintained Good 221 95.5 219 94.4 16,797 89.5 16,361 89.2 Standard of Excellence Intermediate Maintained Acceptable 221 12.7 219 13.0 16,797 11.4 16,361 12.2
French Lang Arts 30-1 Acceptable Standard Intermediate Maintained Acceptable 28 92.9 11 92.5 1,375 94.7 1,256 95.3 Standard of Excellence Intermediate Maintained Acceptable 28 7.1 11 9.7 1,375 9.4 1,256 11.0
Français 30-1 Acceptable Standard n/a n/a n/a n/a n/a n/a n/a 156 98.1 140 98.0 Standard of Excellence n/a n/a n/a n/a n/a n/a n/a 156 18.6 140 22.2
Mathematics 30-1 Acceptable Standard n/a n/a n/a 160 70.0 148 78.6 20,371 73.1 20,934 74.0 Standard of Excellence n/a n/a n/a 160 19.4 148 25.1 20,371 30.7 20,934 28.5
Mathematics 30-2 Acceptable Standard n/a n/a n/a 169 78.7 173 74.9 14,327 74.7 12,738 73.6 Standard of Excellence n/a n/a n/a 169 14.2 173 18.8 14,327 15.9 12,738 15.8
Social Studies 30-1 Acceptable Standard High Maintained Good 225 88.9 215 87.6 22,249 86.0 21,875 85.9 Standard of Excellence Intermediate Maintained Acceptable 225 13.8 215 15.5 22,249 14.8 21,875 14.9
Social Studies 30-2 Acceptable Standard Intermediate Maintained Acceptable 265 87.2 281 86.1 20,054 80.6 19,579 82.1 Standard of Excellence Intermediate Maintained Acceptable 265 14.0 281 11.8 20,054 12.6 19,579 13.5
Biology 30 Acceptable Standard Intermediate Maintained Acceptable 182 82.4 203 84.9 22,993 84.2 21,843 85.4 Standard of Excellence Intermediate Maintained Acceptable 182 25.8 203 27.2 22,993 32.3 21,843 32.4
Chemistry 30 Acceptable Standard Very High Improved Significantly Excellent 130 86.2 147 76.6 18,751 83.1 19,161 81.7 Standard of Excellence High Improved Good 130 33.1 147 24.6 18,751 38.6 19,161 34.6
Physics 30 Acceptable Standard Low Declined Issue 69 69.6 75 78.6 9,952 85.7 10,553 84.3 Standard of Excellence Intermediate Maintained Acceptable 69 26.1 75 21.3 9,952 41.8 10,553 36.6
Science 30 Acceptable Standard Intermediate Maintained Acceptable 109 83.5 69 78.8 9,323 84.9 7,914 84.4 Standard of Excellence Low Maintained Issue 109 14.7 69 18.6 9,323 28.4 7,914 26.6
Notes: 1. Data values have been suppressed where the number of respondents/students is fewer than 6. Suppression is marked with an asterisk (*). 2. Achievement Evaluation is not calculated for courses that do not have sufficient data available, either due to too few jurisdictions offering the
course or because of changes in examinations. 3. Caution should be used when interpreting evaluations and results over time for Mathematics 30-1/30-2, as equating was not in place until the
2016/17 school year. Alberta Education does not comment on province wide trends until it has five years of equated examination data. 4. Participation in Diploma Examinations was impacted by the flooding in June 2013 and by the fires in May to June 2016. Caution should be used
when interpreting trends over time for the province and those school authorities affected by these events.
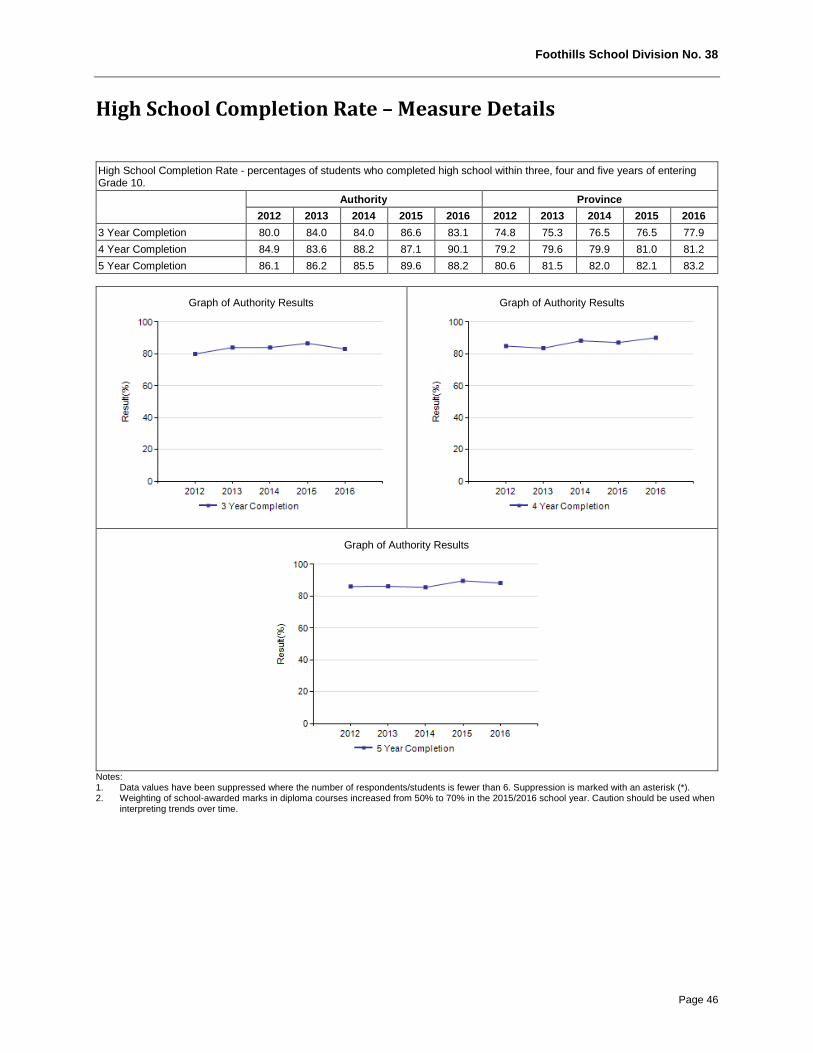
Foothills School Division No. 38
Page 46
High School Completion Rate – Measure Details
High School Completion Rate - percentages of students who completed high school within three, four and five years of entering Grade 10. Authority Province
2012 2013 2014 2015 2016 2012 2013 2014 2015 2016 3 Year Completion 80.0 84.0 84.0 86.6 83.1 74.8 75.3 76.5 76.5 77.9 4 Year Completion 84.9 83.6 88.2 87.1 90.1 79.2 79.6 79.9 81.0 81.2 5 Year Completion 86.1 86.2 85.5 89.6 88.2 80.6 81.5 82.0 82.1 83.2
Graph of Authority Results
Graph of Authority Results
Graph of Authority Results
Notes: 1. Data values have been suppressed where the number of respondents/students is fewer than 6. Suppression is marked with an asterisk (*). 2. Weighting of school-awarded marks in diploma courses increased from 50% to 70% in the 2015/2016 school year. Caution should be used when
interpreting trends over time.
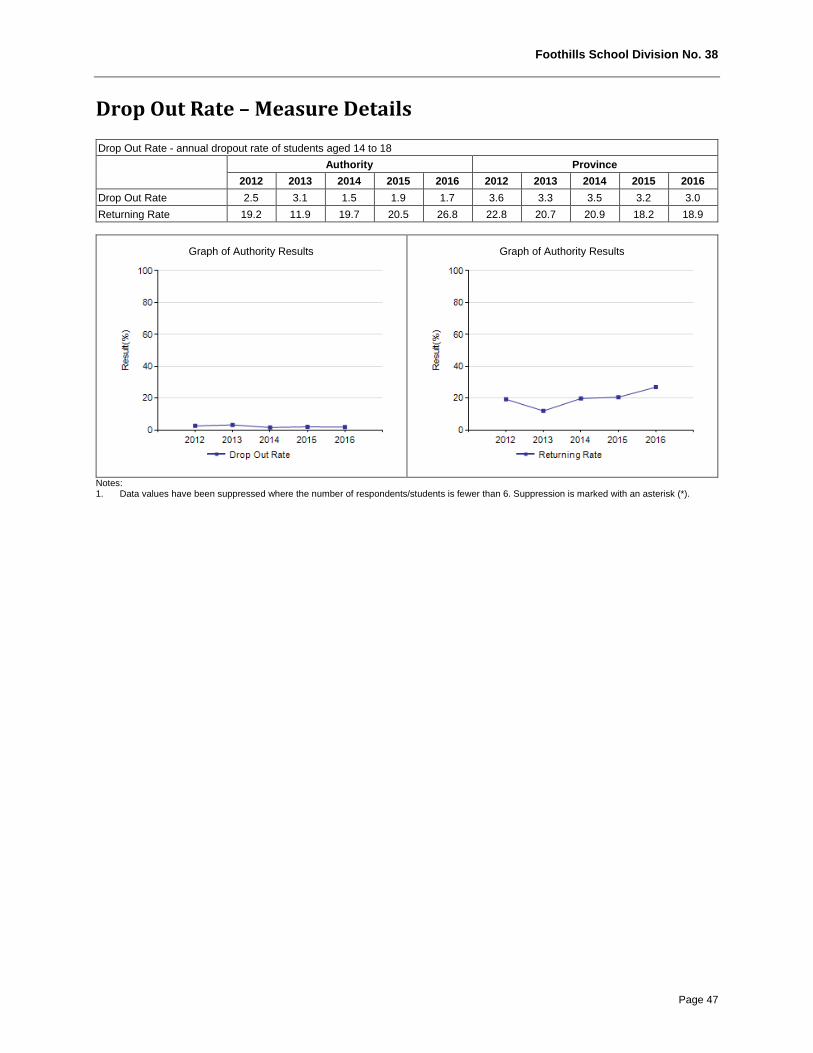
Foothills School Division No. 38
Page 47
Drop Out Rate – Measure Details Drop Out Rate - annual dropout rate of students aged 14 to 18 Authority Province
2012 2013 2014 2015 2016 2012 2013 2014 2015 2016 Drop Out Rate 2.5 3.1 1.5 1.9 1.7 3.6 3.3 3.5 3.2 3.0 Returning Rate 19.2 11.9 19.7 20.5 26.8 22.8 20.7 20.9 18.2 18.9
Graph of Authority Results
Graph of Authority Results
Notes: 1. Data values have been suppressed where the number of respondents/students is fewer than 6. Suppression is marked with an asterisk (*).
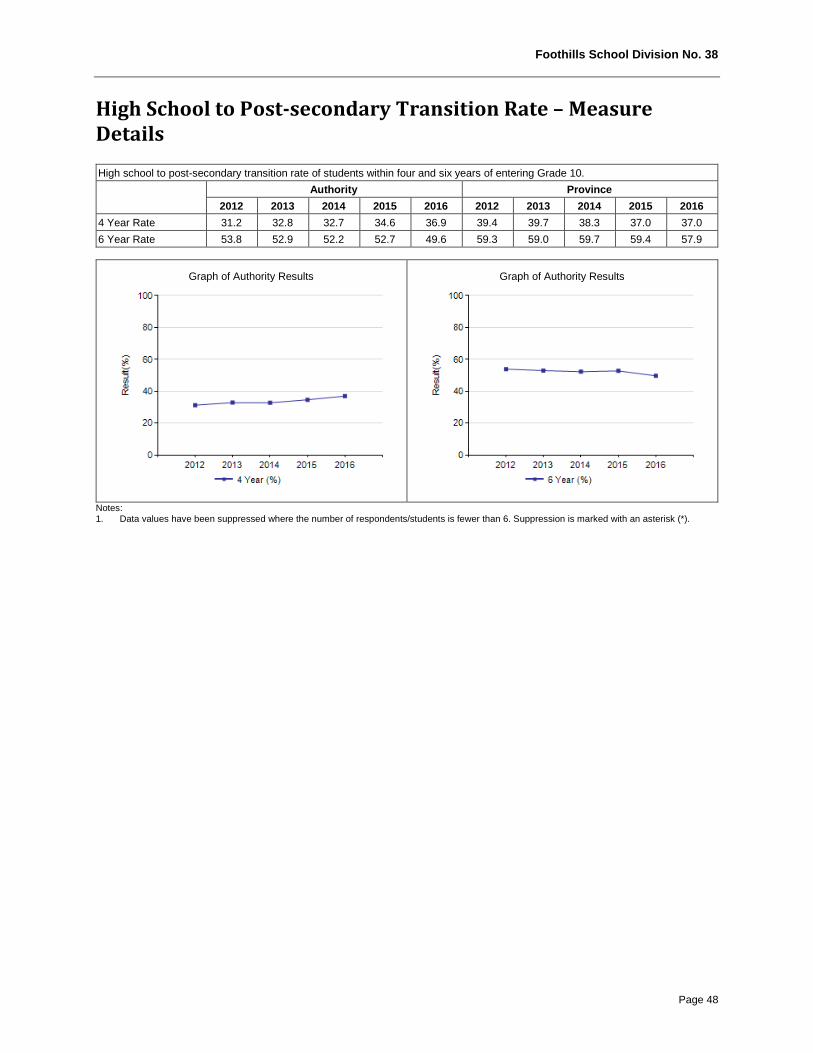
Foothills School Division No. 38
Page 48
High School to Post-secondary Transition Rate – Measure Details High school to post-secondary transition rate of students within four and six years of entering Grade 10. Authority Province
2012 2013 2014 2015 2016 2012 2013 2014 2015 2016 4 Year Rate 31.2 32.8 32.7 34.6 36.9 39.4 39.7 38.3 37.0 37.0 6 Year Rate 53.8 52.9 52.2 52.7 49.6 59.3 59.0 59.7 59.4 57.9
Graph of Authority Results
Graph of Authority Results
Notes: 1. Data values have been suppressed where the number of respondents/students is fewer than 6. Suppression is marked with an asterisk (*).
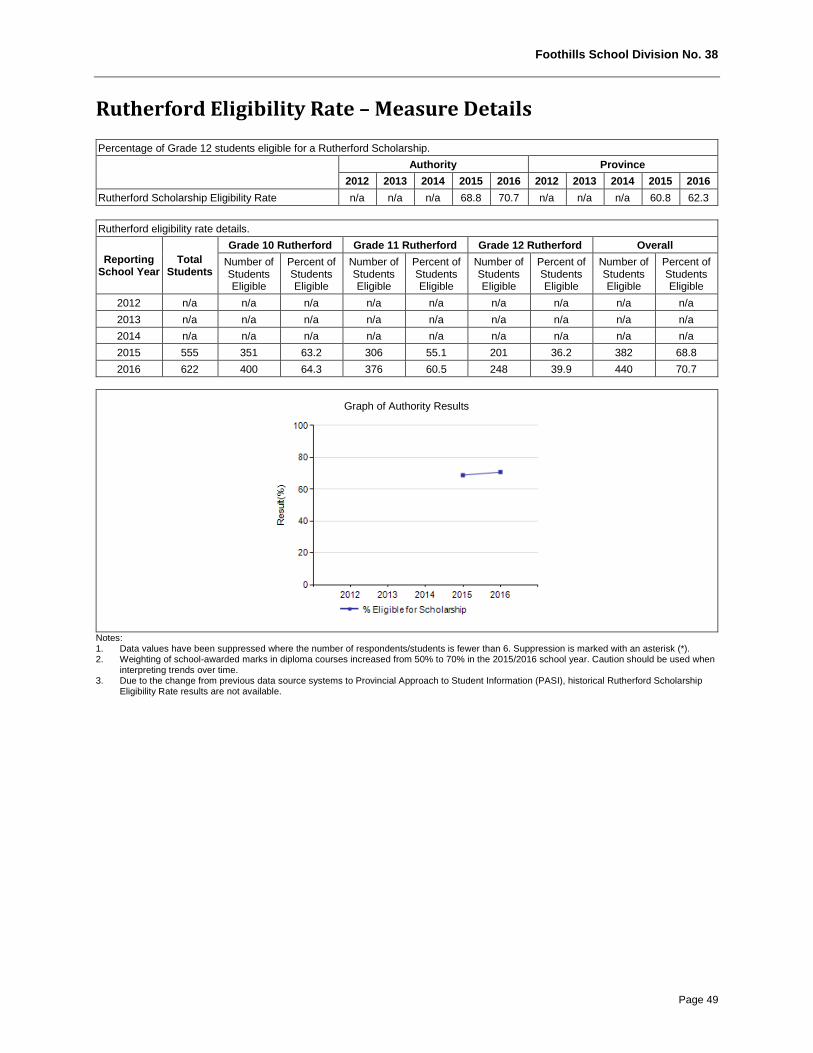
Foothills School Division No. 38
Page 49
Rutherford Eligibility Rate – Measure Details Percentage of Grade 12 students eligible for a Rutherford Scholarship. Authority Province
2012 2013 2014 2015 2016 2012 2013 2014 2015 2016 Rutherford Scholarship Eligibility Rate n/a n/a n/a 68.8 70.7 n/a n/a n/a 60.8 62.3 Rutherford eligibility rate details.
Reporting School Year
Total Students
Grade 10 Rutherford Grade 11 Rutherford Grade 12 Rutherford Overall Number of Students Eligible
Percent of Students Eligible
Number of Students Eligible
Percent of Students Eligible
Number of Students Eligible
Percent of Students Eligible
Number of Students Eligible
Percent of Students Eligible
2012 n/a n/a n/a n/a n/a n/a n/a n/a n/a 2013 n/a n/a n/a n/a n/a n/a n/a n/a n/a 2014 n/a n/a n/a n/a n/a n/a n/a n/a n/a 2015 555 351 63.2 306 55.1 201 36.2 382 68.8 2016 622 400 64.3 376 60.5 248 39.9 440 70.7
Graph of Authority Results
Notes: 1. Data values have been suppressed where the number of respondents/students is fewer than 6. Suppression is marked with an asterisk (*). 2. Weighting of school-awarded marks in diploma courses increased from 50% to 70% in the 2015/2016 school year. Caution should be used when
interpreting trends over time. 3. Due to the change from previous data source systems to Provincial Approach to Student Information (PASI), historical Rutherford Scholarship
Eligibility Rate results are not available.
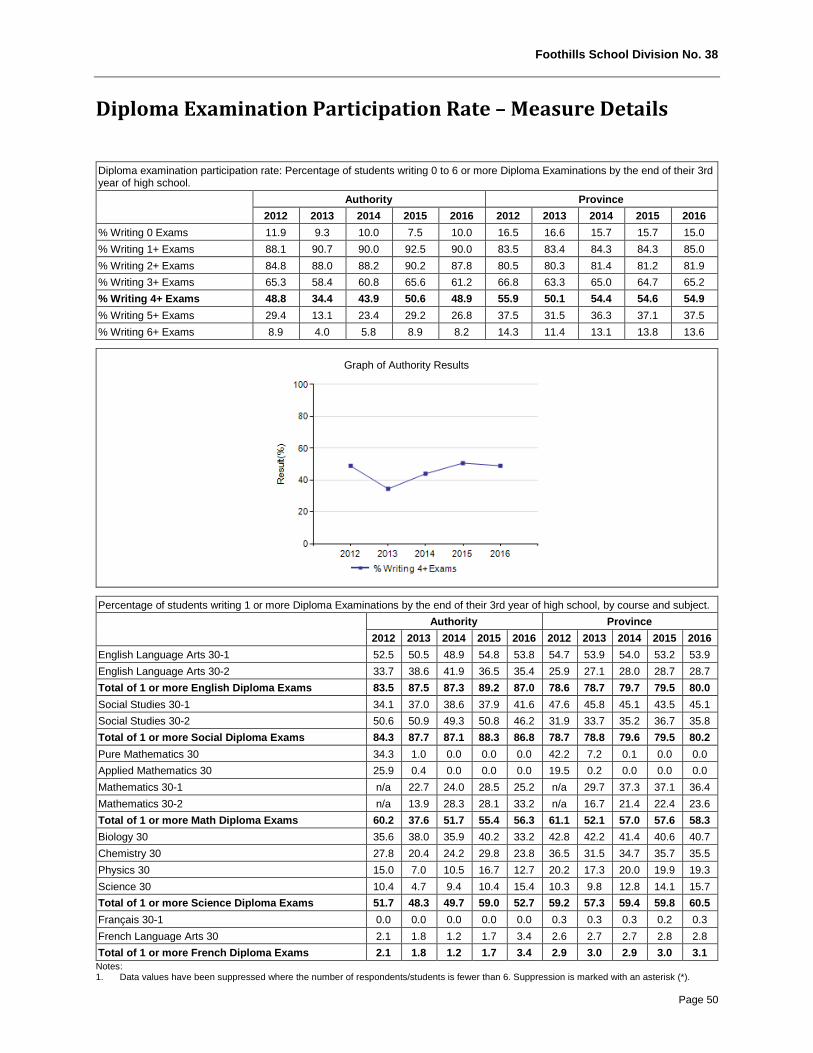
Foothills School Division No. 38
Page 50
Diploma Examination Participation Rate – Measure Details
Diploma examination participation rate: Percentage of students writing 0 to 6 or more Diploma Examinations by the end of their 3rd year of high school. Authority Province
2012 2013 2014 2015 2016 2012 2013 2014 2015 2016 % Writing 0 Exams 11.9 9.3 10.0 7.5 10.0 16.5 16.6 15.7 15.7 15.0 % Writing 1+ Exams 88.1 90.7 90.0 92.5 90.0 83.5 83.4 84.3 84.3 85.0 % Writing 2+ Exams 84.8 88.0 88.2 90.2 87.8 80.5 80.3 81.4 81.2 81.9 % Writing 3+ Exams 65.3 58.4 60.8 65.6 61.2 66.8 63.3 65.0 64.7 65.2 % Writing 4+ Exams 48.8 34.4 43.9 50.6 48.9 55.9 50.1 54.4 54.6 54.9 % Writing 5+ Exams 29.4 13.1 23.4 29.2 26.8 37.5 31.5 36.3 37.1 37.5 % Writing 6+ Exams 8.9 4.0 5.8 8.9 8.2 14.3 11.4 13.1 13.8 13.6
Graph of Authority Results
Percentage of students writing 1 or more Diploma Examinations by the end of their 3rd year of high school, by course and subject. Authority Province
2012 2013 2014 2015 2016 2012 2013 2014 2015 2016 English Language Arts 30-1 52.5 50.5 48.9 54.8 53.8 54.7 53.9 54.0 53.2 53.9 English Language Arts 30-2 33.7 38.6 41.9 36.5 35.4 25.9 27.1 28.0 28.7 28.7 Total of 1 or more English Diploma Exams 83.5 87.5 87.3 89.2 87.0 78.6 78.7 79.7 79.5 80.0 Social Studies 30-1 34.1 37.0 38.6 37.9 41.6 47.6 45.8 45.1 43.5 45.1 Social Studies 30-2 50.6 50.9 49.3 50.8 46.2 31.9 33.7 35.2 36.7 35.8 Total of 1 or more Social Diploma Exams 84.3 87.7 87.1 88.3 86.8 78.7 78.8 79.6 79.5 80.2 Pure Mathematics 30 34.3 1.0 0.0 0.0 0.0 42.2 7.2 0.1 0.0 0.0 Applied Mathematics 30 25.9 0.4 0.0 0.0 0.0 19.5 0.2 0.0 0.0 0.0 Mathematics 30-1 n/a 22.7 24.0 28.5 25.2 n/a 29.7 37.3 37.1 36.4 Mathematics 30-2 n/a 13.9 28.3 28.1 33.2 n/a 16.7 21.4 22.4 23.6 Total of 1 or more Math Diploma Exams 60.2 37.6 51.7 55.4 56.3 61.1 52.1 57.0 57.6 58.3 Biology 30 35.6 38.0 35.9 40.2 33.2 42.8 42.2 41.4 40.6 40.7 Chemistry 30 27.8 20.4 24.2 29.8 23.8 36.5 31.5 34.7 35.7 35.5 Physics 30 15.0 7.0 10.5 16.7 12.7 20.2 17.3 20.0 19.9 19.3 Science 30 10.4 4.7 9.4 10.4 15.4 10.3 9.8 12.8 14.1 15.7 Total of 1 or more Science Diploma Exams 51.7 48.3 49.7 59.0 52.7 59.2 57.3 59.4 59.8 60.5 Français 30-1 0.0 0.0 0.0 0.0 0.0 0.3 0.3 0.3 0.2 0.3 French Language Arts 30 2.1 1.8 1.2 1.7 3.4 2.6 2.7 2.7 2.8 2.8 Total of 1 or more French Diploma Exams 2.1 1.8 1.2 1.7 3.4 2.9 3.0 2.9 3.0 3.1 Notes: 1. Data values have been suppressed where the number of respondents/students is fewer than 6. Suppression is marked with an asterisk (*).
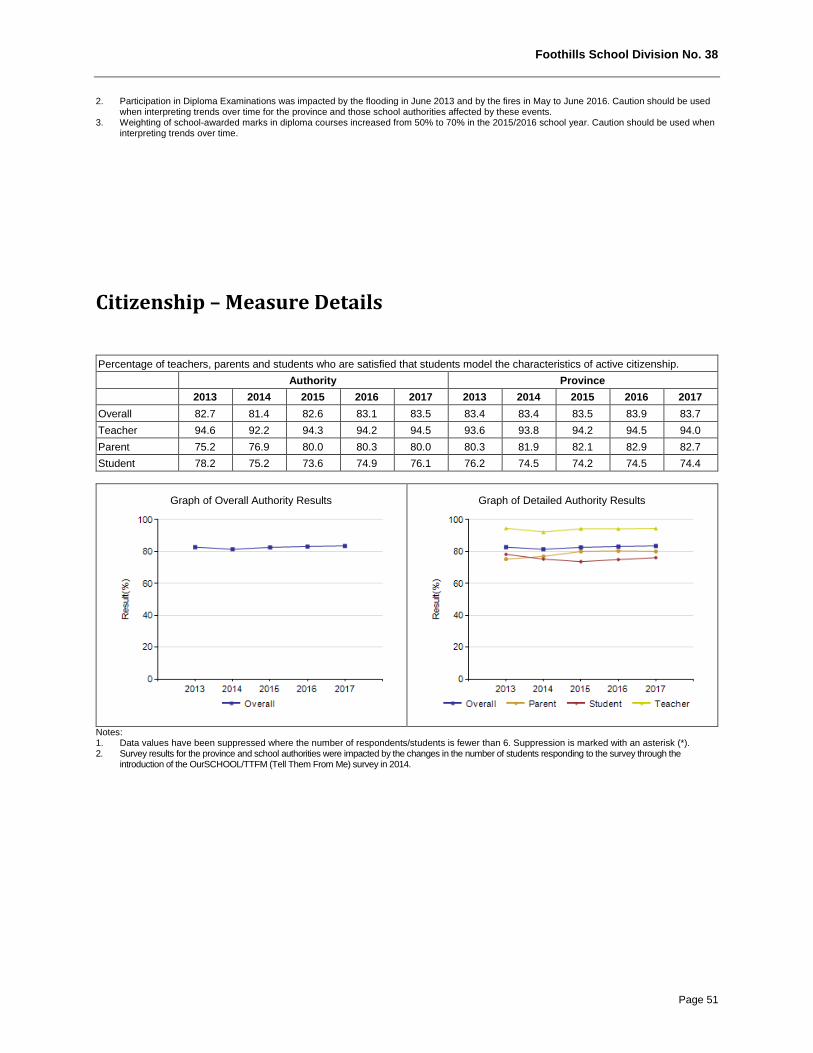
Foothills School Division No. 38
Page 51
2. Participation in Diploma Examinations was impacted by the flooding in June 2013 and by the fires in May to June 2016. Caution should be used when interpreting trends over time for the province and those school authorities affected by these events.
3. Weighting of school-awarded marks in diploma courses increased from 50% to 70% in the 2015/2016 school year. Caution should be used when interpreting trends over time.
Citizenship – Measure Details
Percentage of teachers, parents and students who are satisfied that students model the characteristics of active citizenship. Authority Province 2013 2014 2015 2016 2017 2013 2014 2015 2016 2017 Overall 82.7 81.4 82.6 83.1 83.5 83.4 83.4 83.5 83.9 83.7 Teacher 94.6 92.2 94.3 94.2 94.5 93.6 93.8 94.2 94.5 94.0 Parent 75.2 76.9 80.0 80.3 80.0 80.3 81.9 82.1 82.9 82.7 Student 78.2 75.2 73.6 74.9 76.1 76.2 74.5 74.2 74.5 74.4
Graph of Overall Authority Results
Graph of Detailed Authority Results
Notes: 1. Data values have been suppressed where the number of respondents/students is fewer than 6. Suppression is marked with an asterisk (*). 2. Survey results for the province and school authorities were impacted by the changes in the number of students responding to the survey through the
introduction of the OurSCHOOL/TTFM (Tell Them From Me) survey in 2014.
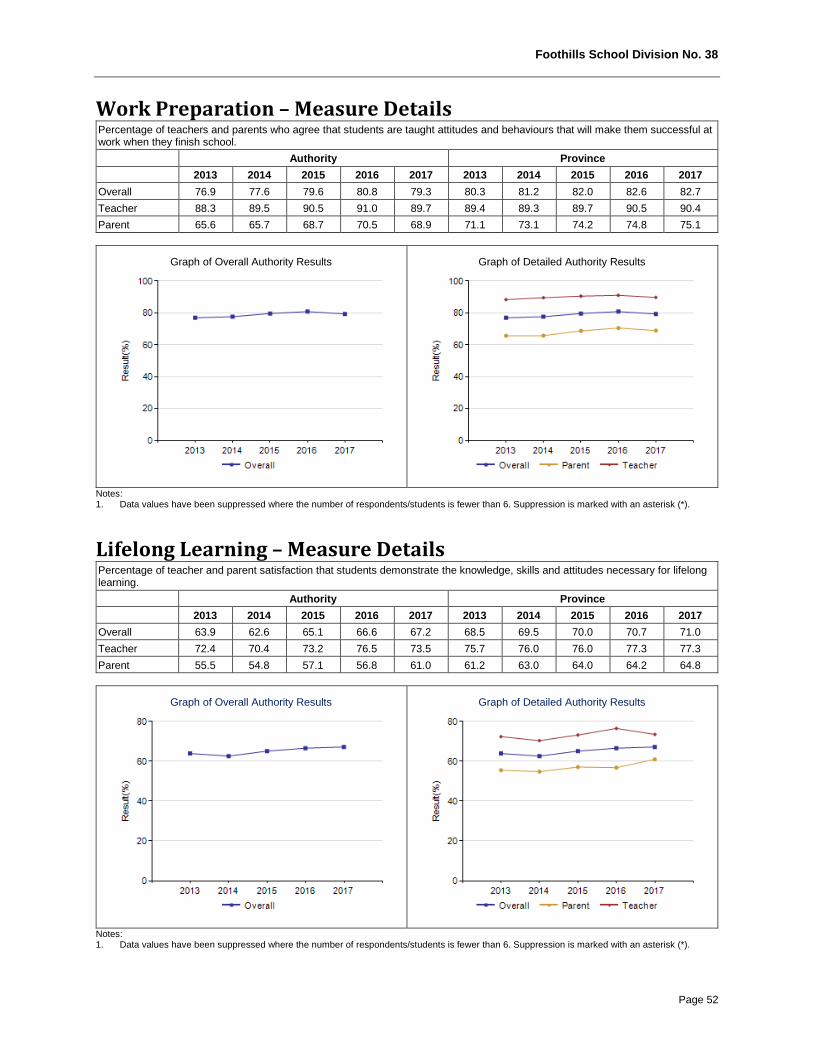
Foothills School Division No. 38
Page 52
Work Preparation – Measure Details Percentage of teachers and parents who agree that students are taught attitudes and behaviours that will make them successful at work when they finish school. Authority Province 2013 2014 2015 2016 2017 2013 2014 2015 2016 2017 Overall 76.9 77.6 79.6 80.8 79.3 80.3 81.2 82.0 82.6 82.7 Teacher 88.3 89.5 90.5 91.0 89.7 89.4 89.3 89.7 90.5 90.4 Parent 65.6 65.7 68.7 70.5 68.9 71.1 73.1 74.2 74.8 75.1
Graph of Overall Authority Results
Graph of Detailed Authority Results
Notes: 1. Data values have been suppressed where the number of respondents/students is fewer than 6. Suppression is marked with an asterisk (*).
Lifelong Learning – Measure Details Percentage of teacher and parent satisfaction that students demonstrate the knowledge, skills and attitudes necessary for lifelong learning. Authority Province 2013 2014 2015 2016 2017 2013 2014 2015 2016 2017 Overall 63.9 62.6 65.1 66.6 67.2 68.5 69.5 70.0 70.7 71.0 Teacher 72.4 70.4 73.2 76.5 73.5 75.7 76.0 76.0 77.3 77.3 Parent 55.5 54.8 57.1 56.8 61.0 61.2 63.0 64.0 64.2 64.8
Graph of Overall Authority Results
Graph of Detailed Authority Results
Notes: 1. Data values have been suppressed where the number of respondents/students is fewer than 6. Suppression is marked with an asterisk (*).
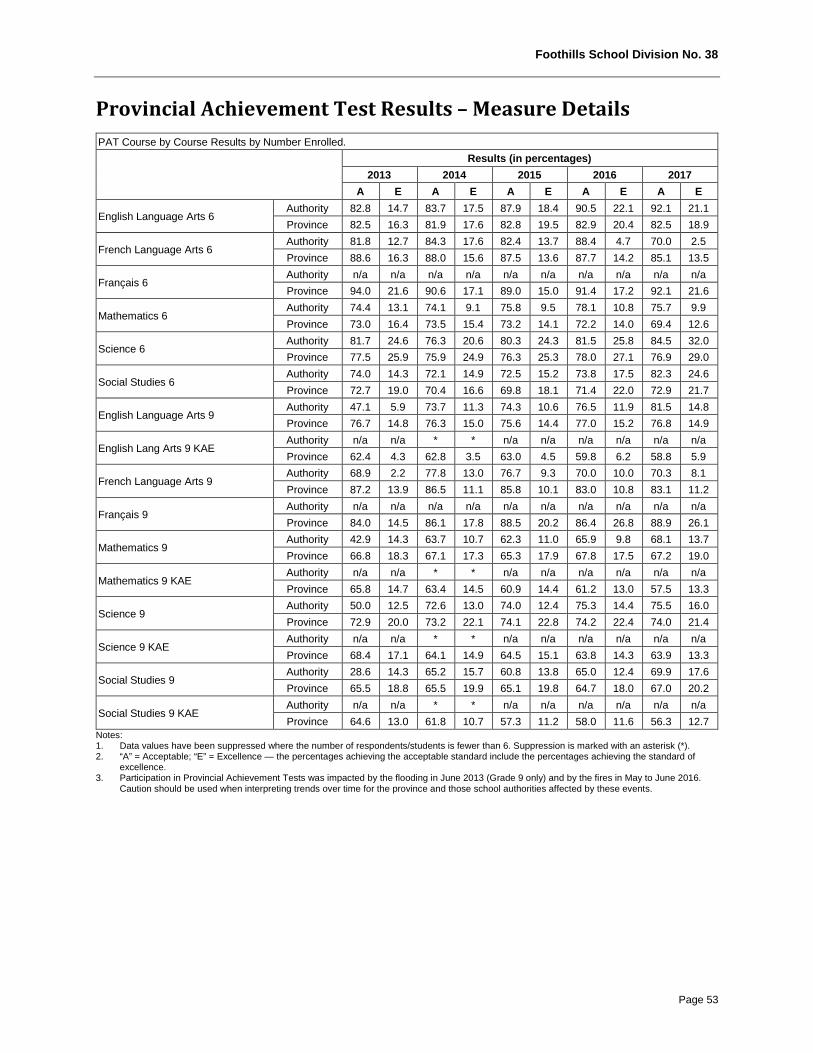
Foothills School Division No. 38
Page 53
Provincial Achievement Test Results – Measure Details PAT Course by Course Results by Number Enrolled. Results (in percentages)
2013 2014 2015 2016 2017 A E A E A E A E A E
English Language Arts 6 Authority 82.8 14.7 83.7 17.5 87.9 18.4 90.5 22.1 92.1 21.1 Province 82.5 16.3 81.9 17.6 82.8 19.5 82.9 20.4 82.5 18.9
French Language Arts 6 Authority 81.8 12.7 84.3 17.6 82.4 13.7 88.4 4.7 70.0 2.5 Province 88.6 16.3 88.0 15.6 87.5 13.6 87.7 14.2 85.1 13.5
Français 6 Authority n/a n/a n/a n/a n/a n/a n/a n/a n/a n/a Province 94.0 21.6 90.6 17.1 89.0 15.0 91.4 17.2 92.1 21.6
Mathematics 6 Authority 74.4 13.1 74.1 9.1 75.8 9.5 78.1 10.8 75.7 9.9 Province 73.0 16.4 73.5 15.4 73.2 14.1 72.2 14.0 69.4 12.6
Science 6 Authority 81.7 24.6 76.3 20.6 80.3 24.3 81.5 25.8 84.5 32.0 Province 77.5 25.9 75.9 24.9 76.3 25.3 78.0 27.1 76.9 29.0
Social Studies 6 Authority 74.0 14.3 72.1 14.9 72.5 15.2 73.8 17.5 82.3 24.6 Province 72.7 19.0 70.4 16.6 69.8 18.1 71.4 22.0 72.9 21.7
English Language Arts 9 Authority 47.1 5.9 73.7 11.3 74.3 10.6 76.5 11.9 81.5 14.8 Province 76.7 14.8 76.3 15.0 75.6 14.4 77.0 15.2 76.8 14.9
English Lang Arts 9 KAE Authority n/a n/a * * n/a n/a n/a n/a n/a n/a Province 62.4 4.3 62.8 3.5 63.0 4.5 59.8 6.2 58.8 5.9
French Language Arts 9 Authority 68.9 2.2 77.8 13.0 76.7 9.3 70.0 10.0 70.3 8.1 Province 87.2 13.9 86.5 11.1 85.8 10.1 83.0 10.8 83.1 11.2
Français 9 Authority n/a n/a n/a n/a n/a n/a n/a n/a n/a n/a Province 84.0 14.5 86.1 17.8 88.5 20.2 86.4 26.8 88.9 26.1
Mathematics 9 Authority 42.9 14.3 63.7 10.7 62.3 11.0 65.9 9.8 68.1 13.7 Province 66.8 18.3 67.1 17.3 65.3 17.9 67.8 17.5 67.2 19.0
Mathematics 9 KAE Authority n/a n/a * * n/a n/a n/a n/a n/a n/a Province 65.8 14.7 63.4 14.5 60.9 14.4 61.2 13.0 57.5 13.3
Science 9 Authority 50.0 12.5 72.6 13.0 74.0 12.4 75.3 14.4 75.5 16.0 Province 72.9 20.0 73.2 22.1 74.1 22.8 74.2 22.4 74.0 21.4
Science 9 KAE Authority n/a n/a * * n/a n/a n/a n/a n/a n/a Province 68.4 17.1 64.1 14.9 64.5 15.1 63.8 14.3 63.9 13.3
Social Studies 9 Authority 28.6 14.3 65.2 15.7 60.8 13.8 65.0 12.4 69.9 17.6 Province 65.5 18.8 65.5 19.9 65.1 19.8 64.7 18.0 67.0 20.2
Social Studies 9 KAE Authority n/a n/a * * n/a n/a n/a n/a n/a n/a Province 64.6 13.0 61.8 10.7 57.3 11.2 58.0 11.6 56.3 12.7
Notes: 1. Data values have been suppressed where the number of respondents/students is fewer than 6. Suppression is marked with an asterisk (*). 2. “A” = Acceptable; “E” = Excellence — the percentages achieving the acceptable standard include the percentages achieving the standard of
excellence. 3. Participation in Provincial Achievement Tests was impacted by the flooding in June 2013 (Grade 9 only) and by the fires in May to June 2016.
Caution should be used when interpreting trends over time for the province and those school authorities affected by these events.
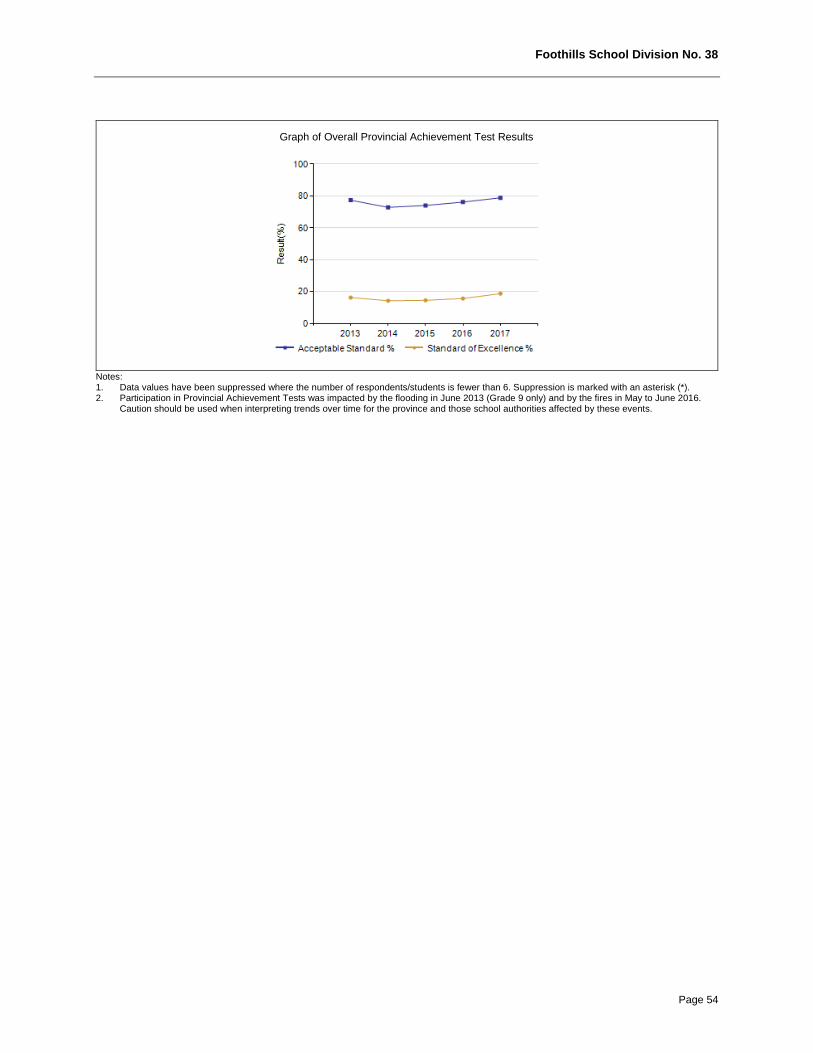
Foothills School Division No. 38
Page 54
Graph of Overall Provincial Achievement Test Results
Notes: 1. Data values have been suppressed where the number of respondents/students is fewer than 6. Suppression is marked with an asterisk (*). 2. Participation in Provincial Achievement Tests was impacted by the flooding in June 2013 (Grade 9 only) and by the fires in May to June 2016.
Caution should be used when interpreting trends over time for the province and those school authorities affected by these events.
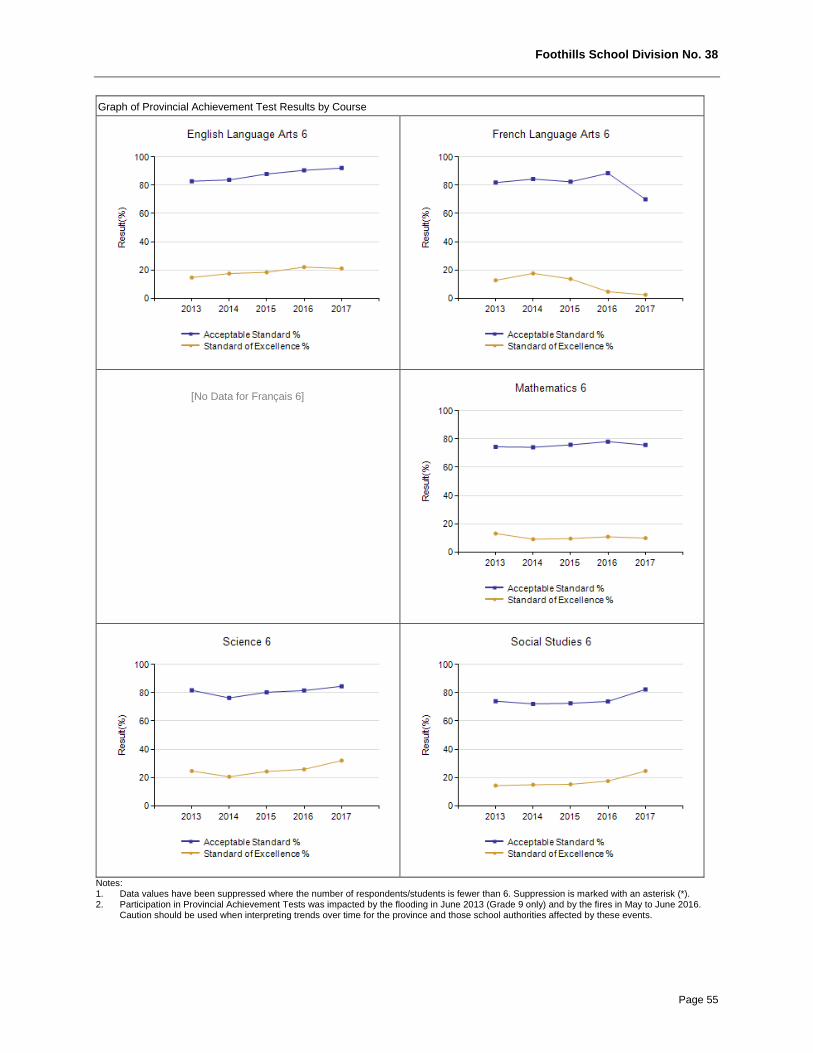
Foothills School Division No. 38
Page 55
Graph of Provincial Achievement Test Results by Course
[No Data for Français 6]
Notes: 1. Data values have been suppressed where the number of respondents/students is fewer than 6. Suppression is marked with an asterisk (*). 2. Participation in Provincial Achievement Tests was impacted by the flooding in June 2013 (Grade 9 only) and by the fires in May to June 2016.
Caution should be used when interpreting trends over time for the province and those school authorities affected by these events.
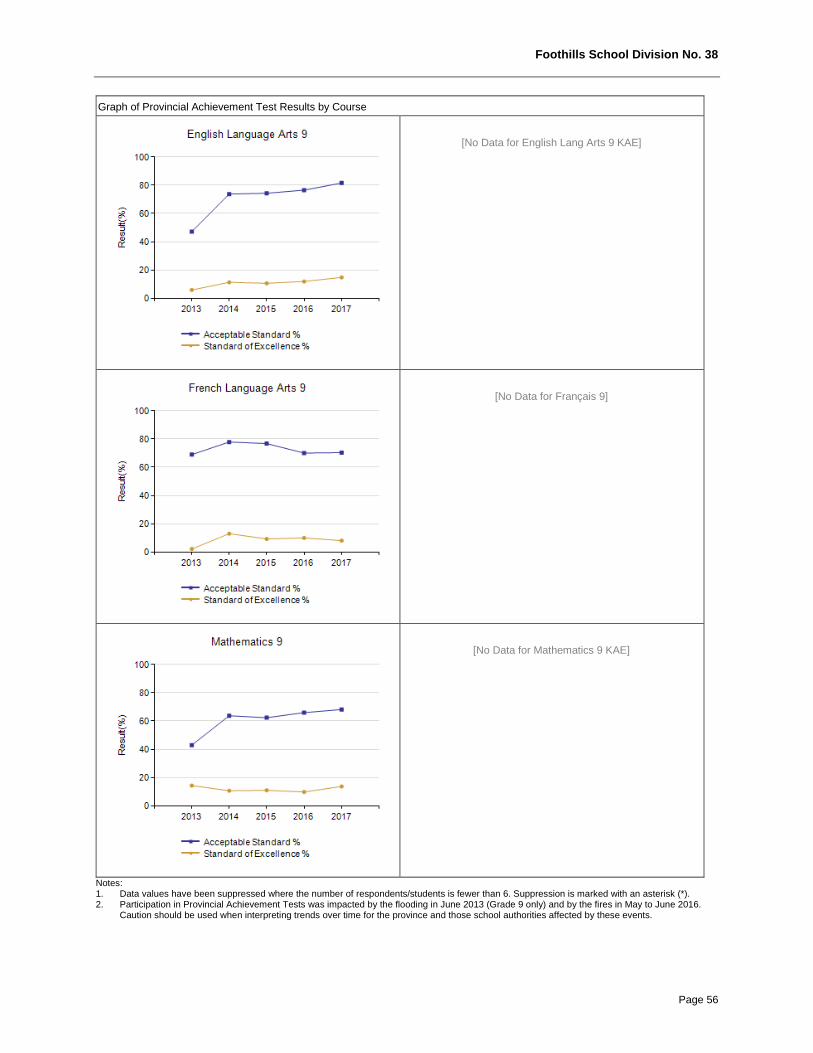
Foothills School Division No. 38
Page 56
Graph of Provincial Achievement Test Results by Course
[No Data for English Lang Arts 9 KAE]
[No Data for Français 9]
[No Data for Mathematics 9 KAE]
Notes: 1. Data values have been suppressed where the number of respondents/students is fewer than 6. Suppression is marked with an asterisk (*). 2. Participation in Provincial Achievement Tests was impacted by the flooding in June 2013 (Grade 9 only) and by the fires in May to June 2016.
Caution should be used when interpreting trends over time for the province and those school authorities affected by these events.
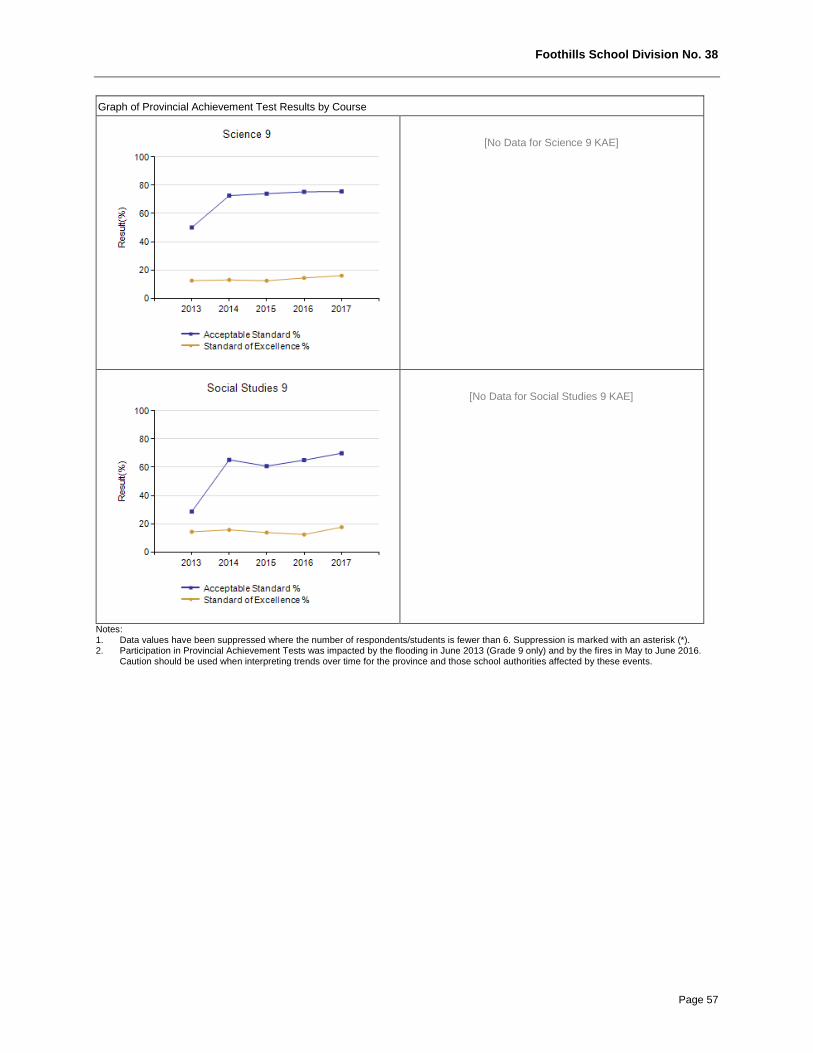
Foothills School Division No. 38
Page 57
Graph of Provincial Achievement Test Results by Course
[No Data for Science 9 KAE]
[No Data for Social Studies 9 KAE]
Notes: 1. Data values have been suppressed where the number of respondents/students is fewer than 6. Suppression is marked with an asterisk (*). 2. Participation in Provincial Achievement Tests was impacted by the flooding in June 2013 (Grade 9 only) and by the fires in May to June 2016.
Caution should be used when interpreting trends over time for the province and those school authorities affected by these events.
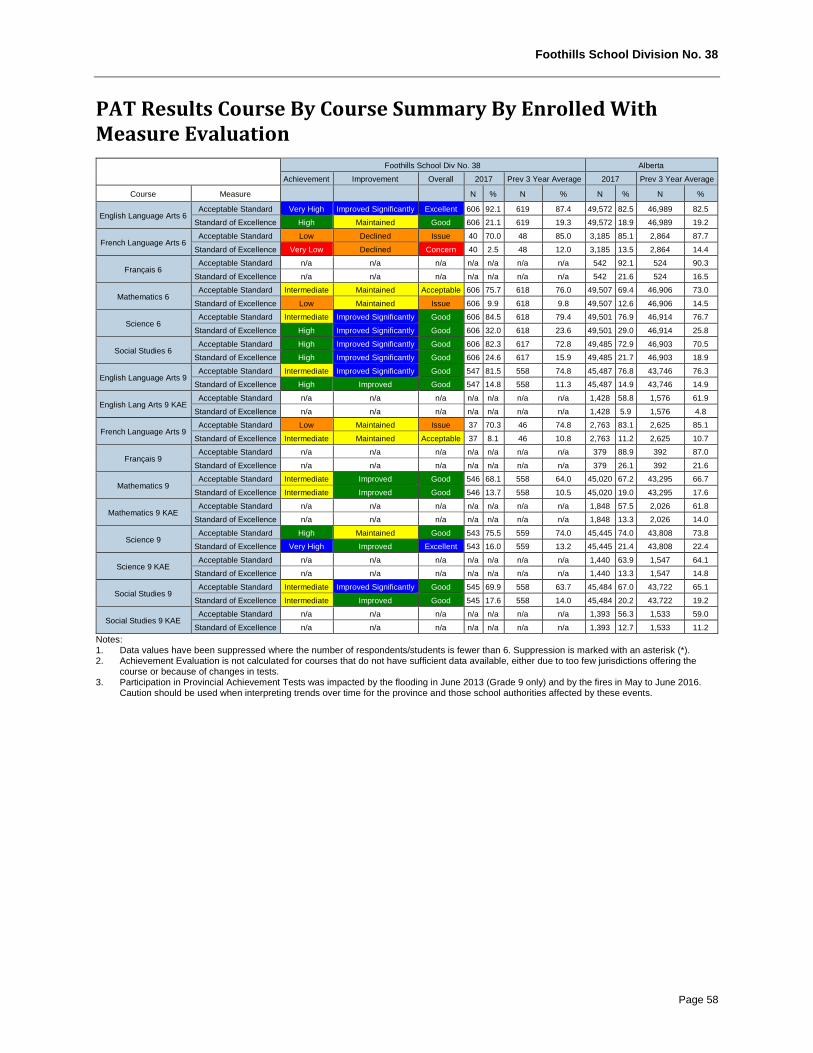
Foothills School Division No. 38
Page 58
PAT Results Course By Course Summary By Enrolled With Measure Evaluation
Foothills School Div No. 38 Alberta
Achievement Improvement Overall 2017 Prev 3 Year Average 2017 Prev 3 Year Average Course Measure N % N % N % N %
English Language Arts 6 Acceptable Standard Very High Improved Significantly Excellent 606 92.1 619 87.4 49,572 82.5 46,989 82.5 Standard of Excellence High Maintained Good 606 21.1 619 19.3 49,572 18.9 46,989 19.2
French Language Arts 6 Acceptable Standard Low Declined Issue 40 70.0 48 85.0 3,185 85.1 2,864 87.7 Standard of Excellence Very Low Declined Concern 40 2.5 48 12.0 3,185 13.5 2,864 14.4
Français 6 Acceptable Standard n/a n/a n/a n/a n/a n/a n/a 542 92.1 524 90.3 Standard of Excellence n/a n/a n/a n/a n/a n/a n/a 542 21.6 524 16.5
Mathematics 6 Acceptable Standard Intermediate Maintained Acceptable 606 75.7 618 76.0 49,507 69.4 46,906 73.0 Standard of Excellence Low Maintained Issue 606 9.9 618 9.8 49,507 12.6 46,906 14.5
Science 6 Acceptable Standard Intermediate Improved Significantly Good 606 84.5 618 79.4 49,501 76.9 46,914 76.7 Standard of Excellence High Improved Significantly Good 606 32.0 618 23.6 49,501 29.0 46,914 25.8
Social Studies 6 Acceptable Standard High Improved Significantly Good 606 82.3 617 72.8 49,485 72.9 46,903 70.5 Standard of Excellence High Improved Significantly Good 606 24.6 617 15.9 49,485 21.7 46,903 18.9
English Language Arts 9 Acceptable Standard Intermediate Improved Significantly Good 547 81.5 558 74.8 45,487 76.8 43,746 76.3 Standard of Excellence High Improved Good 547 14.8 558 11.3 45,487 14.9 43,746 14.9
English Lang Arts 9 KAE Acceptable Standard n/a n/a n/a n/a n/a n/a n/a 1,428 58.8 1,576 61.9 Standard of Excellence n/a n/a n/a n/a n/a n/a n/a 1,428 5.9 1,576 4.8
French Language Arts 9 Acceptable Standard Low Maintained Issue 37 70.3 46 74.8 2,763 83.1 2,625 85.1 Standard of Excellence Intermediate Maintained Acceptable 37 8.1 46 10.8 2,763 11.2 2,625 10.7
Français 9 Acceptable Standard n/a n/a n/a n/a n/a n/a n/a 379 88.9 392 87.0 Standard of Excellence n/a n/a n/a n/a n/a n/a n/a 379 26.1 392 21.6
Mathematics 9 Acceptable Standard Intermediate Improved Good 546 68.1 558 64.0 45,020 67.2 43,295 66.7 Standard of Excellence Intermediate Improved Good 546 13.7 558 10.5 45,020 19.0 43,295 17.6
Mathematics 9 KAE Acceptable Standard n/a n/a n/a n/a n/a n/a n/a 1,848 57.5 2,026 61.8 Standard of Excellence n/a n/a n/a n/a n/a n/a n/a 1,848 13.3 2,026 14.0
Science 9 Acceptable Standard High Maintained Good 543 75.5 559 74.0 45,445 74.0 43,808 73.8 Standard of Excellence Very High Improved Excellent 543 16.0 559 13.2 45,445 21.4 43,808 22.4
Science 9 KAE Acceptable Standard n/a n/a n/a n/a n/a n/a n/a 1,440 63.9 1,547 64.1 Standard of Excellence n/a n/a n/a n/a n/a n/a n/a 1,440 13.3 1,547 14.8
Social Studies 9 Acceptable Standard Intermediate Improved Significantly Good 545 69.9 558 63.7 45,484 67.0 43,722 65.1 Standard of Excellence Intermediate Improved Good 545 17.6 558 14.0 45,484 20.2 43,722 19.2
Social Studies 9 KAE Acceptable Standard n/a n/a n/a n/a n/a n/a n/a 1,393 56.3 1,533 59.0 Standard of Excellence n/a n/a n/a n/a n/a n/a n/a 1,393 12.7 1,533 11.2
Notes: 1. Data values have been suppressed where the number of respondents/students is fewer than 6. Suppression is marked with an asterisk (*). 2. Achievement Evaluation is not calculated for courses that do not have sufficient data available, either due to too few jurisdictions offering the
course or because of changes in tests. 3. Participation in Provincial Achievement Tests was impacted by the flooding in June 2013 (Grade 9 only) and by the fires in May to June 2016.
Caution should be used when interpreting trends over time for the province and those school authorities affected by these events.
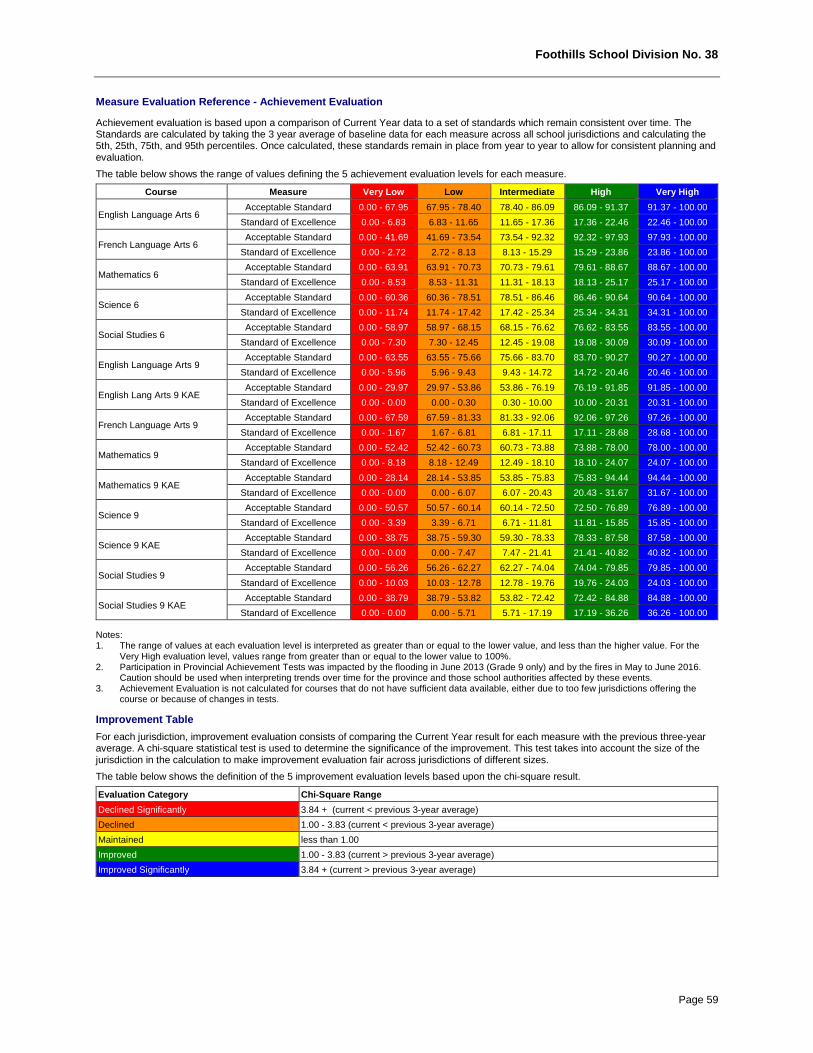
Foothills School Division No. 38
Page 59
Measure Evaluation Reference - Achievement Evaluation Achievement evaluation is based upon a comparison of Current Year data to a set of standards which remain consistent over time. The Standards are calculated by taking the 3 year average of baseline data for each measure across all school jurisdictions and calculating the 5th, 25th, 75th, and 95th percentiles. Once calculated, these standards remain in place from year to year to allow for consistent planning and evaluation. The table below shows the range of values defining the 5 achievement evaluation levels for each measure.
Course Measure Very Low Low Intermediate High Very High English Language Arts 6 Acceptable Standard 0.00 - 67.95 67.95 - 78.40 78.40 - 86.09 86.09 - 91.37 91.37 - 100.00
Standard of Excellence 0.00 - 6.83 6.83 - 11.65 11.65 - 17.36 17.36 - 22.46 22.46 - 100.00 French Language Arts 6 Acceptable Standard 0.00 - 41.69 41.69 - 73.54 73.54 - 92.32 92.32 - 97.93 97.93 - 100.00
Standard of Excellence 0.00 - 2.72 2.72 - 8.13 8.13 - 15.29 15.29 - 23.86 23.86 - 100.00 Mathematics 6 Acceptable Standard 0.00 - 63.91 63.91 - 70.73 70.73 - 79.61 79.61 - 88.67 88.67 - 100.00
Standard of Excellence 0.00 - 8.53 8.53 - 11.31 11.31 - 18.13 18.13 - 25.17 25.17 - 100.00 Science 6 Acceptable Standard 0.00 - 60.36 60.36 - 78.51 78.51 - 86.46 86.46 - 90.64 90.64 - 100.00
Standard of Excellence 0.00 - 11.74 11.74 - 17.42 17.42 - 25.34 25.34 - 34.31 34.31 - 100.00 Social Studies 6 Acceptable Standard 0.00 - 58.97 58.97 - 68.15 68.15 - 76.62 76.62 - 83.55 83.55 - 100.00
Standard of Excellence 0.00 - 7.30 7.30 - 12.45 12.45 - 19.08 19.08 - 30.09 30.09 - 100.00 English Language Arts 9 Acceptable Standard 0.00 - 63.55 63.55 - 75.66 75.66 - 83.70 83.70 - 90.27 90.27 - 100.00
Standard of Excellence 0.00 - 5.96 5.96 - 9.43 9.43 - 14.72 14.72 - 20.46 20.46 - 100.00 English Lang Arts 9 KAE Acceptable Standard 0.00 - 29.97 29.97 - 53.86 53.86 - 76.19 76.19 - 91.85 91.85 - 100.00
Standard of Excellence 0.00 - 0.00 0.00 - 0.30 0.30 - 10.00 10.00 - 20.31 20.31 - 100.00 French Language Arts 9 Acceptable Standard 0.00 - 67.59 67.59 - 81.33 81.33 - 92.06 92.06 - 97.26 97.26 - 100.00
Standard of Excellence 0.00 - 1.67 1.67 - 6.81 6.81 - 17.11 17.11 - 28.68 28.68 - 100.00 Mathematics 9 Acceptable Standard 0.00 - 52.42 52.42 - 60.73 60.73 - 73.88 73.88 - 78.00 78.00 - 100.00
Standard of Excellence 0.00 - 8.18 8.18 - 12.49 12.49 - 18.10 18.10 - 24.07 24.07 - 100.00 Mathematics 9 KAE Acceptable Standard 0.00 - 28.14 28.14 - 53.85 53.85 - 75.83 75.83 - 94.44 94.44 - 100.00
Standard of Excellence 0.00 - 0.00 0.00 - 6.07 6.07 - 20.43 20.43 - 31.67 31.67 - 100.00 Science 9 Acceptable Standard 0.00 - 50.57 50.57 - 60.14 60.14 - 72.50 72.50 - 76.89 76.89 - 100.00
Standard of Excellence 0.00 - 3.39 3.39 - 6.71 6.71 - 11.81 11.81 - 15.85 15.85 - 100.00 Science 9 KAE Acceptable Standard 0.00 - 38.75 38.75 - 59.30 59.30 - 78.33 78.33 - 87.58 87.58 - 100.00
Standard of Excellence 0.00 - 0.00 0.00 - 7.47 7.47 - 21.41 21.41 - 40.82 40.82 - 100.00 Social Studies 9 Acceptable Standard 0.00 - 56.26 56.26 - 62.27 62.27 - 74.04 74.04 - 79.85 79.85 - 100.00
Standard of Excellence 0.00 - 10.03 10.03 - 12.78 12.78 - 19.76 19.76 - 24.03 24.03 - 100.00 Social Studies 9 KAE Acceptable Standard 0.00 - 38.79 38.79 - 53.82 53.82 - 72.42 72.42 - 84.88 84.88 - 100.00
Standard of Excellence 0.00 - 0.00 0.00 - 5.71 5.71 - 17.19 17.19 - 36.26 36.26 - 100.00 Notes: 1. The range of values at each evaluation level is interpreted as greater than or equal to the lower value, and less than the higher value. For the
Very High evaluation level, values range from greater than or equal to the lower value to 100%. 2. Participation in Provincial Achievement Tests was impacted by the flooding in June 2013 (Grade 9 only) and by the fires in May to June 2016.
Caution should be used when interpreting trends over time for the province and those school authorities affected by these events. 3. Achievement Evaluation is not calculated for courses that do not have sufficient data available, either due to too few jurisdictions offering the
course or because of changes in tests. Improvement Table For each jurisdiction, improvement evaluation consists of comparing the Current Year result for each measure with the previous three-year average. A chi-square statistical test is used to determine the significance of the improvement. This test takes into account the size of the jurisdiction in the calculation to make improvement evaluation fair across jurisdictions of different sizes. The table below shows the definition of the 5 improvement evaluation levels based upon the chi-square result.
Evaluation Category Chi-Square Range Declined Significantly 3.84 + (current < previous 3-year average) Declined 1.00 - 3.83 (current < previous 3-year average) Maintained less than 1.00 Improved 1.00 - 3.83 (current > previous 3-year average) Improved Significantly 3.84 + (current > previous 3-year average)
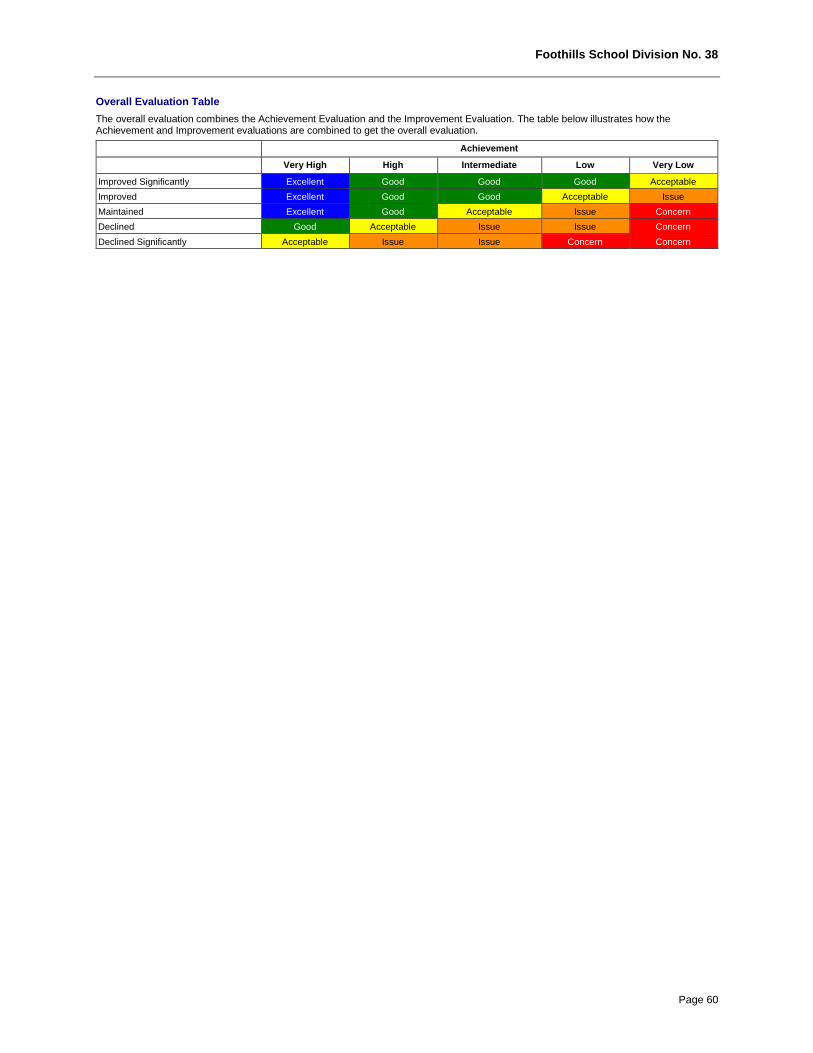
Foothills School Division No. 38
Page 60
Overall Evaluation Table The overall evaluation combines the Achievement Evaluation and the Improvement Evaluation. The table below illustrates how the Achievement and Improvement evaluations are combined to get the overall evaluation.
Achievement Very High High Intermediate Low Very Low Improved Significantly Excellent Good Good Good Acceptable Improved Excellent Good Good Acceptable Issue Maintained Excellent Good Acceptable Issue Concern Declined Good Acceptable Issue Issue Concern Declined Significantly Acceptable Issue Issue Concern Concern
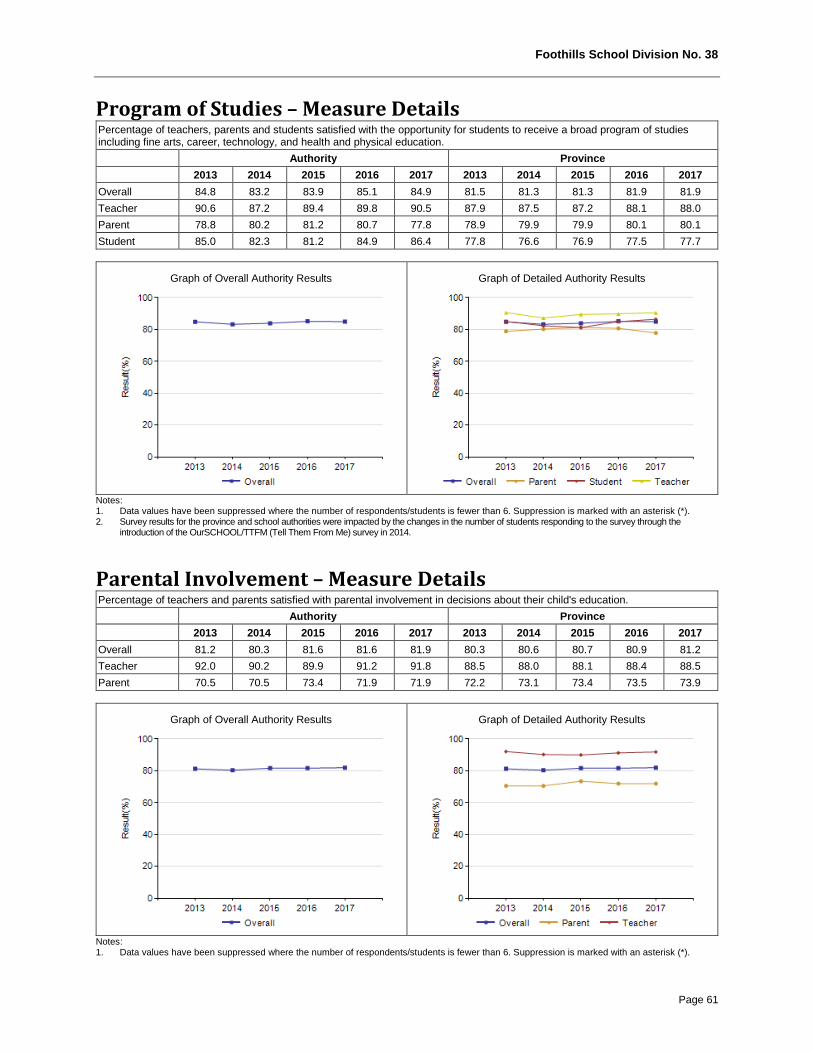
Foothills School Division No. 38
Page 61
Program of Studies – Measure Details Percentage of teachers, parents and students satisfied with the opportunity for students to receive a broad program of studies including fine arts, career, technology, and health and physical education. Authority Province 2013 2014 2015 2016 2017 2013 2014 2015 2016 2017 Overall 84.8 83.2 83.9 85.1 84.9 81.5 81.3 81.3 81.9 81.9 Teacher 90.6 87.2 89.4 89.8 90.5 87.9 87.5 87.2 88.1 88.0 Parent 78.8 80.2 81.2 80.7 77.8 78.9 79.9 79.9 80.1 80.1 Student 85.0 82.3 81.2 84.9 86.4 77.8 76.6 76.9 77.5 77.7
Graph of Overall Authority Results
Graph of Detailed Authority Results
Notes: 1. Data values have been suppressed where the number of respondents/students is fewer than 6. Suppression is marked with an asterisk (*). 2. Survey results for the province and school authorities were impacted by the changes in the number of students responding to the survey through the
introduction of the OurSCHOOL/TTFM (Tell Them From Me) survey in 2014.
Parental Involvement – Measure Details Percentage of teachers and parents satisfied with parental involvement in decisions about their child's education. Authority Province 2013 2014 2015 2016 2017 2013 2014 2015 2016 2017 Overall 81.2 80.3 81.6 81.6 81.9 80.3 80.6 80.7 80.9 81.2 Teacher 92.0 90.2 89.9 91.2 91.8 88.5 88.0 88.1 88.4 88.5 Parent 70.5 70.5 73.4 71.9 71.9 72.2 73.1 73.4 73.5 73.9
Graph of Overall Authority Results
Graph of Detailed Authority Results
Notes: 1. Data values have been suppressed where the number of respondents/students is fewer than 6. Suppression is marked with an asterisk (*).
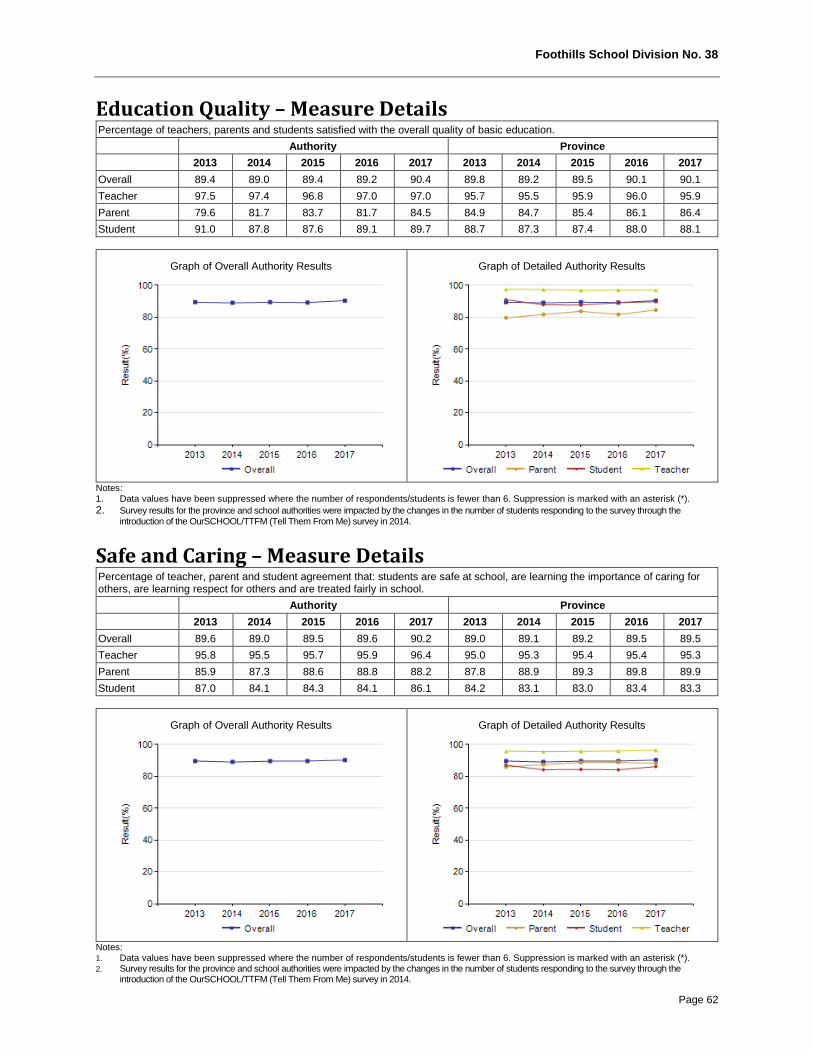
Foothills School Division No. 38
Page 62
Education Quality – Measure Details Percentage of teachers, parents and students satisfied with the overall quality of basic education. Authority Province 2013 2014 2015 2016 2017 2013 2014 2015 2016 2017 Overall 89.4 89.0 89.4 89.2 90.4 89.8 89.2 89.5 90.1 90.1 Teacher 97.5 97.4 96.8 97.0 97.0 95.7 95.5 95.9 96.0 95.9 Parent 79.6 81.7 83.7 81.7 84.5 84.9 84.7 85.4 86.1 86.4 Student 91.0 87.8 87.6 89.1 89.7 88.7 87.3 87.4 88.0 88.1
Graph of Overall Authority Results
Graph of Detailed Authority Results
Notes: 1. Data values have been suppressed where the number of respondents/students is fewer than 6. Suppression is marked with an asterisk (*). 2. Survey results for the province and school authorities were impacted by the changes in the number of students responding to the survey through the
introduction of the OurSCHOOL/TTFM (Tell Them From Me) survey in 2014.
Safe and Caring – Measure Details Percentage of teacher, parent and student agreement that: students are safe at school, are learning the importance of caring for others, are learning respect for others and are treated fairly in school. Authority Province 2013 2014 2015 2016 2017 2013 2014 2015 2016 2017 Overall 89.6 89.0 89.5 89.6 90.2 89.0 89.1 89.2 89.5 89.5 Teacher 95.8 95.5 95.7 95.9 96.4 95.0 95.3 95.4 95.4 95.3 Parent 85.9 87.3 88.6 88.8 88.2 87.8 88.9 89.3 89.8 89.9 Student 87.0 84.1 84.3 84.1 86.1 84.2 83.1 83.0 83.4 83.3
Graph of Overall Authority Results
Graph of Detailed Authority Results
Notes: 1. Data values have been suppressed where the number of respondents/students is fewer than 6. Suppression is marked with an asterisk (*). 2. Survey results for the province and school authorities were impacted by the changes in the number of students responding to the survey through the
introduction of the OurSCHOOL/TTFM (Tell Them From Me) survey in 2014.