Embed Size (px)
Citation preview

Threshold 21 Model Project for
Conservation International:
Strategic Options for Papua, Indonesia
January 2003
Millennium Institute 1117 N. 19th Street, suite 900
Arlington, VA 22209


Contents
Introduction..........................................................................................................................5 Challenges Facing Papua, Indonesia....................................................................................6 Brief Description of the T21 Model.....................................................................................8 Summary of the Results of the Initial Scenarios................................................................10 Overall Lessons..................................................................................................................17 Conclusions........................................................................................................................18 Annex I: Detailed Description of the T21 Model ..............Error! Bookmark not defined. Annex II: Script for Running Current Version of the Papua T21 ModelError! Bookmark not defined.


INTRODUCTION Conservation International (CI) has been working in Indonesia for years to promote environmental conservation while encouraging sustainable development and poverty alleviation. CI has also been seeking improved tools to support its analysis and exercises, in particular tools that can be shared with local staff, stakeholders, and counterparts in government. In this regard, CI contacted the Millennium Institute (MI) about application of its Threshold21 (T21) model to Papua, Indonesia, with these goals:
! Reach out to development planners and parliamentarians in Papua to examine, in concert, various development strategies in Papua; help determine which options offered the best chances for real development and protection of the spectacular environment in Papua; and to help formulate more desirable strategic paths.
! Empower CI staff with a methodology to examine options with “potentially the same or greater development gains with significantly less biodiversity loss” and test whether the dynamic modeling approach contained in T21 would be applicable to similar exercises in other countries.
! Develop the analytical basis for dialogues with IFIs and other donors about the sustainability and efficacy of different policy options.
! Create a new methodology that moves beyond the current bifurcation of development and conservation approaches to a more integrated approach looking at development, conservation, poverty alleviation strategies on a large scale with an instrument that integrates these different and often conflicting interests so that the full implications of various strategies and scenarios can be examined
These were ambitious goals, and CI carefully evaluated a number of options before selecting T21 as the best tool for this exercise. In addition to its own evaluation, CI contracted with the University of Bergen, which specializes in integrated approaches to the dynamics of development, to evaluate available tools. That evaluation is attached in Annex I. Its conclusion supported the choice of T21 by a wide margin. As a result, CI contracted MI to develop a version of the standard T21 model to apply to the Papua province of Indonesia and to examine the impacts of several strategies on both development and conservation.
Based on extensive consultations with CI experts on Papua, a large body of provincial data supplied by CI field staff, and MI’s experience in model development and Indonesia, MI constructed a customized version of its standard model for Papua to look at development strategies. The data collection at the provincial level was a major effort and has contributed to the accuracy of this innovative new model. This is the first time MI has adapted its model to a single province in a country, which has also led to a number of very useful new formulations. The current version of the model demonstrates several development options and allows the users to test different levels of the strategies included. Further training of CI staff in using and modifying the model is planned for Spring 2003. The training will offer the opportunity for additional refinements in the structure and options considered in the model.

The rest of this report will examine the particular challenges addressed in Papua, the adaptations of T21 to address these challenges, the results of the scenarios examined along with overall lessons from the work so far, and the initial conclusions from the exercise.
CHALLENGES FACING PAPUA, INDONESIA Papua, Indonesian covers the Western part of the island of Papua. It is a region characterized by an incredible abundance of natural resources -- precious metals, natural gas and oil, and especially rich primary forest. The immense potential for profit from extracting these resources creates a tremendous incentive to exploit them. The danger is that such activities will be conducted with little regard for the precious, and largely undisturbed, natural environment that still exists in Papua. It will be a huge challenge to decide how to manage the production of resource-based products while protecting the environment.
Papua has a relatively small population, primarily concentrated around two urban settlements. Indigenous people who have benefited very little from the resources extracted to date inhabit the remaining land. The benefits accrued to the government, Indonesian elite, and foreign investors. It is interesting that in terms of Gross Regional Product, Papua has one of the highest per capita incomes of all provinces in Indonesia, but is also suffers the highest rate of poverty and lowest levels of human development indicators. Very little value of the production has stayed in Papua, and Papuans have benefited very little from their plentiful natural resources. Another challenge is to assure that Papuans benefit from the development of their resources.
Over the past several years, Indonesia has undertaken an ambitious process of decentralization, moving from one of the most centralized to one of the most decentralized governments in Southeast Asia. The transition has been more successful than many expected, but still has a long way to go. While substantial resources and manpower have been transferred to the regional and provincial levels, much remains to be done to assure effective governance at provincial and local levels. The region is now facing an extremely delicate moment, and the choices and the politics of the local government will dramatically influence Papuan’s development opportunities. The challenge here is whether local government will be able to meet the needs and expectations of the Papuan people from the substantial resources that will be available from the island’s natural resources, or whether local officials will cave in to foreign interests and allow expansion of the kind of natural resource exploitation that has characterized past regimes.
The region is currently facing pressures to undertake a number of development projects, largely conceived under the old model of massive exploitation. Numbers of large-scale investment projects are under examination concerning infrastructure interventions, the construction of a trans regional highway network and a series of gigantic hydropower plants. Requests for expanded land concessions for mining, agriculture (palm oil production in particular), and timber production are among the more prominent issues on the local government’s agenda. The new government is more locally tied and accountable than has been the case in the past. It is trying to identify and support the needs of the

local people, and it is seeking to assure that the local people benefit much more than in the past from any new activities. CI is commendably assisting the government in these efforts.
The T21 modeling tool adapted to Papua by Conservation International and the Millennium Institute is designed to examine the impacts of the identified development strategies and programs on the well being of the people and the environment of Papua. The model is able to integrate the impacts across the economic, social, and environmental aspects and show likely scenarios for different approaches. This will enable the government and its stakeholders to more effectively evaluate the full range of results of policy options. In particular, it will demonstrate the impacts on the environment and show how much of the benefits will remain in Papua and increase the welfare of the Papuans, compared to how much is transferred abroad. The model will help all stakeholders find the best way to meet the challenges outlined above – weighing results of different approaches over a 20-year horizon and across all sectors.
For this exercise, four specific scenarios have been identified and investigated in detail to illustrate the nature of the challenges and the impacts of different development paths. The scenarios were developed in close consultation with CI experts and government officials. They do not cover all options by any means, but illustrate the power of the model to analyze the impacts of several high profile options. The next stage of this project will be to engage and train more CI and Papuan experts and to extend and adapt the model further to cover more alternative paths and options.
1. The first scenario, what we call the Base Case, is a continuation of present trends and it includes:
! A small investment in Hydropower, financed by the government, but not directed specifically to support mining or industrial activities.
! A relatively small investment in expansion of the road system based on extending ongoing projects, also financed by the government.
! An increase in expenditure on Education based on the recently announced intentions of the Papuan government and a normal expenditure for Health care.
! Continuation of other government expenditures and policies in other areas and of private sector activity
2. The second scenario, called Big M, looks at the impacts of a major expansion of development and resource exploitation in the Mamberamo region in central Papua. The area is rich in hydropower, minerals, and timber. It has been the object of several proposals for major interventions by foreign investors aimed at building access roads, exploiting resources in the area, and building related industrial activities. At this stage, there is no final blueprint of an overall approach, so we have put together a likely set of investments based on the material available, including:
! A large investment in hydropower (dams and power stations) with the financing shared between foreign investors and government.
! A huge increase in mining and industrial activities financed by foreign capital. ! A moderate increase of investment in roads in that area financed by the government.

3. The third scenario, called More Roads, looks at the impacts of proposals to undertake a massive increase in road building throughout the region. The current road network is poor in Papua and more construction is needed. However, there are serious questions as to how many roads are needed, how soon, and where. Several proposals have been made urging the creation of a vast network of roads, many of them cutting through areas of very low population and rich forest resources. The leading proposal is for a foreign firm to build the roads at no direct financial cost to the government. It would accept full logging rights for five kilometers on each side of the roads built. And it would exercise these rights to earn money to pay for the roads and earn a profit. Other proposals would require other financing. For this scenario, we include
! An accelerated process of road construction financed by logging concessions around the road.
! A small investment in Hydropower and power lines, financed by the government.
4. The fourth scenario, called Urban Development, captures the impacts of a new and integrated program by the government to promote development of existing urban areas with emphasis on supporting Papuan entrepreneurs, facilitating transport among urban areas, and improving human services. This approach differs from the others in that it focuses on activities that improve the production capacity of the Papuan region rather than on exploiting natural resources. It is a more sustainable strategy, and one with greater benefits for the local people. This scenario looks at an initial set of policy options. As the local government becomes more involved in using the model, it should be able to design and test scenarios with many more options. The fourth scenario includes
! Increased expenditures in education and health care (including clean water). ! Enhanced Credit to local, small, and medium enterprises supporting local industries
and services. ! Targeted investment in roads to reduce or eliminate transport bottlenecks among
urban areas, but with no new roads or logging concessions in forest areas. ! Modest investment in energy production and distribution to substitute hydropower for
diesel in order to lower power costs in urban areas.
BRIEF DESCRIPTION OF THE T21 MODEL The current adaptation of the model to Papua will enhance the ability of CI and local government to analyze economic, social, and environmental prospects of the province in an integrated manner. The Planning agency and other interested parties will be able to explore and evaluate the effectiveness of specific policy choices to achieve the targets presented in the country’s strategic vision, analyze the impacts of alternative development paths, and examine the potential risks posed by external factors on Papua’s long-term prospects. This tool will also greatly enhance the capacity of the provincial government to negotiate with the central government and potential donors—such as USAID, UNDP (and other UN agencies), and World Bank. Use of this flexible and quantitative tool will empower the newly decentralized Papuan government in many of its relations.

The T21 Model has been developed over several years to address issues of sustainable development and integrated policy formulation approaches. The T21 model is based on systems dynamics and uses the powerful Vensim modeling package. This package rapidly solves large and complex models and presents the results in a transparent manner. The model produces quantitative and graphic results over 5-50 year time horizons. Twenty years is a typical period of analysis. The model’s open structure and easy-to-use interface can show the time path of any variable or set of variables over the time horizon being considered. The model demonstrates the impacts of policies or structural changes and encourages graphic comparison of the impacts of different policy or structural choices. This greatly facilitates dialogues on these options and alternatives within the government, with partner aid agencies, and with civil society. Pre-evaluating impacts from different programs assists in the process of making better strategic choices. The model also allows setting results-based targets and monitoring progress.
The Millennium Institute’s Threshold 21 Integrated Development Model is a planning tool that provides the opportunity to meet these requirements. The model
! Integrates economic, environmental, and social elements through a whole systems approach;
• Transfers capacity, facilitates participation, and builds consensus through an easy-to-understand, diagrammatic interface;
• Customizes its structure to fit the country through data input and structural modification;
• Informs long-term development strategy by simulating future impacts of alternative policy scenarios; and
• Produces output for key policy documents such as the World Bank Country Assistance Strategy (CAS), the IMF Policy Framework Paper (PFP), the National Budget, and the UN Development Assistance Framework (UNDAF).
The first stage of this project has created an initial version of the model for Papua and generated several scenarios to illustrate its power. T21-Papua consists of a T21core, which includes the common features and problems of most of nations everywhere in the world, and country-specific additions. The core part has been modified to represent, at best, the characteristics of Papua, and the most reliable and updated data sources have been used to implement it. The country specific part of the model has been created on purpose to incorporate critical and peculiar aspects of the socio-economic-environmental system of Papua and to include some of the most likely policy options actually at hand. In particular, we introduced:
! The dam sector, to take into account the dynamics related to investments in this sector, focusing on the electricity price and availability and the environmental impact of the projects;
! The highway sector allows the user to test various policies relative to road construction, modifying length and characteristics of the roads. The sector aims in particular to evaluate the impacts on economic activities and of the legal and illegal logging of construction projects;
! The land sector represents the dynamics of land use and degradation. It particularly supports monitoring the forest loss generated from many possible human activities;

! The workers migration sector represents the migration phenomena related to the labor force supply/demand balance. This is a key factor in the calculation of the real economic benefit for local people deriving from the different economic activities;
! The GNrP (Gross National regional Product)1 function, which calculates the share of total production by sector which stays in Papua, thus defining the actual benefits accruing to local people from the different economic activities. The difference between GDrP and GNrP generated by the model is a key element in the evaluation of possible development alternatives;
! The small-scale credit sector, which considers how the funds made available from the government for this kind of initiative are used and how they influence the region’s development;
! The government debt sector, which gives policy makers the possibility of using deficit financing to sustain expenditure and monitors the actual financial situation and creditworthiness of the region;
Following this initial stage, the project should:
! Engage country stakeholders in the process of building the model ! Train country experts to maintain and update the country-specific model. ! Support the Ministers of Finance and Planning and others in the processes of
formulating development strategies within the model. ! Assist in planning and facilitating participatory workshops on the use, features, and
capability of the T21- Papua model. ! Technical support will be provided as needed by MI via internet.
SUMMARY OF THE RESULTS OF THE INITIAL SCENARIOS The Base Case provides a useful point of reference for comparison of policy alternatives. It continues the basic trends of the past decade, with modifications to reflect recent decisions already implemented, such as the increase in expenditures on education instituted last year. The scenarios are not to be viewed as predictions of actual levels, but as a possible, even likely, evolution of the major variables and indicators. We make no claim that these scenario values will actually be obtained. No one can predict the future. Running alternative scenarios will show the relative change in variables and indicators compared to the base run, or other alternatives. Given the comprehensive and integrated structure of the model, the direction of impacts of an alternative – higher or lower – is pretty likely to be correct as is the comparison of different scenarios – which do better or worse on different variables or indicators. One can have confidence in the comparative results, especially if the differences are substantial. Thus, comparing results is a powerful application of this T21 tool.
1 The concepts of Gross National regional Product and Gross Domestic regional Product (GDrP) are calculated for the province in the same manner as GNP and GDP are for a nation, but looking only flows within the province. In this case, it highlights how much of the value of what is produced in Papua remains in Papua, compared to how much flows to the rest of Indonesia or abroad.
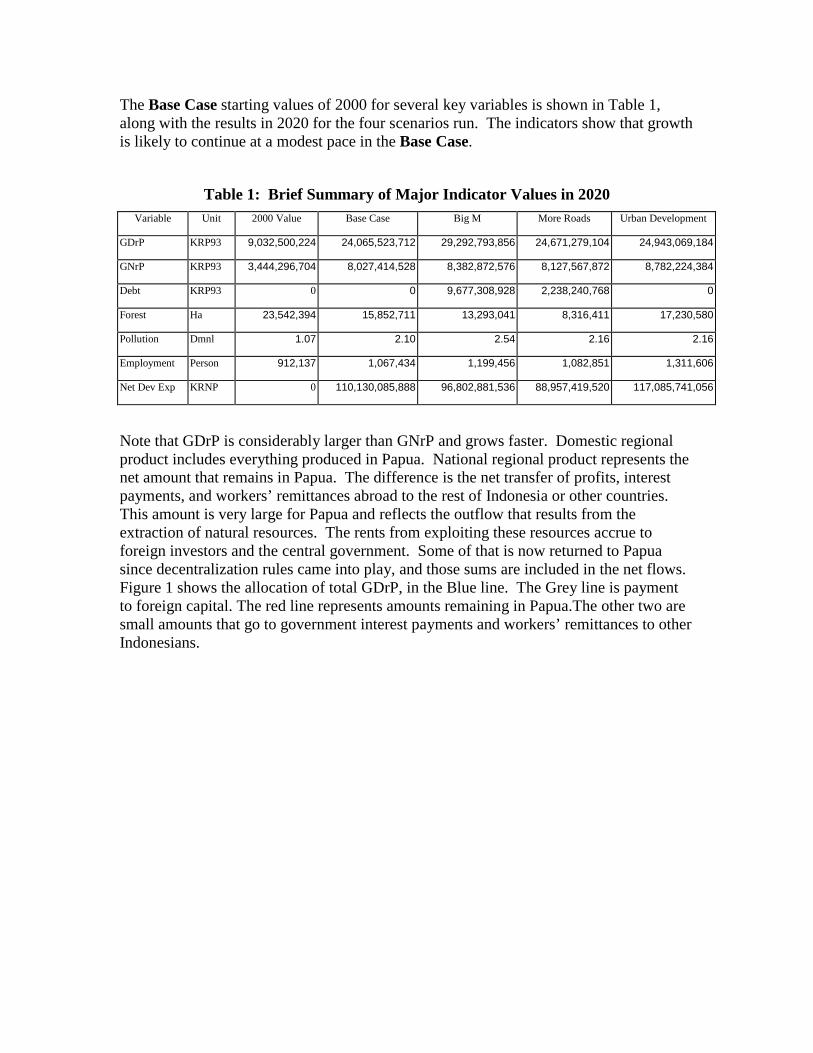
The Base Case starting values of 2000 for several key variables is shown in Table 1, along with the results in 2020 for the four scenarios run. The indicators show that growth is likely to continue at a modest pace in the Base Case.
Table 1: Brief Summary of Major Indicator Values in 2020 Variable Unit 2000 Value Base Case Big M More Roads Urban Development
GDrP KRP93 9,032,500,224 24,065,523,712 29,292,793,856 24,671,279,104 24,943,069,184
GNrP KRP93 3,444,296,704 8,027,414,528 8,382,872,576 8,127,567,872 8,782,224,384
Debt KRP93 0 0 9,677,308,928 2,238,240,768 0
Forest Ha 23,542,394 15,852,711 13,293,041 8,316,411 17,230,580
Pollution Dmnl 1.07 2.10 2.54 2.16 2.16
Employment Person 912,137 1,067,434 1,199,456 1,082,851 1,311,606
Net Dev Exp KRNP 0 110,130,085,888 96,802,881,536 88,957,419,520 117,085,741,056
Note that GDrP is considerably larger than GNrP and grows faster. Domestic regional product includes everything produced in Papua. National regional product represents the net amount that remains in Papua. The difference is the net transfer of profits, interest payments, and workers’ remittances abroad to the rest of Indonesia or other countries. This amount is very large for Papua and reflects the outflow that results from the extraction of natural resources. The rents from exploiting these resources accrue to foreign investors and the central government. Some of that is now returned to Papua since decentralization rules came into play, and those sums are included in the net flows. Figure 1 shows the allocation of total GDrP, in the Blue line. The Grey line is payment to foreign capital. The red line represents amounts remaining in Papua.The other two are small amounts that go to government interest payments and workers’ remittances to other Indonesians.

Figure 1: Gross Domestic regional Product Composition (GDrP)
The Papuan government does not accumulate any debt in this case, and the reduction in forests is moderate at xx%. Pollution levels also increase somewhat. Employment grows in line with regional product and net development expenditures amount to 88 Trillion Rhupees. The indicators in these tables are a small set of the total number of variables that are produced and can be reviewed. Figure 2 shows a larger list of variables that the model is set up to display for the casual user. Experienced users can display and compare paths of any variables. By displaying and comparing the impacts of different policy options on a range of variables, policy makers and other stakeholders can see what is likely to happen under different assumptions, which will greatly assist in supporting more informed policy decisions.

Figure 2: Major Indicators
Turning to the second scenario, Big M, we can see the effects of instituting major resource exploitation projects centered in the Mamberamo Valley. The activities include large investments in hydropower, mining, and forestry with related downstream processing and transport construction. Compared to the Base Case, this scenario’s primary positive impact is the Gross Provincial Product of the region (GDrP) will rapidly increase, due to the foreign investments, increased resource production, and their multiplication effect on local activities. Table 1 shows that GDrP is 20% higher than in the Base Case in 2020. Employment is also higher though it turns out that most of the increase in jobs, especially the high paying ones, goes to non-Papuans. Development expenditures do rise due to the higher level of resource revenues returned to the local government, but much of this is absorbed funding the infrastructure for the Mamberamo projects.
However, the negative effects are significant. The local economy will only partially benefit from this investment. Note that GNrP increases only marginally faster than in the Base Case, rising only 2%. Most of the increased jobs will go to migrant workers as locals lack the skills needed, and most of the profits generated will go to foreign companies. The disruption of the environment would be huge. Significantly more forests are cleared, pollution goes up substantially compared to the base case, and the risk

of flooding and soil erosion would be increased. Traditional social and cultural activities and relations would be dramatically affected.
This comparison illustrates the importance of looking at a range of indicators. The most commonly used GDrP shows substantial improvement. However, looking more closely at what happens to Papua, we see that little of the benefit actually accrues to Papua; most goes to elsewhere. In addition, the Papuans pay a high price in terms of the impacts of environmental disruption and pollution on their health and safety; their ability to improve their own agricultural output, the burden of higher debt, and the loss of forest resources. Carefully reviewing the other indicators will fill out this picture on the comparison of the Big M scenario with the Base Case. Viewed in this light, the Big M scenario does not look so attractive and suggests other options be considered to see what most benefits the Papuans and their objectives.
The third scenario, More Roads, looks at the impacts of another approach that has been promoted. It aims at greatly expanding the road network-- based on the Trans Irian highway project -- to open up many opportunities and to do so at little direct cost to the government. Granting logging concessions will cover the road building costs. This scenario does not assume additional development projects beyond what would normally be generated by the increase in activity following road building. Since it is expected that the foreign contractors2 will bring most of the skilled employees from abroad, additional work beyond logging is not expected. Compared to the Base Case, there is little increase in GDrP or GNrP. The increased road building was offset against the increased logging due to the ‘goods-exchange’ nature of the deal. If the road building were paid for directly with revenues from increased logging, the GDrP would be higher, but little else would change.
Among the positive effects reduced transportation costs would benefit all production activities, and new small industries or service activities would emerge to support road construction. Simultaneously, large forest loss is caused by logging legal concessions around the road and the illegal logging that accompanies roads through existing forests. The loss of forests is almost twice that incurred in the Big M case.
In this scenario, government debt increases compared to the Base Case due to the increase in collateral development expenditures for hydropower, though it is lower than in Big M. There is also a relatively modest increase in pollution due to the increase in use of road transportation. The loss of forestland would also imply a general degradation of the environment (erosion, flooding) and biodiversity loss. Highway maintenance costs would be relevant, raising these expenditures in the budget and ultimately reducing the funds available for other expenditure, such as education or health care. This scenario suggests that building More Roads, especially with little regard for their location or the kinds of linkages they improve, will not have strong beneficial effects beyond the road building sectors. Under this approach, there will be significant cost to natural resources. Simply building roads is not a viable strategy though some increase in transport will be an important element in a more integrated strategy.
2 The initial proposal was from Korean firms, who bring in most of their workers.

The fourth scenario, called Urban Development, looks at a more integrated strategy focused on improving development prospects for a large part of the Papuan population living in the urban areas (about 70% of the Papuan population). This scenario combines programs to improve conditions for local entrepreneurs and industries, including access to credit, better roads3 among urban areas, and cheaper and more reliable access to electricity. Expenditures on health, education, and sanitation are also increased. These measures are indicative of a strategy focused on promoting locally based growth. As the model is further refined, more options and policies can be examined to see how they work.
There are many positive effects from this strategy. Both GDrP and GNrP increase compared to the Base Case, mostly the latter as the growth comes from increased local activities in Papua. (See Figure 3.) GNrP is higher than in the Big M case. Perhaps more interesting, looking at the paths shown in the graphs, the GNrP of the Urban Development scenario is accelerating, which is slowing in the Big M scenario. This is encouraging and illustrates that there is often a moderate time lag in making sustainable development strategies work. Natural resources are preserved with forests declining less than in the Base Case. Pollution is slightly higher than in the Base Case. This is due in large part to more economic activity and transport. There is less danger of soil erosion and risks of biodiversity loss. The amount of government funds available for development expenditure increases as the local tax base increases. This supports the increased expenditure on education, health care, and other infrastructure. The government is able to do this without assuming any long-term debt liabilities. More jobs are created for locals as a result of the stronger local basis of the economy. The degree of economic dependence from foreign investors would be reduced.
One aspect of this scenario that is interesting is how the policies affect the population dynamics. These are illustrated in the comparative population pyramid for the Urban Development scenario compared to the Base Case shown in Figure 4. Higher expenditures on health reduce mortality across the age cohorts. While higher per capita income and education levels lead to lower fertility. As a result, population growth is slightly lower, but there are relatively more active Papuans in the productive age cohorts and reducing the number of children. This lowers the dependency ratio and creates a situation where more rapid growth can occur.
This Urban Development case demonstrates how a more balanced approach can generate positive benefits for the local population in an affordable and sustainable manner. These scenarios are illustrative of the range of options that the T21 model for Papua can address. As further work is done with the model, a much wider range of options can be designed and tested. In this initial version, users do have the option of modifying each of these scenarios and looking at the results. The attached script for the model describes how the model can be run.
33 The model has been designed to allow users to distinguish between construction of ‘good’ roads that connect population and production centers, thereby improving productivity, and ‘bad’ roads that open up previously inaccessible areas.

Figure 3: GNrP Comparison
GNrP Comparison10 B
7.5 B
5 B
2.5 B
01995 2000 2005 2010 2015 2020
Time (Year)
GNrP : Base KRP93/YearGNrP : BigM KRP93/YearGNrP : MoreRoad KRP93/YearGNrP : Urban KRP93/Year
Figure 4: Comparative Population Pyramid

OVERALL LESSONS Developing the T21 model for Papua and running these initial scenarios have already contributed to increasing our understanding of the issues facing the country and how they may be resolved. Calibrating the model has required the collection and analysis of significant data on Papua. Much is readily available from government sources, but other key information involved research that has uncovered valuable information. Formulating the hypotheses for the scenarios meant that CI staff had to define the likely forms of the options to be considered and their key characteristics. MI staff then had to translate that information into structural relations that could be included in the model. This process of defining the options quantitatively and so they can be modeled is a very important element in this project. Going forward, the process of defining and quantifying the costs and benefits of alternative strategies will play a key role in helping all parties understand what is being proposed and how it will affect prospects across all sectors. This is as important as the eventual scenarios and is a central element in the consultation process.4
Looking at the initial results, several lessons become clear. The first is that it is important to consider what happens to Gross National regional Product as well as Gross Domestic regional Product. The former measures the amount of production that accrues to Papua. The latter includes the part which is transferred to beneficiaries overseas. For Papua, the difference is enormous. Looking only at GDrP, the most frequently used measure, can be misleading. While this is particularly relevant to Papua, it can be important to other countries or regions where natural resources are exploited by outsiders.
The second lesson relates to the time frame of benefits. The T21 model, by running out 20-year scenarios (and it could go longer) shows the pattern of results over time. This allows users to see where policies may have immediate impact and others have impact over the longer term. In some cases, the longer-term benefits from policies may outweigh the stronger short-term impact of other options. Decision makers may have to make critical choices between shorter and longer-term impacts. In the scenarios discussed above, the immediate impacts of the Big M option for locals are outweighed in the longer term by the benefits to the locals from the Urban Development scenario. The latter scenario has more beneficial impact on the environment and the government finances. This may be preferable from the point of view of the Papuans. They gain more in the medium term and preserve their resources for the future. The non-Papuans do not gain as much.
The third lesson is that benefits from policies can be distributed quite differently, even though the overall numbers are similar. The distribution between Papuans and non-Papuans has just been highlighted. In addition, the scenarios show that approaches have different results for government debt, pollution, and employment. In addition, the model shows that the More Roads approach benefits the logging industry and construction industry and those who would make a living exploiting the resources in the interior where most of the new roads are build, while the Urban Development approach benefits more of the larger urban population and is much less disruptive to indigenous people and the
4 This is one reason it is important to develop local capacity to modify and run the model so that it becomes an integral part of the dynamic planning process.

environment. The ability to look at the distribution of results from various policies is important to improving decision-making.
Finally, by developing and examining the results of alternate options and scenarios, model users gain knowledge on how policies interact across sectors. The impacts of education, health care on production are demonstrated, as are the impacts of development approaches on the environment and the risks that result from environmental damage. As these relations are better understood, policy makers can develop and design new and better options to consider and eventually create superior strategies. This is why the primary objective of the project is to transfer the capacity to use this tool to local experts.
MI will conduct a T21 training program in March for CI staff from Indonesia, Papuans, and other Indonesians. They will then be able to improve the database and structure of the model, design new scenarios and options to consider, and involve many stakeholders in strategy creation in an effective and transparent manner. Using the model will also help them better understand the working of the Papuan social, economic, and environmental structure and the nature of different policy options. As they become more experienced, local users will be able extend the model in new directions and integrate it into their planning process.
CONCLUSIONS The exercise to date has gone a long way toward meeting CI’s initial goals. The T21 application to Papua provides a powerful tool to allow planners and parliamentarians to examine options of development paths and see the impacts across a broad range of variables. The four scenarios presented give a general idea of the results of strategic options. The scenarios also indicate that focusing more on developing local productive capacity will lead to more sustainable development than simply exploiting Papua’s natural resources, where the results accrue largely to non-Papuans. These scenarios are indicative and more analysis will be needed to examine the details of variations of the options and different measures to achieve better results. The model and related work empowers CI staff and other users with a potent methodology to examine a variety of development options to examine which offers the best overall results in a medium term, dynamic situation. The model compares development strategies across many variables and allows users to see the trade-offs: good results in some areas and poor results in others. Of particular importance is the ability of the model to include impacts of policies on the environment. The examples cited above showed significantly different results on the forests and air pollution in the summary tables. More information is available in the details of the model, which can be readily displayed. The model is transparent and its users are able to trace backwards any of the results to better understand why certain results occur.5 Based on our experience with the model, it is clear that this kind of analysis can be used in other countries. The T21 model is designed to be readily adapted to different countries.
5 Or on occasion find and repair a flaw in the model.

The model has been used in other countries in the course of dialogues with the World Bank and other IFIs. One version was adapted for the World Bank in Guyana to look at the impacts of several structural reforms and demonstrate to the government how the short-term adverse effects could be mitigated to make the reforms acceptable. The government is now proceeding with the first stage of the reform.6 Another version was developed with the Malawi government, who later used it as the basis for writing their PFP. The PFP was used in the negotiations with the IMF and was accepted by the IMF Board. UNFPA has just contracted with MI to develop a specialized model that would highlight population and reproduction issues. It is designed to be adapted to any country at the request of country offices. There is no doubt that the Papua version of the model will be a valuable tool in discussions with the central government, IFIs, and other parties about the strategic options facing Papua.
And finally it is clear that this methodology spans the gaps between the economy and social and environmental issues. It integrates economic sectors with social and environmental sectors and can readily track the results of policies across these sectors and evaluate the impacts on poverty and other important factors. The model presents these results in a transparent manner over a 20-year time horizon. Scenarios can be compared in relation to any of the included variables.
The initial stage of this project demonstrates that the T21 approach will meet CI’s goals as set out above. The initial scenarios also show how approaches in Papua will have varied results across economic, social, and environmental sectors. These scenarios will be refined in the course of the next stage of the process. CI staff will be trained in the model and will contribute to further development of the model. At some point, use of the model should be fully transferred to CI and Papuan staff.
6 The reforms comprised privatizing the bauxite mines and reforming the sugar industry and closing about half the production capacity. The major adverse effect was massive layoffs, and these could be mitigated through severance payments and carefully directed government investment.