Embed Size (px)
Citation preview

Carbon in the Classroom: Lessons from a Simulation of California’s Electricity Market Under a Stringent Cap and Trade System
by
Mark C. Thurber Frank A. Wolak Associate Director Director, PESD Program on Energy and Sustainable Development (PESD) Department of Economics Stanford University Stanford University Stanford, CA 94305 USA Stanford, CA 94305 USA [email protected] [email protected]
June 14, 2013

DRAFT – Not for citation or distribution
Thurber and Wolak, 14 June 2013 2
Abstract
This paper summarizes the lessons learned from implementing a realistic, game-based simulation of California’s electricity market with a cap-and-trade market for greenhouse gas (GHG) emissions and fixed-price forward financial contracts for energy. Sophisticated market participants competed to maximize their returns under stressed (high carbon price) market conditions. Our simulation exhibited volatile carbon prices that could be influenced by strategic behavior of market participants. General uncertainty around carbon price as well as the deployment of strategies that were privately profitable but adversely affected overall market efficiency resulted in total costs of electricity supply that were significantly higher than would have been observed in perfectly competitive allowance and electricity markets. These findings have several important policy implications. First, policy measures that increase the transparency and liquidity of the carbon allowance market would make both the allowance market and the electricity market work better. In our simulation, all market participants showed a strong unilateral desire to limit the amount of information publicly available about conditions in the carbon market, much to the detriment of market performance. Second, guardrails that constrain market outcomes, such as price floors and ceilings, can play a valuable role by limiting carbon price volatility. Third, position and holding limits can reduce the ability and incentive of market participants to attempt strategies that, while privately profitable, have a negative impact on overall market efficiency.

DRAFT – Not for citation or distribution
Thurber and Wolak, 14 June 2013 3
1. Introduction
To prevent a meltdown of California’s nascent cap and trade market for greenhouse gas emissions (GHG) allowances, it important to have a clear idea of how the market could fail. In order to better understand how such a cap and trade market might function under high carbon price conditions, we ran a simulation at Stanford University’s Graduate School of Business of California’s electricity market with a cap and trade system. The core of our simulation was the “Electricity Strategy Game” (ESG) created by Severin Borenstein and James Bushnell (Borenstein and Bushnell 2011). The basic ESG framework allows players to offer generation into wholesale electricity markets. We layered on top of this setup additional market elements including fixed-price forward contracts for electricity, random outage probabilities, and tradable carbon allowances, of which about 80% were allocated with the generation assets and the remaining 20% purchased through an auction. Because our simulation was able to capture strategic decision making by sophisticated players in a realistic market environment, our observations complement those derived from theoretical models of an economy under cap and trade (Goulder et al 2010), empirical analyses of cap and trade markets (Fabra and Reguant 2013; Reguant and Ellerman 2008; Wara 2008), forecasts of cap and trade supply-demand balance (Borenstein et al 2013), and previous game-based simulations of a highly stylized nature (Goeree et al 2010; Wråke et al 2010; Buckley et al 2005).
We observed several striking phenomena in our game. First, all teams in our game found themselves in a position to prefer higher carbon prices, even those holding high-emitting power plants. This occurred both because electricity price rose faster with carbon price than the average variable cost of producing output for most teams and because the initial allowance allocations functioned as “free money” with a face value that could be increased through the unilateral actions of market participants. Second, teams exercised unilateral market power on both selling and buying sides of the carbon allowance market, with the net effect being a carbon price far above that which would have been expected based on allowance supply and demand in a perfectly competitive market. Third, disagreement among teams over the appropriate price of carbon allowances combined with the exercise of unilateral market power in both electricity and allowance markets dramatically increased electricity prices and often resulted in the use of a more expensive set of generation units to produce the electricity demanded. Numerous authors have pointed out that electricity markets are extremely susceptible to the exercise of market power, and emissions allowance markets can exacerbate this problem, as demonstrated in Kolstad and Wolak (2008). Fourth, there was very little liquidity in the secondary market for carbon allowances until right before the final emissions “true-up,” with a flurry of trading at the last minute, which resulted in inefficient market outcomes as several trades failed to be completed before the deadline.
In this paper we delve more deeply into the causes and consequences of these phenomena. We begin this paper with a detailed description of how our classroom game was

DRAFT – Not for citation or distribution
Thurber and Wolak, 14 June 2013 4
structured, provide an overall summary of the game results, and then consider in detail the behavior of market participants. We conclude with a discussion of the policy-relevant lessons learned from running our game.
2. The Electricity Strategy Game with Forward Contracts and Carbon Trading1
2.1 The Electricity Market
Teams in our game purchased portfolios of electricity generation units in an auction at the start of the game. They then attempted to recover this up-front cost by competing to sell electricity into a bid-based electricity market and by trading in a bilateral carbon allowance market over four simulated “days,” with the goal of being the team with the highest ratio of net revenue to price paid for the generation portfolio at auction.
The basic ESG setup uses seven generation portfolios that are meant to roughly mirror the holdings of the seven largest generating firms operating in California in early 2002 (Borenstein and Bushnell 2011). Each generation unit is characterized by its capacity, location (northern or southern California zone – see below), variable cost, fixed cost, and carbon emissions rate.2 The characteristics of the seven different portfolios on offer are summarized in Table 1. Fourteen total portfolios (seven per game for two parallel games, or “worlds”) were auctioned off in an open outcry, ascending price auction, with the last portfolio awarded to the remaining team at a reservation price. In determining their bids, the teams had to value both the carbon allowances (Table 1) and the fixed-price forward financial contracts that were bundled with each portfolio.
1 Note that much of our basic setup of the Electricity Strategy Game uses the default values provided by Borenstein and Bushnell (2011). 2 As Borenstein and Bushnell (2011) note, modeled carbon emissions rates are somewhat lower than those actually achieved by the units in operation.

DRAFT – Not for citation or distribution
Thurber and Wolak, 14 June 2013 5
Portfolio Location # of Units
Capacity by Fuel
Range of Unit Variable Costs
Base Case Emissions, 4 Days (tons CO2)
Initial Carbon Allowance Allocation
Big Coal South 6 1900MW coal; 2000MW gas
$19.00-51.50/MWh
23,436 15,000
Big Gas South 7 3600MW gas $29.00-62.50/MWh
10,701 15,000
Beachfront South 8 3800MW gas $26.50-52.50/MWh
14,323 5,000
Old Timers South 5 1500MW coal; 250MW gas; 1000 MW hydro
$0.00-37.50/MWh
11,936 10,000
Bay Views North 5 2650MW gas $23.00-42.50/MWh
10,449 10,000
East Bay North 6 3000MW gas $25.50-$48.50/MWh
8,492 5,000
Fossil Light North 5 650MW gas; 800MW hydro; 1000MW nuclear
$0.50-53.00/MWh
1,310 0
Table 1 Summary of generation portfolio characteristics. Variable cost includes O&M and fuel cost. Base case carbon emissions are calculated assuming a competitive market (all units bid in at marginal cost) and demand at forecast. At auction, each portfolio was bundled with the initial carbon allowance allocation shown in the last column. Full details on the units in the standard portfolios are available in spreadsheet form from Borenstein and Bushnell (2011).
For each of the four hours that make up an ESG day, teams bid in the full capacity of each of their generation units at an offer price of their choosing. The ESG code constructs the resulting aggregate supply curve, calculates the market clearing price as its intersection with a pre-specified stochastic demand curve, and then calculates variable profit (market clearing price minus unit variable cost in the case of a uniform price auction) for each unit that ends up running. All units also incur fixed O&M costs for each round of the game whether they run or not.
The overall market is divided into separate north and south zones that are connected by a transmission line with finite transfer capacity. If supply and demand conditions are such that this transmission line is filled to capacity (congestion), the two zones separate from each other. Demand forecasts for northern and southern zones are provided to the teams for each hour of each day. Demand is downward-sloping but relatively inelastic. Realized demand is set by choosing the load intercepts for northern and southern markets in each hour as random variables normally distributed about forecasted levels, with a standard deviation equal to 3% of the load intercept. Demand forecasts were the same for each ESG day, but the days differed in the nature of the forward contracts provided to teams, whether they had the option to decline the forward

DRAFT – Not for citation or distribution
Thurber and Wolak, 14 June 2013 6
contracts, whether contract holdings were visible to other market participants, and whether the possibility existed of unplanned unit outages. Outage probabilities were set to be higher for zero-carbon (nuclear and hydro) units in order to create additional uncertainty around demand for allowances.
2.2 The Carbon Cap and Trade
A single cap and trade market for carbon covered both of our two ESG worlds. To stress the system, we intentionally established a cap that would produce carbon prices well above values that would be politically feasible in the real world. The cap was set at 148,000 carbon allowances, with each allowance covering one ton of CO2 emissions. This was expected to yield a carbon emissions reduction of slightly less than 10% relative to the baseline zero-carbon-price, competitive market scenario. Sixty thousand carbon allowances per game (120,000 total) were bundled with the generation portfolios at the portfolio auction,3 and the remaining 28,000 allowances (roughly 20% of the total available) were sold to the teams by means of a sealed-bid, uniform price allowance auction that took place after the players purchased their generation portfolios.4 All teams were informed of their allowance winnings and the market-clearing price but not of the distribution of allowances to other teams.
Allowances were freely tradable among teams on a web platform5 before, during, and after the four ESG days were run. The trading platform allowed any team to make buy and sell offers at a quantity and price of their choosing to any other team. If a team receiving an offer accepted it, the trade was recorded on the system. All transactions on the web platform were bilateral, with teams having no visibility to transactions in which they were not involved.6
Allowance trading was halted and a carbon emissions “true up” performed four days after the conclusion of the Day 4 electricity market. Teams were assessed a penalty of $500/ton for any CO2 emitted over the four days in excess of their allowance holdings. The regulator bought back any unused allowances at a price of $10/allowance.
2.3 Economic and Environmental Performance of Electricity and Cap and Trade Markets
The markets in our game strikingly underperformed relative to the perfectly competitive ideal in terms of both environmental results and total costs of electricity supply. Figure 1
3 There is an extensive literature on the effect of “grandfathering” some portion of a firm’s existing emissions through the allocation of free permits – see, for example, Reguant and Ellerman (2008) or Goeree et al (2010). These studies mostly conclude, as one would expect from economic theory, that the initial allocation represents a windfall and has no bearing on how teams subsequently trade permits. 4 Teams submitted up to 5 price-quantity pairs at decreasing price, increasing quantity values. The regulator then constructed the aggregate demand curve for permits and distributed the 28,000 available permits at the market clearing price to the teams that had bids above this price, in accordance with their bid quantities. 5 The web trading platform we used was developed by Trevor Davis, a Ph.D. candidate in the Department of Economics at Stanford University. 6 To encourage “cheap talk,” we did provide teams with the option to broadcast an offer to all other teams as well as to send it only to a specific team.

DRAFT – Not for citation or distribution
Thurber and Wolak, 14 June 2013 7
simulates the carbon emissions reductions that would be achieved with a carbon tax in a perfectly competitive electricity market, such that no supplier has the ability to exercise unilateral market power and each submits its variable cost (including the cost of the carbon tax) as its price offer into the energy market. The carbon tax achieves emissions reductions both by shifting the merit order of generation units towards lower emissions units—for example, in the steep section of the curve between $40 and $75 per ton of CO2, the high-emitting Four Corners coal plant is progressively turned off more and more of the time until it is used only in the highest demand periods7—and by reducing electricity demand through higher prices. The figure shows that, with actual demand levels and unit outages observed in the game, a carbon tax of $262 would have been sufficient to limit emissions to the game “cap” of 148,000 tons of CO2 over the four days, a 9.6% emissions reduction relative to the zero-carbon-price case. However, the actual emissions reduction observed in our game was only 7.4%, which would have been attainable in a competitive market with a carbon tax of $141. Some teams ended up with insufficient allowances to cover their emissions and had to pay the $500/ton penalty instead.
7 The portfolios in our game offered only limited options for mitigating costs through changes in the merit order. The vast majority of the power plants in the game were fueled by natural gas, with carbon emissions rate a function only of the efficiency of the generation unit, and so the merit order was preserved to a significant extent as carbon price increased.

DRAFT – Not for citation or distribution
Thurber and Wolak, 14 June 2013 8
Figure 1 Simulated carbon emissions reduction (relative to a zero-carbon-price scenario) as a function of carbon price when our game is run as a competitive market (all units bid their marginal costs in all hours) and a carbon tax is directly incorporated into unit bids as a variable cost.
Cost performance in our game was also poor. Figure 2 plots the average electricity price that would have been expected in a competitive market for a given level of carbon emissions reductions achieved by means of a carbon tax. The generation-weighted average electricity price actually observed in our game, $259/MWh, was significantly higher than the benchmark price of $112/MWh for equivalent emissions level with a carbon tax.
As we will discuss further, the poor performance in our game on both cost and environmental dimensions can be attributed to a significant extent to the fact that participants in our market, just like those in the actual market, knew they had the ability to influence prices in both the electricity and carbon markets through their unilateral actions. It also derived in part from uncertainty among market participants about the marginal cost of carbon mitigation that they should factor in to their price offers into the electricity market.

DRAFT – Not for citation or distribution
Thurber and Wolak, 14 June 2013 9
Figure 2 Generation-weighted average electricity price across all four ESG days for carbon emissions reductions achieved by means of a carbon tax in a competitive market (see Figure 1).
3. Observations from Game: Electricity Bidding Strategy
3.1 The Cost of Carbon Price Uncertainty
There is inherent uncertainty about the price of carbon allowances due, among other factors, to unforeseeable changes in the supply and demand of allowances. Different market participants may also draw different conclusions about what the price of carbon is likely to be. In the absence of a transparent and liquid market for these allowances, such disagreement is likely to be accentuated. Our trading platform allowed market participants to trade allowances at all hours of the day with any other market participant, but we found that market participants were very wary of sharing information about their allowance holdings and trades. This result argues in favor of mandatory release of information about allowance holdings and emissions to foster more active trading of carbon allowances. During in-class discussions after the game, our student participants suggested that having more information about conditions in the carbon allowance market throughout the game would have encouraged them to trade more.

DRAFT – Not for citation or distribution
Thurber and Wolak, 14 June 2013 10
Our game demonstrated how disagreement over the price of carbon can lead to inefficient electricity and carbon market outcomes. Figure 3(a) shows, in black, the aggregate bid curve for all of the generating units in Hour 4 of Day 1 of World #1. The gray curve represents a benchmark bid curve under a carbon tax and competitive market that would have produced identical carbon emissions as the black curve actually observed in the game. In Day 1, all of the generation portfolios were forced to hold forward contracts for electricity approximately equal to their expected output, incentivizing the teams to bid aggressively rather than to try to exercise significant unilateral market power (see section 3.2). Therefore, we can assume that the amount that teams bid above their variable costs in the absence of carbon regulation roughly reflected their views about the price of carbon. In other words, a rational strategy under these conditions would have been to bid each unit into the market based on its marginal cost including the expected carbon price ($/ton) times the carbon emissions rate in tons/MWh.8
In Figure 3(b), we use this assumption to calculate an implicit price of carbon for each unit’s bid, in the same merit order as the red bid curve of Figure 3(a). Figure 3(b) indicates significant variation in how different teams appeared to value carbon, with teams on the left of the merit order (Big Coal and Big Gas portfolios) assuming a near-zero carbon price, teams in the middle of the merit order (Old Timers, Bay Views, and Beachfront portfolios) expecting a mid-range carbon price, and teams on the bottom end of the merit order (including the Fossil Light and East Bay portfolios) seemingly factoring in a very high cost of carbon allowances.
8 Studying the Spanish electricity market under Europe’s Emissions Trading Scheme (ETS), Fabra and Reguant (2013) found that generators did in fact pass through carbon prices into their bids in this way. Kolstad and Wolak (2008) found that generation unit owners in the South Coast Air Quality Management District in Southern California passed through input fossil fuel price changes in this manner but did not pass through changes in the prices of NOx emissions allowances because of the structure of regulatory oversight of wholesale prices in the California market.

DRAFT – Not for citation or distribution
Thurber and Wolak, 14 June 2013 11
Figure 3 (a) Bid curve for Day 1, Hour 4 of World #1 (black); simulated bid curve for the same conditions and a $134/ton carbon tax (gray), which produces identical emissions as the game bid curve. Dotted lines show the market clearing prices, and the steep black line with negative slope is the electricity demand curve. (b) Carbon prices implicit in the bid quantities for each unit, assuming that any amount bid above the zero-carbon-price variable cost is intended to take into account the opportunity cost of using a carbon allowance. The three lightly shaded bars on the left indicate units that have zero carbon emissions, for which we arbitrarily assume an implicit carbon price equal to the benchmark value of $134/ton. (Units showing an implicit carbon price of zero had bids equal to or below the zero-carbon-price variable cost.)
The result of this divergence in beliefs about carbon price is that actual bid curves were considerably steeper and therefore produced higher electricity prices than competitive benchmark bid curves that would have yielded the same carbon emissions reduction via a carbon tax in a perfectly competitive market. Differing carbon price assumptions between teams also led to significant deviations from the generation merit order observed in the competitive benchmark case. Two relatively inefficient units, Alamitos 7 (in the Big Coal portfolio) and Oakland (in the Bay Views portfolio), were dispatched in the game but not in the benchmark case. The Four

DRAFT – Not for citation or distribution
Thurber and Wolak, 14 June 2013 12
Corners plant was near the top of the merit order in the game, whereas it was the marginal unit in the benchmark case.
3.2 The Role of Forward Contracts Under Cap and Trade
Already higher prices for electricity under cap and trade can be further elevated through the exercise of unilateral market power in the electricity market. Requiring firms to hold fixed-price forward financial contracts for a significant portion of their expected output can be an effective way to reduce the incentives for them to exercise unilateral market power (Wolak 2000). Teams with forward contracts can only benefit from high spot prices on the portion of their short-term market sales that exceeds their forward contract quantities. Moreover, if they attempt to push up prices through their offers, they run the risk that less of their capacity will be dispatched, and possibly that they will end up selling less energy in the short-term market than their forward market obligation—and thus effectively be required to buy energy on the spot market at high prices to cover this shortfall. For these reasons, generators will tend to submit offer prices closer to their marginal cost of production when they are significantly hedged.
The favorable incentive properties of forward contracts were illustrated by Day 2 of the game. All generators were given the option to decline contracts in this day, but contract prices were increased relative to Day 1 so that contracts would be reasonably attractive to generation unit owners. It turned out that most of the generation unit owners in world #1 (6 of 7) refused contracts in Day 2, while most in world #2 (5 of 7) kept them, providing a useful comparison to assess the impact of fixed-price forward contracts on market outcomes. Figure 4 illustrates how much higher electricity prices were in world #1 as a result. This figure clearly shows that high and uncertain carbon prices and generation unit owners with long positions (relative to their forward contract quantities) in the short-term energy market are a likely to be an expensive combination for ratepayers.

DRAFT – Not for citation or distribution
Thurber and Wolak, 14 June 2013 13
Figure 4 Southern market bid curves for world #1 (gray) and world #2 (black) in Hour 2 of Day 2. The dotted lines show market clearing prices and the sloping lines show demand. In world #1, none of the four teams in the Southern market held forward contracts for electricity; in world #2, three of the four teams held forward contracts.
The game illustrated another important point about combining forward contracts and carbon pricing: legacy contracts that are attractively priced in the absence of a carbon market (like our Day 1 contracts) may no longer be so after a carbon market has been put in place. The establishment of a carbon cap and trade market can significantly increase spot electricity prices, but generators stuck with low-price legacy contracts will be less able to benefit from the situation and could even be forced to take a loss if their costs of cap and trade compliance go up enough. In our game, the Big Coal portfolio faced the tightest squeeze. It needed to run its high-emitting Four Corners coal plant in most hours if it was to cover contracted quantities and avoid having to buy electricity at high spot prices, but the cost of covering the associated emissions with allowances risked being greater than the revenue from its low-price contracts.
4. Observations from the Game: Carbon Bidding and Trading Strategy
4.1 Carbon Price Preferences
One might expect that operators of fossil fuel fired units, especially those that run on coal, would be more profitable with lower carbon prices, but we observed the opposite in our game. In Figure 5, we simulate generation portfolio profits in a competitive market with a fixed carbon allowance price of different values. The light gray area represents variable profits from selling electricity in the spot market – in other words, the market clearing price times output in each hour minus the variable costs (including the cost of allowances to cover all emissions) of all units operating in that hour as well as the fixed costs of all units. The dark gray area represents additional profits from selling all of the allowances that were initially allocated to the respective

DRAFT – Not for citation or distribution
Thurber and Wolak, 14 June 2013 14
portfolios for free (or, equivalently, it represents the offset to costs from using these allowances to cover emissions).
Figure 5 yields two surprising observations. First, a $1 increase in the price of allowances increases supplier variable profits in the electricity market in almost all cases.9 The intuition for this is as follows. The profits of a generation portfolio will go up if the market clearing electricity price rises faster with an increasing carbon price than the portfolio’s costs, assuming changes in the merit order do not sideline too high a portion of the portfolio’s generation capacity. Due to high, inelastic demand in peak hours and heterogeneity in carbon emissions rates across generation units—both within individual portfolios and in the overall market—this usually turned out to be the case. Within a given zone (North or South), the portfolios with lower average carbon emissions rates tended to benefit more as the carbon price increased. Within-portfolio heterogeneity in emissions rates also proved to be an advantage, with increased profits from lower-emitting units compensating for decreased profits from higher-emitting ones.
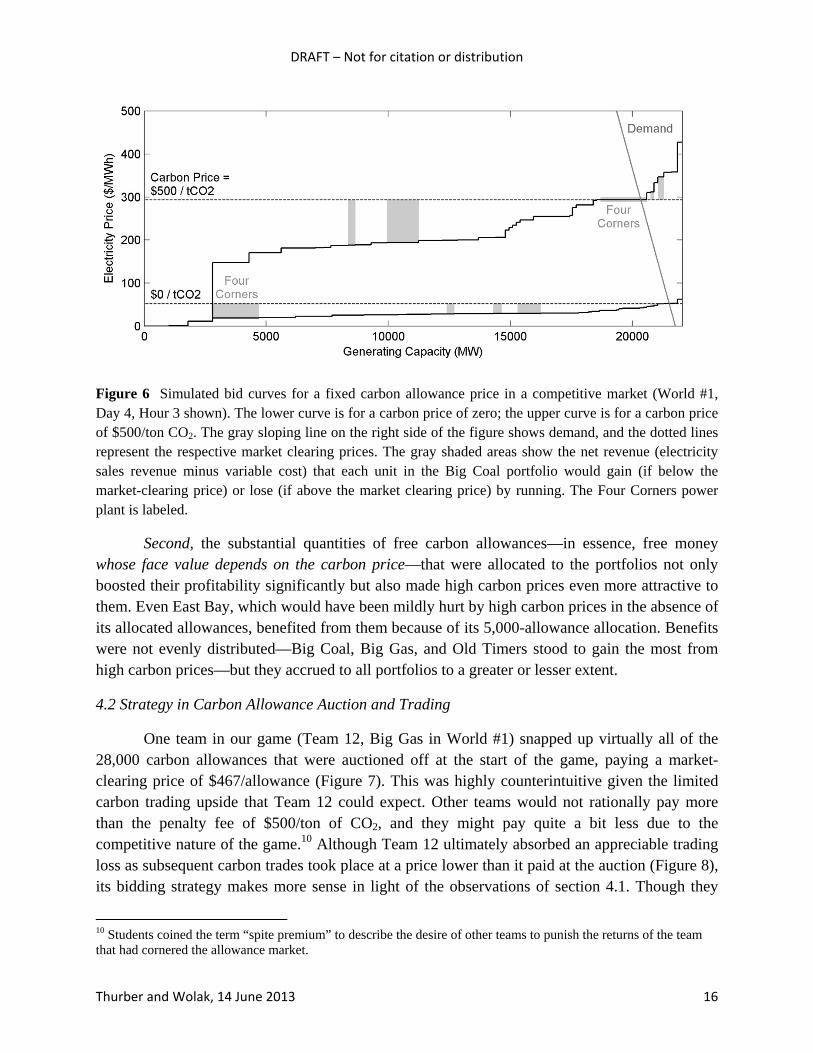
Figure 6, which shows bid curves in a high-demand hour, helps illustrate this phenomenon using the Big Coal portfolio as an example. Big Coal’s Four Corners coal plant is the unit with the largest total carbon emissions in the game. With a zero carbon price (lower bid curve in Figure 1), it also has among the lowest variable costs, so it earns substantial variable profits for the portfolio. By the time the carbon allowance price reaches $500/ton (upper curve), Four Corners has become the marginal unit and no longer generates profits for Big Coal. However, the heterogeneity of emissions rates in the broader market means that the aggregate bid curve has a much steeper slope at $500/ton than it did at $0/ton. As a result, the market clearing price has increased more than costs for Big Coal, and the resulting higher variable profits earned on the portfolio’s natural gas units (which have moved closer to the top of the merit order) more than make up for the loss of net revenue from Four Corners and two smaller high-carbon units, Alamitos 7 and Huntington Beach 5. (Note that carbon intensity is not just a function of fuel type: the units with the highest emissions rates in the game are actually natural gas peaking plants with low thermal efficiencies, and these units play an especially significant role in pushing up the market-clearing price in high-demand periods.)
9 As shown by the light gray areas, East Bay experiences a slight decline in variable profits from electricity as carbon prices increase across their full range, while Big Coal sees a slight downturn as prices increase from zero to $50/ton of CO2 before variable profits begins increasing again.

DRAFT – Not for citation or distribution
Thurber and Wolak, 14 June 2013 15
Figure 5 Simulated net revenue for each of the generation portfolios as a function of carbon price for fixed allowance price (no cap) in a competitive market. The light gray area shows spot market variable profits (sales revenue minus variable costs) assuming that all carbon emissions must be covered by purchases of allowances at the indicated price, so that allowance purchases are a known variable cost factored into the bids for each unit. The dark gray area shows additional revenue from selling the allowances that were allocated for free to the different portfolios (see allowance allocations in Table 1). Capacity-weighted carbon emissions rates are shown for each of the portfolios.
DRAFT – Not for citation or distribution
Thurber and Wolak, 14 June 2013 16
Figure 6 Simulated bid curves for a fixed carbon allowance price in a competitive market (World #1, Day 4, Hour 3 shown). The lower curve is for a carbon price of zero; the upper curve is for a carbon price of $500/ton CO2. The gray sloping line on the right side of the figure shows demand, and the dotted lines represent the respective market clearing prices. The gray shaded areas show the net revenue (electricity sales revenue minus variable cost) that each unit in the Big Coal portfolio would gain (if below the market-clearing price) or lose (if above the market clearing price) by running. The Four Corners power plant is labeled.
Second, the substantial quantities of free carbon allowances—in essence, free money whose face value depends on the carbon price—that were allocated to the portfolios not only boosted their profitability significantly but also made high carbon prices even more attractive to them. Even East Bay, which would have been mildly hurt by high carbon prices in the absence of its allocated allowances, benefited from them because of its 5,000-allowance allocation. Benefits were not evenly distributed—Big Coal, Big Gas, and Old Timers stood to gain the most from high carbon prices—but they accrued to all portfolios to a greater or lesser extent.
4.2 Strategy in Carbon Allowance Auction and Trading
One team in our game (Team 12, Big Gas in World #1) snapped up virtually all of the 28,000 carbon allowances that were auctioned off at the start of the game, paying a market-clearing price of $467/allowance (Figure 7). This was highly counterintuitive given the limited carbon trading upside that Team 12 could expect. Other teams would not rationally pay more than the penalty fee of $500/ton of CO2, and they might pay quite a bit less due to the competitive nature of the game.10 Although Team 12 ultimately absorbed an appreciable trading loss as subsequent carbon trades took place at a price lower than it paid at the auction (Figure 8), its bidding strategy makes more sense in light of the observations of section 4.1. Though they
10 Students coined the term “spite premium” to describe the desire of other teams to punish the returns of the team that had cornered the allowance market.

DRAFT – Not for citation or distribution
Thurber and Wolak, 14 June 2013 17
may not all have realized it, all teams stood to benefit from a high carbon price, and the Big Gas portfolio stood to benefit more than most due to its large initial allocation of carbon allowances relative to expected emissions. Sending a signal to all teams that carbon prices would be high in the game—and setting itself up to exercise unilateral market power in the allowance market to achieve this objective—was a reasonable strategy for Team 12 to maximize both absolute variable profits and returns relative to other teams that would need to buy more carbon allowances.11 (Based on their own game involving highly stylized electricity and cap and trade markets, Goeree et al (2010) also noted the tendency of players who were longer on carbon allowances to exercise market power in the allowance market to push up carbon price.)
Figure 7 Carbon allowance auction results. The aggregate bid curve is shown, with the bids from each of the 14 teams highlighted in a different shade of dark gray except for Team 12 (Big Gas in world #1), whose bids are shown in a light shading. Team 12 was awarded 25,968 of the 28,000 allowances on offer, at a market-clearing price of $467/allowance; Team 11 received the other 2,032 allowances.
11 In hindsight, Team 12 may have wished that it had bid in to the allowance auction at slightly lower price tiers so as to avoid this kind of trading loss while still significantly pushing up carbon prices. As it was, the heavy trading loss meant that Team 12’s bold gambit to ensure sky-high carbon prices probably ended up benefitting other teams more than it did Team 12.

DRAFT – Not for citation or distribution
Thurber and Wolak, 14 June 2013 18
Figure 8 Carbon allowance trading history from the auction (9am on Day 0) through the close of trading (9am on Day 19). Each circle shows a carbon allowance transaction, with the x-axis value of the center of the circle indicating day and time of the trade, the y-axis value of the center showing allowance price, and the area of the circle proportional to the total number of allowances that changed hands. The leftmost circle represents the 28,000 total allowances awarded to Teams 11 (2,032 allowances) and 12 (25,968 allowances) at the auction; all other circles represent bilateral trades between teams. The vertical gray dotted lines mark when the teams were informed of the results of each day’s electricity markets, including total CO2 output. The gray-shaded circles highlight Team 1’s successful strategy of shorting allowances.
Team 1 (Beachfront in World #1) also pursued a carbon trading strategy that seemed counterintuitive at first glance. Despite owning the generation portfolio with the largest shortfall of allocated allowances relative to expected emissions (see Table 1), Team 1 opted to sell all of its available allowances at a price of $400/allowance in three trades (the smaller gray circles in Figure 8) executed slightly less than two days before the close of trading.12 By selling all of the allowances in its possession, Team 1 positioned itself to be the major buyer of allowances at the end of trading: a monopsony buyer matched against Team 12’s monopoly seller. Team 1 bet that it could use its market power on the demand side to extract a lower price than the $400/allowance for which it had initially sold its allowances, especially since Team 12 would receive only $10 from the regulator for any unused allowances it held at the close of the game. For its part, Team 1 would have to pay $500 for each ton of CO2 it failed to cover with 12 In fact, Team 1 had inquired as to whether it could also sell allowances not in its possession, in a “naked shorting” strategy, but it was informed by the regulator that this was not permitted by the carbon market rules; in a future version of the game we may explore the effects of permitting this type of transaction.

DRAFT – Not for citation or distribution
Thurber and Wolak, 14 June 2013 19
allowances. After tense price negotiations over the final hours of trading, Team 12 finally agreed to sell 12,296 allowances to Team 1 at a price of $360/allowance (large gray circle in Figure 8)—less than Team 1 had hoped for but still enough for it to turn a nice profit from its short selling strategy.
A distinguishing feature of the carbon market throughout most of the game was its lack of liquidity. As illustrated by Figure 8, only three trades occurred between the allowance auction and the completion of the electricity markets on Day 4. One trade occurred soon after teams were informed about the Day 4 results, but the vast majority of trades occurred only in the final 48 hours before the close of trading. This result argues in favor of more frequent compliance periods to ensure that suppliers do not incur substantial emissions without accumulating sufficient allowances in advance to meet this compliance obligation.
The lack of liquidity in the carbon market throughout the game caused several problems. First, it appeared to contribute to the divergent views on carbon price discussed in section 3.1. Second, the flurry of trading before the market closed resulted in some mutually beneficial transactions failing to be executed in time. As shown in Figure 9, Team 12 (Big Gas #1) ended the game with a significant surplus of allowances, while Teams 14 (East Bay #1) and 2 (Fossil Light #2) ended up with appreciable deficits that resulted in their paying emissions penalties. These teams all said that they had been trying to execute deals but ran out of time.13
13 One dynamic that may be less of an issue in real world markets is that some of the market participants were in class at the time the market closed!

DRAFT – Not for citation or distribution
Thurber and Wolak, 14 June 2013 20
Figure 9 Final carbon emissions and allowance holdings for all portfolios.
5. Policy Insights and Recommendations
Among the most startling observations in our game was the fact that higher carbon prices were favorable to all of the generation portfolios. From a policy perspective, this result reinforces the observations of others that free allocations of carbon allowances should be minimized, as they constitute a largely unnecessary direct transfer from taxpayers to generators. Small allocations of free allowances can in principle be justified as a way to equalize the impact of carbon regulation on emitters (Goulder et al 2010), but their political value as a tool for softening the resistance of affected industries to a carbon market tends to result in over-allocation of free allowances, to the detriment of taxpayers. Our simulations here suggest that an additional concern about free allocations is their potential to shift the preferences of market participants in the direction of higher carbon prices.
Even without the free allocations of allowances, all but one of our generation portfolios would have expected to benefit from higher carbon prices (and the one exception did not see a significant negative impact on profits). This suggests that most or all market players could have an incentive to unilaterally withhold rather than use up all of their carbon allowances, even at the cost of paying some emissions penalties. The benefits that they receive as a consequence of higher electricity prices (and an increase in the face value of any “free money” they have been allocated in the form of allowances) might outweigh these penalties. Moreover, coordination on
DRAFT – Not for citation or distribution
Thurber and Wolak, 14 June 2013 21
carbon prices, for example by means of a brokerage firm which “makes a market” for carbon, could be a legitimate problem.
This common desire among market participants for higher carbon prices can be reduced by increasing the price responsiveness of final demand for carbon-intensive products. If suppliers perceive significant reductions in the demand for their output as the electricity price they charge increases, they will benefit less from higher carbon prices. One way to increase the elasticity of demand for electricity would be to pass wholesale electricity prices that reflect the price of carbon through to final electricity consumers and give them tools for responding appropriately. Unfortunately, the California Public Utility Commission’s retail pricing policies limit the extent to which final electricity consumers can be active participants in the wholesale market as a means of increasing the price responsiveness of the demand for electricity.14 Our market simulation suggests that the state’s failure to pass through electricity prices that reflect the price of carbon to final consumers and to implement dynamic pricing programs for these consumers adversely affects both carbon market and electricity market performance.
If electricity producers would benefit from high carbon prices in theory, why hasn’t there been more industry support for cap and trade markets? One possible explanation is the significant political uncertainty around real carbon markets. The students quickly realized that the regulators in their classroom (and the authors of this article) were willing to tolerate high carbon and electricity prices. In the real world, as soon as high prices inflict real and substantial pain on electricity ratepayers, politicians are likely to intervene to quell the resulting uproar. The dubious political sustainability of high carbon prices may be one reason why companies would have difficulty carrying out a strategy of “maximizing profits by maximizing carbon prices.”15
Carbon prices are inherently difficult to predict—and keep within politically acceptable bounds—under a cap and trade system (Borenstein et al 2013). From the very beginning of our game, the difficulties teams had in valuing carbon were evident. The simulation shown in Figure 1 suggested that allowance supply and demand for the conditions of the game should (with perfect foresight) have yielded an allowance price around $262. However, actual carbon prices observed in our market ranged from $200 to $467, with most transactions closer to the upper end of this range. By buying up a large fraction of the available carbon allowances at the start, one team acquired substantial ability to set price by withholding allowances, at least until the end of trading when they were countered by another player that set itself up as the sole source of demand.
Uncertainty around the carbon price created significant uncertainty around the optimal bidding strategy in the electricity markets. In markets with high forward contract coverage of
14 The barrier to dynamic pricing in California is no longer technological, because all customers of the three large investor-owned utilities have interval meters that allow their utility to measure a customer’s consumption on an hourly basis. 15 A devious example of “doing well by doing good”?

DRAFT – Not for citation or distribution
Thurber and Wolak, 14 June 2013 22
expected output of generation units, participants have very little incentive to submit bid prices above their variable costs. However, the uncertain cost of carbon translated directly into uncertainty in the variable cost of operation. This uncertainty led to the dispatch of electricity generation units that were not the lowest-cost options.
One broad takeaway from our game is that, in regulating the CO2 emissions of electricity producers in wholesale markets, a carbon tax is far less fraught with pitfalls than a cap and trade approach. However, we also recognize that cap and trade approaches may be continue to be politically easier to implement. Therefore, we offer the following recommendations for the design of a cap and trade market based on our experience with the game:
First, the carbon market should be made as transparent as possible. One justification for a lack of transparency is that it can incentivize market players to develop trading strategies that help make the markets more liquid while yielding profits for themselves, as in the case of Team 1’s shorting strategy in our game. On balance, however, we believe that the need for carbon price discovery to minimize inefficiencies in electricity market bidding outweighs the benefits of keeping trades confidential. Market transparency would also make it more apparent when teams are trying to develop allowance positions that allow them to exercise market power, as Team 12 did in our game.
An alternative policy approach to address this issue would be to keep trades secret but put in place “position limit” rules intended to prevent any one player from acquiring an excessively large position in carbon allowances. In fact, students in the class suggested this regulatory strategy, and the California Air Resources Board has implemented policy measures along these lines for the state’s cap and trade market. Our experience with this simulation convinces us that these position limits are indeed worthwhile, albeit imperfect, measures for limiting allowance price volatility.
Second, emissions true ups should take place regularly. In our game, almost all carbon trading took place immediately before the true up. The longer between true ups, the greater opportunity each team has to dig itself into a financial hole by emitting significantly in excess of allowance holdings. Protecting market participants from themselves might ultimately reduce the likelihood of political blowups that threaten the survival of the cap and trade framework.
Third, mechanisms that keep carbon price within certain bounds are essential. Many of the inefficiencies we observed in our game could have been mitigated to a significant extent through the use of price caps and floors. By constraining companies’ assessments of carbon price to a certain range, caps and floors could have significantly reduced the spread in bids into the electricity markets and the resulting inefficiencies in dispatch.
Fourth, policies that make electricity markets more robust overall can be of particular value when a cap and trade system is in place. As illustrated in Day 2 of our game, forcing generators to hold forward contracts for a significant portion of their capacity creates incentives

DRAFT – Not for citation or distribution
Thurber and Wolak, 14 June 2013 23
to bid aggressively that help moderate the price increases that naturally occur when carbon prices are in place. (Our game also pointed out that regulators need to account for how a carbon market can change the value of existing forward contracts.)
Layering a cap and trade for carbon on top of a wholesale electricity market creates a very complex and difficult to predict set of interactions. Indeed, we greatly appreciated the willingness of our students in the Stanford University Graduate School of Business to dive into the chaos and do their best to maximize the financial results of their respective portfolios. Without their conscientious and savvy engagement, we doubt that the game would have yielded such interesting results. An overarching lesson of the experience for us was that group simulations such as this one can be extremely valuable as a research tool as well as an educational one. Future work using this methodology could explore a variety of carbon policy issues including the effects of: 1) limits on the quantity of emissions allowances that market participants can hold relative to their expected compliance obligations, 2) different regimes for disclosing information on allowance holdings and emissions to market participants, 3) different borrowing and banking regimes for transferring emissions allowances across time, and 4) alternative approaches to distributing allowances to market participants.
Acknowledgements
We would particularly like to thank Severin Borenstein and James Bushnell for developing the outstanding tool that is the Electricity Strategy Game. Without it, none of this work would have been possible. We also thank Trevor Davis for developing the web trading platform that was an essential part of our game. And last but not least, we thank our students for being such enthusiastic, creative, and intelligent participants in the game.

DRAFT – Not for citation or distribution
Thurber and Wolak, 14 June 2013 24
References
Borenstein S, Bushnell J, Wolak FA, Zaragoza-Watkins M (2013). Forecasting supply and demand balance in California’s greenhouse gas cap and trade market.
Borenstein S, Bushnell J (2011). Operating instructions for the Electricity Strategy Game Version 1.00.
Buckley NJ, Mestelman S, Muller RA (2005). Baseline-and-credit emission permit trading: experimental evidence under variable output capacity. McMaster University Department of Economics Working Paper Series.
Fabra N, Reguant M (2013). Pass-through of emissions costs in electricity markets.
Goeree JK, Holt CA, Palmer K, Shobe W, Burtraw D (2010). An experimental study of auctions versus grandfathering to assign pollution permits. Journal of the European Economic Association 8(2-3): 514-525.
Goulder LH, Hafstead MAC, Dworsky M (2010). Impacts of alternative emissions allowance allocation methods under a federal cap-and-trade program. Journal of Environmental Economics and Management 60: 161-181.
Kolstad JT, Wolak FA (2008). Using environmental emissions permit prices to raise electricity prices: evidence from the California electricity market.
Reguant M, Ellerman DA (2008). Grandfathering and the endowment effect: an assessment in the context of the Spanish National Allocation Plan.
Wara M (2008). Measuring the Clean Development Mechanism’s performance and potential. UCLA Law Review 55: 1759-1803.
Wolak FA (2000). An empirical analysis of the impact of hedge contracts on bidding behavior in a competitive electricity market. International Economic Journal 14(2): 1-39.
Wråke M, Myers E, Burtraw D, Mandell S, Holt C (2010). Opportunity cost for free allocations of emissions permits: an experimental analysis. Environmental and Resource Economics 46: 331-336.