Embed Size (px)
Citation preview
Crop Growth and Development in Closed and Semi-closed Greenhouses
Tian Qian
Thesis committee
Promotor
Prof. Dr L.F.M. Marcelis
Professor of Horticulture and Product Physiology
Wageningen University & Research
Co-promotors
Dr J.A. Dieleman
Senior Researcher, Business Unit Greenhouse Horticulture
Wageningen University & Research
Dr A. Elings
Senior Researcher, Business Unit Greenhouse Horticulture
Wageningen University & Research,
Other members
Prof. Dr E.J. van Henten, Wageningen University & Research
Prof. Dr U. Schmidt, Humboldt University, Berlin, Germany
Prof. Dr E. Jacobsen, Wageningen University & Research
Dr X. Yin, Wageningen University & Research
This research was conducted under the auspices of the C.T. de Wit Graduate School of Production Ecology
and Resource Conservation (PE&RC)
Crop Growth and Development in Closed and Semi-closed Greenhouses
Tian Qian
Thesis
submitted in fulfilment of the requirements for the degree of doctor
at Wageningen University
by the authority of the Rector Magnificus
Prof. Dr A.P.J. Mol,
in the presence of the
Thesis Committee appointed by the Academic Board
to be defended in public
on Wednesday 24 May 2017
at 4 p.m. in the Aula.
Tian Qian
Crop Growth and Development in Closed and Semi-closed Greenhouses, 112 pages
PhD thesis, Wageningen University, Wageningen, NL (2017)
With references, with summary in English
ISBN: 978-94-6343-070-8
DOI: http://dx.doi.org/10.18174/403466
CONTENTS
Chapter 1 General introduction 1
Chapter 2 Comparison of climate and production in closed, semi-closed and open 11
greenhouses
Chapter 3 Crop morphology and physiology in response to high CO2 concentration 21
Chapter 4 Vertical temperature gradients and their consequences for crop growth
and development
Chapter 4.1 Occurrence of vertical temperature and vapour pressure
deficit gradients 41
Chapter 4.2 Effects of vertical temperature gradients on crop growth
and development 51
Chapter 5 Quantification of photosynthesis at a wide range of climate conditions 63
Chapter 6 General discussion 81
Summary 101
Acknowledgements 105
Curriculum Vitae 107
List of Publications 109
PE&RC PhD Education Statement 111
Sponsors 112

Chapter 1
General Introduction
Chapter 1
2
Global environmental protection and energy saving
In the last 50 years, climate change and resource scarcity raised people’s
concern about environmental protection and energy saving. The Club of Rome, the
global policy institute, raised considerable public attention in 1972 with its report
“The Limits to Growth”. In 1987, the World Commission on Environment and
Development, created by the United Nations, released the Brundtland report “Our
Common Future” (Anonymous 1987), in which the term “sustainable development1”
was defined. In 1997, the Kyoto Protocol of the United Nations Framework
Convention on Climate Change, an international treaty, set binding obligations on
developed countries to reduce emissions of greenhouse gases.
The European Union (EU) translated the Kyoto protocol into its own targets for
2020 (known as the EU Climate and Energy Package). In the Netherlands, the
government announced the “Clean and efficient” program in 2007, aiming to improve
energy efficiency in various sectors (Anonymous 2007). One of these was the agro-
sector2, in which the sub-sector greenhouse horticulture contributes to about 10% of
the national consumption of natural gas (CBS et al. 2014; Van der Velden and Smit
2014). Energy costs constitute about 15-30% of the total annual costs of a greenhouse
(Vermeulen, 2012). In 2008, the Dutch agro-sectors signed a Public-Private
Partnership with the government entitled ‘Clean and Efficient Agro-sectors’, agreeing
to make the agro-sectors more sustainable by 2020 (Anonymous 2008). Within the
context of the ‘Clean and Efficient Agro-Sectors’ program, the greenhouse
horticultural sub-sector has signed the Greenhouse and Environment Covenant
(known as GLAMI) (Anonymous 2010) with the government, which contains
objectives on the performance of greenhouse horticulture with respect to energy and
environment.
The objectives to be achieved are: 1) Total reduction of at least 3.3 megatons
CO2 emission in 2020 compared to that of 1990; 2) 2% improvement of energy
efficiency yearly until 2020; 3) Contribution of sustainable energy3 to the total energy
input of 20% in 2020. Subsequently, in 2014 the Dutch government and greenhouse
horticultural sector agreed upon a long-term agreement for energy transition in the
greenhouse horticultural sector (“Meerjarenafspraak Energietransitie Glastuinbouw
2014-2020”). This agreement focuses on a target of maximum 6.2 megatons CO2
emission in 2020. In 2015 the CO2 emission was already reduced to 5.7 megatons.
This means that the greenhouse horticulture sector has already reached the goal set for
2020 (Van der Velden and Smit 2016). In 2015, the sustainable energy was only 5.1%
of the total energy consumption (Van der Velden and Smit 2016).
Dutch greenhouse horticulture
The Netherlands has a world-leading position in greenhouse horticulture, with
1Sustainable development is development that meets the needs of the present without compromising the
ability of future generations to meet their own needs. (Anonymous 1987)
2 Agro sector is defined as the complex of businesses that are involved in agriculture (consisting of sub-
sectors arable farming, livestock farming, horticulture), as well as those businesses that are involved in
the chain of supply to agriculture and processing of agricultural products. (De Haas 2013)
3Sustainable energy is defined as energy that is generated through renewable processes from sun, wind,
water power, earth warmth and biomass. (Anonymous 2010)
General introduction
3
glass greenhouse area of about 10,000 hectare (Statline 2016). Mechanization and
technological developments such as heating, artificial light, CO2 enrichment and
climate control led to high control of the production process in the greenhouses
(Breukers et al. 2008). Crop productivity increased by 113% for tomato, 90% for
sweet pepper, and 35% for cucumber over a period of 27 years from 1983 to 2010 (De
Gelder et al. 2012). Application of technology, mainly heating and artificial light,
enabled year-round production, but was also associated with high energy consumption.
In 2012, 82% of the energy in the agro-sector was consumed by greenhouse
horticulture (Anonymous 2012), although the energy consumption per unit of
production (energy use efficiency) decreased by 70% between 1980 and 2008 (Van
der Velden and Smit 2012). Over the last decades, the Dutch greenhouse horticultural
sector made remarkable efforts to increase its energy use efficiency. Measures that
were taken in greenhouse horticulture to reduce the energy consumption were
summarized by Elings et al. (2005) and Dieleman et al. (2006). These measures
included improving greenhouse insulation and improving light transmission by
antireflection coatings (Hemming et al. 2012), applying temperature integration,
improved energy screen opening strategies (Dieleman and Kempkes 2006) and
increasing heat buffer capacity.
Various greenhouse concepts toward sustainability
Various greenhouse concepts aiming at environmental protection and energy
saving were developed in the last decades. Bot (1992) indicated that the trends in
greenhouse development for the purpose of environmental protection and energy
saving would reflect in the use of window ventilation and improving the technology
of mechanic air treatment. Later Bot et al. (2005) described the solar greenhouse
concept for high value crop production without the use of fossil fuels. Solar energy
could be captured in summer, stored in an underground aquifer, and re-used in winter
for heating. This concept was firstly tested in a 14,000 m2 closed greenhouse for
tomato production (Opdam et al. 2005; De Gelder et al. 2005). Another concept, the
Watergy greenhouse (Buchholz et al. 2005), was developed for central and southern
European conditions. The Watergy greenhouse concept consisted of a closed
greenhouse with solar thermal energy storage, water recycling, and water desalination,
using a cooling tower and a secondary heat collector. The system had constant air
humidification, enabling the transfer of large amounts of energy via latent heat from
the greenhouse to a thermal storage water tank. Bakker et al. (2006) developed the
energy (heat) producing greenhouse concept, using advanced greenhouse covering
materials (Sonneveld and Swinkels 2005) to maximize the transmission of solar
radiation, and to minimize the heat loss from the greenhouse. For efficient air
conditioning, a fine wire heat exchanger with a very high heat transfer coefficient was
used. In 2008, the Sunergy greenhouse concept was developed and tested in a 550 m2
greenhouse (De Zwart 2011). The Sunergy greenhouse was a semi-closed greenhouse
that was closed only during periods with high solar radiation in order to enable
harvesting of solar energy when temperatures were relatively high. During dull days
and nights, outside air was taken in for dehumidification purposes. This way of
dehumidification lowered the investment costs of the air treatment unit and moreover
lowered the electrical demand in comparison to a completely closed greenhouse with
mechanical dehumidification. Tantau et al. (2011) described the concept of Low
energy greenhouse (named Zineg), aiming for energy savings of up to 90%. The
Zineg concept combined many different methods that had been developed in the past.
For instance, making use of solar radiation as a sustainable energy source, as in all
Chapter 1
4
concepts mentioned above, thereby reducing the energy consumption. Window
opening was also reduced which results in less CO2 and heat loss.
The closed and semi-closed greenhouse concept
In a conventional greenhouse, excess heat and moisture are released from the
greenhouse by window ventilation. In this thesis, these conventional greenhouses are
referred to as open greenhouses, because window opening is the only means of
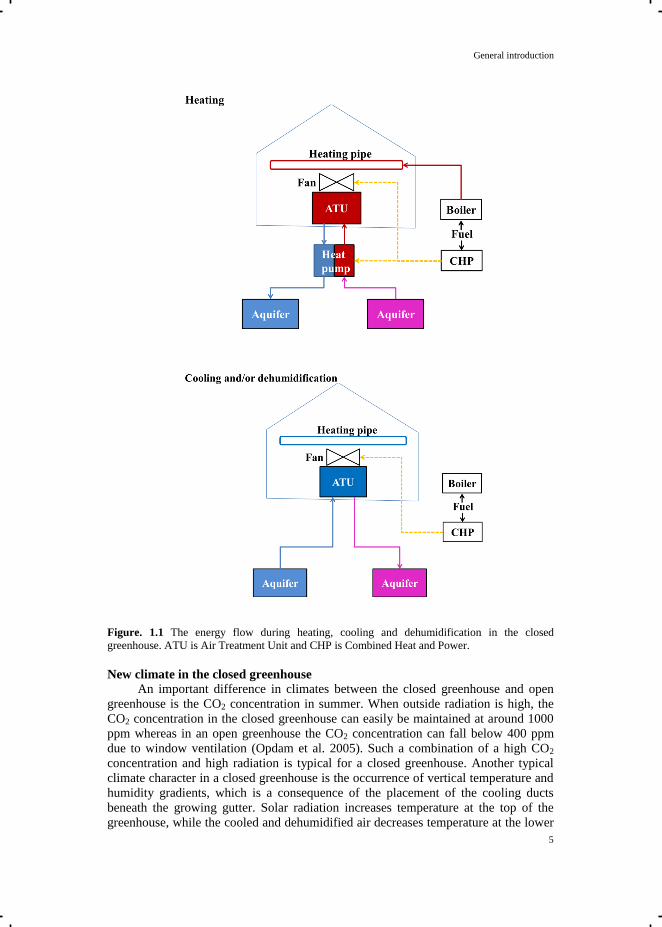
cooling and dehumidification. In a closed greenhouse (Fig. 1.1), cooling and
dehumidification are done mechanically by an air treatment unit (ATU). The ATU is
connected to an underground aquifer, which is located about 20-100 meter below the
soil surface (De Gelder et al. 2012), depending on local soil conditions. The ATU
contains a heat exchanger and connects to a ventilator. The ventilator sucks air from
inside the greenhouse and distributes the cooled and dehumidified air back to the
greenhouse. Most commonly, the ventilator distributes the air via ducts. The ducts are
usually placed below the growing gutters, since placement overhead causes shading
and placement within the crop interferes with the cultivation practices. The energy
flow of the closed greenhouse system is presented in Fig 1.1. For cooling in summer,
the cold water with a temperature of approximately 7 °C is pumped from the aquifer.
The surplus heat from the greenhouse is absorbed by the cold water when passing the
heat exchanger of the ATU. The collected heat in water is transported to the aquifer
and stored (De Gelder et al. 2012). For heating in winter, water with a temperature of
approximately 18 °C is pumped from the aquifer to a heat pump. The heat pump
further increases the water temperature to 35-50 °C (Bot et al. 2005; De Zwart 2012)
for greenhouse heating. In both summer and winter, if dehumidification is needed,
humid air from the greenhouse passes the cold surface of the heat exchanger of the
ATU, resulting in removal of air moisture by condensation. Therewith, extra (latent)
heat can be harvested. Primary energy, mainly electricity, is required for the operation
of the heat and other pumps, and the ventilators connected to the ATU. Electricity can
be obtained from the grid, or produced by the co-generation system of a heat and
power system. Co-generation of heat and power requires primary energy/fuel input,
and by burning the fuel, electricity is produced for the heat pump, the duct ventilation
system, and other pumps, and also heat and CO2 for the greenhouse.
A fully closed greenhouse requires high investment cost for drilling the pipes
toward the aquifers, for the ATUs and heat pumps. To have a high cooling capacity, the
heat exchanger has to have a large exchanging surface and a high heat exchange
coefficient (De Zwart and Kempkes 2008). The large exchanging surface requires
plenty of materials. The high exchange coefficient is achieved by forced convection
induced by ventilators, which consumes large amounts of electricity and therefore
leads to high running costs. Electricity needed for cooling was mostly twice as high as
that for heating (Hoes et al. 2008). To reduce these costs, the concept of semi-closed
greenhouse with smaller cooling capacity was developed. In this concept, window
ventilation is combined with mechanical cooling: at moments of low cooling demand
all the cooling is mechanically and windows are kept closed, while at moments of
high cooling demand both mechanical cooling and window ventilation are used.
General introduction
5
Figure. 1.1 The energy flow during heating, cooling and dehumidification in the closed
greenhouse. ATU is Air Treatment Unit and CHP is Combined Heat and Power.
New climate in the closed greenhouse
An important difference in climates between the closed greenhouse and open
greenhouse is the CO2 concentration in summer. When outside radiation is high, the
CO2 concentration in the closed greenhouse can easily be maintained at around 1000
ppm whereas in an open greenhouse the CO2 concentration can fall below 400 ppm
due to window ventilation (Opdam et al. 2005). Such a combination of a high CO2
concentration and high radiation is typical for a closed greenhouse. Another typical
climate character in a closed greenhouse is the occurrence of vertical temperature and
humidity gradients, which is a consequence of the placement of the cooling ducts
beneath the growing gutter. Solar radiation increases temperature at the top of the
greenhouse, while the cooled and dehumidified air decreases temperature at the lower
Chapter 1
6
part of the greenhouse. Air movement in a closed greenhouse is different from that in
an open greenhouse. The air movement of an open greenhouse depends on the
ventilation rate of the window, and ranges from 0.1 to 0.5 m s-1
(Wang et al. 1999).
The air movement of a closed greenhouse depends on the forced air circulation by the
fans connected to ATU and ducts, ranging from 0.2 to 1 m s-1
(Elings et al. 2007). In
the closed greenhouse mechanical cooling and dehumidification make greenhouse air
temperature and humidity independent from outside radiation. No CO2 is lost via
windows when outside radiation is high. In short, the use of mechanical cooling
enables the decoupling of outside radiation and other climate factors, such as
temperature, CO2 concentration, and humidity. Therefore, a closed greenhouse has
greater abilities for climate control than an open greenhouse. It might be expected that
the increased CO2 concentration and improved climate conditions would positively
affect the production levels that could be realized in a closed or semi-closed
greenhouse.
Expected effects of the new climate on crops
The new combinations of climate characters in the closed greenhouse may
affect crop growth, development and, finally, production. Instantaneous effects are
likely to have seasonal consequences. A higher CO2 concentration leads to higher leaf
photosynthesis (Cannell and Thornley 1998). The effect of CO2 concentration on
photosynthesis shows a strong interaction with the effects of other climate factors
such as temperature and radiation. When radiation is the limiting factor for
photosynthesis, increased CO2 concentration has only a limited influence on
photosynthesis while effects at high radiation are much larger (Körner et al. 2009).
CO2 concentration is continuously high in a closed greenhouse. Plants grown at high
CO2 concentrations may in the long term have a lower photosynthesis rate at a given
CO2 concentration than plants grown at a lower CO2 concentration (Ayari et al. 2000;
Hao et al. 2006; Yelle et al. 1990). This can be explained by over-accumulation of
assimilates in leaves, leading to feedback inhibition on leaf photosynthesis (Poorter et
al. 2009). These studies were done in open greenhouses or climate chambers, and
mostly with young plants. Whether photosynthetic acclimation to high CO2
concentrations occurs in the closed greenhouse when cultivating a fruit bearing crop
and whether photosynthetic acclimation may nullify the effect of high CO2 on
photosynthetic rate has not been investigated.
The effects of vertical temperature gradients on crops in a closed greenhouse
have not been investigated either. Temperature influences various crop growth and
development processes, such as photosynthesis (Cannell and Thornley 1998; Yamori
et al. 2010), maintenance respiration (Amthor 1989), leaf and truss initiation (Adams
et al. 2001; De Koning 1994), and fruit growth (Bertin 2005; Fanwoua 2012). Thus, it
was expected that a vertical temperature gradient would have effects on crop growth
and development. For instance, the fruits at the lower part of the crop may be
subjected to lower temperatures during ripening due to a vertical temperature gradient,
which might result in longer ripening duration and higher fruit weight (Adams et al.
2001). Consequently, the combined result of all the possible effects might influence
the final production in the closed greenhouse.
General introduction
7
Aim and outline of the thesis
When the concept of closed greenhouse was introduced, researchers initially
focused on its economic and technical aspects. During the development of the closed
greenhouse, scientists and growers realized that their knowledge on crop
physiological processes under such new climate conditions was insufficient to fully
explore the possibilities of climate control in the closed greenhouse. This PhD
research, therefore, focuses on the crop physiology in closed and semi-closed
greenhouses, aiming to study the effects of the new climate conditions on crop growth
and development and underlying processes.
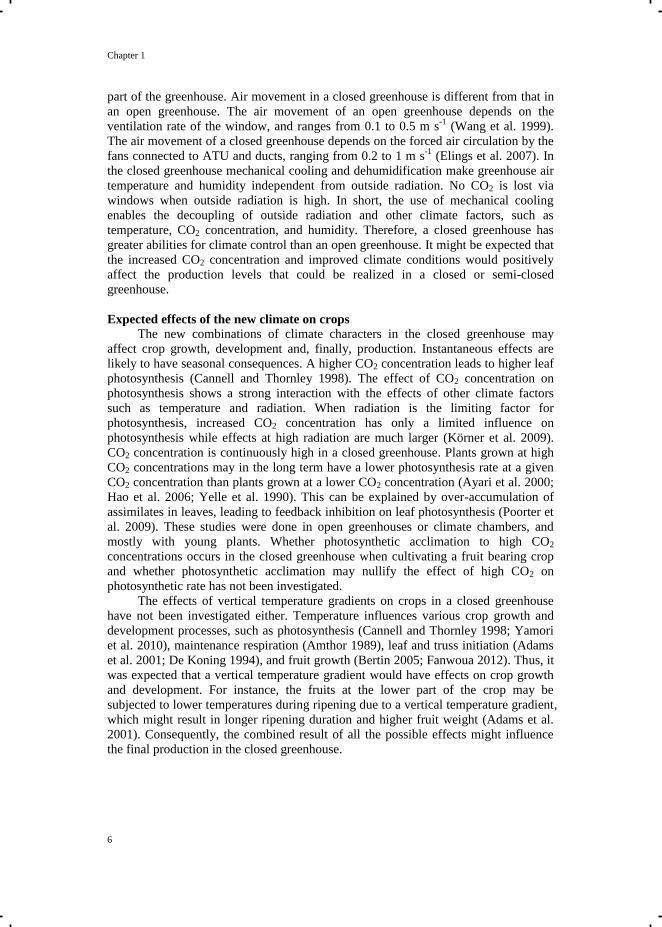
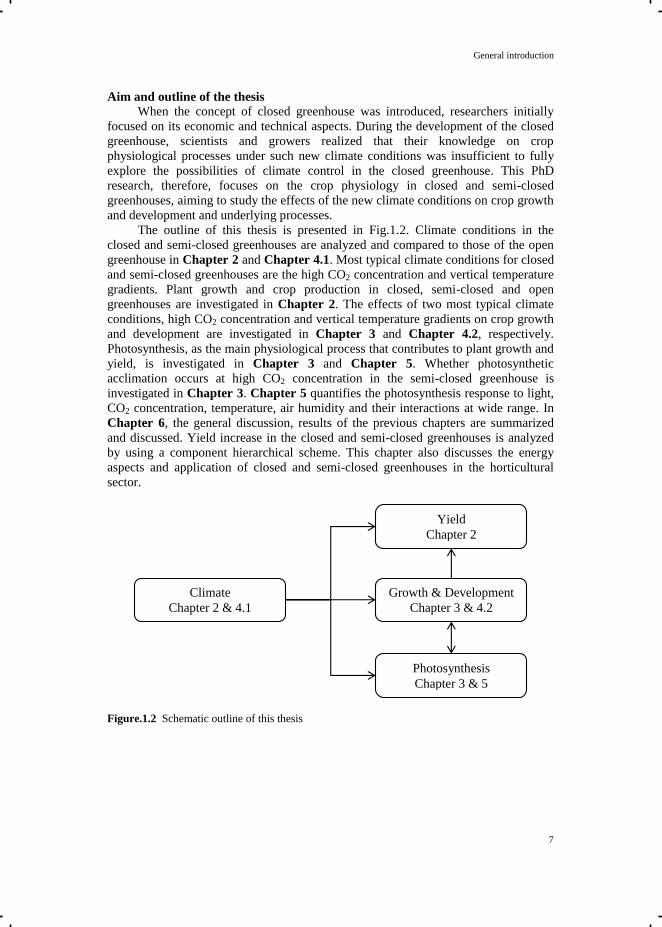
The outline of this thesis is presented in Fig.1.2. Climate conditions in the
closed and semi-closed greenhouses are analyzed and compared to those of the open
greenhouse in Chapter 2 and Chapter 4.1. Most typical climate conditions for closed
and semi-closed greenhouses are the high CO2 concentration and vertical temperature
gradients. Plant growth and crop production in closed, semi-closed and open
greenhouses are investigated in Chapter 2. The effects of two most typical climate
conditions, high CO2 concentration and vertical temperature gradients on crop growth
and development are investigated in Chapter 3 and Chapter 4.2, respectively.
Photosynthesis, as the main physiological process that contributes to plant growth and
yield, is investigated in Chapter 3 and Chapter 5. Whether photosynthetic
acclimation occurs at high CO2 concentration in the semi-closed greenhouse is
investigated in Chapter 3. Chapter 5 quantifies the photosynthesis response to light,
CO2 concentration, temperature, air humidity and their interactions at wide range. In
Chapter 6, the general discussion, results of the previous chapters are summarized
and discussed. Yield increase in the closed and semi-closed greenhouses is analyzed
by using a component hierarchical scheme. This chapter also discusses the energy
aspects and application of closed and semi-closed greenhouses in the horticultural
sector.
Figure.1.2 Schematic outline of this thesis
Climate
Chapter 2 & 4.1
Yield
Chapter 2
Growth & Development
Chapter 3 & 4.2
Photosynthesis
Chapter 3 & 5
Chapter 1
8
References
Adams, S.R., Cockshull, K.E., Cave, C.R.J., 2001. Effect of temperature on the
growth and development of tomato fruits. Annals of Botany. 88: 869-877.
Amthor, J. S., 1989. Respiration and Crop Productivity. Springer-Verlag, New York,
USA. 215pp.
Anonymous, 1987. World Commission on Environment and Development (WCED).
Our common future. Oxford: Oxford University Press. 43pp.
Anonymous, 2007. The Netherlands Energy Efficiency Action Plan 2007. The Hague,
The Netherlands. 69pp.
Anonymous, 2008. Convenant Schone en Zuinige Agrosectoren (in Dutch). Ministry
of Agriculture, Nature Conservation, and Fisheries, Den Hague, The Netherlands.
29pp.
Anonymous, 2010. Convenant Glastuinbouw en Milieu Evaluerende eindrapportage.
Platform Duurzame Glastuinbouw (in Dutch). 15 December 2010, Utrecht, The
Netherlands. 43pp.
Anonymous, 2012. Agricultural sectors take steps on energy and climate. Renewable
energy, greenhouse gas reduction and energy savings. NL Agency. Publication
No. 2AGRO01211.
Ayari, O., Dorais, M., Gosselin, A., 2000. Daily variations of photosynthetic
efficiency of greenhouse tomato plants during winter and spring. Journal of
American Society of Horticultural Science. 125: 235–241.
Bakker, J. C., De Zwart, H.F., Campen, J.B., 2006. Greenhouse cooling and heat
recovery using fine wire heat exchangers in a closed pot plant greenhouse: design
of an energy producing greenhouse. Acta Horticulturae. 719: 263-270.
Bertin, N., 2005. Analysis of the tomato fruit growth response to temperature and
plant fruit load in relation to cell division, cell expansion and DNA
endoreduplication. Annals of Botany. 95: 439-447.
Bot, G., 1992. Greenhouse growing: outlook 2000. Acta Horticulturae. 304: 43-48.
Bot, G., van de Braak, N., Challa, H., Hemming, S., Rieswijk, T., van Straten, G.,
Verlodt, I., 2005. The solar greenhouse: state of the art in energy saving and
sustainable energy supply. Acta Horticulturae. 691: 501-508.
Breukers, A., Hietbrink, O., Rujis, M.N.A., 2008. The power of Dutch greenhouse
vegetable horticulture. An analysis of the private sector and its institutional
framework. LEI Wageningen UR, Den Haag. Report No. 2008-049. 114pp.
Buchholz, M., Jochum, P., Zaragoza, G., 2005. Concept for water, heat and food
supply from a closed greenhouse-The watergy project. Acta Hortculturae. 691:
509-516.
Cannell, M.G.R., Thornley, J.H.M., 1998. Temperature and CO2 responses of leaf and
canopy photosynthesis: a clarification using the non-rectangular hyperbola model
of photosynthesis. Annals of Botany. 14: 729–739.
CBS, PBL, Wageningen UR. 2014. Energieverbruik in de land- en tuinbouw, 1990-
2012 (indicator 0013, versie 13, 27 januari 2014).
www.compendiumvoordeleefomgeving.nl. CBS, Den Haag; Planbureau voor de
Leefomgeving, Den Haag/Bilthoven en Wageningen UR, Wageningen.
De Gelder, A., Heuvelink, E., Opdam, J.J.G., 2005. Tomato yield in a closed
greenhouse and comparison with simulated yields in closed and conventional
Greenhouses. Acta Hortculturae. 691: 549-552.
General introduction
9
De Gelder, A., Dieleman, J.A., Bot, G.P.A., Marcelis, L.F.M., 2012. An overview of
climate and crop yield in closed greenhouses. The Journal of Horticultural
Science & Biotechnology. 87: 193-202.
De Haas, M., 2013. Two centuries of state involvement in the Dutch agro sector. An
assessment of policy in a long-term historical perspective. The Hague November
2013. 100pp.
De Koning, A.N.M., 1994. Development and dry matter distribution in glasshouse
tomato: a quantitative approach. PhD Thesis Wageningen Agricultural University.
240pp.
De Zwart, H.F., 2011. The sunergy greenhouse – one year of measurements in a next
generation greenhouse. Acta Horticulturae. 893: 351-358.
De Zwart, H.F., 2012. Lessons learned from experiments with semi-closed
greenhouse. Acta Horticulturae. 952: 583-588.
De Zwart, H.F., Kempkes, F.L.K., 2008. Characterizing of cooling equipment for
closed greenhouses. Acta Horticulturae. 801: 409-416.
Dieleman, J.A., Kempkes, F.L.K., 2006. Energy screens in tomato: determining the
optimal opening strategy. Acta Horticulturae. 718: 599-606.
Dieleman, J.A., Marcelis, L.F.M., Elings, A., Dueck, T.A., Meinen, E., 2006. Energy
saving in greenhouses: optimal use of climate conditions and crop management.
Acta Horticulturae. 718: 203-210.
Elings, A., Kempkes, F.L.K., Kaarsemaker, R.C., Ruijs, M.N.A., Braak, N.J. van der,
Dueck, T.A., 2005. The energy balance and energy-saving measures in
greenhouse tomato cultivation. Acta Horticulturae .691: 67-74.
Elings, A., Meinen, E., Campen, J., de Gelder, A., 2007. The photosynthesis response
of tomato to air circulation. Acta Horticulturae. 761: 77-84.
Fanwoua, J., de Visser, P., Heuvelink, E., Angenent, G., Yin, X. Marcelis, L.F.M.,
Struik, P., 2012. Response of cell division and cell expansion to local fruit
heating in tomato fruit. Journal of American Society of Horticultural Science.137:
294-301.
Hao, X., Wang, Q., Khosla, S., 2006. Responses of a long greenhouse tomato crop to
summer CO2 enrichment. Canadian Journal of Plant Science. 86: 1395–1400.
Hemming, S., Kempkes, F.L.K., Janse J., 2012. New greenhouse concept with high
insulating double glass and new climate control strategies – Modelling and first
results from a cucumber experiment. Acta Horticulturae. 952: 231-239.
Hoes, H., Desmedt, J., Goen, K., 2008. The GESKAS Project, closed greenhouse as
energy source and optimal growing environment. Acta Horticulturae.801: 1355-
1362.
Körner, O., Heuvelink, E., Niu, Q., 2009. Quantification of temperature, CO2, and
light effects on crop photosynthesis as a basis for model-based greenhouse
climate control. Journal of Horticultural Science & Biotechnology. 84:233-239.
Opdam, J.J.G., Schoonderbeek, G.G., Heller, E.M.B. 2005. Closed greenhouse: a
starting point for sustainable entrepreneurship in horticulture. Acta Horticulturae.
691: 517-524.
Poorter, H., Niinemets, Ü., Poorter, L., Wright, I.J., Villar, R., 2009. Causes and
consequences of variation in leaf mass per area (LMA): a meta-analysis. New
Phytologist.182: 565–588.
Sonneveld, P.J., Swinkels, G.L.A.M., 2005. New developments of energy-saving
greenhouses with a high light transmittance. Acta Horticulturae. 691: 589-595.
Chapter 1
10
Statline, 2016. Land use; main categories; Agriculture; greenhouses. Statline.cbs.nl.
Accessed 25 February 2016.
Tantau, H.J., Meyer, J., Schmidt, U., Bessler B., 2011. Low energy greenhouse – a
system approach. Acta Horticulturae. 893: 75-84.
Van der Velden, N.J.A., Smit, P.X., 2012. Energiemonitor van de Nederlandse
glastuinbouw 2012 LEI Report 2013-061. 68 pp.
Van der Velden, N.J.A., Smit, P.X., 2014. Energiemonitor van de Nederlandse
glastuinbouw 2013 LEI Report 2014-025. 54 pp.
Van der Velden, N., Smit, P., 2016. Energiemonitor van de Nederlandse glastuinbouw
2015. Wageningen, Wageningen Economic Research, Report 2016-099. 50pp
Vermeulen, P.C.M., 2012. Kwantitatieve Informatie voor de Glastuinbouw 2012-2013
- Kengetallen voor Groenten - Snijbloemen - Potplanten teelten - Editie 22.
Wageningen UR Glastuinbouw, Wageningen-Bleiswijk. GTB 5032. 196 pp
Wang, S., Boulard T., Haxaire, R., 1999. Air speed profiles in a naturally ventilated
greenhouse with a tomato crop. Agricultural and Forest Meteorology. 96: 181-
188.
Yamori, W., Evans, J.R., von Caemmerer, S., 2010. Effects of growth and
measurement light intensities on temperature dependence of CO2 assimilation rate
in tobacco leaves. Plant, Cell and Environment. 33: 332-343.
Yelle, S., Beeson Jr., R.C., Trudel, M.J., Gosselin, A., 1990. Duration of CO2
enrichment influences growth, yield, and gas exchange of two tomato species.
Journal of American Society of Horticultural Science. 115: 52–57.
Chapter 2
Comparison of climate and production in closed, semi-closed and open
greenhouses
Published as:
Qian, T., Dieleman, J. A., Elings, A., Marcelis, L. F. M., van Kooten O., 2011.
Comparison of climate and production in closed, semi-closed and open greenhouses. Acta
Horticulturae. 893: 807-814.
Chapter 2
12
Abstract
A (semi-)closed greenhouse is a novel greenhouse with an active cooling system
and temporary heat storage in an aquifer. Air is cooled, heated and dehumidified by air
treatment units. The climate in (semi-)closed greenhouses differs from that of
conventional open greenhouses. The aims of our research were firstly to analyze the
effect of active cooling on greenhouse climate, in terms of stability, gradient and average
levels; secondly to determine crop growth and production in closed and semi-closed
greenhouses. An experiment with tomato crop was conducted from December 2007 until
November 2008 in a closed greenhouse with 700 W m-2
cooling capacity, two semi-
closed greenhouses with 350 W m-2
and 150 W m-2
cooling capacity, respectively, and an
open greenhouse. The higher the cooling capacity, the more independent the greenhouse
climate was of outside climate. As the cooling ducts were placed underneath the plants,
cooling led to a remarkable vertical temperature gradient. Under sunny conditions
temperature could be 5 ˚C higher at the top than at the bottom of the canopy in the closed
greenhouse. Cumulative production in the semi-closed greenhouses with 350 W m-2
and
150 W m-2
cooling capacity were 10% (61 kg m-2
) and 6% (59 kg m-2
) higher than that in
the open greenhouse (55 kg m-2
), respectively. Cumulative production in the closed
greenhouse was 14% higher than in the open greenhouse in week 29 after planting but at
the end of the experiment the cumulative increase was only 4% due to botrytis. Model
calculations showed that the production increase in the closed and semi-closed
greenhouses was explained by higher CO2 concentration.
Climate in closed and semi-closed greenhouses
13
Introduction
Energy consumption of Dutch greenhouse industry contributes to about 10% of the
total national energy use and 79% of the total energy use of agriculture in the Netherlands
(Lansink and Ondersteijn 2006). Closed and semi-closed greenhouses were innovated to
reduce the energy consumption. A closed greenhouse has no window ventilation. Air is
cooled and dehumidified by air treatment units (ATU), which mainly takes place in
summer. Surplus heat as energy is stored in an underground aquifer and used in winter to
warm the greenhouse (Opdam et al. 2005). A semi-closed greenhouse has a smaller
cooling capacity than a closed greenhouse. Window ventilation is combined with active
cooling when temperature is too high to be managed by the active cooling system.
The greenhouse macro- and microclimates are distinctly different in (semi-)closed
greenhouses compared to that of open greenhouses. A high CO2 concentration (about
1000 ppm) is one of the typical climate characteristics of the (semi-)closed greenhouse
(De Gelder et al. 2005), which increases the production in the (semi-)closed greenhouse
(Heuvelink et al. 2008). In particular, the combination of high CO2 and high radiation that
occurs during summer in a (semi-)closed greenhouse is impossible to realize in an open
greenhouse. However, there is little detailed information available on climate conditions
that are realized by different cooling capacities in the (semi-)closed greenhouses. In
addition, a simultaneous comparison of climate and production between a (semi-)closed
greenhouse and an open greenhouse is necessary to analyze processes under similar
outdoor climate conditions.
The aims of our research are firstly to analyze the effect of active cooling on
climate, in terms of stability, gradient and average levels, in closed and semi-closed
greenhouses; and secondly to determine the production increase in closed and semi-closed
greenhouses. For this reason, we evaluated climate and crop growth and production in
greenhouses with different cooling capacities.
Materials and methods
Four experimental Venlo greenhouses were located in Bleiswijk, The Netherlands.
Each greenhouse was 144 m2 (15 m × 9.6 m), with a gutter height of 5.5 m. From these
four greenhouses, one was a conventional open greenhouse; the other three had cooling
capacities of 700 W m-2
, 350 W m-2
, and 150 W m-2
, respectively, installed. The air
conditioning was controlled by a standard horticultural computer (Hoogendoorn-
Economic). Greenhouse air was extracted to the ATU by five ventilators placed at the top
of each greenhouse. In the ATU the air was cooled and dehumidified, and subsequently
blown into the greenhouse through five plastic ducts placed beneath the growing gutters.
Each duct had six holes (16 mm diameter) per meter. Cooling capacity was adjusted
based on a difference between supply and return water temperature in the ATU. Cooling
was achieved by controlling air speed and water temperature with a minimum
temperature of 9 °C to obtain a desired greenhouse temperature. If temperature of the
greenhouse air exceeded the set point for cooling (Table 1), cooling was used. When the
cooling capacity could not cope with too high temperature, ventilation windows were
opened to support cooling (Table 1). In the greenhouse with 700 W m-2
cooling capacity
the cooling capacity was high enough to keep the windows closed during the experiment.
Hence, this greenhouse was defined as a closed greenhouse. The greenhouses with 350 W
m-2
and 150 W m-2
cooling capacities represented semi-closed greenhouses, of which the
latter one had more extended periods of window opening. Climate treatments started on
10th
March 2008 (89 days after planting). Heating was done via the conventional heating
Chapter 2
14
pipes. Average temperature set points during treatment for heating in the greenhouses
with 700 W m-2
, 350 W m-2
, and 150 W m-2
cooling capacities, and in the open
greenhouse, were 19.3 °C, 18.6 °C, 18.1 °C, and 17.9 °C, respectively. Pure CO2 was
supplied with a maximum capacity of 230 kg ha-1
h-1
during daytime with a set point of
1000 ppm for all treatments. Outside solar radiation, greenhouse CO2 concentration,
greenhouse air temperatures and humidity at the top of the canopy and at the growing
gutter were recorded automatically at a 5 min interval. Relations between outside solar
radiation and greenhouse CO2 concentration, vertical temperature gradient, and air humidity
were established for the purpose of trend analysis only.
Table 1. Average temperature set points to start cooling, to open lee side windows and wind side
windows in the greenhouses with 700 W m-2
, 350 W m-2
, and 150 W m-2
cooling capacities,
respectively, and in the open greenhouse.
Treatment Cooling Open lee side windows Open wind side windows
(°C) (°C) (°C)
700 W m-2
20 28 29
350 W m-2
19 22 25
150 W m-2
18 20 23
Open 19 22
Tomato plants, cultivar Capricia (truss tomato) grafted on the rootstock Emperador,
were planted in rock wool on 12 December 2007 with an initial stem density of 2.5 stem
m-2
. In week 11 after planting, one plant out of each two developed an additional side
shoot, to increase the stem density to 3.75 stems m-2
. Fruit harvest was started in 14 week
after planting. Fresh weights of the harvested fruits were recorded weekly. Scenarios were
calculated, by using the plant growth model INTKAM (Marcelis et al., 2009), to
investigate the contribution of the climate factors to the final production increase.
Calculation started by inputting the actual CO2 concentration, air temperature and VPD of
the open greenhouse. CO2 concentration, then, was replaced by the actual CO2
concentrations of the closed greenhouse, the semi-closed greenhouse with 350 W m-2
cooling capacity and the semi-closed greenhouse with 150 W m-2
cooling capacity,
respectively. The same operations were done for air temperature and VPD.
Results and discussion
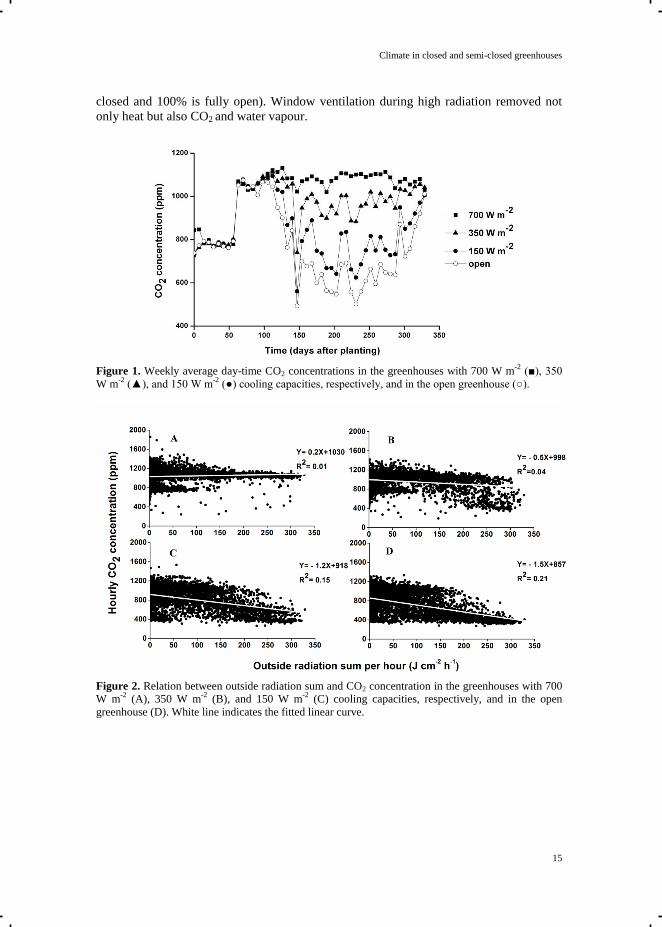
Carbon dioxide
In summer, average day-time CO2 concentration in the closed greenhouse with 700
W m-2
cooling capacity was greater than 1000 ppm, while it was about 600 ppm in the
open greenhouse (Fig. 1). However, the total amount of CO2 supplied to the open
greenhouse was almost four times more than that of the closed greenhouse (Table 2). CO2
concentration in the closed greenhouse was independent of solar radiation, whereas in the
semi-closed greenhouse with 150 W m-2
cooling capacity and the open greenhouse CO2
concentration decreased with increasing solar radiation (Fig. 2). The differences in CO2
concentration and CO2 supply rates between treatments were due to differences in
window opening. During treatments, the average extents of lee side and wind side
window opening of the closed greenhouse, the semi-closed greenhouses with 350 W m-2
and 150 W m-2
cooling capacities, and the open greenhouse, were correspondingly 0%,
6%, 18%, and 30% for lee side and 0%, 0%, 3%, and 5% for wind side (0% is fully
Climate in closed and semi-closed greenhouses
15
closed and 100% is fully open). Window ventilation during high radiation removed not
only heat but also CO2 and water vapour.
Figure 1. Weekly average day-time CO2 concentrations in the greenhouses with 700 W m
-2 (■), 350
W m-2
(▲), and 150 W m-2
(●) cooling capacities, respectively, and in the open greenhouse (○).
Figure 2. Relation between outside radiation sum and CO2 concentration in the greenhouses with 700
W m-2
(A), 350 W m-2
(B), and 150 W m-2
(C) cooling capacities, respectively, and in the open
greenhouse (D). White line indicates the fitted linear curve.
Chapter 2
16
Table 2. Early cumulative fruit production in week 29 after planting, final cumulative production in
week 48 after planting, and total amount of supplied CO2 in the greenhouses with 700 W m-2
, 350 W
m-2
, and 150 W m-2
cooling capacities, respectively, and in the open greenhouse. Values between
brackets indicate increase compared to open greenhouse
Treatment Early production Final production Supplied CO2
(kg m-2
) (kg m-2
) (kg m-2
)
700 W m-2
28 (14%) 57 (4%) 14
350 W m-2
27 (10%) 61 (10%) 30
150 W m-2
26 (6%) 59 (6%) 46
Open 24 55 55
Temperature
Air temperature in the greenhouse showed a positive linear relation with solar
radiation in all greenhouse types (the slope being about 0.03 J cm-2
h-1
°C-1
for the four
greenhouses). Realized average day-time temperature (measured at the top canopy) was
about 21.5 °C, 21.2 °C, 21.3 °C, and 21.0 °C for the closed greenhouse, the semi-closed
greenhouses with 350 W m-2
and 150 W m-2
cooling capacities, and the open greenhouse,
respectively. Since the closed and semi-closed greenhouses had higher CO2
concentrations compared to that of the open greenhouse, temperature in the closed and
semi-closed greenhouses was controlled to a higher level to have a higher rate of crop
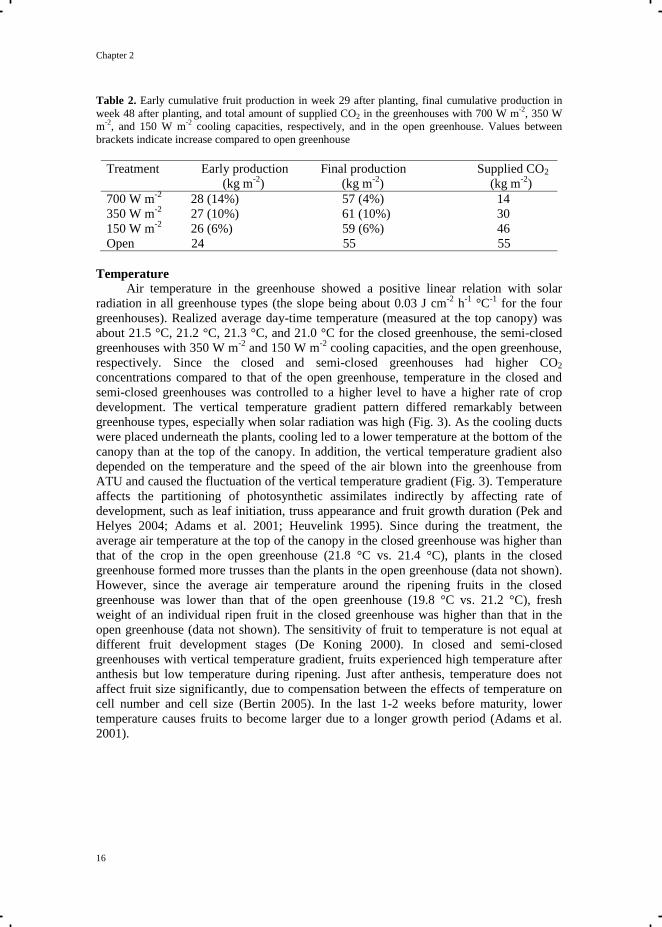
development. The vertical temperature gradient pattern differed remarkably between
greenhouse types, especially when solar radiation was high (Fig. 3). As the cooling ducts
were placed underneath the plants, cooling led to a lower temperature at the bottom of the
canopy than at the top of the canopy. In addition, the vertical temperature gradient also
depended on the temperature and the speed of the air blown into the greenhouse from
ATU and caused the fluctuation of the vertical temperature gradient (Fig. 3). Temperature
affects the partitioning of photosynthetic assimilates indirectly by affecting rate of
development, such as leaf initiation, truss appearance and fruit growth duration (Pek and
Helyes 2004; Adams et al. 2001; Heuvelink 1995). Since during the treatment, the
average air temperature at the top of the canopy in the closed greenhouse was higher than
that of the crop in the open greenhouse (21.8 °C vs. 21.4 °C), plants in the closed
greenhouse formed more trusses than the plants in the open greenhouse (data not shown).
However, since the average air temperature around the ripening fruits in the closed
greenhouse was lower than that of the open greenhouse (19.8 °C vs. 21.2 °C), fresh
weight of an individual ripen fruit in the closed greenhouse was higher than that in the
open greenhouse (data not shown). The sensitivity of fruit to temperature is not equal at
different fruit development stages (De Koning 2000). In closed and semi-closed
greenhouses with vertical temperature gradient, fruits experienced high temperature after
anthesis but low temperature during ripening. Just after anthesis, temperature does not
affect fruit size significantly, due to compensation between the effects of temperature on
cell number and cell size (Bertin 2005). In the last 1-2 weeks before maturity, lower
temperature causes fruits to become larger due to a longer growth period (Adams et al.
2001).
Climate in closed and semi-closed greenhouses
17
Figure 3. Relation between outside radiation sum and vertical temperature gradient (air temperature
difference) in the greenhouses with 700 W m-2
(A), 350 W m-2
(B), and 150 W m-2
(C) cooling
capacities, respectively, and in the open greenhouse (D). Air temperature difference is the difference
between the air temperatures measured at the height of the top canopy (top) and at the height of the
growing gutter (bottom). White line indicates the fitted linear curve.
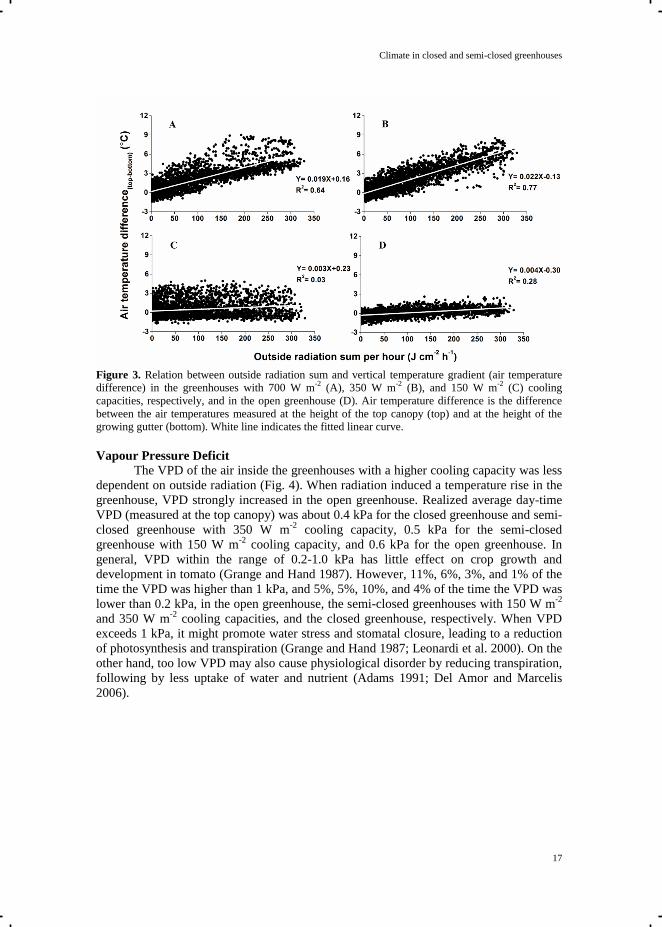
Vapour Pressure Deficit
The VPD of the air inside the greenhouses with a higher cooling capacity was less
dependent on outside radiation (Fig. 4). When radiation induced a temperature rise in the
greenhouse, VPD strongly increased in the open greenhouse. Realized average day-time
VPD (measured at the top canopy) was about 0.4 kPa for the closed greenhouse and semi-
closed greenhouse with 350 W m-2
cooling capacity, 0.5 kPa for the semi-closed
greenhouse with 150 W m-2
cooling capacity, and 0.6 kPa for the open greenhouse. In
general, VPD within the range of 0.2-1.0 kPa has little effect on crop growth and
development in tomato (Grange and Hand 1987). However, 11%, 6%, 3%, and 1% of the
time the VPD was higher than 1 kPa, and 5%, 5%, 10%, and 4% of the time the VPD was
lower than 0.2 kPa, in the open greenhouse, the semi-closed greenhouses with 150 W m-2
and 350 W m-2
cooling capacities, and the closed greenhouse, respectively. When VPD
exceeds 1 kPa, it might promote water stress and stomatal closure, leading to a reduction
of photosynthesis and transpiration (Grange and Hand 1987; Leonardi et al. 2000). On the
other hand, too low VPD may also cause physiological disorder by reducing transpiration,
following by less uptake of water and nutrient (Adams 1991; Del Amor and Marcelis
2006).
Chapter 2
18
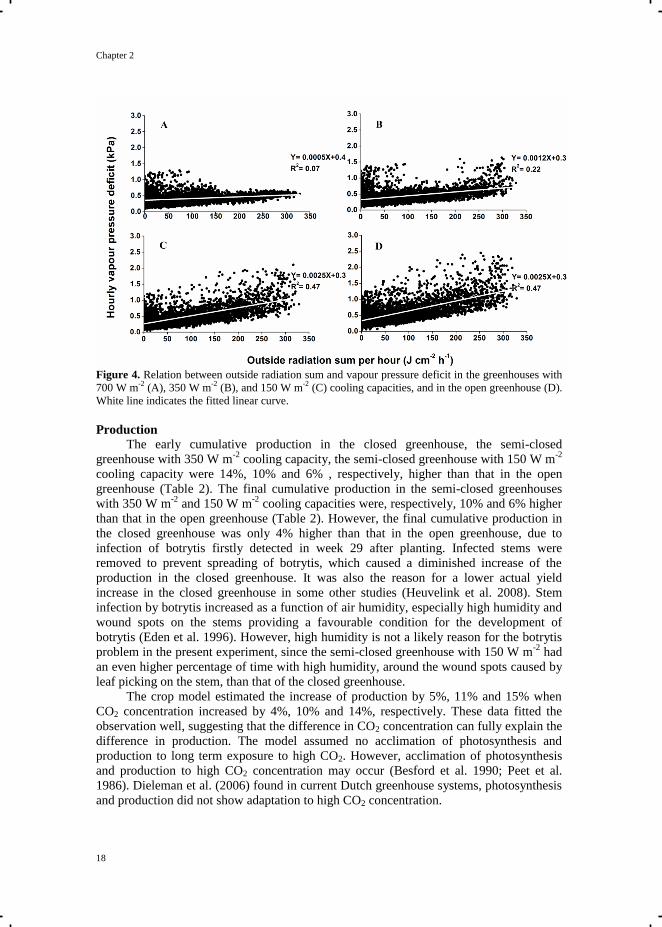
Figure 4. Relation between outside radiation sum and vapour pressure deficit in the greenhouses with
700 W m-2
(A), 350 W m-2
(B), and 150 W m-2
(C) cooling capacities, and in the open greenhouse (D).
White line indicates the fitted linear curve.
Production
The early cumulative production in the closed greenhouse, the semi-closed
greenhouse with 350 W m-2
cooling capacity, the semi-closed greenhouse with 150 W m-2
cooling capacity were 14%, 10% and 6% , respectively, higher than that in the open
greenhouse (Table 2). The final cumulative production in the semi-closed greenhouses
with 350 W m-2
and 150 W m-2
cooling capacities were, respectively, 10% and 6% higher
than that in the open greenhouse (Table 2). However, the final cumulative production in
the closed greenhouse was only 4% higher than that in the open greenhouse, due to
infection of botrytis firstly detected in week 29 after planting. Infected stems were
removed to prevent spreading of botrytis, which caused a diminished increase of the
production in the closed greenhouse. It was also the reason for a lower actual yield
increase in the closed greenhouse in some other studies (Heuvelink et al. 2008). Stem
infection by botrytis increased as a function of air humidity, especially high humidity and
wound spots on the stems providing a favourable condition for the development of
botrytis (Eden et al. 1996). However, high humidity is not a likely reason for the botrytis
problem in the present experiment, since the semi-closed greenhouse with 150 W m-2
had
an even higher percentage of time with high humidity, around the wound spots caused by
leaf picking on the stem, than that of the closed greenhouse.
The crop model estimated the increase of production by 5%, 11% and 15% when
CO2 concentration increased by 4%, 10% and 14%, respectively. These data fitted the
observation well, suggesting that the difference in CO2 concentration can fully explain the
difference in production. The model assumed no acclimation of photosynthesis and
production to long term exposure to high CO2. However, acclimation of photosynthesis
and production to high CO2 concentration may occur (Besford et al. 1990; Peet et al.
1986). Dieleman et al. (2006) found in current Dutch greenhouse systems, photosynthesis
and production did not show adaptation to high CO2 concentration.
Climate in closed and semi-closed greenhouses
19
Conclusions
In conclusion, the higher the cooling capacity, the more independent the
greenhouse’s interior climate is of the outside climate. In addition, the active cooling from
below the canopy introduced new macro and micro climate conditions in the greenhouse,
which were the vertical temperature gradient and the combination of high radiation and
high CO2 concentration. Future work will have to be done to quantify the relations
between climate factors and crop physiological processes, such as photosynthesis and
transpiration.
Chapter 2
20
References
Adams, P., 1991. Effect of diurnal fluctuation in humidity on the accumulation of
nutrients in leaves of tomato (Lycopersicon esculentum). Journal of Horticultural
Science. 66: 545-550.
Adams, S.R., Cockshull, K.E., Cave, C.R.J., 2001. Effect of temperature on the growth
and development of tomato fruits. Annals of Botany. 88: 869-877.
Besford, R.T., Ludwig, L.J.,Withers, A.C., 1990. The greenhouse effect: acclimation of
tomato plants growing in high CO2, photosynthesis and Ribulose-1, 5-Bisphosphate
carboxylase protein. Journal of Experimental Botany. 41: 925-931.
Bertin, N., 2005. Analysis of the tomato fruit growth response to temperature and plant
fruit load in relation to cell division, cell expansion and DNA endoreduplication.
Annals of Botany. 95: 439-447.
Del Amor, F.M., Marcelis, L.F.M., 2006. Differential effect of transpiration and Ca
supply on growth and Ca concentration of tomato plants. Scientia Horticulturae. 111:
17-23.
De Gelder, A., Heuvelink, E., Opdam, J.J.G., 2005. Tomato yield in a closed greenhouse
and comparison with simulated yields in closed and conventional greenhouses. Acta
Horticulturae. 691: 549-552.
De Koning, A.N.M., 2000. The effect of temperature, fruit load and salinity on
development rate of tomato fruit. Acta Horticulturae. 519: 85-93.
Dieleman, J.A., Marcelis, L.F.M., Elings, A., Dueck, T.A.,Meinen, E., 2006. Energy
saving in greenhouses: Optimal use of climate conditions and crop management. Acta
Horticulturae. 718: 203-209.
Eden, M.A., Hill, R.A., Beresford, R., Stewart, A., 1996. The influence of inoculum
concentration, relative humidity, and temperature on infection of greenhouse tomatoes
by Botrytis cinerea. Plant Pathology. 45: 795-806.
Grange, R.I., Hand, D.W. 1987. A review of the effects of atmospheric humidity on the
growth of horticultural crops. Journal of Horticultural Science. 62: 125-134.
Heuvelink, E., 1995. Effect of temperature on biomass allocation in tomato (Lycopersicon
esculentum). Physiologia Plantarum. 94: 447-452.
Heuvelink, E., Bakker, M., Marcelis, L.F.M., 2008. Climate and yield in a closed
greenhouse. Acta Horticulturae. 801: 1083-1092.
Lansink, A.O., Ondersteijn, C., 2006. Energy productivity growth in the Dutch
greenhouse industry. American Journal of Agricultural Economics. 88: 124-132.
Leonardi, C., Guichard, S., Bertin, N., 2000. High vapour pressure deficit influences
growth, transpiration and quality of tomato fruits. Scientia Horticulturae. 84: 285-296.
Marcelis, L.F.M., Elings, A., De Visser, P.H.B., Heuvelink, E. 2009. Simulating growth
and development of the tomato crop. Acta Horticulturae. 821: 101-110.
Opdam, J.J.G., Schoonderbeek, G.G., Heller, E.B.M., De Gelder, A., 2005. Closed
greenhouse: A starting point for sustainable entrepreneurship in horticulture. Acta
Horticulturae. 691: 517-524.
Peet, M.M., Huber, S.C., Patterson, D.T., 1986. Acclimation to high CO2 in monoecious
cucumbers : II. Carbon exchange rates, enzyme activities, and starch and nutrient
concentrations. Plant Physiology. 80: 63-67.
Pek, Z., Helyes, L., 2004. The effect of daily temperature on truss flowering rate of
tomato. Journal of Science of Food and Agriculture. 84: 1671-1674.
Chapter 3
Crop morphology and physiology in response to high CO2 concentration
Published as:
Qian, T., Dieleman, J. A., Elings, A., Marcelis, L. F. M., 2012. Leaf photosynthetic and
morphological responses to elevated CO2 concentration and altered fruit number in the semi-
closed greenhouse. Scientia Horticulturae. 145: 1–9.
Chapter 3
22
Abstract
Semi-closed greenhouses have been developed to reduce the energy consumption in
horticulture. In these greenhouses, CO2 concentration is higher than in the conventional
modern greenhouses due to the reduction of window ventilation. Photosynthetic and
morphological acclimation to elevated CO2 has been found in many plant species with
feedback inhibition being the main mechanism to explain this. The aim of this study was to
investigate the occurrence of photosynthetic and morphological acclimation to elevated CO2
concentration in the semi-closed greenhouse. Our hypothesis was that photosynthetic and
morphological acclimation to elevated CO2 concentration only occurred in plants with low
sink strength. Experiments were carried out with tomato plants with varying fruit loads in a
semi-closed greenhouse and a conventional modern greenhouse. Our results showed that
photosynthetic acclimation to elevated CO2 concentration only occurred when the number of
fruits was considerably reduced. Elevated CO2 as well as fruit removal reduced specific leaf
area. Reduction in photosynthesis rate was associated with, but not caused by reduced
stomatal conductance. The increase of dry matter production in the semi-closed greenhouse
was mainly explained by a higher CO2 concentration compared to the open greenhouse. We
suggested that elevated CO2 concentrations in the semi-closed greenhouse do not cause
feedback inhibition in high producing crops, because the plants have sufficient sink organs
(fruits) to utilise the extra assimilates.
Crop in response to high CO2
23
Introduction
Greenhouse horticulture has been developed to protect crops from unfavourable
environmental conditions, thereby extending the growing season, at the cost of a high energy
demand. Over the last decades, greenhouse concepts were developed aiming at reducing the
energy consumption (De Gelder et al. 2012; Heuvelink et al. 2008). In these concepts, cooling
by window ventilation was replaced by mechanical cooling. The excess solar energy was then
collected and stored, to be reused to heat the greenhouse in winter (Bakker 1992; Blackwell
and Garzoli 1981; Opdam et al. 2005). The greenhouse with reduced or no window opening
were named as semi-closed or closed greenhouses. Further advantages of the (semi)closed
greenhouse are the reduction of CO2 emission and improvement of crop and pest management
(Bot 1992). The reduced window ventilation in the (semi)closed greenhouses results in a
continuously high air CO2 concentration of about 800-1000 µmol mol-1
throughout the year,
while nowadays in conventional modern greenhouses the CO2 concentration in summer is
400-600 µmol mol-1
(Jokinen et al. 2011; Chapter 2). In the short-term, elevated CO2
concentration enhances photosynthesis (Cannell and Thornley 1998). However, in the long-
term, plants grown at an elevated CO2 concentration may have a lower photosynthesis rate at
a given CO2 concentration than plants grown at a lower CO2 concentration (Chen et al. 2005;
Pérez et al. 2007; Zhang et al. 2009). Such a decline of photosynthesis rate at a given CO2
concentration was defined as photosynthetic acclimation to elevated CO2 concentration
(Wolfe et al. 1998; Xu et al. 1994) and has been found in cucumber (Peet et al. 1986), tomato
(Besford et al. 1990; Nederhoff 1994; Yelle et al. 1989b), strawberry (Bunce 2001), rice
(Chen et al. 2005; Zhang et al. 2008), wheat (Pérez et al. 2007) and trees (Urban et al. 2003).
Furthermore, photosynthetic acclimation to elevated CO2 was often associated with changes
in stomatal conductance and leaf morphology. For instance, decrease of stomatal conductance
at elevated CO2 concentration was found in cotton, tomato, and soybean (Ainsworth et al.
2002; Sasek et al. 1985; Yelle et al. 1990). Increase of leaf thickness at elevated CO2
concentration, as a consequence of increased leaf weight and unaltered leaf area, was found in
soybean and tomato (Besford et al. 1990; Clough and Peet 1981; Yelle et al. 1990).
Feedback inhibition is the main mechanism that explains photosynthetic acclimation to
elevated CO2 concentration, in which the source-sink balance plays a role. Source organs are
the net exporters of carbon assimilates (mainly leaves), and source strength is defined as the
rate at which carbon assimilates are produced (photosynthesis rate) (Marcelis 1996). Sink
organs are the net importer of assimilates, and sink strength is defined as the competitive
ability of an organ to attract assimilates (Marcelis 1996). Photosynthesis rate increases at
elevated CO2 concentration in the short term, reflecting an increase of source strength. Such a
high photosynthesis rate is sustained in the long term if the sink is not limiting. If the sink is
limiting, over-accumulation of assimilates in leaves causes feedback inhibition on leaf
photosynthesis, associated with a decrease of stomatal conductance and increase of leaf
thickness (Poorter et al. 2009; Stitt et al. 1991). Species in which feedback inhibition at
elevated CO2 concentration was not found, had large sink organs, e.g. underground storage
organs like potato (Sage et al. 1989), radish (Usuda 2006), and bulb plants (Gutjahr and
Lapointe 2008); or were at high sink demand stages, e.g. reproductive stage (Davey et al.
2006) and fruit producing stage (Heuvelink 1995).
The aim of this study was to investigate whether there was photosynthetic and
morphological acclimation to elevated CO2 concentration in semi-closed greenhouses. Our
hypothesis was that photosynthetic and morphological acclimation to elevated CO2
concentration only occurred if the sink strength was low.
Chapter 3
24
Materials and methods
Greenhouses and crop management
The experiments were performed in two adjacent experimental greenhouses of 144 m2
each (15 m × 9.6 m), oriented from north to south, located at Bleiswijk, the Netherlands. A
standard horticultural computer (Hoogendoorn-Economic, The Netherlands) controlled the
environment inside the greenhouses. For temperature control, one greenhouse combined
mechanical cooling of 350 W m-2
cooling capacity with window ventilation, whereas the
other greenhouse only used window ventilation for cooling. Consequently, the greenhouse
with mechanical cooling had the ventilation windows more closed (defined as ‗semi-closed
greenhouse‘ hereafter) than the greenhouse without mechanical cooling (defined as ‗open
greenhouse‘ hereafter), especially in periods with a high cooling demand (Fig. 1). Pure CO2
was supplied at a maximum rate of 23 g m-2
h-1
during day-time (between sun rise and sun set)
with a set point of 1000 µmol mol-1
for both greenhouses.
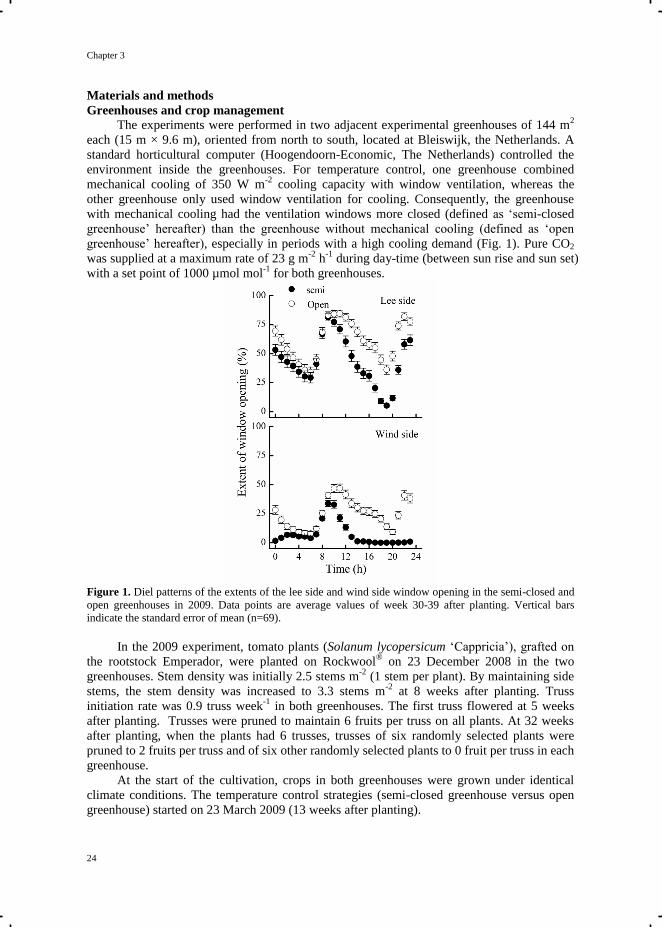
Figure 1. Diel patterns of the extents of the lee side and wind side window opening in the semi-closed and
open greenhouses in 2009. Data points are average values of week 30-39 after planting. Vertical bars
indicate the standard error of mean (n=69).
In the 2009 experiment, tomato plants (Solanum lycopersicum ‗Cappricia‘), grafted on
the rootstock Emperador, were planted on Rockwool®
on 23 December 2008 in the two
greenhouses. Stem density was initially 2.5 stems m-2
(1 stem per plant). By maintaining side
stems, the stem density was increased to 3.3 stems m-2
at 8 weeks after planting. Truss
initiation rate was 0.9 truss week-1
in both greenhouses. The first truss flowered at 5 weeks
after planting. Trusses were pruned to maintain 6 fruits per truss on all plants. At 32 weeks
after planting, when the plants had 6 trusses, trusses of six randomly selected plants were
pruned to 2 fruits per truss and of six other randomly selected plants to 0 fruit per truss in each
greenhouse.
At the start of the cultivation, crops in both greenhouses were grown under identical
climate conditions. The temperature control strategies (semi-closed greenhouse versus open
greenhouse) started on 23 March 2009 (13 weeks after planting).
Crop in response to high CO2
25
In the 2010 experiment, tomato plants ‗Cappricia‘ were planted on 18 December 2009
in two other adjacent experimental greenhouses of 144 m2 at the same location. Climate
control and crop management in the open and semi-closed greenhouses were similar to the
previous year. Temperature control strategies started on 29 March 2010 (14 weeks after
planting).
Photosynthesis measurements (Table 1)
In the 2009 experiment, photosynthesis measurements were carried out on top and
middle leaves during periods when the average day-time difference in CO2 concentration
between the open and semi-closed greenhouses was larger than 200 µmol mol-1
(Fig. 2). For
the top, leaf number 5 was taken, which is the uppermost fully unfolded leaf, and which has
an age of about 11 days. The middle leaf was leaf number 11, a mature leaf in the middle of
the canopy, with an age of about 25 days. Photosynthesis rate (net CO2 exchange rate) and
stomatal conductance were measured with LCpro (ADC BioScientific Ltd. UK). Light
intensity, Photosynthetic Active Radiation (PAR), in the measuring chamber was 1860 µmol
m-2
s-1
. Two CO2 concentrations were set in the measuring chamber, viz., 600 µmol mol-1
and
1000 µmol mol-1
. Air temperature in the chamber was controlled at 27°C, and Vapour
Pressure Deficit (VPD) was controlled to be less than 1 kPa. Photosynthesis rate and stomatal
conductance of the plants with 6 fruits per truss were measured at 30, 33, 36 and 39 weeks
after planting, to ensure that middle leaves were initiated when difference in CO2
concentration was larger than 200 µmol mol-1
in the two greenhouses (from week 28 after
planting onwards). Photosynthesis rate and stomatal conductance of the plants with 0 or 2
fruits per truss were measured at 33, 36 and 39 weeks after planting (1, 4, and 7 weeks after
fruit pruning).
Table 1. Overview of the measurements of photosynthesis rate described above
Year
Fruit load
(fruit truss-1
)
Time
(week after
planting)
Leaf position
(leaf number)
CO2
concentration
(µmol mol-1
)
Replicates
2009 6 30, 33, 36, 39 5, 11 600, 1000 6
2009 2 33, 36, 39 5, 11 600, 1000 6
2009 0 33, 36, 39 5, 11 600, 1000 6
2010 6 27 4, 7, 11, 14, 17 1000 6
2010 6 27 11 50-1600 6
In the 2010 experiment, the aim was to confirm the absence of photosynthesis
acclimation in plants with 6 fruit per truss. Therefore, the measurements were taken on more
leaf layers, namely leaf number 4, 7, 11, 14, and 17, counting from the top to bottom. Leaf
number 1 was the upmost leaf with the leaf length longer than 5 cm. Leaf number 4, 7, 11, 14,
and 17 were approximately 9, 16, 25, 32 and 39 days after appearance, respectively.
Differences in CO2 concentration between the open and semi-closed greenhouses were
smaller than 200 µmol mol-1
until 24 weeks after planting (data not shown). Photosynthesis
measurements were carried out on the five leaf layers at 27 weeks after planting in the two
greenhouses. Average day-time CO2 concentrations at 27 weeks after planting were 856 µmol
mol-1
in the semi-closed greenhouse and 575 µmol mol-1
in the open greenhouse. Light
intensity in the measuring chamber was 1860 µmol m-2
s-1
PAR. CO2 concentration was set to
1000 µmol mol-1
. Air temperature in the chamber was controlled at 27 °C, and VPD was
controlled to be less than 1 kPa. In addition, the response of photosynthesis rate to CO2
concentration was measured on leaf number 11 at CO2 concentrations varying between 50 and
1600 µmol mol-1
in the measuring chamber on the plants in the two greenhouses. The starting
Chapter 3
26
CO2 concentration was 600 µmol mol-1
, followed by 400, 200, 50, 600, 800, 1200, 1600 µmol
mol-1
. Air temperature, VPD, and light intensity in the leaf chamber were 27 °C, <1 kPa, and
1395 μmol m-2
s-1
PAR, respectively.
Plant measurements
In the 2009 experiment, the leaves on which photosynthesis rate was measured were
removed from the plant after the measurements (week 39 after planting), and leaf area was
measured immediately with a leaf area meter (LI-3100C, Li-Cor Inc. USA). Leaves were
dried for 48 h at 80 °C in the oven to determine their dry weights. Specific Leaf Area (SLA)
was calculated by dividing leaf area by leaf dry weight. Ripe fruits were harvested weekly,
starting from 15 weeks after planting. Three bottom leaves were removed weekly, starting
from 8 weeks after planting. Destructive harvests were performed at 27 and 40 weeks after
planting. Each compartment was divided into 3 blocks from north to south. Two plants were
randomly selected from each block. Dry weights (dried at 80 ˚C for over 48 h) of leaves,
stems and fruits were measured. Dry weight of harvested fruits and the picked old leaves were
added to the cumulative total dry weights.
Model calculations and scenario studies
The INTKAM crop growth model, as described in more detail by Marcelis et al. (2009),
was used to simulate total above-ground dry matter production. The model considers the main
crop physiological processes, and consists of modules for radiation interception by the canopy,
leaf and canopy photosynthesis, maintenance respiration, dry matter increase, and dry matter
partitioning among plant organs (roots, stem, leaves and individual trusses of fruits).
Interception of radiation, and canopy gross photosynthesis are calculated for a multi-
layered uniform canopy (Spitters 1986; Goudriaan and van Laar 1994). Extinction of radiation
is calculated according to the law of Lambert-Beer:
Where Iabs is radiation absorbed by the canopy (J m-2
s-1
), ρ is canopy reflection
coefficient (0.04 for diffuse light), Io is the radiation level at the top of the canopy (J m-2
s-1
), k
is the extinction coefficient (0.77 for diffuse light), and L is leaf area index (LAI) (m2 m
-2).
Instantaneous gross leaf gross photosynthesis is calculated with the biochemical model of
Farquhar-von Caemmerer-Berry (Farquhar et al. 1980) for 5 leaf layers in the canopy.
Instantaneous gross crop photosynthesis rate is obtained by applying a 5-point Gaussian
integration over LAI (Goudriaan 1986). The five Gaussian depths are at 5%, 23%, 50%, 77%
and 95% of total LAI. Instantaneous gross crop photosynthesis is computed at 5-60 minutes
time intervals, depending on the availability of environmental information, and accumulated
to daily gross crop photosynthesis rate.
Net assimilate production (Pn) results from the difference between canopy gross
photosynthesis (Pg) and maintenance respiration (Rm):
Maintenance respiration is calculated as a function of dry weights of the different plant
organs, temperature and crop relative growth rate according to Heuvelink (1995). Assimilate
partitioning between vegetative parts and individual trusses is simulated on the basis of the
concept of sink strengths, as described by Heuvelink (1996) and Marcelis (1994). In this
concept the assimilates partitioned to an organ (fi) is proportional to the ratio between its
potential growth rate (sink strength, S) and that of all plant parts together (ΣS):
Crop in response to high CO2
27
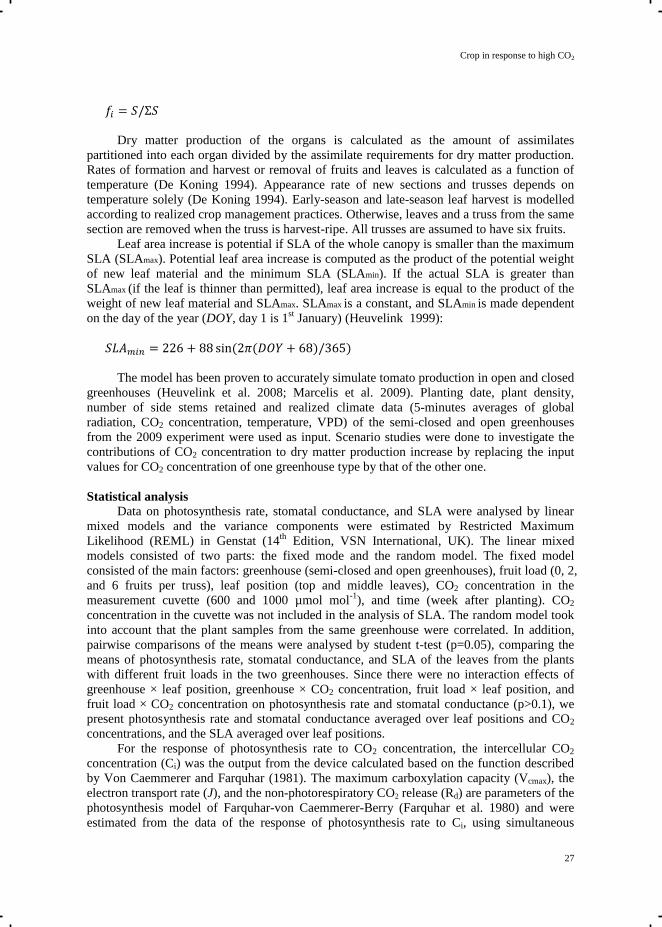
Dry matter production of the organs is calculated as the amount of assimilates
partitioned into each organ divided by the assimilate requirements for dry matter production.
Rates of formation and harvest or removal of fruits and leaves is calculated as a function of
temperature (De Koning 1994). Appearance rate of new sections and trusses depends on
temperature solely (De Koning 1994). Early-season and late-season leaf harvest is modelled
according to realized crop management practices. Otherwise, leaves and a truss from the same
section are removed when the truss is harvest-ripe. All trusses are assumed to have six fruits.
Leaf area increase is potential if SLA of the whole canopy is smaller than the maximum
SLA (SLAmax). Potential leaf area increase is computed as the product of the potential weight
of new leaf material and the minimum SLA (SLAmin). If the actual SLA is greater than
SLAmax (if the leaf is thinner than permitted), leaf area increase is equal to the product of the
weight of new leaf material and SLAmax. SLAmax is a constant, and SLAmin is made dependent
on the day of the year (DOY, day 1 is 1st January) (Heuvelink 1999):
The model has been proven to accurately simulate tomato production in open and closed
greenhouses (Heuvelink et al. 2008; Marcelis et al. 2009). Planting date, plant density,
number of side stems retained and realized climate data (5-minutes averages of global
radiation, CO2 concentration, temperature, VPD) of the semi-closed and open greenhouses
from the 2009 experiment were used as input. Scenario studies were done to investigate the
contributions of CO2 concentration to dry matter production increase by replacing the input
values for CO2 concentration of one greenhouse type by that of the other one.
Statistical analysis
Data on photosynthesis rate, stomatal conductance, and SLA were analysed by linear
mixed models and the variance components were estimated by Restricted Maximum
Likelihood (REML) in Genstat (14th
Edition, VSN International, UK). The linear mixed
models consisted of two parts: the fixed mode and the random model. The fixed model
consisted of the main factors: greenhouse (semi-closed and open greenhouses), fruit load (0, 2,
and 6 fruits per truss), leaf position (top and middle leaves), CO2 concentration in the
measurement cuvette (600 and 1000 µmol mol-1
), and time (week after planting). CO2
concentration in the cuvette was not included in the analysis of SLA. The random model took
into account that the plant samples from the same greenhouse were correlated. In addition,
pairwise comparisons of the means were analysed by student t-test (p=0.05), comparing the
means of photosynthesis rate, stomatal conductance, and SLA of the leaves from the plants
with different fruit loads in the two greenhouses. Since there were no interaction effects of
greenhouse × leaf position, greenhouse × CO2 concentration, fruit load × leaf position, and
fruit load × CO2 concentration on photosynthesis rate and stomatal conductance (p>0.1), we
present photosynthesis rate and stomatal conductance averaged over leaf positions and CO2
concentrations, and the SLA averaged over leaf positions.
For the response of photosynthesis rate to CO2 concentration, the intercellular CO2
concentration (Ci) was the output from the device calculated based on the function described
by Von Caemmerer and Farquhar (1981). The maximum carboxylation capacity (Vcmax), the
electron transport rate (J), and the non-photorespiratory CO2 release (Rd) are parameters of the
photosynthesis model of Farquhar-von Caemmerer-Berry (Farquhar et al. 1980) and were
estimated from the data of the response of photosynthesis rate to Ci, using simultaneous
Chapter 3
28
estimation method and nonlinear mixed effects model in R (version 2.9.2) described in
Chapter 5.
Results
Climate
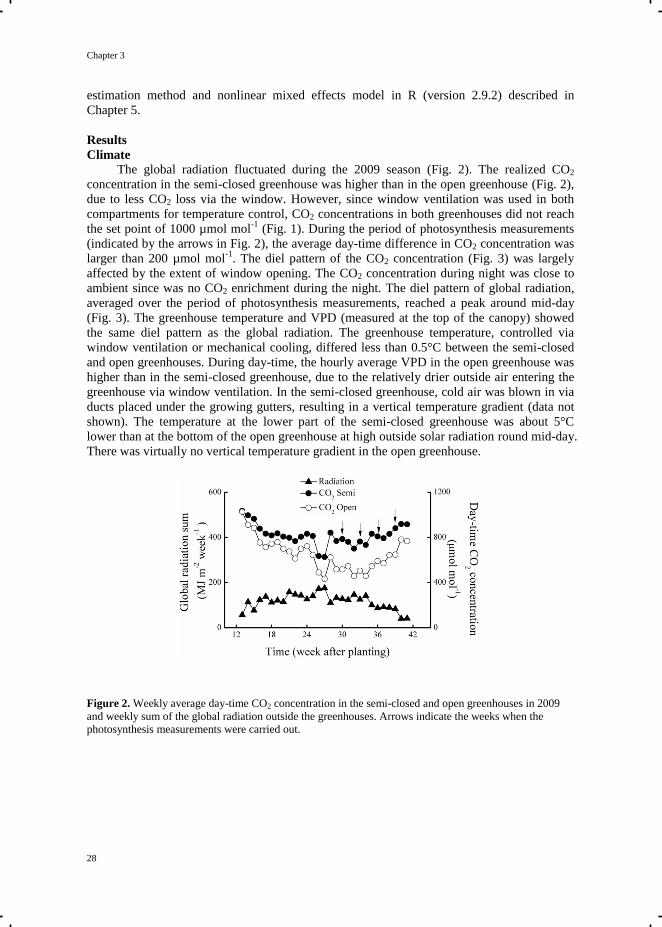
The global radiation fluctuated during the 2009 season (Fig. 2). The realized CO2
concentration in the semi-closed greenhouse was higher than in the open greenhouse (Fig. 2),
due to less CO2 loss via the window. However, since window ventilation was used in both
compartments for temperature control, CO2 concentrations in both greenhouses did not reach
the set point of 1000 µmol mol-1
(Fig. 1). During the period of photosynthesis measurements
(indicated by the arrows in Fig. 2), the average day-time difference in CO2 concentration was
larger than 200 µmol mol-1
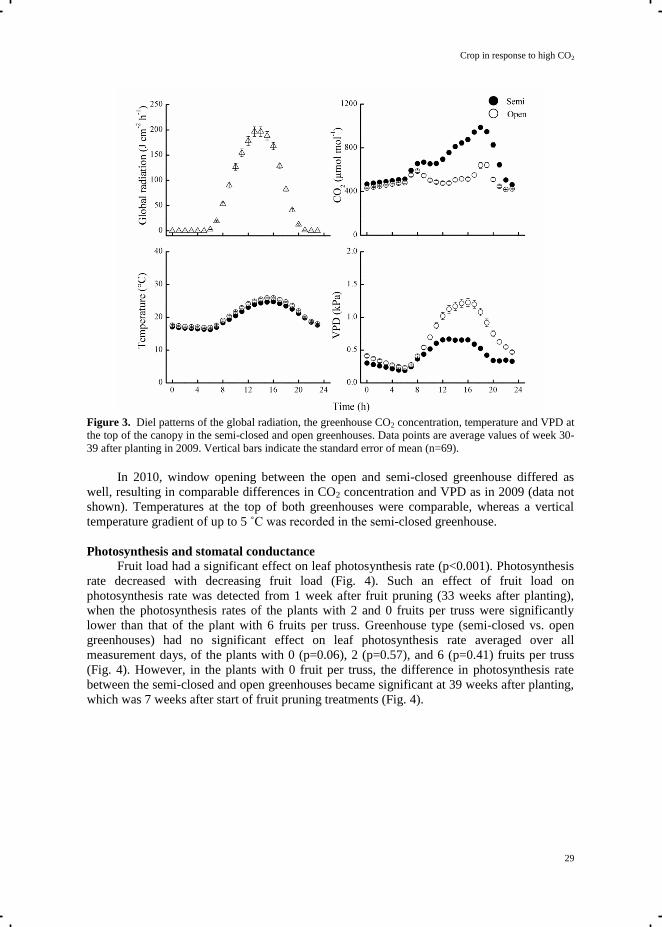
. The diel pattern of the CO2 concentration (Fig. 3) was largely
affected by the extent of window opening. The CO2 concentration during night was close to
ambient since was no CO2 enrichment during the night. The diel pattern of global radiation,
averaged over the period of photosynthesis measurements, reached a peak around mid-day
(Fig. 3). The greenhouse temperature and VPD (measured at the top of the canopy) showed
the same diel pattern as the global radiation. The greenhouse temperature, controlled via
window ventilation or mechanical cooling, differed less than 0.5°C between the semi-closed
and open greenhouses. During day-time, the hourly average VPD in the open greenhouse was
higher than in the semi-closed greenhouse, due to the relatively drier outside air entering the
greenhouse via window ventilation. In the semi-closed greenhouse, cold air was blown in via
ducts placed under the growing gutters, resulting in a vertical temperature gradient (data not
shown). The temperature at the lower part of the semi-closed greenhouse was about 5°C
lower than at the bottom of the open greenhouse at high outside solar radiation round mid-day.
There was virtually no vertical temperature gradient in the open greenhouse.
Figure 2. Weekly average day-time CO2 concentration in the semi-closed and open greenhouses in 2009
and weekly sum of the global radiation outside the greenhouses. Arrows indicate the weeks when the
photosynthesis measurements were carried out.
Crop in response to high CO2
29
Figure 3. Diel patterns of the global radiation, the greenhouse CO2 concentration, temperature and VPD at
the top of the canopy in the semi-closed and open greenhouses. Data points are average values of week 30-
39 after planting in 2009. Vertical bars indicate the standard error of mean (n=69).
In 2010, window opening between the open and semi-closed greenhouse differed as
well, resulting in comparable differences in CO2 concentration and VPD as in 2009 (data not
shown). Temperatures at the top of both greenhouses were comparable, whereas a vertical
temperature gradient of up to 5 ˚C was recorded in the semi-closed greenhouse.
Photosynthesis and stomatal conductance
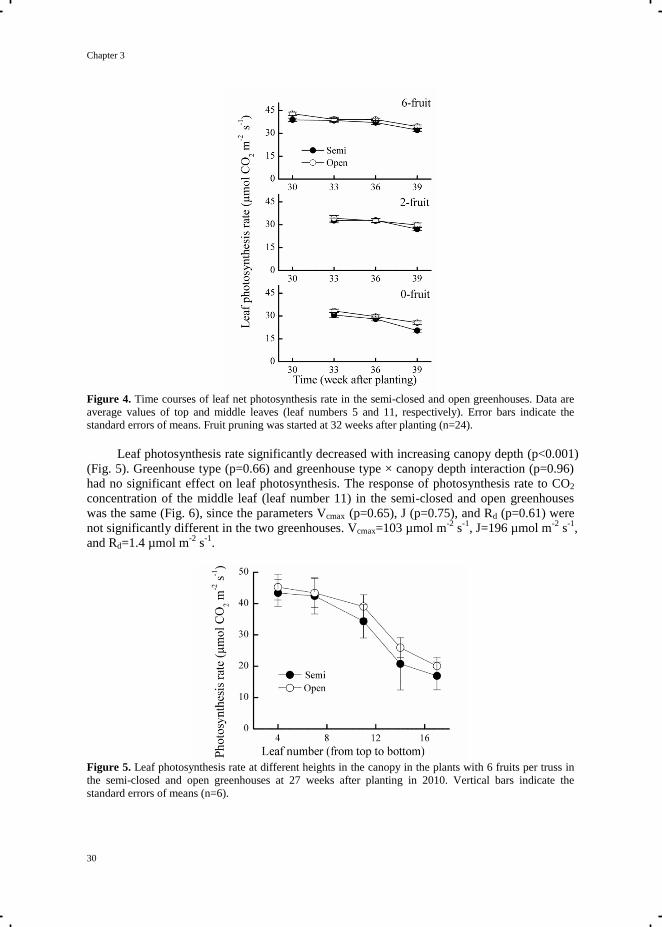
Fruit load had a significant effect on leaf photosynthesis rate (p<0.001). Photosynthesis
rate decreased with decreasing fruit load (Fig. 4). Such an effect of fruit load on
photosynthesis rate was detected from 1 week after fruit pruning (33 weeks after planting),
when the photosynthesis rates of the plants with 2 and 0 fruits per truss were significantly
lower than that of the plant with 6 fruits per truss. Greenhouse type (semi-closed vs. open
greenhouses) had no significant effect on leaf photosynthesis rate averaged over all
measurement days, of the plants with 0 (p=0.06), 2 (p=0.57), and 6 (p=0.41) fruits per truss
(Fig. 4). However, in the plants with 0 fruit per truss, the difference in photosynthesis rate
between the semi-closed and open greenhouses became significant at 39 weeks after planting,
which was 7 weeks after start of fruit pruning treatments (Fig. 4).
Chapter 3
30
Figure 4. Time courses of leaf net photosynthesis rate in the semi-closed and open greenhouses. Data are
average values of top and middle leaves (leaf numbers 5 and 11, respectively). Error bars indicate the
standard errors of means. Fruit pruning was started at 32 weeks after planting (n=24).
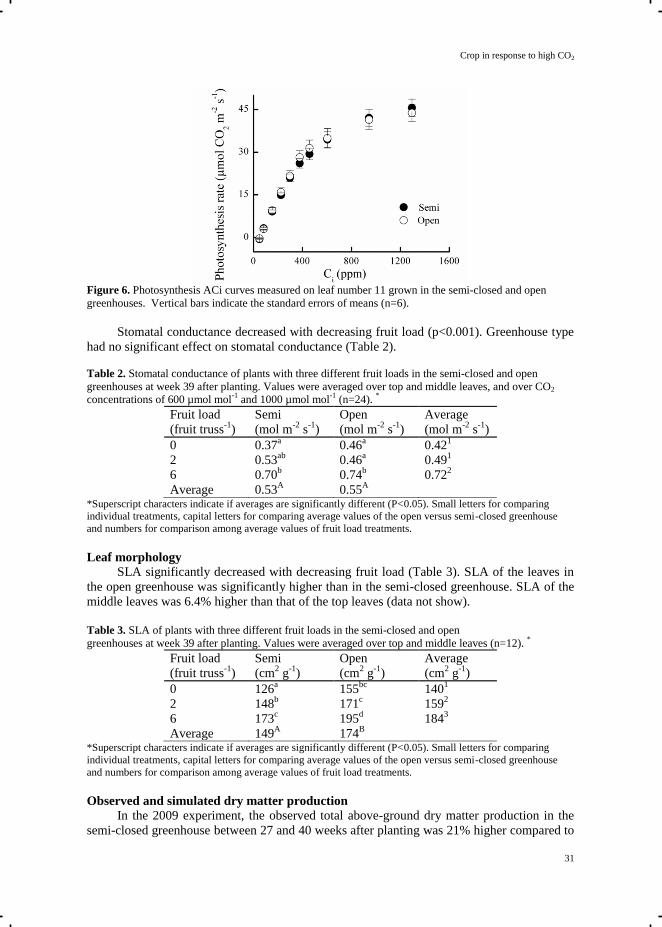
Leaf photosynthesis rate significantly decreased with increasing canopy depth (p<0.001)
(Fig. 5). Greenhouse type (p=0.66) and greenhouse type × canopy depth interaction (p=0.96)
had no significant effect on leaf photosynthesis. The response of photosynthesis rate to CO2
concentration of the middle leaf (leaf number 11) in the semi-closed and open greenhouses
was the same (Fig. 6), since the parameters Vcmax (p=0.65), J (p=0.75), and Rd (p=0.61) were
not significantly different in the two greenhouses. Vcmax=103 µmol m-2
s-1
, J=196 µmol m-2
s-1
,
and Rd=1.4 µmol m-2
s-1
.
Figure 5. Leaf photosynthesis rate at different heights in the canopy in the plants with 6 fruits per truss in
the semi-closed and open greenhouses at 27 weeks after planting in 2010. Vertical bars indicate the
standard errors of means (n=6).
Crop in response to high CO2
31
Figure 6. Photosynthesis ACi curves measured on leaf number 11 grown in the semi-closed and open
greenhouses. Vertical bars indicate the standard errors of means (n=6).
Stomatal conductance decreased with decreasing fruit load (p<0.001). Greenhouse type
had no significant effect on stomatal conductance (Table 2).
Table 2. Stomatal conductance of plants with three different fruit loads in the semi-closed and open
greenhouses at week 39 after planting. Values were averaged over top and middle leaves, and over CO2
concentrations of 600 µmol mol-1
and 1000 µmol mol-1
(n=24). *
Fruit load
(fruit truss-1
)
Semi
(mol m-2
s-1
)
Open
(mol m-2
s-1
)
Average
(mol m-2
s-1
)
0 0.37a 0.46
a 0.42
1
2 0.53ab
0.46a 0.49
1
6 0.70b 0.74
b 0.72
2
Average 0.53A 0.55
A
*Superscript characters indicate if averages are significantly different (P<0.05). Small letters for comparing
individual treatments, capital letters for comparing average values of the open versus semi-closed greenhouse
and numbers for comparison among average values of fruit load treatments.
Leaf morphology
SLA significantly decreased with decreasing fruit load (Table 3). SLA of the leaves in
the open greenhouse was significantly higher than in the semi-closed greenhouse. SLA of the
middle leaves was 6.4% higher than that of the top leaves (data not show).
Table 3. SLA of plants with three different fruit loads in the semi-closed and open
greenhouses at week 39 after planting. Values were averaged over top and middle leaves (n=12). *
Fruit load
(fruit truss-1
)
Semi
(cm2 g
-1)
Open
(cm2 g
-1)
Average
(cm2 g
-1)
0 126a 155
bc 140
1
2 148b 171
c 159
2
6 173c 195
d 184
3
Average 149A 174
B
*Superscript characters indicate if averages are significantly different (P<0.05). Small letters for comparing
individual treatments, capital letters for comparing average values of the open versus semi-closed greenhouse
and numbers for comparison among average values of fruit load treatments.
Observed and simulated dry matter production
In the 2009 experiment, the observed total above-ground dry matter production in the
semi-closed greenhouse between 27 and 40 weeks after planting was 21% higher compared to
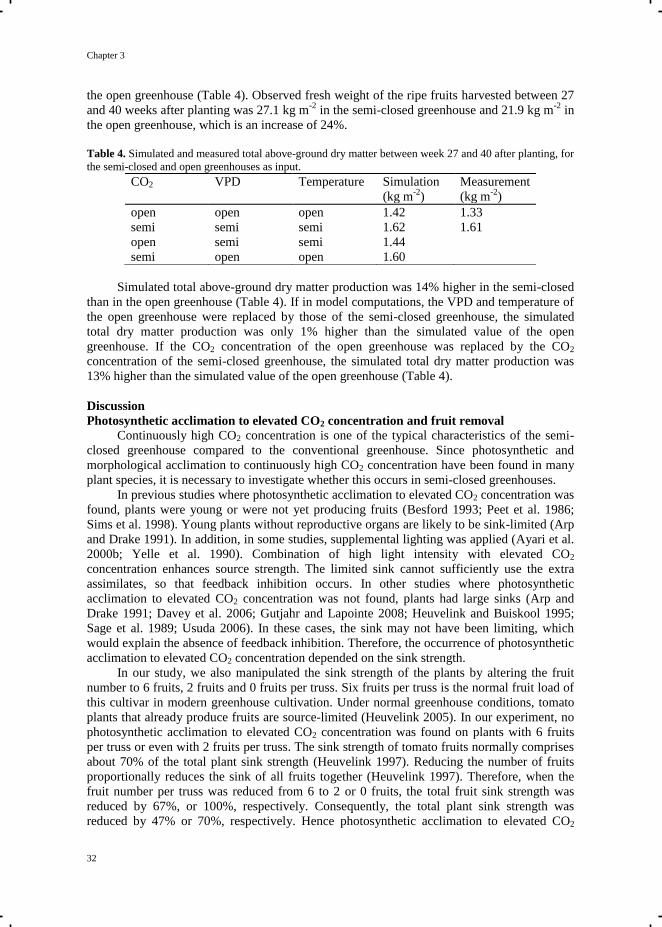
Chapter 3
32
the open greenhouse (Table 4). Observed fresh weight of the ripe fruits harvested between 27
and 40 weeks after planting was 27.1 kg m-2
in the semi-closed greenhouse and 21.9 kg m-2
in
the open greenhouse, which is an increase of 24%.
Table 4. Simulated and measured total above-ground dry matter between week 27 and 40 after planting, for
the semi-closed and open greenhouses as input.
CO2
VPD
Temperature
Simulation
(kg m-2
)
Measurement
(kg m-2
)
open open open 1.42 1.33
semi semi semi 1.62 1.61
open semi semi 1.44
semi open open 1.60
Simulated total above-ground dry matter production was 14% higher in the semi-closed
than in the open greenhouse (Table 4). If in model computations, the VPD and temperature of
the open greenhouse were replaced by those of the semi-closed greenhouse, the simulated
total dry matter production was only 1% higher than the simulated value of the open
greenhouse. If the CO2 concentration of the open greenhouse was replaced by the CO2
concentration of the semi-closed greenhouse, the simulated total dry matter production was
13% higher than the simulated value of the open greenhouse (Table 4).
Discussion
Photosynthetic acclimation to elevated CO2 concentration and fruit removal
Continuously high CO2 concentration is one of the typical characteristics of the semi-
closed greenhouse compared to the conventional greenhouse. Since photosynthetic and
morphological acclimation to continuously high CO2 concentration have been found in many
plant species, it is necessary to investigate whether this occurs in semi-closed greenhouses.
In previous studies where photosynthetic acclimation to elevated CO2 concentration was
found, plants were young or were not yet producing fruits (Besford 1993; Peet et al. 1986;
Sims et al. 1998). Young plants without reproductive organs are likely to be sink-limited (Arp
and Drake 1991). In addition, in some studies, supplemental lighting was applied (Ayari et al.
2000b; Yelle et al. 1990). Combination of high light intensity with elevated CO2
concentration enhances source strength. The limited sink cannot sufficiently use the extra
assimilates, so that feedback inhibition occurs. In other studies where photosynthetic
acclimation to elevated CO2 concentration was not found, plants had large sinks (Arp and
Drake 1991; Davey et al. 2006; Gutjahr and Lapointe 2008; Heuvelink and Buiskool 1995;
Sage et al. 1989; Usuda 2006). In these cases, the sink may not have been limiting, which
would explain the absence of feedback inhibition. Therefore, the occurrence of photosynthetic
acclimation to elevated CO2 concentration depended on the sink strength.
In our study, we also manipulated the sink strength of the plants by altering the fruit
number to 6 fruits, 2 fruits and 0 fruits per truss. Six fruits per truss is the normal fruit load of
this cultivar in modern greenhouse cultivation. Under normal greenhouse conditions, tomato
plants that already produce fruits are source-limited (Heuvelink 2005). In our experiment, no
photosynthetic acclimation to elevated CO2 concentration was found on plants with 6 fruits
per truss or even with 2 fruits per truss. The sink strength of tomato fruits normally comprises
about 70% of the total plant sink strength (Heuvelink 1997). Reducing the number of fruits
proportionally reduces the sink of all fruits together (Heuvelink 1997). Therefore, when the
fruit number per truss was reduced from 6 to 2 or 0 fruits, the total fruit sink strength was
reduced by 67%, or 100%, respectively. Consequently, the total plant sink strength was
reduced by 47% or 70%, respectively. Hence photosynthetic acclimation to elevated CO2
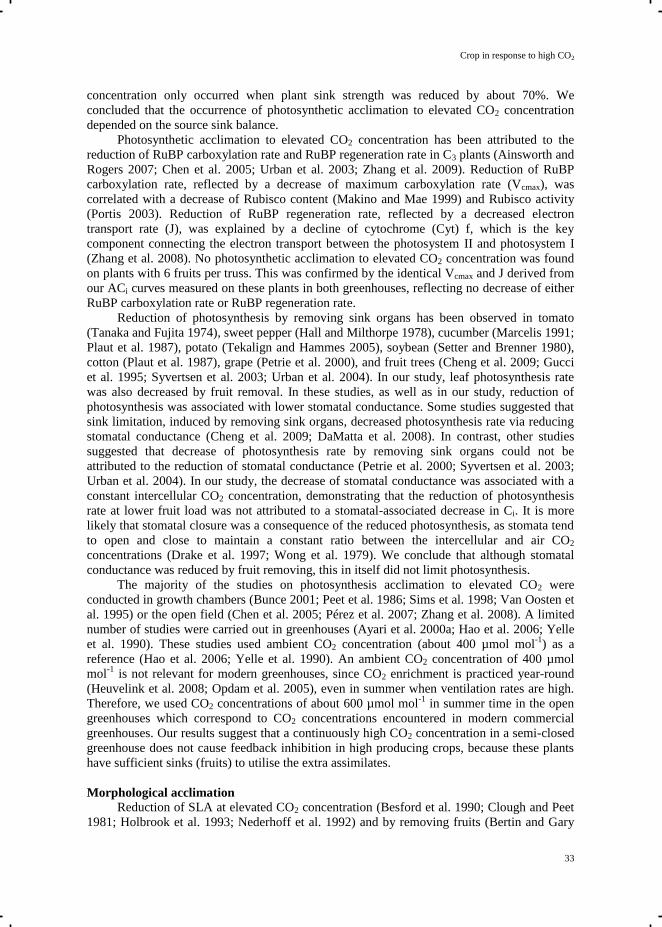
Crop in response to high CO2
33
concentration only occurred when plant sink strength was reduced by about 70%. We
concluded that the occurrence of photosynthetic acclimation to elevated CO2 concentration
depended on the source sink balance.
Photosynthetic acclimation to elevated CO2 concentration has been attributed to the
reduction of RuBP carboxylation rate and RuBP regeneration rate in C3 plants (Ainsworth and
Rogers 2007; Chen et al. 2005; Urban et al. 2003; Zhang et al. 2009). Reduction of RuBP
carboxylation rate, reflected by a decrease of maximum carboxylation rate (Vcmax), was
correlated with a decrease of Rubisco content (Makino and Mae 1999) and Rubisco activity
(Portis 2003). Reduction of RuBP regeneration rate, reflected by a decreased electron
transport rate (J), was explained by a decline of cytochrome (Cyt) f, which is the key
component connecting the electron transport between the photosystem II and photosystem I
(Zhang et al. 2008). No photosynthetic acclimation to elevated CO2 concentration was found
on plants with 6 fruits per truss. This was confirmed by the identical Vcmax and J derived from
our ACi curves measured on these plants in both greenhouses, reflecting no decrease of either
RuBP carboxylation rate or RuBP regeneration rate.
Reduction of photosynthesis by removing sink organs has been observed in tomato
(Tanaka and Fujita 1974), sweet pepper (Hall and Milthorpe 1978), cucumber (Marcelis 1991;
Plaut et al. 1987), potato (Tekalign and Hammes 2005), soybean (Setter and Brenner 1980),
cotton (Plaut et al. 1987), grape (Petrie et al. 2000), and fruit trees (Cheng et al. 2009; Gucci
et al. 1995; Syvertsen et al. 2003; Urban et al. 2004). In our study, leaf photosynthesis rate
was also decreased by fruit removal. In these studies, as well as in our study, reduction of
photosynthesis was associated with lower stomatal conductance. Some studies suggested that
sink limitation, induced by removing sink organs, decreased photosynthesis rate via reducing
stomatal conductance (Cheng et al. 2009; DaMatta et al. 2008). In contrast, other studies
suggested that decrease of photosynthesis rate by removing sink organs could not be
attributed to the reduction of stomatal conductance (Petrie et al. 2000; Syvertsen et al. 2003;
Urban et al. 2004). In our study, the decrease of stomatal conductance was associated with a
constant intercellular CO2 concentration, demonstrating that the reduction of photosynthesis
rate at lower fruit load was not attributed to a stomatal-associated decrease in Ci. It is more
likely that stomatal closure was a consequence of the reduced photosynthesis, as stomata tend
to open and close to maintain a constant ratio between the intercellular and air CO2
concentrations (Drake et al. 1997; Wong et al. 1979). We conclude that although stomatal
conductance was reduced by fruit removing, this in itself did not limit photosynthesis.
The majority of the studies on photosynthesis acclimation to elevated CO2 were
conducted in growth chambers (Bunce 2001; Peet et al. 1986; Sims et al. 1998; Van Oosten et
al. 1995) or the open field (Chen et al. 2005; Pérez et al. 2007; Zhang et al. 2008). A limited
number of studies were carried out in greenhouses (Ayari et al. 2000a; Hao et al. 2006; Yelle
et al. 1990). These studies used ambient CO2 concentration (about 400 µmol mol-1
) as a
reference (Hao et al. 2006; Yelle et al. 1990). An ambient CO2 concentration of 400 µmol
mol-1
is not relevant for modern greenhouses, since CO2 enrichment is practiced year-round
(Heuvelink et al. 2008; Opdam et al. 2005), even in summer when ventilation rates are high.
Therefore, we used CO2 concentrations of about 600 µmol mol-1
in summer time in the open
greenhouses which correspond to CO2 concentrations encountered in modern commercial
greenhouses. Our results suggest that a continuously high CO2 concentration in a semi-closed
greenhouse does not cause feedback inhibition in high producing crops, because these plants
have sufficient sinks (fruits) to utilise the extra assimilates.
Morphological acclimation
Reduction of SLA at elevated CO2 concentration (Besford et al. 1990; Clough and Peet
1981; Holbrook et al. 1993; Nederhoff et al. 1992) and by removing fruits (Bertin and Gary
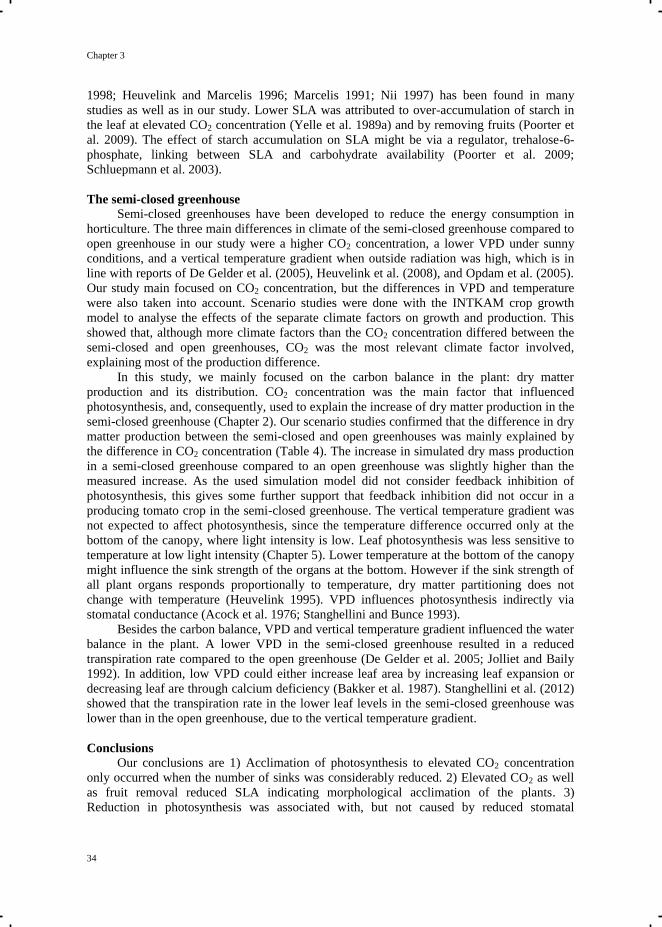
Chapter 3
34
1998; Heuvelink and Marcelis 1996; Marcelis 1991; Nii 1997) has been found in many
studies as well as in our study. Lower SLA was attributed to over-accumulation of starch in
the leaf at elevated CO2 concentration (Yelle et al. 1989a) and by removing fruits (Poorter et
al. 2009). The effect of starch accumulation on SLA might be via a regulator, trehalose-6-
phosphate, linking between SLA and carbohydrate availability (Poorter et al. 2009;
Schluepmann et al. 2003).
The semi-closed greenhouse
Semi-closed greenhouses have been developed to reduce the energy consumption in
horticulture. The three main differences in climate of the semi-closed greenhouse compared to
open greenhouse in our study were a higher CO2 concentration, a lower VPD under sunny
conditions, and a vertical temperature gradient when outside radiation was high, which is in
line with reports of De Gelder et al. (2005), Heuvelink et al. (2008), and Opdam et al. (2005).
Our study main focused on CO2 concentration, but the differences in VPD and temperature
were also taken into account. Scenario studies were done with the INTKAM crop growth
model to analyse the effects of the separate climate factors on growth and production. This
showed that, although more climate factors than the CO2 concentration differed between the
semi-closed and open greenhouses, CO2 was the most relevant climate factor involved,
explaining most of the production difference.
In this study, we mainly focused on the carbon balance in the plant: dry matter
production and its distribution. CO2 concentration was the main factor that influenced
photosynthesis, and, consequently, used to explain the increase of dry matter production in the
semi-closed greenhouse (Chapter 2). Our scenario studies confirmed that the difference in dry
matter production between the semi-closed and open greenhouses was mainly explained by
the difference in CO2 concentration (Table 4). The increase in simulated dry mass production
in a semi-closed greenhouse compared to an open greenhouse was slightly higher than the
measured increase. As the used simulation model did not consider feedback inhibition of
photosynthesis, this gives some further support that feedback inhibition did not occur in a
producing tomato crop in the semi-closed greenhouse. The vertical temperature gradient was
not expected to affect photosynthesis, since the temperature difference occurred only at the
bottom of the canopy, where light intensity is low. Leaf photosynthesis was less sensitive to
temperature at low light intensity (Chapter 5). Lower temperature at the bottom of the canopy
might influence the sink strength of the organs at the bottom. However if the sink strength of
all plant organs responds proportionally to temperature, dry matter partitioning does not
change with temperature (Heuvelink 1995). VPD influences photosynthesis indirectly via
stomatal conductance (Acock et al. 1976; Stanghellini and Bunce 1993).
Besides the carbon balance, VPD and vertical temperature gradient influenced the water
balance in the plant. A lower VPD in the semi-closed greenhouse resulted in a reduced
transpiration rate compared to the open greenhouse (De Gelder et al. 2005; Jolliet and Baily
1992). In addition, low VPD could either increase leaf area by increasing leaf expansion or
decreasing leaf are through calcium deficiency (Bakker et al. 1987). Stanghellini et al. (2012)
showed that the transpiration rate in the lower leaf levels in the semi-closed greenhouse was
lower than in the open greenhouse, due to the vertical temperature gradient.
Conclusions
Our conclusions are 1) Acclimation of photosynthesis to elevated CO2 concentration
only occurred when the number of sinks was considerably reduced. 2) Elevated CO2 as well
as fruit removal reduced SLA indicating morphological acclimation of the plants. 3)
Reduction in photosynthesis was associated with, but not caused by reduced stomatal

Crop in response to high CO2
35
conductance. 4) Increase of dry matter production in the semi-closed greenhouse was mainly
explained by elevated CO2 concentration.
Chapter 3
36
References
Acock, B., Charles-Edwards, D.A., Hand, D.W., 1976. An analysis of some effects of
humidity on photosynthesis by a tomato canopy under winter light conditions and a range
of carbon dioxide concentrations. Journal of Experimental Botany. 27: 933-941.
Ainsworth, E.A., Davey, P.A., Bernacchi, C.J., Dermody, O.C., Heaton, E.A., Moore, D.J.,
Morgan, P.B., Naidu, S.L., Yoo Ra, H.-s., Zhu, X.-g., Curtis, P.S., Long, S.P., 2002. A
meta-analysis of elevated [CO2] effects on soybean (Glycine max) physiology, growth
and yield. Global Change Biology. 8: 695-709.
Ainsworth, E. A., Rogers, A. 2007. The response of photosynthesis and stomatal conductance
to rising [CO2]: mechanisms and environmental interactions. Plant Cell Environment. 30:
258-270.
Arp, W.J., Drake, B.G., 1991. Increased photosynthetic capacity of Scirpus olneyi after 4
years of exposure to elevated CO2. Plant Cell Environment. 14: 1003-1006.
Ayari, O., Dorais, M., Gosselin, A., 2000a. Daily variations of photosynthetic efficiency of
greenhouse tomato plants during winter and spring. Journal of the American Society for
Horticultural Science. 125: 235-241.
Ayari, O., Samson, G., Dorais, M., Boulanger, R., Gosselin, A., 2000b. Stomatal limitation of
photosynthesis in winter production of greenhouse tomato plants. Physiologia Plantarum.
110: 558-564.
Bakker, J.C., 1992. Glasshouse with closed cover and ventilation system for air treatment.
Acta Horticulturae. 312,115.
Bakker, J.C., Welles, G.W.H., van Uffelen, J.A.M., 1987. The effects of day and night
humidity on yield and quality of glasshouse cucumber. Journal of Horticultural Science.
62: 361-368.
Bertin, N., Gary, C., 1998. Short and long term fluctuations of the leaf mass per area of
tomato plants—Implications for growth models. Annals of Botany. 82: 71-81.
Besford, R.T., 1993. Photosynthetic acclimation in tomato plants grown in high CO2.
Vegetatio. 104/105: 441-448.
Besford, R.T., Ludwig, L.J., Withers, A.C., 1990. The greenhouse effect: Acclimation of
tomato plants growing in high CO2, photosynthesis and Ribulose-1, 5-Bisphosphate
carboxylase protein. Journal of Experimental Botany. 41: 925-931.
Blackwell, J., Garzoli, K.V. 1981. Australian development of a low energy greenhouse based
on thermal storage rockpiles. Acta Horticulturae. 115: 113-123.
Bot, G.P.A., 1992. Greenhouse growing: outlook 2000. Acta Horticulturae. 304: 43-47.
Bunce, J.A., 2001. Seasonal patterns of photosynthetic response and acclimation to elevated
carbon dioxide in field-grown strawberry. Photosynthesis Research. 68: 237-245.
Cannell, M.G.R., Thornley, J.H.M., 1998. Temperature and CO2 responses of leaf and canopy
photosynthesis: a clarification using the non-rectangular hyperbola model of
photosynthesis. Annals of Botany. 14: 729-739.
Chen, G.Y., Yong, Z.H., Liao, Y., Zhang, D.Y., Chen, Y., Zhang, H.B., Chen, J., Zhu, J.G.,
Xu, D.Q., 2005. Photosynthetic acclimation in rice leaves to free-air CO2 enrichment
related to both Ribulose-1,5-bisphosphate carboxylation limitation and Ribulose-1,5-
bisphosphate regeneration limitation. Plant Cell Physiology. 46: 1036-1045.
Cheng, J., Fan, P., Liang, Z., Wang, Y., Niu, N., Li, W., Li, S., 2009. Accumulation of end
products in source leaves affects photosynthetic rate in peach via alteration of stomatal
conductance and photosynthetic efficiency. Journal of the American Society for
Horticultural Science. 134: 667-676.
Clough, J.M., Peet, M.M., 1981. Effects of intermittent exposure to high atmospheric CO2 on
vegetative growth in soybean. Physiologia Plantarum. 53: 565-569.
Crop in response to high CO2
37
DaMatta, F.M., Cunha, R.L., Antunes, W.C., Martins, S.C.V., Araujo, W.L., Fernie, A.R.,
Moraes, G.A.B.K., 2008. In field-grown coffee trees source-sink manipulation alters
photosynthetic rates, independently of carbon metabolism, via laterations in stomatal
function. New Phytologist. 178: 149-153.
Davey, P.A., Olcer, H., Zakhleniuk, O., Bernacchi, C.J., Calfapietra, C., Long, S.P., Raines,
C.A., 2006. Can fast-growing plantation trees escape biochemical down-regulation of
photosynthesis when grown throughout their complete production cycle in the open air
under elevated carbon dioxide? Plant Cell Environment. 29: 1235-1244.
De Gelder, A., Heuvelink, E., Opdam, J.J.G., 2005. Tomato yield in a closed greenhouse and
comparison with simulated yields in closed and conventional greenhouses. Acta
Horticulturae. 691: 549-552.
De Gelder, A., Dieleman, J.A., Bot, G.P.A., Marcelis, L.F.M., 2012. An overview of climate
and crop yield in closed greenhouses. Journal of Horticultural Science and Biotechnology.
87: 193-202.
Drake, B.G., Gonzàlez-Meler, M.A., Long, S.P., 1997. More efficient plants: A consequence
of rising atmospheric CO2. Annual Review of Plant Physiology. 48: 609-639.
Farquhar, G.D., Caemmerer, S., Berry, J.A., 1980. A biochemical model of photosynthetic
CO2 assimilation in leaves of C3 species. Planta. 149: 78-90.
Goudriaan, J., 1986. A simple and fast numerical method for the computation of daily totals
of crop photosynthesis. Agriculture and Forest Meteorology. 38: 249-254.
Goudriaan, J. van Laar, H.H., 1994. Modelling potential crop growth processes: textbook with
exercises. Kluwer, Dordrecht. 238pp.
Gucci, R., Grappadelli, L.C., Tustin, S., Ravaglia, G., 1995. The effect of defruiting at
different stages of fruit development on leaf photosynthesis of ―Golden Delicious‖ apple.
Tree Physiology. 15: 35-40.
Gutjahr, S., Lapointe, L., 2008. Carbon dioxide enrichment does not reduce leaf longevity or
alter accumulation of carbon reserves in the woodland spring ephemeral Erythronium
americanum. Annals of Botany. 102: 835-843.
Hall, A., Milthorpe, F., 1978. Assimilate source-sink relationships in Capsicum annuum L. III.
The effects of fruit excision on photosynthesis and leaf and stem carbohydrates.
Functional Plant Biology. 5: 1-13.
Hao, X., Wang, Q., Khosla, S., 2006. Responses of a long greenhouse tomato crop to summer
CO2 enrichment. Canadian Journal of Plant Science. 86: 1395-1400.
Heuvelink, E., 1995. Growth, development and yield of a tomato crop: periodic destructive
measurements in a greenhouse. Scientia Horticulturae. 61: 77-99.
Heuvelink, E., 1997. Effect of fruit load on dry matter partitioning in tomato. Scientia
Horticulturae. 69: 51-59.
Heuvelink, E. 1999. Evaluation of a dynamic simulation model for tomato crop growth and
development. Annals of Botany. 83: 413-422.
Heuvelink, E., 2005. Developmental processes. In: Heuvelink, E. (Ed), Tomatoes. CABI
Publishing, Wallingford, pp. 53-83.
Heuvelink, E., Bakker, M., Marcelis, L.F.M., 2008. Climate and yield in a closed greenhouse.
Acta Horticulturae. 801: 1083-1092.
Heuvelink, E., Buiskool, R.P.M., 1995. Influence of sink-source interaction on dry matter
production in tomato. Annals of Botany. 75: 381-389.
Heuvelink, E., Marcelis, L.F.M., 1996. Influence of assimilate supply on leaf formation in
sweet pepper and tomato. Journal of Horticultural Science. 71: 405-414.
Holbrook, G.P., Hansen, J., Wallick, K., Zinnen, T.M., 1993. Starch accumulation during
hydroponic growth of spinach and basil plants under carbon dioxide enrichment.
Environmental and Experimental Botany. 33: 313-321.
Chapter 3
38
Jokinen, K., Särkkä, L.E., Näkkilä, J., Tahvonen, R., 2011. Split root fertigation enhances
cucumber yield in both an open and a semi-closed greenhouse. Scientia Horticulturae.
130: 808-814.
Makino, A., Mae, T., 1999. Photosynthesis and plant growth at elevated levels of CO2. Plant
Cell Physiology. 40: 999-1006.
Marcelis, L.F.M., 1991. Effects of sink demand on photosynthesis in cucumber. Journal
Experimental Botany. 42: 1387-1392.
Marcelis, L.F.M., 1994. A simulation model for dry matter partitioning in cucumber. Annals
of Botany. 74: 43-52.
Marcelis, L.F.M., 1996. Sink strength as a determinant of dry matter partitioning in the whole
plant. Journal of Experimental Botany. 47: 1281-1291.
Marcelis, L.F.M., Elings, A., de Visser, P.H.B. Heuvelink, E. 2009. Simulating growth and
development of the tomato crop. Acta Horticulturae. 82: 101-110.
Nederhoff, E.M., 1994. Effects of CO2 concentration on photosynthesis, transpiration and
production of greenhouse fruit vegetable crops. Ph.D. thesis, Wageningen University,
The Netherlands. 213pp.
Nederhoff, E.M., de Koning, A.N.M., Rijsdijk, A.A., 1992. Leaf deformation and fruit
production of glasshouse grown tomato (Lycopersicon esculentum Mill.) as affected by
CO2, plant density and pruning. Journal of Horticultural Science. 67: 411 - 420.
Nii, N., 1997. Changes of starch and sorbitol in leaves before and after removal of fruits from
peach trees. Annals of Botany. 79: 139-144.
Opdam, J.J.G., Schoonderbeek, G.G., Heller, E.B.M., de Gelder, A., 2005. Closed greenhouse:
A starting point for sustainable entrepreneurship in horticulture. Acta Horticulturae. 691:
517-524.
Peet, M.M., Huber, S.C., Patterson, D.T., 1986. Acclimation to high CO2 in monoecious
cucumbers : II. carbon exchange rates, enzyme activities, and starch and nutrient
concentrations. Plant Physiology. 80: 63-67.
Pérez, P., Zita, G., Morcuende, R., Martínez-Carrasco, R., 2007. Elevated CO2 and
temperature differentially affect photosynthesis and resource allocation in flag and
penultimate leaves of wheat. Photosynthetica. 45: 9-17.
Petrie, P.R., Trought, M.C.T., Howell, G.S., 2000. Influence of leaf ageing, leaf area and crop
load on photosynthesis, stomatal conductance and senescence of grapevine (Vitis vinifera
L. cv. Pinot noir) leaves. Vitis. 39: 31-36.
Plaut, Z., Mayoral, M.L., Reinhold, L., 1987. Effect of altered sink:source ratio on
photosynthetic metabolism of source leaves. Plant Physiology. 85: 786-791.
Poorter, H., Niinemets, Ü., Poorter, L., Wright, I.J., Villar, R., 2009. Causes and
consequences of variation in leaf mass per area (LMA): a meta-analysis. New Phytologist.
182: 565-588.
Portis, A., 2003. Rubisco activase – Rubisco's catalytic chaperone. Photosynthesis Research.
75: 11-27.
Sage, R.F., Sharkey, T.D., Seemann, J.R., 1989. Acclimation of photosynthesis to elevated
CO2 in five C3 species. Plant Physiology. 89: 590-596.
Sasek, T.W., Delucia, E.H., Strain, B.R., 1985. Reversibility of photosynthetic inhibition in
cotton after long-term exposure to elevated CO2 concentrations. Plant Physiology. 78:
619-622.
Schluepmann, H., Pellny, T., van Dijken, A., Smeekens, S., Paul, M., 2003. Trehalose 6-
phosphate is indispensable for carbohydrate utilization and growth in Arabidopsis
thaliana. Proceedings of the National Academy of Sciences U.S.A. 100: 6849-6854.
Setter, T.L., Brenner, M.L., 1980. Stomatal closure and photosynthetic inhibition in soybean
leaves induced by petiole girdling and pod removal. Plant Physiology. 65: 884-887.
Crop in response to high CO2
39
Sims, D.A., Luo, Y., Seemann, J.R., 1998. Comparison of photosynthetic acclimation to
elevated CO2 and limited nitrogen supply in soybean. Plant Cell Environment. 21, 945.
Spitters, C.J.T., 1986. Separating the diffuse and direct component of global radiation and its
implications for modelling canopy photosynthesis: II. Calculation of canopy
photosynthesis. Agricultural and Forest Meteorology. 38: 231–242.
Stanghellini, C., Bunce, J.A., 1993. Response of photosynthesis and conductance to light,
CO2, temperature and humidity in tomato plants acclimated to ambient and elevated CO2.
Photosynthetica. 29: 487-497.
Stitt, M., Schaewen, A., Willmitzer, L., 1991. ―Sink‖ regulation of photosynthetic metabolism
in transgenic tobacco plants expressing yeast invertase in their cell wall involves a
decrease of the Calvin-cycle enzymes and an increase of glycolytic enzymes. Planta. 183:
40-50.
Syvertsen, J.P., Goñi, C., Otero, A., 2003. Fruit load and canopy shading affect leaf
characteristics and net gas exchange of ‗Spring‘ navel orange trees. Tree Physiology. 23:
899-906.
Tanaka, A., Fujita, K., 1974. Nutrio-physiological studies on the tomato plant. IV. Source-
sink relationship and structure of the source-sink unit. Soil Science and Plant Nutrition.
20: 305-315.
Tekalign, T., Hammes, P.S., 2005. Growth and productivity of potato as influenced by
cultivar and reproductive growth: I. Stomatal conductance, rate of transpiration, net
photosynthesis, and dry matter production and allocation. Scientia Horticulturae. 105: 13-
27.
Urban, L., Léchaudel, M., Lu, P., 2004. Effect of fruit load and girdling on leaf
photosynthesis in Mangifera indica L. Journal of Experimental Botany. 55: 2075-2085.
Urban, O., Pokorný, R., Kalina, J., Marek, M.V., 2003. Control mechanisms of photosynthetic
capacity under elevated CO2 concentration: evidence from three experiments with
norway spruce trees. Photosynthetica. 41: 69-75.
Usuda, H., 2006. Effects of elevated CO2 on the capacity for photosynthesis of a single leaf
and a whole plant, and on growth in a radish. Plant Cell Physiology. 47: 262-269.
Van Oosten, J.J., Wilkins, D., Besford, R.T., 1995. Acclimation of tomato to different carbon
dioxide concentrations. Relationships between biochemistry and gas exchange during leaf
development. New Phytologist. 130: 357-367.
Von Caemmerer, S., Farquhar, G.D., 1981. Some relationships between the biochemistry of
photosynthesis and the gas exchange of leaves. Planta. 153: 376-387.
Wolfe, D.W., Gifford, R.M., Hilbert, D., Luo, Y., 1998. Integration of photosynthetic
acclimation to CO2 at the whole-plant level. Global Change Biology. 4: 879-893.
Wong, S.C., Cowan, I.R., Farquhar, G.D., 1979. Stomatal conductance correlates with
photosynthetic capacity. Nature. 282: 424-426.
Xu, D.Q., Gifford, R.M., Chow, W.S., 1994. Photosynthetic acclimation in pea and soybean
to high atmospheric CO2 partial pressure. Plant Physiology. 106: 661-671.
Yelle, S., Beeson, R.C., Jr., Trudel, M.J., Gosselin, A., 1989a. Acclimation of two tomato
species to high atmospheric CO2: I. Sugar and starch concentrations. Plant Physiology.
90:1465-1472.
Yelle, S., Beeson, R.C., Jr., Trudel, M.J., Gosselin, A., 1989b. Acclimation of two tomato
species to high atmospheric CO2: II. Ribulose-1,5-Bisphosphate carboxylase/oxygenase
and phosphoenolpyruvate carboxylase. Plant Physiology. 90: 1473-1477.
Yelle, S., Beeson, R.C., Jr., Trudel, M.J., Gosselin, A., 1990. Duration of CO2 enrichment
influences growth, yield, and gas exchange of two tomato species. Journal of the
American Society for Horticultural Science. 115: 52-57.

Chapter 3
40
Zhang, D.Y., Chen, G.Y., Gong, Z.Y., Chen, J., Yong, Z.H., Zhu, J.G., Xu, D.Q., 2008.
Ribulose-1,5-bisphosphate regeneration limitation in rice leaf photosynthetic acclimation
to elevated CO2. Plant Science. 175: 348-355.
Zhang, D.Y., Chen, G.Y., Chen, J., Yong, Z.H., Zhu, J.G., Xu, D.Q., 2009. Photosynthetic
acclimation to CO2 enrichment related to ribulose-1,5-bisphosphate carboxylation
limitation in wheat. Photosynthetica. 47: 152-154.
Chapter 4
Crop growth and development in response to vertical temperature gra-
dients
Chapter 4.1 Occurrence of vertical temperature and vapour pres-
sure deficit gradients
Adapted from the publication:
Qian, T., Dieleman, J. A., Elings, A., Van Kooten, O., Marcelis, L. F. M., 2012. Vertical
temperature gradients in the semi-closed greenhouses: occurrence and effects. Acta Horti-
culturae. 927: 59-66.
Chapter 4.1
42
Abstract
Semi-closed greenhouses have been developed in which window ventilation is min-
imized due to active cooling, enabling enhanced CO2 concentrations at high irradiance.
Cooled and dehumidified air is blown into the greenhouse from below or above the cano-
py. Cooling below the canopy may induce vertical temperature gradients along the height
of the plants. The aim was to analyse the effect of the positioning of the inlet of cooled
and dehumidified air on the magnitudes of vertical temperature gradients and vapour
pressure deficit (VPD) gradients in the semi-closed greenhouses. Tomato crops were
grown year-round in four semi-closed greenhouses with cooled and dehumidified air
blown into the greenhouses from below or above the crop. Cooling below the canopy in-
duced vertical temperature and VPD gradients. The temperature at the top of the canopy
was over 5 °C higher and VPD was 0.7 kPa lower, than at the bottom, when outside solar
radiation was high (solar radiation > 250 J cm-2
h-1
). The vertical temperature gradients
and VPD gradients were studied in seasonal pattern, and in diel pattern in detail. The ver-
tical temperature gradients and VPD gradients positively correlated with outside radiation
and outside temperature.
Occurrence of vertical temperature gradients
43
Introduction
Semi-closed greenhouses were developed to save energy. Greenhouse air is cooled
and dehumidified by air treatment units and returned to the greenhouse through cooling
ducts (De Gelder et al. 2012). Active cooling is combined with window ventilation if
temperatures are too high to be controlled by the air treatment units with limited cooling
capacity. Cooling ducts are normally placed beneath the growing gutters, because place-
ment overhead or within crops either causes loss of light or interferes with cultivation
procedures (Wells and Amos 1994). However, cooling from below induces a vertical
temperature gradient along the canopy (Chapter 2). The occurrence and magnitude of the
vertical temperature gradient depend on the radiation (Suay et al. 2008), the cooling ca-
pacity, and temperature of the air blown into the greenhouse (Chapter 2). It may vary dur-
ing a day and during the season. We carried out an experiment with tomato crops in semi-
closed greenhouses where a vertical temperature gradient was present or absent. The aim
was to analyse the effects of the positioning of the inlet of cool and dehumidified air on
the occurrence and magnitudes of vertical temperature gradients and vapour pressure def-
icit (VPD) gradients in the semi-closed greenhouses. The vertical temperature gradients
and VPD gradients were studied in seasonal pattern, and in diel pattern in detail.
Materials and methods
Experiments were conducted in four adjacent semi-closed greenhouses with 350 W
m-2
maximum cooling capacity, located in Bleiswijk, The Netherlands. Each greenhouse
measured 144 m2 (15 m x 9.6 m), with a gutter height of 5.5 m. Transmission of diffuse
global light was 59 %. Seven growing gutters, about 70 cm above the floor, with rock-
wool slabs, were oriented from east to west, of which five were double-row and two were
single-row for border plants. Air conditioning was controlled by a standard horticultural
computer (Hoogendoorn-Economic). Cooling capacity was controlled by adjustment of
air speed and the temperature of the cooling water. This control was based on the differ-
ence between supply and return water temperature in the air treatment units. Air tempera-
ture set points for cooling and heating were identical for all the four greenhouses. Ventila-
tion windows were opened if the 350 W m-2
cooling capacity was insufficient to keep
greenhouse temperature below the critical level. Pure CO2 was supplied at a maximum
rate of 23g m-2
h-1
during daytime with a set point of 1000 μmol mol-1
for each green-
house. Outside radiation, greenhouse CO2 concentration, greenhouse air temperature and
humidity were recorded automatically at a 5 min interval. In addition, temperature and hu-
midity sensors (Hoogendoorn) were placed at four canopy heights in each greenhouse (3.5
m, 2.5 m, 1.2 m, and 0.3 m above the growing gutters, which were 0.7 m from the ground).
The highest sensor (3.5 m) was above the top of the canopy. The lowest sensor (0.3 m) was
between the lowest truss and the rockwool slab. The values of the two sensors in the middle
(2.5 m and 1.2 m) were averaged, representing the temperature and humidity at the middle
of the canopy.
Two treatments were applied, namely cooling from below and from above the can-
opy (Fig. 1). Each treatment was replicated in two greenhouse compartments. The differ-
ence of the realized daily average temperature between the two replicates was less than
0.5°C. In all the four greenhouses, air was extracted from the greenhouse by five ventila-
tors placed at the top of the greenhouse, cooled and dehumidified in the air treatment
units. In one treatment, treated air from the air treatment units was returned to the green-
house through five plastic cooling ducts placed horizontally beneath the growing gutters.
Each duct had six holes (16 mm diameter) per meter. In the other treatment, treated air
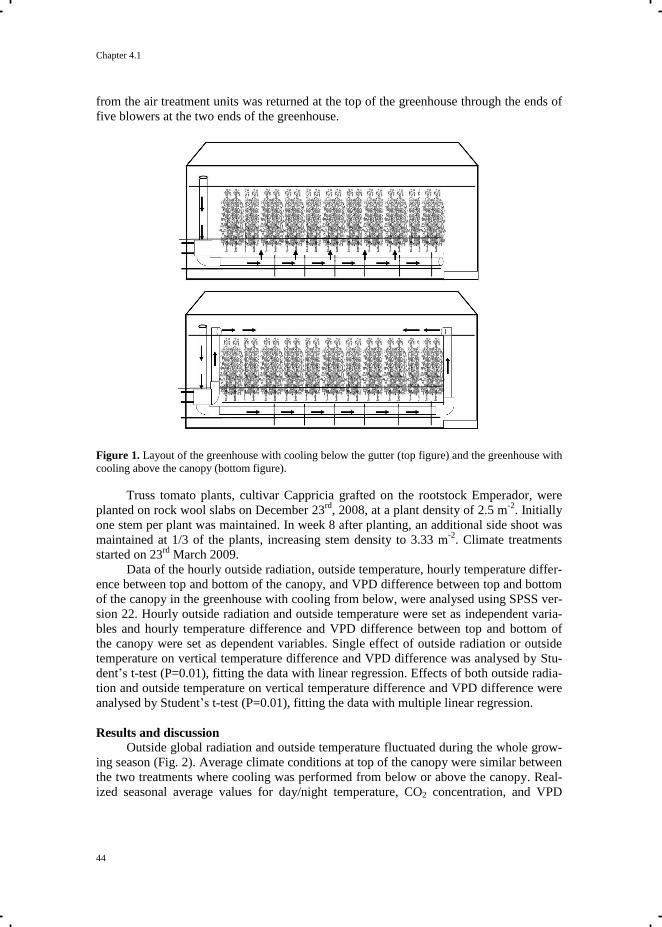
Chapter 4.1
44
from the air treatment units was returned at the top of the greenhouse through the ends of
five blowers at the two ends of the greenhouse.
Figure 1. Layout of the greenhouse with cooling below the gutter (top figure) and the greenhouse with
cooling above the canopy (bottom figure).
Truss tomato plants, cultivar Cappricia grafted on the rootstock Emperador, were
planted on rock wool slabs on December 23rd
, 2008, at a plant density of 2.5 m-2
. Initially
one stem per plant was maintained. In week 8 after planting, an additional side shoot was
maintained at 1/3 of the plants, increasing stem density to 3.33 m-2
. Climate treatments
started on 23rd
March 2009.
Data of the hourly outside radiation, outside temperature, hourly temperature differ-
ence between top and bottom of the canopy, and VPD difference between top and bottom
of the canopy in the greenhouse with cooling from below, were analysed using SPSS ver-
sion 22. Hourly outside radiation and outside temperature were set as independent varia-
bles and hourly temperature difference and VPD difference between top and bottom of
the canopy were set as dependent variables. Single effect of outside radiation or outside
temperature on vertical temperature difference and VPD difference was analysed by Stu-
dent’s t-test (P=0.01), fitting the data with linear regression. Effects of both outside radia-
tion and outside temperature on vertical temperature difference and VPD difference were
analysed by Student’s t-test (P=0.01), fitting the data with multiple linear regression.
Results and discussion
Outside global radiation and outside temperature fluctuated during the whole grow-
ing season (Fig. 2). Average climate conditions at top of the canopy were similar between
the two treatments where cooling was performed from below or above the canopy. Real-
ized seasonal average values for day/night temperature, CO2 concentration, and VPD
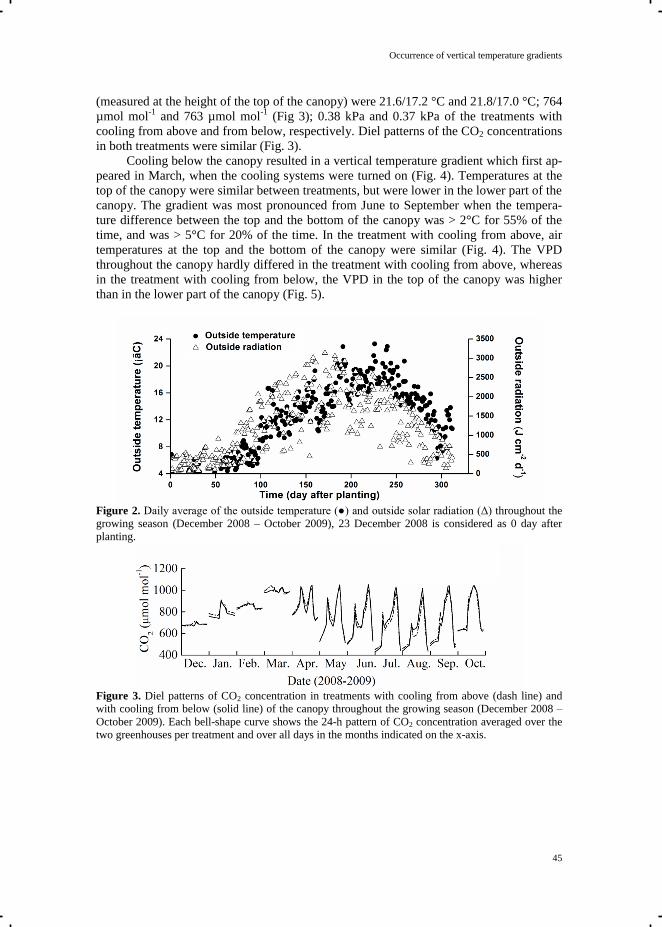
Occurrence of vertical temperature gradients
45
(measured at the height of the top of the canopy) were 21.6/17.2 °C and 21.8/17.0 °C; 764
µmol mol-1
and 763 µmol mol-1
(Fig 3); 0.38 kPa and 0.37 kPa of the treatments with
cooling from above and from below, respectively. Diel patterns of the CO2 concentrations
in both treatments were similar (Fig. 3).
Cooling below the canopy resulted in a vertical temperature gradient which first ap-
peared in March, when the cooling systems were turned on (Fig. 4). Temperatures at the
top of the canopy were similar between treatments, but were lower in the lower part of the
canopy. The gradient was most pronounced from June to September when the tempera-
ture difference between the top and the bottom of the canopy was > 2°C for 55% of the
time, and was > 5°C for 20% of the time. In the treatment with cooling from above, air
temperatures at the top and the bottom of the canopy were similar (Fig. 4). The VPD
throughout the canopy hardly differed in the treatment with cooling from above, whereas
in the treatment with cooling from below, the VPD in the top of the canopy was higher
than in the lower part of the canopy (Fig. 5).
Figure 2. Daily average of the outside temperature (●) and outside solar radiation (Δ) throughout the
growing season (December 2008 – October 2009), 23 December 2008 is considered as 0 day after
planting.
Figure 3. Diel patterns of CO2 concentration in treatments with cooling from above (dash line) and
with cooling from below (solid line) of the canopy throughout the growing season (December 2008 –
October 2009). Each bell-shape curve shows the 24-h pattern of CO2 concentration averaged over the
two greenhouses per treatment and over all days in the months indicated on the x-axis.
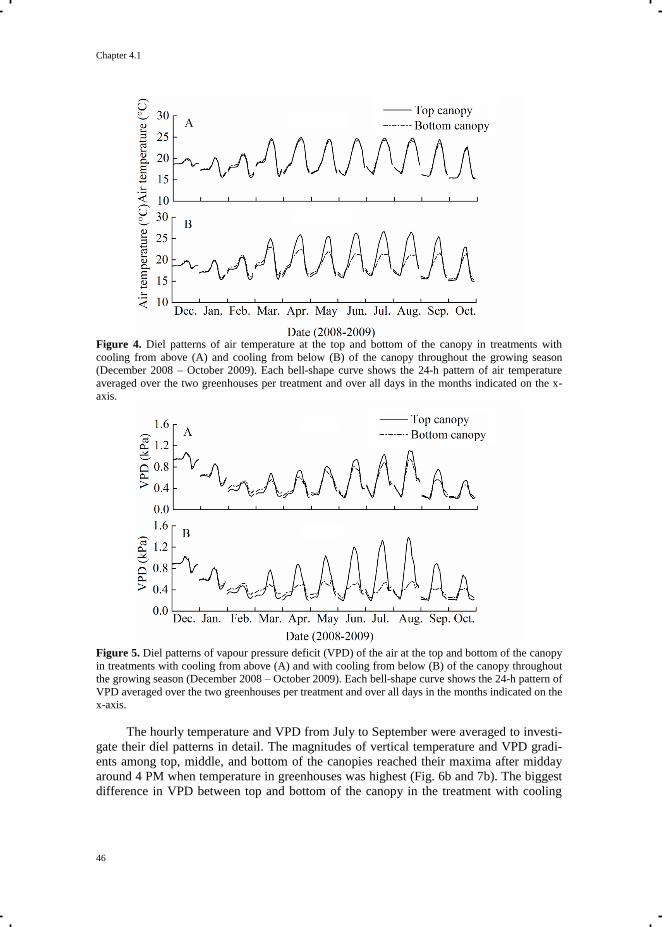
Chapter 4.1
46
Figure 4. Diel patterns of air temperature at the top and bottom of the canopy in treatments with
cooling from above (A) and cooling from below (B) of the canopy throughout the growing season
(December 2008 – October 2009). Each bell-shape curve shows the 24-h pattern of air temperature
averaged over the two greenhouses per treatment and over all days in the months indicated on the x-
axis.
Figure 5. Diel patterns of vapour pressure deficit (VPD) of the air at the top and bottom of the canopy
in treatments with cooling from above (A) and with cooling from below (B) of the canopy throughout
the growing season (December 2008 – October 2009). Each bell-shape curve shows the 24-h pattern of
VPD averaged over the two greenhouses per treatment and over all days in the months indicated on the
x-axis.
The hourly temperature and VPD from July to September were averaged to investi-
gate their diel patterns in detail. The magnitudes of vertical temperature and VPD gradi-
ents among top, middle, and bottom of the canopies reached their maxima after midday
around 4 PM when temperature in greenhouses was highest (Fig. 6b and 7b). The biggest
difference in VPD between top and bottom of the canopy in the treatment with cooling
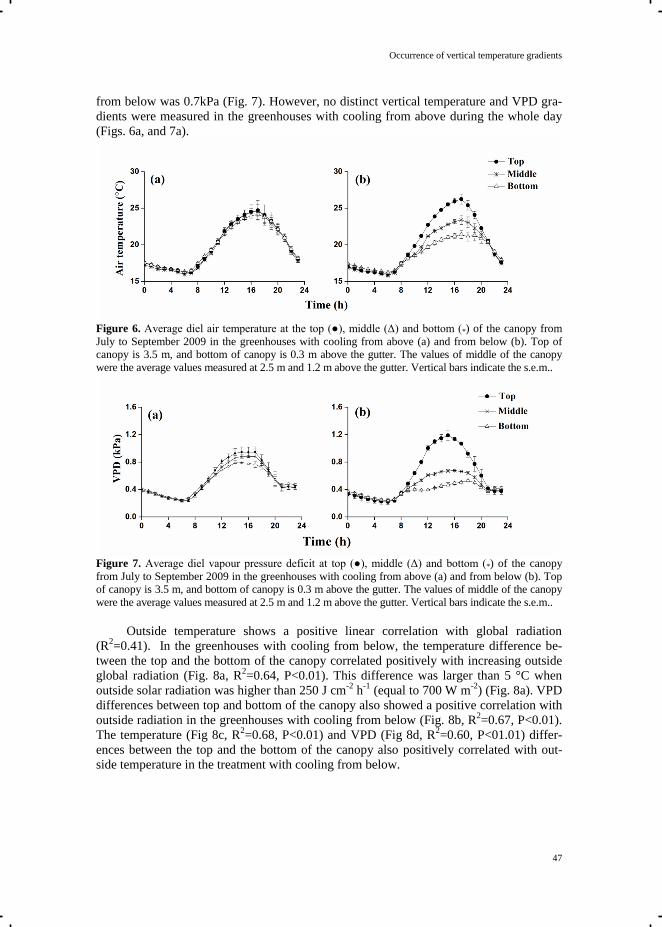
Occurrence of vertical temperature gradients
47
from below was 0.7kPa (Fig. 7). However, no distinct vertical temperature and VPD gra-
dients were measured in the greenhouses with cooling from above during the whole day
(Figs. 6a, and 7a).
Figure 6. Average diel air temperature at the top (●), middle (Δ) and bottom (*) of the canopy from
July to September 2009 in the greenhouses with cooling from above (a) and from below (b). Top of
canopy is 3.5 m, and bottom of canopy is 0.3 m above the gutter. The values of middle of the canopy
were the average values measured at 2.5 m and 1.2 m above the gutter. Vertical bars indicate the s.e.m..
Figure 7. Average diel vapour pressure deficit at top (●), middle (Δ) and bottom (*) of the canopy
from July to September 2009 in the greenhouses with cooling from above (a) and from below (b). Top
of canopy is 3.5 m, and bottom of canopy is 0.3 m above the gutter. The values of middle of the canopy
were the average values measured at 2.5 m and 1.2 m above the gutter. Vertical bars indicate the s.e.m..
Outside temperature shows a positive linear correlation with global radiation
(R2=0.41). In the greenhouses with cooling from below, the temperature difference be-
tween the top and the bottom of the canopy correlated positively with increasing outside
global radiation (Fig. 8a, R2=0.64, P<0.01). This difference was larger than 5 °C when
outside solar radiation was higher than 250 J cm-2
h-1
(equal to 700 W m-2
) (Fig. 8a). VPD
differences between top and bottom of the canopy also showed a positive correlation with
outside radiation in the greenhouses with cooling from below (Fig. 8b, R2=0.67, P<0.01).
The temperature (Fig 8c, R2=0.68, P<0.01) and VPD (Fig 8d, R
2=0.60, P<01.01) differ-
ences between the top and the bottom of the canopy also positively correlated with out-
side temperature in the treatment with cooling from below.
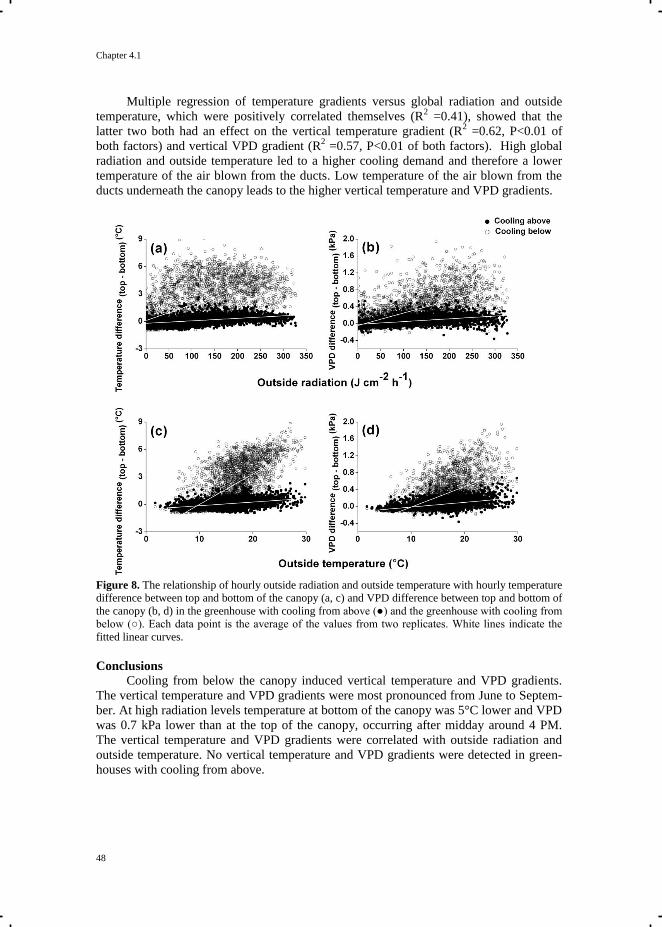
Chapter 4.1
48
Multiple regression of temperature gradients versus global radiation and outside
temperature, which were positively correlated themselves (R2 =0.41), showed that the
latter two both had an effect on the vertical temperature gradient (R2 =0.62, P<0.01 of
both factors) and vertical VPD gradient (R2 =0.57, P<0.01 of both factors). High global
radiation and outside temperature led to a higher cooling demand and therefore a lower
temperature of the air blown from the ducts. Low temperature of the air blown from the
ducts underneath the canopy leads to the higher vertical temperature and VPD gradients.
Figure 8. The relationship of hourly outside radiation and outside temperature with hourly temperature
difference between top and bottom of the canopy (a, c) and VPD difference between top and bottom of
the canopy (b, d) in the greenhouse with cooling from above (●) and the greenhouse with cooling from
below (○). Each data point is the average of the values from two replicates. White lines indicate the
fitted linear curves.
Conclusions
Cooling from below the canopy induced vertical temperature and VPD gradients.
The vertical temperature and VPD gradients were most pronounced from June to Septem-
ber. At high radiation levels temperature at bottom of the canopy was 5°C lower and VPD
was 0.7 kPa lower than at the top of the canopy, occurring after midday around 4 PM.
The vertical temperature and VPD gradients were correlated with outside radiation and
outside temperature. No vertical temperature and VPD gradients were detected in green-
houses with cooling from above.
Occurrence of vertical temperature gradients
49
References De Gelder, A., Dieleman, J.A., Bot, G.P.A., Marcelis, L.F.M., 2012. An overview of cli-
mate and crop yield in closed greenhouses. Journal of Horticultural Science & Bio-
technology. 87: 193-202.
Suay, R., Lopez, S., Granell, R., Molto, E., Fatnassi, H., Boulard, T., 2008. Preliminary
analysis of greenhouse microclimate heterogeneity for different weather conditions.
Acta Horticulturae. 797: 103-110.
Wells, C.M., Amos, N.D., 1994. Design of air distribution system for closed greenhouses.
Acta Horticulturae. 361: 93-104.

Chapter 4
Crop growth and development in response to vertical temperature
gradients
Chapter 4.2 Effects of vertical temperature gradients on crop growth
and development
Adapted from the publication:
Qian, T., Dieleman, J. A., Elings, A., De Gelder, A., Marcelis, L. F. M., 2015. Response of
tomato crop growth and development to a vertical temperature gradient in a semi-closed
greenhouse. Journal of Horticultural Science and Biotechnology. 90 (5): 578–584.
Chapter 4.2
52
Abstract
Semi-closed greenhouses have been developed over the last decade to conserve energy.
Energy consumption is reduced by collecting the excess solar energy in summer, storing it in
aquifers and reusing it in winter to heat the greenhouse. Cooling systems placed in the lower
part of the greenhouse, can cause vertical temperature gradients, which can be more than 5°C
at high levels of solar radiation. Given the substantial effect that air temperature has on a
number of plant physiological processes, we expected to observe effects on plant growth and
fruit production. Tomato plants were grown in semi-closed greenhouses with or without a
vertical temperature gradient. Despite these large vertical temperature gradients, plant growth
and fruit yields were mostly unaffected. Leaf and truss initiation rates did not differ between
treatments, since air temperatures at the top of the canopy were comparable. The only
observed response of plants to the vertical temperature gradient was the reduced rate of fruit
development in the lower part of the canopy. This resulted in a longer time between anthesis
and fruit harvest in the treatment with a vertical temperature gradient, and an increase in the
average fruit weight in summer. However, total fruit production over the whole season was
not affected. These results are important when designing greenhouses, as well as heating and
cooling systems for greenhouses.
Effects of vertical temperature gradients on the crop
53
Introduction
Air temperatures can be spatially and temporally heterogeneous in nature, in a forest
(Leuzinger and Körner 2007), an orchard or in the open field (Baldocchi et al., 1983). This
heterogeneity is caused by features of the canopy architecture such as plant height, plant
density, and leaf orientation (Grace 1977) and by environmental conditions such as solar
radiation, wind, and rainfall (Parker 1995). Spatial and temporal variations in air temperature
also exist in a protected environment such as a greenhouse (Bojaca et al. 2009; Kempkes et al.
2000). This spatial variation in temperature in a greenhouse can be caused by operational
actions such as window or screen opening (Soni et al. 2005), heating or cooling (Kempkes et
al., 2000). Canopy architecture, in combination with leaf traits, was shown to affect leaf
temperature (Leuzinger and Körner 2007). Savvides et al. (2013) showed that at a constant air
temperature, the difference between the apex temperature and the air temperature in tomato
plants varied from -3°C to +4°C, depending on air temperature, vapour pressure deficit,
radiation, and wind speed, thereby affecting the rate of plant development.
Semi-closed greenhouses have been developed over the last decade to conserve energy.
In such greenhouses, energy consumption is reduced by collecting the excess solar energy in
summer, storing it in aquifers and reusing it in winter to heat the greenhouse (De Gelder et al.
2012; Opdam et al. 2005; Vadiee and Martin 2012). In this system, active cooling minimizes
window ventilation, thereby enabling more favourable conditions for plant growth (e.g. a high
light intensity with a high CO2 concentration and moderate temperatures) which have been
shown to have a positive effect on production levels (De Gelder et al., 2012; Dannehl et al.
2012; 2013; Chapter 3). Cooled and dehumidified air is returned to the greenhouse through
cooling ducts, which are commonly placed beneath the growing gutters (De Gelder et al.
2012). This system results in a vertical temperature gradient (VTG) that can be considerably
greater than in a conventional greenhouse with window ventilation. The occurrence and
magnitude of the VTG depends on the incident radiation (Suay et al. 2008), the cooling
capacity of the installation, and the temperature of the air being blown into the greenhouse
(Chapter 2 and Chapter 4.1).
Air temperature influences a wide range of plant growth and developmental processes.
Together with the level of solar radiation and CO2, air temperature is therefore one of the
major factors affecting crop characters such as the balance between generative and vegetative
growth, the rate of crop development, and, ultimately, crop yield. Thus, it can be expected that
a VTG would have a noticeable effect on a number of plant physiological processes and,
ultimately, on crop yield.
The influence of temperature on the growth and development of tomato plants has been
studied extensively (reviewed by Van der Ploeg and Heuvelink 2005). The effect of
temperature on the rate of leaf photosynthesis depends, among other things, on the intensity of
the light (Chapter 5; Cannell and Thornley 1998; Yamori et al. 2010). At low light levels the
effect of temperature on the rate of photosynthesis is relatively small. Light intensity is
relatively low at the bottom of the canopy. So, if the temperature of the lower leaves changes
due to a VTG in a closed greenhouse, the effect of this gradient on photosynthesis might be
limited.
Maintenance respiration rate decreases with temperature (Amthor 1989). Consequently,
a vertical temperature gradient with a lower air temperature at the bottom of the canopy may
lead to greater availability of assimilates for crop growth (i.e., source strength), when the rate
of photosynthesis is largely unaffected and the rate of maintenance respiration is low.
However, the rate of maintenance respiration also depends on organ weight (Amthor 1989;
Penning de Vries 1975). If, due to a longer duration of fruit maturation the total crop dry
Chapter 4.2
54
weight (DW) at a specific time-point was higher, the rate of maintenance respiration would
also be increased. The consequences for the final availability of assimilates are therefore
difficult to estimate.
Rates of leaf and truss initiation increase linearly with increasing air temperature
(Adams et al. 2001; De Koning 1994). The rate of truss initiation is approx. one truss per
week at an average daytime temperature of 20°C (De Koning 1994). Cooling from above
could result in lower air temperatures at the top of the canopy, and therefore in a lower rate of
truss initiation.
The rate of fruit maturation is also determined by air temperature. A certain number of
day-degrees (temperature sum) have to be accumulated to reach physiological maturity (De
Koning 1994). In a semi-closed greenhouse with a VTG, the fruits in the lower part of the
canopy experience lower temperatures, which would be expected to affect the duration of fruit
growth and the average fruit fresh weight (Adams et al. 2001; De Koning 1994; Fanwoua et
al. 2012). Consequently, a lower air temperature would result in delayed (as expressed in the
number of days required) fruit ripening. Thus, temperature effects on truss initiation and the
rate of fruit maturation must interact in their effect on fruit load, for example. Lowered
temperatures may result in fewer new trusses formed per unit of time, but also in a delayed
fruit ripening. The result of this interaction on the number of trusses per plant is difficult to
predict.
In Chapter 4.1, it has been showed that, in semi-closed greenhouses with cooling ducts
below the canopy, air temperatures in the lower part of the canopy could be > 5°C lower than
in the top of the canopy. They also provided some overall values for plant and fruit growth.
This work aimed to study the effects of a vertical temperature gradient on the plant
physiological processes that determine growth and fruit production (e.g. the rates of truss
initiation and fruit development, dry matter (DM) production and partitioning).
Materials and methods
Experimental design
The experiment was conducted in four adjacent, semi-closed greenhouses (144 m2 each)
with a maximum cooling capacity of 350 W m-2
at Bleiswijk, The Netherlands (see Chapter
4.1). Two treatments were applied, with or without a vertical temperature gradient, each
replicated twice using two greenhouse compartments. In the treatment with a vertical
temperature gradient (+VTG), mechanically cooled air was blown into these greenhouses
through cooling ducts placed horizontally beneath the growing gutters. Each duct had six
holes (16 mm in diameter) m-1
. In the treatment without a vertical temperature gradient (-
VTG), cooling was applied above the canopy in two greenhouses. Mechanically cooled air
was blown into the top of these greenhouses through five blowers (three blowers at the eastern
end and two blowers at the western end of each greenhouse). Since cold air has a higher
density, this mixed with the lower layers of warmer air, resulting in no VTG (Fig. 1 of
Chapter 4.1).
The air temperature set points at the top of the canopy were similar between both
treatments. The greenhouse climate was controlled based on measurements of air temperature,
relative humidity (RH) and CO2 concentration, which were recorded automatically at 5 min
time intervals, using one climate sensor (Hoogendoorn, Vlaardingen, The Netherlands) per
greenhouse, placed at the top of the canopy. Pure CO2 was supplied at a maximum rate of 23 g
m-2
h-1
between sunrise and sunset with a set point of 1,000 μmol mol-1
in each greenhouse.
Tomato (Solanum lycopersicum ‘Cappricia’) plants, scions grafted on Emperador
rootstock, were planted on Rockwool slabs on 23 December 2008, at a plant of 2.5 plants m-2
Effects of vertical temperature gradients on the crop
55
(n=300 per greenhouse). Initially only one stem was maintained per plant. An additional side
shoot was maintained on one-third of the plants (n=100) 8 weeks after planting, increasing the
stem density to 3.33 stems m-2
. Starting 8 weeks after planting, the lowest two-to-three leaves
per stem were removed each week and the shoots were lowered to keep the tops of the plants
at a constant height (3.5 m above the gutter). Fruit numbers per truss were manually restricted
to six fruits per truss.
The ±VTG treatments started on 23 March 2009 (13 weeks after planting) when the two
cooling systems were turned on. Pests and diseases were controlled biologically, as much as
possible, and their incidences were very low. Plants were topped 40 weeks after planting. The
last fruit harvest occurred 7 weeks after topping (20 November 2009).
Crop measurements
Eight plants in each greenhouse compartment were marked to record their truss number
each week throughout the growing season. Plant biomass was measured by harvesting plants
destructively at planting and 9, 19, 28, 40, and 46 weeks after planting. The fresh weights
(FW) and dry weights (DW; oven dried at 80°C for > 48 h) of leaves, stems, and fruits were
measured, as well as the leaf area per plant (LI-3100C Area Meter, LI-COR, Lincoln, NE,
USA). FWs and DWs of the picked leaves and harvested fruits were recorded and added to
the cumulative FW and DW values. The leaf area index (LAI; m2 m
-2) was calculated from
the leaf area per plant and the plant density. The specific leaf area (SLA; cm2 g
-1) was
calculated as the leaf area per unit leaf DW. To select plants for destructive measurements,
each compartment was considered to be three blocks, evenly divided from North-to-South.
Two plants were selected at random from each block. In total, six plants (four with a single
main stem and two with a side shoot) were selected from each greenhouse compartment at
each harvest. Plants with a side shoot were always selected from two different blocks. Weekly
fruit harvests started 15 weeks after planting. Total fruit FW and the total number of harvested
fruits, from one pre-selected double row were measured in each greenhouse to determine
yields (kg m-2
). Average fruit FW were calculated by dividing the total FW of the harvested
fruits by the total number of harvested fruits. Fruit dry matter contents (DMC) were measured
19, 24, 28, 34, 37, and 43 weeks after planting. Five trusses were at random selected from the
harvested trusses in each greenhouse, and the FW and DW (oven-dried at 80°C for > 48 h) of
the fruits were measured to determine DMC (%).
Measurements of fruit growth and development
Twenty-one weeks after planting, six Smartdust sensors (Wisensys, Emmen, The
Netherlands) were attached to six randomly-selected trusses on which the second flower was
just reaching anthesis, in one greenhouse of each treatment. Air temperature and relative
humidity around the selected trusses were recorded automatically from 21 - 30 weeks after
planting, when the trusses were harvested. The dates on which the second fruit on the selected
truss reached colour stage ‘4’ were recorded as ‘breaker stage’, and the duration of growth
between anthesis and the breaker stage was determined. Colour stage was defined using a
standard tomato colour chart (The Greenery, Breda, The Netherlands). Temperature sum
(expressed in day-degrees; d°C) was calculated using a base temperature of 4°C (as was
previously used by e.g. De Koning 1994). This procedure was repeated twice, from 30 - 38
weeks after planting, and from 33 - 42 weeks after planting.
Chapter 4.2
56
Statistical analysis
Data on fruit yield, DMC, truss number, production and partitioning of DM, LAI, and
SLA were analysed using a linear mixed model (Potvin et al. 1990). The variance components
were estimated using Restricted Maximum Likelihood (REML) in Genstat (14th
Edition; VSN
International, Hemel Hempstead, UK). Each linear mixed model consisted of two parts: a
fixed model and a random model. The fixed model consisted of the main factors: cooling
position (above and below) and time (weeks after planting). The random model accounted for
the fact that plant samples from the same greenhouse were linked. Individual data (not
averaged) on truss numbers and fruit yields were fitted as a linear function of time.
The slopes and intercepts of the fitted curves of the two treatments were analysed using
a Student’s t-test (P ≤ 0.05). Individual data (not averaged) on DM production, DM
partitioning, LAI, and SLA were fitted to non-linear curves as a function of time. The
parameters of the curves of the two treatments were analysed using Student’s t-test (P ≤ 0.05).
Pairwise comparisons of means were analysed using Student’s t-test (P ≤ 0.05),
comparing the duration of fruit growth and the cumulative degree-days (temperature sum) of
fruits reaching the breaker stage in both greenhouses.
Results
Greenhouse climate
Diurnal and seasonal patterns of the climate in the treatments with cooling from above
and below are described in Chapter 4.1.
Truss initiation, leaf initiation and leaf growth
Rates of truss initiation did not differ significantly between the two treatments, as is
shown by the non-significant difference in the slopes of truss number as a function of time
(Fig. 1A; P = 0.99). Given a fixed ratio of 1:3 between numbers of trusses and leaves once the
first truss has appeared, the number of leaves per plant did not differ significantly either
between the two treatments (Fig. 1B; P = 0.78). LAI increased in the beginning of the
growing season up to almost 4 m2 m
-2 19 weeks after planting (end of April 2009; Fig. 1C).
Thereafter, the LAI decreased due to leaf picking and did not differ significantly between
treatments (P = 0.68; Fig. 1C). The SLA showed a seasonal pattern with a higher value in
early spring than in summer (Fig. 1D), but did not differ significantly between treatments (P =
0.22).
Dry matter production and partitioning
Dry matter production did not differ significantly between the two treatments (P = 0.16;
Fig. 1E). The fraction of dry matter partitioned to the fruits reached a maximum value of 72%,
but did not differ significantly between the two treatments (Fig. 1F).
Fruit growth and development
The temperature sum required from anthesis to breaker stage did not differ significantly
between the two treatments (Table 1). The duration of fruit growth from anthesis to breaker
stage lasted on average 1.3 days longer in the treatment +VTG compared to the treatment -
VTG (Table 1).
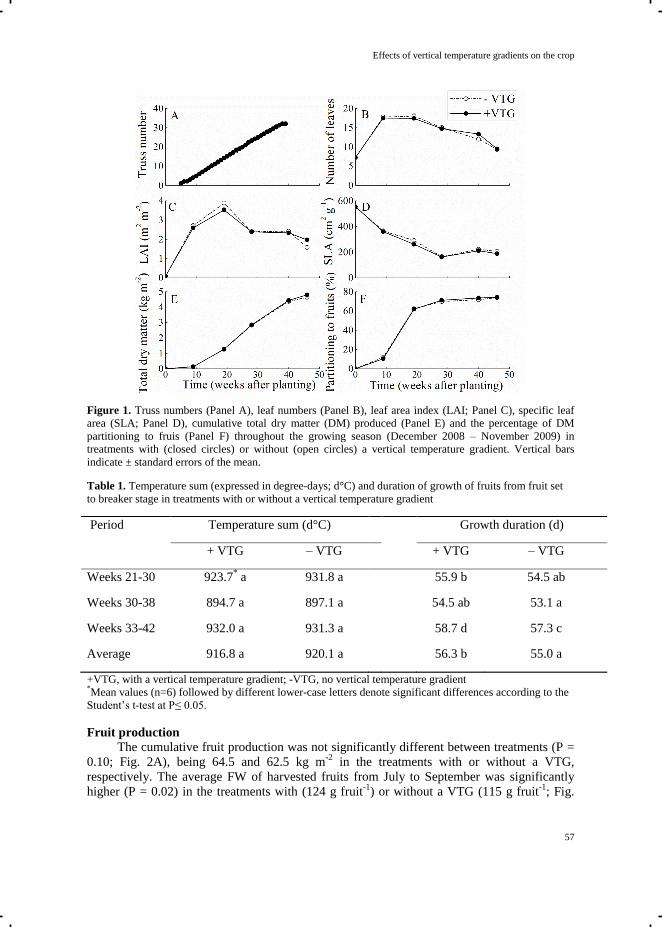
Effects of vertical temperature gradients on the crop
57
Figure 1. Truss numbers (Panel A), leaf numbers (Panel B), leaf area index (LAI; Panel C), specific leaf
area (SLA; Panel D), cumulative total dry matter (DM) produced (Panel E) and the percentage of DM
partitioning to fruis (Panel F) throughout the growing season (December 2008 – November 2009) in
treatments with (closed circles) or without (open circles) a vertical temperature gradient. Vertical bars
indicate ± standard errors of the mean.
Table 1. Temperature sum (expressed in degree-days; d°C) and duration of growth of fruits from fruit set
to breaker stage in treatments with or without a vertical temperature gradient
Period Temperature sum (d°C) Growth duration (d)
+ VTG – VTG + VTG – VTG
Weeks 21-30
Weeks 30-38
Weeks 33-42
923.7* a
894.7 a
932.0 a
931.8 a
897.1 a
931.3 a
55.9 b
54.5 ab
58.7 d
54.5 ab
53.1 a
57.3 c
Average 916.8 a 920.1 a 56.3 b 55.0 a
+VTG, with a vertical temperature gradient; -VTG, no vertical temperature gradient *Mean values (n=6) followed by different lower-case letters denote significant differences according to the
Student’s t-test at P≤ 0.05.
Fruit production
The cumulative fruit production was not significantly different between treatments (P =
0.10; Fig. 2A), being 64.5 and 62.5 kg m-2
in the treatments with or without a VTG,
respectively. The average FW of harvested fruits from July to September was significantly
higher (P = 0.02) in the treatments with (124 g fruit-1
) or without a VTG (115 g fruit-1
; Fig.
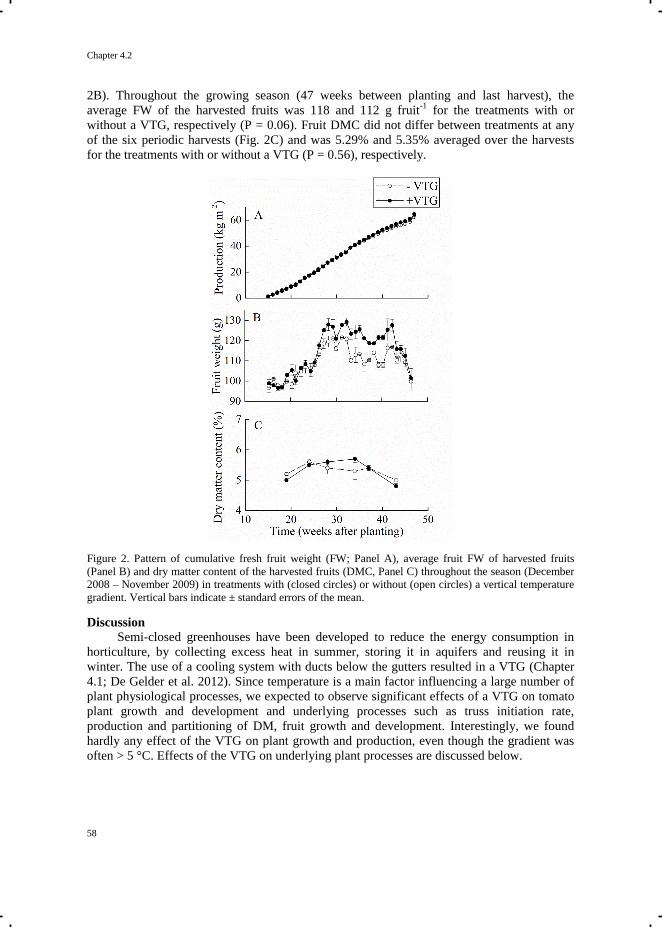
Chapter 4.2
58
2B). Throughout the growing season (47 weeks between planting and last harvest), the
average FW of the harvested fruits was 118 and 112 g fruit-1
for the treatments with or
without a VTG, respectively (P = 0.06). Fruit DMC did not differ between treatments at any
of the six periodic harvests (Fig. 2C) and was 5.29% and 5.35% averaged over the harvests
for the treatments with or without a VTG (P = 0.56), respectively.
Figure 2. Pattern of cumulative fresh fruit weight (FW; Panel A), average fruit FW of harvested fruits
(Panel B) and dry matter content of the harvested fruits (DMC, Panel C) throughout the season (December
2008 – November 2009) in treatments with (closed circles) or without (open circles) a vertical temperature
gradient. Vertical bars indicate ± standard errors of the mean.
Discussion
Semi-closed greenhouses have been developed to reduce the energy consumption in
horticulture, by collecting excess heat in summer, storing it in aquifers and reusing it in
winter. The use of a cooling system with ducts below the gutters resulted in a VTG (Chapter
4.1; De Gelder et al. 2012). Since temperature is a main factor influencing a large number of
plant physiological processes, we expected to observe significant effects of a VTG on tomato
plant growth and development and underlying processes such as truss initiation rate,
production and partitioning of DM, fruit growth and development. Interestingly, we found
hardly any effect of the VTG on plant growth and production, even though the gradient was
often > 5 °C. Effects of the VTG on underlying plant processes are discussed below.
Effects of vertical temperature gradients on the crop
59
Truss initiation
In general, rates of leaf and truss initiation increase with air temperature (Adams et al.,
2001). In our experiments, the greenhouse climate was controlled based on online air
temperature measurements at the top of the canopy which were kept similar between
treatments (Fig. 1). Therefore, processes occurring in the top of the canopy, i.e. leaf and truss
initiation were unaffected.
Dry matter production
Total plant DM production depends on the amount of light intercepted by the canopy
and its light use efficiency. Light interception is determined by LAI and the light extinction
coefficient k, which was assumed constant. In our experiment, LAI was not significantly
different between treatments. Therefore, light interception by the canopy could be assumed to
be similar in both treatments. In addition, the light intensity, CO2 concentration and
temperature at the top of the canopy did not differ between treatments in our experiment, most
likely resulting in similar rates of leaf photosynthesis at the top of the canopy. At the middle
and lower parts of the canopy, the leaves in treatment +VTG experienced lower temperatures.
However, leaf photosynthesis is hardly sensitive to temperature at low light intensities
(Chapter 5; Yamori et al. 2010). The rate of photosynthesis in the lower canopy was therefore
hardly influenced by temperature due to the low light conditions. In conclusion, the effect of a
VTG on net production of assimilates was negligible, and did not significantly affect the total
DM production.
Dry matter partitioning
DM partitioning to the fruit depends on fruit sink strength and the total number of fruits.
Sink strength of the fruit is defined as the competitive ability of the fruit to attract assimilates
(Marcelis 1996), and the potential fruit growth rate is a measure of sink strength of the fruit.
Temperature does not influence the potential fruit growth rate of tomato (De Koning 1994;
Heuvelink and Marcelis 1989). In our experiment, the lower canopy experienced lower
temperatures in the treatment with a VTG. However, all plant organs (leaf, stem and fruit) at
the lower part of the plant experienced the same lower temperature, and therefore, dry matter
partitioning among organs was not influenced. The total number of fruits resulted from the
truss initiation rate, truss number and number of fruits per truss. No differences in truss
initiation rates were found between treatments, resulting in identical numbers of trusses per
plant. Fruit number per truss was manually controlled at 6 fruits in both treatments. In
conclusion, the fact that there were no differences in total sink strength of the fruits and in
total fruit number explained the absence of treatment effect on DM partitioning to the fruit.
Fruit growth and development
Temperature affects rates of fruit growth (Adams et al. 2001) and development (De
Koning 2000). The temperature sensitivity of these rates depends on the stage of fruit
development. During the first week after anthesis, higher temperatures increase the rate of
fruit development, and therefore shorten the time to maturity (De Koning 1994; Fanwoua et
al. 2012). This phase is followed by a period during which temperature hardly affects fruit
growth and development (Adams et al. 2001; De Koning 1994). In the last 1 to 2 weeks
before harvest, a lower temperature reduces the rate of fruit development and therefore
increases the fruit growth duration and fruit FW (Adams et al. 2001; De Koning 1994). In our
experiment, the number of degree-days for fruit development was identical, but the duration
(number of days) of fruit growth from anthesis to breaker stage was longer in the treatment
Chapter 4.2
60
with a VTG than without a VTG due to lower temperatures at the final stage of fruit
development. This resulted in fruits with a significant higher FW during the summer months
in which the VTG was largest (Figure 5B).
Application
In our experiment, in which tomatoes were grown in semi-closed greenhouses with
cooling ducts below the gutter, the plants experienced a VTG of > 5°C during the day in
summer, which is in agreement with results in other (semi-)closed greenhouses (Hoes et al.
2008) and in other high-wire grown crops such as cucumber and sweet pepper (De Gelder et
al. 2012). Gieling et al. (2011) pointed out that a VTG requires special attention, since the
response of a crop to such a microclimate was unknown. Our results show that the rate of
truss initiation, production and partitioning of DM, and yield were not different in the
treatments with or without a VTG, when the temperatures at the top of the canopy were the
same. Higher yields were found when crops were grown in (semi-)closed greenhouses
compared to conventionally ventilated greenhouses (De Gelder et al. 2012; Hoes et al. 2008;
Dannehl et al. 2013), mainly due to increased concentrations of CO2 leading to higher rates of
photosynthesis (Chapter 2). Furthermore, fruit quality and health-promoting compounds were
increased by higher CO2 concentrations in semi-closed greenhouses (Dannehl et al. 2012;
Farneti et al. 2013), implying that semi-closed greenhouses can be beneficial to plant growth,
yield and product quality. Our results show that a VTG resulting from a cooling system in the
lower part of the greenhouse did not affect plant growth, development and production. These
results are important when designing greenhouses and their heating and cooling systems when
balancing light loss due to cooling systems in the top of the greenhouse with effects of
vertical temperature gradients.
Effects of vertical temperature gradients on the crop
61
References
Adams, S.R., Cockshull, K.E., Cave, C.R.J., 2001. Effect of temperature on the growth and
development of tomato fruits. Annals of Botany. 88: 869-877.
Amthor, J.S., 1989. Respiration and Crop Productivity. Springer-Verlag, New York, NY,
USA. 215pp.
Baldocchi, D.D., Verma, S.B., Rosenberg, N.J., 1983. Microclimate in the soybean canopy.
Agricultural Meteorology. 28: 321-337.
Bojaca, C.R., GIL, R., Cooman, A., 2009. Use of geostatistical and crop growth modelling to
assess the variability of greenhouse tomato yield caused by spatial temperature variations.
Computers and Electronics in Agriculture. 65: 219-227.
Cannell, M.G.R., Thornley, J.H.M., 1998. Temperature and CO2 responses of leaf and
canopy photosynthesis: a clarification using the non-rectangular hyperbola model of
photosynthesis. Annals of Botany. 14: 729-739.
Dannehl, D., Huber, C., Rocksch, T., Huyskens-Keil, S., Schmidt, U., 2012. Interactions
between changing climate conditions in a semi-closed greenhouse and plant development,
fruit yield, and health-promoting plant compounds of tomatoes. Scientia Horticulturae.
138: 235-243.
Dannehl, D., Schuch, I., S Schmidt, U., 2013. Plant production in solar collector greenhouses
– Influence on yield, energy use efficiency and reduction in CO2 emissions. Journal of
Agricultural Science. 5: 34-45.
De Gelder, A., Dieleman, J.A., Bot, G.P.A., Marcelis, L.F.M., 2012. An overview of climate
and crop yield in closed greenhouses. Journal of Horticultural Science & Biotechnology.
87: 193-202.
De Koning, A.N.M., 1994. Development and Dry Matter Distribution in Glasshouse Tomato:
A Quantitative Approach. Ph.D. Thesis, Wageningen Agricultural University,
Wageningen, The Netherlands. 240pp.
De Koning, A.N.M., 2000. The effect of temperature, fruit load and salinity on development
rate of tomato fruit. Acta Horticulturae. 519: 85-93.
Fanwoua, J., de Visser, P., Heuvelink, E., Angenent, G., Yin, X., Marcelis, L.F.M., Struik, P.,
2012. Response of cell division and cell expansion to local fruit heating in tomato fruit.
Journal of The American Society for Horticultural Science. 137: 294-301.
Farneti, B., Schouten, R.E., Qian, T., Dieleman, J.A., Tijskens, L.M.M., Woltering, E.J.,
2013. Greenhouse climate control affects postharvest tomato quality. Postharvest Biology
and Technology. 86: 354-361.
Farquhar, G.D., Wong, S.C., 1984. An empirical model of stomatal conductance. Functional
Plant Biology. 11: 191-210.
Grace, J., 1977. Plant Response to Wind. Academic Press, New York, NY, USA, 204 pp.
Gieling, T.H., Campen, J.B., Dieleman, J.A., Garcia, N., Janssen, H.J.J., 2011. Monitoring of
climate variables in semi-closed greenhouses. Acta Horticulturae. 893: 1073-1080.
Heuvelink, E., Marcelis, L.F.M., 1989. Dry natter distribution in tomato and cucumber. Acta
Horticulturae. 260: 149-157.
Hoes, H., Desmedt, J., Goen, K., Wittemans, L., 2008. The GESKAS project, closed
greenhouse as energy source and optimal growing environment. Acta Horticulturae. 801:
1355- 1362.
Kempkes, F.L.K., de Braak, N.J., and Bakker, J.C., 2000. Effect of heating system position on
vertical distribution of crop temperature and transpiration in greenhouse tomatoes.
Journal of Agricultural Engineering Research. 75: 57-64.
Chapter 4.2
62
Leuzinger, S., Körner, C., 2007. Tree species diversity affects canopy leaf temperatures in a
mature temperate forest. Agricultural and Forest Meteorology. 146: 29-37.
Marcelis, L.F.M., 1996. Sink strength as a determinant of dry matter partitioning in the whole
plant. Journal of Experimental Botany. 47: 1281-1291.
Opdam, J.J.G., Schoonderbeek, G.G., Heller, E.B.M., de Gelder, A., 2005. Closed
greenhouse: A starting point for sustainable entrepreneurship in horticulture. Acta
Horticulturae. 691: 517-524.
Parker, G.G., 1995. Structure and microclimate of forest canopies. In: Forest Canopies.
(Lowman, M.D. and Nadkami, N.M., Eds.). Academic Press, San Diego, CA, USA, 73-
106.
Penning dE Vries, F.W.T. 1975. The costs of maintenance processes in plant cells. Annals of
Botany. 39: 77-92.
Potvin, C., Lechowicz, M.J., Tardif, S., 1990. The statistical analysis of ecophysiological
response curves obtained from experiments involving repeated measures. Ecology. 71:
138901400.
Savvides, A., van Ieperen, W., Dieleman, J.A., Marcelis, L.F.M., 2013. Meristem temperature
substantially deviates from air temperature even in moderate environments: is the
magnitude of this deviation species-specific? Plant, Cell and Environment. 36: 1950-
1960.
Soni, P., Salokhe, V.M., Tantau, H.J., 2005. Effect of screen mesh size on vertical
temperature distribution in naturally ventilated tropical greenhouses. Biosystems
Engineering. 92: 469-482.
Suay, R., Lopez, S., Granell, R., Molto, E., Fatnassi, H., Boulard, T. 2008. Preliminary
analysis of greenhouse microclimate heterogeneity for different weather conditions. Acta
Horticulturae. 797: 103-110.
Vadiee, A., Martin, V., 2012. Energy management in horticultural applications through the
closed greenhouse concept, state of the art. Renewable and Sustainable Energy Reviews.
16: 5087-5100.
Van der Ploeg, A., Heuvelink, E., 2005. Influence of sub-optimal temperature on tomato
growth and yield: a review. Journal of Horticultural Science & Biotechnology. 80: 652-
659.
Yamori, W., Evans, J.R., von Caemmerer, S., 2010. Effects of growth and measurement light
intensities on temperature dependence of CO2 assimilation rate in tobacco leaves. Plant
Cell and Environment. 33: 332-343.
Chapter 5
Quantification of photosynthesis under a wide range of climate conditions
Adapted from the publication:
Qian, T., Elings A., Dieleman, J. A., Gort, G., Marcelis, L. F. M., 2012. Estimation of
photosynthesis parameters for a modified Farquhar–von Caemmerer–Berry model using
simultaneous estimation method and nonlinear mixed effects model. Environmental and
Experimental Botany. 82: 66– 73.
Chapter 5
64
Abstract
The aims of this paper were to modify the photosynthesis model of Farquhar, von Caemmerer
and Berry (FvCB) to be able to predict light dependency of the carboxylation capacity (Vc)
and to improve the prediction of temperature dependency of the maximum carboxylation
capacity (Vcmax) and the maximum electron transport rate (Jmax). The FvCB model was
modified by adding a sub-model for Ribulose-1,5-bisphosphate carboxylase (Rubisco)
activation and validating the parameters for temperature dependency of Vcmax and Jmax. Values
of parameters for temperature dependency of Vcmax and Jmax were validated and adjusted based
on data of the photosynthesis response to temperature. Parameter estimation was based on
measurements under a wide range of environmental conditions, providing parameters with
broad validity. The simultaneous estimation method and the nonlinear mixed effects model
were applied to ensure the accuracy of the parameter estimation. The FvCB parameters, Vcmax,
Jmax, α (the efficiency of light energy conversion), θ (the curvature of light response of
electron transport), and Rd (the non-photorespiratory CO2 release) were estimated and
validated on a dataset from two other years. Observations and predictions matched well
(R2=0.94). We conclude that incorporating a sub-model of Rubisco activation improved the
FvCB model through predicting light dependency of carboxylation rate; and that estimating
Vcmax, Jmax, α, θ, and Rd requires data sets of both CO2 and light response curves.
Quantification of photosynthesis
65
Introduction
Many studies have established the relations between photosynthesis and light intensity
(Ogren and Evans, 1993; Heschel et al., 2004), CO2 concentration (Cannell and Thornley,
1998), and temperature (Cannell and Thornley, 1998; Yamori et al., 2010). Most studies deal
with photosynthesis response to only a few environmental factors. Integrated studies, where
effects of all these environmental factors and their interactions are quantified in a wide range,
are scarce.
The model of Farquhar, von Caemmerer and Berry (1980) (‘the FvCB model’ hereafter)
is the most commonly used over the past three decades to study the response of C3
photosynthesis to environment. The model predicts net photosynthesis rate (A) at any given
environmental condition. The CO2 dependency of photosynthesis rate is determined as the
minimum value of three distinct states, limited by Ribulose-1,5-bisphosphate carboxylase
(Rubisco) for carboxylation, ribulose-1,5-bisphosphate (RuBP) regeneration, or triose
phosphate utilization (TPU). The light dependency of photosynthesis rate is determined by the
light response of electron transport rate (J). The relation between J and light intensity was
first described as a rectangular hyperbola function (Farquhar and von Caemmerer, 1982) and
later modified to a non-rectangular hyperbola function (Farquhar and Wong, 1984; Von
Caemmerer, 2000). The temperature dependency of the FvCB parameters related to kinetic
properties of Rubisco is described based on the Arrhenius function (Farquhar et al., 1980;
Bernacchi et al., 2001; Medlyn et al., 2002a). The original functions to describe the
temperature dependency of Vcmax and Jmax, were modified in many studies (Dreyer et al., 2001;
Leuning, 2002; Medlyn et al., 2002b; Warren and Dreyer, 2006). The peaked function was
considered the best, since it predicts the Vcmax and Jmax at the super-optimal temperature with
the parameter deactivation energy (Hd) (Medlyn et al., 2002b). Parameter values for the
activation energy (Ha), deactivation energy (Hd), and the entropy factor (S) were estimated for
different species (Harley et al., 1992b; Bunce, 2000; Bernacchi et al., 2001; Dreyer et al.,
2001;).
The FvCB model assumes that Rubisco is always fully activated (Farquhar et al., 1980;
Von Caemmerer, 2000). The consequence of this assumption is that the carboxylation rate of
Rubisco (Vc) is independent of light intensity. In other words, Vc is assumed to be equal to
Vcmax. However, several studies (Taylor and Terry, 1984; Salvucci et al., 1986; Von
Caemmerer and Edmondson, 1986; Brooks et al., 1988;) have shown that the fraction of
Rubisco activation increases with light intensity. Using Vc as Vcmax derived under low light
condition to determine photosynthesis rate under high light condition might cause under-
estimation of photosynthesis rate. It is therefore necessary to extend the FvCB model with a
sub-model of light dependency of Vc, relating Vc to Rubisco activation.
The FvCB model is often simplified to two limitations, since the TPU limitation occurs
only occasionally in case of saturated photosynthesis rate or even decreased photosynthesis
rate with increased CO2 concentration (Long and Bernacchi, 2003; Sharkey et al., 2007). The
CO2 response curves are then fitted with two nonlinear functions either limited by Rubisco or
RuBP regeneration, taking the minimum value of the two. The methods used to fit the curves
to the data and estimate the parameters are not yet consistent in literature. One method is the
disjunct segments estimation method, separately fitting the functions of Rubisco-limited
photosynthesis and of RuBP-regeneration-limited photosynthesis (Manter and Kerrigan, 2004;
Onoda et al., 2005; Sharkey et al., 2007). In this method, gas exchange data are divided into
two subsets. Sub-setting is usually subjective, as it is not possible to unambiguously allocate
data points to both processes. Arbitrary division of the two subsets has a significant effect on
the estimation of the parameters (Miao et al., 2009). The second method is the simultaneous
estimation method (Dubois et al., 2007), which simultaneously estimates the parameters for
both functions using the entire gas exchange data set. This method avoids the need for
Chapter 5
66
preliminary division of the gas exchange data before analysis. However, the simultaneous
estimation method is not commonly applied to gas exchange data for the study of effects of
environmental factors on photosynthesis.
Typically, data sets of light and CO2 responses curves possess two characteristics. The
first characteristic is that the data set usually involves repeated measurements. Gas exchange
measurements are obtained on one leaf over a series of light intensities or CO2 concentrations.
Proper data analysis should take into account that observations obtained from the same
experimental unit (one leaf) are correlated, as otherwise the estimated error variance and
standard errors of parameter estimates may be wrong (Potvin et al., 1990; Peek et al., 2002).
The second characteristic is the increase in variation of the photosynthesis rate with increasing
light intensity or CO2 concentration (Peek et al., 2002; Lin et al., 2008). If the non-constant
variance is ignored, the standard deviation will be overestimated at low light intensity or CO2
concentration, and underestimated at high light intensity or CO2 concentration. To
accommodate for these two characteristics, Peek et al. (2002) proposed the use of nonlinear
mixed effects models in photosynthesis response curves. However, only a few studies applied
the nonlinear mixed-effects model to their data analysis to investigate treatment differences
(Peek et al., 2002; Heschel et al., 2004; McElrone and Forseth, 2004; Ozturk et al., 2011).
The aims of this paper were to modify the FvCB model to be able to predict light
dependency of Vc and to improve the prediction of temperature dependency of Vcmax and Jmax.
Parameter estimation was based on measurements under a wide range of environmental
conditions, providing parameters with broad validity. CO2 response curves were analysed by
the simultaneous estimation method rather than the traditional disjunctive segments
estimation method. A nonlinear mixed effects model was used to account for the fact that
photosynthesis response measurements involved repeated measurements on the same leaf.
The simultaneous estimation method and the nonlinear mixed effects model ensured the
accuracy of the parameter estimation.
Materials and methods
Plant cultivation
Tomato (Solanum lycopersicum, cultivar ‘Cappricia’) plants, grafted on the rootstock
Emperador, were planted on Rockwool®
on 23 December 2008 in an air conditioned
greenhouse. The greenhouse had a size of 144 m2 with a gutter height of 5.5 m, and was
located at Bleiswijk, the Netherlands. Initial stem density was 2.5 stem m-2
. Stem density was
increased to 3.3 stems m-2
eight weeks after planting. A standard horticultural computer
(Hoogendoorn-Economic) controlled the environment inside the greenhouse. Photosynthesis
measurements were conducted during July and August 2009. Daily average outside radiation
in July and August 2009 was 18.17 MJ m-2
d-1
. Realized day/night temperatures, CO2
concentration and relative humidity averaged over July and August 2009 in the greenhouse
were 22.3/17.6 °C, 759/486 µmol mol-1
, and 80/86 %, respectively. Water and nutrients were
adequately supplied.
Photosynthesis measurements
Leaf photosynthesis rate was measured with a portable photosynthesis device (LCpro+,
ADC, UK) at two leaf positions in the canopy, namely the uppermost fully unfolded leaf (top
leaf) and the leaf near the middle of the canopy (middle leaf). Light intensity, CO2
concentration, temperature, and humidity were controlled in the leaf chamber of the device.
Measurements were carried out between 9:00 and 15:00 to avoid photosynthesis afternoon
depression.
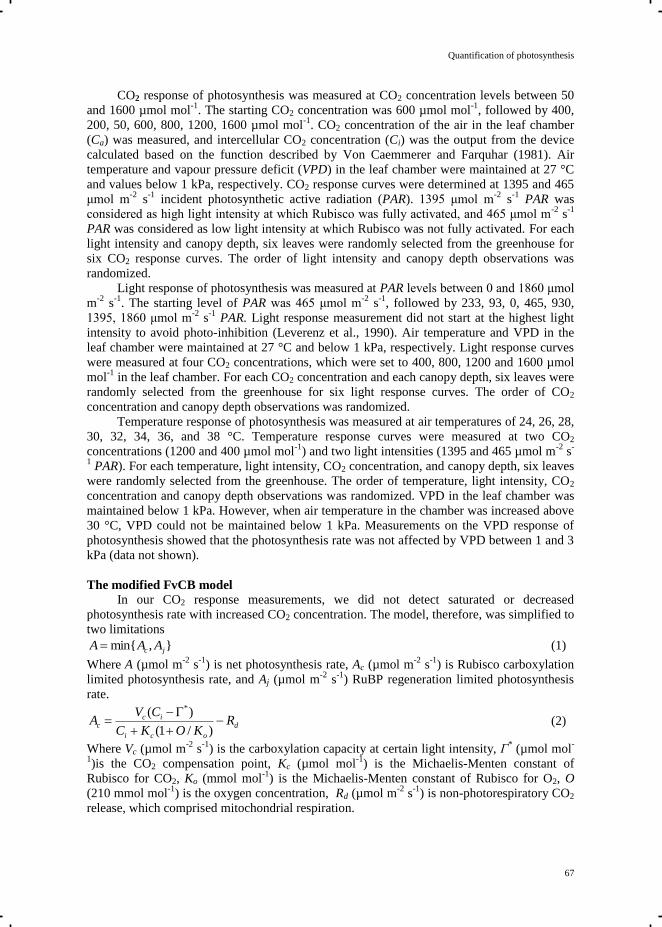
Quantification of photosynthesis
67
CO2 response of photosynthesis was measured at CO2 concentration levels between 50
and 1600 µmol mol-1
. The starting CO2 concentration was 600 µmol mol-1
, followed by 400,
200, 50, 600, 800, 1200, 1600 µmol mol-1
. CO2 concentration of the air in the leaf chamber
(Ca) was measured, and intercellular CO2 concentration (Ci) was the output from the device
calculated based on the function described by Von Caemmerer and Farquhar (1981). Air
temperature and vapour pressure deficit (VPD) in the leaf chamber were maintained at 27 °C
and values below 1 kPa, respectively. CO2 response curves were determined at 1395 and 465
μmol m-2
s-1
incident photosynthetic active radiation (PAR). 1395 μmol m-2
s-1
PAR was
considered as high light intensity at which Rubisco was fully activated, and 465 μmol m-2
s-1
PAR was considered as low light intensity at which Rubisco was not fully activated. For each
light intensity and canopy depth, six leaves were randomly selected from the greenhouse for
six CO2 response curves. The order of light intensity and canopy depth observations was
randomized.
Light response of photosynthesis was measured at PAR levels between 0 and 1860 μmol
m-2
s-1
. The starting level of PAR was 465 μmol m-2
s-1
, followed by 233, 93, 0, 465, 930,
1395, 1860 μmol m-2
s-1
PAR. Light response measurement did not start at the highest light
intensity to avoid photo-inhibition (Leverenz et al., 1990). Air temperature and VPD in the
leaf chamber were maintained at 27 °C and below 1 kPa, respectively. Light response curves
were measured at four CO2 concentrations, which were set to 400, 800, 1200 and 1600 µmol
mol-1
in the leaf chamber. For each CO2 concentration and each canopy depth, six leaves were
randomly selected from the greenhouse for six light response curves. The order of CO2
concentration and canopy depth observations was randomized.
Temperature response of photosynthesis was measured at air temperatures of 24, 26, 28,
30, 32, 34, 36, and 38 °C. Temperature response curves were measured at two CO2
concentrations (1200 and 400 µmol mol-1
) and two light intensities (1395 and 465 µmol m-2
s-
1 PAR). For each temperature, light intensity, CO2 concentration, and canopy depth, six leaves
were randomly selected from the greenhouse. The order of temperature, light intensity, CO2
concentration and canopy depth observations was randomized. VPD in the leaf chamber was
maintained below 1 kPa. However, when air temperature in the chamber was increased above
30 °C, VPD could not be maintained below 1 kPa. Measurements on the VPD response of
photosynthesis showed that the photosynthesis rate was not affected by VPD between 1 and 3
kPa (data not shown).
The modified FvCB model
In our CO2 response measurements, we did not detect saturated or decreased
photosynthesis rate with increased CO2 concentration. The model, therefore, was simplified to
two limitations
},min{ jc AAA (1)
Where A (µmol m-2
s-1
) is net photosynthesis rate, Ac (µmol m-2
s-1
) is Rubisco carboxylation
limited photosynthesis rate, and Aj (µmol m-2
s-1
) RuBP regeneration limited photosynthesis
rate.
d
oci
icc R
KOKC
CVA
)/1(
)( *
(2)
Where Vc (µmol m-2
s-1
) is the carboxylation capacity at certain light intensity, Γ* (µmol mol
-
1)is the CO2 compensation point, Kc (µmol mol
-1) is the Michaelis-Menten constant of
Rubisco for CO2, Ko (mmol mol-1
) is the Michaelis-Menten constant of Rubisco for O2, O
(210 mmol mol-1
) is the oxygen concentration, Rd (µmol m-2
s-1
) is non-photorespiratory CO2
release, which comprised mitochondrial respiration.
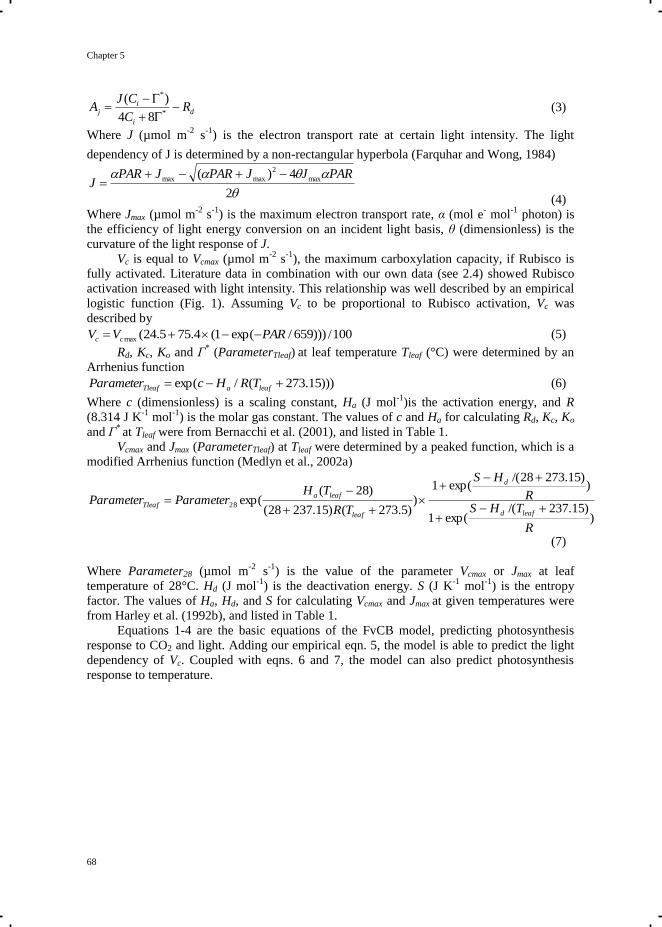
Chapter 5
68
d
i
ij R
C
CJA
*
*
84
)( (3)
Where J (µmol m-2
s-1
) is the electron transport rate at certain light intensity. The light
dependency of J is determined by a non-rectangular hyperbola (Farquhar and Wong, 1984)
2
4)( max
2
maxmax PARJJPARJPARJ
(4)
Where Jmax (µmol m-2
s-1
) is the maximum electron transport rate, α (mol e- mol
-1 photon) is
the efficiency of light energy conversion on an incident light basis, θ (dimensionless) is the
curvature of the light response of J.
Vc is equal to Vcmax (µmol m-2
s-1
), the maximum carboxylation capacity, if Rubisco is
fully activated. Literature data in combination with our own data (see 2.4) showed Rubisco
activation increased with light intensity. This relationship was well described by an empirical
logistic function (Fig. 1). Assuming Vc to be proportional to Rubisco activation, Vc was
described by
100/)))659/exp(1(4.755.24(max PARVV cc (5)
Rd, Kc, Ko and Γ* (ParameterTleaf)
at leaf temperature Tleaf (°C) were determined by an
Arrhenius function
)))15.273(/exp( leafaTleaf TRHcParameter (6)
Where c (dimensionless) is a scaling constant, Ha (J mol-1
)is the activation energy, and R
(8.314 J K-1
mol-1
) is the molar gas constant. The values of c and Ha for calculating Rd, Kc, Ko
and Γ*
at Tleaf were from Bernacchi et al. (2001), and listed in Table 1.
Vcmax and Jmax (ParameterTleaf) at Tleaf were determined by a peaked function, which is a
modified Arrhenius function (Medlyn et al., 2002a)
))15.237/(
exp(1
))15.27328/(
exp(1
))5.273()15.23728(
)28(exp(28
R
THSR
HS
TR
THParameterParameter
leafd
d
leaf
leafa
Tleaf
(7)
Where Parameter28 (µmol m-2
s-1
) is the value of the parameter Vcmax or Jmax at leaf
temperature of 28°C. Hd (J mol-1
) is the deactivation energy. S (J K-1
mol-1
) is the entropy
factor. The values of Ha, Hd, and S for calculating Vcmax and Jmax at given temperatures were
from Harley et al. (1992b), and listed in Table 1.
Equations 1-4 are the basic equations of the FvCB model, predicting photosynthesis
response to CO2 and light. Adding our empirical eqn. 5, the model is able to predict the light
dependency of Vc. Coupled with eqns. 6 and 7, the model can also predict photosynthesis
response to temperature.
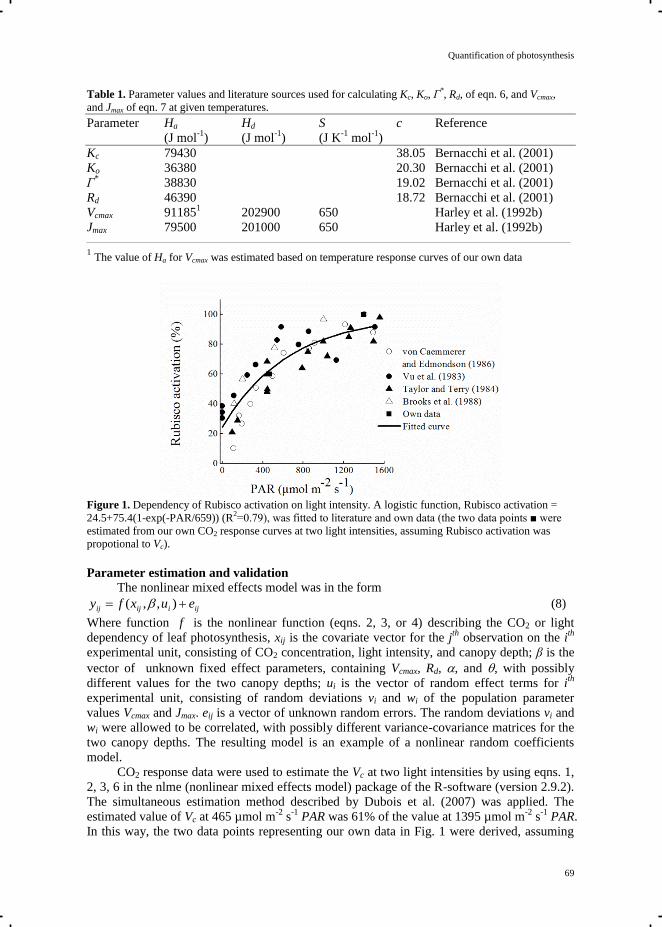
Quantification of photosynthesis
69
Table 1. Parameter values and literature sources used for calculating Kc, Ko, Γ*, Rd, of eqn. 6, and Vcmax,
and Jmax of eqn. 7 at given temperatures.
Parameter Ha Hd S c Reference
(J mol-1
) (J mol-1
) (J K-1
mol-1
)
Kc 79430 38.05 Bernacchi et al. (2001)
Ko 36380 20.30 Bernacchi et al. (2001)
Γ* 38830 19.02 Bernacchi et al. (2001)
Rd 46390 18.72 Bernacchi et al. (2001)
Vcmax 911851 202900 650 Harley et al. (1992b)
Jmax 79500 201000 650 Harley et al. (1992b)
1 The value of Ha for Vcmax was estimated based on temperature response curves of our own data
Figure 1. Dependency of Rubisco activation on light intensity. A logistic function, Rubisco activation =
24.5+75.4(1-exp(-PAR/659)) (R2=0.79), was fitted to literature and own data (the two data points ■ were
estimated from our own CO2 response curves at two light intensities, assuming Rubisco activation was
propotional to Vc).
Parameter estimation and validation
The nonlinear mixed effects model was in the form
ijiijij euxfy ),,( (8)
Where function f is the nonlinear function (eqns. 2, 3, or 4) describing the CO2 or light
dependency of leaf photosynthesis, xij is the covariate vector for the jth
observation on the ith
experimental unit, consisting of CO2 concentration, light intensity, and canopy depth; β is the
vector of unknown fixed effect parameters, containing Vcmax, Rd, , and , with possibly
different values for the two canopy depths; ui is the vector of random effect terms for ith
experimental unit, consisting of random deviations vi and wi of the population parameter
values Vcmax and Jmax. eij is a vector of unknown random errors. The random deviations vi and
wi were allowed to be correlated, with possibly different variance-covariance matrices for the
two canopy depths. The resulting model is an example of a nonlinear random coefficients
model.
CO2 response data were used to estimate the Vc at two light intensities by using eqns. 1,
2, 3, 6 in the nlme (nonlinear mixed effects model) package of the R-software (version 2.9.2).
The simultaneous estimation method described by Dubois et al. (2007) was applied. The
estimated value of Vc at 465 µmol m-2
s-1
PAR was 61% of the value at 1395 µmol m-2
s-1
PAR.
In this way, the two data points representing our own data in Fig. 1 were derived, assuming
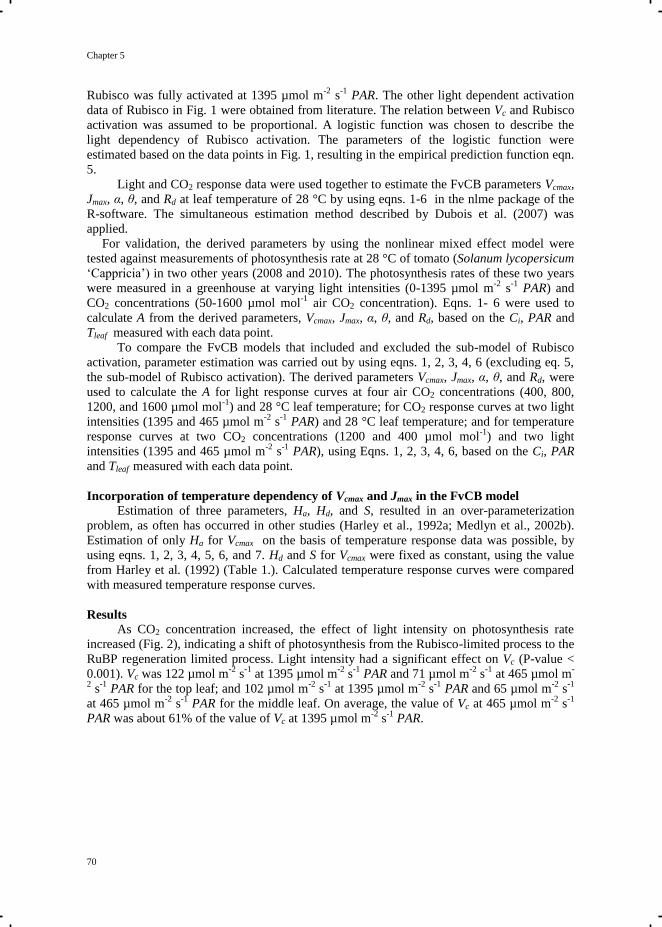
Chapter 5
70
Rubisco was fully activated at 1395 µmol m-2
s-1
PAR. The other light dependent activation
data of Rubisco in Fig. 1 were obtained from literature. The relation between Vc and Rubisco
activation was assumed to be proportional. A logistic function was chosen to describe the
light dependency of Rubisco activation. The parameters of the logistic function were
estimated based on the data points in Fig. 1, resulting in the empirical prediction function eqn.
5.
Light and CO2 response data were used together to estimate the FvCB parameters Vcmax,
Jmax, α, θ, and Rd at leaf temperature of 28 °C by using eqns. 1-6 in the nlme package of the
R-software. The simultaneous estimation method described by Dubois et al. (2007) was
applied.
For validation, the derived parameters by using the nonlinear mixed effect model were
tested against measurements of photosynthesis rate at 28 °C of tomato (Solanum lycopersicum
‘Cappricia’) in two other years (2008 and 2010). The photosynthesis rates of these two years
were measured in a greenhouse at varying light intensities (0-1395 µmol m-2
s-1
PAR) and
CO2 concentrations (50-1600 µmol mol-1
air CO2 concentration). Eqns. 1- 6 were used to
calculate A from the derived parameters, Vcmax, Jmax, α, θ, and Rd, based on the Ci, PAR and
Tleaf measured with each data point.
To compare the FvCB models that included and excluded the sub-model of Rubisco
activation, parameter estimation was carried out by using eqns. 1, 2, 3, 4, 6 (excluding eq. 5,
the sub-model of Rubisco activation). The derived parameters Vcmax, Jmax, α, θ, and Rd, were
used to calculate the A for light response curves at four air CO2 concentrations (400, 800,
1200, and 1600 µmol mol-1
) and 28 °C leaf temperature; for CO2 response curves at two light
intensities (1395 and 465 µmol m-2
s-1
PAR) and 28 °C leaf temperature; and for temperature
response curves at two CO2 concentrations (1200 and 400 µmol mol-1
) and two light
intensities (1395 and 465 µmol m-2
s-1
PAR), using Eqns. 1, 2, 3, 4, 6, based on the Ci, PAR
and Tleaf measured with each data point.
Incorporation of temperature dependency of Vcmax and Jmax in the FvCB model
Estimation of three parameters, Ha, Hd, and S, resulted in an over-parameterization
problem, as often has occurred in other studies (Harley et al., 1992a; Medlyn et al., 2002b).
Estimation of only Ha for Vcmax on the basis of temperature response data was possible, by
using eqns. 1, 2, 3, 4, 5, 6, and 7. Hd and S for Vcmax were fixed as constant, using the value
from Harley et al. (1992) (Table 1.). Calculated temperature response curves were compared
with measured temperature response curves.
Results
As CO2 concentration increased, the effect of light intensity on photosynthesis rate
increased (Fig. 2), indicating a shift of photosynthesis from the Rubisco-limited process to the
RuBP regeneration limited process. Light intensity had a significant effect on Vc (P-value <
0.001). Vc was 122 µmol m-2
s-1
at 1395 µmol m-2
s-1
PAR and 71 µmol m-2
s-1
at 465 µmol m-
2 s
-1 PAR for the top leaf; and 102 µmol m
-2 s
-1 at 1395 µmol m
-2 s
-1 PAR and 65 µmol m
-2 s
-1
at 465 µmol m-2
s-1
PAR for the middle leaf. On average, the value of Vc at 465 µmol m-2
s-1
PAR was about 61% of the value of Vc at 1395 µmol m-2
s-1
PAR.
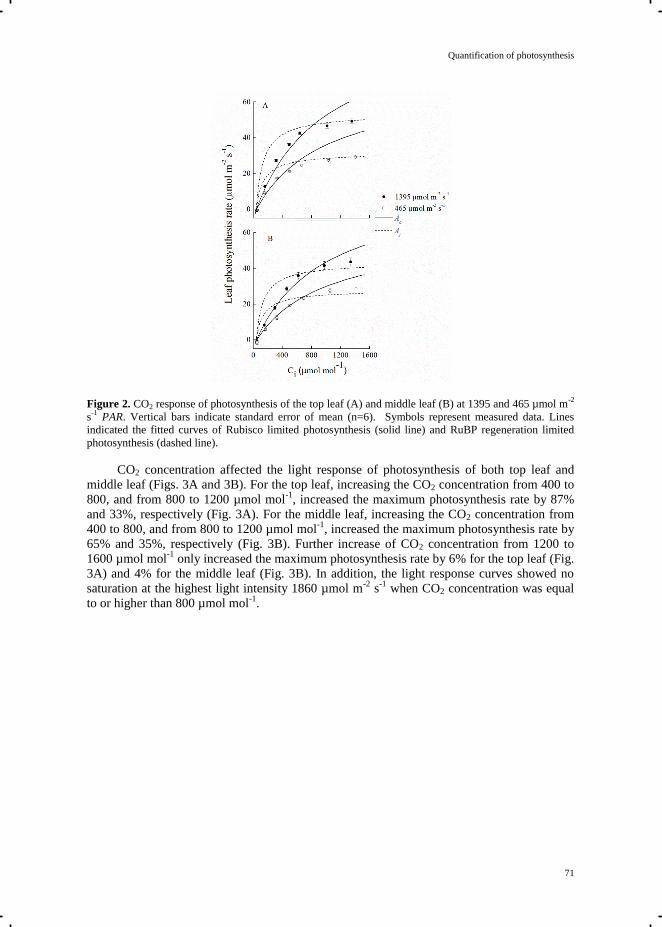
Quantification of photosynthesis
71
Figure 2. CO2 response of photosynthesis of the top leaf (A) and middle leaf (B) at 1395 and 465 µmol m
-2
s-1
PAR. Vertical bars indicate standard error of mean (n=6). Symbols represent measured data. Lines
indicated the fitted curves of Rubisco limited photosynthesis (solid line) and RuBP regeneration limited
photosynthesis (dashed line).
CO2 concentration affected the light response of photosynthesis of both top leaf and
middle leaf (Figs. 3A and 3B). For the top leaf, increasing the CO2 concentration from 400 to
800, and from 800 to 1200 µmol mol-1
, increased the maximum photosynthesis rate by 87%
and 33%, respectively (Fig. 3A). For the middle leaf, increasing the CO2 concentration from
400 to 800, and from 800 to 1200 µmol mol-1
, increased the maximum photosynthesis rate by
65% and 35%, respectively (Fig. 3B). Further increase of CO2 concentration from 1200 to
1600 µmol mol-1
only increased the maximum photosynthesis rate by 6% for the top leaf (Fig.
3A) and 4% for the middle leaf (Fig. 3B). In addition, the light response curves showed no
saturation at the highest light intensity 1860 µmol m-2
s-1
when CO2 concentration was equal
to or higher than 800 µmol mol-1
.
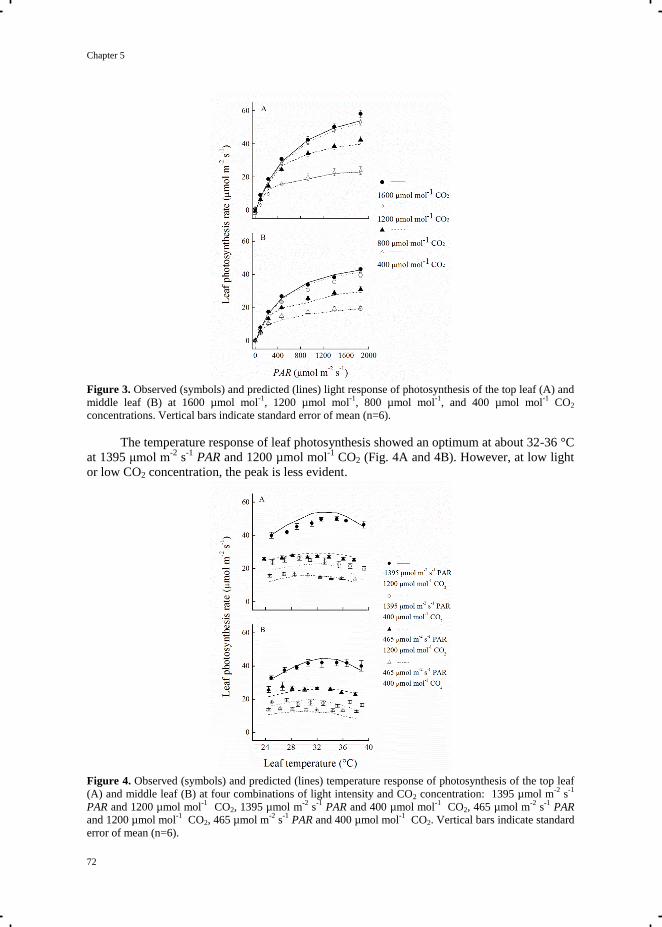
Chapter 5
72
Figure 3. Observed (symbols) and predicted (lines) light response of photosynthesis of the top leaf (A) and
middle leaf (B) at 1600 µmol mol-1
, 1200 µmol mol-1
, 800 µmol mol-1
, and 400 µmol mol-1
CO2
concentrations. Vertical bars indicate standard error of mean (n=6).
The temperature response of leaf photosynthesis showed an optimum at about 32-36 °C
at 1395 μmol m-2
s-1
PAR and 1200 µmol mol-1
CO2 (Fig. 4A and 4B). However, at low light
or low CO2 concentration, the peak is less evident.
Figure 4. Observed (symbols) and predicted (lines) temperature response of photosynthesis of the top leaf
(A) and middle leaf (B) at four combinations of light intensity and CO2 concentration: 1395 µmol m-2
s-1
PAR and 1200 µmol mol-1
CO2, 1395 µmol m-2
s-1
PAR and 400 µmol mol-1
CO2, 465 µmol m-2
s-1
PAR
and 1200 µmol mol-1
CO2, 465 µmol m-2
s-1
PAR and 400 µmol mol-1
CO2. Vertical bars indicate standard
error of mean (n=6).
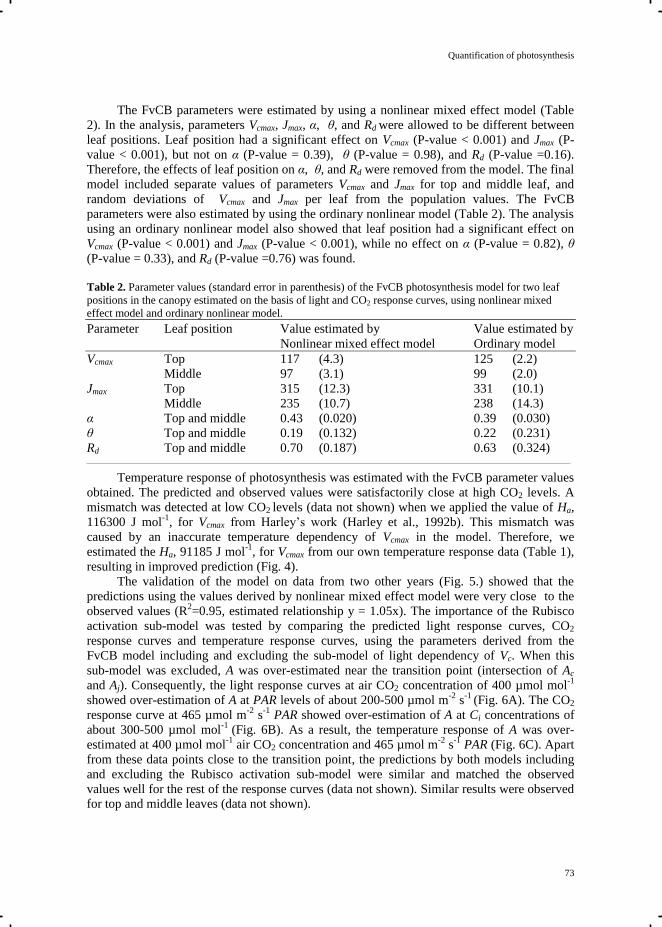
Quantification of photosynthesis
73
The FvCB parameters were estimated by using a nonlinear mixed effect model (Table
2). In the analysis, parameters Vcmax, Jmax, α, θ, and Rd were allowed to be different between
leaf positions. Leaf position had a significant effect on Vcmax (P-value < 0.001) and Jmax (P-
value < 0.001), but not on α (P-value = 0.39), θ (P-value = 0.98), and Rd (P-value =0.16).
Therefore, the effects of leaf position on α, θ, and Rd were removed from the model. The final
model included separate values of parameters Vcmax and Jmax for top and middle leaf, and
random deviations of Vcmax and Jmax per leaf from the population values. The FvCB
parameters were also estimated by using the ordinary nonlinear model (Table 2). The analysis
using an ordinary nonlinear model also showed that leaf position had a significant effect on
Vcmax (P-value < 0.001) and Jmax (P-value < 0.001), while no effect on α (P-value = 0.82), θ
(P-value = 0.33), and Rd (P-value =0.76) was found.
Table 2. Parameter values (standard error in parenthesis) of the FvCB photosynthesis model for two leaf
positions in the canopy estimated on the basis of light and CO2 response curves, using nonlinear mixed
effect model and ordinary nonlinear model.
Parameter Leaf position Value estimated by Value estimated by
Nonlinear mixed effect model Ordinary model
Vcmax Top 117 (4.3) 125 (2.2)
Middle 97 (3.1) 99 (2.0)
Jmax Top 315 (12.3) 331 (10.1)
Middle 235 (10.7) 238 (14.3)
α Top and middle 0.43 (0.020) 0.39 (0.030)
θ Top and middle 0.19 (0.132) 0.22 (0.231)
Rd Top and middle 0.70 (0.187) 0.63 (0.324)
Temperature response of photosynthesis was estimated with the FvCB parameter values
obtained. The predicted and observed values were satisfactorily close at high CO2 levels. A
mismatch was detected at low CO2 levels (data not shown) when we applied the value of Ha,
116300 J mol-1
, for Vcmax from Harley’s work (Harley et al., 1992b). This mismatch was
caused by an inaccurate temperature dependency of Vcmax in the model. Therefore, we
estimated the Ha, 91185 J mol-1
, for Vcmax from our own temperature response data (Table 1),
resulting in improved prediction (Fig. 4).
The validation of the model on data from two other years (Fig. 5.) showed that the
predictions using the values derived by nonlinear mixed effect model were very close to the
observed values (R2=0.95, estimated relationship y = 1.05x). The importance of the Rubisco
activation sub-model was tested by comparing the predicted light response curves, CO2
response curves and temperature response curves, using the parameters derived from the
FvCB model including and excluding the sub-model of light dependency of Vc. When this
sub-model was excluded, A was over-estimated near the transition point (intersection of Ac
and Aj). Consequently, the light response curves at air CO2 concentration of 400 µmol mol-1
showed over-estimation of A at PAR levels of about 200-500 µmol m-2
s-1
(Fig. 6A). The CO2
response curve at 465 µmol m-2
s-1
PAR showed over-estimation of A at Ci concentrations of
about 300-500 µmol mol-1
(Fig. 6B). As a result, the temperature response of A was over-
estimated at 400 µmol mol-1
air CO2 concentration and 465 µmol m-2
s-1
PAR (Fig. 6C). Apart
from these data points close to the transition point, the predictions by both models including
and excluding the Rubisco activation sub-model were similar and matched the observed
values well for the rest of the response curves (data not shown). Similar results were observed
for top and middle leaves (data not shown).
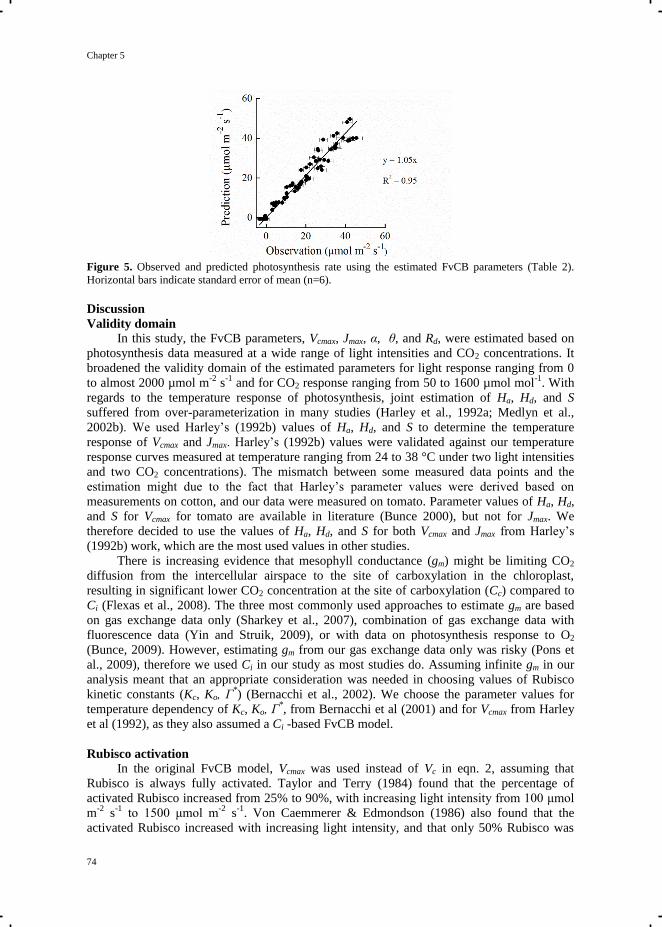
Chapter 5
74
Figure 5. Observed and predicted photosynthesis rate using the estimated FvCB parameters (Table 2).
Horizontal bars indicate standard error of mean (n=6).
Discussion
Validity domain
In this study, the FvCB parameters, Vcmax, Jmax, α, θ, and Rd, were estimated based on
photosynthesis data measured at a wide range of light intensities and CO2 concentrations. It
broadened the validity domain of the estimated parameters for light response ranging from 0
to almost 2000 µmol m-2
s-1
and for CO2 response ranging from 50 to 1600 µmol mol-1
. With
regards to the temperature response of photosynthesis, joint estimation of Ha, Hd, and S
suffered from over-parameterization in many studies (Harley et al., 1992a; Medlyn et al.,
2002b). We used Harley’s (1992b) values of Ha, Hd, and S to determine the temperature
response of Vcmax and Jmax. Harley’s (1992b) values were validated against our temperature
response curves measured at temperature ranging from 24 to 38 °C under two light intensities
and two CO2 concentrations). The mismatch between some measured data points and the
estimation might due to the fact that Harley’s parameter values were derived based on
measurements on cotton, and our data were measured on tomato. Parameter values of Ha, Hd,
and S for Vcmax for tomato are available in literature (Bunce 2000), but not for Jmax. We
therefore decided to use the values of Ha, Hd, and S for both Vcmax and Jmax from Harley’s
(1992b) work, which are the most used values in other studies.
There is increasing evidence that mesophyll conductance (gm) might be limiting CO2
diffusion from the intercellular airspace to the site of carboxylation in the chloroplast,
resulting in significant lower CO2 concentration at the site of carboxylation (Cc) compared to
Ci (Flexas et al., 2008). The three most commonly used approaches to estimate gm are based
on gas exchange data only (Sharkey et al., 2007), combination of gas exchange data with
fluorescence data (Yin and Struik, 2009), or with data on photosynthesis response to O2
(Bunce, 2009). However, estimating gm from our gas exchange data only was risky (Pons et
al., 2009), therefore we used Ci in our study as most studies do. Assuming infinite gm in our
analysis meant that an appropriate consideration was needed in choosing values of Rubisco
kinetic constants (Kc, Ko, Γ*) (Bernacchi et al., 2002). We choose the parameter values for
temperature dependency of Kc, Ko, Γ*, from Bernacchi et al (2001) and for Vcmax from Harley
et al (1992), as they also assumed a Ci -based FvCB model.
Rubisco activation
In the original FvCB model, Vcmax was used instead of Vc in eqn. 2, assuming that
Rubisco is always fully activated. Taylor and Terry (1984) found that the percentage of
activated Rubisco increased from 25% to 90%, with increasing light intensity from 100 μmol
m-2
s-1
to 1500 μmol m-2
s-1
. Von Caemmerer & Edmondson (1986) also found that the
activated Rubisco increased with increasing light intensity, and that only 50% Rubisco was
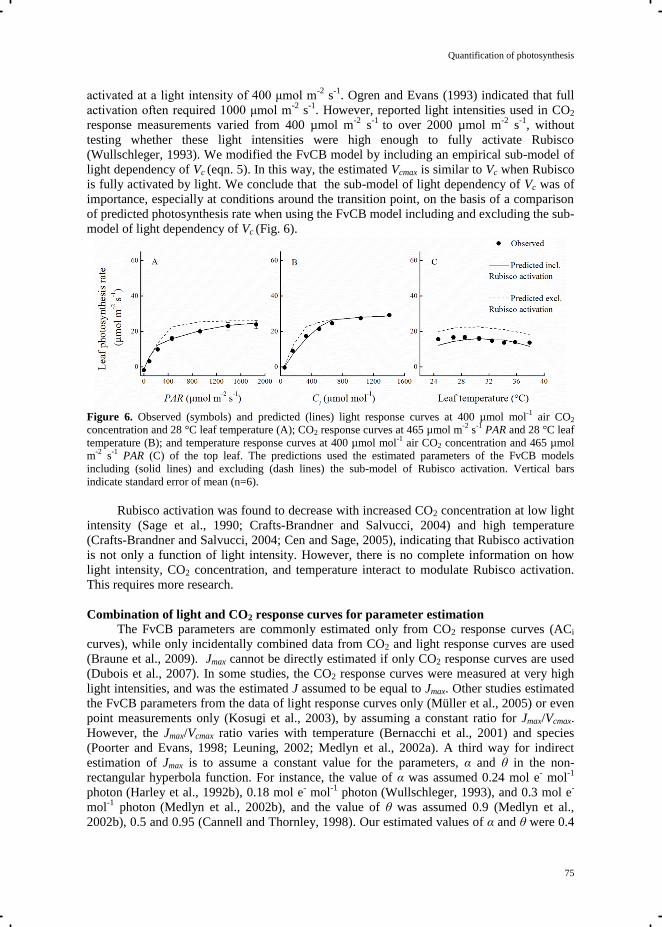
Quantification of photosynthesis
75
activated at a light intensity of 400 μmol m-2
s-1
. Ogren and Evans (1993) indicated that full
activation often required 1000 μmol m-2
s-1
. However, reported light intensities used in CO2
response measurements varied from 400 µmol m-2
s-1
to over 2000 µmol m-2
s-1
, without
testing whether these light intensities were high enough to fully activate Rubisco
(Wullschleger, 1993). We modified the FvCB model by including an empirical sub-model of
light dependency of Vc (eqn. 5). In this way, the estimated Vcmax is similar to Vc when Rubisco
is fully activated by light. We conclude that the sub-model of light dependency of Vc was of
importance, especially at conditions around the transition point, on the basis of a comparison
of predicted photosynthesis rate when using the FvCB model including and excluding the sub-
model of light dependency of Vc (Fig. 6).
Figure 6. Observed (symbols) and predicted (lines) light response curves at 400 µmol mol
-1 air CO2
concentration and 28 °C leaf temperature (A); CO2 response curves at 465 µmol m-2
s-1
PAR and 28 °C leaf
temperature (B); and temperature response curves at 400 µmol mol-1
air CO2 concentration and 465 µmol
m-2
s-1
PAR (C) of the top leaf. The predictions used the estimated parameters of the FvCB models
including (solid lines) and excluding (dash lines) the sub-model of Rubisco activation. Vertical bars
indicate standard error of mean (n=6).
Rubisco activation was found to decrease with increased CO2 concentration at low light
intensity (Sage et al., 1990; Crafts-Brandner and Salvucci, 2004) and high temperature
(Crafts-Brandner and Salvucci, 2004; Cen and Sage, 2005), indicating that Rubisco activation
is not only a function of light intensity. However, there is no complete information on how
light intensity, CO2 concentration, and temperature interact to modulate Rubisco activation.
This requires more research.
Combination of light and CO2 response curves for parameter estimation
The FvCB parameters are commonly estimated only from CO2 response curves (ACi
curves), while only incidentally combined data from CO2 and light response curves are used
(Braune et al., 2009). Jmax cannot be directly estimated if only CO2 response curves are used
(Dubois et al., 2007). In some studies, the CO2 response curves were measured at very high
light intensities, and was the estimated J assumed to be equal to Jmax. Other studies estimated
the FvCB parameters from the data of light response curves only (Müller et al., 2005) or even
point measurements only (Kosugi et al., 2003), by assuming a constant ratio for Jmax/Vcmax.
However, the Jmax/Vcmax ratio varies with temperature (Bernacchi et al., 2001) and species
(Poorter and Evans, 1998; Leuning, 2002; Medlyn et al., 2002a). A third way for indirect
estimation of Jmax is to assume a constant value for the parameters, α and θ in the non-
rectangular hyperbola function. For instance, the value of α was assumed 0.24 mol e- mol
-1
photon (Harley et al., 1992b), 0.18 mol e- mol
-1 photon (Wullschleger, 1993), and 0.3 mol e
-
mol-1
photon (Medlyn et al., 2002b), and the value of θ was assumed 0.9 (Medlyn et al.,
2002b), 0.5 and 0.95 (Cannell and Thornley, 1998). Our estimated values of α and θ were 0.4
Chapter 5
76
mol e- mol
-1 photon and 0.2, respectively (Table 2), which is higher, respectively lower than
literature values. However, if we assign values of α to 0.3 mol e- mol
-1 photon and θ to 0.7,
the estimated Jmax is 272 µmol m-2
s-1
and 209 µmol m-2
s-1
for top and middle leaves,
respectively. These two values differ substantially from our results (Table 2), which shows
that the values of α and θ do influence the estimated value of Jmax. This stands in contrast with
Medlyn et al. (2002b), who indicated only a slight effect. We conclude that estimation of the
FvCB parameters, without the assumptions α, θ, and Jmax/Vcmax, required both data sets of CO2
and light response curves.
Nonlinear mixed effects model
Peek et al. (2002) showed an example of misinterpretation by comparing the
conclusions drawn by ordinary fixed effects and mixed effects model analysis. From the
ordinary model it was concluded that light and species had significant effects on all the
parameters of a light response function. However, from the mixed effects model it was
concluded that light and species only had significant effect on the parameter for the maximum
photosynthesis rate at saturated light intensity. This difference was due to the violated model
assumption of homogeneity of variances in the ordinary model. We also compared the
parameter estimates from the ordinary nonlinear model and the nonlinear mixed effects model.
The analyses using the two models yielded identical conclusions. It was found in both cases
that leaf position had significant effects on Vcmax and Jmax, but not on α, θ, and Rd. The
parameter estimates from both models were quite comparable, but some differences in
standard errors were observed (Table 2). Consequently, we advocate using nonlinear mixed
effects models for estimating the FvCB parameters, because these models incorporate
properties of repeated measurements experimental design of photosynthesis studies, which are
neglected by fixed effects models. The analysis using a nonlinear mixed effect model for data
of repeated measurements yields more realistic standard errors, since it takes into account the
correlation among the data points from the same leaf and the non-constant variance.
Conclusions
The FvCB parameters, Vcmax, Jmax, α, θ, and Rd, were estimated based on CO2 and light
response curves, using nonlinear mixed effects model. Ha for calculation of Vcmax was
estimated from temperature response curves. The main conclusions were that (1)
incorporating a sub-model of Rubisco activation improved the prediction of the FvCB model
for light dependency of carboxylation rate; (2) Estimating Vcmax, Jmax, α, θ, and Rd requires
both data sets of CO2 and light response curves.
Quantification of photosynthesis
77
References
Bernacchi, C.J., Portis, A.R., Nakano, H., von Caemmerer, S., Long, S.P., 2002. Temperature
response of mesophyll conductance. Implications for the determination of Rubisco enzyme
kinetics and for limitations to photosynthesis in vivo. Plant Physiology. 130: 1992-1998.
Bernacchi, C.J., Singsaas, E.L., Pimentel, C., Portis, A.R.J., Long, S.P., 2001. Improved
temperature response functions for models of Rubisco-limited photosynthesis. Plant Cell
Environment. 24: 253-259.
Brooks, A., Portis, A.R.J., Sharkey, T.D., 1988. Effects of irradiance and methyl viologen
treatment on ATP, ADP, and activation of ribulose bisphosphate carboxylase in spinach
leaves. Plant Physiology. 88: 850-853.
Bunce, J.A., 2000. Acclimation of photosynthesis to temperature in eight cool and warm
climate herbaceous C3 species: Temperature dependence of parameters of a biochemical
photosynthesis model. Photosynthesis Research. 63: 59-67.
Bunce, J.A., 2009. Use of the response of photosynthesis to oxygen to estimate mesophyll
conductance to carbon dioxide in water-stressed soybean leaves. Plant Cell Environment.
32: 875-881.
Cannell, M.G.R., Thornley, J.H.M., 1998. Temperature and CO2 responses of leaf and canopy
photosynthesis: a clarification using the non-rectangular hyperbola model of
photosynthesis. Annals of Botany. 14: 729-739.
Cen, Y.-P., Sage, R.F., 2005. The regulation of Rubisco activity in response to variation in
temperature and atmospheric CO2 partial pressure in sweet potato. Plant Physiology. 139:
979-990.
Crafts-Brandner, S.J., Salvucci, M.E., 2004. Analyzing the impact of high temperature and
CO2 on net photosynthesis: biochemical mechanisms, models and genomics. Field Crops
Research. 90: 75-85.
Dreyer, E., Le Roux, X., Montpied, P., Daudet, F.A., Masson, F., 2001. Temperature response
of leaf photosynthetic capacity in seedlings from seven temperate tree species. Tree
Physiology. 21: 223-232.
Dubois, J.-J.B., Fiscus, E.L., Booker, F.L., Flowers, M.D., Reid, C.D., 2007. Optimizing the
statistical estimation of the parameters of the Farquhar-von Caemmerer-Berry model of
photosynthesis. New Phytologist. 176: 402-414.
Farquhar, G.D., von Caemmerer, S., 1982. Modelling of photosynthetic response to
environmental conditions. In: O.L. Lange, P.S. Nobel, C.B. Osmond and H. Ziegler, (Ed.),
Physiological Plant Ecology. II. Water Relations and Carbon Assimilation, Springer,
Berlin, pp. 549-588.
Farquhar, G.D., von Caemmerer, S., Berry, J.A., 1980. A biochemical model of
photosynthetic CO2 assimilation in leaves of C3 species. Planta. 149: 78-90.
Farquhar, G.D., Wong, S.C., 1984. An empirical model of stomatal conductance. Functional
Plant Biology. 11: 191-210.
Flexas, J., Ribas-Carbo, M., Diaz-Espejo, A., Galmes, J., Medrano, H., 2008. Mesophyll
conductance to CO2: current knowledge and future prospects. Plant Cell Environment. 31:
602-621.
Harley, P.C., Loreto, F., Di Marco, G., Sharkey, T.D., 1992a. Theoretical considerations when
estimating the mesophyll conductance to CO2 flux by analysis of the response of
photosynthesis to CO2. Plant Physiology. 98: 1429-1436.
Harley, P.C., Thomas, R.B., Reynolds, J.F., Strain, B.R., 1992b. Modelling photosynthesis of
cotton grown in elevated CO2. Plant Cell Environment. 15: 271-282.
Heschel, M.S., Stinchcombe, J., Holsinger, K., Schmitt, J., 2004. Natural selection on light
response curve parameters in the herbaceous annual, Impatiens capensis. Oecologia. 139:
487-494.
Chapter 5
78
Kosugi, Y., Shibata, S., Kobashi, S., 2003. Parameterization of the CO2 and H2O gas
exchange of several temperate deciduous broad-leaved trees at the leaf scale considering
seasonal changes. Plant Cell Environment. 26: 285-301.
Leuning, R., 2002. Temperature dependence of two parameters in a photosynthesis model.
Plant Cell Environment. 25: 1205-1210.
Leverenz, J.W., Falk, S., Pilström, C.-M., Samuelsson, G., 1990. The effects of
photoinhibition on the photosynthetic light-response curve of green plant cells
(Chlamydomonas reinhardtii). Planta. 182: 161-168.
Lin, S., Guan, B., Chang, T., 2008. Fitting photosynthesis irradiance response curves with
nonlinear mixed-effects models. Taiwan Journal of Forest Science. 23: 55-69.
Long, S.P., Bernacchi, C.J., 2003. Gas exchange measurements, what can they tell us about
the underlying limitations to photosynthesis? Procedures and sources of error. Journal of
Experimental Botany. 54: 2393-2401.
Manter, D.K., Kerrigan, J., 2004. A/Ci curve analysis across a range of woody plant species:
influence of regression analysis parameters and mesophyll conductance. Journal of
Experimental Botany. 55, 2581-2588.
McElrone, A.J., Forseth, I.N., 2004. Photosynthetic responses of a temperate liana to xylella
fastidiosa infection and water stress. J. Phytopathology. 152: 9-20.
Medlyn, B.E., Dreyer, E., Ellsworth, D., Forstreuter, M., Harley, P.C., Kirschbaum, M.U.F.,
Le Roux, X., Montpied, P., Strassemeyer, J., Walcroft, A., Wang, K., Loustau, D., 2002a.
Temperature response of parameters of a biochemically based model of photosynthesis. II.
A review of experimental data. Plant Cell Environment. 25: 1167-1179.
Medlyn, B.E., Loustau, D., Delzon, S., 2002b. Temperature response of parameters of a
biochemically based model of photosynthesis. I. Seasonal changes in mature maritime pine
(Pinus pinaster Ait.). Plant Cell Environmet. 25: 1155-1165.
Miao, Z., Xu, M., Lathrop, R.G., Wang, Y., 2009. Comparison of the A–Cc curve fitting
methods in determining maximum ribulose 1·5-bisphosphate carboxylase/oxygenase
carboxylation rate, potential light saturated electron transport rate and leaf dark respiration.
Plant Cell Environment. 32: 109-122.
Müller, J., Wernecke, P., Diepenbrock, W., 2005. LEAFC3-N: a nitrogen-sensitive extension
of the CO2 and H2O gas exchange model LEAFC3 parameterised and tested for winter
wheat (Triticum aestivum L.). Ecological Modelling. 183: 183-210.
Ogren, E., Evans, J.R., 1993. Photosynthetic light-response curves - I. The influence of CO2
partial pressure and leaf inversion. Planta. 189: 182-190.
Onoda, Y., Hikosaka, K., Hirose, T., 2005. Seasonal change in the balance between capacities
of RuBP carboxylation and RuBP regeneration affects CO2 response of photosynthesis in
Polygonum cuspidatum. Journal of Experimental Botany. 56: 755-763.
Ozturk, I., Ottosen, C.O., Ritz, C., Streibig, J.C., 2011. Non-linear mixed-eff ects modeling
for photosynthetic response of Rosa hybrida L. under elevated CO2 in greenhouses – Short
communication. Horticultural Science. 38: 43-47.
Peek, M.S., Russek-Cohen, E., Wait, D.A., Forseth, I.N., 2002. Physiological response curve
analysis using nonlinear mixed models. Oecologia. 132: 175-180.
Pons, T.L., Flexas, J., von Caemmerer, S., Evans, J.R., Genty, B., Ribas-Carbo, M., Brugnoli,
E., 2009. Estimating mesophyll conductance to CO2: methodology, potential errors, and
recommendations. Journal of Experimental Botany. 60: 2217-2234.
Poorter, H., Evans, J.R., 1998. Photosynthetic nitrogen-use efficiency of species that differ
inherently in specific leaf area. Oecologia. 116: 26-37.
Potvin, C., Lechowicz, M.J., Tardif, S., 1990. The statistical analysis of ecophysiological
response curves obtained from experiments involving repeated measures. Ecology. 71:
1389-1400.
Quantification of photosynthesis
79
Sage, R.F., Sharkey, T.D., Seemann, J.R., 1990. Regulation of Ribulose-1,5-Bisphosphate
carboxylase activity in response to light intensity and CO2 in the C3 annuals Chenopodium
album L. and Phaseolus vulgaris L.. Plant Physiology. 94: 1735-1742.
Salvucci, M.E., Portis, A.R., Jr., Ogren, W.L., 1986. Light and CO2 response of Ribulose-1,5-
Bisphosphate carboxylase/oxygenase activation in Arabidopsis leaves. Plant Physiology.
80: 655-659.
Sharkey, T.D., Bernacchi, C.J., Farquhar, G.D., Singsaas, E.L., 2007. Fitting photosynthetic
carbon dioxide response curves for C3 leaves. Plant Cell Environment. 30: 1035-1040.
Taylor, S.E., Terry, N., 1984. Limiting factors in photosynthesis: V. photochemical energy
supply colimits photosynthesis at low values of intercellular CO2 concentration. Plant
Physiology. 75: 82-86.
Von Caemmerer, S., 2000. Biochemical Models of Leaf Photosynthesis. CISIRO Publishing,
Collingwood, Victoria, Australia. 165pp.
Von Caemmerer, S., Edmondson, D.L., 1986. Relationship between steady-state gas exchange,
in vivo Ribulose bisphosphate carboxylase activity and some carbon reduction cycle
intermediates in Raphanus sativus. Functional Plant Biology. 13: 669-688.
Von Caemmerer, S., Farquhar, G.D., 1981. Some relationships between the biochemistry of
photosynthesis and the gas exchange of leaves. Planta. 153: 376-387.
Warren, C.R., Dreyer, E., 2006. Temperature response of photosynthesis and internal
conductance to CO2: results from two independent approaches. Journal of Experimental
Botany. 57: 3057-3067.
Wullschleger, S.D., 1993. Biochemical limitations to carbon assimilation in C3 plants—a
retrospective analysis of the A/Ci curves from 109 species. Journal of Experimental Botany.
44: 907-920.
Yamori, W., Evans, J.R., von Caemmerer, S., 2010. Effects of growth and measurement light
intensities on temperature dependence of CO2 assimilation rate in tobacco leaves. Plant
Cell Environment. 33: 332-343.
Yin, X., Struik, P.C., 2009. Theoretical reconsiderations when estimating the mesophyll
conductance to CO2 diffusion in leaves of C3 plants by analysis of combined gas exchange
and chlorophyll fluorescence measurements. PlantCell Environment. 32: 1513-1524.

Chapter 6
General Discussion
Chapter 6
82
Closed and semi-closed greenhouses were developed to reduce energy
consumption and increase production,. In these greenhouses, ventilation windows are
kept fully or largely closed, respectively. Climate conditions in these greenhouses can
differ from open greenhouses. In summer, high CO2 concentration is combined with
high light intensity (Chapter 2) and vertical temperature gradients occur due to
cooling below the gutters (Chapter 4). As described in Chapter 1, knowledge on crop
growth and development and the underlying physiological processes in (semi)-closed
greenhouses is the key to fully explore the advantages of these greenhouse systems.
This PhD research focuses on crop physiology in closed and semi-closed greenhouses,
aiming to study the effects of the new climate conditions on crop growth,
development and underlying processes. For this investigation, experiments were
performed in closed, semi-closed and open greenhouses. Greenhouse climate (Chapter
2 and 4.1), yield (Chapter 2), crop growth and development (Chapter 3 and 4.2), and
photosynthesis (Chapter 3 and 5) were analyzed.
In this Chapter, the results of these experiments are integrated and discussed.
The yield increase in a closed greenhouse, compared to that in an open greenhouse is
discussed based on physiological and developmental processes. In addition,
sustainability of the system is discussed in terms of energy, compared to an open
greenhouse. This chapter ends with the discussion on the applicability of the closed
greenhouse concept and other innovations for greenhouse energy conservation.
6.1 Yield analysis
The effect of the closed greenhouse system on yield is discussed by using a
component hierarchical scheme (Fig. 6.1, modified from Higashide and Heuvelink
(2009)). Yield increase (fresh fruit production, kg m-2
) can be caused by an increase
of total fruit dry matter (TDMfruit, kg m-2
) and/or a decrease of fruit dry matter content
(ratio between dry and fresh mass, %). Increase in TDMfruit can result from an
increase of total plant dry matter (TDMplant, kg m-2
) and/or an increase of the fraction
(%) of dry matter partitioned into the fruit. TDMplant is determined by the light use
efficiency of the plant (LUE, kg J-1
), i.e. TDMplant per unit of PAR light that is
intercepted by the canopy (J m-2
). Dry matter partitioning to the fruit is determined by
sink strengths of the fruits relative to those of the vegetative plant organs. Sink
strength of a fruit is defined as the competitive ability of a fruit to attract assimilates,
and the potential fruit growth rate is a measure of fruit sink strength (Marcelis 1996).
Total fruit sink strength of a plant depends on sink strength of the individual fruits and
the number of fruits. An increase of LUE can be the result of an increase of net leaf
photosynthesis rate (µmol m-2
s-1
), while a lower light extinction coefficient (k) may
lead to better distribution of light over the leaves and therefore also lead to higher rate
of crop photosynthesis (Higashide and Heuvelink 2009). A higher light interception is
the result of a higher light extinction coefficient and/or a higher leaf area index (LAI,
m2 m
-2). An increase of number of fruits per plant can be caused by a higher number
of trusses per plant, more fruits per truss and/or longer fruit growth duration.
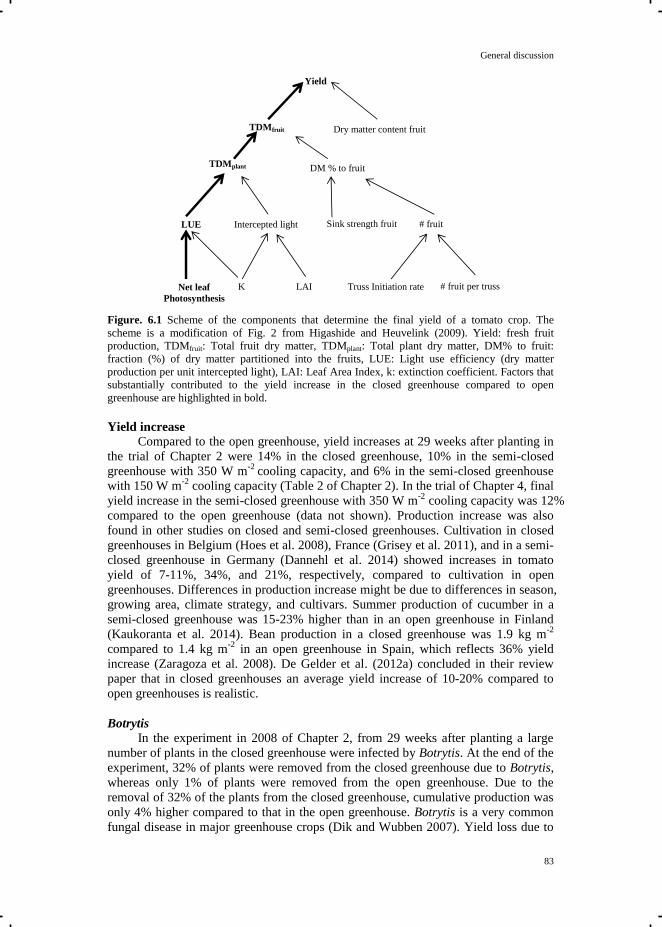
General discussion
83
Figure. 6.1 Scheme of the components that determine the final yield of a tomato crop. The
scheme is a modification of Fig. 2 from Higashide and Heuvelink (2009). Yield: fresh fruit
production, TDMfruit: Total fruit dry matter, TDMplant: Total plant dry matter, DM% to fruit:
fraction (%) of dry matter partitioned into the fruits, LUE: Light use efficiency (dry matter
production per unit intercepted light), LAI: Leaf Area Index, k: extinction coefficient. Factors that
substantially contributed to the yield increase in the closed greenhouse compared to open
greenhouse are highlighted in bold.
Yield increase
Compared to the open greenhouse, yield increases at 29 weeks after planting in
the trial of Chapter 2 were 14% in the closed greenhouse, 10% in the semi-closed
greenhouse with 350 W m-2
cooling capacity, and 6% in the semi-closed greenhouse
with 150 W m-2
cooling capacity (Table 2 of Chapter 2). In the trial of Chapter 4, final
yield increase in the semi-closed greenhouse with 350 W m-2
cooling capacity was 12%
compared to the open greenhouse (data not shown). Production increase was also
found in other studies on closed and semi-closed greenhouses. Cultivation in closed
greenhouses in Belgium (Hoes et al. 2008), France (Grisey et al. 2011), and in a semi-
closed greenhouse in Germany (Dannehl et al. 2014) showed increases in tomato
yield of 7-11%, 34%, and 21%, respectively, compared to cultivation in open
greenhouses. Differences in production increase might be due to differences in season,
growing area, climate strategy, and cultivars. Summer production of cucumber in a
semi-closed greenhouse was 15-23% higher than in an open greenhouse in Finland
(Kaukoranta et al. 2014). Bean production in a closed greenhouse was 1.9 kg m-2
compared to 1.4 kg m-2
in an open greenhouse in Spain, which reflects 36% yield
increase (Zaragoza et al. 2008). De Gelder et al. (2012a) concluded in their review
paper that in closed greenhouses an average yield increase of 10-20% compared to
open greenhouses is realistic.
Botrytis In the experiment in 2008 of Chapter 2, from 29 weeks after planting a large
number of plants in the closed greenhouse were infected by Botrytis. At the end of the
experiment, 32% of plants were removed from the closed greenhouse due to Botrytis,
whereas only 1% of plants were removed from the open greenhouse. Due to the
removal of 32% of the plants from the closed greenhouse, cumulative production was
only 4% higher compared to that in the open greenhouse. Botrytis is a very common
fungal disease in major greenhouse crops (Dik and Wubben 2007). Yield loss due to
Yield
TDMfruit Dry matter content fruit
TDMplant DM % to fruit
LUE Intercepted light
K Net leaf
Photosynthesis
LAI
Sink strength fruit # fruit
Truss Initiation rate # fruit per truss
Chapter 6
84
Botrytis infection also occurred in other closed greenhouses reviewed by Heuvelink et
al. (2008) and De Gelder et al. (2012a). Grisey et al. (2011) also reported more
Botrytis occurrence in the closed than in the open greenhouse (plant loss of
respectively 8% and 3%). De Gelder et al. (2008) reported a cucumber experiment in
which 40% of the plants in the closed greenhouses and 20% in open greenhouses were
infected by Botrytis.
High air humidity is the most likely reason for the high occurrence of Botrytis in
experiments with closed greenhouse (Heuvelink et al. 2008; De Gelder et al. 2012a).
We indeed found that in our experiments air humidity in the closed greenhouse was
higher than in the semi-closed and open greenhouse (Fig. 4 of Chapter 2), with the
latter two having very limited occurrence of Botrytis. In the 2008 experiment (Chapter
2) only 1% and 2% of the plants were affected by Botrytis in the semi-closed
greenhouses with respectively 150 and 350 W m-2
cooling capacity, which was
comparable to the loss of 1% of the plants in the open greenhouse. In the experiment
in 2009 (Chapter 4), no Botrytis infection was detected in any of the semi-closed
greenhouses, which had cooling capacity of 350 W m-2
.
Flower, fruit and leaf infection by Botrytis is related to high air humidity in
particular when combined with an organ temperature that is lower than the air
temperature, which causes condensation on the organs. The spores of Botrytis needs
wind or water to spread. This can occur in the morning in a greenhouse, when air
temperature is rising faster than plant temperature. In practice, the heating system is
usually turned on before sunrise to gradually increase leaf temperature concomitantly
with air temperature to avoid condensation, which reduces the risk of Botrytis
infection of leaves (Dik and Wubben 2007). Stem infection by Botrytis is stimulated
by high air humidity, but it is not linked directly to condensation. The presence of
wound spots provides the fungus with sufficient moisture for rapid infection. Eden et
al. (1996) showed an interaction effect of air humidity and temperature for tomato
stem infection by Botrytis. Stem infection increased with increasing relative humidity
from 56%-100%, and with decreasing air temperature from 25 °C to 15 °C. This
could explain the more frequent occurrence of Botrytis in closed greenhouses, which
is characterized by relatively humid air. High air humidity and low temperature were
combined at the lower part of the canopy, where cool air was brought in in summer
(Chapter 4.1). High humidity in closed and semi-closed greenhouses was also found
in other experiments (Dannehl et al. 2012, Hoes et al. 2008). Such a combination of
high humidity and low temperature at the lower part of the canopy can be avoided by
applying the cooling above instead of below the canopy (Chapter 4). In conclusion,
close attention should be paid to humidity and temperature, especially at the lower
part of the canopy, in the closed greenhouse to avoid infection by Botrytis.
Yield increase due to increase of total fruit dry matter
The yield increase in the closed and semi-closed greenhouses, compared to the
open greenhouse, was the result of an increase of total dry matter production of the
fruit, but not of a decrease of the dry matter content of the fruit (Fig. 6.2.). Dannehl et
al. (2014) also found yield increase in tomato in the closed greenhouse compared to
an open greenhouse while dry matter content of the fruit was unaffected. This is in
line with the fact that increased light intensity (Kläring and Krumbein 2013) and CO2
concentration (Nederhoff 1994) increased fresh and dry weight production but not the
fruit dry matter content of tomato fruits. Furthermore, Heuvelink (1995) and De
Koning (1994) showed that the source/sink ratio had no effect on dry matter content
of tomato fruits, despite its effects on fruit growth rate. In contrast to tomato, in
General discussion
85
cucumber a higher fruit dry matter content was found in a semi-closed greenhouse
than in an open greenhouse (Luomala et al. 2008). This is not surprising as for
cucumber an increase in assimilate supply (Marcelis 1993a) as well as a decrease in
temperature (Marcelis and Baan Hofman-Eijer 1993) increases the fruit dry matter
content and affects the developmental stage of the fruits at harvest, which further
contributes to a change in dry matter content.
The air humidity in the open greenhouse is in general lower than that in the
closed greenhouse. Bertin (2000) found an increase in tomato fruit dry matter content
when the air humidity was lower, but only under saline conditions in summer in the
south of France. Salinity induced restriction of water supply to the fruit, which
promoted fruit dry matter content but had a negative effect on yield (Li et al. 2001). In
several experiments under Dutch greenhouse conditions no (Bakker 1991) or only
small effects (Li et al. 2001) of air humidity were found in tomato. In our experiments,
plants were grown under non-saline condition with an EC in the rockwool slab of
approximately 3.7 dS m-1
in all treatments and experiments. We conclude that the
increase in tomato yield in the closed and semi-closed greenhouse, compared to the
open greenhouse, was not due to an increase in fruit dry matter content, but due to an
increase of total dry matter of the fruit.
Total dry matter production of the plant Increase in total fruit dry matter can be the result of an increase of total dry
matter of the plant and/or an increase of dry matter partitioning to the fruit (Fig. 6.1).
We showed that the increase of total fruit dry matter was the result of an increase of
total plant dry matter production, rather than a larger fraction of dry matter partitioned
into the fruit (Chapter 4.2). Higashide and Heuvelink (2009) compared the yield of
different tomato varieties, and also found that the increase of fruit yield was not due to
a change in the fraction of dry matter partitioned into fruit but that it positively
correlated with total plant dry matter production. In the research of Luomala et al.
(2008) with cucumber, both higher total dry matter production of the plant and higher
dry matter allocation to the fruits was found in the semi-closed greenhouse compared
to an open greenhouse.
Dry matter partitioning to the fruits
Dry matter partitioning is regulated by sink strengths of the organs. Source
strength has no direct influence on dry matter partitioning to the fruit (reviewed by
Marcelis 1996) which was confirmed by several studies. Radiation (Marcelis 1992),
CO2 concentration (Nederhoff 1994) and plant density (indirect influence of light
interception per plant, Heuvelink 1995) neither influenced the dry matter partitioning
to the fruit. The importance of sink strength in determining dry matter partitioning in
tomato was corroborated by experiments where fruit number per truss (fruit load) was
varied (Heuvelink 1996). In our experiments, as is common practice in commercial
tomato cultivation, fruit number was restricted by pruning to a fixed number per truss.
Heuvelink (1996) found that temperature did not affect dry matter partitioning into the
fruits in tomato. Therefore, it is not surprising that dry matter partitioning to the fruits
was similar between plants grown in closed and open greenhouses in our experiments.
Although also in cucumber source strength has no direct effect on dry matter
partitioning to the fruits, the number of sinks increases when source strength increases,
in the long run resulting in an increased partitioning to the fruits (Marcelis 1993b).
Therefore, increased source strength by higher CO2 concentration in the closed
greenhouse compared to open greenhouse might increase dry matter partitioning to
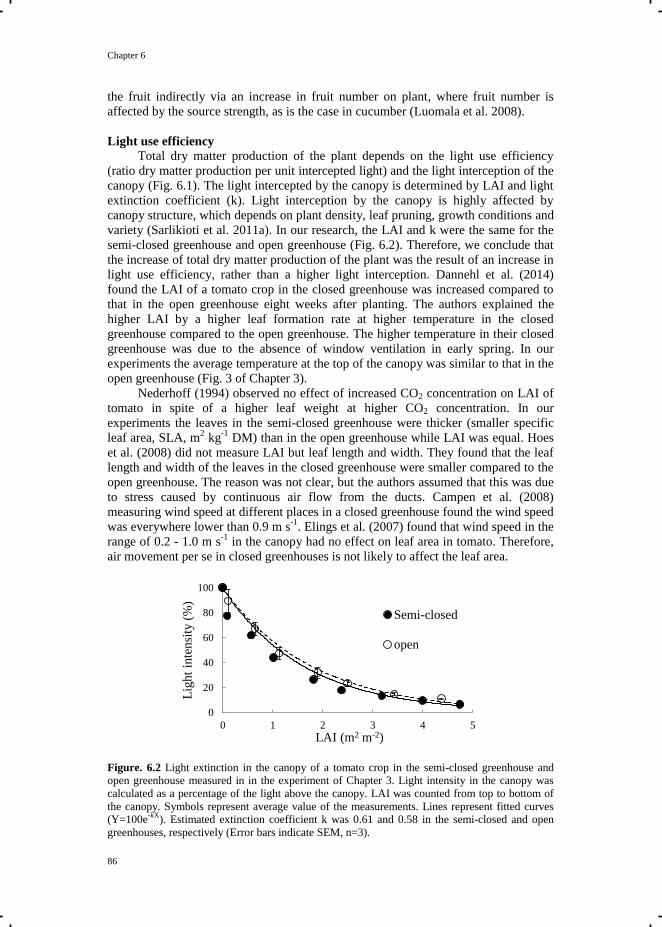
Chapter 6
86
the fruit indirectly via an increase in fruit number on plant, where fruit number is
affected by the source strength, as is the case in cucumber (Luomala et al. 2008).
Light use efficiency
Total dry matter production of the plant depends on the light use efficiency
(ratio dry matter production per unit intercepted light) and the light interception of the
canopy (Fig. 6.1). The light intercepted by the canopy is determined by LAI and light
extinction coefficient (k). Light interception by the canopy is highly affected by
canopy structure, which depends on plant density, leaf pruning, growth conditions and
variety (Sarlikioti et al. 2011a). In our research, the LAI and k were the same for the
semi-closed greenhouse and open greenhouse (Fig. 6.2). Therefore, we conclude that
the increase of total dry matter production of the plant was the result of an increase in
light use efficiency, rather than a higher light interception. Dannehl et al. (2014)
found the LAI of a tomato crop in the closed greenhouse was increased compared to
that in the open greenhouse eight weeks after planting. The authors explained the
higher LAI by a higher leaf formation rate at higher temperature in the closed
greenhouse compared to the open greenhouse. The higher temperature in their closed
greenhouse was due to the absence of window ventilation in early spring. In our
experiments the average temperature at the top of the canopy was similar to that in the
open greenhouse (Fig. 3 of Chapter 3).
Nederhoff (1994) observed no effect of increased CO2 concentration on LAI of
tomato in spite of a higher leaf weight at higher CO2 concentration. In our
experiments the leaves in the semi-closed greenhouse were thicker (smaller specific
leaf area, SLA, m2 kg
-1 DM) than in the open greenhouse while LAI was equal. Hoes
et al. (2008) did not measure LAI but leaf length and width. They found that the leaf
length and width of the leaves in the closed greenhouse were smaller compared to the
open greenhouse. The reason was not clear, but the authors assumed that this was due
to stress caused by continuous air flow from the ducts. Campen et al. (2008)
measuring wind speed at different places in a closed greenhouse found the wind speed
was everywhere lower than 0.9 m s-1
. Elings et al. (2007) found that wind speed in the
range of 0.2 - 1.0 m s-1
in the canopy had no effect on leaf area in tomato. Therefore,
air movement per se in closed greenhouses is not likely to affect the leaf area.
Figure. 6.2 Light extinction in the canopy of a tomato crop in the semi-closed greenhouse and
open greenhouse measured in in the experiment of Chapter 3. Light intensity in the canopy was
calculated as a percentage of the light above the canopy. LAI was counted from top to bottom of
the canopy. Symbols represent average value of the measurements. Lines represent fitted curves
(Y=100e-kX
). Estimated extinction coefficient k was 0.61 and 0.58 in the semi-closed and open
greenhouses, respectively (Error bars indicate SEM, n=3).
0
20
40
60
80
100
0 1 2 3 4 5
Lig
ht
inte
nsi
ty (
%)
LAI (m2 m-2)
Semi-closed
open
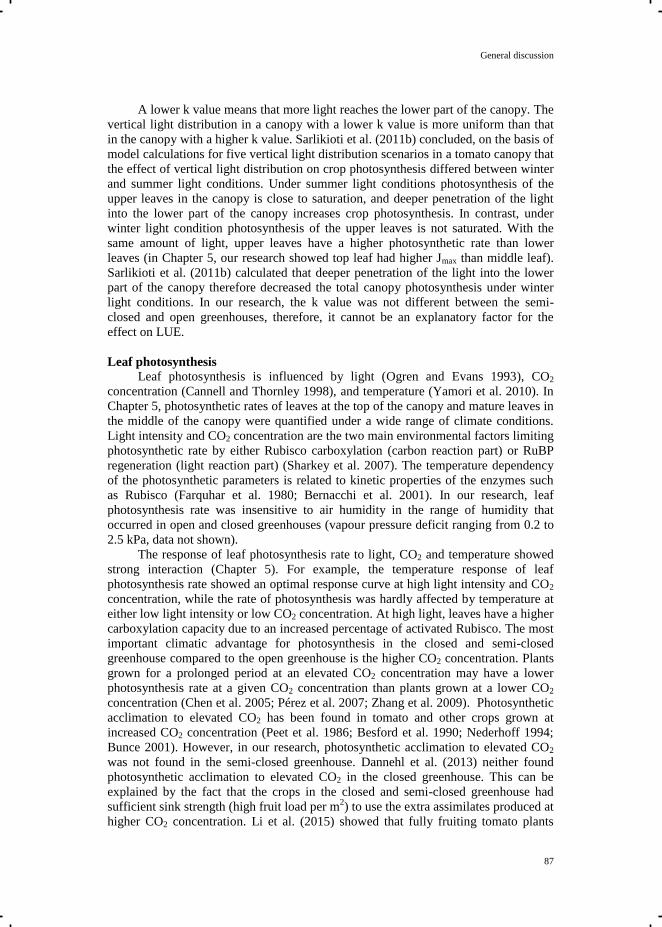
General discussion
87
A lower k value means that more light reaches the lower part of the canopy. The
vertical light distribution in a canopy with a lower k value is more uniform than that
in the canopy with a higher k value. Sarlikioti et al. (2011b) concluded, on the basis of
model calculations for five vertical light distribution scenarios in a tomato canopy that
the effect of vertical light distribution on crop photosynthesis differed between winter
and summer light conditions. Under summer light conditions photosynthesis of the
upper leaves in the canopy is close to saturation, and deeper penetration of the light
into the lower part of the canopy increases crop photosynthesis. In contrast, under
winter light condition photosynthesis of the upper leaves is not saturated. With the
same amount of light, upper leaves have a higher photosynthetic rate than lower
leaves (in Chapter 5, our research showed top leaf had higher Jmax than middle leaf).
Sarlikioti et al. (2011b) calculated that deeper penetration of the light into the lower
part of the canopy therefore decreased the total canopy photosynthesis under winter
light conditions. In our research, the k value was not different between the semi-
closed and open greenhouses, therefore, it cannot be an explanatory factor for the
effect on LUE.
Leaf photosynthesis
Leaf photosynthesis is influenced by light (Ogren and Evans 1993), CO2
concentration (Cannell and Thornley 1998), and temperature (Yamori et al. 2010). In
Chapter 5, photosynthetic rates of leaves at the top of the canopy and mature leaves in
the middle of the canopy were quantified under a wide range of climate conditions.
Light intensity and CO2 concentration are the two main environmental factors limiting
photosynthetic rate by either Rubisco carboxylation (carbon reaction part) or RuBP
regeneration (light reaction part) (Sharkey et al. 2007). The temperature dependency
of the photosynthetic parameters is related to kinetic properties of the enzymes such
as Rubisco (Farquhar et al. 1980; Bernacchi et al. 2001). In our research, leaf
photosynthesis rate was insensitive to air humidity in the range of humidity that
occurred in open and closed greenhouses (vapour pressure deficit ranging from 0.2 to
2.5 kPa, data not shown).
The response of leaf photosynthesis rate to light, CO2 and temperature showed
strong interaction (Chapter 5). For example, the temperature response of leaf
photosynthesis rate showed an optimal response curve at high light intensity and CO2
concentration, while the rate of photosynthesis was hardly affected by temperature at
either low light intensity or low CO2 concentration. At high light, leaves have a higher
carboxylation capacity due to an increased percentage of activated Rubisco. The most
important climatic advantage for photosynthesis in the closed and semi-closed
greenhouse compared to the open greenhouse is the higher CO2 concentration. Plants
grown for a prolonged period at an elevated CO2 concentration may have a lower
photosynthesis rate at a given CO2 concentration than plants grown at a lower CO2
concentration (Chen et al. 2005; Pérez et al. 2007; Zhang et al. 2009). Photosynthetic
acclimation to elevated CO2 has been found in tomato and other crops grown at
increased CO2 concentration (Peet et al. 1986; Besford et al. 1990; Nederhoff 1994;
Bunce 2001). However, in our research, photosynthetic acclimation to elevated CO2
was not found in the semi-closed greenhouse. Dannehl et al. (2013) neither found
photosynthetic acclimation to elevated CO2 in the closed greenhouse. This can be
explained by the fact that the crops in the closed and semi-closed greenhouse had
sufficient sink strength (high fruit load per m2) to use the extra assimilates produced at
higher CO2 concentration. Li et al. (2015) showed that fully fruiting tomato plants
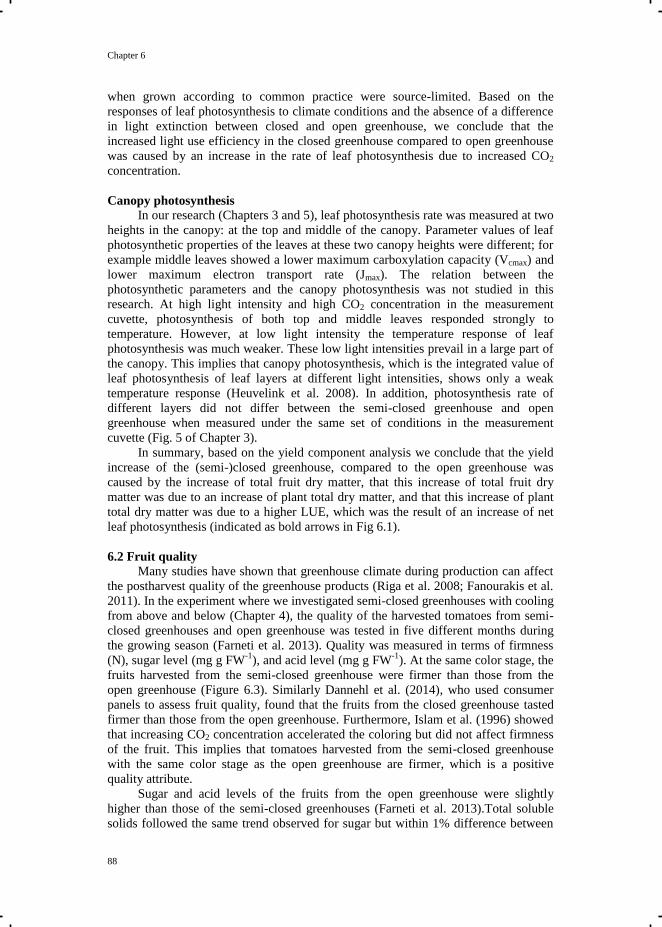
Chapter 6
88
when grown according to common practice were source-limited. Based on the
responses of leaf photosynthesis to climate conditions and the absence of a difference
in light extinction between closed and open greenhouse, we conclude that the
increased light use efficiency in the closed greenhouse compared to open greenhouse
was caused by an increase in the rate of leaf photosynthesis due to increased CO2
concentration.
Canopy photosynthesis
In our research (Chapters 3 and 5), leaf photosynthesis rate was measured at two
heights in the canopy: at the top and middle of the canopy. Parameter values of leaf
photosynthetic properties of the leaves at these two canopy heights were different; for
example middle leaves showed a lower maximum carboxylation capacity (Vcmax) and
lower maximum electron transport rate (Jmax). The relation between the
photosynthetic parameters and the canopy photosynthesis was not studied in this
research. At high light intensity and high CO2 concentration in the measurement
cuvette, photosynthesis of both top and middle leaves responded strongly to
temperature. However, at low light intensity the temperature response of leaf
photosynthesis was much weaker. These low light intensities prevail in a large part of
the canopy. This implies that canopy photosynthesis, which is the integrated value of
leaf photosynthesis of leaf layers at different light intensities, shows only a weak
temperature response (Heuvelink et al. 2008). In addition, photosynthesis rate of
different layers did not differ between the semi-closed greenhouse and open
greenhouse when measured under the same set of conditions in the measurement
cuvette (Fig. 5 of Chapter 3).
In summary, based on the yield component analysis we conclude that the yield
increase of the (semi-)closed greenhouse, compared to the open greenhouse was
caused by the increase of total fruit dry matter, that this increase of total fruit dry
matter was due to an increase of plant total dry matter, and that this increase of plant
total dry matter was due to a higher LUE, which was the result of an increase of net
leaf photosynthesis (indicated as bold arrows in Fig 6.1).
6.2 Fruit quality Many studies have shown that greenhouse climate during production can affect
the postharvest quality of the greenhouse products (Riga et al. 2008; Fanourakis et al.
2011). In the experiment where we investigated semi-closed greenhouses with cooling
from above and below (Chapter 4), the quality of the harvested tomatoes from semi-
closed greenhouses and open greenhouse was tested in five different months during
the growing season (Farneti et al. 2013). Quality was measured in terms of firmness
(N), sugar level (mg g FW-1
), and acid level (mg g FW-1
). At the same color stage, the
fruits harvested from the semi-closed greenhouse were firmer than those from the
open greenhouse (Figure 6.3). Similarly Dannehl et al. (2014), who used consumer
panels to assess fruit quality, found that the fruits from the closed greenhouse tasted
firmer than those from the open greenhouse. Furthermore, Islam et al. (1996) showed
that increasing CO2 concentration accelerated the coloring but did not affect firmness
of the fruit. This implies that tomatoes harvested from the semi-closed greenhouse
with the same color stage as the open greenhouse are firmer, which is a positive
quality attribute.
Sugar and acid levels of the fruits from the open greenhouse were slightly
higher than those of the semi-closed greenhouses (Farneti et al. 2013).Total soluble
solids followed the same trend observed for sugar but within 1% difference between
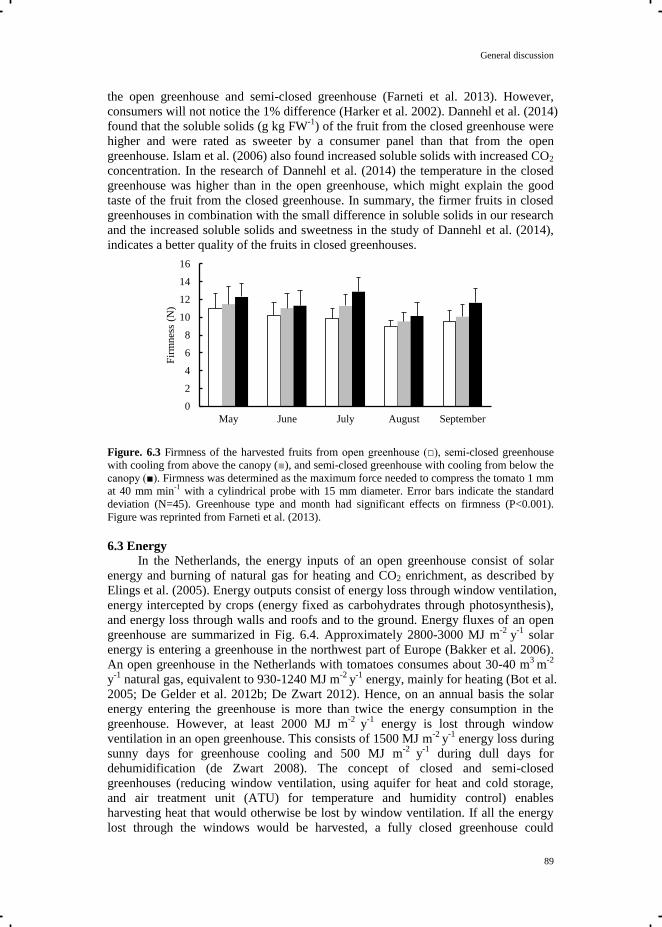
General discussion
89
the open greenhouse and semi-closed greenhouse (Farneti et al. 2013). However,
consumers will not notice the 1% difference (Harker et al. 2002). Dannehl et al. (2014)
found that the soluble solids (g kg FW-1
) of the fruit from the closed greenhouse were
higher and were rated as sweeter by a consumer panel than that from the open
greenhouse. Islam et al. (2006) also found increased soluble solids with increased CO2
concentration. In the research of Dannehl et al. (2014) the temperature in the closed
greenhouse was higher than in the open greenhouse, which might explain the good
taste of the fruit from the closed greenhouse. In summary, the firmer fruits in closed
greenhouses in combination with the small difference in soluble solids in our research
and the increased soluble solids and sweetness in the study of Dannehl et al. (2014),
indicates a better quality of the fruits in closed greenhouses.
Figure. 6.3 Firmness of the harvested fruits from open greenhouse (□), semi-closed greenhouse
with cooling from above the canopy (■), and semi-closed greenhouse with cooling from below the
canopy (■). Firmness was determined as the maximum force needed to compress the tomato 1 mm
at 40 mm min-1
with a cylindrical probe with 15 mm diameter. Error bars indicate the standard
deviation (N=45). Greenhouse type and month had significant effects on firmness (P<0.001).
Figure was reprinted from Farneti et al. (2013).
6.3 Energy
In the Netherlands, the energy inputs of an open greenhouse consist of solar
energy and burning of natural gas for heating and CO2 enrichment, as described by
Elings et al. (2005). Energy outputs consist of energy loss through window ventilation,
energy intercepted by crops (energy fixed as carbohydrates through photosynthesis),
and energy loss through walls and roofs and to the ground. Energy fluxes of an open
greenhouse are summarized in Fig. 6.4. Approximately 2800-3000 MJ m-2
y-1
solar
energy is entering a greenhouse in the northwest part of Europe (Bakker et al. 2006).
An open greenhouse in the Netherlands with tomatoes consumes about 30-40 m3
m-2
y-1
natural gas, equivalent to 930-1240 MJ m-2
y-1
energy, mainly for heating (Bot et al.
2005; De Gelder et al. 2012b; De Zwart 2012). Hence, on an annual basis the solar
energy entering the greenhouse is more than twice the energy consumption in the
greenhouse. However, at least 2000 MJ m-2
y-1
energy is lost through window
ventilation in an open greenhouse. This consists of 1500 MJ m-2
y-1
energy loss during
sunny days for greenhouse cooling and 500 MJ m-2
y-1
during dull days for
dehumidification (de Zwart 2008). The concept of closed and semi-closed
greenhouses (reducing window ventilation, using aquifer for heat and cold storage,
and air treatment unit (ATU) for temperature and humidity control) enables
harvesting heat that would otherwise be lost by window ventilation. If all the energy
lost through the windows would be harvested, a fully closed greenhouse could
0
2
4
6
8
10
12
14
16
May June July August September
Fir
mnes
s (N
)
Chapter 6
90
potentially harvest 2000 MJ m-2
y-1
energy, while the energy consumption for heating
of a greenhouse is only 930-1240 MJ m-2
y-1
. It means that the harvested energy is
more than enough for heating. However, energy saving by a closed greenhouse
(reduction in % energy consumption compared to an open greenhouse) is not 100%
because primary energy is needed for running the pumps, the ventilators of the ATU,
and the heat pump (Bakker et al. 2006; De Zwart 2008; De Gelder et al. 2012). De
Zwart mentioned that energy saving is less than 50% and De Gelder et al. (2012a)
mentioned in their review a saving of 30-40% (heat pumps are needed to bridge the
gap between the water temperature from the aquifer (18°C) and required heating
water temperature (above 40°C) in the ATU (Bot et al. 2005; de Zwart 2012).
Electrical energy for operation of heat pump depends on the heat that the heat pump
needs to supply and by the COP (coefficient of performance, ratio of heating or
cooling output to work input).
Figure. 6.4 Energy fluxes of an open greenhouse with tomatoes in the Netherlands. Values
indicate energy input and output in MJ m-2
y-1
. These are rough estimates based on Elings et al.
(2005) and De Zwart (2008).
In our research, closed, semi-closed and open greenhouses were operated at the
same time and same location (Chapter 2 and Chapter 4). Figure 6.5 shows the
monthly average consumed and harvested energy in these greenhouses. The energy
consumption calculated here was for heating, excluding the primary electricity energy
for operation of the heat pump, pumps, and ventilator of ATU. The accumulated
difference between harvested and consumed heat energy shows the net heat energy
gained by the system. The greenhouse with a higher cooling capacity harvested more
energy. On an annual basis in the fully closed greenhouse the estimated heat energy
harvested was 2605 MJ m-2
y-1
, which is equal to the heat that would be produced by
burning 84 m3
m-2
y-1
natural gas (Table 6.1). The energy consumption for heating in
the fully closed greenhouse was equal to 39 m3 m
-2 y
-1 natural gas. In the experiment
of 2009 in Chapter 3 and 4, the semi-closed greenhouse was found to harvest less
energy compared to the experiment of 2008 of Chapter 2 (Dieleman et al. 2009;
Dieleman et al. 2012). A major reason for the differences in harvested energy between
the two experimental years was that dehumidification was completely realized by
window ventilation and that the ATU was not used for this purpose in the semi-closed
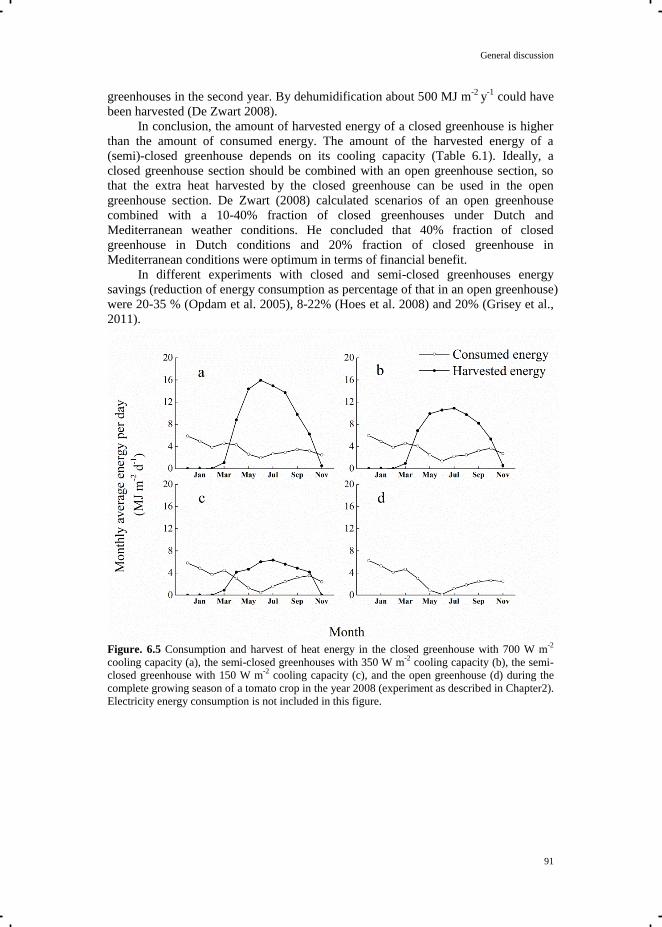
General discussion
91
greenhouses in the second year. By dehumidification about 500 MJ m-2
y-1
could have
been harvested (De Zwart 2008).
In conclusion, the amount of harvested energy of a closed greenhouse is higher
than the amount of consumed energy. The amount of the harvested energy of a
(semi)-closed greenhouse depends on its cooling capacity (Table 6.1). Ideally, a
closed greenhouse section should be combined with an open greenhouse section, so
that the extra heat harvested by the closed greenhouse can be used in the open
greenhouse section. De Zwart (2008) calculated scenarios of an open greenhouse
combined with a 10-40% fraction of closed greenhouses under Dutch and
Mediterranean weather conditions. He concluded that 40% fraction of closed
greenhouse in Dutch conditions and 20% fraction of closed greenhouse in
Mediterranean conditions were optimum in terms of financial benefit.
In different experiments with closed and semi-closed greenhouses energy
savings (reduction of energy consumption as percentage of that in an open greenhouse)
were 20-35 % (Opdam et al. 2005), 8-22% (Hoes et al. 2008) and 20% (Grisey et al.,
2011).
Figure. 6.5 Consumption and harvest of heat energy in the closed greenhouse with 700 W m
-2
cooling capacity (a), the semi-closed greenhouses with 350 W m-2
cooling capacity (b), the semi-
closed greenhouse with 150 W m-2
cooling capacity (c), and the open greenhouse (d) during the
complete growing season of a tomato crop in the year 2008 (experiment as described in Chapter2).
Electricity energy consumption is not included in this figure.
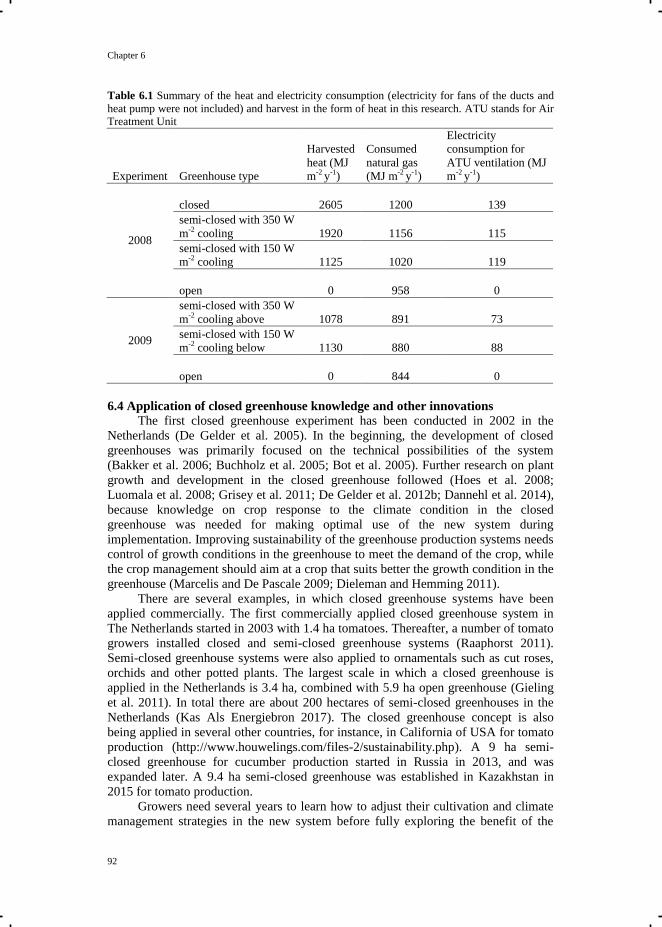
Chapter 6
92
Table 6.1 Summary of the heat and electricity consumption (electricity for fans of the ducts and
heat pump were not included) and harvest in the form of heat in this research. ATU stands for Air
Treatment Unit
Experiment Greenhouse type
Harvested
heat (MJ
m-2
y-1
)
Consumed
natural gas
(MJ m-2
y-1
)
Electricity
consumption for
ATU ventilation (MJ
m-2
y-1
)
2008
closed 2605 1200 139
semi-closed with 350 W
m-2
cooling 1920 1156 115
semi-closed with 150 W
m-2
cooling 1125 1020 119
open 0 958 0
2009
semi-closed with 350 W
m-2
cooling above 1078 891 73
semi-closed with 150 W
m-2
cooling below 1130 880 88
open 0 844 0
6.4 Application of closed greenhouse knowledge and other innovations
The first closed greenhouse experiment has been conducted in 2002 in the
Netherlands (De Gelder et al. 2005). In the beginning, the development of closed
greenhouses was primarily focused on the technical possibilities of the system
(Bakker et al. 2006; Buchholz et al. 2005; Bot et al. 2005). Further research on plant
growth and development in the closed greenhouse followed (Hoes et al. 2008;
Luomala et al. 2008; Grisey et al. 2011; De Gelder et al. 2012b; Dannehl et al. 2014),
because knowledge on crop response to the climate condition in the closed
greenhouse was needed for making optimal use of the new system during
implementation. Improving sustainability of the greenhouse production systems needs
control of growth conditions in the greenhouse to meet the demand of the crop, while
the crop management should aim at a crop that suits better the growth condition in the
greenhouse (Marcelis and De Pascale 2009; Dieleman and Hemming 2011).
There are several examples, in which closed greenhouse systems have been
applied commercially. The first commercially applied closed greenhouse system in
The Netherlands started in 2003 with 1.4 ha tomatoes. Thereafter, a number of tomato
growers installed closed and semi-closed greenhouse systems (Raaphorst 2011).
Semi-closed greenhouse systems were also applied to ornamentals such as cut roses,
orchids and other potted plants. The largest scale in which a closed greenhouse is
applied in the Netherlands is 3.4 ha, combined with 5.9 ha open greenhouse (Gieling
et al. 2011). In total there are about 200 hectares of semi-closed greenhouses in the
Netherlands (Kas Als Energiebron 2017). The closed greenhouse concept is also
being applied in several other countries, for instance, in California of USA for tomato
production (http://www.houwelings.com/files-2/sustainability.php). A 9 ha semi-
closed greenhouse for cucumber production started in Russia in 2013, and was
expanded later. A 9.4 ha semi-closed greenhouse was established in Kazakhstan in
2015 for tomato production.
Growers need several years to learn how to adjust their cultivation and climate
management strategies in the new system before fully exploring the benefit of the
General discussion
93
system. Knowledge transfer and a strong cooperation between researchers and
growers are key factors in the development and application of closed greenhouses
(Dieleman and Hemming 2011; De Gelder et al. 2012a).
Closed and semi-closed greenhouses with aquifer, heat pump and ATU have
obvious advantages in energy saving and production increase, but the application has
not been as wide as expected (De Zwart 2012). One of the reasons is the fixed
investment cost for drilling to reach the aquifers, ATU and heat pump. As mentioned
above, growers need several years to learn to fully exploit the new system. The profit
from increased production and reduction in energy consumption might not be able to
compensate for the investment costs (Ruijs et al. 2010). In addition, Combined Heat
and Power (CHP) are commonly used in Dutch greenhouse. Growers purchase natural
gas, by burning natural gas CHP generates electricity and heat (reject heat of the CHP
engine). The heat can be used for greenhouse heating and surplus electricity, after
fulfilling greenhouse electricity requirement, can be sold to the public grid. The CO2
that is produced by burning natural gas is used for CO2 enrichment of the greenhouse.
Investment in CHP is attractive because of the relatively low natural gas price and
good infrastructure for selling the electricity to the public grid (Breukers et al. 2008;
De Zwart 2012). However, investment in CHP is not as interesting anymore as it was
5-10 years ago, since the price of natural gas increased from 0.16 €m-3
in 2000, to
0.21 €m-3
in 2015, and estimated to be about 0.28 €m-3
in 2030 (Schoots et al. 2016),
while electricity price was 0.22 €kwh-1
in 2007 but decreased to around 0.12 €kwh-1
in 2014 (Eurostat 2016).
The next generation greenhouse cultivation
The knowledge obtained from closed greenhouses is currently being applied in
open greenhouses (De Gelder et al. 2012a; Schuddebeurs et al. 2015; Persoon et al.
2016). This knowledge has been used in the development of the concept of the next
generation greenhouse cultivation. This concept strives to reduce the energy
consumption for heating without reducing yield and quality of the produce (De Gelder
et al. 2012b), at much lower investment costs than the closed greenhouses. The main
elements of this concept are 1) Improving insulation by application of multiple
screens; 2) Controlling air humidity by forced ventilation. 3) Temperature integration
by accepting higher temperature at high radiation and lowering night temperature. 4)
Adjustment of the production plan by shifting planting date from December to
January; 5) Reducing ventilation to retain CO2 in the greenhouse (by fogging the
temperature is reduced, which diminishes the need for window opening); 6) Using a
combination of heat pump and aquifer for energy storage and active cooling. This
concept required commercial availability and modular applicability of techniques. The
next generation concept has been tested on several crops such as tomato (De Gelder
and Dieleman 2012; Schuddebeurs et al. 2015), gerbera (De Gelder et al. 2014;
Persoon et al. 2016), Phalaenopsis (Kromwijk et al. 2012), and Cymbidium
(Raaphorst and Kromwijk 2012) and resulted in 42-50%, 40%, 14-18%, and 27%
energy conservation, respectively, while production and quality were maintained
compared to those of commercial growers.
Other innovations in the greenhouse for energy saving
Besides the development of closed and semi-closed greenhouses and the next
generation greenhouse cultivation concepts, a number of innovations are being
developed for greenhouse industry to reduce energy consumption while improving
production and product quality. Better understanding of crop physiology in
Chapter 6
94
combination with new technologies has significantly contributed to those innovations.
Dieleman and Hemming (2011) and Marcelis et al. (2014) summarized the most
recent innovations: double glass with antireflection coatings was used as greenhouse
cover to improve insulation without influence of light transmission (Hemming et al.,
2012); diffuse glass was used as greenhouse roof cover to have uniform horizontal
and vertical light distribution in the greenhouse, higher photosynthesis at the middle
of the canopy and less photo inhibition and consequently higher production (Li et al.
2015; Dueck et al. 2012); LED light, which has higher efficiency in converting
electricity into light than HPS lamp, was used as supplement lighting for greenhouse
cultivation (Dieleman et al. 2016; Trouwborst et al. 2010). Researchers will continue
to strive for lower energy consumption in greenhouses in different ways.
General discussion
95
References
Bakker, J.C., 1991. Analysis of humidity effects on growth and production of
glasshouse fruit vegetables. PhD thesis of Wageningen University. 155pp.
Bakker, J. C., De Zwart, H.F., Campen, J.B., 2006. Greenhouse cooling and heat
recovery using fine wire heat exchangers in a closed pot plant greenhouse: design
of an energy producing greenhouse. Acta Horticulturae. 719: 263-270.
Bernacchi, C.J., Singsaas, E.L., Pimentel, C., Portis, A.R.J., Long, S.P., 2001.
Improved temperature response functions for models of Rubisco-limited
photosynthesis. Plant, Cell Environment. 24: 253–259.
Bertin, N., Guichard, S., Leonardi, C., Longuenesse, J. J., Langlois, D., 2000.
Seasonal evolution of the quality of fresh glasshouse tomatoes under
Mediterranean conditions, as affected by air vapour pressure deficit and plant
fruit load. Annals of Botany. 85: 741-750.
Besford, R.T., Ludwig, L.J., Withers, A.C., 1990. The greenhouse effect: Acclimation
of tomato plants growing in high CO2, photosynthesis and Ribulose-1, 5-
Bisphosphate carboxylase protein. Journal of Experimental Botany. 41: 925-931.
Bot, G., van de Braak, N., Challa, H., Hemming, S., Rieswijk, T., van Straten, G.,
Verlodt, I., 2005. The solar greenhouse: state of the art in energy saving and
sustainable energy supply. Acta Horticulturae. 691: 501-508.
Breukers, A., Hietbrink, O., Rujis, M. N.A., 2008. The power of dutch greenhouse
vegetable horticulture. An analysis of the private sector and its institutional
framework. LEI Wageningen UR, Den Haag. Report No. 2008-049. 114pp.
Buchholz, M., Jochum, P., Zaragoza, G., 2005. Concept for water, heat and food
supply from a closed greenhouse-The watergy project. Acta Hortculturae. 691:
509-516.
Bunce, J.A., 2001. Seasonal patterns of photosynthetic response and acclimation to
elevated carbon dioxide in field-grown strawberry. Photosynthesis Research. 68:
237–245.
Campen, J.B., Kempkes, F.L.K., Sapounas, A.A., 2008. Klimaat “Kas zonder gas”.
Report 1001. Wageningen UR Greenhouse Horticulture, Wageningen, The
Netherlands. 27pp.
Cannell, M.G.R., Thornley, J.H.M., 1998. Temperature and CO2 responses of leaf and
canopy photosynthesis: a clarification using the non-rectangular hyperbola model
of photosynthesis. Annals of Botany. 14: 729–739.
Chen, G.Y., Yong, Z.H., Liao, Y., Zhang, D.Y., Chen, Y., Zhang, H.B., Chen, J., Zhu,
J.G., Xu, D.Q., 2005. Photosynthetic acclimation in rice leaves to free-air CO2
enrichment related to both ribulose-1,5-bisphosphate carboxylation limitation and
ribulose-1,5-bisphosphate regeneration limitation. Plant Cell Physiology. 46:
1036–1045.
Dannehl. D., Huber. C., Rocksch, T., Huyskens-Keil, S., Schmidt, U., 2012.
Interactions between changing climate conditions in a semi-closed greenhouse
and plant development, fruit yield, and health-promoting plant compounds of
tomatoes. Scientia Horticulturae. 138: 235–243.
Dannehl, D., Josuttis, M., Ulrichs, C., Schmidt, U., 2014. The potential of a confined
closed greenhouse in terms of sustainable production, crop growth, yield and
valuable plant compounds of tomatoes. Journal of Applied Botany and Food
Quality. 87: 210 – 219
Dannehl, D., Schuch, I., Schmidt, U., 2013. Plant production in solar collector
greenhouses - Influence on yield, energy use efficiency and reduction in CO2
emissions. Journal of Agricultural Science. 5: 34-45.
Chapter 6
96
De Gelder, A., Janse, J., Lagas, P., 2008. Teelt komkommer in een geconditioneerde
kas. Report No. 529. Wageningen UR Greenhouse Horticulture, Wageningen,
The Netherlands. 33pp.
De Gelder, A., Dieleman, J.A., 2012. Validating the concept of the next generation
greenhouse cultivation: an experiment with tomato. Acta Hortculturae. 952: 545-
550.
De Gelder, A. de, Heuvelink, E., Opdam, J.J.G., 2005. Tomato yield in a closed
greenhouse and comparison with simulated yields in closed and conventional
greenhouses. Acta Hortculturae. 691: 549-552.
De Gelder, A., Dieleman, J.A., Bot, G.P.A., Marcelis, L.F.M., 2012a. An overview
of climate and crop yield in closed greenhouses. The Journal of Horticultural
Science & Biotechnology. 87: 193-202.
De Gelder, A., Poot, E.H., Dieleman, J.A., De Zwart, H.F., 2012b. A concept for
reduced energy demand of greenhouses: the next generation greenhouse
cultivation in the Netherlands. Acta Hortculturae. 952: 539-544.
De Gelder, A., Warmenhoven, M. and Dieleman, J.A., 2014. Sustainable gerbera
production realised with the next generation greenhouse cultivation.
ActaHortculturae. 1037: 701-708.
De Koning, A.N.M., 1994. Development and dry matter distribution in glasshouse
tomato: a quantitative approach. PhD Thesis Wageningen Agricultural University.
240pp.
De Zwart, H.F., 2008. Overall energy analysis of (semi)closed greenhouses. Acta
Horticulturae. 801: 811-818.
De Zwart, H.F., 2012. Lessons learned from experiments with semi-closed
greenhouse. Acta Horticulturae 952: 583-588.
Dik, A.J., Wubben, J.P., 2007. Epidemiology of Botrytis cinerea diseases in
greenhouse. Chapter 17. Y. Elad et al. (eds.) Botrytis: Biology, Pathology and
Control. 319-333.
Dieleman, A., De Gelder, A., Eveleens, B., Elings, A., Janse, J., Lagas, P., T. Qian,
Steenhuizen, J., Meinen, E., 2009. Tomaten telen in een geconditioneerde kas:
groei, productie en onderliggende processen. Nota 633, Wageningen UR
Greenhouse Horticulture. 54 pp.
Dieleman, A., de Gelder, A., Janse, J., Lagas, P., Eveleens, B., Qian, T., Elings, A.,
Steenhuizen, J., Stanghellini, C., Nederhoff, E., Savvides, A., Farneti, B., de
Visser, R., Woltering, E., Marcelis, L.F.M., 2012. Verticale
temperatuurgradiënten in geconditioneerde kassen. Effecten op groei,
ontwikkeling en onderliggende processen bij tomaat. Rapport GTB-1122,
Wageningen UR Glastuinbouw. 125 pp.
Dieleman, J.A., Hemming, S., 2011. Energy saving: from engineering to crop
management. Acta Horticulturae. 893: 65-73
Dieleman, J.A., de Visser, P.H.B., Vermeulen, P.C.M., 2016. Reducing the carbon
footprint of greenhouse grown crops: re-designing LED-based production
systems. Acta Horticulture. 1134: 395-402.
Dueck, T.A., Janse, J., Li, T., Kempkes, F.L.K., Eveleens-Clark, B.A., 2012.
Influence of diffuse glass on the growth and production of tomato. Acta
Horticulturae. 956: 75-82.
Eden, M.A., Hill, R.A., Beresford, R., Stewart, A., 1996.The influence of inoculum
concentration, relative humidity, and temperature on infection of greenhouse
tomatoes by Botrytis cinerea. Plant Pathology. 45: 795-806.
Elings, A., Kempkes, F.L.K., Kaarsemaker, R.C., Ruijs, M.N.A., van den Braak, N.J.,
General discussion
97
Dueck, T.A., 2005. The energy balance and energy-saving measures in
greenhouse tomato cultivation. Acta Horticulturae. 691: 67-74.
Elings, A., Meinen, E., Campen, J., de Gelder, A., 2007. The photosynthesis repsonse
of tomato to air circulation. Acta Horticulturae. 761: 77-84.
Eurostat, 2016. Accessed on 12 April 2016,
http://ec.europa.eu/eurostat/tgm/table.do?tab=table&init=1&language=en&pcode
=ten00117&plugin=1
Fanourakis, D., Heuvelink, E., Carvalo, S.M.P., 2011. A comprehensive analysis of
the physiological and anatomical components involved in higher water loss rates
after leaf development at high humidity. Journal of Plant Physiology. 170: 890-
898.
Farquhar, G.D., von Caemmerer, S., Berry, J.A., 1980. A biochemical model of
photo-synthetic CO2 assimilation in leaves of C3 species. Planta. 149: 78–90.
Farneti, B., Schouten, R. E., Qian, T., Dieleman, J.A., Tijskens, L.M.M., Ernst J.W.,
E.J., 2013. Greenhouse climate control affects postharvest tomato quality.
Postharvest Biology and Technology. 86: 354-361.
Gieling, T.H., Campen, J.B., Dieleman, J.A., Garcia V. N., Janssen, H.J.J., Kempkes,
F.L.K., Kromwijk, J.A.M., Raaphorst, M.G.M., 2011. Monitoring of climate
variables in semi-closed greenhouses. Acta Horticulturae. 893: 1073 - 1080.
Grisey, A., Grasselly, D., Rosso, L., D'Amaral, F., Melamedoff, S., 2011. Using heat
exchangers to cool and heat a closed tomato greenhouse: application in the south
of France. Acta Horticulturae. 893:405-411
Harker, F.R., Marsh, K.B., Young, H., Murray, S.H., Gunson, F.A., Walker, S.B.,
2002. Sensory interpretation of instrumental measurements 2: sweet and acid
taste of apple fruit. Postharvest Biology and Technology 24, 241–250.
Hemming, S., Kempkes F.L.K., Janse, J., 2012. New greenhouse concept with high
insulating double glass and new climate control strategies – Modelling and first
results from a cucumber experiment. Acta Horticulturae. 952: 231-239.
Heuvelink, E., 1995. Effect of plant density on biomass allocation to the fruits in
tomato (Lycopersicon esculentum Mill). Scientia Horticulturae. 64: 193-201.
Heuvelink, E., 1996. Tomato growth and yield: quantitative analysis and synthesis.
PhD thesis Wageningen University. 326pp.
Heuvelink, E., Bakker, M., Marcelis, L.F.M., Raaphorst, M., 2008. Climate and yield
in a closed greenhouse. ActaHorticulturae. 801:1083-1092.
Higashide, T., Heuvelink, E., 2009. Physiological and morphological changes over the
past 50 years in yield components in tomato. Journal of American Society for
Horticultural Science. 134: 460–465.
Hoes, H. , Desmedt, J., Goen, K., 2008. The GESKAS project, closed greenhouse as
energy source and optimal growing environment. Acta Horticulturae. 801: 1355-
1362.
Islam, S., Matsui, T., Yoshida, Y., 1996. Effect of carbon dioxide enrichment on
physico-chemical and enzymatic changes in tomato fruits at various stages of
maturity. Scientia Horticulturae 65: 137-149
Kas Als Energiegron, 2017. https://www.kasalsenergiebron.nl/over-ons/resultaten.
retrieved December 2016.
Kaukoranta, T.T., Näkkilä, J., Särkkä, L., Jokinen, K., 2014. Effects of lighting, semi-
closed greenhouse and split-root fertigation on energy use and CO2 emissions in
high latitude cucumber growing. Agricultural and Food Science. 23: 220-235.
Chapter 6
98
Kläring, H.P., Krumbein, A., 2013.The Effect of constraining the intensity of solar
radiation on the photosynthesis, growth, yield and product quality of tomato.
Journal of Agronomy and Crop Science. 199: 315-359.
Kromwijk, A., Baas, R., Kempkes, F., van Noort, F., 2012. Energiezuiniger
watergeefmethode Phalaenopsis. Stichting Dienst Landbouwkundig Onderzoek
(DLO) onderzoeksinstituut Wageningen UR Glastuinbouw. Rapport GTB-1179.
44pp.
Li, T., Heuvelink, E., Marcelis, L.F.M., 2015. Quantifying the source-sink balance
and carbohydrate content in three tomato cultivars. Frontiers in Plant Science. 6:
416.
Li, Y., Stanghellini, C., Challa, H., 2001. Effect of electrical conductivity and
transpiration on production of greenhouse tomato (Lycopersicon esculentum L.).
Scientia Horticulturae. 88: 11-29.
Luomala, E.M., Särkkä, L., Kaukoranta, T., 2008. Altered plant structure and greater
yield of cucumber grown at elevated CO2 in a semi-closed greenhouse. Acta
Horticulturae. 801: 1339-1346.
Marcelis, L.F.M., 1992. The dynamics of growth and dry matter distribution in
cucumber. Annals of Botany. 69: 487-492.
Marcelis, L.F.M., 1993a. Effect of assimilate supply on the growth of individual
cucumber fruits. Physiologia Plantarum. 87: 313-320.
Marcelis, L.F.M., 1993b. Fruit growth and biomass allocation to the fruits in
cucumber. 2. Effect of irradiance. Scientia Horticulturae. 54: 123-30.
Marcelis, L.F.M., 1996. Sink strength as a determinant of dry matter partitioning in
the whole plant. Journal of Experimental Botany. 47, 1281–1291.
Marcelis, L.F.M., Baan Hofman-Eijer, L.R., 1993. Effect of temperature on the
growth of individual cucumber fruits. Physiologia Plantarum. 87: 321-328.
Marcelis, L.F.M., De Pascale, S., 2009. Crop management in greenhouses: adapting
the growth conditions to the plant needs or adapting the plant to the growth
condition? Acta Horticulturae. 807:163-174
Marcelis, L.F.M., Buwalda, F., Dieleman, J.A., Dueck, T.A., Elings, A., de Gelder, A.,
Hemming, S., Kempkes, F.L.K. Li T., van Noort, F., De visser, P.H.B., 2014.
Innovations in crop production: a matter of physiology and technology. Acta
Horticulturae. 1037: 39-46.
Nederhoff, E.M., 1994. Effect of CO2 concentration on photosynthesis, transpiration
and production of greenhouse fruit vegetable crops. PhD thesis Wageningen
University. 213pp.
Ogren, E., Evans, J.R., 1993. Photosynthetic light-response curves. I. The influence of
CO2 partial pressure and leaf inversion. Planta. 189: 182-190.
Opdam, J.J.G., Schoonderbeek, G.G., Heller, E.M.B., 2005. Closed greenhouse: a
starting point for sustainable entrepreneurship in Horticulture. Acta Horticulturae.
691:517-524.
Peet, M.M., Huber, S.C., Patterson, D.T., 1986. Acclimation to high CO2 in
monoecious cucumbers: II. Carbon exchange rates, enzyme activities, and starch
and nutrient concentrations. Plant Physiology. 80: 63–67.
Pérez, P., Zita, G., Morcuende, R., Martínez-Carrasco, R., 2007. Elevated CO2 and
temperature differentially affect photosynthesis and resource allocation in flag
and penultimate leaves of wheat. Photosynthetica. 45: 9–17.
Persoon, S., van Weel, P.A., de Gelder, A., 2016. Eindrapportage HNT Gerbera : de
gerberateler aan zet voor HNT valorisatie. Wageningen UR Greenhouse
Horticulture. 22pp.
General discussion
99
Raaphorst, M.G.M., 2011. Teeltbegeleiding geconditioneerde tomaat. Report 1063.
Wageningen UR Greenhouse Horticulture, Wageningen, The Netherlands. 54pp.
Raaphorst, M.G.M., Kromwijk, A., 2012. Perspectief HNT voor Cymbidium.
Stichting Dienst Landbouwkundig Onderzoek (DLO) onderzoeksinstituut
Wageningen UR Glastuinbouw. Rapport GTB-1174. 26pp.
Riga, P., Anza, M., Garbisu, C., 2008. Tomato quality is more dependent on
temperature than on photosynthetically active radiation. Journal of the Science of
Food and Agriculture. 88: 158-166.
Ruijs, M.N.A., Raaphorst, M.G.M. Dijkxhoorn, Y., 2010. Meer mogelijkheden voor
energiezuinige teeltconditionerling; Economische perspectieven (More
opportunities for low-energy crop conditioning; Economic perspectives). LEI
Wageningen UR, Den Haag. 56pp.
Sarlikioti, V., de Visser, P. H.B. , Marcelis, L.F.M., 2011a. Towards a 3D structural
tomato model for calculating light interception. Acta Horticulturae. 893:721-728.
Sarlikioti, V., de Visser, P. H. B., Buck-Sorlin, G. H., Marcelis, L. F. M., 2011b. How
plant architecture affects light absorption and photosynthesis in tomato: towards
an ideotype for plant architecture using a functional – structural plant model.
Annuals of Botany. 108(6): 1065-73.
Schoots, K., Hekkenberg, M., Hammingh, P., 2016. Netherlands National Energy
Outlook 2016 Summary. Report ECN-O--16-042. 15 pp.
Schuddebeurs, L., Grootscholten, M., van der Burg, R., van der Ven, E., de Gelder, A.,
Arkestijn, P., Maat, R., 2015. Het nieuwe telen: Energiezuinig komkommers
telen. Bleiswijk, the Netherlands. 44 pp.
Sharkey, T.D., Bernacchi, C.J., Farquhar, G.D., Singsaas, E.L., 2007. Fitting
photosynthetic carbon dioxide response curves for C3 leaves. Plant Cell and
Environment. 30: 1035–1040.
Trouwborst, G., Oosterkamp, J., Hogewoning, S.W., Harbinson, J., van Ieperen, W.,
2010. The responses of light interception, photosynthesis and fruit yield of
cucumber to LED-lighting within the canopy. Physiologia Plantarum. 138: 289-
300.
Yamori, W., Evans, J.R., von Caemmerer, S., 2010. Effects of growth and
measurement light intensities on temperature dependence of CO2 assimilation
rate in tobacco leaves. Plant, Cell and Environment. 33: 332-343.
Zaragoza, G., Buendía, D., Meca, D., Pérez-Parra, J., Buchholz, M., 2008.
Experiences in cultivation inside the watergy prototype of a closed greenhouse
for semi-arid regions. Acta Horticulturae. 801: 773-780.
Zhang, D.Y., Chen, G.Y., Chen, J., Yong, Z.H., Zhu, J.G., Xu, D.Q., 2009.
Photosynthetic acclimation to CO2 enrichment related to ribulose-1,5-
bisphosphate carboxylation limitation in wheat. Photosynthetica. 47: 152–154.

Summary
101
SUMMARY
Climate change and resource scarcity raised people’s concern about environmental
protection and energy saving. In the greenhouse horticulture sector, various concepts, aiming
at sustainability and energy saving, were developed in the last decades. One of these concepts
is the closed greenhouse, in which ventilation by window opening is replaced by mechanical
cooling. A closed greenhouse has no window ventilation. Air is cooled and dehumidified by
an air treatment unit, which mainly takes place in summer. The air treatment unit contains a
heat exchanger and connects to an underground aquifer as well as to a ventilator. The
ventilator sucks air from inside the greenhouse into the air treatment unit and distributes the
cooled and dehumidified air back to the greenhouse. For cooling in summer, the cold water is
pumped up from the aquifer. The surplus heat from the greenhouse is absorbed by the cold
water and stored in the aquifer. This stored heat is used in winter to heat the greenhouse. A
semi-closed greenhouse has a smaller cooling capacity than a closed greenhouse. Window
ventilation is combined with active cooling when the temperature is too high to be managed
by the active cooling system.
When the concept of closed greenhouse was introduced, researchers initially focused on
its economic and technical aspects. During the development of the closed greenhouse concept,
scientists and growers realized that their knowledge on crop physiological processes under
such new climate conditions was insufficient to fully explore the possibilities of climate
control in the closed greenhouse. Closed greenhouses created new climate conditions for
crops, for instance, the combination of high CO2 concentration and high irradiance, which is
not possible in an open greenhouse, due to window ventilation. CO2 concentration can be high
continuously during the whole growing season in a closed greenhouse. There are vertical
gradients in temperature and vapour pressure deficit (VPD) throughout the canopy in a closed
greenhouse. Therefore, the effects of these new climates and their combination on crop
growth and development needed to be investigated.
This thesis focuses on the crop physiology in closed and semi-closed greenhouses,
aiming to study the effects of these new climate conditions on crop growth, development and
underlying processes.
In Chapter 2, the effect of active cooling on greenhouse climate, in terms of stability,
gradient and average levels was analysed. Crop growth and production in closed and semi-
closed greenhouses were quantified and compared to those of an open greenhouse. An
experiment with a tomato crop was conducted in a fully closed greenhouse with 700 W m-2
cooling capacity, two semi-closed greenhouses with 350 W m-2
and 150 W m-2
cooling
capacity, respectively, and an open greenhouse. The higher the cooling capacity, the more
independent of outside climate the greenhouse climate was.
Cumulative production in the semi-closed greenhouses with 350 W m-2
and 150 W m-2
cooling capacity was 10% (61 kg m-2
) and 6% (59 kg m-2
) higher than that in the open
greenhouse (55 kg m-2
), respectively. Cumulative production in the closed greenhouse was 14%
higher than in the open greenhouse in week 29 after planting but at the end of the experiment.
The cumulative increase was only 4% due to Botrytis. Model calculations showed that the
production increase in the closed and semi-closed greenhouses was explained by higher CO2
concentration.
As a high CO2 concentration is one of the most remarkable differences in climate
between the closed and open greenhouse, Chapter 3 focuses on CO2. Photosynthetic and
morphological acclimation to high CO2 has been found in many plant species with feedback
inhibition being the main mechanism to explain this. Chapter 3 investigated the occurrence
of photosynthetic and morphological acclimation to high CO2 concentration in the semi-
closed greenhouse. The hypothesis was that photosynthetic and morphological acclimation to
Summary
102
elevated CO2 concentration only occurred in plants with low sink strength. An experiment
was carried out with tomato plants with varying fruit loads in a semi-closed greenhouse and a
conventional modern greenhouse. The results showed that photosynthetic acclimation to
elevated CO2 concentration only occurred when the number of fruits was considerably
reduced. High CO2 as well as fruit removal reduced the specific leaf area. Reduction in
photosynthesis rate was associated with, but not caused by reduced stomatal conductance. The
increase of dry matter production in the semi-closed greenhouse was mainly explained by a
higher CO2 concentration compared to the open greenhouse. The results suggest that high
CO2 concentrations in the semi-closed greenhouse do not cause feedback inhibition in high
producing crops, because the plants have sufficient sink organs (fruits) to utilise all
assimilates.
Vertical temperature and VPD gradients are typical for closed and semi-closed
greenhouses. In Chapter 4.1 the effects of the positioning of the inlet of cooled and
dehumidified air on the vertical temperature and VPD gradients in the semi-closed
greenhouses were analyzed. Tomato crops were grown year-round in four semi-closed
greenhouses with cooled and dehumidified air blown into the greenhouses from below or
above the crop. Cooling below the canopy induced vertical temperature and VPD gradients.
The temperature at the top of the canopy was over 5 °C higher and the VPD was 0.7 kPa
lower than at the bottom, when outside solar radiation was higher than 250 J cm-2
h-1
. The
seasonal and diel patterns of vertical temperature gradients and VPD gradients were studied.
The vertical temperature gradients and VPD gradients correlated with outside radiation and
outside temperature. Chapter 4.2 investigated the effects of the vertical gradients of
temperature and VPD on crop growth and development. Despite the occurrence of vertical
temperature gradients, plant growth and fruit yields were mostly unaffected. Leaf and truss
initiation rates did not differ between treatments, since air temperatures at the top of the
canopy were comparable. The only observed response of plants to the vertical temperature
gradient was the reduced rate of fruit development in the lower part of the canopy. This
resulted in a longer time between anthesis and fruit harvest in the treatment with a vertical
temperature gradient, and an increase in the average fruit weight in summer. However, total
fruit production over the whole season was not affected. These results are important when
designing greenhouses, as well as heating and cooling systems for greenhouses.
The effects of the climate factors light, CO2 concentration, temperature, and humidity
on leaf photosynthesis were investigated in Chapter 5. The photosynthesis model of Farquhar,
von Caemmerer and Berry (FvCB) was modified to predict light dependency of the
carboxylation capacity (Vc) and to improve the prediction of temperature dependency of the
maximum carboxylation capacity (Vcmax) and the maximum electron transport rate (Jmax). The
FvCB model was modified by adding a sub-model for Ribulose-1,5-bisphosphate carboxylase
(Rubisco) activation. Values of parameters for temperature dependency of Vcmax and Jmax were
validated and adjusted based on data of the photosynthesis response to temperature. Parameter
estimation was based on measurements under a wide range of environmental conditions,
providing parameters with broad validity. The simultaneous estimation method and the
nonlinear mixed effects model were applied to ensure the accuracy of the parameter
estimation. The FvCB parameters, Vcmax, Jmax, α (the efficiency of light energy conversion), θ
(the curvature of light response of electron transport), and Rd (the non-photorespiratory CO2
release) were estimated and validated on a dataset from two other years. Observations and
predictions matched well (R2=0.94). We conclude that incorporating a sub-model of Rubisco
activation improved the FvCB model through predicting light dependency of carboxylation
rate; and that estimating Vcmax, Jmax, α, θ, and Rd requires data sets of both CO2 and light
response curves. With these parameters derived from the data obtained in closed and semi-
Summary
103
closed greenhouse, leaf photosynthesis rate could be estimated under a wide range of climate
conditions.
At the end of the thesis, Chapter 6, the results were integrated and discussed. The yield
increase in a closed greenhouse, compared to that in an open greenhouse was analyzed based
on physiological and developmental processes. In addition, sustainability of the system was
discussed in terms of energy, and compared to an open greenhouse. Applicability of the
closed greenhouse concept and other innovations for greenhouse energy conservation were
summarized.

Acknowledgements
105
ACKNOWLEDGEMENTS
This PhD has been an almost-ten-years journey since November 2007. Amazing! It is
much longer than it should be, and impossible to be finished without the input of many people
who play important roles along the road. Through this journey I became more critical,
knowledgeable and confident as a researcher, but also a wife and a mother. Writing a PhD
thesis is a challenge, but writing acknowledgement is even more challenging, because
sometimes words are so powerless to express gratitude.
First of all, I would like to thank my promoter Prof. dr. Leo Marcelis. Leo, I still
remember that you called me five minutes after our interview in 2007, offering me the
opportunity to do this PhD. I know it was out of your expectation that I finalized this thesis in
2017. Although I did not always listen to your advice, I would like you to know that without
your support, patience, and understanding, I could not make it!
I also would like to thank my co-promoters Dr. Anja Dieleman and Dr. Anne Elings for
supporting me all the time. Anja, what I learned from you is not only the scientific knowledge,
but also how to work as a woman in the horticultural world, where majority of the staff are
men. Anne, although I often said that we have a generation gap, your critical and precise way
of working impressed me and showed me how a scientist should be.
Many thanks to my former PhD mates who were working together in Wageningen: Vaia
Sarlikioti, Andreas Savvides, Aaron Velez-Ramirez, Pavlos Kalaitzoglou, Julie
nne Fanwoua, Dimitrios Fanourakis, Fleur Sterk, Okello Ongom, Bram Vanthoor,
Kangmo Lee, Elias Kaiser, Li Tao, and René Kuijken. You all created a very nice
environment at work and after work. The scientific discussions we had were inspiring and the
non-scientific conversations were really unrestrained. Vaia, thank you not only for sharing
your experience of doing a PhD with me, but also for shopping together, going to the hair
dresser together, and all the time we spent together after work. Andreas and Aaron, it was
always nice to hear you come to me, saying “it’s time for lunch”, so that I could forget about
the science for a while and enjoy the lunch time with you, and the coffee after lunch of course.
I would like to thank all people from the Horticulture and Product Physiology Group
(formerly Horticultural Production Chains): Prof. dr. Olaf van Kooten, Prof. dr. Ernst
Woltering, Dr. Wim van Ieperen, Dr. Uulke van Meeteren, Dr. Ep Heuvelink, Dr. Jeremy
Harbinson, and all staff and students. Olaf, talking with you always made me feeling
confident and positive. Ernst and Wim, thank you for supervising me during my master thesis,
during which, I developed my research capability and was motivated to continue as PhD in
horticulture. Penny Pan and Robert Biemans, thank you for assisting me during the
greenhouse experiments in Bleiswijk. Thanks to all the members of the FLOP meetings for all
the good and creative criticism on my manuscripts.
Thank all the former colleagues from Wageningen University & Research, Business
Unit of Greenhouse Horticulture in Wageningen and in Bleiswijk: Arie de Gelder, Johan
Steenhuizen, Peter Lagas, Jan Janse, Barbara Eveleens-Clark, Esther Meinen, Mary
Warmenhoven, Piet Koornneef, Dr. Pieter de Visser, Dr. Gerhard Buck-Sorlin, Dr. Feije de
Zwart, and Dr. Cecilia Stanghellini. In this group, theory and practice are actively combined,
supplying me a unique platform to learn both. Johan, I really appreciate your effort for driving
up and down between Wageningen and Bleiswijk to support me with all the measurements. I
even asked you to measure photosynthetic rate at four AM in the morning in the greenhouse
with me and you didn’t refuse. Peter and Arie, thank you for teaching me all the practical
things in the greenhouse.
Thanks Delphy, the company I’m working at since 2012. Especially thanks Aad van den
Berg. Studying greenhouse horticulture in the Netherlands is really useful for me, but bringing
106
the knowledge back to China makes it more meaningful. Aad, thank you for offering me the
opportunity to be the bridge between the Netherlands and China for horticulture.
I would like to thank all the friends who I met in the Netherlands: Sandy Wang, Tong
Hao, Pan shumei, Ye Hui, Eva Wang, Kohei Ishiguro, Leilei Chen, Henry Gouvernante,
Harriët Snoek, Paul van Genuchten, Liu Cheng, Shital Dixit, Paula Ximena, Zhang Ningwen,
Gao Liping, Wan Xi, Bao Jing, Chen Xiangming, Deng Yimin, Pan Xiao, Shao Jia, Dalia
Carvalho, Hong Minyan. Thank you for being part of my life in the Netherlands during these
years.
Thank you all my dear friends and relatives in China, especially thank Maggie Chi,
Lydia Zhou, Wang Xiao, George Cai, Eric Zhang, Dai Xiaohong, Zhang He, and Xixi Liang
for encouraging me to finalizing the PhD thesis. Maggie, you always told me that you
completely had no idea what I was doing for my PhD, but your non-scientific support was
essential for me to finalize this thesis. Lydia, thank you for respecting me as a horticultural
expert to teach you how to grow tomato in your balcony, although sometimes I had no clue
what happed to your tomato plants at all. Xixi, thank you for designing the cover of this thesis
for me, I never knew before that scientist and artist could communicate properly as well.
I would like to thank my Dutch family Wim de Jong, Lies de Jong, Lenneke de Jong,
Suzanna Arensman-de Jong, Jenny de Jong, Willem de Jong, Dennis van Breemens, Jan-
Willem Arensman, Roger Koper. I came to the Netherlands in 2005 as a foreigner, and you
all make me feel at home here. Lies and Wim, you treat me as your daughter, and made me
fall in love with this small country. It’s hard to image a life in the Netherlands without de
Jong family.
Words are not always enough to express my appreciation to my parents and sister. Papa,
thank you for never doubting, always trusting, and always supporting me in your own calm
way. I’m lucky to have a sweet father, otherwise life would be very tough for a child if both
parents were strict. Mama, I know I was not the listen-to-mom daughter, but to be honest, I
realized that I just want to become like you: wise and independent. You are (too) strict and
sometimes became angry or even disappointed with me. However, I have the confidence that I
can always make you proud of me at the end, finalizing this thesis is an example. Liang, my
dear little sister, thank you for always being besides me, and telling me “you can make it”.
Thank my parents-in-law for their kindness, caring, and understanding. Last but not least, I
would like to give my gratitude to my husband and daughter. O.J., you are the person who
understands me even better than myself. You always say there are three kinds of human being
in the world: man, woman, and female PhD. I would like to correct it by adding the fourth
kind: the husband of the female PhD. Lai, thank you for coming to me during my PhD
journey. Sorry for that sometimes I could not always be with you, due to the work for this
thesis. I know you are still too young to read it, but thank you for your contribution to
selecting the colour of the cover page.
This is the end of the thesis but the colourful journey continues.
Curriculum vitae
107
CURRICULUM VITAE
Tian Qian (Didi) was born on February 5th
1983 in Wenzhou, Zhejiang Province of
China. In 2001 she finished her secondary education in her home town. At the same year she
started her study in Zhejiang University, College of Agriculture and Biotechnology, where
she obtained her Bachelor degree with the thesis titled “Research on the molecular basis of
heterosis by constructing and analyzing the genetic linkage map of Brassica campestris L.”.
In August 2005 she arrived in Wageningen and started her MSc study in the Master program
at the Horticultural Product Physiology Group of Wageningen University. During the
internship of the Master program, she did research work in the Centre for Native Floriculture,
School of Land, Crop & Food, University of Queensland in Australia. In 2007 she obtained
her Master degree in Plant Sciences with the thesis titled “Biochemical and structural changes
as affected by caspase inhibitor during tracheary element formation in suspension culture of
Zinnia elegans”. In November 2007 she started her PhD project at the Horticultural Product
Physiology Group of Wageningen University and Wageningen University & Research,
Business Unit Greenhouse Horticulture. The PhD research was about crop growth and
development in closed and semi-closed greenhouses, which resulted in this thesis. Since May
2012, she works as area manager China in Delphy B.V. in the Netherlands.

List of publications
109
LIST OF PUBLICATIONS
Papers published in scientific journals:
Qian, T., Dieleman, J.A., Elings, A., de Gelder, A., Marcelis, L.F.M., 2015. Response of
tomato crop growth and development to a vertical temperature gradient in a semi-
closed greenhouse. Journal of Horticultural Science & Biotechnology. 90 (5): 578–584.
Qian, T., Dieleman, J.A., Elings, A., Marcelis, L.F.M., 2012. Leaf photosynthetic and
morphological responses to elevated CO2 concentration and altered fruit number in the
semi-closed greenhouse. Scientia Horticulturae. 145: 1–9.
Qian, T., Elings, A., Dieleman, J.A., Gort, G., Marcelis L.F.M., 2012. Estimation of
photosynthesis parameters for a modified Farquhar–von Caemmerer–Berry model
using simultaneous estimation method and nonlinear mixed effects model.
Environmental and Experimental Botany. 82: 66– 73.
Qian, T., Dieleman, J.A., Elings, A., van Kooten O., Marcelis L.F.M., 2012. Vertical
temperature gradients in the semi-Closed greenhouses: occurrence and effects. Acta
Horticulturae. 927: 59-66.
Qian, T., Dieleman, J. A., Elings, A., van Kooten, O., Marcelis, L.F.M., van Kooten, O.,
2011. Comparison of climate and production in closed, semi-closed and open
greenhouses. Acta Horticulturae. 893: 807-814.
Farneti, B., Schouten, R.E., Qian, T., Dieleman, J.A., Tijskens, L.M.M., Woltering, E.J.,
2013. Greenhouse climate control affects postharvest tomato quality. Postharvest
Biology and Technology. 86: 354-361.
Damunupola, J.W., Qian, T., Muusers, R., Joyce, D.C., Irving, D.E., van Meeteren, U., 2010.
Effect of S-carvone on vase life parameters of selected cut flower and foliage species.
Postharvest Biology and Technology. 55: 66-69.
Twumasi, P., Iakimova, E.T., Qian, T., van Ieperen, W., Schel, J.H., Emons, A.M., van
Kooten, O., Woltering, E.J., 2010. Caspase inhibitors affect the kinetics and dimensions
of tracheary elements in xylogenic Zinnia (Zinnia elegans) cell cultures. BMC Plant
Biology. 10: 162-177.
Other publications:
Qian, T., Joyce, D., He, S., 2007. China’s ornamentals industry in ‘full bloom’. Australian
Flower Industry. 15: 10-11.
Dieleman, J.A., de Gelder, A., Eveleens-Clark, B.A., Elings, A., Janse, J., Lagas, P., Qian, T.,
Steenhuizen, J.W., Meinen, E., 2009. Tomaten telen in een geconditioneerde kas: groei,
productie en onderliggende processen. Nota 633. Wageningen UR Greenhouse
Horticulture. 53pp.
Eveleens-Clark, B.A., Dieleman, J.A., de Gelder, A., Elings, A., Janse, J., Qian, T., Lagas, P.,
Steenhuizen, J.W., 2009. Effecten van verneveling op groei en ontwikkeling van
tomaat : teelt van eind april tot eind augustus. Nota 643. Wageningen UR Greenhouse
Horticulture. 34pp.
List of publications
110
Dieleman, J.A., Qian, T., Elings, A., Marcelis, L.F.M., 2010. Crop physiology in
(semi-)closed greenhouses. Final report of the Transforum scientific project “SynErgy:
Monitoring and control system for conditioning of plants and greenhouse” (WP-066).
Report GTB-1051. Wageningen UR Greenhouse Horticulture. 18pp.
Dieleman, J.A., de Gelder, A., Janse, J., Lagas, P., Eveleens-Clark, B.A., Qian, T., Elings, A.,
Steenhuizen, J.W., Stanghellini, C., Nederhoff, E.M., Savvides, A., Farneti, B., de
Visser, R., Woltering, E.J., Marcelis, L.F.M., 2011. Verticale temperatuurgradiënten in
geconditioneerde kassen. Effecten op groei, ontwikkeling en onderliggende processen
bij tomaat. Report GTB-1122. Wageningen UR Greenhouse Horticulture. 142pp.
PE&RC Training and Education Statement
111
PE&RC Training and Education Statement
With the training and education activities listed below the PhD
candidate has complied with the requirements set by the C.T. de Wit
Graduate School for Production Ecology and Resource Conservation
(PE&RC) which comprises of a minimum total of 32 ECTS (= 22
weeks of activities)
Review of literature (4.5 ECTS)
- Development of closed and semi-closed greenhouses
Writing of project proposal (4.5 ECTS)
- Crop physiology and modelling in closed greenhouse
Post-graduate courses (7.5 ECTS)
- Advanced statistics; PE&RC (2008)
- Applied methods in crop physiology; Aarhus University (2009)
Deficiency, refresh, brush-up courses (3.9 ECTS)
- Greenhouse technology; Wageningen University (2008)
- Basic statistics; PE&RC (2008)
Competence strengthening / skills courses (2.1 ECTS)
- Information literacy, including EndNote; WGS (2007)
- PhD Competence assessment; WGS (2008)
- Techniques for writing and presenting a scientific paper; WGS (2008)
PE&RC Annual meetings, seminars and the PE&RC weekend (1.8 ECTS)
- PE&RC Weekend (2008)
- PE&RC Day (2008, 2009, 2010)
Discussion groups / local seminars / other scientific meetings (6 ECTS)
- Frontier Literature in Plant Physiology (FLOP) (2008-2012)
International symposia, workshops and conferences (5 ECTS)
- International symposium on high technology for greenhouse systems Greensys 2009; Quebec
City, Canada (2009)
- International symposium on greenhouse 2010 and soilless cultivation IHC 2010; Lisbon,
Portugal (2010)
Supervision of MSc students
- Robert Biemans: comparison between a conventional and (semi)-closed greenhouse with
respect to production and allocation of assimilates in tomato
- Ye Pan: a study on tomato performance under environmental conditions that create distinct
source-sink ratios
112
Sponsors
The research described in this thesis was financially supported by the Ministry of Economic
Affairs and the former Product Board for Horticulture within the framework of the research
programme “Kas als Energiebron” and by TransForum.
Thesis cover design: Xixi Liang
Printed by: Proefschriftmaken.nl


![poster 173ASA Tian 624 jkjiatian/posters/poster_173...Multi-dimensionalphonetic space for phonation contrasts. Poster presented at LabPhon13in 2012. [6] Qian, N., (1992). Dangdai wuyu](https://img.pdfslide.net/doc/110x75/5f52231adb38ab4f2066b6b6/poster-173asa-tian-624-jk-jiatianpostersposter173-multi-dimensionalphonetic.jpg)