Embed Size (px)
Citation preview

TIBCO Business Studio™ Simulation GuideSoftware Release 4.0November 2015
Two-Second Advantage®

Important Information
SOME TIBCO SOFTWARE EMBEDS OR BUNDLES OTHER TIBCO SOFTWARE. USE OF SUCHEMBEDDED OR BUNDLED TIBCO SOFTWARE IS SOLELY TO ENABLE THE FUNCTIONALITY(OR PROVIDE LIMITED ADD-ON FUNCTIONALITY) OF THE LICENSED TIBCO SOFTWARE. THEEMBEDDED OR BUNDLED SOFTWARE IS NOT LICENSED TO BE USED OR ACCESSED BY ANYOTHER TIBCO SOFTWARE OR FOR ANY OTHER PURPOSE.
USE OF TIBCO SOFTWARE AND THIS DOCUMENT IS SUBJECT TO THE TERMS ANDCONDITIONS OF A LICENSE AGREEMENT FOUND IN EITHER A SEPARATELY EXECUTEDSOFTWARE LICENSE AGREEMENT, OR, IF THERE IS NO SUCH SEPARATE AGREEMENT, THECLICKWRAP END USER LICENSE AGREEMENT WHICH IS DISPLAYED DURING DOWNLOADOR INSTALLATION OF THE SOFTWARE (AND WHICH IS DUPLICATED IN THE LICENSE FILE)OR IF THERE IS NO SUCH SOFTWARE LICENSE AGREEMENT OR CLICKWRAP END USERLICENSE AGREEMENT, THE LICENSE(S) LOCATED IN THE “LICENSE” FILE(S) OF THESOFTWARE. USE OF THIS DOCUMENT IS SUBJECT TO THOSE TERMS AND CONDITIONS, ANDYOUR USE HEREOF SHALL CONSTITUTE ACCEPTANCE OF AND AN AGREEMENT TO BEBOUND BY THE SAME.
This document contains confidential information that is subject to U.S. and international copyright lawsand treaties. No part of this document may be reproduced in any form without the writtenauthorization of TIBCO Software Inc.
TIBCO, Two-Second Advantage, TIBCO Enterprise Message Service, TIBCO Business Studio andTIBCO ActiveMatrix are either registered trademarks or trademarks of TIBCO Software Inc. in theUnited States and/or other countries.
All other product and company names and marks mentioned in this document are the property of theirrespective owners and are mentioned for identification purposes only.
THIS SOFTWARE MAY BE AVAILABLE ON MULTIPLE OPERATING SYSTEMS. HOWEVER, NOTALL OPERATING SYSTEM PLATFORMS FOR A SPECIFIC SOFTWARE VERSION ARE RELEASEDAT THE SAME TIME. SEE THE README FILE FOR THE AVAILABILITY OF THIS SOFTWAREVERSION ON A SPECIFIC OPERATING SYSTEM PLATFORM.
THIS DOCUMENT IS PROVIDED “AS IS” WITHOUT WARRANTY OF ANY KIND, EITHEREXPRESS OR IMPLIED, INCLUDING, BUT NOT LIMITED TO, THE IMPLIED WARRANTIES OFMERCHANTABILITY, FITNESS FOR A PARTICULAR PURPOSE, OR NON-INFRINGEMENT.
THIS DOCUMENT COULD INCLUDE TECHNICAL INACCURACIES OR TYPOGRAPHICALERRORS. CHANGES ARE PERIODICALLY ADDED TO THE INFORMATION HEREIN; THESECHANGES WILL BE INCORPORATED IN NEW EDITIONS OF THIS DOCUMENT. TIBCOSOFTWARE INC. MAY MAKE IMPROVEMENTS AND/OR CHANGES IN THE PRODUCT(S)AND/OR THE PROGRAM(S) DESCRIBED IN THIS DOCUMENT AT ANY TIME.
THE CONTENTS OF THIS DOCUMENT MAY BE MODIFIED AND/OR QUALIFIED, DIRECTLY ORINDIRECTLY, BY OTHER DOCUMENTATION WHICH ACCOMPANIES THIS SOFTWARE,INCLUDING BUT NOT LIMITED TO ANY RELEASE NOTES AND "READ ME" FILES.
Copyright © 2004-2015 TIBCO Software Inc. ALL RIGHTS RESERVED.
TIBCO Software Inc. Confidential Information
2
TIBCO Business Studio™ Simulation Guide

Contents
TIBCO Documentation and Support Services . . . . . . . . . . . . . . . . . . . . . . . . . . . . . . . . . . . . . . . . . . . . . . . . . . . . . . . . .5
Getting Started with Simulation . . . . . . . . . . . . . . . . . . . . . . . . . . . . . . . . . . . . . . . . . . . . . . . . . . . . . . . . . . . . . . . . . . . . . 6
Overview of Simulation . . . . . . . . . . . . . . . . . . . . . . . . . . . . . . . . . . . . . . . . . . . . . . . . . . . . . . . . . . . . . . . . . . . . . . . . . . . . . . . . . . . . . . . . . . . . . . . . 6
Tutorial 1 Setting Up a Simple Simulation . . . . . . . . . . . . . . . . . . . . . . . . . . . . . . . . . . . . . . . . . . . . . . . . . . . . . . . . . . . . . . . . . . . . . . . . . . . . . . 7
Creating the Claims Management Process . . . . . . . . . . . . . . . . . . . . . . . . . . . . . . . . . . . . . . . . . . . . . . . . . . . . . . . . . . . . . . . . . . . . . . . . .7
Adding the Participants . . . . . . . . . . . . . . . . . . . . . . . . . . . . . . . . . . . . . . . . . . . . . . . . . . . . . . . . . . . . . . . . . . . . . . . . . . . . . . . . . . . . . . . . . . . .7
Specifying the Unit Cost of the Participants . . . . . . . . . . . . . . . . . . . . . . . . . . . . . . . . . . . . . . . . . . . . . . . . . . . . . . . . . . . . . . . . . . . . . . . . 8
Specifying the Duration of the Activities . . . . . . . . . . . . . . . . . . . . . . . . . . . . . . . . . . . . . . . . . . . . . . . . . . . . . . . . . . . . . . . . . . . . . . . . . . . . 8
Associating the Participants with the Activities . . . . . . . . . . . . . . . . . . . . . . . . . . . . . . . . . . . . . . . . . . . . . . . . . . . . . . . . . . . . . . . . . . . . . 8
Adding the Data Fields . . . . . . . . . . . . . . . . . . . . . . . . . . . . . . . . . . . . . . . . . . . . . . . . . . . . . . . . . . . . . . . . . . . . . . . . . . . . . . . . . . . . . . . . . . . . 9
Tutorial 2 - Running a Simulation . . . . . . . . . . . . . . . . . . . . . . . . . . . . . . . . . . . . . . . . . . . . . . . . . . . . . . . . . . . . . . . . . . . . . . . . . . . . . . . . . . . . . . .9
Tutorial 3 - Interpreting the Results of Simulation . . . . . . . . . . . . . . . . . . . . . . . . . . . . . . . . . . . . . . . . . . . . . . . . . . . . . . . . . . . . . . . . . . . . . . 10
Tutorial 4 - Changing Simulation Properties . . . . . . . . . . . . . . . . . . . . . . . . . . . . . . . . . . . . . . . . . . . . . . . . . . . . . . . . . . . . . . . . . . . . . . . . . . . 11
Tutorial 5 - Viewing and Comparing the Results of Simulation . . . . . . . . . . . . . . . . . . . . . . . . . . . . . . . . . . . . . . . . . . . . . . . . . . . . . . . . . 12
Tutorial 6 - Using Loops in Simulation . . . . . . . . . . . . . . . . . . . . . . . . . . . . . . . . . . . . . . . . . . . . . . . . . . . . . . . . . . . . . . . . . . . . . . . . . . . . . . . . .13
Tutorial 7 - Controlling Flow From a Gateway . . . . . . . . . . . . . . . . . . . . . . . . . . . . . . . . . . . . . . . . . . . . . . . . . . . . . . . . . . . . . . . . . . . . . . . . . 15
Tutorial 8 - Using Historical Data for Activity Duration . . . . . . . . . . . . . . . . . . . . . . . . . . . . . . . . . . . . . . . . . . . . . . . . . . . . . . . . . . . . . . . . . .15
Reviewing the Import File . . . . . . . . . . . . . . . . . . . . . . . . . . . . . . . . . . . . . . . . . . . . . . . . . . . . . . . . . . . . . . . . . . . . . . . . . . . . . . . . . . . . . . . . 17
Creating the Parameter . . . . . . . . . . . . . . . . . . . . . . . . . . . . . . . . . . . . . . . . . . . . . . . . . . . . . . . . . . . . . . . . . . . . . . . . . . . . . . . . . . . . . . . . . . 17
Importing the Data . . . . . . . . . . . . . . . . . . . . . . . . . . . . . . . . . . . . . . . . . . . . . . . . . . . . . . . . . . . . . . . . . . . . . . . . . . . . . . . . . . . . . . . . . . . . . . . 18
Tutorial 9 - Monitoring SLAs . . . . . . . . . . . . . . . . . . . . . . . . . . . . . . . . . . . . . . . . . . . . . . . . . . . . . . . . . . . . . . . . . . . . . . . . . . . . . . . . . . . . . . . . . . 20
Concepts and Definitions . . . . . . . . . . . . . . . . . . . . . . . . . . . . . . . . . . . . . . . . . . . . . . . . . . . . . . . . . . . . . . . . . . . . . . . . . . 22
Activity-Based Costing . . . . . . . . . . . . . . . . . . . . . . . . . . . . . . . . . . . . . . . . . . . . . . . . . . . . . . . . . . . . . . . . . . . . . . . . . . . . . . . . . . . . . . . . . . . . . . . .22
Destination Environment . . . . . . . . . . . . . . . . . . . . . . . . . . . . . . . . . . . . . . . . . . . . . . . . . . . . . . . . . . . . . . . . . . . . . . . . . . . . . . . . . . . . . . . . . . . . . .22
Scenario . . . . . . . . . . . . . . . . . . . . . . . . . . . . . . . . . . . . . . . . . . . . . . . . . . . . . . . . . . . . . . . . . . . . . . . . . . . . . . . . . . . . . . . . . . . . . . . . . . . . . . . . . . . . . 22
Service Level Agreement (SLA) . . . . . . . . . . . . . . . . . . . . . . . . . . . . . . . . . . . . . . . . . . . . . . . . . . . . . . . . . . . . . . . . . . . . . . . . . . . . . . . . . . . . . . .22
Simulation . . . . . . . . . . . . . . . . . . . . . . . . . . . . . . . . . . . . . . . . . . . . . . . . . . . . . . . . . . . . . . . . . . . . . . . . . . . . . . . . . . . . . . . . . . . . . . . . . . . . . . . . . . . .22
Simulation Time . . . . . . . . . . . . . . . . . . . . . . . . . . . . . . . . . . . . . . . . . . . . . . . . . . . . . . . . . . . . . . . . . . . . . . . . . . . . . . . . . . . . . . . . . . . . . . . . . . . . . . 23
Tasks . . . . . . . . . . . . . . . . . . . . . . . . . . . . . . . . . . . . . . . . . . . . . . . . . . . . . . . . . . . . . . . . . . . . . . . . . . . . . . . . . . . . . . . . . . . . 24
Simulating Business Processes . . . . . . . . . . . . . . . . . . . . . . . . . . . . . . . . . . . . . . . . . . . . . . . . . . . . . . . . . . . . . . . . . . . . . . . . . . . . . . . . . . . . . . .24
Define the As Is Process . . . . . . . . . . . . . . . . . . . . . . . . . . . . . . . . . . . . . . . . . . . . . . . . . . . . . . . . . . . . . . . . . . . . . . . . . . . . . . . . . . . . . . . . . 24
Prepare the Simulation . . . . . . . . . . . . . . . . . . . . . . . . . . . . . . . . . . . . . . . . . . . . . . . . . . . . . . . . . . . . . . . . . . . . . . . . . . . . . . . . . . . . . . . . . . .24
Assign Activity Duration . . . . . . . . . . . . . . . . . . . . . . . . . . . . . . . . . . . . . . . . . . . . . . . . . . . . . . . . . . . . . . . . . . . . . . . . . . . . . . . . . . . . . 24
Add the Participants and Associate them with Activities . . . . . . . . . . . . . . . . . . . . . . . . . . . . . . . . . . . . . . . . . . . . . . . . . . . . . . 25
Assign Unit Costs to Participants . . . . . . . . . . . . . . . . . . . . . . . . . . . . . . . . . . . . . . . . . . . . . . . . . . . . . . . . . . . . . . . . . . . . . . . . . . . . 25
Add the Data Fields and Associate them with Activities (optional) . . . . . . . . . . . . . . . . . . . . . . . . . . . . . . . . . . . . . . . . . . . . . 26
Set the Number of Simulation Cases . . . . . . . . . . . . . . . . . . . . . . . . . . . . . . . . . . . . . . . . . . . . . . . . . . . . . . . . . . . . . . . . . . . . . . . . .26
Set Up Looping Strategies . . . . . . . . . . . . . . . . . . . . . . . . . . . . . . . . . . . . . . . . . . . . . . . . . . . . . . . . . . . . . . . . . . . . . . . . . . . . . . . . . . . 27
3
TIBCO Business Studio™ Simulation Guide

Run the Simulation of the As Is Process . . . . . . . . . . . . . . . . . . . . . . . . . . . . . . . . . . . . . . . . . . . . . . . . . . . . . . . . . . . . . . . . . . . . . . . . . . 27
View the Simulation Progress . . . . . . . . . . . . . . . . . . . . . . . . . . . . . . . . . . . . . . . . . . . . . . . . . . . . . . . . . . . . . . . . . . . . . . . . . . . . . . . .28
Interpret the Results of Simulation . . . . . . . . . . . . . . . . . . . . . . . . . . . . . . . . . . . . . . . . . . . . . . . . . . . . . . . . . . . . . . . . . . . . . . . . . . . . . . . .28
Optimize or Re-Engineer the Process . . . . . . . . . . . . . . . . . . . . . . . . . . . . . . . . . . . . . . . . . . . . . . . . . . . . . . . . . . . . . . . . . . . . . . . . . . . . 28
Using Historical Data for Activity Duration . . . . . . . . . . . . . . . . . . . . . . . . . . . . . . . . . . . . . . . . . . . . . . . . . . . . . . . . . . . . . . . . . . . . . . . . . . . . . 30
Controlling Sequence Flow from a Gateway . . . . . . . . . . . . . . . . . . . . . . . . . . . . . . . . . . . . . . . . . . . . . . . . . . . . . . . . . . . . . . . . . . . . . . . . . . .33
Monitoring SLAs . . . . . . . . . . . . . . . . . . . . . . . . . . . . . . . . . . . . . . . . . . . . . . . . . . . . . . . . . . . . . . . . . . . . . . . . . . . . . . . . . . . . . . . . . . . . . . . . . . . . . .33
Comparing Simulations . . . . . . . . . . . . . . . . . . . . . . . . . . . . . . . . . . . . . . . . . . . . . . . . . . . . . . . . . . . . . . . . . . . . . . . . . . . . . . . . . . . . . . . . . . . . . . . 34
Creating and Viewing a Simulation Report . . . . . . . . . . . . . . . . . . . . . . . . . . . . . . . . . . . . . . . . . . . . . . . . . . . . . . . . . . . . . . . . . . . . . . . . . . . . 35
Designing Custom Reports . . . . . . . . . . . . . . . . . . . . . . . . . . . . . . . . . . . . . . . . . . . . . . . . . . . . . . . . . . . . . . . . . . . . . . . . . . . . . . . . . . . . . . . . . . . 35
Obtaining a Data Source . . . . . . . . . . . . . . . . . . . . . . . . . . . . . . . . . . . . . . . . . . . . . . . . . . . . . . . . . . . . . . . . . . . . . . . . . . . . . . . . . . . . . . . . . 36
Creating a New Report . . . . . . . . . . . . . . . . . . . . . . . . . . . . . . . . . . . . . . . . . . . . . . . . . . . . . . . . . . . . . . . . . . . . . . . . . . . . . . . . . . . . . . . . . . .36
Creating the Data Source . . . . . . . . . . . . . . . . . . . . . . . . . . . . . . . . . . . . . . . . . . . . . . . . . . . . . . . . . . . . . . . . . . . . . . . . . . . . . . . . . . . . . . . . 36
Create the Data Set . . . . . . . . . . . . . . . . . . . . . . . . . . . . . . . . . . . . . . . . . . . . . . . . . . . . . . . . . . . . . . . . . . . . . . . . . . . . . . . . . . . . . . . . . . . . . .38
Creating the Report Parameters . . . . . . . . . . . . . . . . . . . . . . . . . . . . . . . . . . . . . . . . . . . . . . . . . . . . . . . . . . . . . . . . . . . . . . . . . . . . . . . . . .39
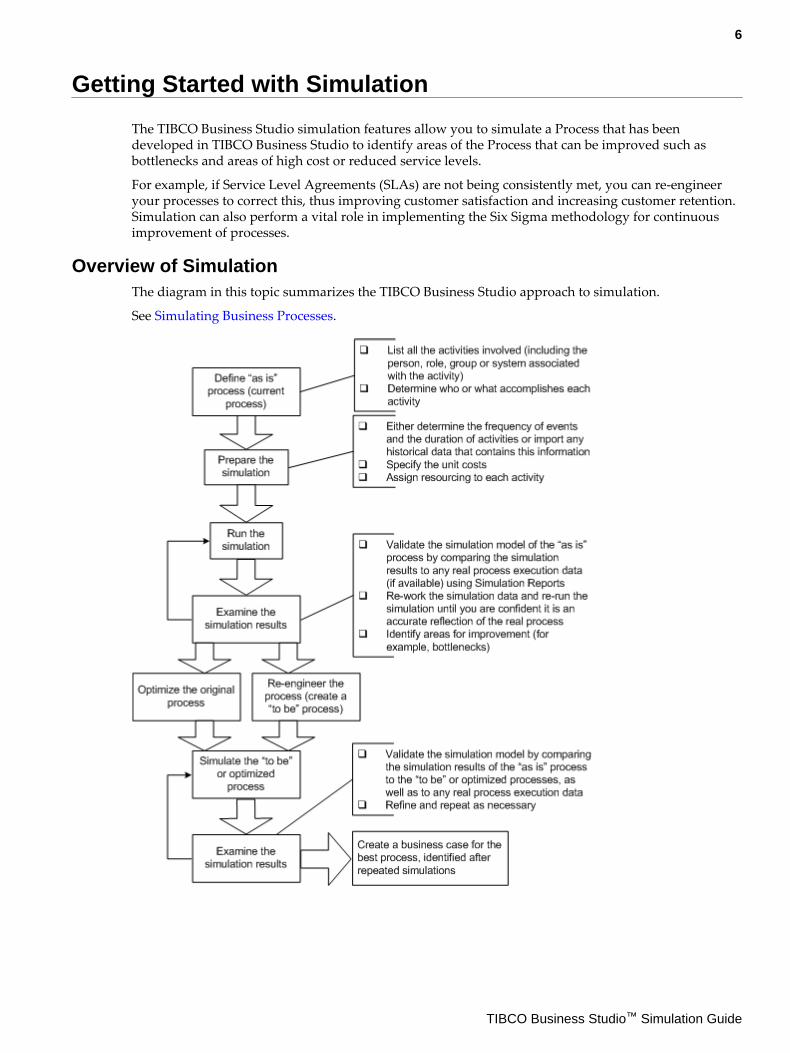
Creating a Table to Display the Data . . . . . . . . . . . . . . . . . . . . . . . . . . . . . . . . . . . . . . . . . . . . . . . . . . . . . . . . . . . . . . . . . . . . . . . . . . . . . 39
Importing the Report . . . . . . . . . . . . . . . . . . . . . . . . . . . . . . . . . . . . . . . . . . . . . . . . . . . . . . . . . . . . . . . . . . . . . . . . . . . . . . . . . . . . . . . . . . . . . 40
Editing the Report . . . . . . . . . . . . . . . . . . . . . . . . . . . . . . . . . . . . . . . . . . . . . . . . . . . . . . . . . . . . . . . . . . . . . . . . . . . . . . . . . . . . . . . . . . . . . . . .41
Customizing Simulation Preferences . . . . . . . . . . . . . . . . . . . . . . . . . . . . . . . . . . . . . . . . . . . . . . . . . . . . . . . . . . . . . . . . . . . . . . . . . . . . . . . . . . 41
Reference . . . . . . . . . . . . . . . . . . . . . . . . . . . . . . . . . . . . . . . . . . . . . . . . . . . . . . . . . . . . . . . . . . . . . . . . . . . . . . . . . . . . . . . . 43
Simulation Control View . . . . . . . . . . . . . . . . . . . . . . . . . . . . . . . . . . . . . . . . . . . . . . . . . . . . . . . . . . . . . . . . . . . . . . . . . . . . . . . . . . . . . . . . . . . . . . 43
Simulation Results View . . . . . . . . . . . . . . . . . . . . . . . . . . . . . . . . . . . . . . . . . . . . . . . . . . . . . . . . . . . . . . . . . . . . . . . . . . . . . . . . . . . . . . . . . . . . . . 43
Simulation Report View . . . . . . . . . . . . . . . . . . . . . . . . . . . . . . . . . . . . . . . . . . . . . . . . . . . . . . . . . . . . . . . . . . . . . . . . . . . . . . . . . . . . . . . . . . . . . . .44
Simulation Properties View . . . . . . . . . . . . . . . . . . . . . . . . . . . . . . . . . . . . . . . . . . . . . . . . . . . . . . . . . . . . . . . . . . . . . . . . . . . . . . . . . . . . . . . . . . . 45
Compare Simulation Results View . . . . . . . . . . . . . . . . . . . . . . . . . . . . . . . . . . . . . . . . . . . . . . . . . . . . . . . . . . . . . . . . . . . . . . . . . . . . . . . . . . . . 45
Case Cost-Time Analysis . . . . . . . . . . . . . . . . . . . . . . . . . . . . . . . . . . . . . . . . . . . . . . . . . . . . . . . . . . . . . . . . . . . . . . . . . . . . . . . . . . . . . . . . 46
Participant Utilization . . . . . . . . . . . . . . . . . . . . . . . . . . . . . . . . . . . . . . . . . . . . . . . . . . . . . . . . . . . . . . . . . . . . . . . . . . . . . . . . . . . . . . . . . . . . .47
Simulation Data . . . . . . . . . . . . . . . . . . . . . . . . . . . . . . . . . . . . . . . . . . . . . . . . . . . . . . . . . . . . . . . . . . . . . . . . . . . . . . . . . . . . . . . . . . . . . . . . . . . . . . 47
4
TIBCO Business Studio™ Simulation Guide

TIBCO Documentation and Support Services
Documentation for this and other TIBCO products is available on the TIBCO Documentation site:
https://docs.tibco.com
Documentation on the TIBCO Documentation site is updated more frequently than any documentationthat might be included with the product. To ensure that you are accessing the latest available helptopics, please visit https://docs.tibco.com.
Product-Specific Documentation
Documentation for TIBCO products is not bundled with the software. Instead, it is available on theTIBCO Documentation site. To directly access documentation for this product, double-click thefollowing file:
TIBCO_HOME/release_notes/TIB_business-studio-bpm-cloud-edition_version_docinfo.html
The following documents for this product can be found on the TIBCO Documentation site:
● TIBCO Business Studio™ Concepts
● TIBCO Business Studio™ Modeling User's Guide
● TIBCO Business Studio™ - Analyst Edition User's Guide
● TIBCO Business Studio™ - BPM Implementation
● TIBCO Business Studio™ Forms User's Guide
● TIBCO Business Studio™ Simulation User's Guide
● TIBCO Business Studio™ Customization
● TIBCO Business Studio™ - Analyst Edition Installation
● TIBCO Business Studio™ - BPM Edition Installation
● TIBCO Business Studio™ iProcess to BPM Conversion
How to Join TIBCOmmunity
TIBCOmmunity is an online destination for TIBCO customers, partners, and resident experts. It is aplace to share and access the collective experience of the TIBCO community. TIBCOmmunity offersforums, blogs, and access to a variety of resources. To register, go to the following web address:
https://www.tibcommunity.com
5
TIBCO Business Studio™ Simulation Guide
Getting Started with Simulation
The TIBCO Business Studio simulation features allow you to simulate a Process that has beendeveloped in TIBCO Business Studio to identify areas of the Process that can be improved such asbottlenecks and areas of high cost or reduced service levels.
For example, if Service Level Agreements (SLAs) are not being consistently met, you can re-engineeryour processes to correct this, thus improving customer satisfaction and increasing customer retention.Simulation can also perform a vital role in implementing the Six Sigma methodology for continuousimprovement of processes.
Overview of SimulationThe diagram in this topic summarizes the TIBCO Business Studio approach to simulation.
See Simulating Business Processes.
6
TIBCO Business Studio™ Simulation Guide

Tutorial 1 Setting Up a Simple SimulationIn this tutorial you prepare a Process for Simulation by completing a number of steps:
This tutorial assumes that you are familiar with the modeling features of TIBCO Business Studio (formore information, see the TIBCO Business Studio modeling documentation).
Creating the Claims Management ProcessCreate an Analyst Project with the Simulation destination environment checked on the project level.
Create a new Package for the Process you are about to create and call it Claims Management. Create aProcess called Claims Management that looks like this:
Note that the data flow between Send Loss Adjuster? and Adjust Loss must be a conditional flow, andthe flow to the Handle Claimant Activity must be a default flow.
Ensure that the Destination Environment is set to Simulation as follows:
Procedure
1. Select the Claims Management Process in the Project Explorer.
2. Click the Destinations tab and select Simulation as the Destination Environment.
Adding the Participants
Procedure
1. In the Project Explorer, expand the tree down to the Claims Management Process Package.
2. Right-click Participants and select New Participant. The New Participant wizard is displayed.
3. The Participant Details dialog is displayed first. Enter Call Center Operator for the Name, and selectRole as the Type. You can optionally press Next to enter a Description of the role.
4. Click Back from Participant Details if you want to change the default values for Project, Package orProcess.
5. Click Finish and note that Call Center Operator is added to Participants in the Project Explorerunder the Claims Management Process Package.
6. Repeat these steps to add Loss Adjuster and Claims Handler as an additional Role Participants.
7. Simulation data is not added automatically. Go to Simulation tab for the Participant to addsimulation data.
7
TIBCO Business Studio™ Simulation Guide

Specifying the Unit Cost of the Participants
Procedure
1. Select the Call Center Operator Participant and go to the Properties view.
2. Click the Simulation tab, and edit the Simulation Data as follows:
● Number Of People/Machines - How many of this resource are required. Enter 3.● Cost Per Unit - Cost per Unit (for example cost per hour). Enter 7.5.● Unit - Specifies the time period against which the Cost is measured. Select HOUR.
3. Do the same for the Loss Adjuster Participant, but specify the following:
● Number Of People/Machines - How many of this resource are required. Enter 2.● Cost Per Unit - Cost per Unit (for example cost per hour). Enter 30.● Unit - Specifies the time period against which the Cost is measured. Select HOUR.
4. In the same way, modify the Simulation Data for the Claims Handler:
● Number Of People/Machines - How many of this resource are required. Enter 10.● Cost Per Unit - Cost per Unit (for example cost per hour). Enter 15.● Unit - Specifies the time period against which the Cost is measured. Select HOUR.
Specifying the Duration of the Activities
Procedure
1. Select the Validate Policy Activity.
2. Go to the Properties view and edit the Simulation Data as follows:
● Select NORMAL as the Duration Distribution.● Select MINUTE for the Time Unit with a Mean value of 5 and a Standard Deviation of 2.
3. Do the same for the Adjust Loss Activity, but select NORMAL distribution, HOUR, with a mean of2 and standard deviation of 0.25.
4. For the Handle Claimant Activity, specify NORMAL distribution, DAY, with a mean of 2 andstandard deviation of 0.25.
5. For the Complete Customer Survey Activity, specify a CONSTANT distribution of 5 minutes.
6. Click the Start Event and specify a EXPONENTIAL distribution with a mean of 60 minutes andaccept the default number of cases which is 100.
Associating the Participants with the Activities
Procedure
1. Highlight the Validate Policy Activity.
2. Go to the Properties view and click the General tab.
3. Browse to select the Call Center Operator as the Participant.
8
TIBCO Business Studio™ Simulation Guide

You can also associate a Participant with an Activity by right-clicking the Activity andselecting Participant, or using drag and drop to drag a Participant over an Activity andmake the association.
4. Do the same for the Adjust Loss Activity, but select the Loss Adjuster Participant.
5. Assign the Claims Handler Participant to the Handle Claimant Activity.
6. Assign the Call Center Operator Participant to the Complete Customer Survey Activity.
Adding the Data Fields
Procedure
1. In the Project Explorer, under the Claims Management Process, right-click Data Fields and selectNew Data Field.
2. The Data Field Details dialog is displayed. Enter Policy as the Name of the Data Field and selectString as the Type.
3. You can optionally click Next to enter a description.
4. You can optionally click Back from the DataField Details dialog if you want to check the displayedProject and Package. For this tutorial, you can accept the defaults.
5. Click Finish.
6. Repeat these steps to create a Customer string Data Field.
7. In the Process Editor, highlight the Validate Policy Activity.
8. In the Properties view, click the Interface tab.
9. Click the + button to browse for the Policy and Customer Data Fields. Change in the 'Mode' fieldfrom default(In/Out) to 'In', for both the data fields. Select each and click Add and then click OK.
10. The Data Fields you selected are displayed in the Properties view.
11. Associate the Policy and Customer Data Fields with each of the remaining Activities in the Process.
Result
Compare the Process you have created with the one in the samples workspace (Simulation TutorialSolutions Project) and continue with Tutorial 2 - Running a Simulation to run the simulation.
Tutorial 2 - Running a SimulationThe simulation is now ready to run.
Procedure
1. Save the Package that contains the Claims Management Process.
2. Check the Problems view for any errors in the Process. If any exist, right-click them and selectQuick Fix to correct them (if no Quick Fix is available, open the Process to correct the problem).
3. In the Project Explorer, select the Claims Management Process, right-click, and select PrepareSimulation.
When you select Prepare Simulation, TIBCO Business Studio sets up parametersnecessary for the simulation to run, in this case defining how data flows through the SendLoss Adjuster? gateway. Selecting Prepare Simulation can also fix some problems that donot have Quick Fixes available.
9
TIBCO Business Studio™ Simulation Guide

4. Select Simulation perspective in the upper right of your workspace. This adds the SimulationControl and Simulation Results views to your workspace.
Alternatively, you can run the simulation as described in the next step and TIBCOBusiness Studio changes the perspective automatically.
5. In the Project Explorer, select the Claims Management Process, right-click, and select Run As > RunSimulation . If prompted, click Yes to save any unsaved changes.
By default a simulation runs with a Simulation Start Date/Time that is the current systemdate/time, but you can set the desired Simulation Start Date/Time using the drop-downcalendar and by entering a time value. For more information, see Simulation Time .
6. The simulation runs:
● The Simulation Control View shows simulation time and the progress of simulation.● The Simulation Results View displays the number of cases and updated simulation data about
the Activities and Participants such as the Cost.● The number of queued and processed cases is indicated on the Process (see Tutorial 3 -
Interpreting the Results of Simulation).
In our example, we simulated 100 cases (the default number of cases for simulation is 100,however this can be configured).
Result
After the 100 cases of the simulation complete, continue with the next tutorial to interpret thesimulation results.
Tutorial 3 - Interpreting the Results of SimulationAfter running a simulation, the Simulation Results view shows information about Cases, Participantsand Activities.
● Cases - a summary of the simulation, including the number of cases started and finished as well ascost and case times (average, minimum and maximum).
● Participants - information about Participants. For example:●
● Activities - information about the cost of Activities, distribution into queues, wait times, and so on.
For more information, see Simulation Results View.
By changing properties in the Process such as the number of Participants or by changing the Processitself, you can re-run the simulation and see the effect of your changes.
For example, if initially there is only one Participant for each Activity, you could run a simulation to seethe maximum number of items in a queue and the wait times. If these numbers are higher than youwould like, one solution is to increase the number of Participants. For example, in the previousinsurance example, five Call Center Operators, three Loss Adjusters and 12 Claims Handlers shouldresult in reduced wait times with fewer items in queues.
You can also export the simulation data to an HTML report. See Creating and Viewing a SimulationReport.
Continue with Tutorial 4 - Changing Simulation Properties to see how to change simulation properties.
10
TIBCO Business Studio™ Simulation Guide

Tutorial 4 - Changing Simulation PropertiesTo simplify the simulation of Processes, TIBCO Business Studio provides default values for significantsimulation parameters. These along with simulation parameters that you specify make up the Scenariothat is used for simulation
See Scenario.
Procedure
1. Open the Claims Management Process that you created in the previous tutorial.
2. Click on the white area of the Lane where the Process is displayed.
3. Go to the Properties view and click the Simulation tab.
4. The simulation properties of the process are displayed. For example:
This shows that from the Validate Policy Activity, the cases are distributed 50:50 to the Adjust Lossand Process Claimant Activities.
5. You can change this distribution of cases by changing the weighting. Click in the Weighting factorscolumn and change the weighting to 30:10, which changes the Percentage to 75:25. In the followingexample, the Sequence Flows have been renamed as well:
6. Re-run the simulation and note in the Simulation Results view that the cases are now distributedaccording to the weighting that you entered:
Now 75 cases are distributed to the Adjust Loss Activity versus 50 in the previous simulation run.
For more information about the simulation properties, see Simulation Properties View.
11
TIBCO Business Studio™ Simulation Guide

Tutorial 5 - Viewing and Comparing the Results of SimulationIn the previous tutorial, we changed the case distribution to the Adjust Loss and Process ClaimantActivities from 50:50 to 25:75. This affects the utilization of the Participants involved. TIBCO BusinessStudio provides a Simulation Report view that will illustrate the effect of this change.
This tutorial assumes that you have completed the previous tutorials and have two sets of simulationresults (those from the original Process and the results obtained after changing the simulationproperties). The results are also available in the Simulation Tutorial Solutions project under theSimulation folder.
Procedure
1. In the Project Explorer, expand the Simulation folder and its sub-folders and select therelevant .sim files that were created when you simulated the process (for example,2006-03-11_15-56-38.sim). Highlight the .sim files that you want to compare, right-click and selectCompare Simulation Results.
This opens the Compare Simulation Results view.
2. Select the check boxes for the two (or more) sets of results that you want to compare.
3. There are two pre-defined comparison tools that you can use:
● Case Cost-Time Analysis - shows charts and tables that display such information as theminimum, average and maximum case times for each experiment.
● Participant Utilization - shows charts that display idle time and costs for the Participants inthe process.
4. Select Participant Utilization and click Display Report.
5. The comparison report is generated and displayed (you can also save the Case Cost-Time Analysisand Participant Utilization reports to HTML and PDF formats). Remember that the differencebetween the two simulations was the distribution of cases to the Claims Handler and Loss Adjusterparticipants. The first chart shows that the overall Participant idle time (expressed in total minutes)has increased:
To see why this is so, look at the next two charts, which show Participant Idle time. This is the chartwith a 50:50 distribution:
12
TIBCO Business Studio™ Simulation Guide

The second chart shows the 75:25 distribution:
Because fewer cases are sent to the Loss Adjuster, this Participant’s idle time has increased. This isalso reflected in lower utilization in the Tutorial 4 results.
There are several aspects of simulation to note when comparing simulations:● When comparing pie charts such as the previous two, note that the total idle time for
each is different, so a similarly-sized segments do not represent the same value.● A Participant’s utilization drops if they have finished their work but the simulation is
still running. For this reason it is best to view the running simulation to get a truepicture of a Participant’s utilization while work is being done.
You can save Portable Document Format (PDF) and HTML versions of the comparison report byclicking the appropriate button.
Result
Continue with Tutorial 6 - Using Loops in Simulation to see how to use looping with your simulation.
Tutorial 6 - Using Loops in SimulationWhen simulating a Process you should avoid infinite loops by providing a Simulation Control strategy.If you create a loop without a Simulation Control, TIBCO Business Studio reports this as an error in theProblems view. This tutorial shows how to use a loop in Process simulation.
1. Open the Submit Expenses Process from the Basic Samples Project. Look at the following portionof the Process:
13
TIBCO Business Studio™ Simulation Guide

Simulating this Process would create an infinite loop because there is nothing to notify TIBCOBusiness Studio to end the loop. Subsequent steps show how to specify a way to break out of theloop for simulation purposes.
2. Click the Submit Revised Receipts Activity. In the Properties view, click the Simulation Controltab.
3. Click the Simulation control link to add a simulation control strategy.
4. There are three strategies from which you can select to break out of the loop:
● Max Loop Count - after the specified number of times through it.● Max Elapse Time - after the specified amount of simulation time has elapsed.● Normal Distribution - based on a normal distribution of times through the loop.
In this example, select Normal Distribution with a mean of 2 and standard deviation of 0.5.
5. For Decision Activity select Is Paperwork Correct?. This informs TIBCO Business Studio whichActivity will be used to decide whether to end the loop.
6. For To Activity, select Enqueue Payment. This informs TIBCO Business Studio which Activity toproceed with once the loop is finished.
7. Save the Package containing the Process.
8. Highlight the Process, right-click and select Run As > Run Simulation .
9. For 100 cases, the finished simulation for the Activities in the loop should look like this:
100 cases reach the Is Paperwork Correct? Gateway. Because the weighting of the Gateway is 50:50,50 cases proceed to the Enqueue Payment Activity. The remaining 50 cases are travel through thetwo Activities in the loop again resulting in 76 cases passing through this Activity.
14
TIBCO Business Studio™ Simulation Guide

Tutorial 7 - Controlling Flow From a GatewayYou can control flow from a Gateway by specifying a Parameter to be used as in a Rule. On aconditional Sequence Flow exiting the Gateway, you can specify that the Sequence Flow is followedonly when values for that Parameter match the expression specified in the Rule.
Procedure
1. Open the Submit Expenses Process from the previous tutorial. Click the Is Paperwork Correct?Gateway.
2. Click the Rule Parameter tab. This shows the Parameter and values that will be evaluated todetermine the output flow from this Gateway. The Parameter in this case is isPaperworkCorrect.
In this case, there are two values for the Parameter, Wrong receipts and Correct receipts.
3. To see how these values control the flow from the Gateway, highlight the conditional SequenceFlow that comes from the Gateway and in the Properties view, click the Simulation tab.
This shows that this Sequence Flow is only traversed when the isPaperworkCorrect Parameter hasthe value Wrong receipts. Any cases with other values for this Parameter will follow the defaultSequence Flow.
4. To test how the Gateway controls the flow, you can adjust the Weighting as described in Tutorial 4 -Changing Simulation Properties. For example, if 90% of those submitting expenses get thepaperwork right the first time, you could adjust the weighting accordingly and run the simulation.This would show far fewer cases going through the Wrong receipts path.
You can also use the Rule Parameter with imported data as described in the next tutorial.
Tutorial 8 - Using Historical Data for Activity Duration
The following was deferred in V1.1
TIBCO Business Studio allows you to specify the interval of case starts using mathematicaldistributions. For example, in a manufacturing environment, a new work piece might arrive on aconveyor belt every five minutes. When simulating this in TIBCO Business Studio, on the simulationproperties of the Process, select a Distribution of CONSTANT and specify five minutes.
However for more complex simulations, deciding which distribution to use can be difficult.Furthermore real data often exists that is ideal to use. TIBCO Business Studio allows you to import casestart data from an Excel spreadsheet. In addition to the data about the interval and timing of case starts,you can import simulation parameters and parameter values.
15
TIBCO Business Studio™ Simulation Guide

Using imported data for parameters and parameter values can have unintended effects on Gatewaysand weightings later in the Process. For example, suppose a Process has two Gateways: one that usesimported historical data and one later in the Process that does not. Any weightings assigned to the firstGateway are ignored and the flow is taken from the actual imported data. The flow at the next gatewayis generated from the weighting set in the simulation parameters (for example, 50:50), but because it israndomly generated and receiving actual data that is not random, the distribution after simulation maynot be 50:50.
Create the Import File
The first step is to obtain the data you want to import. The format of the file that you use for the importis as follows:
● Excel spreadsheet - The first row of cells corresponds to the parameter names. Each column underthe first row represents the parameter values you wish to import.
Should we specify that the parameter names have underscores as formal parameters can’t havespaces?
Import the Data
To import historical case data:
Procedure
1. Right-click the Package that contains your Process and select New > Other .
2. Expand BPM and select Historical Case Data.
3. Select the appropriate file type (Excel or Text File) and click Next.
4. Browse for the file and click Load, then click Next.
The simulation parameters are displayed as columns and each column displays the parametervalues.
Select the parameters you want to import and click Finish. This creates a file with theextension .realdata.
Associate the Imported Data with the Start Event
5. Go to the Properties view of the Start event and click the Simulation tab.
6. Set the Number of Cases.
If you set the number of cases to more than are contained in your imported data, only theTime simulation parameter is used. If you set the number of cases to equal to or less thanthe number of cases in your imported data, both the Time and any other parameters areused.
7. Select EMPIRICAL as the Distribution.
8. Browse to select the .realdata file that was created from your imported simulation data.
9. Right-click the Process and select Prepare Simulation. This automatically generates the names forthe simulation parameters and the values. These can be seen by highlighting the Process and in theProperties view clicking the Simulation tab.
You must rename the simulation Parameters so they match the imported data you want to use. Todo this ...TBS...
Any simulation parameter that does not correspond to a parameter in the imported datafollows the default Sequence Flow from a Gateway.
Run the Simulation
16
TIBCO Business Studio™ Simulation Guide

Result
Run the simulation as normal. Note that the Start time in the Simulation Control view corresponds tothe first value of the Time simulation that you imported and that the distribution of other parameters istaken from the imported data.
As part of setting up a Process for simulation, you specify the duration of the Activities in the Processusing a mathematical distribution (for example, Normal distribution). Alternatively, TIBCO BusinessStudio allows you to import any real historical data that you have about activity duration. This tutorialdescribes how to do this using a sample Process and data. The sample Process is one that represents therenewal process for insurance policies.
Reviewing the Import FileOpen the renewal.xls spreadsheet located in the samples directory where you installed TIBCO BusinessStudio and take a minute to look at it.
The first row of cells corresponds to the parameter names:
● Case Number - a unique number to identify the case. This will be ignored when we import the datainto TIBCO Business Studio.
● Activity Name - the Activity being performed. Note the Activity Names do not have to matchexactly the names of the Activities in the Process; the Import wizard allows you to map Activitiesbetween the spreadsheet and the Process.
● Duration - the amount of time it takes to perform the Activity. The time unit is specified in theImport wizard.
● Existing Customer? - this Parameter affects how long it takes to get the customer details.● Number of Drivers - the number of drivers to be insured.
Each column under the first row represents the parameter values that will be imported.
Creating the ParameterIn this example, the data on whether a customer is new or existing will affect the duration of the TakeCustomer Details Activity. For this reason, we need to create a Parameter to represent whether acustomer is new or existing.
Procedure
1. In the Project Explorer under the Process, right-click Parameters and select New Parameter.
2. Click Next to accept the displayed Project, Package and Process.
3. Enter ExistingCustomer as the Name, select String for the Type and click Finish.
4. In the Project Explorer, select the Process and go to the Simulation tab on the Properties view. Thisshows the Parameter that you created (ExistingCustomer).
5. Click Add Value. This adds a value called New Value. Double-click the value and rename it to Yes.Repeat this to create a No value. The result should look like this:
17
TIBCO Business Studio™ Simulation Guide

Importing the DataYou import the spreadsheet containing your historical data.
Procedure
1. Right-click the Renewal Process and select Import.
2. Select Historical Case Data (Activity Duration).
3. The names of the Project, Package and Process are displayed. Click Next.
4. Either click Browse or Browse Workspace to locate the renewal.xls file and click Next.
5. The Select Parameters dialog is displayed. This allows you to specify which columns in thespreadsheet represent the Activity name and duration:
● In the Select from imported columns: section, select the Activity Name Column and theDuration Column. Select Minutes as the Duration Unit.
● In the Map Activity Names: section, map the Activities in the spreadsheet to those in theProcess.
The completed screen should look like this:
Click Next.
6. The next dialog allows you to map any parameters not already used in the previous dialog ontoActivities in the Process. In this example, there are three parameters left over, Case No, ExistingCustomer and Number of Drivers. In this example, we will ignore the Case No and Number ofDrivers Parameters. The Existing Customer parameter is interesting to us because it affects whatinformation is required for the Take Customer Details Activity. Map the parameters as follows:
18
TIBCO Business Studio™ Simulation Guide

Click Next.
7. In the next dialog, specify that the Take Customer Details Activity takes its duration from theimported data, depending on the value of the Existing Customer Parameter (YES or NO). Clickingon each row gives the values, average duration and deviation from the average from thespreadsheet. For example:
Click Finish.
8. The Simulation Properties view for the Take Customer Details Activity now shows that theduration is taken from the imported data and is based on a parameter:
19
TIBCO Business Studio™ Simulation Guide

Tutorial 9 - Monitoring SLAsTIBCO Business Studio allows you to set Service Level Agreement (SLA) thresholds for Activity Delayand Participant Utilization. When you simulate the Process, TIBCO Business Studio displays visualcues when these thresholds are exceeded.
Procedure
1. Open the Renewal Process.
2. Click the Quote Activity. In the Properties view, specify 5.5 as the Maximum Delay SLA. Thismeans that our SLA specifies that a credit check should take no more than three minutes.
3. In the Project Explorer, click the Insurance Agent Participant. In the Properties view for theParticipant, enter 65 for the Minimum Utilization SLA (%) and 85 for Maximum Utilization SLA(%). This means that our SLA requires that the Participant be busy at least 65% of the time up to amaximum of 85% of the time.
While it is possible to require that the maximum utilization for a Participant is 100%, inpractice this is rarely the case because of holiday, ancillary tasks, sickness and so on.
4. Simulate the Process. The SLA information is displayed next to the Activity in the third and fourthcolumns. For example:
The color of the bar is red in the third column because the SLA is not being met. Specifically theQuote activity is taking longer than we would like it to. In some cases the threshold is displayed inred, but the bar is green like this:
20
TIBCO Business Studio™ Simulation Guide

This means that the threshold was exceeded, but the overall utilization was within the SLA.
5. In this example, the Renewal Process has 100 instances of the Insurance Agent Participant. Bylooking at the simulation, we can see that this Participant appears under-utilized (at about 6%).Experiment with changing the number of Insurance Agents. For example, with six InsuranceAgents, the results should show utilization within the SLA:
6. Looking at the Quote Activity, it has a duration of 4, standard deviation of 1 and a threshold of 5.5.This means that running this simulation results in the average delay exceeding the threshold.Whether this is acceptable is a business specific decision on your part.
21
TIBCO Business Studio™ Simulation Guide

Concepts and Definitions
This section defines concepts and terminology related to the TIBCO Business Studio simulation feature.
Activity-Based CostingActivity-based costing refers to the practice of building up total 'transaction costs' or 'process costs'from the costs of the individual Activity that make up the Process. This can be useful in BusinessProcess Outsourcing situations where a supplier may be paid and have SLAs evaluated on a pertransaction basis.
The way this is expressed in TIBCO Business Studio is by assigning a Participant to an Activity. Youthen assign the Participant a unit cost, and the Activity a duration. TIBCO Business Studio calculatesthe Activity cost (the Activity duration multiplied by the Participant unit cost) and displays this on theSimulation tab of the Properties view of the Activity.
You can generate different reports from the simulation that include activity-based costing data,including participant cost, activity cost and end-to-end process cost (see Creating and Viewing aSimulation Report).
Destination EnvironmentThe intended environment in which you want the process to run (for example, BPM or Simulation).You can select this on the Destinations tab of the Properties view of a Process. The setting selectedaffects the validation performed on the Process and consequently the errors or warnings that aredisplayed in the Problems view.
Because of the requirements of different destination environments, a Process that is valid for onedestination is not necessarily valid for another.
ScenarioA scenario in TIBCO Business Studio consists of the complete set of data used by TIBCO BusinessStudio to simulate a Process (for example, the number of Participants, weightings on transitions and soon), the Process amd Simulation results.
You can make several copies of the Package that contains the Process. This allows you to change thesimulation data or the Process itself and compare the simulation results.
Service Level Agreement (SLA)This refers to a contract between a provider of a service and a user of that service that specifies the levelof service required during the term of their agreement. Often it also stipulates penalties incurred for notmeeting the agreed upon levels of service.
SimulationSimulation is an abstraction of reality made possible by making assumptions about the real Process.Simulation can then be run to identify areas of the Process that can be improved such as bottlenecksand areas of high cost or delay.
Simulation is by nature an empirical science harnessing the business knowledge and user experience tocorrectly identify significant factors in the real process.
22
TIBCO Business Studio™ Simulation Guide

Simulation TimeSimulation time represents the passage of time during a simulation and accrues based on the durationsof the Activities in the Process.
You can specify the Date/Time that you want the simulation to begin as well as the speed at whichsimulation time passes on Simulation Control View.
Simulation time is equivalent to a 37.5 hour work week and excludes weekends. This relates toParticipant utilization in that a Participant that is working a full week is considered to be utilized at100%.
23
TIBCO Business Studio™ Simulation Guide

Tasks
This section describes some of the common tasks that you perform using the TIBCO Business Studiosimulation feature.
Simulating Business ProcessesTIBCO Business Studio has simulation capabilities that make it possible to test and refine businessprocesses before implementation. Simulation is an abstraction of reality made possible by makingassumptions about the real Process.
All Activities in your Process must be assigned a duration for simulation purposes and the Participantswho perform the Activities assigned unit costs. As a result, metrics such as the cost of an Activity (theActivity duration multiplied by the Participant unit cost) can be calculated.
There is no concept of sub-processes in simulation. If you want to simulate a sub-process, you caneither assign it a duration and build this into the entire duration for the process, or you can separate itout as a process, and simulate it individually.
Simulation can then be run to identify areas of the Process that can be improved such as bottlenecksand areas of high cost or delay.
Define the As Is ProcessThe first step in simulation is to create a model of the current business process using the TIBCOBusiness Studio modeling features. The model represents a business view of the process as it exists. Insome cases processes might be informal. TIBCO Business Studio allows you to take a holistic view ofthese disparate processes.
When creating the TIBCO Business Studio Process, each time a different person, group, role, or systemdoes something, an Activity is added to the Process.
Activities may be triggered by events such as the receipt of an email, phone call or workflow item, andmay involve making a judgement on the presented facts and performing an action (such as enteringdata to a computer system, phoning someone in the same or different organization, and so on).
Prepare the SimulationTo prepare a Process for simulation, you must do a number of steps. If you have historical data from anactual business process, you can use this as input to the simulation.
For more information see Using Historical Data for Activity Duration.
Assign Activity Duration
As part of simulating the execution of a Process, specify the duration of each Activity in the Process.For example, the duration of support telephone calls might be normally distributed with an average offive ± two minutes.
Procedure
1. In the Process Editor, select the Activity.
2. In the Properties view, click the Simulation tab.
3. Choose a Duration Distribution, typically one of the following:
● Constant - choose this distribution for Activities that never vary in duration. For example, aquestionnaire might be designed such that it always takes 10 minutes to complete (or rather thevariation is so small that it can be considered constant).
24
TIBCO Business Studio™ Simulation Guide

● Normal - choose this distribution for Activities which follow a bell curve (you specify theMean and Standard Deviation). For example, phone calls in a call center might follow astandard distribution (68% of all phone calls are 4-6 minutes in duration).
●
4. Choose a Time Unit:
● Month● Day● Hour● Minute● Second
5. Enter the Value for the duration.
Add the Participants and Associate them with Activities
All Activities in a Process must have a Participant for simulation purposes. The Participant identifieswho or what performs an Activity. For example, 20 call center staff answering enquiries, giving quotesand taking applications and 10 claim handlers processing claims.
In addition to the Participants involved in an Activity, there are broadly two types of resourceassociated with an Activity:
● blocking resources - a resource that delays the Process when not available (for example, a personneeded to do a job)
● non-blocking resources - a resource that doesn’t delay the Process, but contribute to costs (forexample, the cost of the phone system)
Currently in TIBCO Business Studio you cannot associate non-blocking resources (such as computertime) with an Activity.
To add Participants and associate them with Activities, see the TIBCO Business Studio Modeling User’sGuide.
Assign Unit Costs to Participants
To simulate the cost of an Activity, you must define the cost of the Participants. This could include costssuch as salaries, telephone costs for call centers or travel costs for sales people.
Procedure
1. In the Project Explorer, select the Participant.
2. In the Properties view, click the Simulation tab.
3. Enter the Number Of People/Machines for the Participant. For example, if the Participant is a fieldengineer and two are required, enter 2 here.
25
TIBCO Business Studio™ Simulation Guide

4. Enter the Cost Per Unit and the Unit. For example, 30 per Hour.
Add the Data Fields and Associate them with Activities (optional)
Create the Data Fields used in the Process and associate them with the Activities.
For more information, see the TIBCO Business Studio Modeling User’s Guide.
Set the Number of Simulation Cases
The default number of cases for simulation is 100. You can change this number.
Procedure
1. In the Process Editor, highlight the Start event.
2. In the Properties view, click the Simulation tab.
3. Specify the Number of Cases you want to run during simulation. Avoid specifying extremely largenumbers as this can make simulation time-consuming.
Result
You must also specify a distribution for the interval of case starts, typically one of the following:
● Constant - choose this distribution for case starts that never vary such as the closing of accounts(which happens for example, at the end of every month, quarter and year).
● Uniform - choose this distribution for cases that have an equal probability of starting over a givenrange (for which you can specify a maximum or minimum value). For example, if an audit by agovernment regulator has an equal chance of happening on any day of the year, select a uniformdistribution with 0 and 365 as minimum and maximum values:
●
● Exponential - use this distribution of for examples such as the following:
We had 100,000 claims last year. There are 525,948 minutes in a year, so we received a claim every5.26 minutes. The interval between claims arrivals is expressed by a negative exponentialdistribution:
26
TIBCO Business Studio™ Simulation Guide

Set Up Looping Strategies
If there are any loops in your Process (where a Sequence Flow returns to a previous Activity in theProcess), you must determine a strategy that allows TIBCO Business Studio to break out of the loopduring simulation.
See Simulating Loops in Processes.
Run the Simulation of the As Is Process
Procedure
1. Ensure that Simulation is selected as the Destination Environment:a) Select the Process in the Project Explorer.b) Go to the Properties view and click the Destinations tab.c) Select Simulation as the Destination Environment.
2. Save the Package that contains the Process.
When you save the Package, validation is performed on the Process to ensure that it can besimulated. Any problems are shown in the Problems view.
To correct a problem do one of the following:
● Right-click the problem and select Quick Fix (if enabled for the current problem). This givesyou the option of having TIBCO Business Studio automatically correct the problem for you.
● Right-click the problem and select Show in Process Editor. This displays the Process in theProcess Editor, allowing you to manually correct the problem.
3. Optional - Set the Simulation Date/Time. By default, this is the current system date/time, but you canset the desired simulation time using the drop-down calendar and by entering a time value.
4. Right-click the Process and select Run As > Run Simulation . If prompted, click Yes to switch to theSimulation Perspective.
In the Simulation Control view, click to start the simulation.
5. The Simulation Control view shows the simulation progress and the Simulation Results viewdisplays updated simulation data about the cost of the Activities, and so on. The default number of
27
TIBCO Business Studio™ Simulation Guide

cases for simulation is 100, however this can be configured (see Set the Number of SimulationCases).
View the Simulation Progress
While a simulation is running, you can view information about its progress:
● The Simulation Control view shows a running total of the number of minutes in Simulation Time. Ifthe simulation is running too slowly or quickly, you can adjust the Simulation Speed in this view.
● The Simulation Results view continuously updates as the simulation runs, displaying simulationdata about the Cases, Participants and Activities.
● The Process displays a visual indication of the number of Observed Cases, Current Queue Size,Activity Delay and Participant Utilization % as the simulation progresses:
The indication of case totals becomes red if the number of cases passing through anActivity exceed the total number of cases (for example because of looping).
Interpret the Results of SimulationAfter running a simulation, the Simulation Results view shows information about cases, partiipantsand activities.
● Cases - a summary of the simulation, including the number of cases started and finished as well ascase times (average, minimum and maximum).
● Participants - information about Participants. For example:●
● Activities - information about the cost of Activities, distribution into queues, wait times, and so on.
For more information, see Simulation Results View.
You can also view this information by exporting the simulation data to an HTML report. See Creatingand Viewing a Simulation Report.
At this stage, the goal is to ensure that the "as is" process has sufficient detail to adequately reflectreality. One way of checking this is to compare the results of the simulation to any real data that isavailable. For example, a call center might have data about average call times, or the time it takes toresolve a problem.
After you have re-worked the model, re-run the simulation as needed.
Optimize or Re-Engineer the ProcessAfter simulating the "as is" Process, you must decide whether minor changes to the original Process canachieve the desired results, or if the Process must be re-engineered.
Optimizing the Process
If minor changes are all that is need to the original Process, you can work on that directly.
Identify bottlenecks/areas for improvement in the Process. For example, long queues or extreme idletimes for Participants might be cause for concern.
28
TIBCO Business Studio™ Simulation Guide

Create a "To Be" Process
If you decide to re-engineer your process, the "to be" Process represents an alternative to the currentprocess. One approach is to create several "to be" Processes, simulate them and choose the best one.You can either create a new Process or modify a copy of the "as is" Process and prepare it for simulationas described in Prepare the Simulation.
By changing properties in the Process such as the number of Participants or by changing the Processitself, you can re-run the simulation and see the effect of your changes.
Simulate the "To Be" or Optimized Process
Run the simulation in the same way as you simulated the "as is" Process. The goal of this is to getresults that you can compare to the results of the "as is" Process.
Examine the Results of Simulation
Compare the "as is" Process to the "to be" or optimized Process. One of the ways you can do this is byusing the Simulation Report view (see Comparing Simulations).
When comparing Processes you should keep in mind what has changed between the Processes. Forexample, if you are comparing two Processes that are identical except for the number of Participantsassigned to an Activity, it is easy to explain the different simulation results. However when comparingtwo radically different Processes it can be difficult to identify what accounts for varying simulationresults.
Identify any areas where the Process could be improved, re-work the Process and re-run the simulationas needed.
Build a Business Case for a Process
As a result of simulations in TIBCO Business Studio, you should be able to either optimize or re-engineer a Process to demonstrate substantial cost-savings. However, there is usually a cost associatedchanging existing Processes. This cost must be balanced against the case for change.
For example, suppose that simulations of the "as is" Processes of a support center show that theproblem reporting area of the support web site is under utilized. Furthermore, simulations of "to be"Processes show substantial savings could be made by handling 50 percent more support enquiries viathe web site.
However, there are costs associated with realizing the promised savings. Customers must beencouraged to use the web site to report problems if any savings are to be made, so an investment mustbe made in raising customer awareness. Support staff would be under utilized in proportion to theincreased usage of the web site, so they must be better utilized, perhaps by taking on outside businessfrom other companies.
Simulating Loops in Processes
When simulating a Process you should avoid infinite loops. If you create a loop without a SimulationControl, TIBCO Business Studio reports this as an error in the Problems view and you cannot performsimulation until you correct this..
TIBCO Business Studio supports looping in simulation when the loop is created using a Sequence Flow.However, a Loop Activity Marker is not supported for simulation.
1. Click the Activity in the loop for which you want to add a simulation control. In the Propertiesview, click the Simulation Control tab.
You must add a simulation control to at least one Activity in the loop; otherwise TIBCOBusiness Studio generates an error in the Problems view.
2. Click simulation control to add a Simulation control strategy.
3. There are three strategies from which you can select to break out of the loop:
29
TIBCO Business Studio™ Simulation Guide

● Max Loop Count - after the specified number of times through it. You must enter the Max LoopCount (the number of times you want cases to follow the loop).
● Max Elapse Time - after the specified amount of simulation time has elapsed. You must specifya Time Unit and Value.
● Normal Distribution - based on a normal distribution of times through it. You must enter aMin Loop Count and Max Loop Count upon which to base the distribution.
4. For each strategy, you must specify the following:
● Decision Activity - This informs TIBCO Business Studio which Flow Object will be used todecide whether to end the loop.
● To Activity - This informs TIBCO Business Studio which Activity to proceed with once the loopis finished.
5. Save the Package containing the Process.
6. Highlight the Process, right-click and select Run As > Run Simulation .
7. You should see that the Process breaks out of any loops using the strategy that you specified.
If you have not created the Simulation control strategy correctly TIBCO Business Studio reports this inthe Problems view and you cannot perform simulation until the problem is corrected.
Using Historical Data for Activity Duration
The following was deferred in V1.1
TIBCO Business Studio allows you to specify the interval of case starts using mathematicaldistributions. For example, in a manufacturing environment, a new work piece might arrive on aconveyor belt every five minutes. When simulating this in TIBCO Business Studio, on the simulationproperties of the Process, select a Distribution of CONSTANT and specify five minutes.
However for more complex simulations, deciding which distribution to use can be difficult.Furthermore real data often exists that is ideal to use. TIBCO Business Studio allows you to import casestart data from an Excel spreadsheet. In addition to the data about the interval and timing of case starts,you can import simulation parameters and parameter values.
Using imported data for parameters and parameter values can have unintended effects on Gatewaysand weightings later in the Process. For example, suppose a Process has two Gateways: one that usesimported historical data and one later in the Process that does not. Any weightings assigned to the firstGateway are ignored and the flow is taken from the actual imported data. The flow at the next gatewayis generated from the weighting set in the simulation parameters (for example, 50:50), but because it israndomly generated and receiving actual data that is not random, the distribution after simulation maynot be 50:50.
Create the Import File
The first step is to obtain the data you want to import. The format of the file that you use for the importis as follows:
● Excel spreadsheet - The first row of cells corresponds to the parameter names. Each column underthe first row represents the parameter values you wish to import.
Should we specify that the parameter names have underscores as formal parameters can’t havespaces?
Import the Data
To import historical case data, do the following:
30
TIBCO Business Studio™ Simulation Guide

Procedure
1. Right-click the Package that contains your Process and select New > Other .
2. Expand BPM and select Historical Case Data.
3. Select the appropriate file type (Excel or Text File) and click Next.
4. Browse for the file and click Load, then click Next.
The simulation parameters are displayed as columns and each column displays the parametervalues.
Select the parameters you want to import and click Finish. This creates a file with theextension .realdata.
Associate the Imported Data with the Start Event
5. Go to the Properties view of the Start event and click the Simulation tab.
6. Set the Number of Cases.
If you set the number of cases to more than are contained in your imported data, only theTime simulation parameter is used. If you set the number of cases to equal to or less thanthe number of cases in your imported data, both the Time and any other parameters areused.
7. Select EMPIRICAL as the Distribution.
8. Browse to select the .realdata file that was created from your imported simulation data.
9. Right-click the Process and select Prepare Simulation. This automatically generates the names forthe simulation parameters and the values. These can be seen by highlighting the Process and in theProperties view clicking the Simulation tab.
You must rename the simulation Parameters so they match the imported data you want to use.
Any simulation parameter that does not correspond to a parameter in the imported datafollows the default Sequence Flow from a Gateway.
Run the Simulation
10. Run the simulation as normal. Note that the Start time in the Simulation Control view correspondsto the first value of the Time simulation that you imported and that the distribution of otherparameters is taken from the imported data.As part of setting up a Process for simulation, youspecify the duration of the Activities in the Process using a mathematical distribution (for example,Normal distribution). Alternatively, TIBCO Business Studio allows you to import any real historicaldata (for example, from log files) that you have about activity duration.
11. Create an Excel spreadsheet with the data that you want to import. The first row of cellscorresponds to the parameter names. Each column under the first row represents the parametervalues you wish to import. For example:
In this example, the parameter Existing Customer? can have the values Yes or No.
31
TIBCO Business Studio™ Simulation Guide

Note the following requirements for the spreadsheet that you use for data import:● The spreadsheet must have columns for Activity Name and Duration (though not
necessarily with those names).● You can include any number of other columns for import, but be careful to avoid stray
data in columns that you do not plan to import.● Data from the first worksheet is imported; other worksheets are ignored.
12. To import the spreadsheet containing your historical data, right-click the Process and select Import.
13. Select Historical Case Data (Activity Duration).
14. The names of the Project, Package and Process are displayed. Click Next.
15. Either click Browse or Browse Workspace to locate the Excel file. Press the Tab key (this activatesthe Next button). Click Next.
16. The Select Parameters dialog is displayed.
● Select the parameter that represents the Activity Name.● Select the parameter that represents the Activity Duration.● In the Map Activity Names: section, map the Activities in the spreadsheet to those in the
Process.
Click Next.
17. The next dialog allows you to map any parameters not already used in the previous dialog ontoActivities in the Process. Click Next.
18. For each Activity, there are three options for where the duration data is taken:
● use the data specified in the process rather than the imported data - do not select the Activity.● use the imported data to create a normal distribution - select the Activity, but select
IGNORED.● use the imported data, depending on a parameter setting - select the Activity and select the
Parameter that will be used to determine which values to use.
Clicking on each row gives the values, average duration and deviation from the average.
19. Click Finish.
20. The Simulation Properties view for Activities for which the duration is taken from the importeddata show information about the parameter names and values. For example:
32
TIBCO Business Studio™ Simulation Guide

Controlling Sequence Flow from a GatewayYou can control flow from a Gateway by creating a Parameter and values to be used as in a Rule. On aconditional Sequence Flow exiting the Gateway, you can specify that the Sequence Flow is followedonly when values for that Parameter match the expression specified in the Rule.
Procedure
1. To create the parameter, under the Process, right-click Parameters and select New Parameter.
2. Click Next to accept the default Project, Package and Process.
3. Enter the Name of the Parameter and its Type.
4. Click Finish to save the Parameter.
5. To add values to the parameters, highlight the Process and in the Properties view, click theSimulation tab.
6. Highlight the Parameter that you created, and click Add Value....
7. A new value with the name "New Value" is added under the Parameter. Double-click the name torename the value.
You can also remove values by selecting them and clicking Remove...
If you change an existing Parameter that is associated with a Gateway, you must alsospecify a new value for the conditional Sequence Flow (as described in the following task).
8. To associate thw gateway with the parameter, open the Process and click the Rule Parameter tab.
9. Enter the name of the Parameter that you created earlier.
Instead of entering the name of the Parameter, you can use an Eclipse feature calledContent Assist. Hold down the Ctrl key and press the spacebar. This allows you to selectfrom the available Parameters.
10. To specify a value for the conditional sequence flow, highlight the Conditional Sequence Flowleaving the Gateway.
11. In the Properties view, click the Rule tab. This allows you to create an expression using yourParameter and values. For example:
This shows that this Sequence Flow is only traversed when the isPaperworkCorrect Parameter hasthe value Wrong receipts. Any cases with other values for this Parameter will follow the defaultSequence Flow.
Monitoring SLAsTIBCO Business Studio allows you to set Service Level Agreement (SLA) thresholds for Activity Delayand Participant Utilization. When you simulate the Process, TIBCO Business Studio displays visualcues when these thresholds are exceeded.
Procedure
1. Open the Process.
33
TIBCO Business Studio™ Simulation Guide

2. Click an Activity for which you want to specify a maximum delay. In the Properties view, specifythe Maximum Delay SLA.
3. In the Project Explorer, click a Participant for whom you want to specify a utilization. In theProperties view for the Participant, enter the Minimum Utilization SLA (%) and the MaximumUtilization SLA (%).
While it is possible to require that a Participant is 100% utilized, in practice this is rarelythe case because of holidays, ancillary tasks, sickness and so on.
4. Simulate the Process. The SLA information is displayed next to the Activity in the third and fourthcolumns. For example:
The color of the bar is red in the third column because the SLA is not being met. In some cases thethreshold is displayed in red, but the bar is green like this:
This means that the threshold was exceeded, but the overall utilization was within the SLA.
Comparing SimulationsOften you want to compare the results of a simulation with another set of results, for example if you arefine tuning a Process or if you are making a business case for changing an existing Process. TIBCOBusiness Studio provides a Simulation Report view that allows you to do this.
Procedure
1. Select the set of results that you want to compare. Either:
● In the Project Explorer, right-click the Process for which you want to compare results and selectCompare Simulation Results. This opens the Simulation Report view with the resultsassociated with the Process.
● In the Project Explorer, expand the Simulation folder and its sub-folders and select therelevant .sim files that were created when you simulated the process (for example,2006-03-11_15-56-38.sim).
The filename of the simulation results file is automatically generated. It is easier tokeep track of several simulation results files if you rename them to use moremeaningful names by selecting the file and Refactor > Rename.
Select the two sets of results that you want to compare.
34
TIBCO Business Studio™ Simulation Guide

2. There are two pre-defined report types that you can use to create your reports:
● Case Cost-Time Analysis - shows charts and tables that display such information as theminimum, average and maximum case times for each experiment.
● Participant Utilization - shows charts that display idle time for the Participants in the process.
3. Select a report type and click Display Report. For more information about the Reports that aregenerated, see Compare Simulation Results View.
Creating and Viewing a Simulation ReportYou can create a report in HTML format that contains the results of a simulation.
The report contains the following:
● Cases - a summary of the simulation● Participants - information about Participants (for example, idle time)
● Activities - information about the cost of Activities, distribution into queues, wait times, and so on.
From the Simulation Results view, click in the upper right of the view.
Procedure
1. In the Simulation Report view, you can view the report.
2. The HTML file of the report is also saved to the Simulation folder where the Project is located.
Designing Custom ReportsTIBCO Business Studio allows you to create your own custom reports with the Eclipse BusinessIntelligence and Reporting Tools (BIRT). BIRT is an open source, Eclipse-based reporting system thatallows you to produce HTML and PDF reports.
The reports displayed in the Compare Simulation Results View are examples of BIRT reports providedby TIBCO.
BIRT is provided with TIBCO Business Studio, and you can use it to design and run your report. Formore information refer to the Eclipse BIRT documentation. When you design your report, make sure touse .sim files as a data source (.sim files are XML files that contain the results of simulation comparisonin TIBCO Business Studio).
This section describes how to create a new BIRT report for use in the Compare Simulation Resultseditor. This report is a simple table. To create the report follow these steps:
● Obtaining a Data Source● Creating a New Report● Creating the Data Source● Create the Data Set● Creating the Report Parameters● Creating a Table to Display the Data● Importing the Report
For more information about the different types of reports that you can create, refer to the Eclipse BIRTdocumentation.
35
TIBCO Business Studio™ Simulation Guide

Obtaining a Data SourceTo create a new BIRT report, you will need a sample XML data source file. Even though it has the samefile extension, this is not the same as the .sim result files.
You can obtain a sample data source using either of the following methods:
● In the Compare Simulation Results view, generate a BIRT report with one of the built-in reports.This generates a data file current workspace\.metadata\.plugins\com.tibco.xpd.simulation.compare\.temp\results.sim.
● Alternatively, locate the file Studio\3.7\studio-addins\eclipse\plugins\com.tibco.xpd.simulation.compare_version.jar. Open it in WinZip and extract the filesample.sim.
Creating a New ReportAfter you have obtained a sample data source file, create the report.
Procedure
1. Locate a folder in the Project Explorer to store the new BIRT report.
2. Right-click the folder and select New > Other .
In the New wizard expand Business Intelligence and Reporting Tools, select Report, and clickNext.
3. Enter a file name for the report using the .rptdesign file extension, then click Finish to start with ablank report.
4. The Report editor opens with the new report and you are prompted to change to the Report Designperspective.
Creating the Data SourceTo access data for a BIRT report, you must use a BIRT data source. A BIRT data source is an object thatcontains connection parameters.
Before creating a data source or multiple sources for your first reports, consider the issues of projectand resource organization. If you plan to reuse a data source in multiple report projects, you can createthat data source in a library and reuse that data source from the library. The advantage of this approachis that updates to the BIRT data source in the library are subsequently available to all reports that usethe library.
Use the Data Explorer, as described in this section, to create and manage BIRT data sources. BIRTReport Designer supports using multiple data sources for the report design. The data sources can be ofdifferent types. For example, you can use data from an RDBMS database and data from a flat filerepository in the same report design. In this example, the data is extracted from the sample XML datasource file.
Procedure
1. In the Data Explorer view, right-click Data Sources and select New Data Source.
2. Select XML Data Source, enter a name for the data source, and click Next.
36
TIBCO Business Studio™ Simulation Guide

3. Select the sample data source file (obtained in Obtaining a Data Source):a) Click Browse (to the right of the upper text entry field).b) In the Open dialog, change the Files of type filter from *.xml to *.*.c) Select the sample data source file (obtained in Obtaining a Data Source), and click Finish.
4. In the Data Explorer view, double-click the newly created data source in the and select PropertyBinding.
In the XML Data Source File field, enter params["sourcexml"] and click OK.
The parameter (params["sourcexml"]) is passed to the report at runtime.
37
TIBCO Business Studio™ Simulation Guide

Create the Data SetA data set identifies the data to retrieve from the data source.
Procedure
1. In the Data Explorer view, right-click Data Sets and select New Data Set.2. Enter a name for the data set and click Next.3. In the Sample XML Settings dialog, click Next to accept the default settings.4. On the Row Mapping dialog, select Participant, and click the central arrow button to set the XPath
expression. Accept the default XPath expression in the resulting dialog and click OK:
5. The Row Mapping dialog should look like this:
6. Click Next.7. In the Column Mapping dialog, select the participant Name, AverageIdle, and AverageBusy,
accepting the default column mapping for each. The dialog should look like this:
38
TIBCO Business Studio™ Simulation Guide

8. Click Finish.
The Edit Data Set dialog is displayed, allowing you to further define the data set. Click OK to acceptthe default values.
Creating the Report ParametersCreate a parameter to point to the sample XML data source file for the report.
Procedure
1. In the Data Explorer view, right-click Report Parameters and select New Parameter.
2. Give the parameter the name sourcexml then click OK.
Creating a Table to Display the DataIn this task, create a table to display the data from the data set that you created previously. You start byinserting a table element, then you insert data elements in the table.
Procedure
1. In the Report Design perspective, select Window > Show View > Palette .
2. From the Palette, drag a table element onto the report. Click OK in the following dialog to create athree column table:
39
TIBCO Business Studio™ Simulation Guide
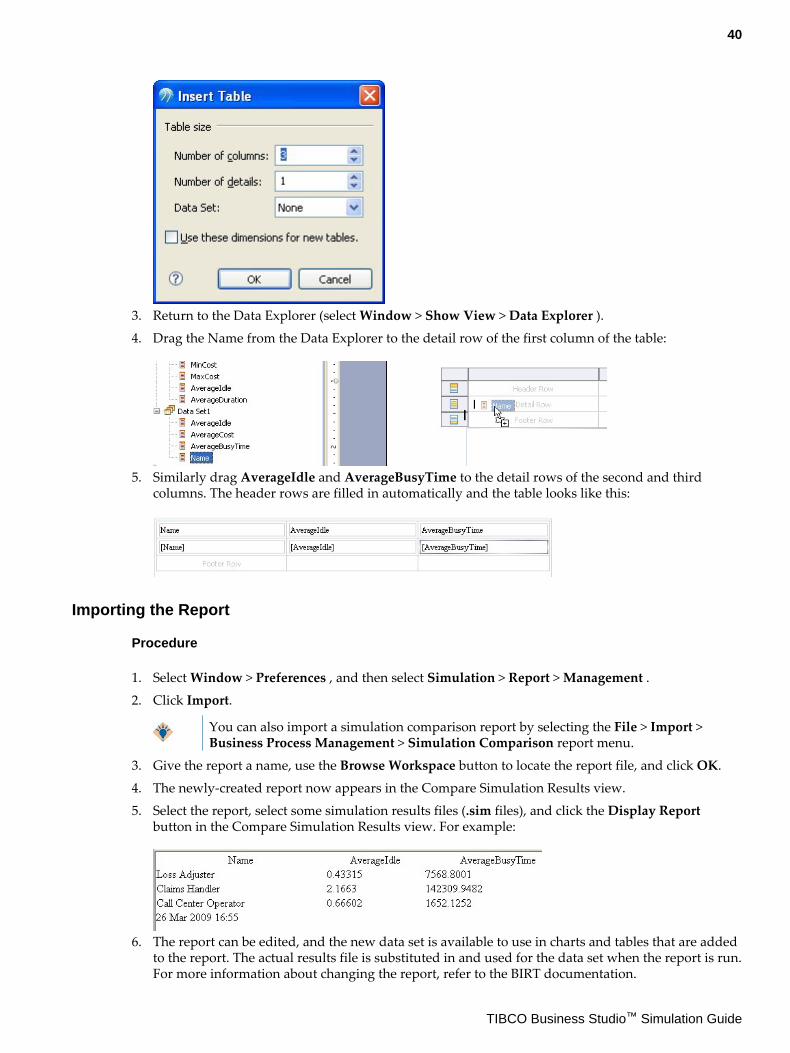
3. Return to the Data Explorer (select Window > Show View > Data Explorer ).
4. Drag the Name from the Data Explorer to the detail row of the first column of the table:
5. Similarly drag AverageIdle and AverageBusyTime to the detail rows of the second and thirdcolumns. The header rows are filled in automatically and the table looks like this:
Importing the Report
Procedure
1. Select Window > Preferences , and then select Simulation > Report > Management .
2. Click Import.
You can also import a simulation comparison report by selecting the File > Import >Business Process Management > Simulation Comparison report menu.
3. Give the report a name, use the Browse Workspace button to locate the report file, and click OK.
4. The newly-created report now appears in the Compare Simulation Results view.
5. Select the report, select some simulation results files (.sim files), and click the Display Reportbutton in the Compare Simulation Results view. For example:
6. The report can be edited, and the new data set is available to use in charts and tables that are addedto the report. The actual results file is substituted in and used for the data set when the report is run.For more information about changing the report, refer to the BIRT documentation.
40
TIBCO Business Studio™ Simulation Guide

Editing the ReportWith the report added to your workspace and available in the Compare Simulation Results view, youcan customize the report to suit your needs.
Procedure
1. Edit the report in the Report Design view.
2. Save the report.
3. Click the Display Report button in the Compare Simulation Results view to see the effect of yourchanges on a report generated from real data.
Customizing Simulation PreferencesYou can customize the annotation selections, report management, and validation that is performed forsimulation. For validation errors you can specify its severity level as Error, Warning, Info, or Ignore.
Procedure
1. Select Window > Preferences .
2. Select Simulation. The following dialog is displayed:
This allows you to control whether you are prompted to confirm changing the perspective whenyou run simulation. If desired, change the setting and click Apply.
3. Expand Simulation and click Annotation Selection. The following dialog is displayed:
This allows you to customize the annotations that are displayed when the Process is beingsimulated. For an explanation of these annotations see View the Simulation Progress. If desired,change the settings and click Apply.
4. Expand Simulation and click Report Management. The following dialog is displayed:
41
TIBCO Business Studio™ Simulation Guide

This dialog allows you to edit, delete or import reports to be used with simulation. For moreinformation see Designing Custom Reports.
5. Expand Process Editor and select Errors/Warnings. From the drop-down list, select Simulation. Thefollowing dialog is displayed:
6. If you want to change the severity level for a Simulation problem, select from the drop-down list.When you have finished, click Apply to effect any changes you have made.
7. The following dialog is displayed:
● Click Yes to revalidate your workspace. Depending on the size of the workspace and thenumber of errors, there is a delay while the revalidation occurs.
● Click No to revalidate your workspace later. The revalidation will take place when the conceptfile next changes or is saved, or when you explicitly request a rebuild of the project orworkspace.
● Click Cancel if you do not wish to apply your changes.
42
TIBCO Business Studio™ Simulation Guide

Reference
This section of the help describes the major parts of the TIBCO Business Studio user interface that arerelated to simulation.
In Eclipse, a Perspective includes the views and set of editors that you commonly use for a specific typeof work. TIBCO has created several TIBCO Business Studio perspectives that include the views andeditors you commonly use when creating and simulating business processes. This section describes theviews contained in the Simulation Perspective.
Simulation Control ViewThis view contains a toolbar that allows you to pause, resume or stop a running simulation.
It also shows the following:
● Process name - name of the Process used to run the simulation.● Simulation speed - a slider for increasing or decreasing the rate at which the simulation executes.● Simulation progress - a visual representation of the number of simulation cases run against the
number of cases to be run.● Simulation time - the number of minutes that have elapsed since the start of the simulation.● Start time - the date/time (in simulated, not real time) that you want the simulation to begin (once
the simulation starts you cannot modify the Start time).● Current time - the date/time the simulation finishes (Start time + Elapsed time)
Simulation Results ViewThis view shows simulation data about running and completed simulations. It displays informationabout the cost of Activities such as the average cost, minimum and maximum cost and so on:
Cases
Property Meaning
Started Cases The number of cases started. This is configured on the Simulationproperties of the Start event.
Finished Cases The number of cases completed. When the simulation runs tocompletion, this should equal the number of cases started.
Average Case Time The average time it takes to complete a case. The time unit isconfigured on the Simulation properties of the Start event.
Min. Case Time The fastest that a case was processed.
Max. Case Time The longest a case took to be processed.
Average Cost The average cost of a Case in the Process (based on the ParticipantCosts and Activity Durations).
Min. Cost The lowest cost case of the simulation run.
Max. Cost The highest cost case of the simulation run.
43
TIBCO Business Studio™ Simulation Guide

Property Meaning
Cumulative Cost The total cost of all the cases in the simulation run.
Participants
Property Meaning
Name Name of the Participant.
Count Number of Participants (specified on the Simulation properties ofthe Participant).
Current Idle Count Number of Idle Participants (for example, if you pause thesimulation before it finishes).
Average Idle Count Average number of idle Participants.
Average Idle Time Average amount of time the Participant spent not handling a case.
Activities
Property Meaning
Name Name of the Activity.
Processed Cases Number of cases processed by this Activity.
Current Queue Size Number of cases currently queued for this Activity.
Max Queue Size The maximum number of cases that were queued for this Activity.
Average Queue Size The average number of cases that were queued for this Activity.
Average Wait The average time a case spends queued.
Average Cost The average cost of an Activity (calculated using the cost of theParticipant and the time spent on the Activity).
Min Cost The lowest Activity cost.
Max Cost The highest Activity cost.
Cumulative Cost The total cost of the Activity to that point in the simulation(calculated by multiplying the average cost times the number ofcases).
Simulation Report View
This view displays an HTML report of a simulation run. To view a report, you must first create one (see Creating and Viewing a Simulation Report).
44
TIBCO Business Studio™ Simulation Guide

Simulation Properties ViewWhen you display a Process in TIBCO Business Studio and click in the white area of the Lane, theProperties view for the Process itself is displayed. Click the Simulation tab, and you can viewinformation about the simulation data for the Process.
For example:
This shows that the gateway g1 has two output Sequence Flows (Id 3 and Id 4) and that one will pass67.1% of the cases and the other 32.9%. The percentages are calculated automatically based on theweighting that you enter.
The weighting can either be:
● a number related to the total number of cases you want to simulate. For example of a total of 100cases the weighting could be specified as 67:33.
● based upon a known weighting regardless of the total number of cases, as illustrated in the previousexample, where the weighting is 200:98.
In either case, the weighting is simply converted to a percentage of the total weighting and used by thesimulation engine.
The simulation parameters in the Simulation Properties view do not necessarily correspond exactly tothe Process itself. For example, if you delete a Gateway or a Sequence Flow from your Process, thesimulation parameters for these objects are retained in the Simulation Properties view. This is becauseyou may still want to manipulate these parameters for the purposes of simulation.
You can delete simulation parameters that are no longer relevant to your Process by right-clicking themand selecting Delete. If you mistakenly delete a parameter that is still needed for simulation, TIBCOBusiness Studio re-creates this parameter when you re-run the simulation, however the parameter is re-created with the default weighting (any weighting changes you have made are lost).
Compare Simulation Results ViewThis view allows you to create comparisons based on one or more sets of simulation results.
For example:
45
TIBCO Business Studio™ Simulation Guide

The following sections discuss the comparison tools.
Case Cost-Time AnalysisThis comparison tool shows information about the time it takes for a case to complete (the cycle time)and also about the cost of cases.
Name Description
Case Cycle Time Comparison This is a bar chart that shows the minimum, average and maximumcase cycle times. This is useful if you are modifying a Process withthe goal of reducing one of these measures (for example, a callcenter that wants to reduce the average time each call takes).
Case Time Comparison toProcess
This table shows the average case time for each simulation anddisplays the percent change against the first Process that youselected.
Case Cost Comparison This bar chart shows the minimum, average and maximum cost forcases. This case cost is calculated based upon the activitiesperformed, their duration and the cost of the Participant performingthe activities. This chart can be useful if you are trying to achieve areduction in case costs, for example by reducing the Activityduration or the cost of Participants.
Case Cost Comparison toProcess
This table shows the average case costs for each simulation and thepercent change against the first Process that you selected.
Average Cost/TimeComparison
This graph compares the average cost and time of each simulation.
46
TIBCO Business Studio™ Simulation Guide

Participant UtilizationThis comparison tool shows how much time is spent idle by all the Participants in a simulation and byeach Participant.
Name Description
Resource Idle Time Report This chart shows how much time is spent idle by Participants ineach simulation.
Participant Idle Times byExperiment
This section displays a pie chart showing idle time for eachParticipant.
Simulation DataSimulation Data is added to a Process using the Simulation tab on the Activity Properties view, theStart Event Properties view and the Participant Properties view.
See Assign Activity Duration.
See Assign Unit Costs to Participants.
See Set the Number of Simulation Cases.
47
TIBCO Business Studio™ Simulation Guide