Embed Size (px)
Citation preview

Tibero
Monitoring Guide
Copyright © 2014 TIBERO Co., Ltd. All Rights Reserved.
Copyright Notice
Copyright © 2014 TIBERO Co., Ltd. All Rights Reserved.
5, Hwangsaeul-ro 329beon-gil, Bundang-gu, Seongnam-si, Gyeonggi-do, Korea
Restricted Rights Legend
All TIBERO Software (Tibero®) and documents are protected by copyright laws and international
convention.TIBERO software and documents are made available under the terms of the TIBERO License
Agreement and may only be used or copied in accordance with the terms of this agreement. No part of
this document may be transmitted, copied, deployed, or reproduced in any form or by any means,
electronic, mechanical, or optical, without the prior written consent of TIBERO Co., Ltd.
Trademarks
Tibero DB® is a registered trademark of TIBERO Co., Ltd. Other products, titles or services may be
registered trademarks of their respective companies.
Document Information
Document Name: Tibero Monitoring Guide
Document Created: 2014-01-15
Software Version: Tibero 5
Document Version: 2.1.1
Table of Contents
About This Document .................................................................................................. vii
Chapter 1. Basic Information ...................................................................................... 1
1.1. Tibero Instance and Database Information ....................................................... 1
1.2. TSM (Tibero Shared Memory) Information ....................................................... 2
Chapter 2. Memory ..................................................................................................... 7
2.1. Database Buffer Cache Hit Ratio ..................................................................... 7
2.2. SQL Cache Hit Ratio ...................................................................................... 9
2.3. Dictionary Cache Hit Ratio ............................................................................ 11
2.4. Free Memory of the Shared Cache ................................................................ 12
Chapter 3. Tibero Standby Event .............................................................................. 15
3.1. V$SYSTEM_EVENT .................................................................................... 15
3.2. V$SYSSTAT ................................................................................................. 24
3.3. Spinlock Contention ..................................................................................... 27
3.4. Spinlock Monitoring ...................................................................................... 32
Chapter 4. Lock & Current Transaction ..................................................................... 41
4.1. Number of Current Sessions ......................................................................... 41
4.2. Current Transaction ...................................................................................... 43
4.3. Current SQL Information (for Sessions) ......................................................... 46
4.4. WLOCK Information (for Sessions) ................................................................ 47
4.5. WLOCK Holder & Waiter Information ............................................................. 50
Chapter 5. Disk I/O Monitoring .................................................................................. 55
5.1. Data File I/O ................................................................................................ 55
5.2. Online Redo Log Switch Count ..................................................................... 58
Chapter 6. Space Management ................................................................................. 63
6.1. Occurrence of Frequent Extents .................................................................... 63
6.2. Tablespace Usage Rate ................................................................................ 64
6.3. Undo Segment Usage Rate .......................................................................... 66
6.3.1. Undo Segment Query ........................................................................ 66
6.3.2. Checking Currently Used Undo .......................................................... 70
6.3.3. Manually Reducing Undo Segments ................................................... 73
Chapter 7. Parameter Tuning ..................................................................................... 75
7.1. Location Setting Parameters ......................................................................... 75
7.2. Optimizer Configuration Parameter ................................................................ 75
7.3. Execute Memory Parameter .......................................................................... 75
7.4. Other Configuration Parameters .................................................................... 76
7.5. Database I/O Tuning ..................................................................................... 77
Tibero iii

List of Figures
[Figure 3.1] Results of Performing V$session_wait ........................................................ 22
[Figure 3.2] Results of Performing V$system_event ...................................................... 23
[Figure 3.3] Effect of Improving WE_LOG_FLUSH_COMMIT ......................................... 23
[Figure 3.4] WE_BUF_WAIT event ............................................................................... 23
[Figure 3.5] The Spin Lock Acquisition Process ............................................................ 31
Tibero v

About This Document
Intended Audience
This guide is intended for database users who monitor the Tibero system.
Required Knowledge
This guide describes monitoring methods. To fully understand this guide, users must have an
understanding of the following:
● Databases
● RDBMS
● OS and system environments
● UNIX and Linux
Document Scope
This Tibero monitoring guide contains information required for actual application and operation.
About This Document vii
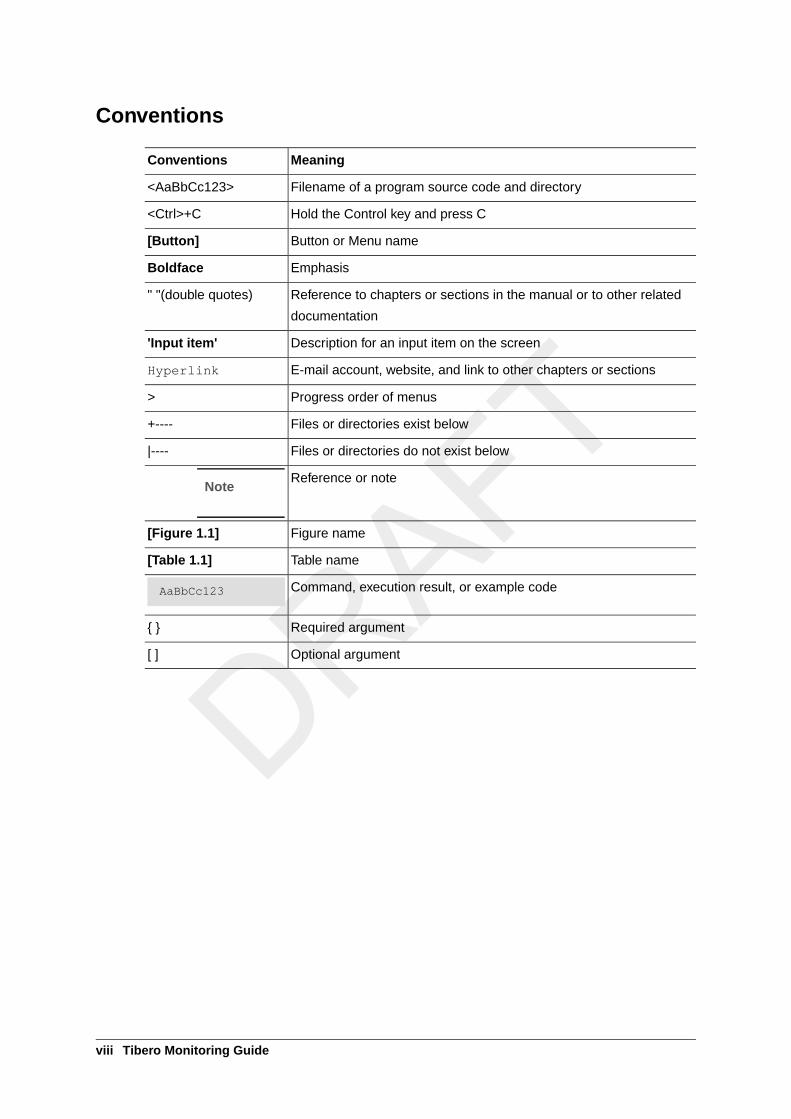
Conventions
MeaningConventions
Filename of a program source code and directory<AaBbCc123>
Hold the Control key and press C<Ctrl>+C
Button or Menu name[Button]
EmphasisBoldface
Reference to chapters or sections in the manual or to other related
documentation
" "(double quotes)
Description for an input item on the screen'Input item'
E-mail account, website, and link to other chapters or sectionsHyperlink
Progress order of menus>
Files or directories exist below+----
Files or directories do not exist below|----
Reference or noteNote
Figure name[Figure 1.1]
Table name[Table 1.1]
Command, execution result, or example code AaBbCc123
Required argument{ }
Optional argument[ ]
viii Tibero Monitoring Guide
Chapter 1. Basic Information
This chapter contains the basic information about the Tibero database and TSM.
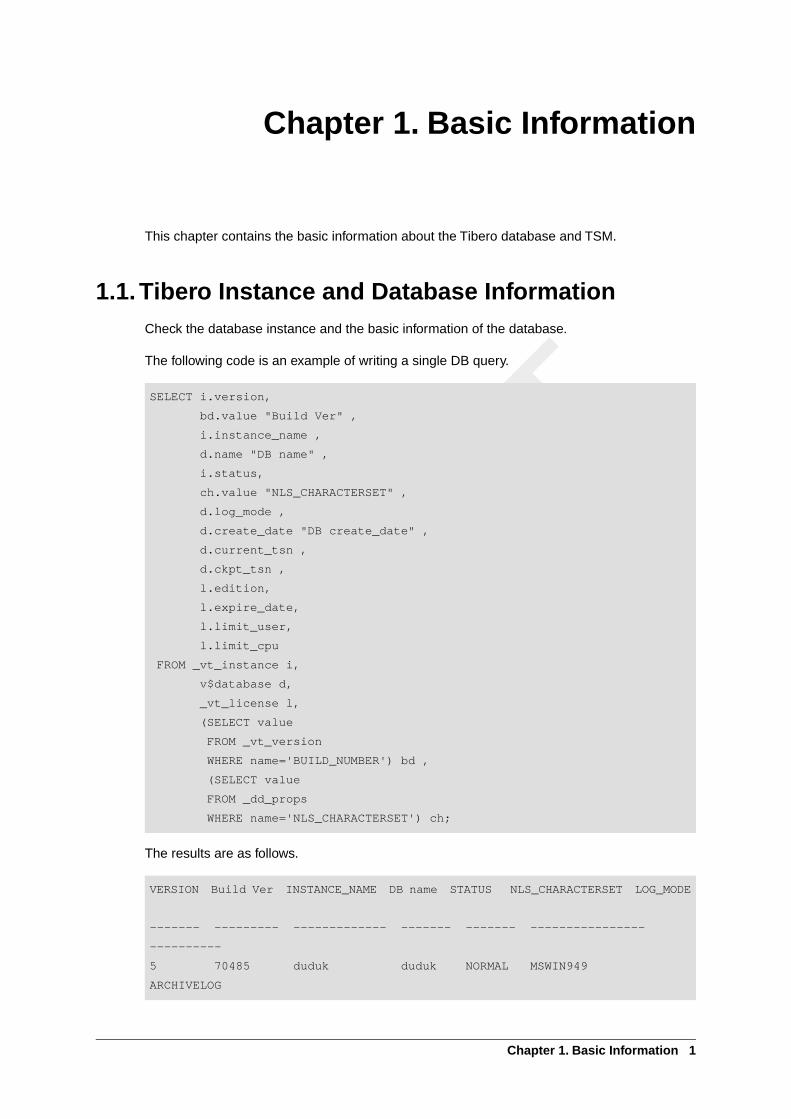
1.1.Tibero Instance and Database InformationCheck the database instance and the basic information of the database.
The following code is an example of writing a single DB query.
SELECT i.version,
bd.value "Build Ver" ,
i.instance_name ,
d.name "DB name" ,
i.status,
ch.value "NLS_CHARACTERSET" ,
d.log_mode ,
d.create_date "DB create_date" ,
d.current_tsn ,
d.ckpt_tsn ,
l.edition,
l.expire_date,
l.limit_user,
l.limit_cpu
FROM _vt_instance i,
v$database d,
_vt_license l,
(SELECT value
FROM _vt_version
WHERE name='BUILD_NUMBER') bd ,
(SELECT value
FROM _dd_props
WHERE name='NLS_CHARACTERSET') ch;
The results are as follows.
VERSION Build Ver INSTANCE_NAME DB name STATUS NLS_CHARACTERSET LOG_MODE
------- --------- ------------- ------- ------- ----------------
----------
5 70485 duduk duduk NORMAL MSWIN949
ARCHIVELOG
Chapter 1. Basic Information 1
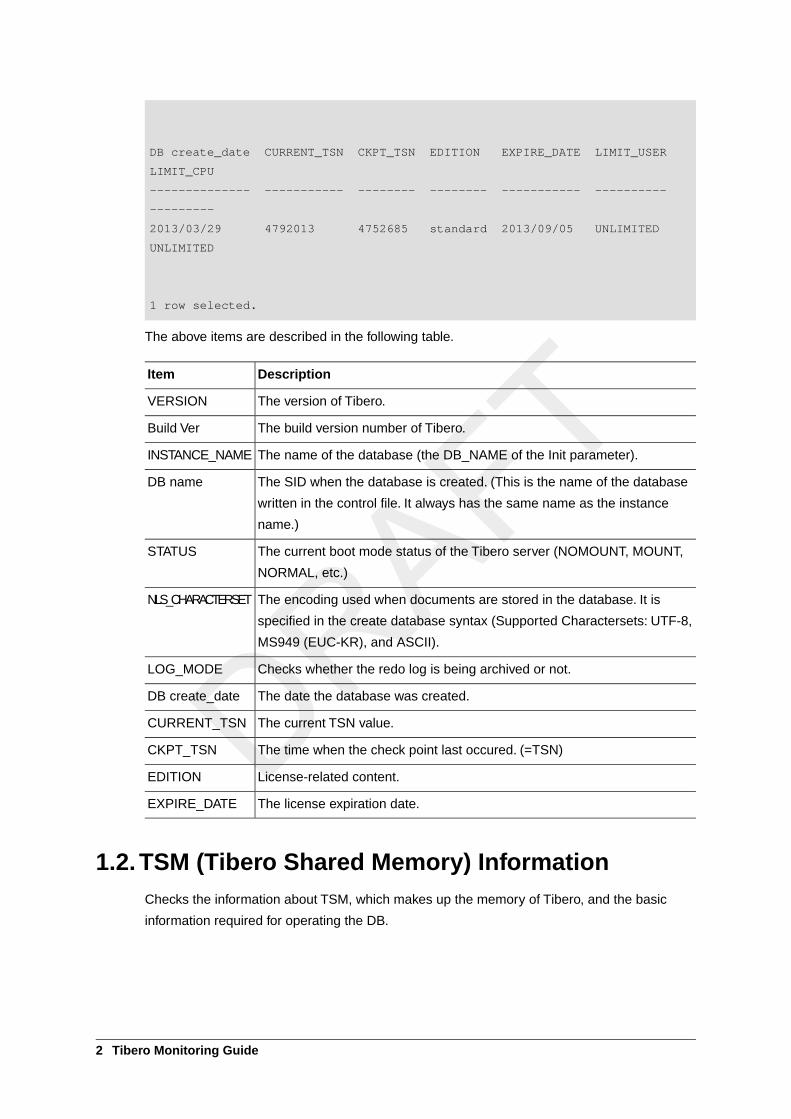
DB create_date CURRENT_TSN CKPT_TSN EDITION EXPIRE_DATE LIMIT_USER
LIMIT_CPU
-------------- ----------- -------- -------- ----------- ----------
---------
2013/03/29 4792013 4752685 standard 2013/09/05 UNLIMITED
UNLIMITED
1 row selected.
The above items are described in the following table.
DescriptionItem
The version of Tibero.VERSION
The build version number of Tibero.Build Ver
The name of the database (the DB_NAME of the Init parameter).INSTANCE_NAME
The SID when the database is created. (This is the name of the database
written in the control file. It always has the same name as the instance
name.)
DB name
The current boot mode status of the Tibero server (NOMOUNT, MOUNT,
NORMAL, etc.)
STATUS
The encoding used when documents are stored in the database. It is
specified in the create database syntax (Supported Charactersets: UTF-8,
MS949 (EUC-KR), and ASCII).
NLS_CHARACTERSET
Checks whether the redo log is being archived or not.LOG_MODE
The date the database was created.DB create_date
The current TSN value.CURRENT_TSN
The time when the check point last occured. (=TSN)CKPT_TSN
License-related content.EDITION
The license expiration date.EXPIRE_DATE
1.2.TSM (Tibero Shared Memory) InformationChecks the information about TSM, which makes up the memory of Tibero, and the basic
information required for operating the DB.
2 Tibero Monitoring Guide
Single DB
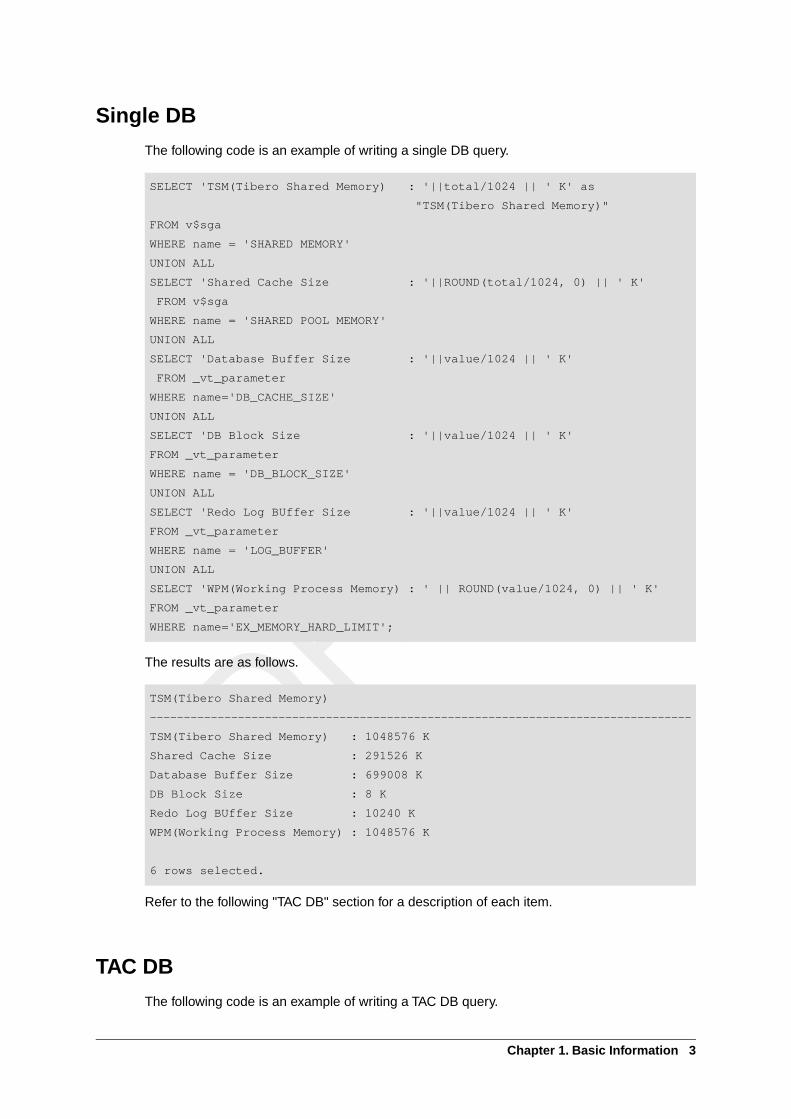
The following code is an example of writing a single DB query.
SELECT 'TSM(Tibero Shared Memory) : '||total/1024 || ' K' as
"TSM(Tibero Shared Memory)"
FROM v$sga
WHERE name = 'SHARED MEMORY'
UNION ALL
SELECT 'Shared Cache Size : '||ROUND(total/1024, 0) || ' K'
FROM v$sga
WHERE name = 'SHARED POOL MEMORY'
UNION ALL
SELECT 'Database Buffer Size : '||value/1024 || ' K'
FROM _vt_parameter
WHERE name='DB_CACHE_SIZE'
UNION ALL
SELECT 'DB Block Size : '||value/1024 || ' K'
FROM _vt_parameter
WHERE name = 'DB_BLOCK_SIZE'
UNION ALL
SELECT 'Redo Log BUffer Size : '||value/1024 || ' K'
FROM _vt_parameter
WHERE name = 'LOG_BUFFER'
UNION ALL
SELECT 'WPM(Working Process Memory) : ' || ROUND(value/1024, 0) || ' K'
FROM _vt_parameter
WHERE name='EX_MEMORY_HARD_LIMIT';
The results are as follows.
TSM(Tibero Shared Memory)
--------------------------------------------------------------------------------
TSM(Tibero Shared Memory) : 1048576 K
Shared Cache Size : 291526 K
Database Buffer Size : 699008 K
DB Block Size : 8 K
Redo Log BUffer Size : 10240 K
WPM(Working Process Memory) : 1048576 K
6 rows selected.
Refer to the following "TAC DB" section for a description of each item.
TAC DB
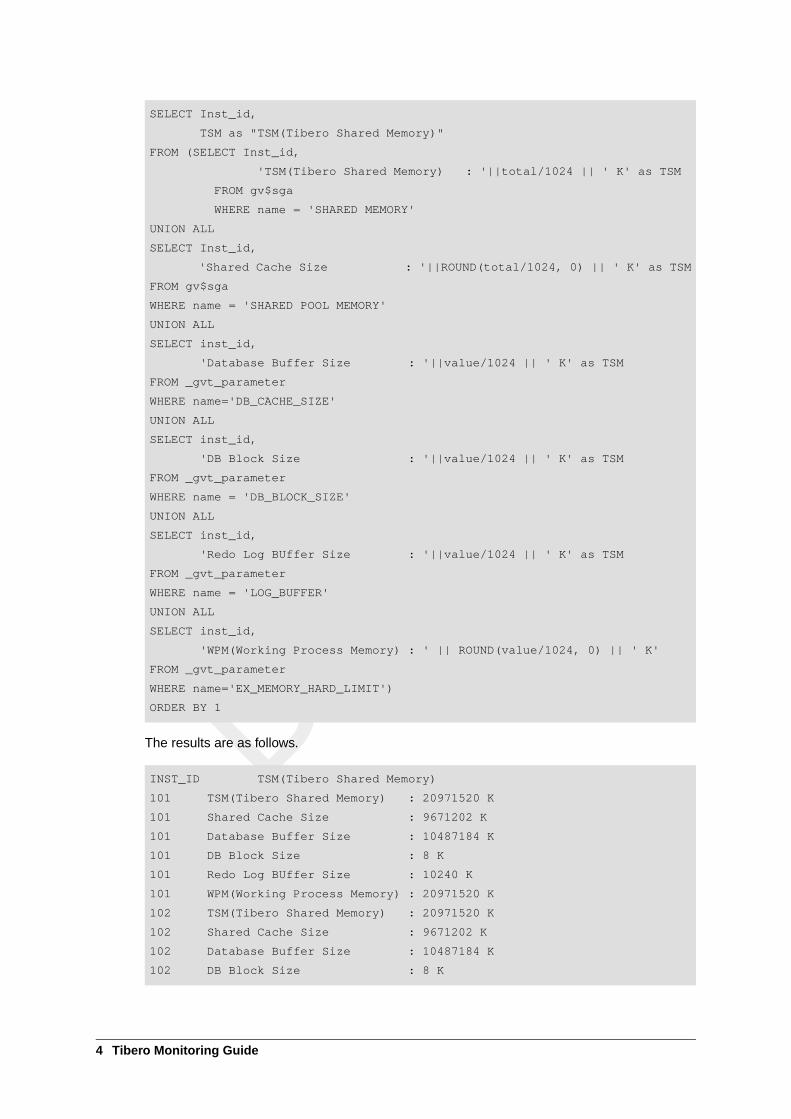
The following code is an example of writing a TAC DB query.
Chapter 1. Basic Information 3
SELECT Inst_id,
TSM as "TSM(Tibero Shared Memory)"
FROM (SELECT Inst_id,
'TSM(Tibero Shared Memory) : '||total/1024 || ' K' as TSM
FROM gv$sga
WHERE name = 'SHARED MEMORY'
UNION ALL
SELECT Inst_id,
'Shared Cache Size : '||ROUND(total/1024, 0) || ' K' as TSM
FROM gv$sga
WHERE name = 'SHARED POOL MEMORY'
UNION ALL
SELECT inst_id,
'Database Buffer Size : '||value/1024 || ' K' as TSM
FROM _gvt_parameter
WHERE name='DB_CACHE_SIZE'
UNION ALL
SELECT inst_id,
'DB Block Size : '||value/1024 || ' K' as TSM
FROM _gvt_parameter
WHERE name = 'DB_BLOCK_SIZE'
UNION ALL
SELECT inst_id,
'Redo Log BUffer Size : '||value/1024 || ' K' as TSM
FROM _gvt_parameter
WHERE name = 'LOG_BUFFER'
UNION ALL
SELECT inst_id,
'WPM(Working Process Memory) : ' || ROUND(value/1024, 0) || ' K'
FROM _gvt_parameter
WHERE name='EX_MEMORY_HARD_LIMIT')
ORDER BY 1
The results are as follows.
INST_ID TSM(Tibero Shared Memory)
101 TSM(Tibero Shared Memory) : 20971520 K
101 Shared Cache Size : 9671202 K
101 Database Buffer Size : 10487184 K
101 DB Block Size : 8 K
101 Redo Log BUffer Size : 10240 K
101 WPM(Working Process Memory) : 20971520 K
102 TSM(Tibero Shared Memory) : 20971520 K
102 Shared Cache Size : 9671202 K
102 Database Buffer Size : 10487184 K
102 DB Block Size : 8 K
4 Tibero Monitoring Guide
102 Redo Log BUffer Size : 10240 K
102 WPM(Working Process Memory) : 20971520 K
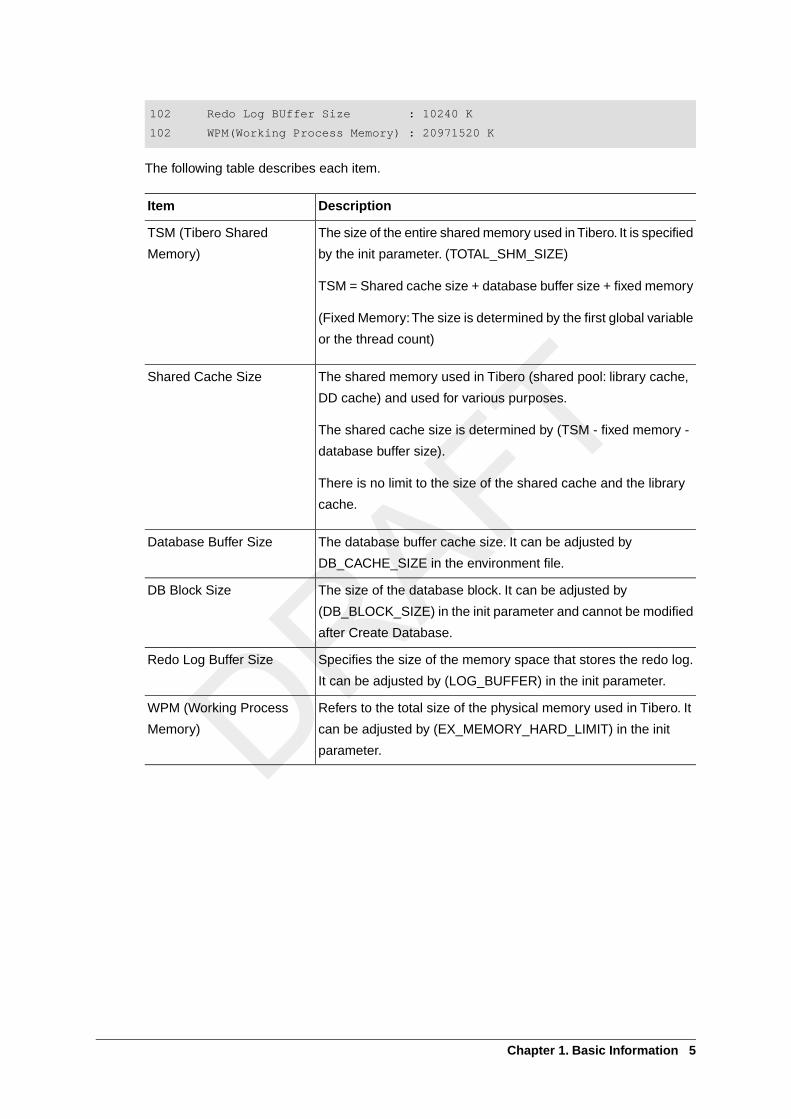
The following table describes each item.
DescriptionItem
The size of the entire shared memory used in Tibero. It is specified
by the init parameter. (TOTAL_SHM_SIZE)
TSM = Shared cache size + database buffer size + fixed memory
(Fixed Memory:The size is determined by the first global variable
or the thread count)
TSM (Tibero Shared
Memory)
The shared memory used in Tibero (shared pool: library cache,
DD cache) and used for various purposes.
The shared cache size is determined by (TSM - fixed memory -
database buffer size).
There is no limit to the size of the shared cache and the library
cache.
Shared Cache Size
The database buffer cache size. It can be adjusted by
DB_CACHE_SIZE in the environment file.
Database Buffer Size
The size of the database block. It can be adjusted by
(DB_BLOCK_SIZE) in the init parameter and cannot be modified
after Create Database.
DB Block Size
Specifies the size of the memory space that stores the redo log.
It can be adjusted by (LOG_BUFFER) in the init parameter.
Redo Log Buffer Size
Refers to the total size of the physical memory used in Tibero. It
can be adjusted by (EX_MEMORY_HARD_LIMIT) in the init
parameter.
WPM (Working Process
Memory)
Chapter 1. Basic Information 5

Chapter 2. Memory
This chapter describes the memory information used in Tibero.
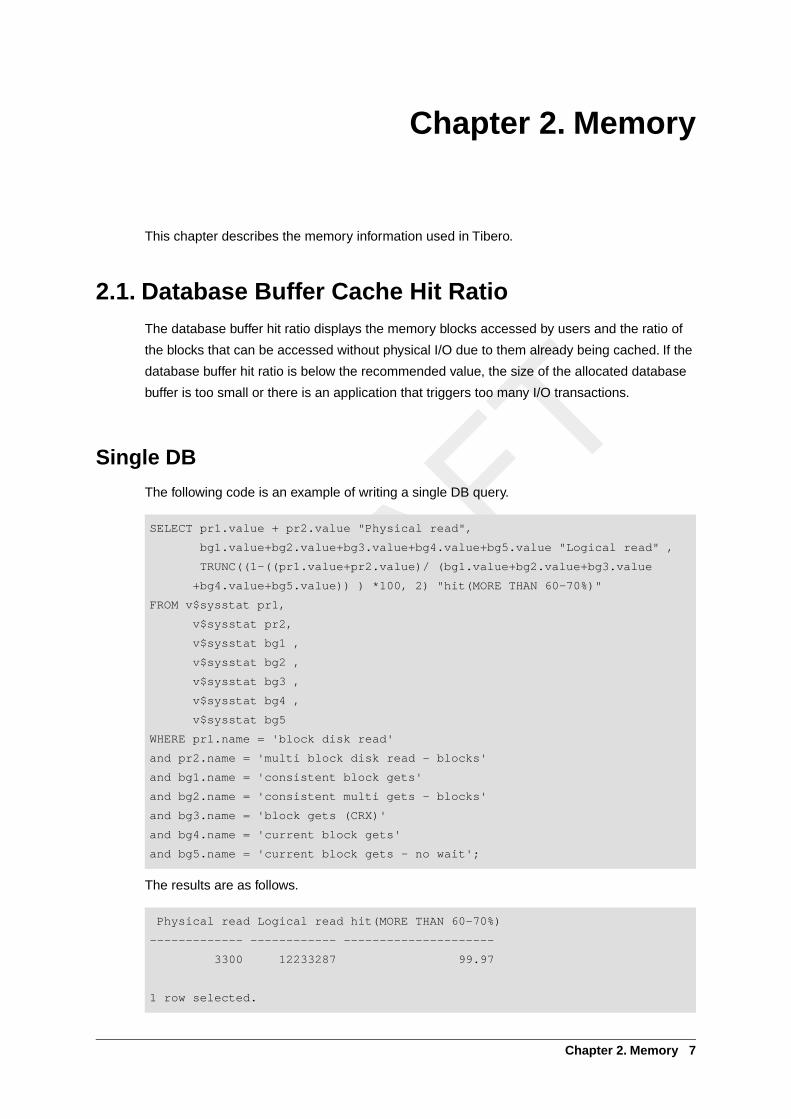
2.1. Database Buffer Cache Hit RatioThe database buffer hit ratio displays the memory blocks accessed by users and the ratio of
the blocks that can be accessed without physical I/O due to them already being cached. If the
database buffer hit ratio is below the recommended value, the size of the allocated database
buffer is too small or there is an application that triggers too many I/O transactions.
Single DB
The following code is an example of writing a single DB query.
SELECT pr1.value + pr2.value "Physical read",
bg1.value+bg2.value+bg3.value+bg4.value+bg5.value "Logical read" ,
TRUNC((1-((pr1.value+pr2.value)/ (bg1.value+bg2.value+bg3.value
+bg4.value+bg5.value)) ) *100, 2) "hit(MORE THAN 60-70%)"
FROM v$sysstat pr1,
v$sysstat pr2,
v$sysstat bg1 ,
v$sysstat bg2 ,
v$sysstat bg3 ,
v$sysstat bg4 ,
v$sysstat bg5
WHERE pr1.name = 'block disk read'
and pr2.name = 'multi block disk read - blocks'
and bg1.name = 'consistent block gets'
and bg2.name = 'consistent multi gets - blocks'
and bg3.name = 'block gets (CRX)'
and bg4.name = 'current block gets'
and bg5.name = 'current block gets - no wait';
The results are as follows.
Physical read Logical read hit(MORE THAN 60-70%)
------------- ------------ ---------------------
3300 12233287 99.97
1 row selected.
Chapter 2. Memory 7
Refer to the following "TAC DB" section for a description of each item.
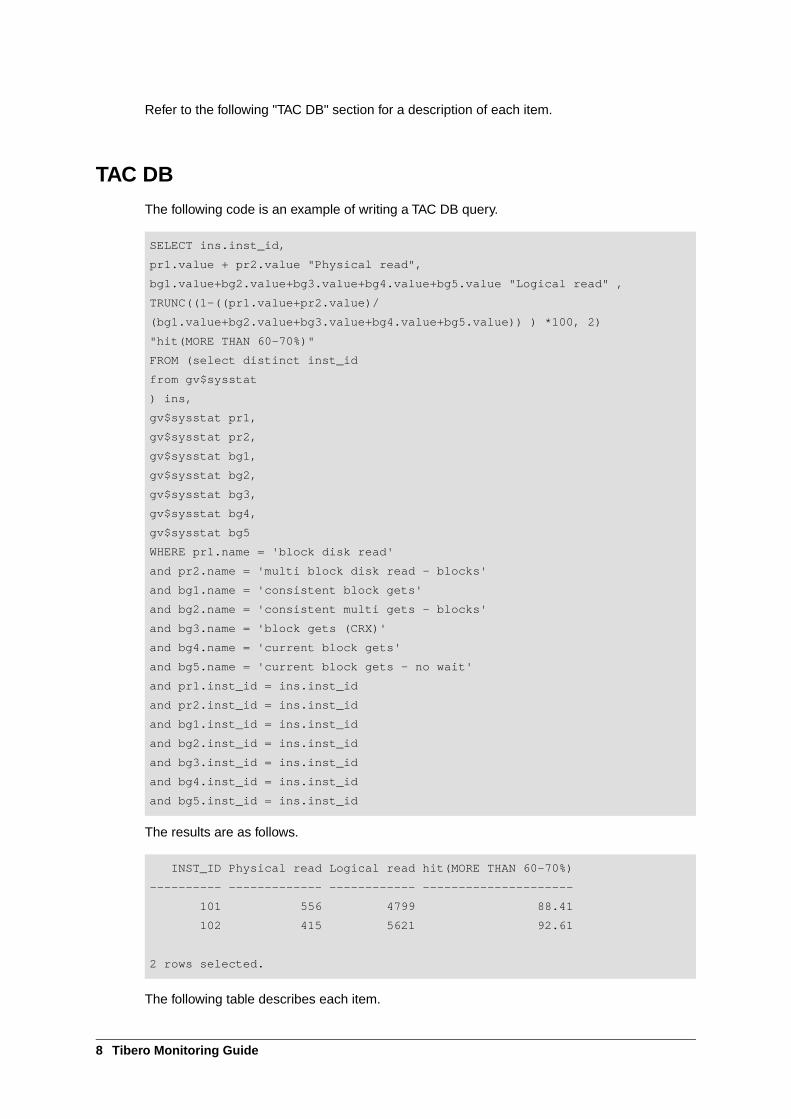
TAC DB
The following code is an example of writing a TAC DB query.
SELECT ins.inst_id,
pr1.value + pr2.value "Physical read",
bg1.value+bg2.value+bg3.value+bg4.value+bg5.value "Logical read" ,
TRUNC((1-((pr1.value+pr2.value)/
(bg1.value+bg2.value+bg3.value+bg4.value+bg5.value)) ) *100, 2)
"hit(MORE THAN 60-70%)"
FROM (select distinct inst_id
from gv$sysstat
) ins,
gv$sysstat pr1,
gv$sysstat pr2,
gv$sysstat bg1,
gv$sysstat bg2,
gv$sysstat bg3,
gv$sysstat bg4,
gv$sysstat bg5
WHERE pr1.name = 'block disk read'
and pr2.name = 'multi block disk read - blocks'
and bg1.name = 'consistent block gets'
and bg2.name = 'consistent multi gets - blocks'
and bg3.name = 'block gets (CRX)'
and bg4.name = 'current block gets'
and bg5.name = 'current block gets - no wait'
and pr1.inst_id = ins.inst_id
and pr2.inst_id = ins.inst_id
and bg1.inst_id = ins.inst_id
and bg2.inst_id = ins.inst_id
and bg3.inst_id = ins.inst_id
and bg4.inst_id = ins.inst_id
and bg5.inst_id = ins.inst_id
The results are as follows.
INST_ID Physical read Logical read hit(MORE THAN 60-70%)
---------- ------------- ------------ ---------------------
101 556 4799 88.41
102 415 5621 92.61
2 rows selected.
The following table describes each item.
8 Tibero Monitoring Guide
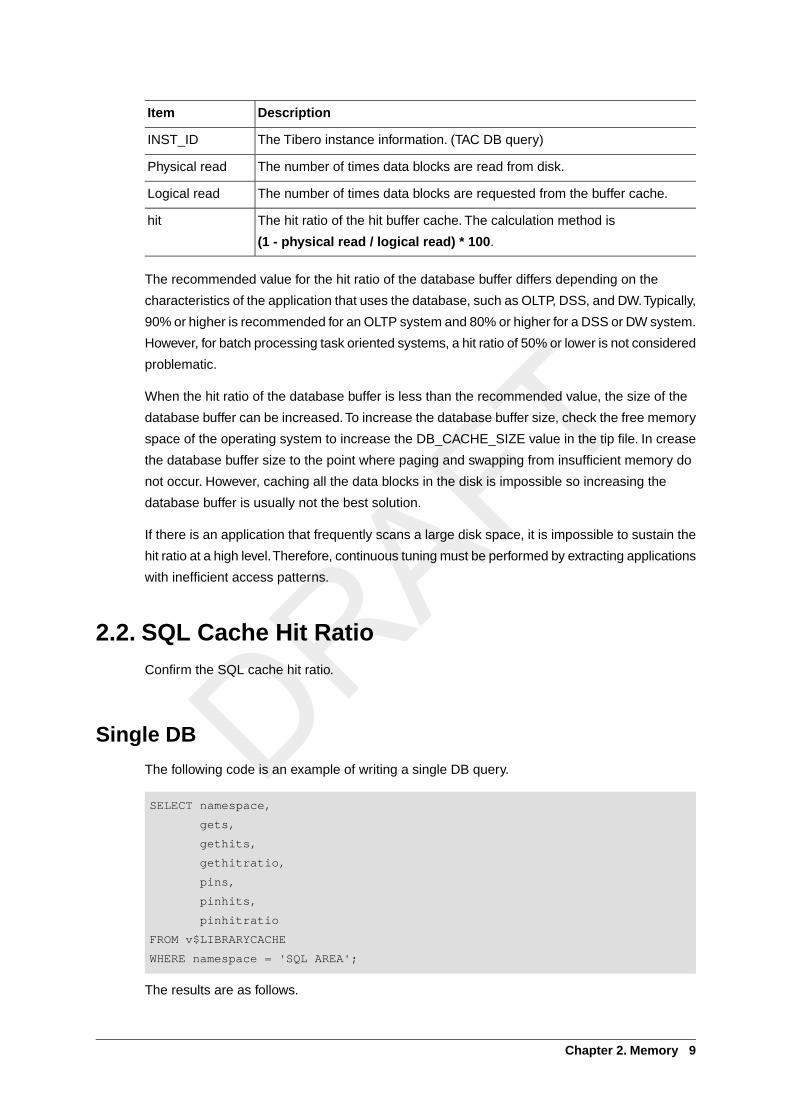
DescriptionItem
The Tibero instance information. (TAC DB query)INST_ID
The number of times data blocks are read from disk.Physical read
The number of times data blocks are requested from the buffer cache.Logical read
The hit ratio of the hit buffer cache. The calculation method is
(1 - physical read / logical read) * 100.
hit
The recommended value for the hit ratio of the database buffer differs depending on the
characteristics of the application that uses the database, such as OLTP, DSS, and DW.Typically,
90% or higher is recommended for an OLTP system and 80% or higher for a DSS or DW system.
However, for batch processing task oriented systems, a hit ratio of 50% or lower is not considered
problematic.
When the hit ratio of the database buffer is less than the recommended value, the size of the
database buffer can be increased.To increase the database buffer size, check the free memory
space of the operating system to increase the DB_CACHE_SIZE value in the tip file. In crease
the database buffer size to the point where paging and swapping from insufficient memory do
not occur. However, caching all the data blocks in the disk is impossible so increasing the
database buffer is usually not the best solution.
If there is an application that frequently scans a large disk space, it is impossible to sustain the
hit ratio at a high level.Therefore, continuous tuning must be performed by extracting applications
with inefficient access patterns.
2.2. SQL Cache Hit RatioConfirm the SQL cache hit ratio.
Single DB
The following code is an example of writing a single DB query.
SELECT namespace,
gets,
gethits,
gethitratio,
pins,
pinhits,
pinhitratio
FROM v$LIBRARYCACHE
WHERE namespace = 'SQL AREA';
The results are as follows.
Chapter 2. Memory 9
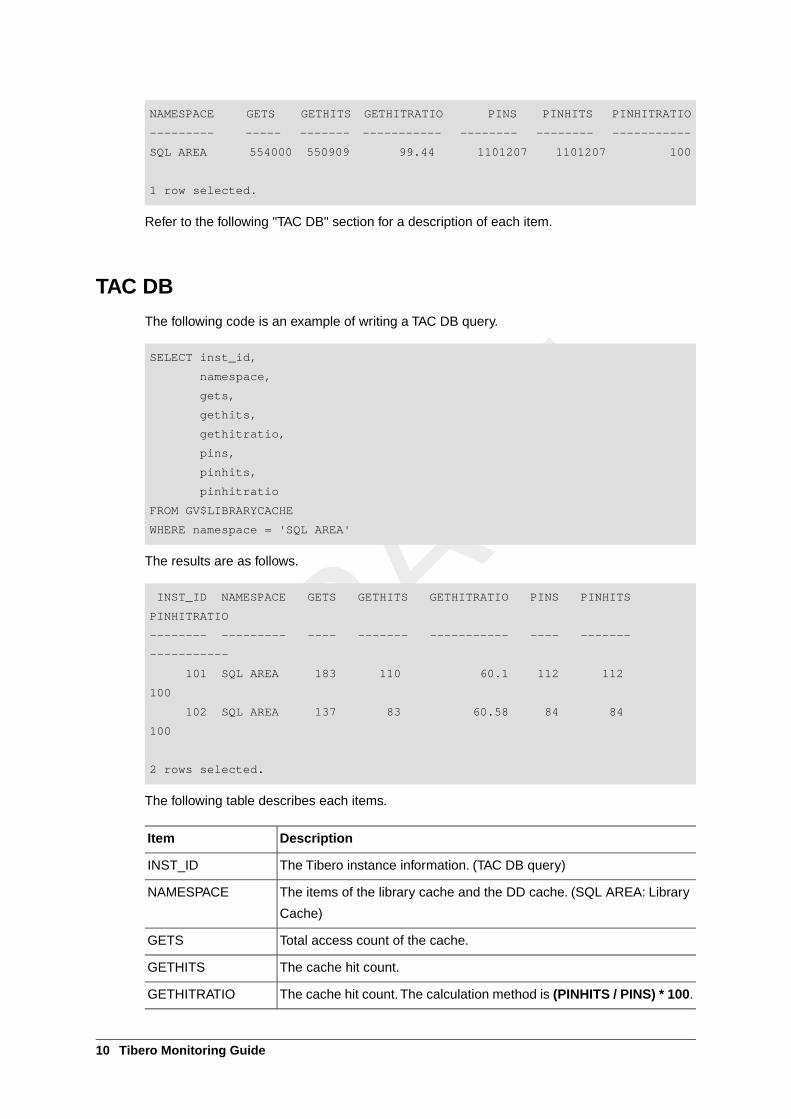
NAMESPACE GETS GETHITS GETHITRATIO PINS PINHITS PINHITRATIO
--------- ----- ------- ----------- -------- -------- -----------
SQL AREA 554000 550909 99.44 1101207 1101207 100
1 row selected.
Refer to the following "TAC DB" section for a description of each item.
TAC DB
The following code is an example of writing a TAC DB query.
SELECT inst_id,
namespace,
gets,
gethits,
gethitratio,
pins,
pinhits,
pinhitratio
FROM GV$LIBRARYCACHE
WHERE namespace = 'SQL AREA'
The results are as follows.
INST_ID NAMESPACE GETS GETHITS GETHITRATIO PINS PINHITS
PINHITRATIO
-------- --------- ---- ------- ----------- ---- -------
-----------
101 SQL AREA 183 110 60.1 112 112
100
102 SQL AREA 137 83 60.58 84 84
100
2 rows selected.
The following table describes each items.
DescriptionItem
The Tibero instance information. (TAC DB query)INST_ID
The items of the library cache and the DD cache. (SQL AREA: Library
Cache)
NAMESPACE
Total access count of the cache.GETS
The cache hit count.GETHITS
The cache hit count.The calculation method is (PINHITS / PINS) * 100.GETHITRATIO
10 Tibero Monitoring Guide
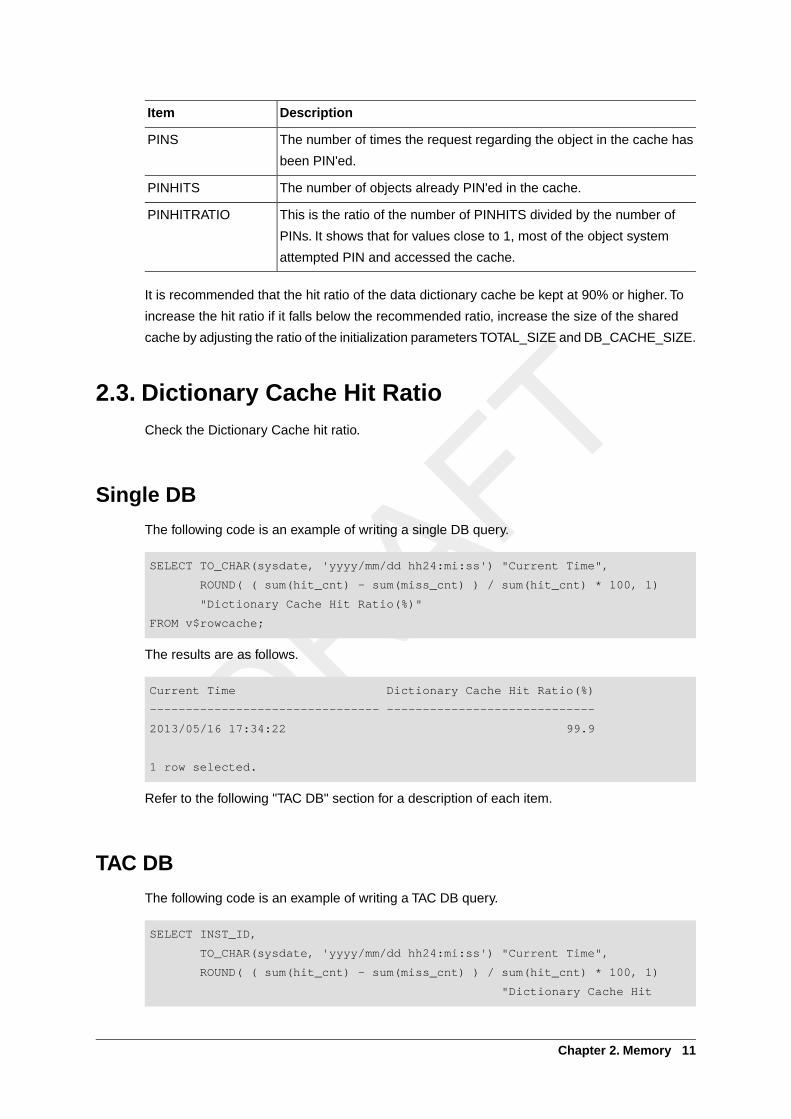
DescriptionItem
The number of times the request regarding the object in the cache has
been PIN'ed.
PINS
The number of objects already PIN'ed in the cache.PINHITS
This is the ratio of the number of PINHITS divided by the number of
PINs. It shows that for values close to 1, most of the object system
attempted PIN and accessed the cache.
PINHITRATIO
It is recommended that the hit ratio of the data dictionary cache be kept at 90% or higher. To
increase the hit ratio if it falls below the recommended ratio, increase the size of the shared
cache by adjusting the ratio of the initialization parameters TOTAL_SIZE and DB_CACHE_SIZE.
2.3. Dictionary Cache Hit RatioCheck the Dictionary Cache hit ratio.
Single DB
The following code is an example of writing a single DB query.
SELECT TO_CHAR(sysdate, 'yyyy/mm/dd hh24:mi:ss') "Current Time",
ROUND( ( sum(hit_cnt) - sum(miss_cnt) ) / sum(hit_cnt) * 100, 1)
"Dictionary Cache Hit Ratio(%)"
FROM v$rowcache;
The results are as follows.
Current Time Dictionary Cache Hit Ratio(%)
-------------------------------- -----------------------------
2013/05/16 17:34:22 99.9
1 row selected.
Refer to the following "TAC DB" section for a description of each item.
TAC DB
The following code is an example of writing a TAC DB query.
SELECT INST_ID,
TO_CHAR(sysdate, 'yyyy/mm/dd hh24:mi:ss') "Current Time",
ROUND( ( sum(hit_cnt) - sum(miss_cnt) ) / sum(hit_cnt) * 100, 1)
"Dictionary Cache Hit
Chapter 2. Memory 11
Ratio(%)"
FROM gv$rowcache
GROUP BY INST_ID;
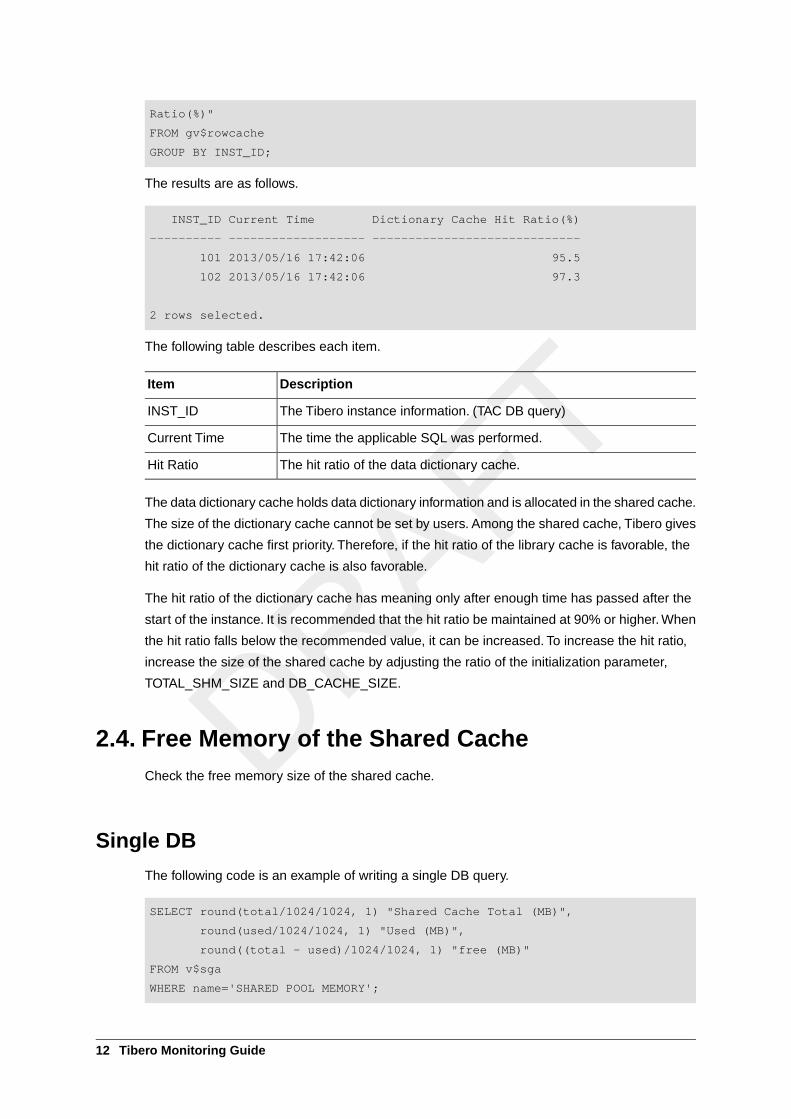
The results are as follows.
INST_ID Current Time Dictionary Cache Hit Ratio(%)
---------- ------------------- -----------------------------
101 2013/05/16 17:42:06 95.5
102 2013/05/16 17:42:06 97.3
2 rows selected.
The following table describes each item.
DescriptionItem
The Tibero instance information. (TAC DB query)INST_ID
The time the applicable SQL was performed.Current Time
The hit ratio of the data dictionary cache.Hit Ratio
The data dictionary cache holds data dictionary information and is allocated in the shared cache.
The size of the dictionary cache cannot be set by users. Among the shared cache, Tibero gives
the dictionary cache first priority. Therefore, if the hit ratio of the library cache is favorable, the
hit ratio of the dictionary cache is also favorable.
The hit ratio of the dictionary cache has meaning only after enough time has passed after the
start of the instance. It is recommended that the hit ratio be maintained at 90% or higher. When
the hit ratio falls below the recommended value, it can be increased. To increase the hit ratio,
increase the size of the shared cache by adjusting the ratio of the initialization parameter,
TOTAL_SHM_SIZE and DB_CACHE_SIZE.
2.4. Free Memory of the Shared CacheCheck the free memory size of the shared cache.
Single DB
The following code is an example of writing a single DB query.
SELECT round(total/1024/1024, 1) "Shared Cache Total (MB)",
round(used/1024/1024, 1) "Used (MB)",
round((total - used)/1024/1024, 1) "free (MB)"
FROM v$sga
WHERE name='SHARED POOL MEMORY';
12 Tibero Monitoring Guide
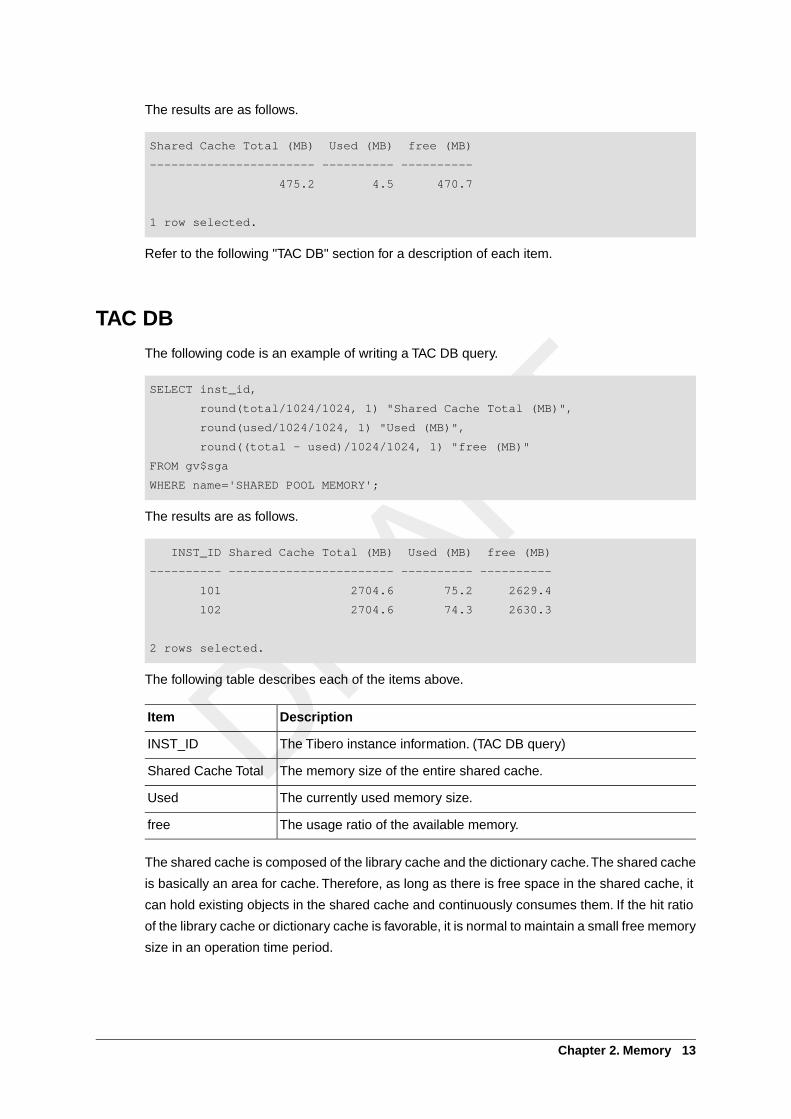
The results are as follows.
Shared Cache Total (MB) Used (MB) free (MB)
----------------------- ---------- ----------
475.2 4.5 470.7
1 row selected.
Refer to the following "TAC DB" section for a description of each item.
TAC DB
The following code is an example of writing a TAC DB query.
SELECT inst_id,
round(total/1024/1024, 1) "Shared Cache Total (MB)",
round(used/1024/1024, 1) "Used (MB)",
round((total - used)/1024/1024, 1) "free (MB)"
FROM gv$sga
WHERE name='SHARED POOL MEMORY';
The results are as follows.
INST_ID Shared Cache Total (MB) Used (MB) free (MB)
---------- ----------------------- ---------- ----------
101 2704.6 75.2 2629.4
102 2704.6 74.3 2630.3
2 rows selected.
The following table describes each of the items above.
DescriptionItem
The Tibero instance information. (TAC DB query)INST_ID
The memory size of the entire shared cache.Shared Cache Total
The currently used memory size.Used
The usage ratio of the available memory.free
The shared cache is composed of the library cache and the dictionary cache.The shared cache
is basically an area for cache. Therefore, as long as there is free space in the shared cache, it
can hold existing objects in the shared cache and continuously consumes them. If the hit ratio
of the library cache or dictionary cache is favorable, it is normal to maintain a small free memory
size in an operation time period.
Chapter 2. Memory 13

If there is a large amount of free memory remaining on a consistent basis, the shared cache is
overly large. If the free memory size suddenly increases temporarily, a lot of fragmentation
occurs and a lot of objects are all flushed at the same time, which can be a problem.
Refrain from using large-sized PSM blocks in order to prevent fragmentation of shared cache
memory. For literal SQL statements, switch to using bind variables.
14 Tibero Monitoring Guide
Chapter 3.Tibero Standby Event
This chapter describes the Tibero standby event information.
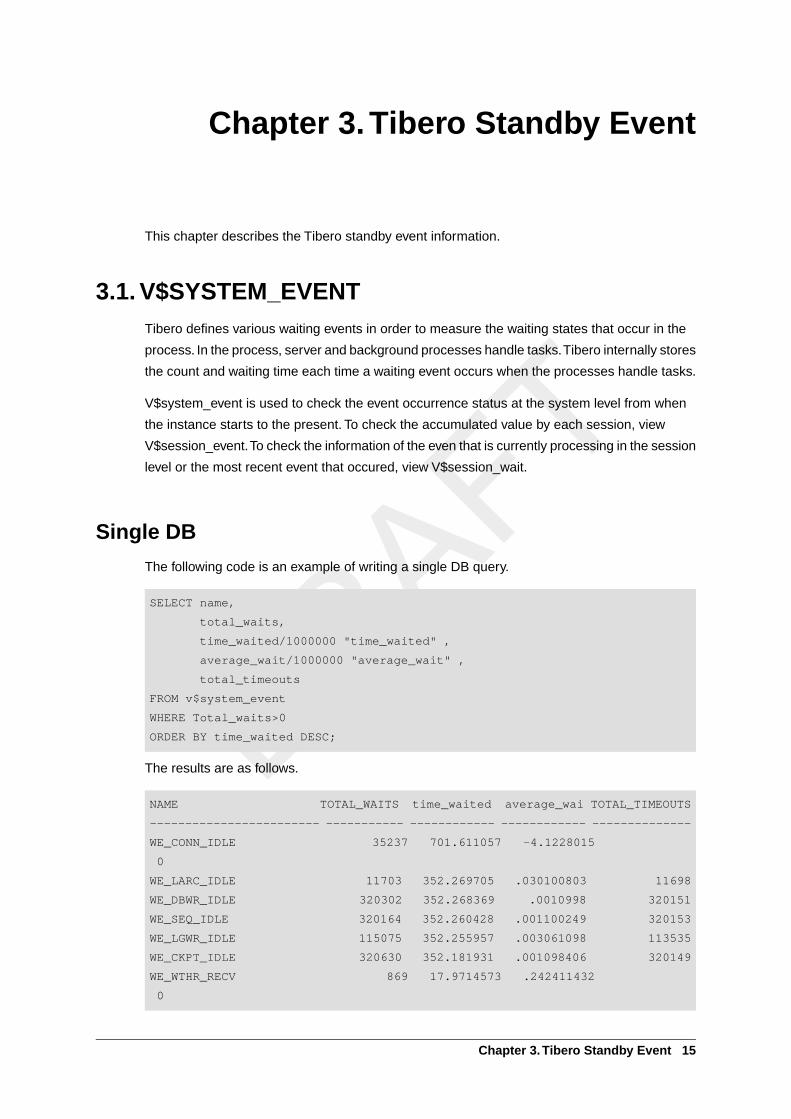
3.1. V$SYSTEM_EVENTTibero defines various waiting events in order to measure the waiting states that occur in the
process. In the process, server and background processes handle tasks.Tibero internally stores
the count and waiting time each time a waiting event occurs when the processes handle tasks.
V$system_event is used to check the event occurrence status at the system level from when
the instance starts to the present. To check the accumulated value by each session, view
V$session_event.To check the information of the even that is currently processing in the session
level or the most recent event that occured, view V$session_wait.
Single DB
The following code is an example of writing a single DB query.
SELECT name,
total_waits,
time_waited/1000000 "time_waited" ,
average_wait/1000000 "average_wait" ,
total_timeouts
FROM v$system_event
WHERE Total_waits>0
ORDER BY time_waited DESC;
The results are as follows.
NAME TOTAL_WAITS time_waited average_wai TOTAL_TIMEOUTS
------------------------ ----------- ------------ ------------ --------------
WE_CONN_IDLE 35237 701.611057 -4.1228015
0
WE_LARC_IDLE 11703 352.269705 .030100803 11698
WE_DBWR_IDLE 320302 352.268369 .0010998 320151
WE_SEQ_IDLE 320164 352.260428 .001100249 320153
WE_LGWR_IDLE 115075 352.255957 .003061098 113535
WE_CKPT_IDLE 320630 352.181931 .001098406 320149
WE_WTHR_RECV 869 17.9714573 .242411432
0
Chapter 3.Tibero Standby Event 15
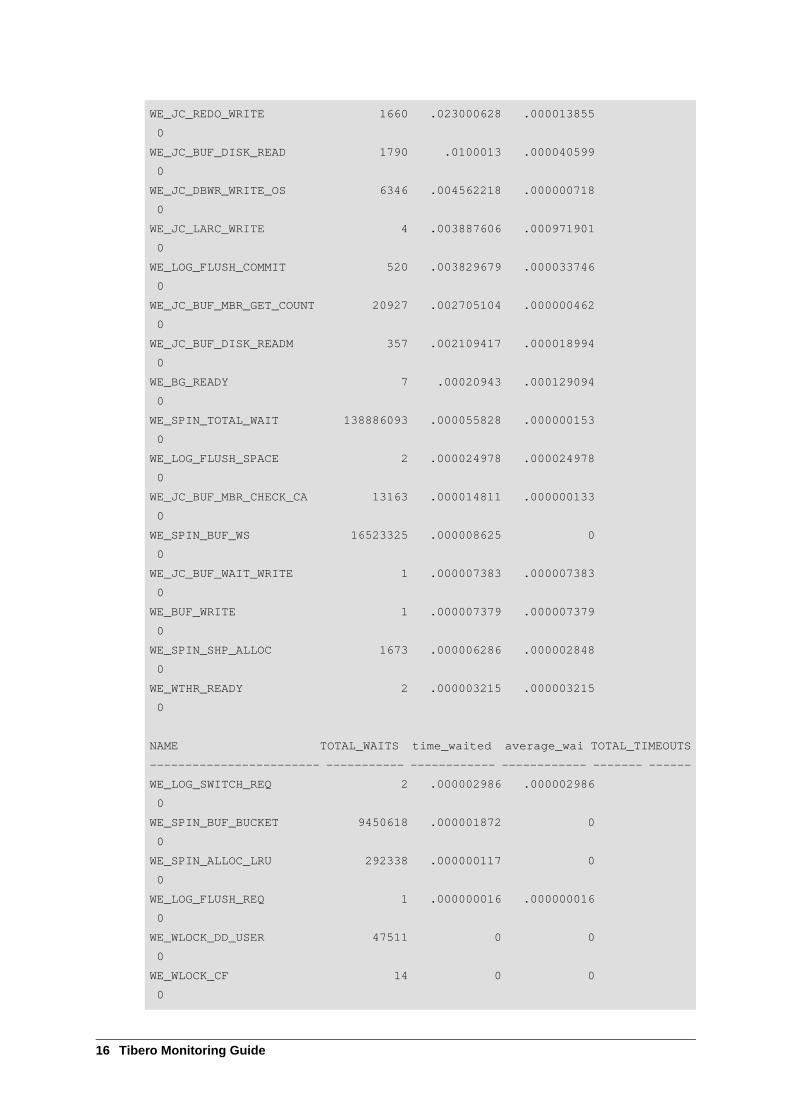
WE_JC_REDO_WRITE 1660 .023000628 .000013855
0
WE_JC_BUF_DISK_READ 1790 .0100013 .000040599
0
WE_JC_DBWR_WRITE_OS 6346 .004562218 .000000718
0
WE_JC_LARC_WRITE 4 .003887606 .000971901
0
WE_LOG_FLUSH_COMMIT 520 .003829679 .000033746
0
WE_JC_BUF_MBR_GET_COUNT 20927 .002705104 .000000462
0
WE_JC_BUF_DISK_READM 357 .002109417 .000018994
0
WE_BG_READY 7 .00020943 .000129094
0
WE_SPIN_TOTAL_WAIT 138886093 .000055828 .000000153
0
WE_LOG_FLUSH_SPACE 2 .000024978 .000024978
0
WE_JC_BUF_MBR_CHECK_CA 13163 .000014811 .000000133
0
WE_SPIN_BUF_WS 16523325 .000008625 0
0
WE_JC_BUF_WAIT_WRITE 1 .000007383 .000007383
0
WE_BUF_WRITE 1 .000007379 .000007379
0
WE_SPIN_SHP_ALLOC 1673 .000006286 .000002848
0
WE_WTHR_READY 2 .000003215 .000003215
0
NAME TOTAL_WAITS time_waited average_wai TOTAL_TIMEOUTS
------------------------ ----------- ------------ ------------ ------- ------
WE_LOG_SWITCH_REQ 2 .000002986 .000002986
0
WE_SPIN_BUF_BUCKET 9450618 .000001872 0
0
WE_SPIN_ALLOC_LRU 292338 .000000117 0
0
WE_LOG_FLUSH_REQ 1 .000000016 .000000016
0
WE_WLOCK_DD_USER 47511 0 0
0
WE_WLOCK_CF 14 0 0
0
16 Tibero Monitoring Guide
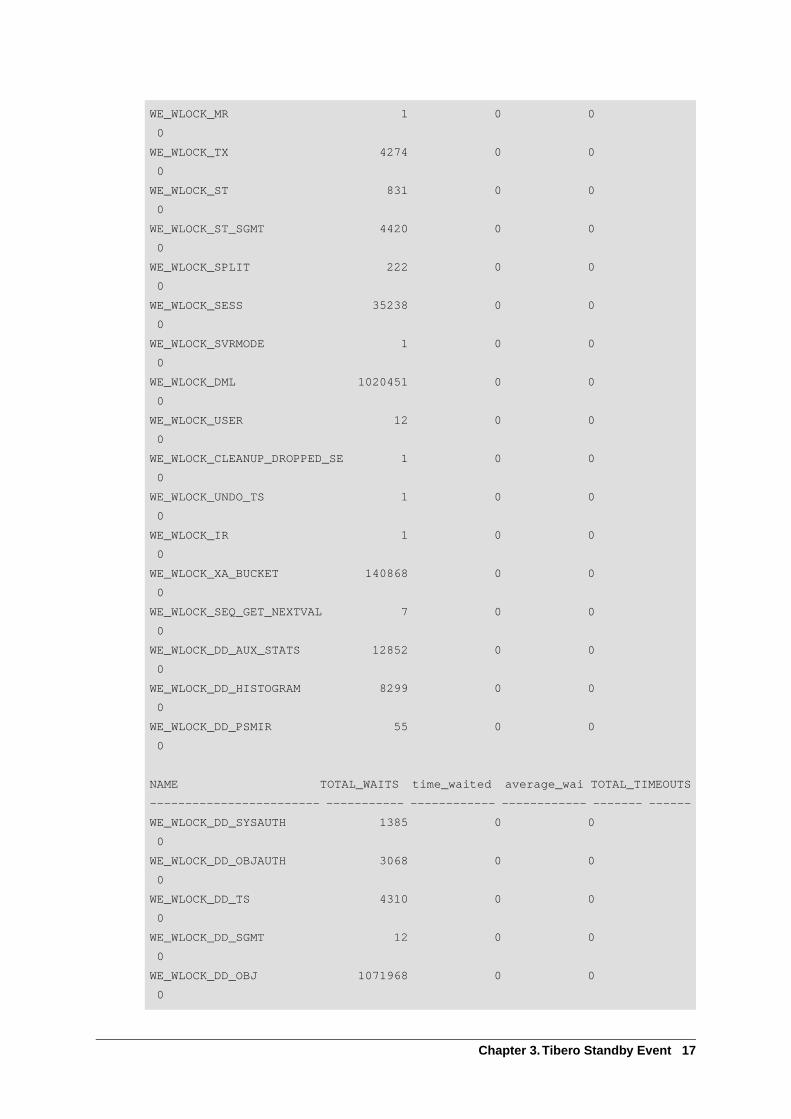
WE_WLOCK_MR 1 0 0
0
WE_WLOCK_TX 4274 0 0
0
WE_WLOCK_ST 831 0 0
0
WE_WLOCK_ST_SGMT 4420 0 0
0
WE_WLOCK_SPLIT 222 0 0
0
WE_WLOCK_SESS 35238 0 0
0
WE_WLOCK_SVRMODE 1 0 0
0
WE_WLOCK_DML 1020451 0 0
0
WE_WLOCK_USER 12 0 0
0
WE_WLOCK_CLEANUP_DROPPED_SE 1 0 0
0
WE_WLOCK_UNDO_TS 1 0 0
0
WE_WLOCK_IR 1 0 0
0
WE_WLOCK_XA_BUCKET 140868 0 0
0
WE_WLOCK_SEQ_GET_NEXTVAL 7 0 0
0
WE_WLOCK_DD_AUX_STATS 12852 0 0
0
WE_WLOCK_DD_HISTOGRAM 8299 0 0
0
WE_WLOCK_DD_PSMIR 55 0 0
0
NAME TOTAL_WAITS time_waited average_wai TOTAL_TIMEOUTS
------------------------ ----------- ------------ ------------ ------- ------
WE_WLOCK_DD_SYSAUTH 1385 0 0
0
WE_WLOCK_DD_OBJAUTH 3068 0 0
0
WE_WLOCK_DD_TS 4310 0 0
0
WE_WLOCK_DD_SGMT 12 0 0
0
WE_WLOCK_DD_OBJ 1071968 0 0
0
Chapter 3.Tibero Standby Event 17
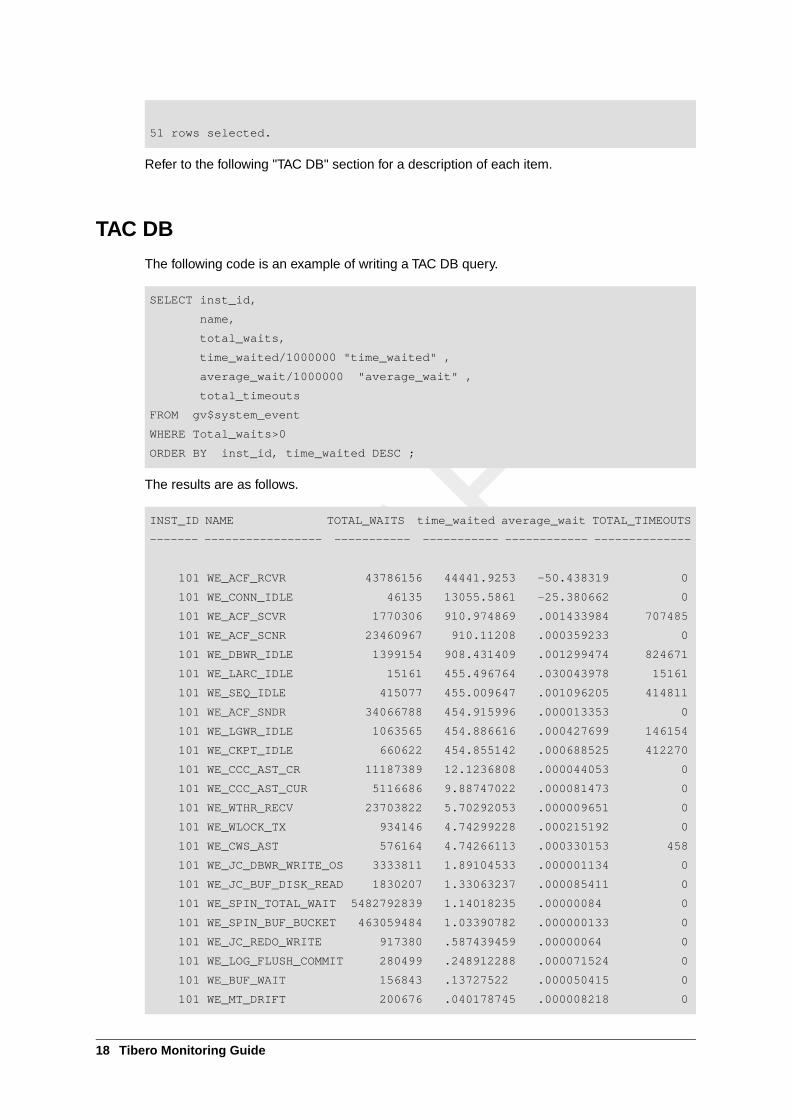
51 rows selected.
Refer to the following "TAC DB" section for a description of each item.
TAC DB
The following code is an example of writing a TAC DB query.
SELECT inst_id,
name,
total_waits,
time_waited/1000000 "time_waited" ,
average_wait/1000000 "average_wait" ,
total_timeouts
FROM gv$system_event
WHERE Total_waits>0
ORDER BY inst_id, time_waited DESC ;
The results are as follows.
INST_ID NAME TOTAL_WAITS time_waited average_wait TOTAL_TIMEOUTS
------- ----------------- ----------- ----------- ------------ --------------
101 WE_ACF_RCVR 43786156 44441.9253 -50.438319 0
101 WE_CONN_IDLE 46135 13055.5861 -25.380662 0
101 WE_ACF_SCVR 1770306 910.974869 .001433984 707485
101 WE_ACF_SCNR 23460967 910.11208 .000359233 0
101 WE_DBWR_IDLE 1399154 908.431409 .001299474 824671
101 WE_LARC_IDLE 15161 455.496764 .030043978 15161
101 WE_SEQ_IDLE 415077 455.009647 .001096205 414811
101 WE_ACF_SNDR 34066788 454.915996 .000013353 0
101 WE_LGWR_IDLE 1063565 454.886616 .000427699 146154
101 WE_CKPT_IDLE 660622 454.855142 .000688525 412270
101 WE_CCC_AST_CR 11187389 12.1236808 .000044053 0
101 WE_CCC_AST_CUR 5116686 9.88747022 .000081473 0
101 WE_WTHR_RECV 23703822 5.70292053 .000009651 0
101 WE_WLOCK_TX 934146 4.74299228 .000215192 0
101 WE_CWS_AST 576164 4.74266113 .000330153 458
101 WE_JC_DBWR_WRITE_OS 3333811 1.89104533 .000001134 0
101 WE_JC_BUF_DISK_READ 1830207 1.33063237 .000085411 0
101 WE_SPIN_TOTAL_WAIT 5482792839 1.14018235 .00000084 0
101 WE_SPIN_BUF_BUCKET 463059484 1.03390782 .000000133 0
101 WE_JC_REDO_WRITE 917380 .587439459 .00000064 0
101 WE_LOG_FLUSH_COMMIT 280499 .248912288 .000071524 0
101 WE_BUF_WAIT 156843 .13727522 .000050415 0
101 WE_MT_DRIFT 200676 .040178745 .000008218 0
18 Tibero Monitoring Guide
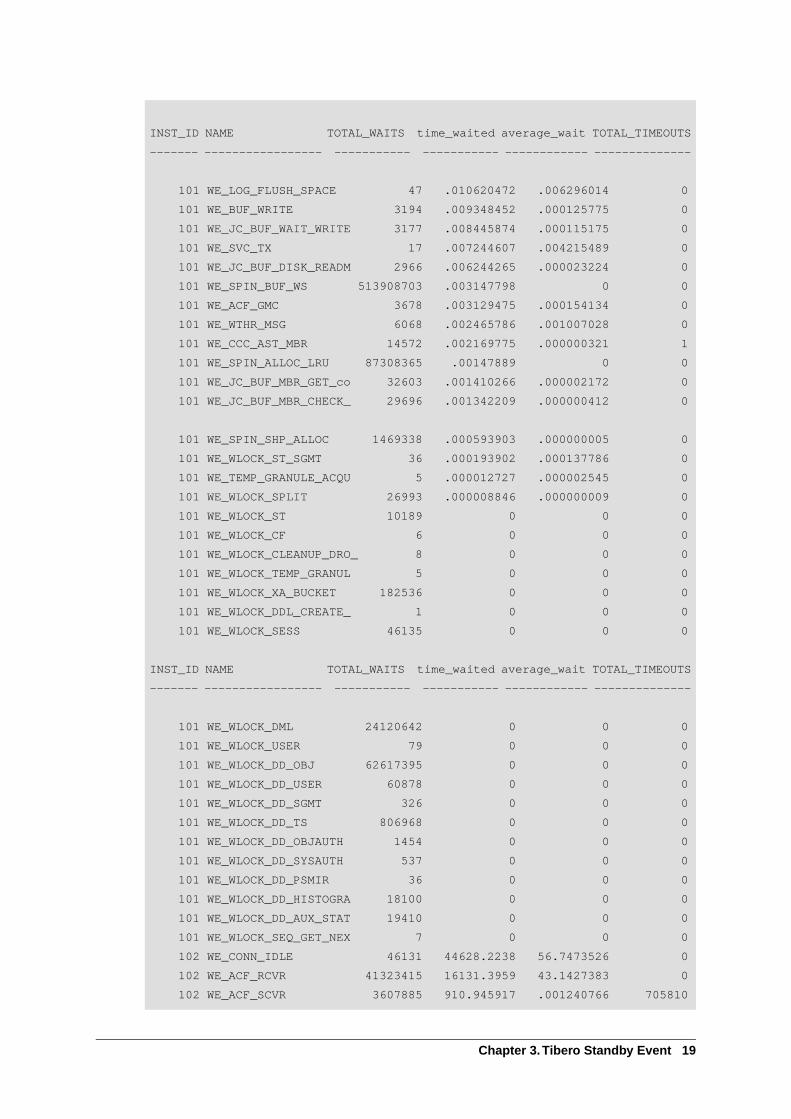
INST_ID NAME TOTAL_WAITS time_waited average_wait TOTAL_TIMEOUTS
------- ----------------- ----------- ----------- ------------ --------------
101 WE_LOG_FLUSH_SPACE 47 .010620472 .006296014 0
101 WE_BUF_WRITE 3194 .009348452 .000125775 0
101 WE_JC_BUF_WAIT_WRITE 3177 .008445874 .000115175 0
101 WE_SVC_TX 17 .007244607 .004215489 0
101 WE_JC_BUF_DISK_READM 2966 .006244265 .000023224 0
101 WE_SPIN_BUF_WS 513908703 .003147798 0 0
101 WE_ACF_GMC 3678 .003129475 .000154134 0
101 WE_WTHR_MSG 6068 .002465786 .001007028 0
101 WE_CCC_AST_MBR 14572 .002169775 .000000321 1
101 WE_SPIN_ALLOC_LRU 87308365 .00147889 0 0
101 WE_JC_BUF_MBR_GET_co 32603 .001410266 .000002172 0
101 WE_JC_BUF_MBR_CHECK_ 29696 .001342209 .000000412 0
101 WE_SPIN_SHP_ALLOC 1469338 .000593903 .000000005 0
101 WE_WLOCK_ST_SGMT 36 .000193902 .000137786 0
101 WE_TEMP_GRANULE_ACQU 5 .000012727 .000002545 0
101 WE_WLOCK_SPLIT 26993 .000008846 .000000009 0
101 WE_WLOCK_ST 10189 0 0 0
101 WE_WLOCK_CF 6 0 0 0
101 WE_WLOCK_CLEANUP_DRO_ 8 0 0 0
101 WE_WLOCK_TEMP_GRANUL 5 0 0 0
101 WE_WLOCK_XA_BUCKET 182536 0 0 0
101 WE_WLOCK_DDL_CREATE_ 1 0 0 0
101 WE_WLOCK_SESS 46135 0 0 0
INST_ID NAME TOTAL_WAITS time_waited average_wait TOTAL_TIMEOUTS
------- ----------------- ----------- ----------- ------------ --------------
101 WE_WLOCK_DML 24120642 0 0 0
101 WE_WLOCK_USER 79 0 0 0
101 WE_WLOCK_DD_OBJ 62617395 0 0 0
101 WE_WLOCK_DD_USER 60878 0 0 0
101 WE_WLOCK_DD_SGMT 326 0 0 0
101 WE_WLOCK_DD_TS 806968 0 0 0
101 WE_WLOCK_DD_OBJAUTH 1454 0 0 0
101 WE_WLOCK_DD_SYSAUTH 537 0 0 0
101 WE_WLOCK_DD_PSMIR 36 0 0 0
101 WE_WLOCK_DD_HISTOGRA 18100 0 0 0
101 WE_WLOCK_DD_AUX_STAT 19410 0 0 0
101 WE_WLOCK_SEQ_GET_NEX 7 0 0 0
102 WE_CONN_IDLE 46131 44628.2238 56.7473526 0
102 WE_ACF_RCVR 41323415 16131.3959 43.1427383 0
102 WE_ACF_SCVR 3607885 910.945917 .001240766 705810
Chapter 3.Tibero Standby Event 19
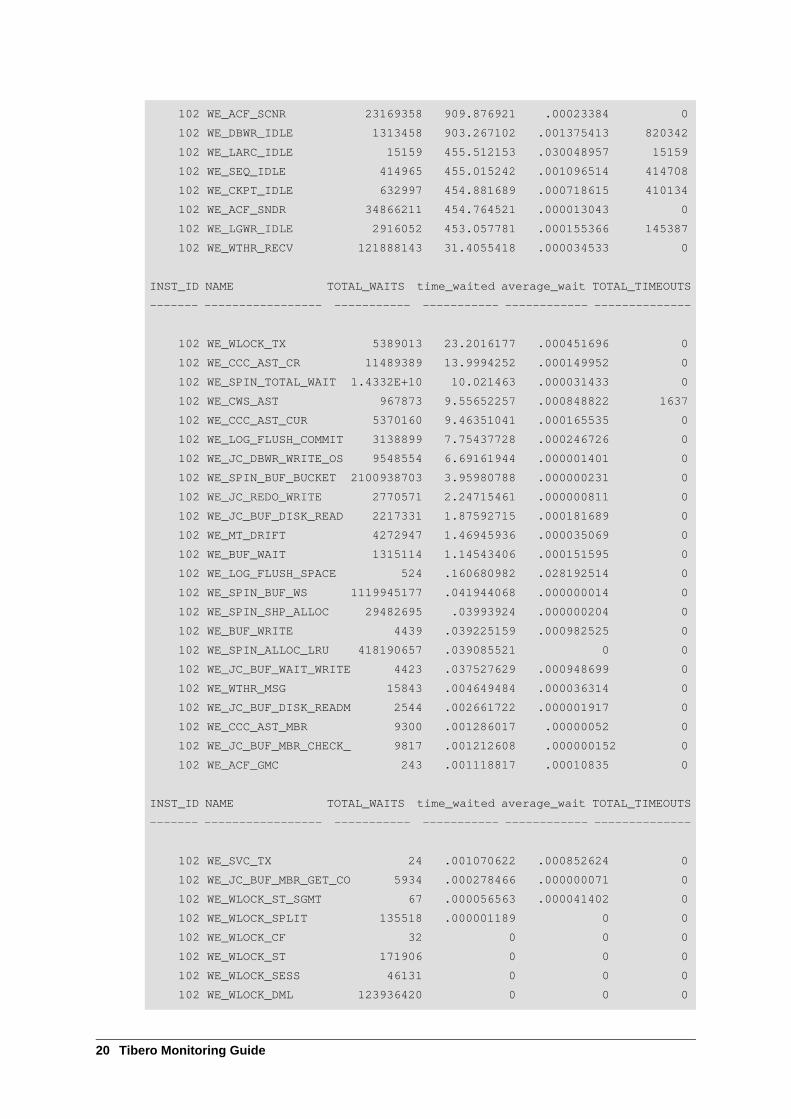
102 WE_ACF_SCNR 23169358 909.876921 .00023384 0
102 WE_DBWR_IDLE 1313458 903.267102 .001375413 820342
102 WE_LARC_IDLE 15159 455.512153 .030048957 15159
102 WE_SEQ_IDLE 414965 455.015242 .001096514 414708
102 WE_CKPT_IDLE 632997 454.881689 .000718615 410134
102 WE_ACF_SNDR 34866211 454.764521 .000013043 0
102 WE_LGWR_IDLE 2916052 453.057781 .000155366 145387
102 WE_WTHR_RECV 121888143 31.4055418 .000034533 0
INST_ID NAME TOTAL_WAITS time_waited average_wait TOTAL_TIMEOUTS
------- ----------------- ----------- ----------- ------------ --------------
102 WE_WLOCK_TX 5389013 23.2016177 .000451696 0
102 WE_CCC_AST_CR 11489389 13.9994252 .000149952 0
102 WE_SPIN_TOTAL_WAIT 1.4332E+10 10.021463 .000031433 0
102 WE_CWS_AST 967873 9.55652257 .000848822 1637
102 WE_CCC_AST_CUR 5370160 9.46351041 .000165535 0
102 WE_LOG_FLUSH_COMMIT 3138899 7.75437728 .000246726 0
102 WE_JC_DBWR_WRITE_OS 9548554 6.69161944 .000001401 0
102 WE_SPIN_BUF_BUCKET 2100938703 3.95980788 .000000231 0
102 WE_JC_REDO_WRITE 2770571 2.24715461 .000000811 0
102 WE_JC_BUF_DISK_READ 2217331 1.87592715 .000181689 0
102 WE_MT_DRIFT 4272947 1.46945936 .000035069 0
102 WE_BUF_WAIT 1315114 1.14543406 .000151595 0
102 WE_LOG_FLUSH_SPACE 524 .160680982 .028192514 0
102 WE_SPIN_BUF_WS 1119945177 .041944068 .000000014 0
102 WE_SPIN_SHP_ALLOC 29482695 .03993924 .000000204 0
102 WE_BUF_WRITE 4439 .039225159 .000982525 0
102 WE_SPIN_ALLOC_LRU 418190657 .039085521 0 0
102 WE_JC_BUF_WAIT_WRITE 4423 .037527629 .000948699 0
102 WE_WTHR_MSG 15843 .004649484 .000036314 0
102 WE_JC_BUF_DISK_READM 2544 .002661722 .000001917 0
102 WE_CCC_AST_MBR 9300 .001286017 .00000052 0
102 WE_JC_BUF_MBR_CHECK_ 9817 .001212608 .000000152 0
102 WE_ACF_GMC 243 .001118817 .00010835 0
INST_ID NAME TOTAL_WAITS time_waited average_wait TOTAL_TIMEOUTS
------- ----------------- ----------- ----------- ------------ --------------
102 WE_SVC_TX 24 .001070622 .000852624 0
102 WE_JC_BUF_MBR_GET_CO 5934 .000278466 .000000071 0
102 WE_WLOCK_ST_SGMT 67 .000056563 .000041402 0
102 WE_WLOCK_SPLIT 135518 .000001189 0 0
102 WE_WLOCK_CF 32 0 0 0
102 WE_WLOCK_ST 171906 0 0 0
102 WE_WLOCK_SESS 46131 0 0 0
102 WE_WLOCK_DML 123936420 0 0 0
20 Tibero Monitoring Guide
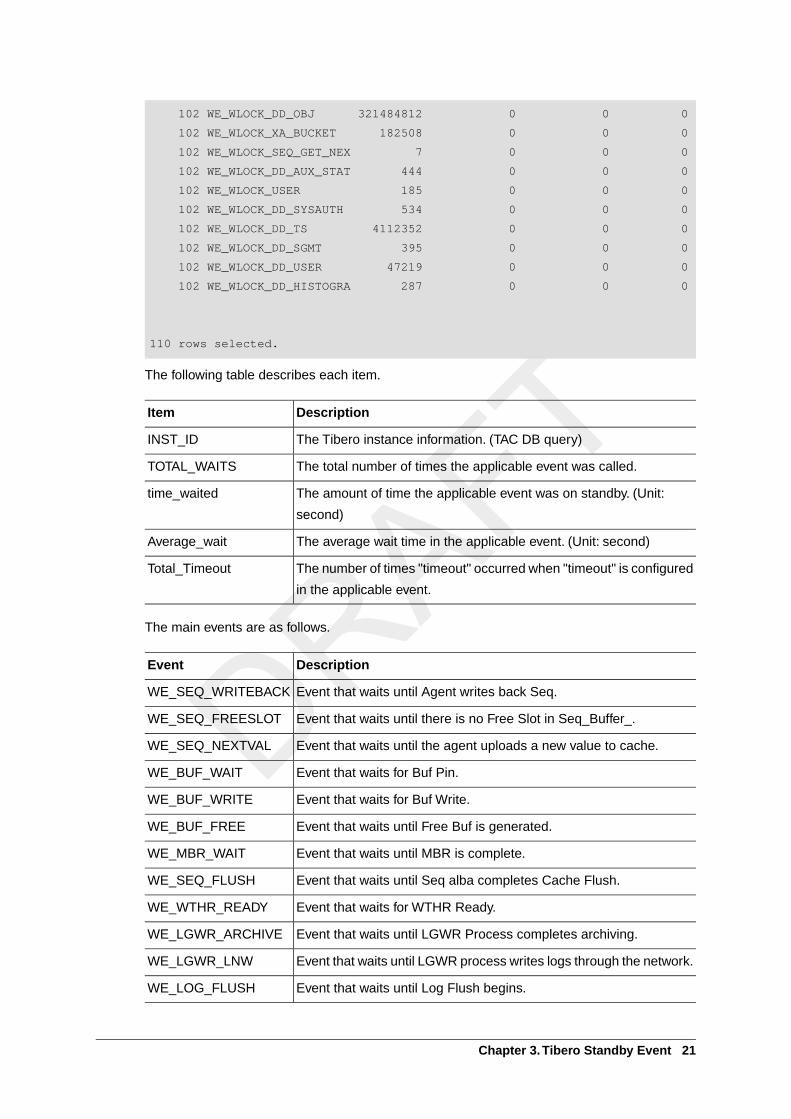
102 WE_WLOCK_DD_OBJ 321484812 0 0 0
102 WE_WLOCK_XA_BUCKET 182508 0 0 0
102 WE_WLOCK_SEQ_GET_NEX 7 0 0 0
102 WE_WLOCK_DD_AUX_STAT 444 0 0 0
102 WE_WLOCK_USER 185 0 0 0
102 WE_WLOCK_DD_SYSAUTH 534 0 0 0
102 WE_WLOCK_DD_TS 4112352 0 0 0
102 WE_WLOCK_DD_SGMT 395 0 0 0
102 WE_WLOCK_DD_USER 47219 0 0 0
102 WE_WLOCK_DD_HISTOGRA 287 0 0 0
110 rows selected.
The following table describes each item.
DescriptionItem
The Tibero instance information. (TAC DB query)INST_ID
The total number of times the applicable event was called.TOTAL_WAITS
The amount of time the applicable event was on standby. (Unit:
second)
time_waited
The average wait time in the applicable event. (Unit: second)Average_wait
The number of times "timeout" occurred when "timeout" is configured
in the applicable event.
Total_Timeout
The main events are as follows.
DescriptionEvent
Event that waits until Agent writes back Seq.WE_SEQ_WRITEBACK
Event that waits until there is no Free Slot in Seq_Buffer_.WE_SEQ_FREESLOT
Event that waits until the agent uploads a new value to cache.WE_SEQ_NEXTVAL
Event that waits for Buf Pin.WE_BUF_WAIT
Event that waits for Buf Write.WE_BUF_WRITE
Event that waits until Free Buf is generated.WE_BUF_FREE
Event that waits until MBR is complete.WE_MBR_WAIT
Event that waits until Seq alba completes Cache Flush.WE_SEQ_FLUSH
Event that waits for WTHR Ready.WE_WTHR_READY
Event that waits until LGWR Process completes archiving.WE_LGWR_ARCHIVE
Event that waits until LGWR process writes logs through the network.WE_LGWR_LNW
Event that waits until Log Flush begins.WE_LOG_FLUSH
Chapter 3.Tibero Standby Event 21
DescriptionEvent
Event that waits because of insufficient space until Log Flush begins.WE_LOG_FLUSH_SPACE
Event that requests Log Flush and waits.WE_LOG_FLUSH_REQ
Event that waits for Checkpoint.WE_CKPT_WAIT
Event that occurs in the case of Shutdown Finish.WE_PROC_DOWN
Event that waits until a message is received to start WTHR.WE_WTHR_START
Event when WTHR waits for the client's MSG.WE_WTHR_MSG
An event that waits until a CCC/CWS RSB (Resource Block) reclaim
request is received in SCVR (scavenger). Even if there is no reclaim
request, _ACF_SCVR_TIMEOUT (Default Value: 1 second) is
awakened periodically and reclaim is performed.
WE_ACF_SCVR
Event where WTHR is AST (asynchronous system trap).WE_ACF_AST
Waiting reduces the performance of tasks. The most common waiting events are resolved first
and the events with long waiting occurrences are resolved by each waiting event type. All
wlock-related information is shown as waiting events and can be used when checking wlock
Contention.
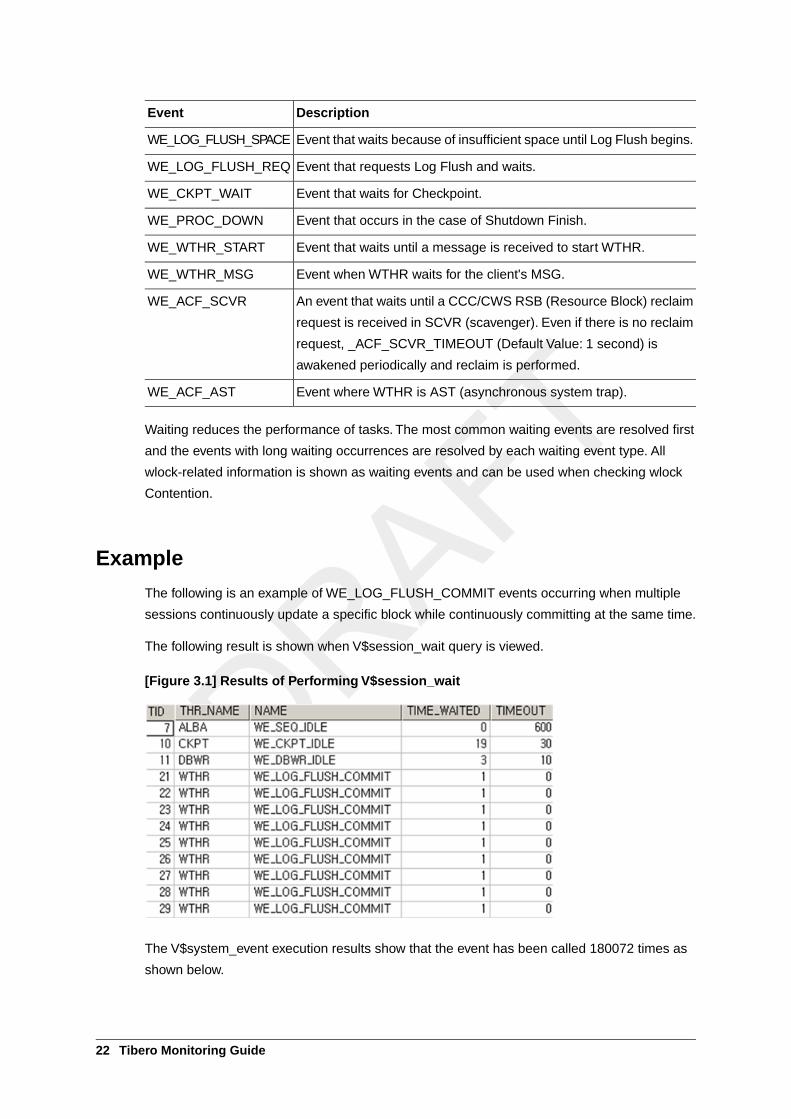
Example
The following is an example of WE_LOG_FLUSH_COMMIT events occurring when multiple
sessions continuously update a specific block while continuously committing at the same time.
The following result is shown when V$session_wait query is viewed.
[Figure 3.1] Results of Performing V$session_wait
The V$system_event execution results show that the event has been called 180072 times as
shown below.
22 Tibero Monitoring Guide
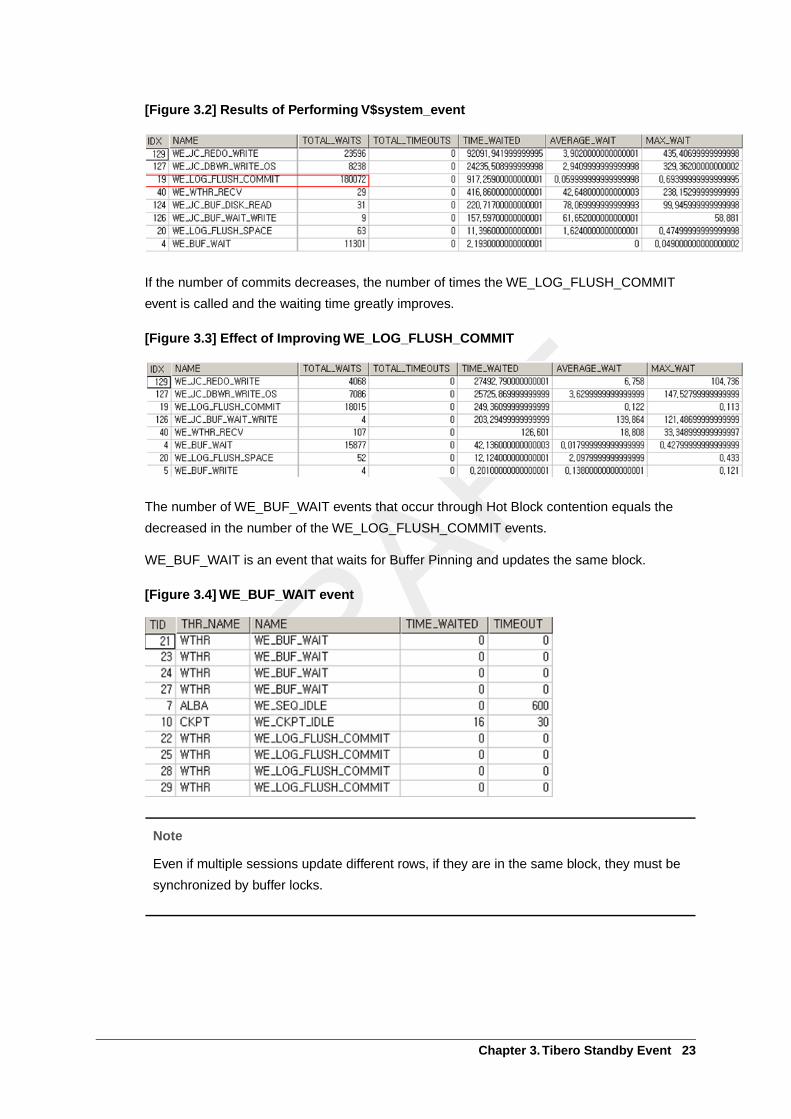
[Figure 3.2] Results of Performing V$system_event
If the number of commits decreases, the number of times the WE_LOG_FLUSH_COMMIT
event is called and the waiting time greatly improves.
[Figure 3.3] Effect of Improving WE_LOG_FLUSH_COMMIT
The number of WE_BUF_WAIT events that occur through Hot Block contention equals the
decreased in the number of the WE_LOG_FLUSH_COMMIT events.
WE_BUF_WAIT is an event that waits for Buffer Pinning and updates the same block.
[Figure 3.4] WE_BUF_WAIT event
Note
Even if multiple sessions update different rows, if they are in the same block, they must be
synchronized by buffer locks.
Chapter 3.Tibero Standby Event 23
3.2. V$SYSSTATv$sysstat is the view that is used for checking the execution statistics accumulated since the
start of the instance. v$sesstat is the view that is used for checking by each individual session.
The execution statistics regarding the currently connected user session can be viewed through
v$mystat.
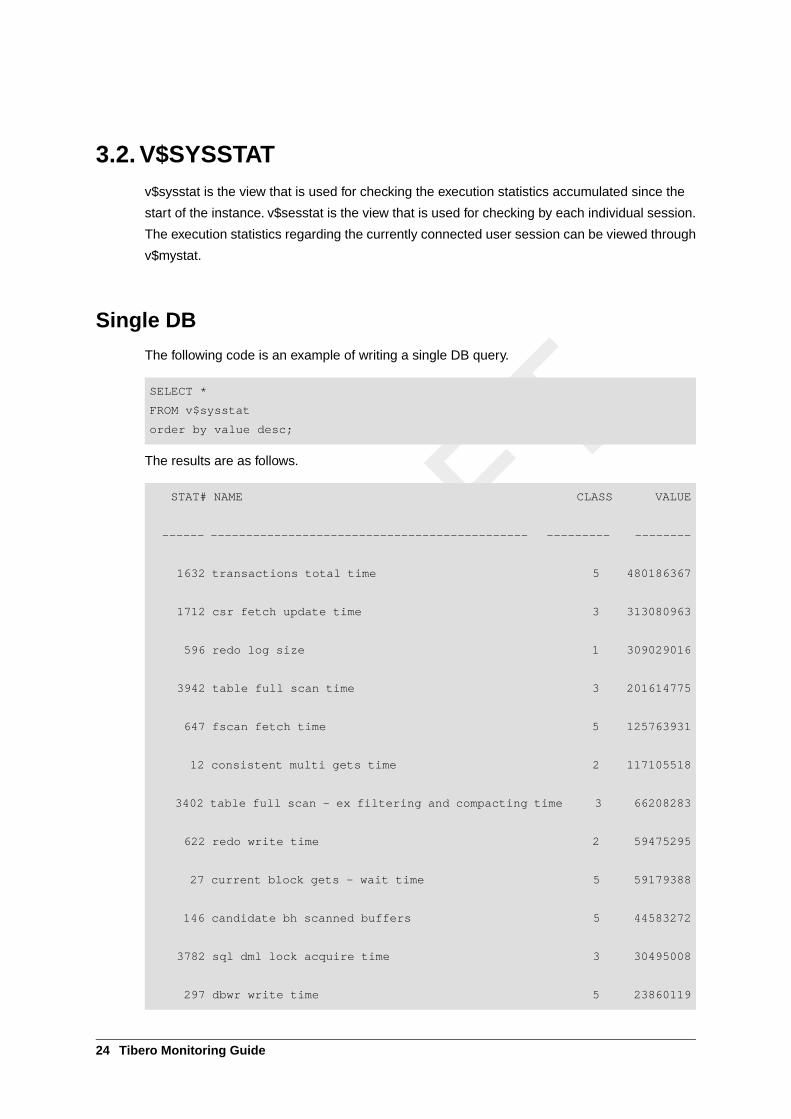
Single DB
The following code is an example of writing a single DB query.
SELECT *
FROM v$sysstat
order by value desc;
The results are as follows.
STAT# NAME CLASS VALUE
------ --------------------------------------------- --------- --------
1632 transactions total time 5 480186367
1712 csr fetch update time 3 313080963
596 redo log size 1 309029016
3942 table full scan time 3 201614775
647 fscan fetch time 5 125763931
12 consistent multi gets time 2 117105518
3402 table full scan - ex filtering and compacting time 3 66208283
622 redo write time 2 59475295
27 current block gets - wait time 5 59179388
146 candidate bh scanned buffers 5 44583272
3782 sql dml lock acquire time 3 30495008
297 dbwr write time 5 23860119
24 Tibero Monitoring Guide
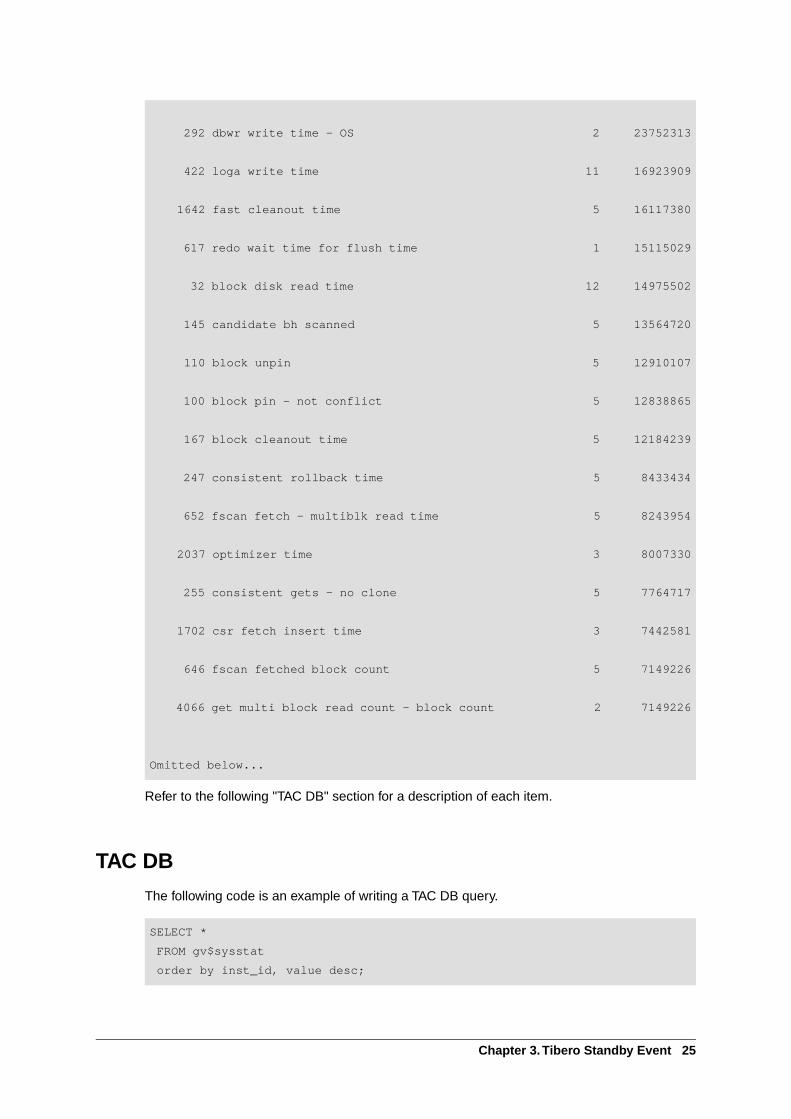
292 dbwr write time - OS 2 23752313
422 loga write time 11 16923909
1642 fast cleanout time 5 16117380
617 redo wait time for flush time 1 15115029
32 block disk read time 12 14975502
145 candidate bh scanned 5 13564720
110 block unpin 5 12910107
100 block pin - not conflict 5 12838865
167 block cleanout time 5 12184239
247 consistent rollback time 5 8433434
652 fscan fetch - multiblk read time 5 8243954
2037 optimizer time 3 8007330
255 consistent gets - no clone 5 7764717
1702 csr fetch insert time 3 7442581
646 fscan fetched block count 5 7149226
4066 get multi block read count - block count 2 7149226
Omitted below...
Refer to the following "TAC DB" section for a description of each item.
TAC DB
The following code is an example of writing a TAC DB query.
SELECT *
FROM gv$sysstat
order by inst_id, value desc;
Chapter 3.Tibero Standby Event 25
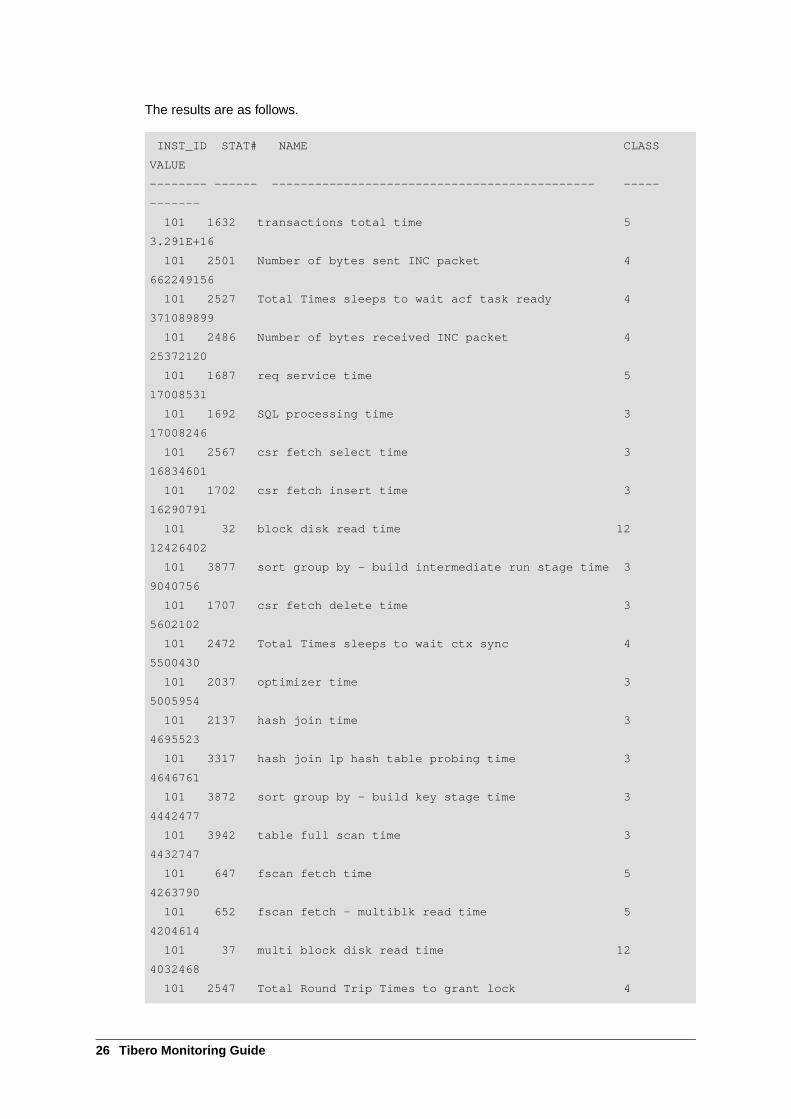
The results are as follows.
INST_ID STAT# NAME CLASS
VALUE
-------- ------ --------------------------------------------- -----
-------
101 1632 transactions total time 5
3.291E+16
101 2501 Number of bytes sent INC packet 4
662249156
101 2527 Total Times sleeps to wait acf task ready 4
371089899
101 2486 Number of bytes received INC packet 4
25372120
101 1687 req service time 5
17008531
101 1692 SQL processing time 3
17008246
101 2567 csr fetch select time 3
16834601
101 1702 csr fetch insert time 3
16290791
101 32 block disk read time 12
12426402
101 3877 sort group by - build intermediate run stage time 3
9040756
101 1707 csr fetch delete time 3
5602102
101 2472 Total Times sleeps to wait ctx sync 4
5500430
101 2037 optimizer time 3
5005954
101 2137 hash join time 3
4695523
101 3317 hash join 1p hash table probing time 3
4646761
101 3872 sort group by - build key stage time 3
4442477
101 3942 table full scan time 3
4432747
101 647 fscan fetch time 5
4263790
101 652 fscan fetch - multiblk read time 5
4204614
101 37 multi block disk read time 12
4032468
101 2547 Total Round Trip Times to grant lock 4
26 Tibero Monitoring Guide
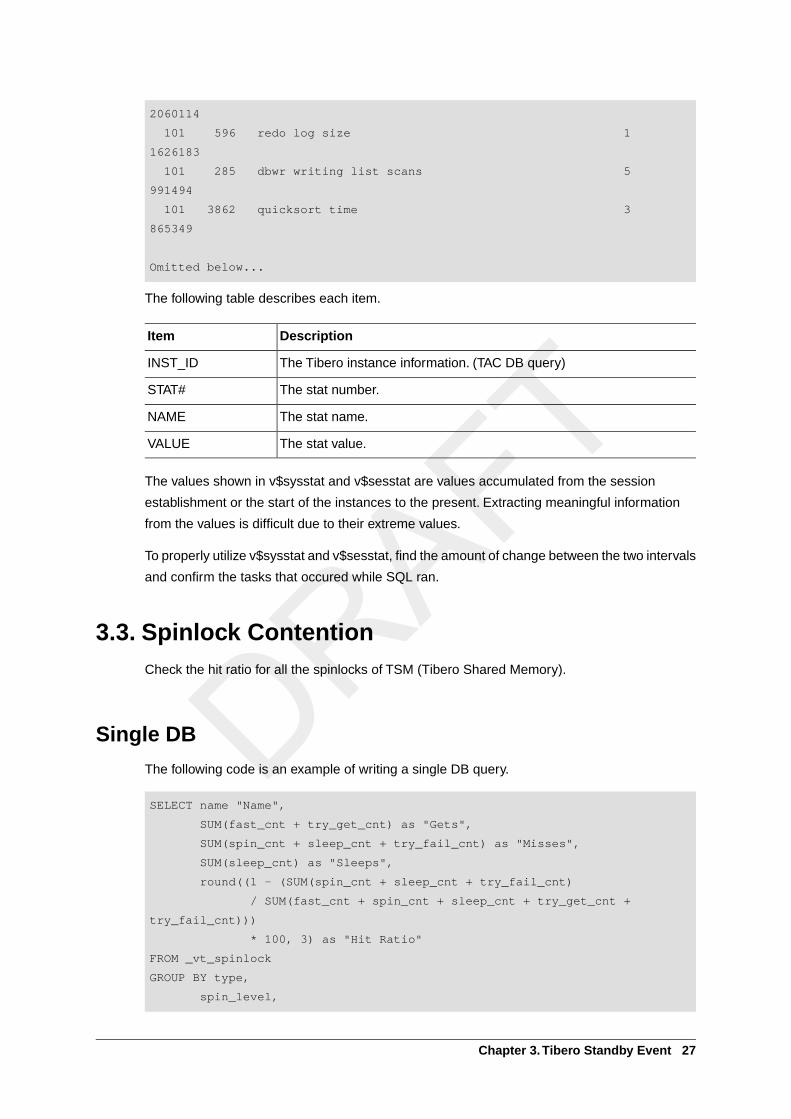
2060114
101 596 redo log size 1
1626183
101 285 dbwr writing list scans 5
991494
101 3862 quicksort time 3
865349
Omitted below...
The following table describes each item.
DescriptionItem
The Tibero instance information. (TAC DB query)INST_ID
The stat number.STAT#
The stat name.NAME
The stat value.VALUE
The values shown in v$sysstat and v$sesstat are values accumulated from the session
establishment or the start of the instances to the present. Extracting meaningful information
from the values is difficult due to their extreme values.
To properly utilize v$sysstat and v$sesstat, find the amount of change between the two intervals
and confirm the tasks that occured while SQL ran.
3.3. Spinlock ContentionCheck the hit ratio for all the spinlocks of TSM (Tibero Shared Memory).
Single DB
The following code is an example of writing a single DB query.
SELECT name "Name",
SUM(fast_cnt + try_get_cnt) as "Gets",
SUM(spin_cnt + sleep_cnt + try_fail_cnt) as "Misses",
SUM(sleep_cnt) as "Sleeps",
round((1 - (SUM(spin_cnt + sleep_cnt + try_fail_cnt)
/ SUM(fast_cnt + spin_cnt + sleep_cnt + try_get_cnt +
try_fail_cnt)))
* 100, 3) as "Hit Ratio"
FROM _vt_spinlock
GROUP BY type,
spin_level,
Chapter 3.Tibero Standby Event 27
name
HAVING SUM(fast_cnt + try_get_cnt) > 0
ORDER BY 4 DESC,
2 DESC;
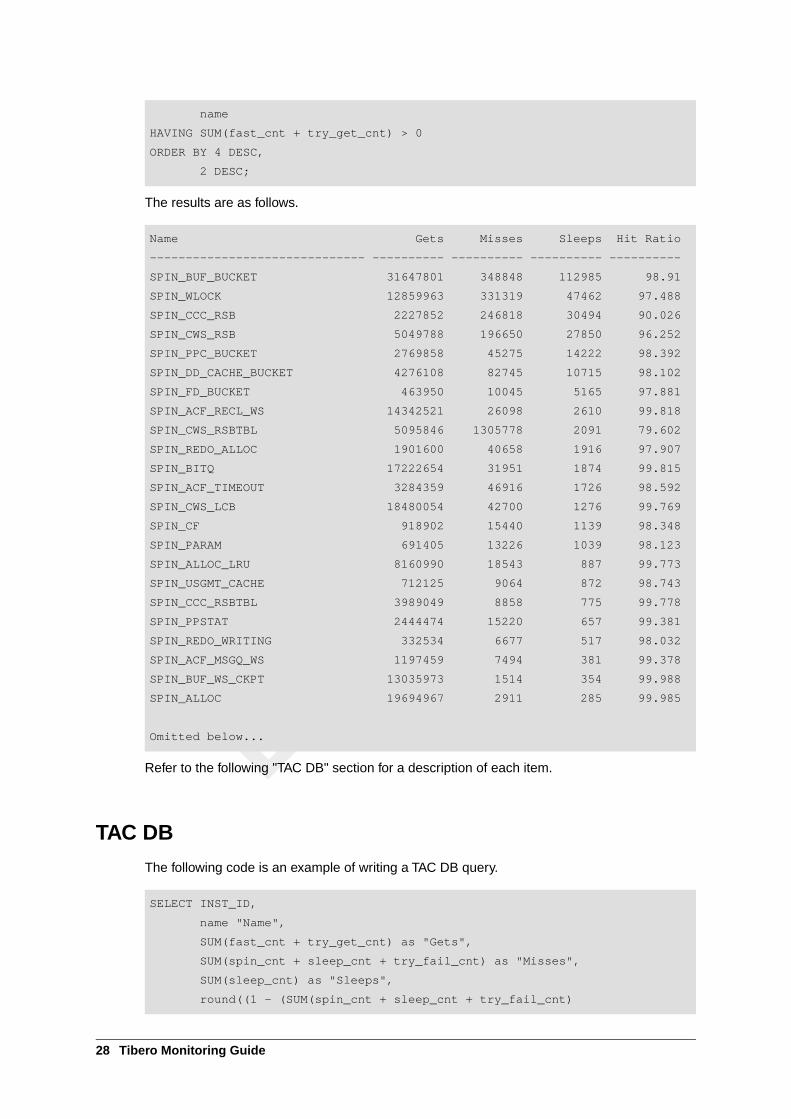
The results are as follows.
Name Gets Misses Sleeps Hit Ratio
------------------------------ ---------- ---------- ---------- ----------
SPIN_BUF_BUCKET 31647801 348848 112985 98.91
SPIN_WLOCK 12859963 331319 47462 97.488
SPIN_CCC_RSB 2227852 246818 30494 90.026
SPIN_CWS_RSB 5049788 196650 27850 96.252
SPIN_PPC_BUCKET 2769858 45275 14222 98.392
SPIN_DD_CACHE_BUCKET 4276108 82745 10715 98.102
SPIN_FD_BUCKET 463950 10045 5165 97.881
SPIN_ACF_RECL_WS 14342521 26098 2610 99.818
SPIN_CWS_RSBTBL 5095846 1305778 2091 79.602
SPIN_REDO_ALLOC 1901600 40658 1916 97.907
SPIN_BITQ 17222654 31951 1874 99.815
SPIN_ACF_TIMEOUT 3284359 46916 1726 98.592
SPIN_CWS_LCB 18480054 42700 1276 99.769
SPIN_CF 918902 15440 1139 98.348
SPIN_PARAM 691405 13226 1039 98.123
SPIN_ALLOC_LRU 8160990 18543 887 99.773
SPIN_USGMT_CACHE 712125 9064 872 98.743
SPIN_CCC_RSBTBL 3989049 8858 775 99.778
SPIN_PPSTAT 2444474 15220 657 99.381
SPIN_REDO_WRITING 332534 6677 517 98.032
SPIN_ACF_MSGQ_WS 1197459 7494 381 99.378
SPIN_BUF_WS_CKPT 13035973 1514 354 99.988
SPIN_ALLOC 19694967 2911 285 99.985
Omitted below...
Refer to the following "TAC DB" section for a description of each item.
TAC DB
The following code is an example of writing a TAC DB query.
SELECT INST_ID,
name "Name",
SUM(fast_cnt + try_get_cnt) as "Gets",
SUM(spin_cnt + sleep_cnt + try_fail_cnt) as "Misses",
SUM(sleep_cnt) as "Sleeps",
round((1 - (SUM(spin_cnt + sleep_cnt + try_fail_cnt)
28 Tibero Monitoring Guide
/ SUM(fast_cnt + spin_cnt + sleep_cnt + try_get_cnt +
try_fail_cnt)))
* 100, 3) as "Hit Ratio"
FROM _gvt_spinlock
GROUP BY INST_ID,
type,
spin_level,
name
HAVING SUM(fast_cnt + try_get_cnt) > 0
ORDER BY 2, 5 DESC, 3 DESC;
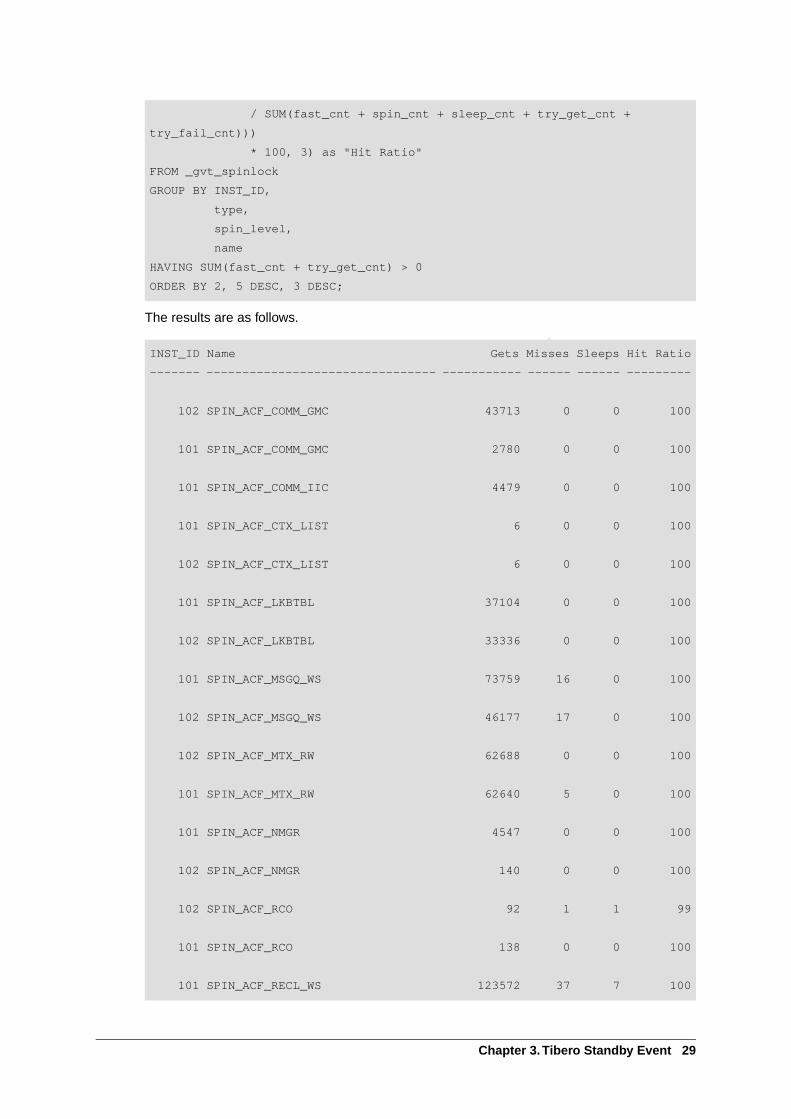
The results are as follows.
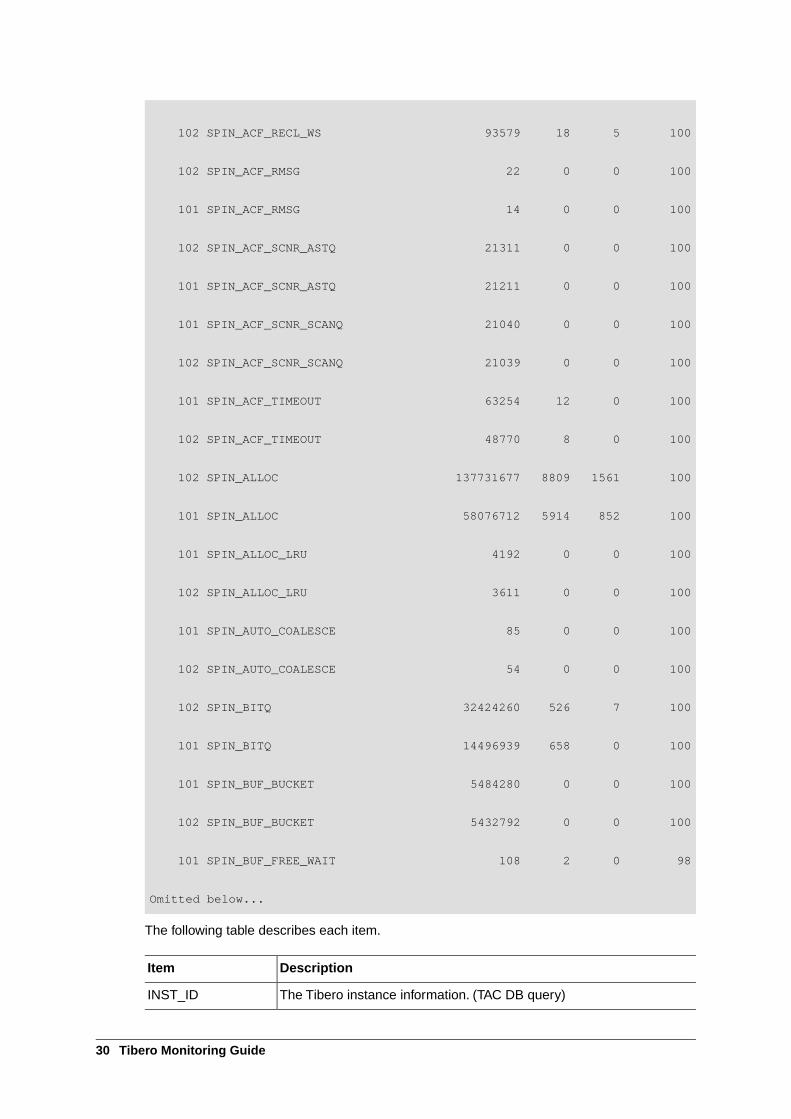
INST_ID Name Gets Misses Sleeps Hit Ratio
------- -------------------------------- ----------- ------ ------ ---------
102 SPIN_ACF_COMM_GMC 43713 0 0 100
101 SPIN_ACF_COMM_GMC 2780 0 0 100
101 SPIN_ACF_COMM_IIC 4479 0 0 100
101 SPIN_ACF_CTX_LIST 6 0 0 100
102 SPIN_ACF_CTX_LIST 6 0 0 100
101 SPIN_ACF_LKBTBL 37104 0 0 100
102 SPIN_ACF_LKBTBL 33336 0 0 100
101 SPIN_ACF_MSGQ_WS 73759 16 0 100
102 SPIN_ACF_MSGQ_WS 46177 17 0 100
102 SPIN_ACF_MTX_RW 62688 0 0 100
101 SPIN_ACF_MTX_RW 62640 5 0 100
101 SPIN_ACF_NMGR 4547 0 0 100
102 SPIN_ACF_NMGR 140 0 0 100
102 SPIN_ACF_RCO 92 1 1 99
101 SPIN_ACF_RCO 138 0 0 100
101 SPIN_ACF_RECL_WS 123572 37 7 100
Chapter 3.Tibero Standby Event 29
102 SPIN_ACF_RECL_WS 93579 18 5 100
102 SPIN_ACF_RMSG 22 0 0 100
101 SPIN_ACF_RMSG 14 0 0 100
102 SPIN_ACF_SCNR_ASTQ 21311 0 0 100
101 SPIN_ACF_SCNR_ASTQ 21211 0 0 100
101 SPIN_ACF_SCNR_SCANQ 21040 0 0 100
102 SPIN_ACF_SCNR_SCANQ 21039 0 0 100
101 SPIN_ACF_TIMEOUT 63254 12 0 100
102 SPIN_ACF_TIMEOUT 48770 8 0 100
102 SPIN_ALLOC 137731677 8809 1561 100
101 SPIN_ALLOC 58076712 5914 852 100
101 SPIN_ALLOC_LRU 4192 0 0 100
102 SPIN_ALLOC_LRU 3611 0 0 100
101 SPIN_AUTO_COALESCE 85 0 0 100
102 SPIN_AUTO_COALESCE 54 0 0 100
102 SPIN_BITQ 32424260 526 7 100
101 SPIN_BITQ 14496939 658 0 100
101 SPIN_BUF_BUCKET 5484280 0 0 100
102 SPIN_BUF_BUCKET 5432792 0 0 100
101 SPIN_BUF_FREE_WAIT 108 2 0 98
Omitted below...
The following table describes each item.
DescriptionItem
The Tibero instance information. (TAC DB query)INST_ID
30 Tibero Monitoring Guide
DescriptionItem
The type of spinlock.NAME
When making a spinlock acquisition request, the Gets value increases
by one.
Gets
When a spinlock acquisition fails in the first attempt, the Misses value
increases by one.
Misses
Increases by 1 whenever entering sleep status.Sleeps
The hit ratio.Hit Ratio
The statistics for acquiring and failing to acquire the latch in Willing-to-Wait mode is viewed
through v$latch View. The Gets (I) and Misses (I) items each refer to the Gets (or Immediate
Gets) and Misses (or Immediate Misses) value. The larger value between Gets and Immediate
Gets is displayed.
When Gets is requested through Willing-to-Wait mode, Immediate Gets is requested through
No-Wait mode. In Willing-to-Wait mode, if a thread fails to acquire the spinlock, the thread retries
by spinning and sleeping until it acquires the spinlock. In No-Wait mode, if a thread fails to get
the spinlock, it doesn't wait for the latch. Basically, using the Willing-to-Wait mode means waiting
until the spinlock is acquired.
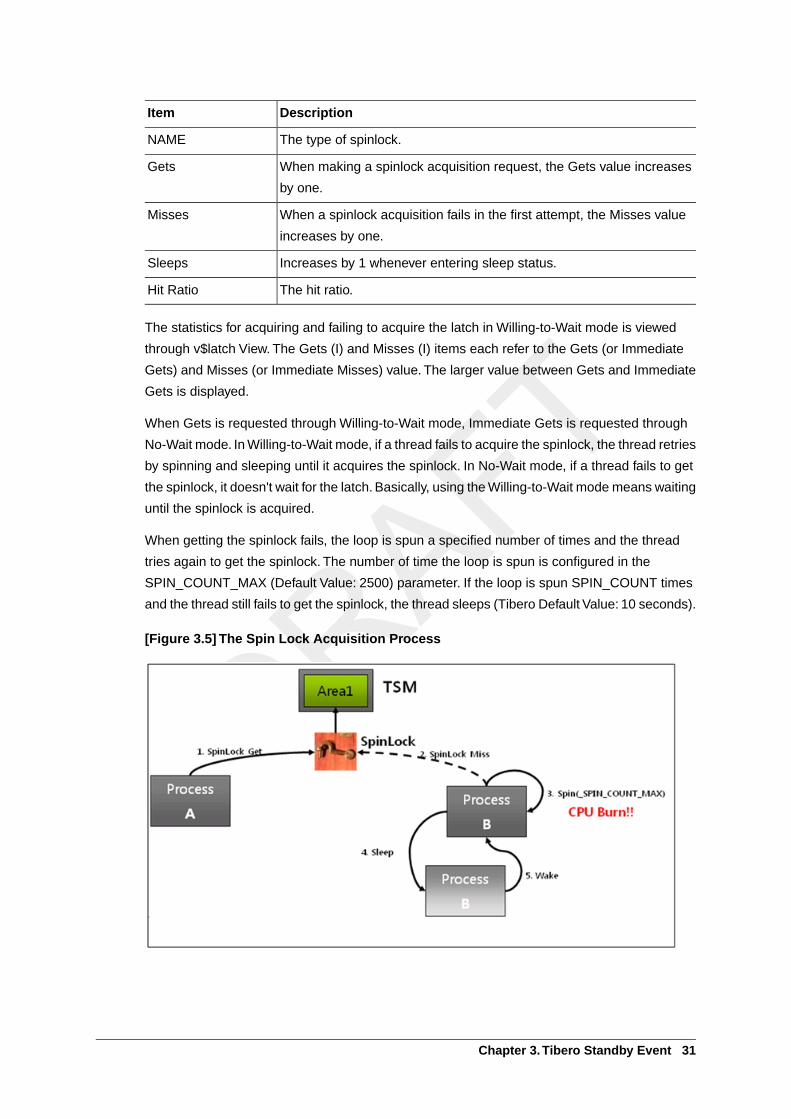
When getting the spinlock fails, the loop is spun a specified number of times and the thread
tries again to get the spinlock. The number of time the loop is spun is configured in the
SPIN_COUNT_MAX (Default Value: 2500) parameter. If the loop is spun SPIN_COUNT times
and the thread still fails to get the spinlock, the thread sleeps (Tibero Default Value: 10 seconds).
[Figure 3.5] The Spin Lock Acquisition Process
Chapter 3.Tibero Standby Event 31
No-Wait mode is used when there are multiple spinlocks with the same function as the Redo
Copy Spinlock, or when avoiding deadlocks. Excluding Redo Copy Spinlock, all spinlocks are
requested through Willing- to-Wait mode.
The following table describes the statistical items for getting or failing to get the spinlock in
No-Wait mode.
DescriptionItem
Increases by 1 when a spinlock is acquired.IMMEDIATE_GETS
Increases by 1 when a spinlock fails to be acquired.IMMEDIATE_MISSES
The GETS value is increased regardless of success or failure. However, the IMMEDIATE_GETS
column increases by 1 only upon success. The hit ratio of all spinlocks must be 98% or higher.
If the hit ratio of each of the spinlocks is not very high, the resources of each spinlock must be
increased or the usage of the applications that use spinlocks must be decreased.
The following table describes the items that display the spinlock information.
DescriptionItem
The number of times a lock is acquired without waiting.fast_cnt
Because it is lighter than wlock, a lock is acquired in the order that a
deadlock does not occur.
try_get_cnt
When the hit ratio of the spinlock is less than 98%, get the lock without spinning. If the lock fails
to be acquired, retry. If getting the lock still fails, release all locks and try again from the beginning.
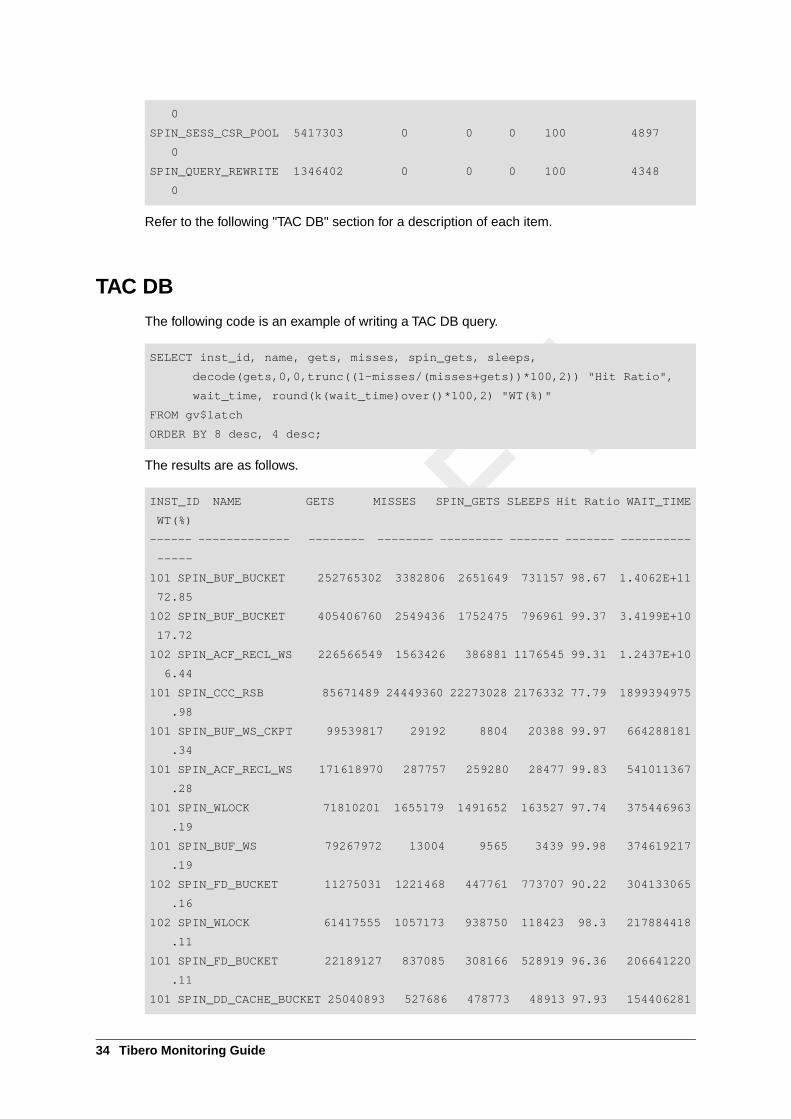
3.4. Spinlock MonitoringCheck the information about spinlock contention.
Single DB
The following code is an example of writing a aingle DB query.
SELECT name, gets, misses, spin_gets, sleeps,
decode(gets,0,0,trunc((1-misses/(misses+gets))*100,2)) "Hit Ratio",
wait_time, round(ratio_to_report(wait_time)over()*100,2) "WAIT_TIME(%)"
FROM v$latch
ORDER BY 7 desc,3 desc;
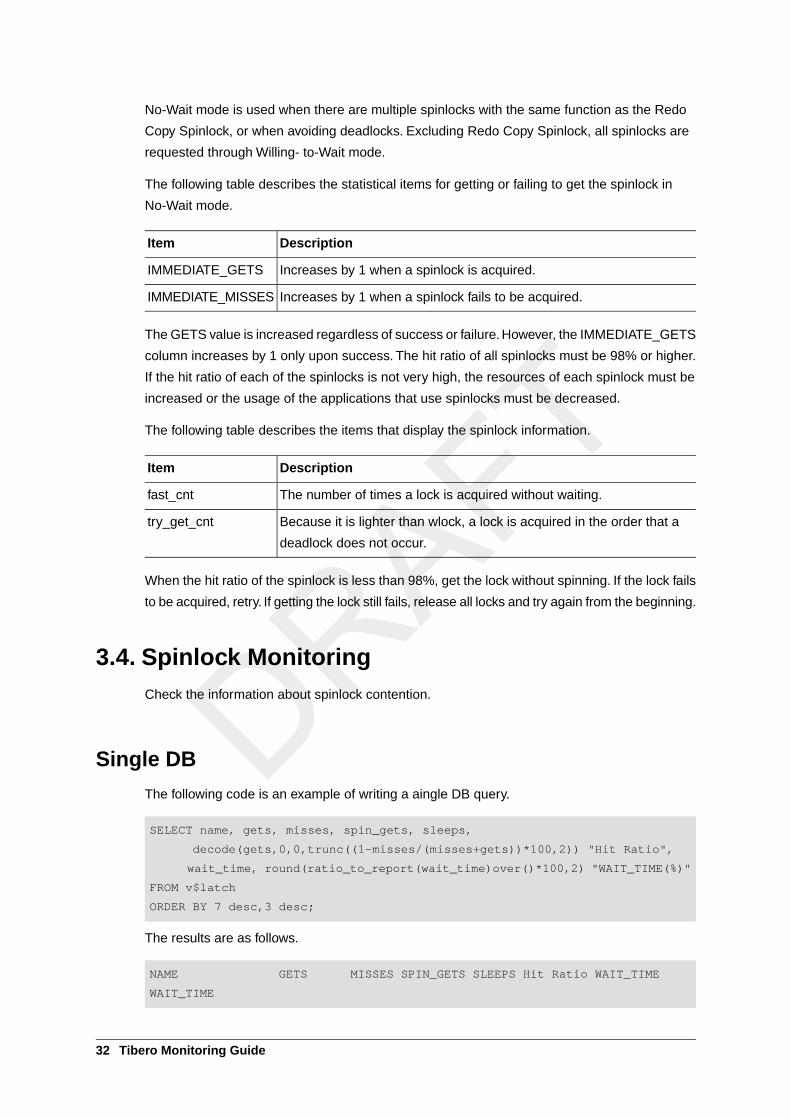
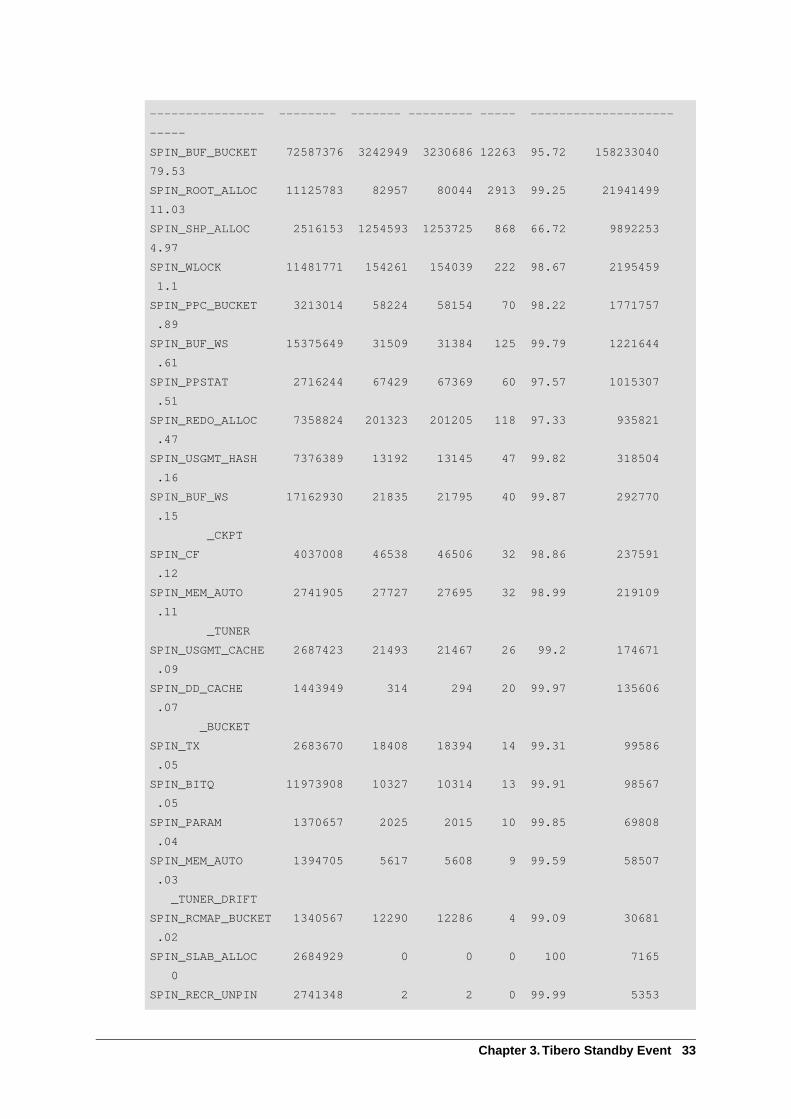
The results are as follows.
NAME GETS MISSES SPIN_GETS SLEEPS Hit Ratio WAIT_TIME
WAIT_TIME
32 Tibero Monitoring Guide
---------------- -------- ------- --------- ----- --------------------
-----
SPIN_BUF_BUCKET 72587376 3242949 3230686 12263 95.72 158233040
79.53
SPIN_ROOT_ALLOC 11125783 82957 80044 2913 99.25 21941499
11.03
SPIN_SHP_ALLOC 2516153 1254593 1253725 868 66.72 9892253
4.97
SPIN_WLOCK 11481771 154261 154039 222 98.67 2195459
1.1
SPIN_PPC_BUCKET 3213014 58224 58154 70 98.22 1771757
.89
SPIN_BUF_WS 15375649 31509 31384 125 99.79 1221644
.61
SPIN_PPSTAT 2716244 67429 67369 60 97.57 1015307
.51
SPIN_REDO_ALLOC 7358824 201323 201205 118 97.33 935821
.47
SPIN_USGMT_HASH 7376389 13192 13145 47 99.82 318504
.16
SPIN_BUF_WS 17162930 21835 21795 40 99.87 292770
.15
_CKPT
SPIN_CF 4037008 46538 46506 32 98.86 237591
.12
SPIN_MEM_AUTO 2741905 27727 27695 32 98.99 219109
.11
_TUNER
SPIN_USGMT_CACHE 2687423 21493 21467 26 99.2 174671
.09
SPIN_DD_CACHE 1443949 314 294 20 99.97 135606
.07
_BUCKET
SPIN_TX 2683670 18408 18394 14 99.31 99586
.05
SPIN_BITQ 11973908 10327 10314 13 99.91 98567
.05
SPIN_PARAM 1370657 2025 2015 10 99.85 69808
.04
SPIN_MEM_AUTO 1394705 5617 5608 9 99.59 58507
.03
_TUNER_DRIFT
SPIN_RCMAP_BUCKET 1340567 12290 12286 4 99.09 30681
.02
SPIN_SLAB_ALLOC 2684929 0 0 0 100 7165
0
SPIN_RECR_UNPIN 2741348 2 2 0 99.99 5353
Chapter 3.Tibero Standby Event 33
0
SPIN_SESS_CSR_POOL 5417303 0 0 0 100 4897
0
SPIN_QUERY_REWRITE 1346402 0 0 0 100 4348
0
Refer to the following "TAC DB" section for a description of each item.
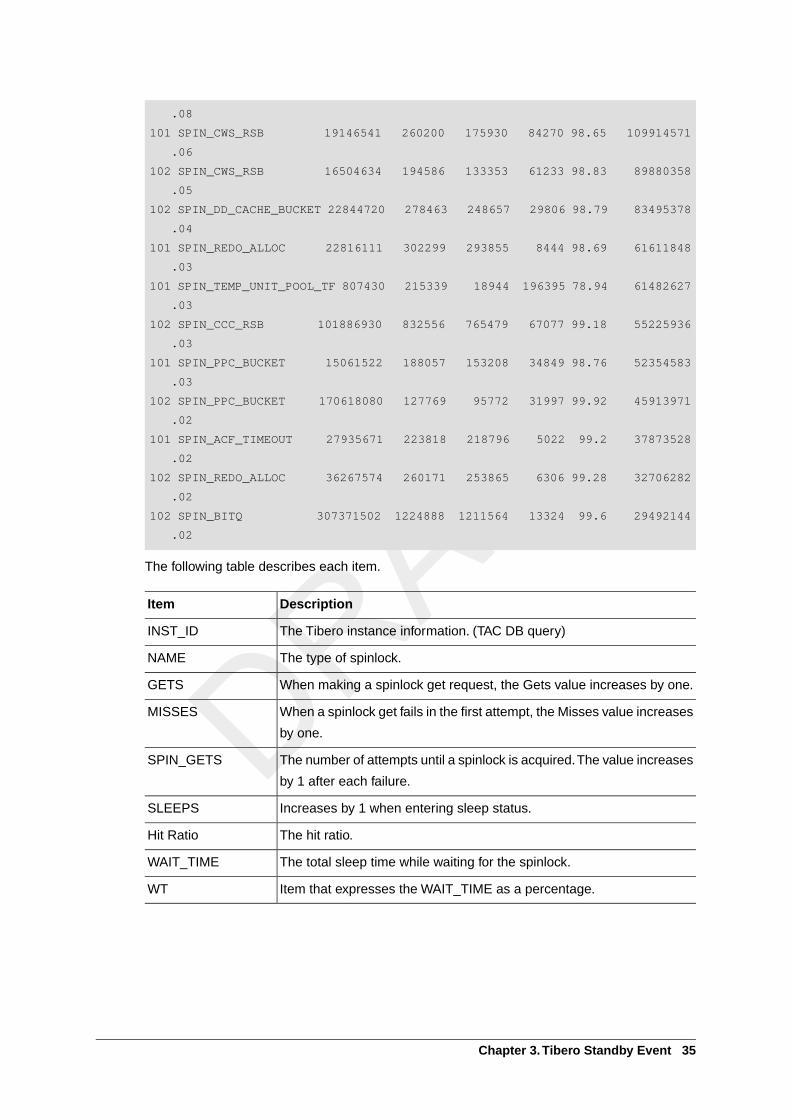
TAC DB
The following code is an example of writing a TAC DB query.
SELECT inst_id, name, gets, misses, spin_gets, sleeps,
decode(gets,0,0,trunc((1-misses/(misses+gets))*100,2)) "Hit Ratio",
wait_time, round(k(wait_time)over()*100,2) "WT(%)"
FROM gv$latch
ORDER BY 8 desc, 4 desc;
The results are as follows.
INST_ID NAME GETS MISSES SPIN_GETS SLEEPS Hit Ratio WAIT_TIME
WT(%)
------ ------------- -------- -------- --------- ------- ------- ----------
-----
101 SPIN_BUF_BUCKET 252765302 3382806 2651649 731157 98.67 1.4062E+11
72.85
102 SPIN_BUF_BUCKET 405406760 2549436 1752475 796961 99.37 3.4199E+10
17.72
102 SPIN_ACF_RECL_WS 226566549 1563426 386881 1176545 99.31 1.2437E+10
6.44
101 SPIN_CCC_RSB 85671489 24449360 22273028 2176332 77.79 1899394975
.98
101 SPIN_BUF_WS_CKPT 99539817 29192 8804 20388 99.97 664288181
.34
101 SPIN_ACF_RECL_WS 171618970 287757 259280 28477 99.83 541011367
.28
101 SPIN_WLOCK 71810201 1655179 1491652 163527 97.74 375446963
.19
101 SPIN_BUF_WS 79267972 13004 9565 3439 99.98 374619217
.19
102 SPIN_FD_BUCKET 11275031 1221468 447761 773707 90.22 304133065
.16
102 SPIN_WLOCK 61417555 1057173 938750 118423 98.3 217884418
.11
101 SPIN_FD_BUCKET 22189127 837085 308166 528919 96.36 206641220
.11
101 SPIN_DD_CACHE_BUCKET 25040893 527686 478773 48913 97.93 154406281
34 Tibero Monitoring Guide
.08
101 SPIN_CWS_RSB 19146541 260200 175930 84270 98.65 109914571
.06
102 SPIN_CWS_RSB 16504634 194586 133353 61233 98.83 89880358
.05
102 SPIN_DD_CACHE_BUCKET 22844720 278463 248657 29806 98.79 83495378
.04
101 SPIN_REDO_ALLOC 22816111 302299 293855 8444 98.69 61611848
.03
101 SPIN_TEMP_UNIT_POOL_TF 807430 215339 18944 196395 78.94 61482627
.03
102 SPIN_CCC_RSB 101886930 832556 765479 67077 99.18 55225936
.03
101 SPIN_PPC_BUCKET 15061522 188057 153208 34849 98.76 52354583
.03
102 SPIN_PPC_BUCKET 170618080 127769 95772 31997 99.92 45913971
.02
101 SPIN_ACF_TIMEOUT 27935671 223818 218796 5022 99.2 37873528
.02
102 SPIN_REDO_ALLOC 36267574 260171 253865 6306 99.28 32706282
.02
102 SPIN_BITQ 307371502 1224888 1211564 13324 99.6 29492144
.02
The following table describes each item.
DescriptionItem
The Tibero instance information. (TAC DB query)INST_ID
The type of spinlock.NAME
When making a spinlock get request, the Gets value increases by one.GETS
When a spinlock get fails in the first attempt, the Misses value increases
by one.
MISSES
The number of attempts until a spinlock is acquired.The value increases
by 1 after each failure.
SPIN_GETS
Increases by 1 when entering sleep status.SLEEPS
The hit ratio.Hit Ratio
The total sleep time while waiting for the spinlock.WAIT_TIME
Item that expresses the WAIT_TIME as a percentage.WT
Chapter 3.Tibero Standby Event 35
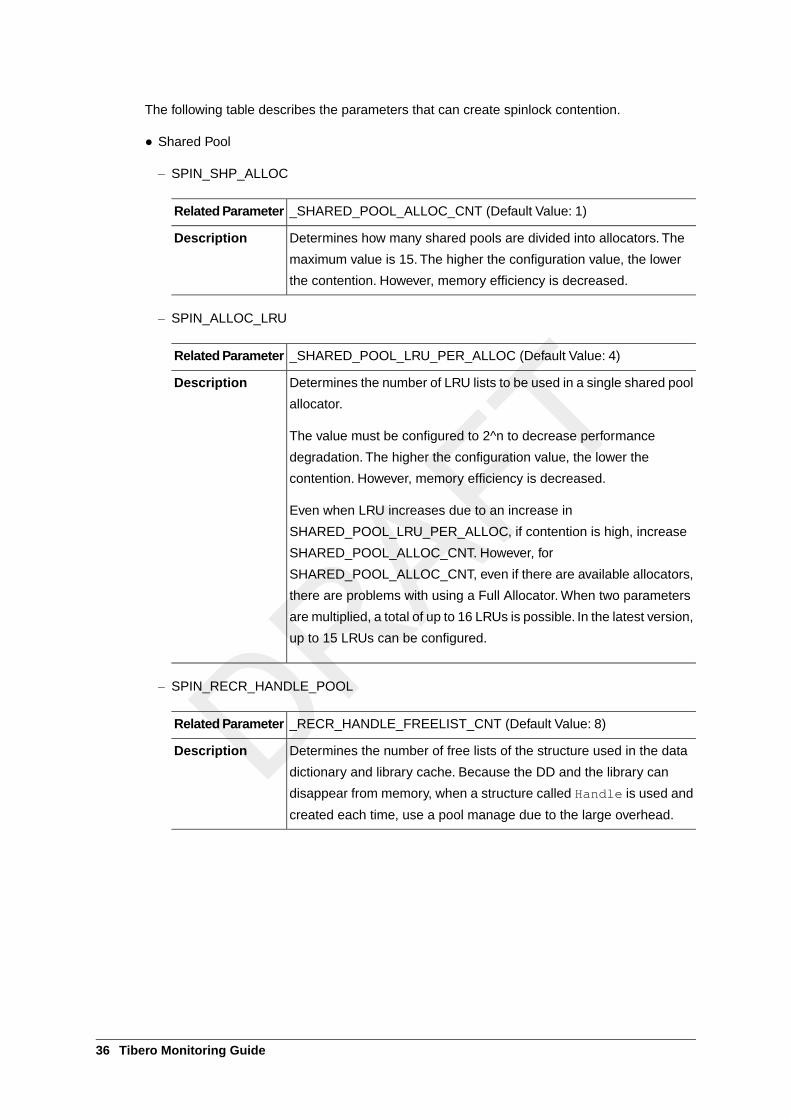
The following table describes the parameters that can create spinlock contention.
● Shared Pool
– SPIN_SHP_ALLOC
_SHARED_POOL_ALLOC_CNT (Default Value: 1)Related Parameter
Determines how many shared pools are divided into allocators. The
maximum value is 15. The higher the configuration value, the lower
the contention. However, memory efficiency is decreased.
Description
– SPIN_ALLOC_LRU
_SHARED_POOL_LRU_PER_ALLOC (Default Value: 4)Related Parameter
Determines the number of LRU lists to be used in a single shared pool
allocator.
The value must be configured to 2^n to decrease performance
degradation. The higher the configuration value, the lower the
contention. However, memory efficiency is decreased.
Even when LRU increases due to an increase in
SHARED_POOL_LRU_PER_ALLOC, if contention is high, increase
SHARED_POOL_ALLOC_CNT. However, for
SHARED_POOL_ALLOC_CNT, even if there are available allocators,
there are problems with using a Full Allocator. When two parameters
are multiplied, a total of up to 16 LRUs is possible. In the latest version,
up to 15 LRUs can be configured.
Description
– SPIN_RECR_HANDLE_POOL
_RECR_HANDLE_FREELIST_CNT (Default Value: 8)Related Parameter
Determines the number of free lists of the structure used in the data
dictionary and library cache. Because the DD and the library can
disappear from memory, when a structure called Handle is used and
created each time, use a pool manage due to the large overhead.
Description
36 Tibero Monitoring Guide
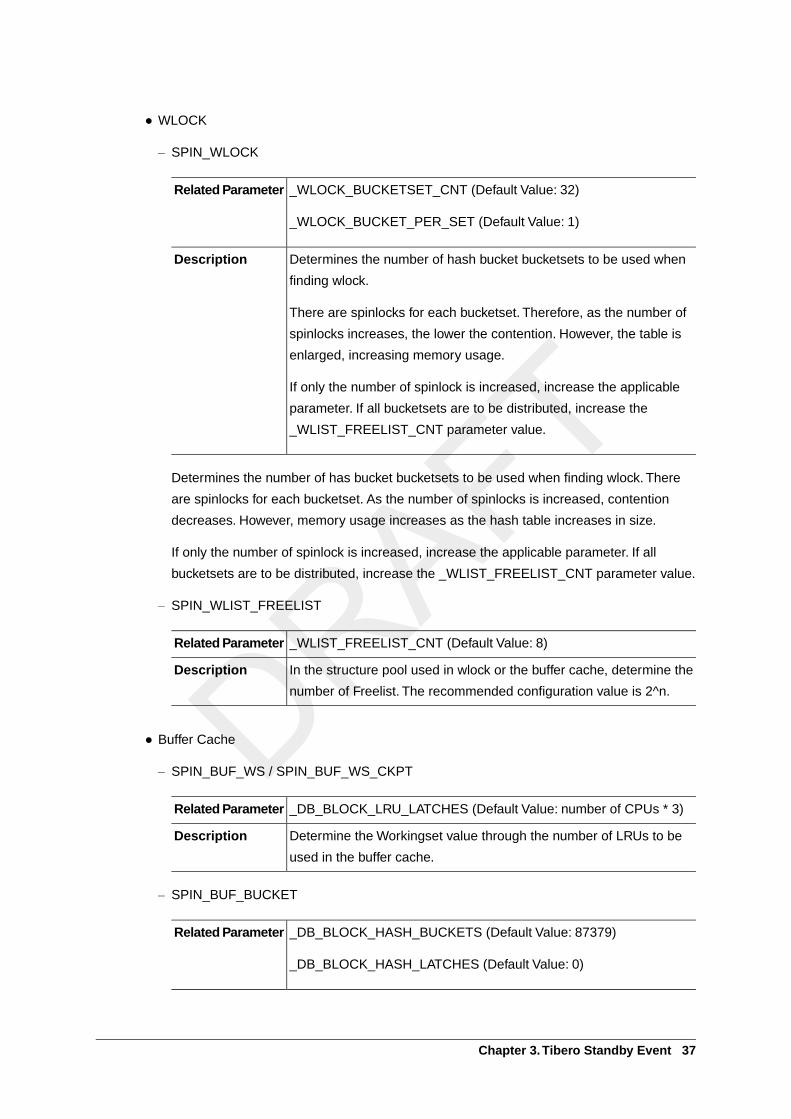
● WLOCK
– SPIN_WLOCK
_WLOCK_BUCKETSET_CNT (Default Value: 32)
_WLOCK_BUCKET_PER_SET (Default Value: 1)
Related Parameter
Determines the number of hash bucket bucketsets to be used when
finding wlock.
There are spinlocks for each bucketset. Therefore, as the number of
spinlocks increases, the lower the contention. However, the table is
enlarged, increasing memory usage.
If only the number of spinlock is increased, increase the applicable
parameter. If all bucketsets are to be distributed, increase the
_WLIST_FREELIST_CNT parameter value.
Description
Determines the number of has bucket bucketsets to be used when finding wlock. There
are spinlocks for each bucketset. As the number of spinlocks is increased, contention
decreases. However, memory usage increases as the hash table increases in size.
If only the number of spinlock is increased, increase the applicable parameter. If all
bucketsets are to be distributed, increase the _WLIST_FREELIST_CNT parameter value.
– SPIN_WLIST_FREELIST
_WLIST_FREELIST_CNT (Default Value: 8)Related Parameter
In the structure pool used in wlock or the buffer cache, determine the
number of Freelist. The recommended configuration value is 2^n.
Description
● Buffer Cache
– SPIN_BUF_WS / SPIN_BUF_WS_CKPT
_DB_BLOCK_LRU_LATCHES (Default Value: number of CPUs * 3)Related Parameter
Determine the Workingset value through the number of LRUs to be
used in the buffer cache.
Description
– SPIN_BUF_BUCKET
_DB_BLOCK_HASH_BUCKETS (Default Value: 87379)
_DB_BLOCK_HASH_LATCHES (Default Value: 0)
Related Parameter
Chapter 3.Tibero Standby Event 37
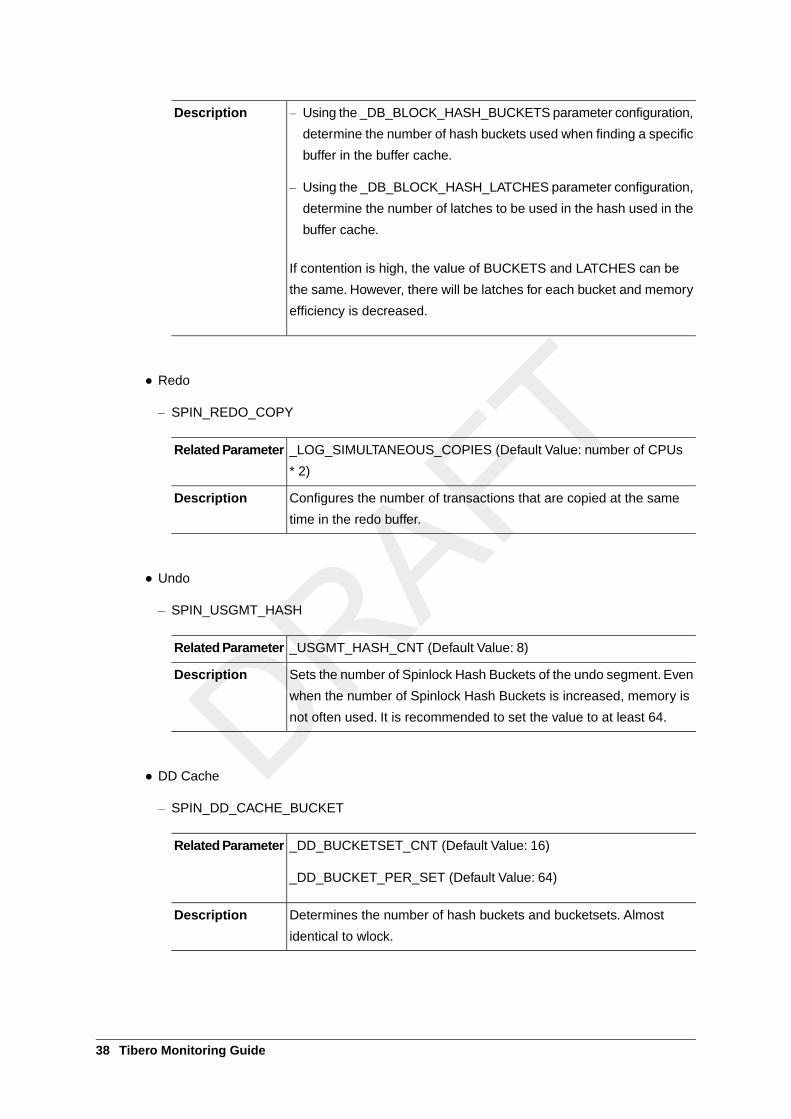
– Using the _DB_BLOCK_HASH_BUCKETS parameter configuration,
determine the number of hash buckets used when finding a specific
buffer in the buffer cache.
– Using the _DB_BLOCK_HASH_LATCHES parameter configuration,
determine the number of latches to be used in the hash used in the
buffer cache.
If contention is high, the value of BUCKETS and LATCHES can be
the same. However, there will be latches for each bucket and memory
efficiency is decreased.
Description
● Redo
– SPIN_REDO_COPY
_LOG_SIMULTANEOUS_COPIES (Default Value: number of CPUs
* 2)
Related Parameter
Configures the number of transactions that are copied at the same
time in the redo buffer.
Description
● Undo
– SPIN_USGMT_HASH
_USGMT_HASH_CNT (Default Value: 8)Related Parameter
Sets the number of Spinlock Hash Buckets of the undo segment. Even
when the number of Spinlock Hash Buckets is increased, memory is
not often used. It is recommended to set the value to at least 64.
Description
● DD Cache
– SPIN_DD_CACHE_BUCKET
_DD_BUCKETSET_CNT (Default Value: 16)
_DD_BUCKET_PER_SET (Default Value: 64)
Related Parameter
Determines the number of hash buckets and bucketsets. Almost
identical to wlock.
Description
38 Tibero Monitoring Guide
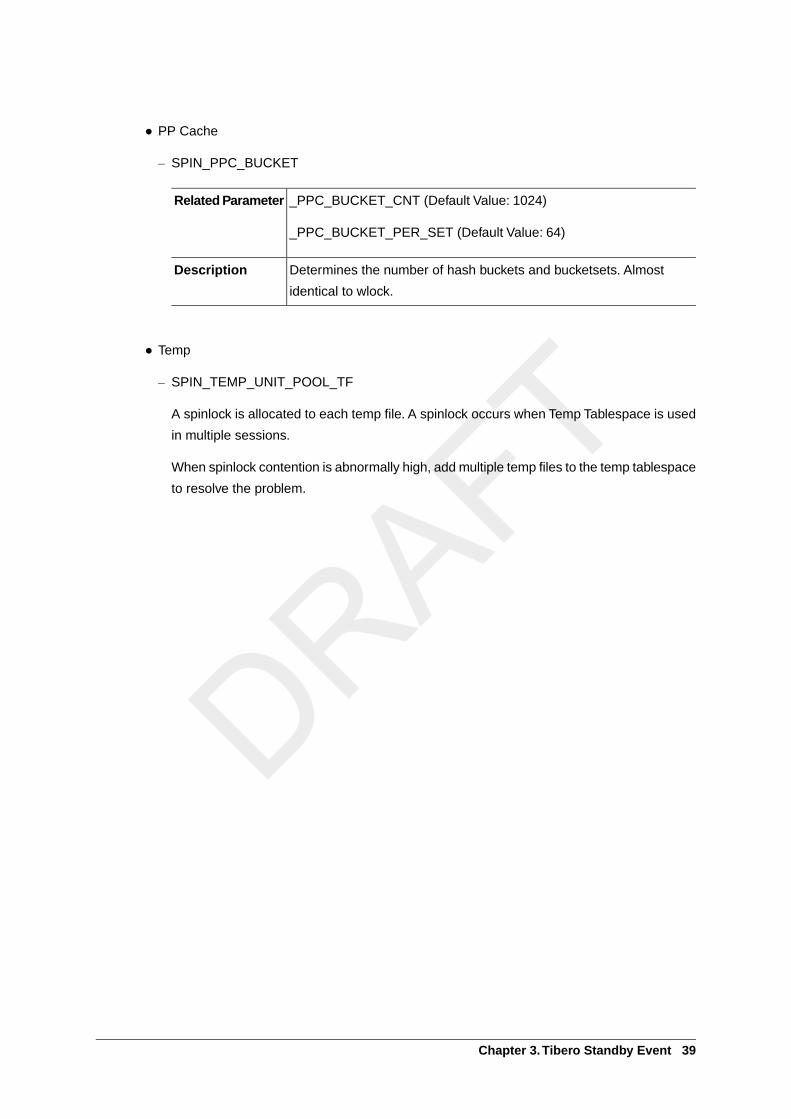
● PP Cache
– SPIN_PPC_BUCKET
_PPC_BUCKET_CNT (Default Value: 1024)
_PPC_BUCKET_PER_SET (Default Value: 64)
Related Parameter
Determines the number of hash buckets and bucketsets. Almost
identical to wlock.
Description
● Temp
– SPIN_TEMP_UNIT_POOL_TF
A spinlock is allocated to each temp file. A spinlock occurs when Temp Tablespace is used
in multiple sessions.
When spinlock contention is abnormally high, add multiple temp files to the temp tablespace
to resolve the problem.
Chapter 3.Tibero Standby Event 39

Chapter 4. Lock & Current Transaction
This chapter describes locks and transactions.
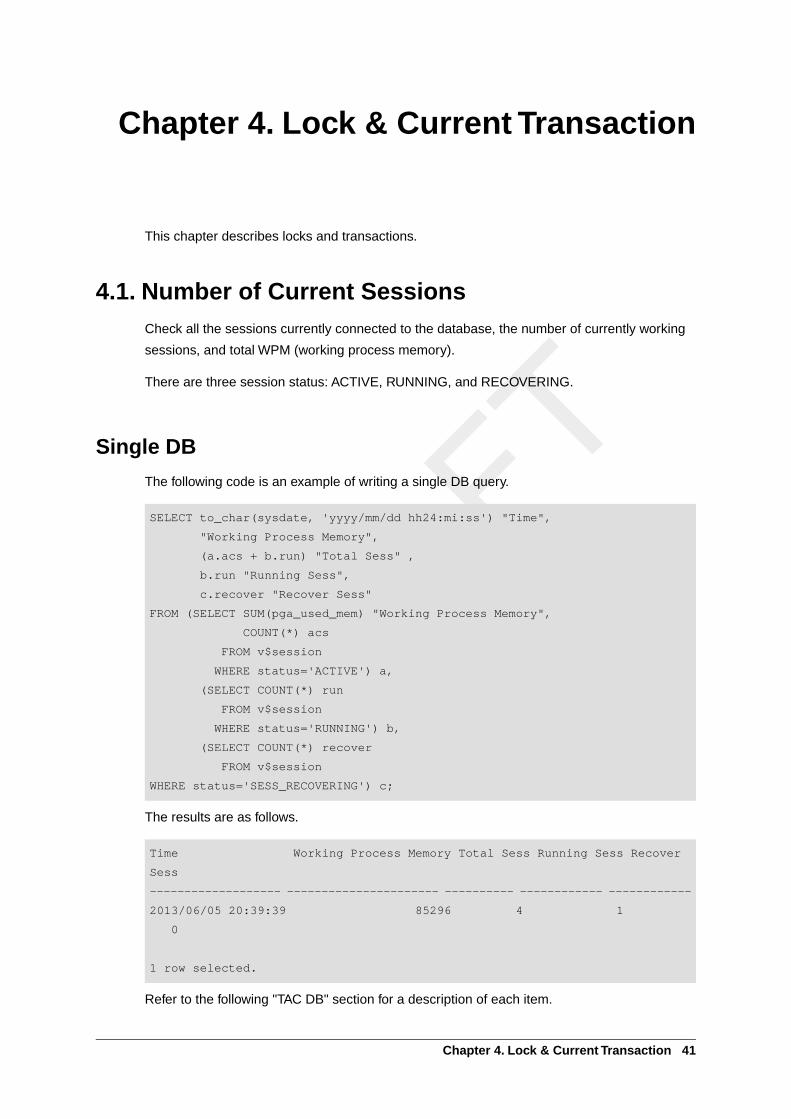
4.1. Number of Current SessionsCheck all the sessions currently connected to the database, the number of currently working
sessions, and total WPM (working process memory).
There are three session status: ACTIVE, RUNNING, and RECOVERING.
Single DB
The following code is an example of writing a single DB query.
SELECT to_char(sysdate, 'yyyy/mm/dd hh24:mi:ss') "Time",
"Working Process Memory",
(a.acs + b.run) "Total Sess" ,
b.run "Running Sess",
c.recover "Recover Sess"
FROM (SELECT SUM(pga_used_mem) "Working Process Memory",
COUNT(*) acs
FROM v$session
WHERE status='ACTIVE') a,
(SELECT COUNT(*) run
FROM v$session
WHERE status='RUNNING') b,
(SELECT COUNT(*) recover
FROM v$session
WHERE status='SESS_RECOVERING') c;
The results are as follows.
Time Working Process Memory Total Sess Running Sess Recover
Sess
------------------- ---------------------- ---------- ------------ ------------
2013/06/05 20:39:39 85296 4 1
0
1 row selected.
Refer to the following "TAC DB" section for a description of each item.
Chapter 4. Lock & Current Transaction 41
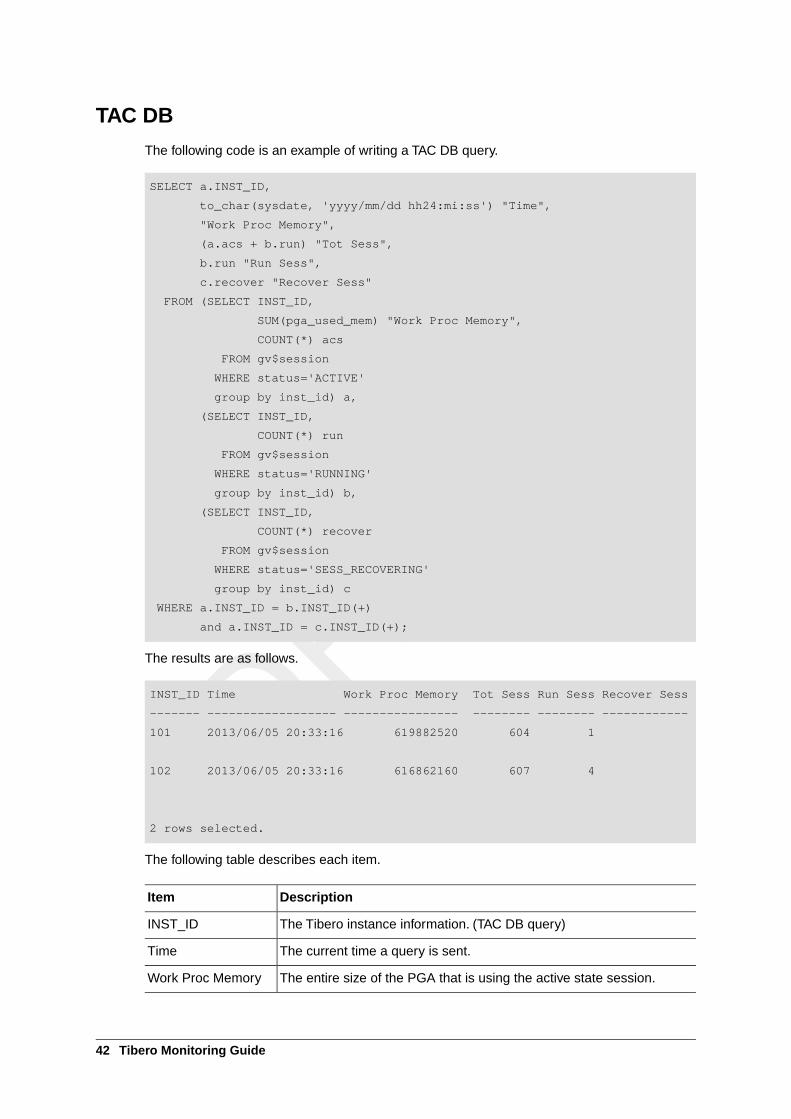
TAC DB
The following code is an example of writing a TAC DB query.
SELECT a.INST_ID,
to_char(sysdate, 'yyyy/mm/dd hh24:mi:ss') "Time",
"Work Proc Memory",
(a.acs + b.run) "Tot Sess",
b.run "Run Sess",
c.recover "Recover Sess"
FROM (SELECT INST_ID,
SUM(pga_used_mem) "Work Proc Memory",
COUNT(*) acs
FROM gv$session
WHERE status='ACTIVE'
group by inst_id) a,
(SELECT INST_ID,
COUNT(*) run
FROM gv$session
WHERE status='RUNNING'
group by inst_id) b,
(SELECT INST_ID,
COUNT(*) recover
FROM gv$session
WHERE status='SESS_RECOVERING'
group by inst_id) c
WHERE a.INST_ID = b.INST_ID(+)
and a.INST_ID = c.INST_ID(+);
The results are as follows.
INST_ID Time Work Proc Memory Tot Sess Run Sess Recover Sess
------- ------------------ ---------------- -------- -------- ------------
101 2013/06/05 20:33:16 619882520 604 1
102 2013/06/05 20:33:16 616862160 607 4
2 rows selected.
The following table describes each item.
DescriptionItem
The Tibero instance information. (TAC DB query)INST_ID
The current time a query is sent.Time
The entire size of the PGA that is using the active state session.Work Proc Memory
42 Tibero Monitoring Guide
DescriptionItem
The typical state. It is the state where users are only connected.Active
The actual running state.RUNNING
The state where a transaction is recovering when booted or a session
is forcibly terminated.
SESS_RECOVERING
If most of the session are running sessions, then take appropriate action by checking the lock
and current transaction information.
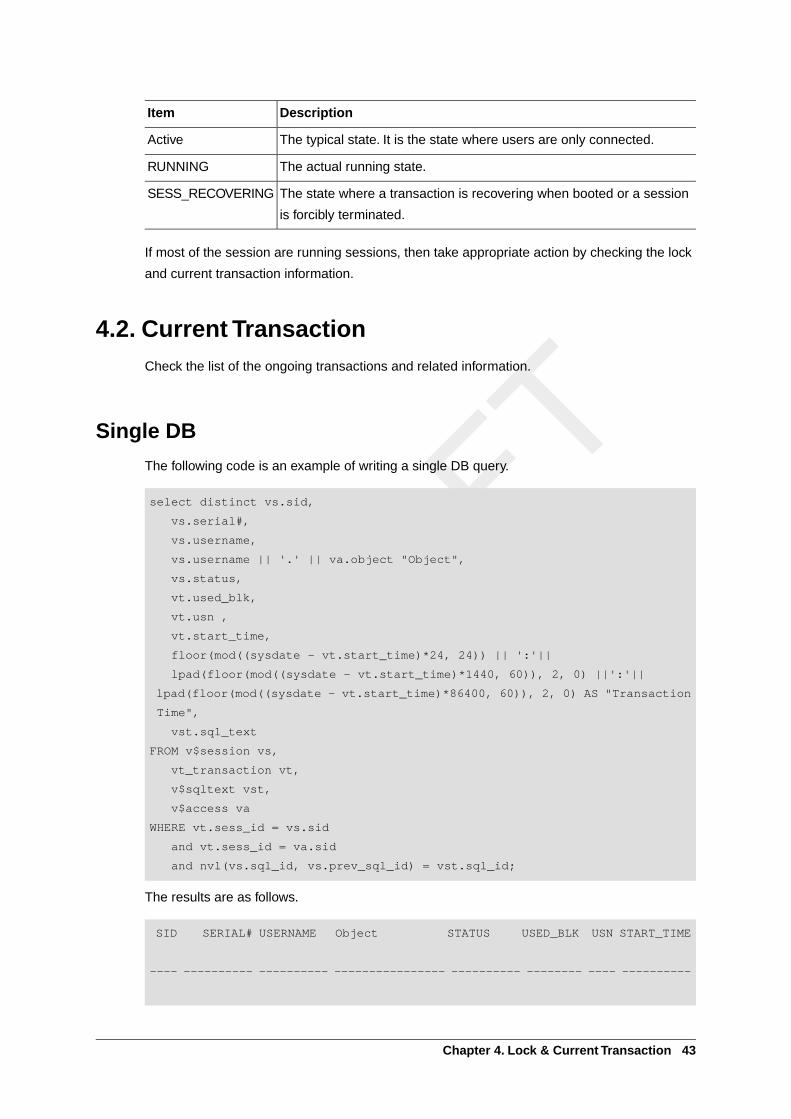
4.2. Current TransactionCheck the list of the ongoing transactions and related information.
Single DB
The following code is an example of writing a single DB query.
select distinct vs.sid,
vs.serial#,
vs.username,
vs.username || '.' || va.object "Object",
vs.status,
vt.used_blk,
vt.usn ,
vt.start_time,
floor(mod((sysdate - vt.start_time)*24, 24)) || ':'||
lpad(floor(mod((sysdate - vt.start_time)*1440, 60)), 2, 0) ||':'||
lpad(floor(mod((sysdate - vt.start_time)*86400, 60)), 2, 0) AS "Transaction
Time",
vst.sql_text
FROM v$session vs,
vt_transaction vt,
v$sqltext vst,
v$access va
WHERE vt.sess_id = vs.sid
and vt.sess_id = va.sid
and nvl(vs.sql_id, vs.prev_sql_id) = vst.sql_id;
The results are as follows.
SID SERIAL# USERNAME Object STATUS USED_BLK USN START_TIME
---- ---------- ---------- ---------------- ---------- -------- ---- ----------
Chapter 4. Lock & Current Transaction 43
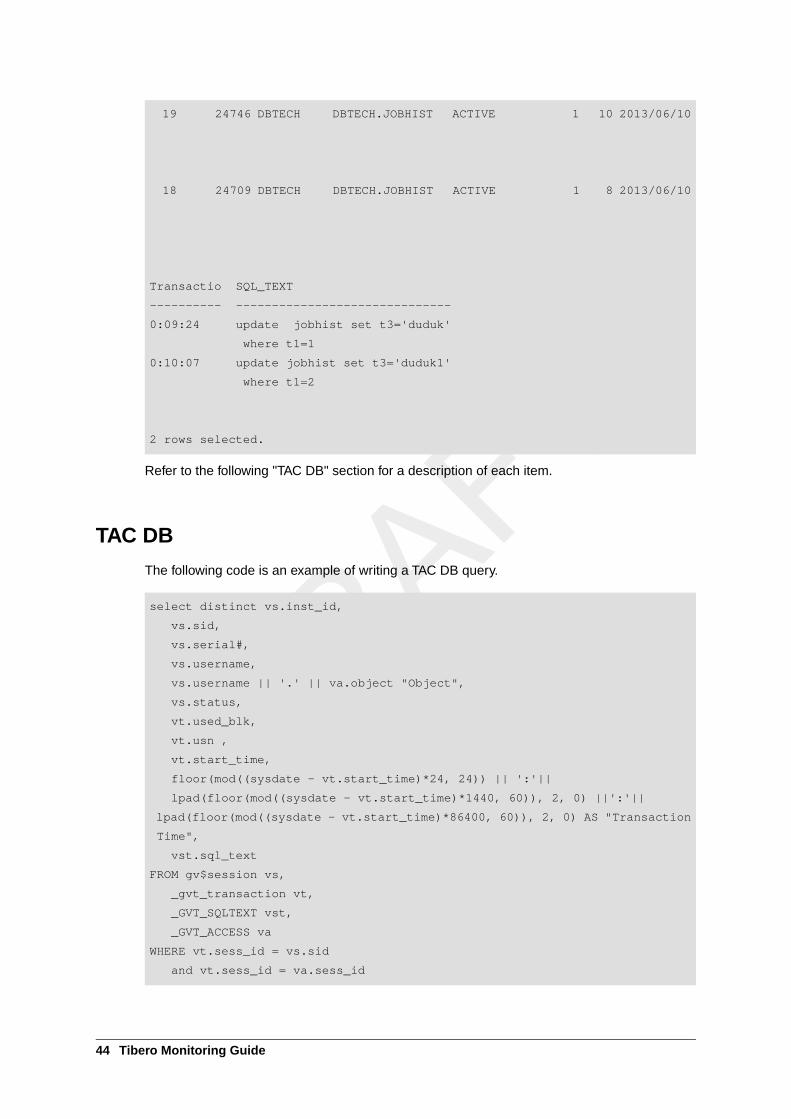
19 24746 DBTECH DBTECH.JOBHIST ACTIVE 1 10 2013/06/10
18 24709 DBTECH DBTECH.JOBHIST ACTIVE 1 8 2013/06/10
Transactio SQL_TEXT
---------- ------------------------------
0:09:24 update jobhist set t3='duduk'
where t1=1
0:10:07 update jobhist set t3='duduk1'
where t1=2
2 rows selected.
Refer to the following "TAC DB" section for a description of each item.
TAC DB
The following code is an example of writing a TAC DB query.
select distinct vs.inst_id,
vs.sid,
vs.serial#,
vs.username,
vs.username || '.' || va.object "Object",
vs.status,
vt.used_blk,
vt.usn ,
vt.start_time,
floor(mod((sysdate - vt.start_time)*24, 24)) || ':'||
lpad(floor(mod((sysdate - vt.start_time)*1440, 60)), 2, 0) ||':'||
lpad(floor(mod((sysdate - vt.start_time)*86400, 60)), 2, 0) AS "Transaction
Time",
vst.sql_text
FROM gv$session vs,
_gvt_transaction vt,
_GVT_SQLTEXT vst,
_GVT_ACCESS va
WHERE vt.sess_id = vs.sid
and vt.sess_id = va.sess_id
44 Tibero Monitoring Guide
and nvl(vs.sql_id, vs.prev_sql_id) = vst.sql_id
ORDER BY 1
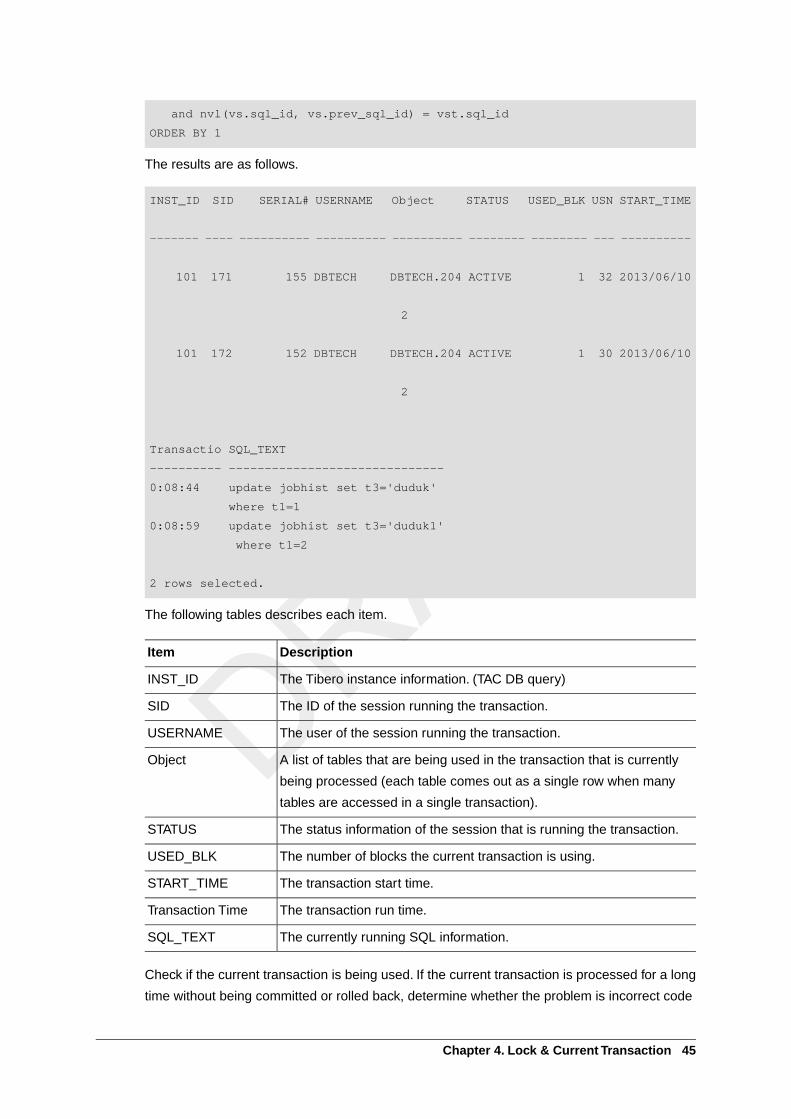
The results are as follows.
INST_ID SID SERIAL# USERNAME Object STATUS USED_BLK USN START_TIME
------- ---- ---------- ---------- ---------- -------- -------- --- ----------
101 171 155 DBTECH DBTECH.204 ACTIVE 1 32 2013/06/10
2
101 172 152 DBTECH DBTECH.204 ACTIVE 1 30 2013/06/10
2
Transactio SQL_TEXT
---------- ------------------------------
0:08:44 update jobhist set t3='duduk'
where t1=1
0:08:59 update jobhist set t3='duduk1'
where t1=2
2 rows selected.
The following tables describes each item.
DescriptionItem
The Tibero instance information. (TAC DB query)INST_ID
The ID of the session running the transaction.SID
The user of the session running the transaction.USERNAME
A list of tables that are being used in the transaction that is currently
being processed (each table comes out as a single row when many
tables are accessed in a single transaction).
Object
The status information of the session that is running the transaction.STATUS
The number of blocks the current transaction is using.USED_BLK
The transaction start time.START_TIME
The transaction run time.Transaction Time
The currently running SQL information.SQL_TEXT
Check if the current transaction is being used. If the current transaction is processed for a long
time without being committed or rolled back, determine whether the problem is incorrect code
Chapter 4. Lock & Current Transaction 45
or a mistake by administrators or developers. After identifying the problem, recommend
committing or rolling back the transaction.
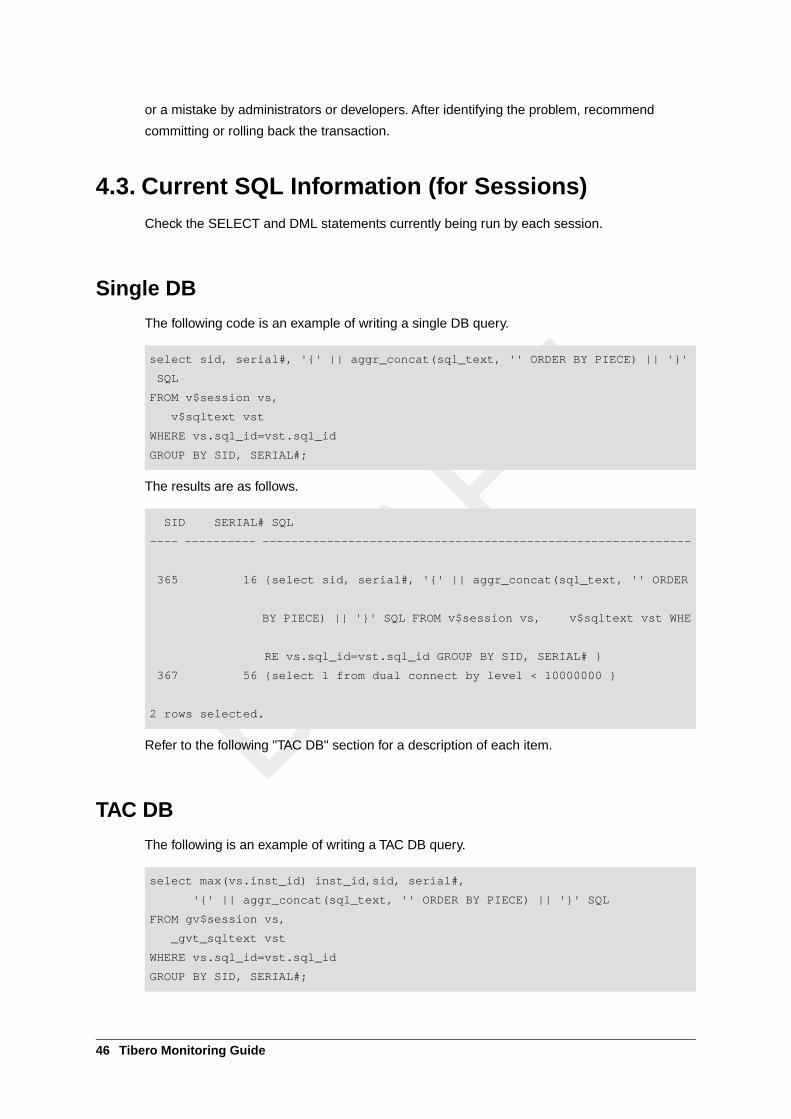
4.3. Current SQL Information (for Sessions)Check the SELECT and DML statements currently being run by each session.
Single DB
The following code is an example of writing a single DB query.
select sid, serial#, '{' || aggr_concat(sql_text, '' ORDER BY PIECE) || '}'
SQL
FROM v$session vs,
v$sqltext vst
WHERE vs.sql_id=vst.sql_id
GROUP BY SID, SERIAL#;
The results are as follows.
SID SERIAL# SQL
---- ---------- ------------------------------------------------------------
365 16 {select sid, serial#, '{' || aggr_concat(sql_text, '' ORDER
BY PIECE) || '}' SQL FROM v$session vs, v$sqltext vst WHE
RE vs.sql_id=vst.sql_id GROUP BY SID, SERIAL# }
367 56 {select 1 from dual connect by level < 10000000 }
2 rows selected.
Refer to the following "TAC DB" section for a description of each item.
TAC DB
The following is an example of writing a TAC DB query.
select max(vs.inst_id) inst_id,sid, serial#,
'{' || aggr_concat(sql_text, '' ORDER BY PIECE) || '}' SQL
FROM gv$session vs,
_gvt_sqltext vst
WHERE vs.sql_id=vst.sql_id
GROUP BY SID, SERIAL#;
46 Tibero Monitoring Guide
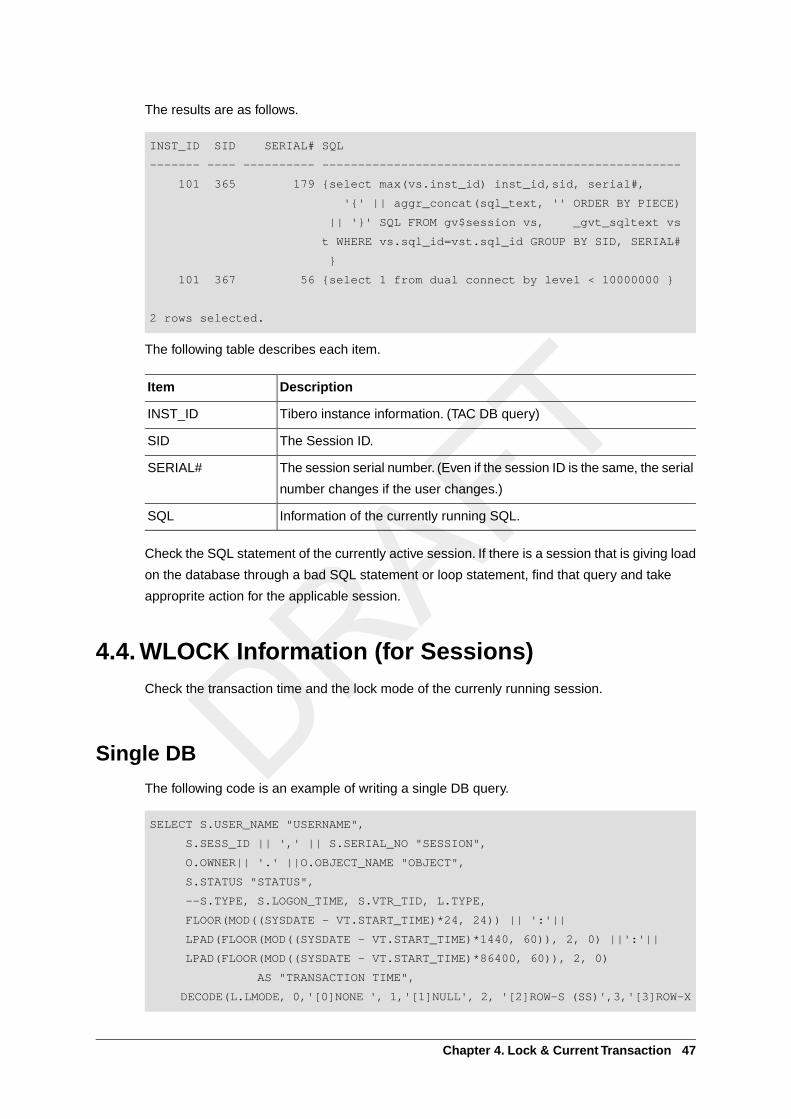
The results are as follows.
INST_ID SID SERIAL# SQL
------- ---- ---------- --------------------------------------------------
101 365 179 {select max(vs.inst_id) inst_id,sid, serial#,
'{' || aggr_concat(sql_text, '' ORDER BY PIECE)
|| '}' SQL FROM gv$session vs, _gvt_sqltext vs
t WHERE vs.sql_id=vst.sql_id GROUP BY SID, SERIAL#
}
101 367 56 {select 1 from dual connect by level < 10000000 }
2 rows selected.
The following table describes each item.
DescriptionItem
Tibero instance information. (TAC DB query)INST_ID
The Session ID.SID
The session serial number. (Even if the session ID is the same, the serial
number changes if the user changes.)
SERIAL#
Information of the currently running SQL.SQL
Check the SQL statement of the currently active session. If there is a session that is giving load
on the database through a bad SQL statement or loop statement, find that query and take
approprite action for the applicable session.
4.4. WLOCK Information (for Sessions)Check the transaction time and the lock mode of the currenly running session.
Single DB
The following code is an example of writing a single DB query.
SELECT S.USER_NAME "USERNAME",
S.SESS_ID || ',' || S.SERIAL_NO "SESSION",
O.OWNER|| '.' ||O.OBJECT_NAME "OBJECT",
S.STATUS "STATUS",
--S.TYPE, S.LOGON_TIME, S.VTR_TID, L.TYPE,
FLOOR(MOD((SYSDATE - VT.START_TIME)*24, 24)) || ':'||
LPAD(FLOOR(MOD((SYSDATE - VT.START_TIME)*1440, 60)), 2, 0) ||':'||
LPAD(FLOOR(MOD((SYSDATE - VT.START_TIME)*86400, 60)), 2, 0)
AS "TRANSACTION TIME",
DECODE(L.LMODE, 0,'[0]NONE ', 1,'[1]NULL', 2, '[2]ROW-S (SS)',3,'[3]ROW-X
Chapter 4. Lock & Current Transaction 47
(SX)'
, 4, '[4]SHARE', 5, '[5]S/ROW-X (SSX)'
, 6, '[6]EXCLUSIVE', TO_CHAR(L.LMODE) ) "LOCK MODE",
L.STATUS "STATE",
--L.ID1, L.ID2,
NVL(S.SQL_ID, S.PREV_SQL_ID) SQL_ID
FROM VT_WLOCK L,
VT_SESSION S,
DBA_OBJECTS O ,
VT_TRANSACTION VT
WHERE L.LMODE =2 -- Grater than 1
AND L.THR_ID = S.VTR_TID
AND L.ID1 = O.OBJECT_ID (+)
AND L.THR_ID = VT.SESS_ID ;
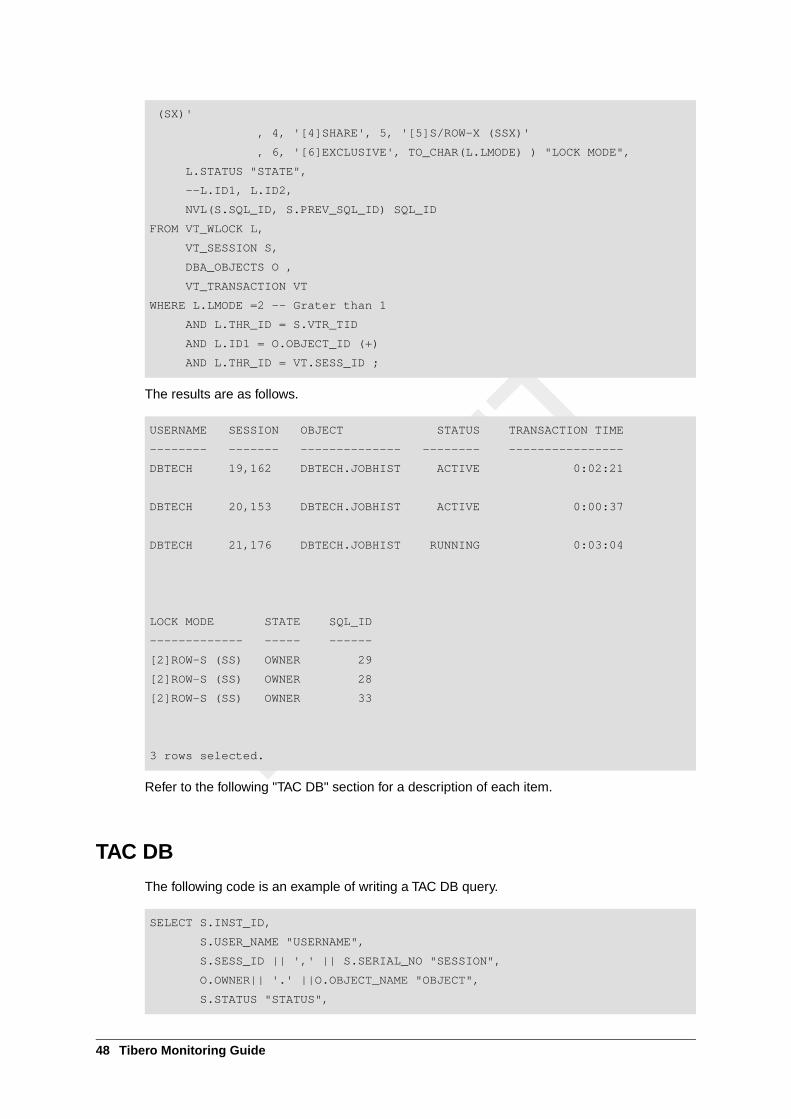
The results are as follows.
USERNAME SESSION OBJECT STATUS TRANSACTION TIME
-------- ------- -------------- -------- ----------------
DBTECH 19,162 DBTECH.JOBHIST ACTIVE 0:02:21
DBTECH 20,153 DBTECH.JOBHIST ACTIVE 0:00:37
DBTECH 21,176 DBTECH.JOBHIST RUNNING 0:03:04
LOCK MODE STATE SQL_ID
------------- ----- ------
[2]ROW-S (SS) OWNER 29
[2]ROW-S (SS) OWNER 28
[2]ROW-S (SS) OWNER 33
3 rows selected.
Refer to the following "TAC DB" section for a description of each item.
TAC DB
The following code is an example of writing a TAC DB query.
SELECT S.INST_ID,
S.USER_NAME "USERNAME",
S.SESS_ID || ',' || S.SERIAL_NO "SESSION",
O.OWNER|| '.' ||O.OBJECT_NAME "OBJECT",
S.STATUS "STATUS",
48 Tibero Monitoring Guide
FLOOR(MOD((SYSDATE - VT.START_TIME)*24, 24)) || ':'||
LPAD(FLOOR(MOD((SYSDATE - VT.START_TIME)*1440, 60)), 2, 0)
||':'||
LPAD(FLOOR(MOD((SYSDATE - VT.START_TIME)*86400, 60)), 2, 0)
AS "TRANSACTION TIME",
DECODE(L.LMODE, 0,'[0]NONE ',1,'[1]NULL',2,'[2]ROW-S (SS)',3,'[3]ROW-X (SX)'
, 4, '[4]SHARE', 5, '[5]S/ROW-X (SSX)'
, 6, '[6]EXCLUSIVE', TO_CHAR(L.LMODE) ) "LOCK MODE",
L.STATUS "STATE",
NVL(S.SQL_ID, S.PREV_SQL_ID) SQL_ID
FROM _GVT_WLOCK L,
_GVT_SESSION S,
DBA_OBJECTS O,
_GVT_TRANSACTION VT
WHERE L.LMODE = 2 -- Greater than 1
AND L.THR_ID = S.VTR_TID
AND L.ID1 = O.OBJECT_ID (+)
AND L.THR_ID = VT.SESS_ID;
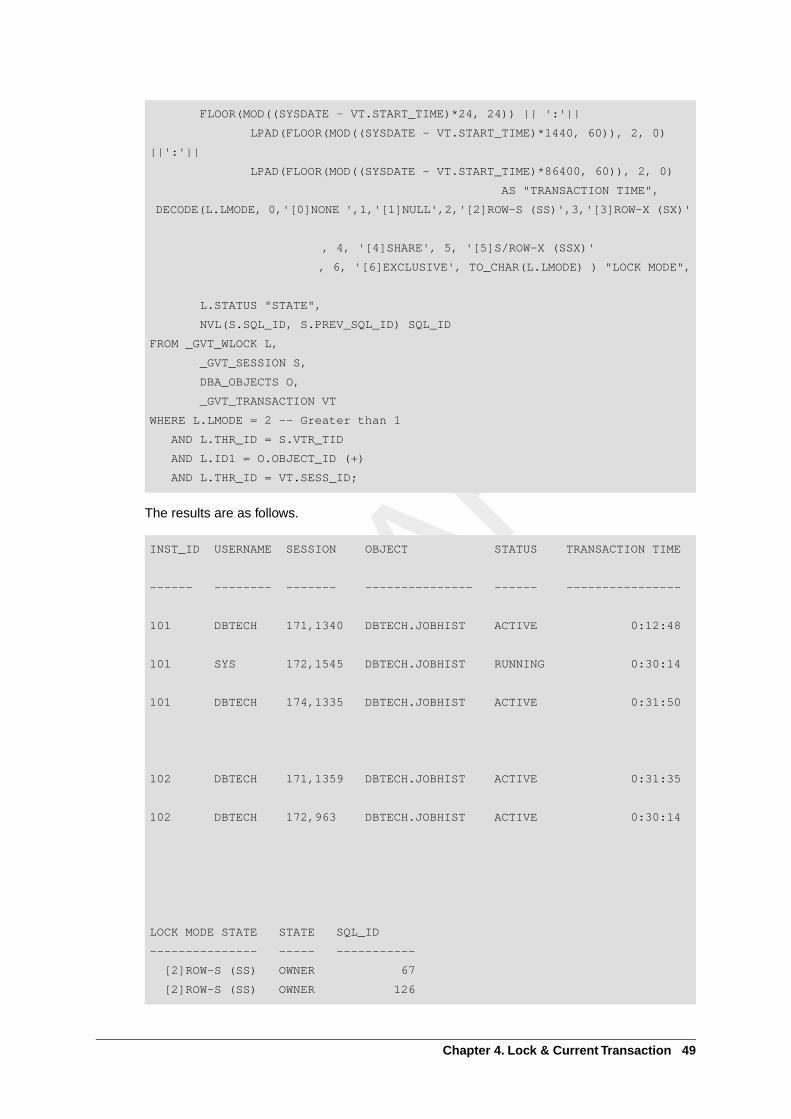
The results are as follows.
INST_ID USERNAME SESSION OBJECT STATUS TRANSACTION TIME
------ -------- ------- --------------- ------ ----------------
101 DBTECH 171,1340 DBTECH.JOBHIST ACTIVE 0:12:48
101 SYS 172,1545 DBTECH.JOBHIST RUNNING 0:30:14
101 DBTECH 174,1335 DBTECH.JOBHIST ACTIVE 0:31:50
102 DBTECH 171,1359 DBTECH.JOBHIST ACTIVE 0:31:35
102 DBTECH 172,963 DBTECH.JOBHIST ACTIVE 0:30:14
LOCK MODE STATE STATE SQL_ID
--------------- ----- -----------
[2]ROW-S (SS) OWNER 67
[2]ROW-S (SS) OWNER 126
Chapter 4. Lock & Current Transaction 49
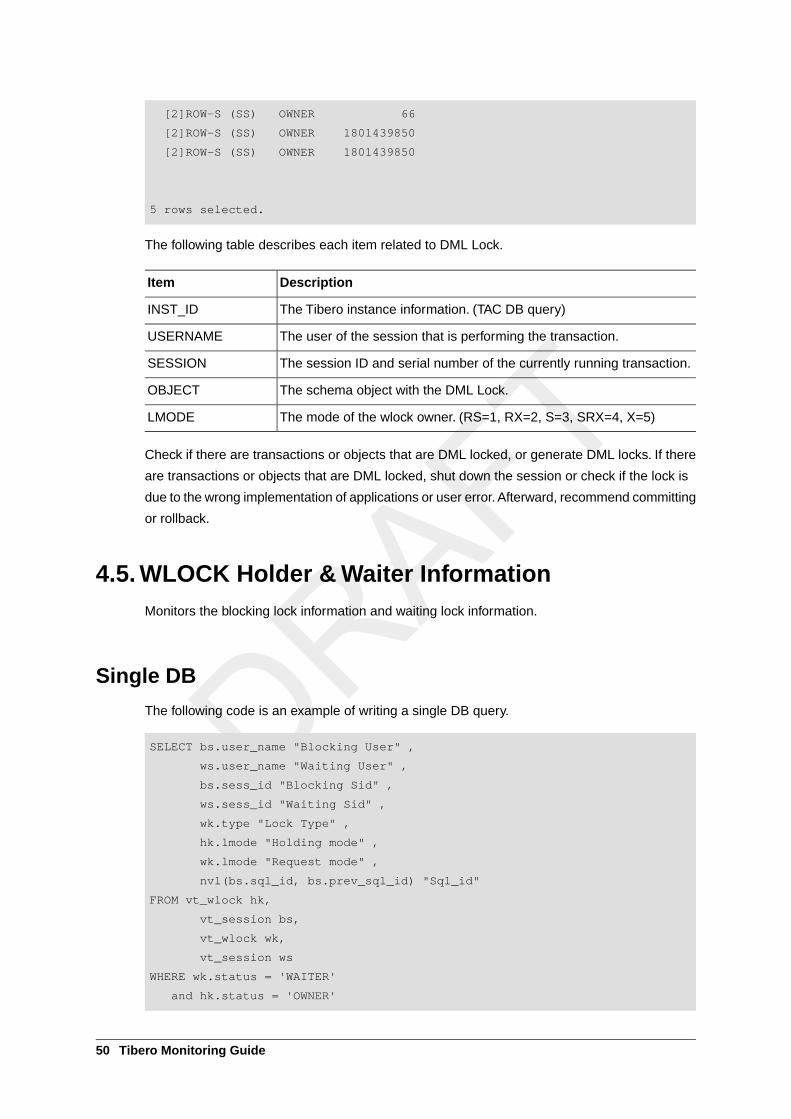
[2]ROW-S (SS) OWNER 66
[2]ROW-S (SS) OWNER 1801439850
[2]ROW-S (SS) OWNER 1801439850
5 rows selected.
The following table describes each item related to DML Lock.
DescriptionItem
The Tibero instance information. (TAC DB query)INST_ID
The user of the session that is performing the transaction.USERNAME
The session ID and serial number of the currently running transaction.SESSION
The schema object with the DML Lock.OBJECT
The mode of the wlock owner. (RS=1, RX=2, S=3, SRX=4, X=5)LMODE
Check if there are transactions or objects that are DML locked, or generate DML locks. If there
are transactions or objects that are DML locked, shut down the session or check if the lock is
due to the wrong implementation of applications or user error. Afterward, recommend committing
or rollback.
4.5. WLOCK Holder & Waiter InformationMonitors the blocking lock information and waiting lock information.
Single DB
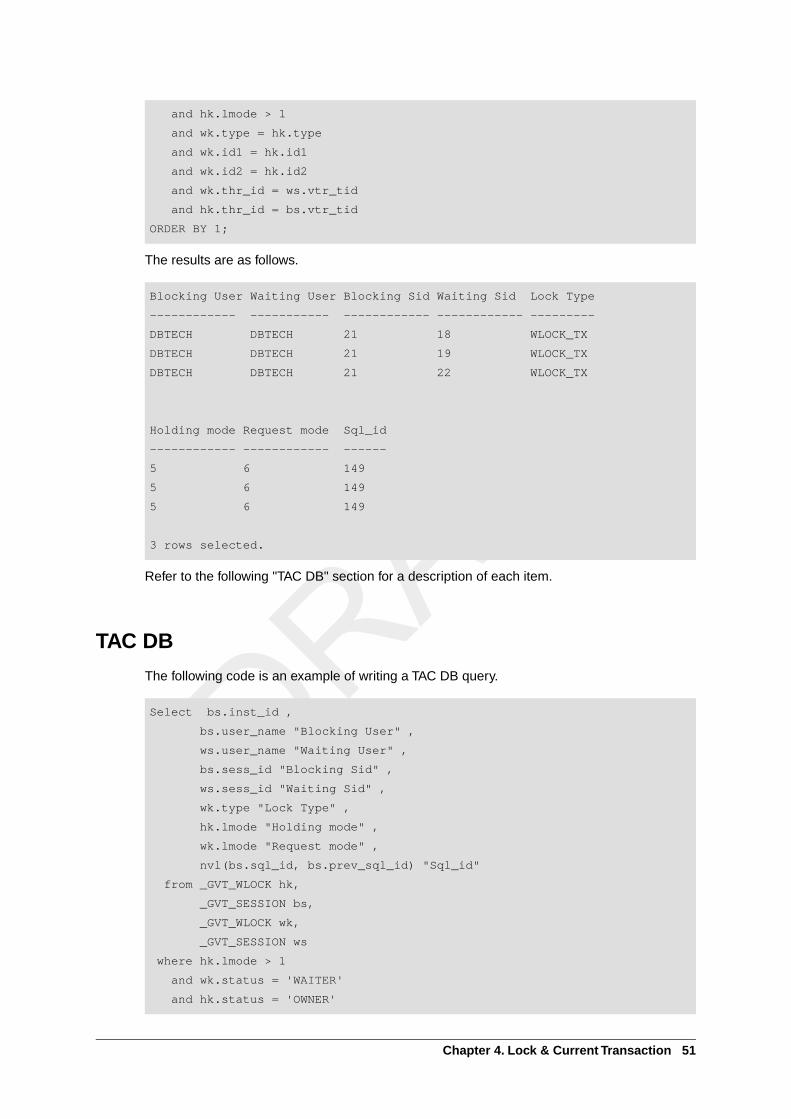
The following code is an example of writing a single DB query.
SELECT bs.user_name "Blocking User" ,
ws.user_name "Waiting User" ,
bs.sess_id "Blocking Sid" ,
ws.sess_id "Waiting Sid" ,
wk.type "Lock Type" ,
hk.lmode "Holding mode" ,
wk.lmode "Request mode" ,
nvl(bs.sql_id, bs.prev_sql_id) "Sql_id"
FROM vt_wlock hk,
vt_session bs,
vt_wlock wk,
vt_session ws
WHERE wk.status = 'WAITER'
and hk.status = 'OWNER'
50 Tibero Monitoring Guide
and hk.lmode > 1
and wk.type = hk.type
and wk.id1 = hk.id1
and wk.id2 = hk.id2
and wk.thr_id = ws.vtr_tid
and hk.thr_id = bs.vtr_tid
ORDER BY 1;
The results are as follows.
Blocking User Waiting User Blocking Sid Waiting Sid Lock Type
------------ ----------- ------------ ------------ ---------
DBTECH DBTECH 21 18 WLOCK_TX
DBTECH DBTECH 21 19 WLOCK_TX
DBTECH DBTECH 21 22 WLOCK_TX
Holding mode Request mode Sql_id
------------ ------------ ------
5 6 149
5 6 149
5 6 149
3 rows selected.
Refer to the following "TAC DB" section for a description of each item.
TAC DB
The following code is an example of writing a TAC DB query.
Select bs.inst_id ,
bs.user_name "Blocking User" ,
ws.user_name "Waiting User" ,
bs.sess_id "Blocking Sid" ,
ws.sess_id "Waiting Sid" ,
wk.type "Lock Type" ,
hk.lmode "Holding mode" ,
wk.lmode "Request mode" ,
nvl(bs.sql_id, bs.prev_sql_id) "Sql_id"
from _GVT_WLOCK hk,
_GVT_SESSION bs,
_GVT_WLOCK wk,
_GVT_SESSION ws
where hk.lmode > 1
and wk.status = 'WAITER'
and hk.status = 'OWNER'
Chapter 4. Lock & Current Transaction 51
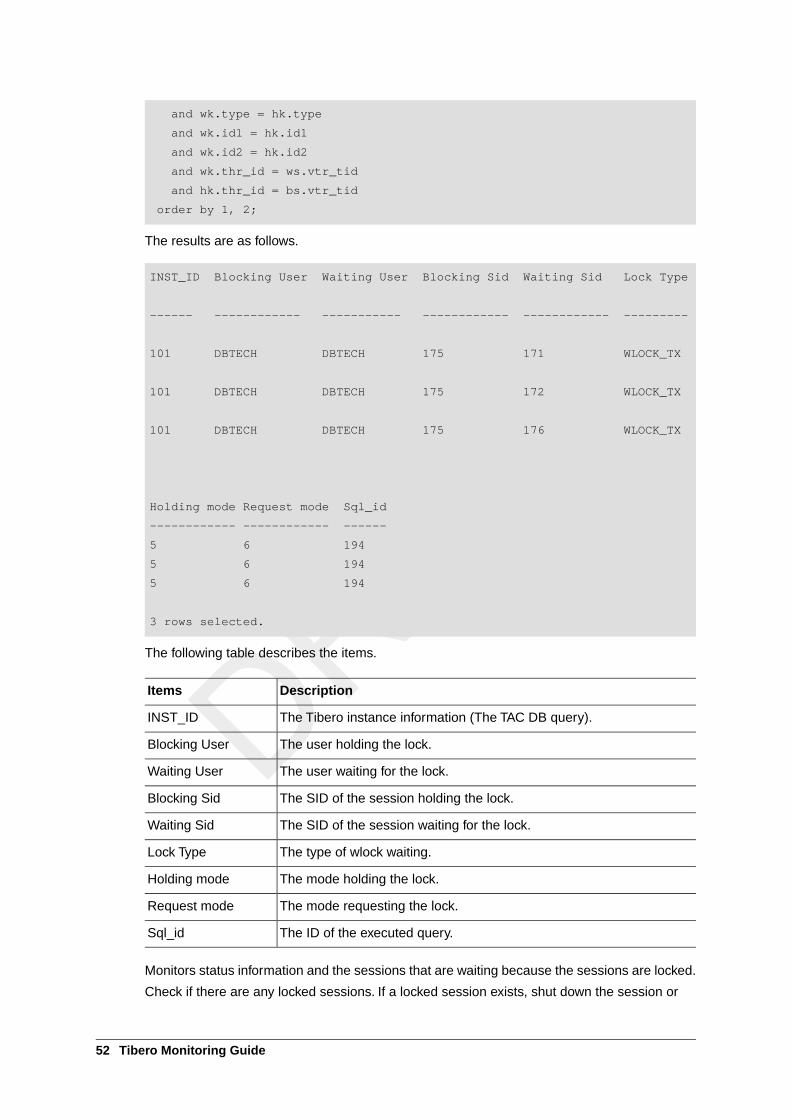
and wk.type = hk.type
and wk.id1 = hk.id1
and wk.id2 = hk.id2
and wk.thr_id = ws.vtr_tid
and hk.thr_id = bs.vtr_tid
order by 1, 2;
The results are as follows.
INST_ID Blocking User Waiting User Blocking Sid Waiting Sid Lock Type
------ ------------ ----------- ------------ ------------ ---------
101 DBTECH DBTECH 175 171 WLOCK_TX
101 DBTECH DBTECH 175 172 WLOCK_TX
101 DBTECH DBTECH 175 176 WLOCK_TX
Holding mode Request mode Sql_id
------------ ------------ ------
5 6 194
5 6 194
5 6 194
3 rows selected.
The following table describes the items.
DescriptionItems
The Tibero instance information (The TAC DB query).INST_ID
The user holding the lock.Blocking User
The user waiting for the lock.Waiting User
The SID of the session holding the lock.Blocking Sid
The SID of the session waiting for the lock.Waiting Sid
The type of wlock waiting.Lock Type
The mode holding the lock.Holding mode
The mode requesting the lock.Request mode
The ID of the executed query.Sql_id
Monitors status information and the sessions that are waiting because the sessions are locked.
Check if there are any locked sessions. If a locked session exists, shut down the session or
52 Tibero Monitoring Guide
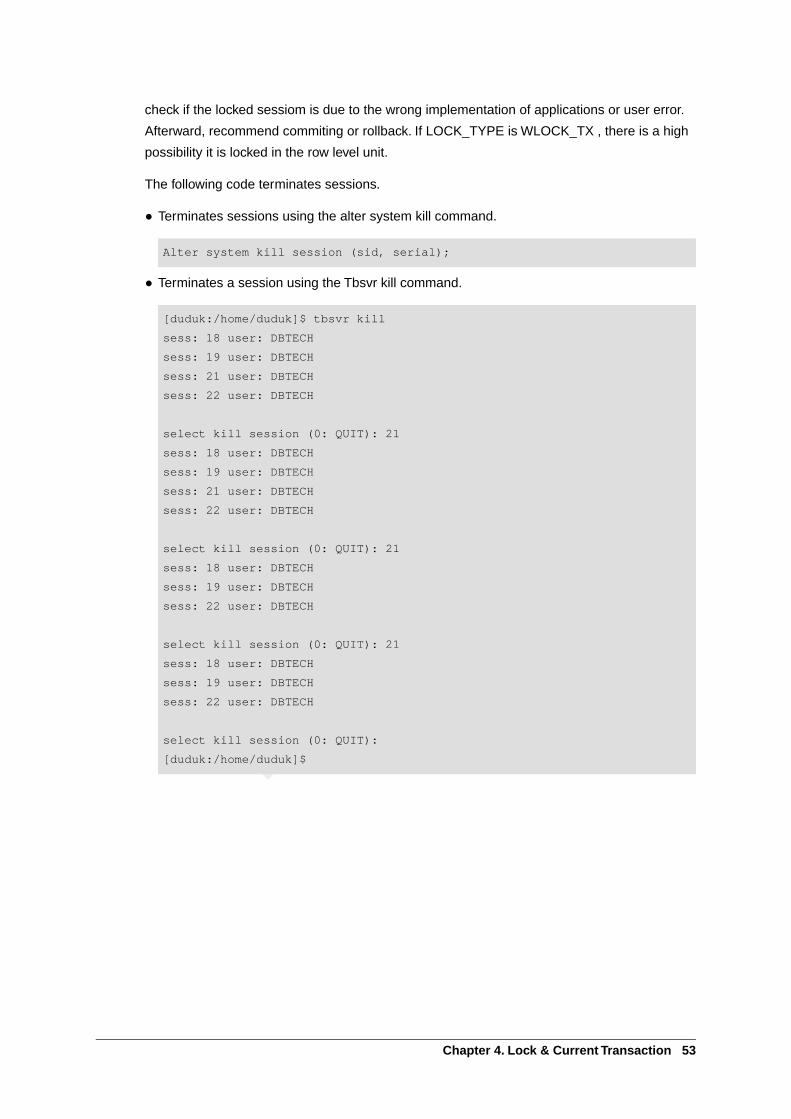
check if the locked sessiom is due to the wrong implementation of applications or user error.
Afterward, recommend commiting or rollback. If LOCK_TYPE is WLOCK_TX , there is a high
possibility it is locked in the row level unit.
The following code terminates sessions.
● Terminates sessions using the alter system kill command.
Alter system kill session (sid, serial);
● Terminates a session using the Tbsvr kill command.
[duduk:/home/duduk]$ tbsvr kill
sess: 18 user: DBTECH
sess: 19 user: DBTECH
sess: 21 user: DBTECH
sess: 22 user: DBTECH
select kill session (0: QUIT): 21
sess: 18 user: DBTECH
sess: 19 user: DBTECH
sess: 21 user: DBTECH
sess: 22 user: DBTECH
select kill session (0: QUIT): 21
sess: 18 user: DBTECH
sess: 19 user: DBTECH
sess: 22 user: DBTECH
select kill session (0: QUIT): 21
sess: 18 user: DBTECH
sess: 19 user: DBTECH
sess: 22 user: DBTECH
select kill session (0: QUIT):
[duduk:/home/duduk]$
Chapter 4. Lock & Current Transaction 53

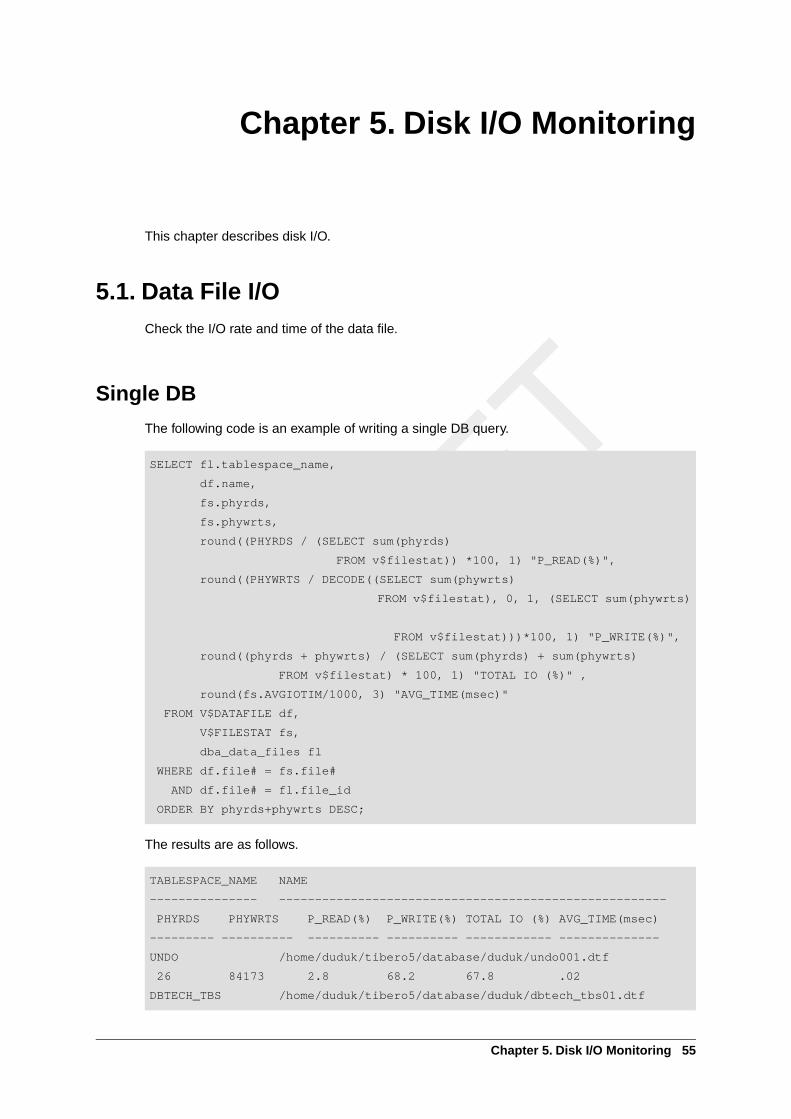
Chapter 5. Disk I/O Monitoring
This chapter describes disk I/O.
5.1. Data File I/OCheck the I/O rate and time of the data file.
Single DB
The following code is an example of writing a single DB query.
SELECT fl.tablespace_name,
df.name,
fs.phyrds,
fs.phywrts,
round((PHYRDS / (SELECT sum(phyrds)
FROM v$filestat)) *100, 1) "P_READ(%)",
round((PHYWRTS / DECODE((SELECT sum(phywrts)
FROM v$filestat), 0, 1, (SELECT sum(phywrts)
FROM v$filestat)))*100, 1) "P_WRITE(%)",
round((phyrds + phywrts) / (SELECT sum(phyrds) + sum(phywrts)
FROM v$filestat) * 100, 1) "TOTAL IO (%)" ,
round(fs.AVGIOTIM/1000, 3) "AVG_TIME(msec)"
FROM V$DATAFILE df,
V$FILESTAT fs,
dba_data_files fl
WHERE df.file# = fs.file#
AND df.file# = fl.file_id
ORDER BY phyrds+phywrts DESC;
The results are as follows.
TABLESPACE_NAME NAME
--------------- ------------------------------------------------------
PHYRDS PHYWRTS P_READ(%) P_WRITE(%) TOTAL IO (%) AVG_TIME(msec)
--------- ---------- ---------- ---------- ------------ --------------
UNDO /home/duduk/tibero5/database/duduk/undo001.dtf
26 84173 2.8 68.2 67.8 .02
DBTECH_TBS /home/duduk/tibero5/database/duduk/dbtech_tbs01.dtf
Chapter 5. Disk I/O Monitoring 55
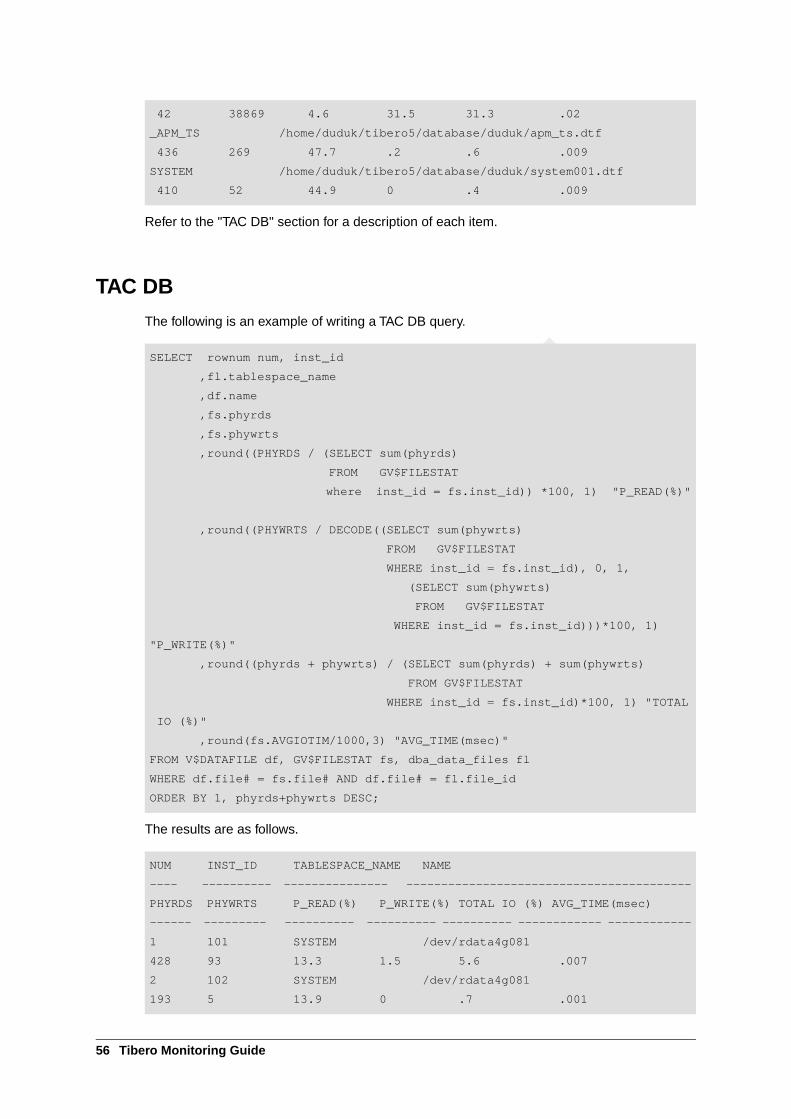
42 38869 4.6 31.5 31.3 .02
_APM_TS /home/duduk/tibero5/database/duduk/apm_ts.dtf
436 269 47.7 .2 .6 .009
SYSTEM /home/duduk/tibero5/database/duduk/system001.dtf
410 52 44.9 0 .4 .009
Refer to the "TAC DB" section for a description of each item.
TAC DB
The following is an example of writing a TAC DB query.
SELECT rownum num, inst_id
,fl.tablespace_name
,df.name
,fs.phyrds
,fs.phywrts
,round((PHYRDS / (SELECT sum(phyrds)
FROM GV$FILESTAT
where inst_id = fs.inst_id)) *100, 1) "P_READ(%)"
,round((PHYWRTS / DECODE((SELECT sum(phywrts)
FROM GV$FILESTAT
WHERE inst_id = fs.inst_id), 0, 1,
(SELECT sum(phywrts)
FROM GV$FILESTAT
WHERE inst_id = fs.inst_id)))*100, 1)
"P_WRITE(%)"
,round((phyrds + phywrts) / (SELECT sum(phyrds) + sum(phywrts)
FROM GV$FILESTAT
WHERE inst_id = fs.inst_id)*100, 1) "TOTAL
IO (%)"
,round(fs.AVGIOTIM/1000,3) "AVG_TIME(msec)"
FROM V$DATAFILE df, GV$FILESTAT fs, dba_data_files fl
WHERE df.file# = fs.file# AND df.file# = fl.file_id
ORDER BY 1, phyrds+phywrts DESC;
The results are as follows.
NUM INST_ID TABLESPACE_NAME NAME
---- ---------- --------------- -----------------------------------------
PHYRDS PHYWRTS P_READ(%) P_WRITE(%) TOTAL IO (%) AVG_TIME(msec)
------ --------- ---------- ---------- ---------- ------------ ------------
1 101 SYSTEM /dev/rdata4g081
428 93 13.3 1.5 5.6 .007
2 102 SYSTEM /dev/rdata4g081
193 5 13.9 0 .7 .001
56 Tibero Monitoring Guide
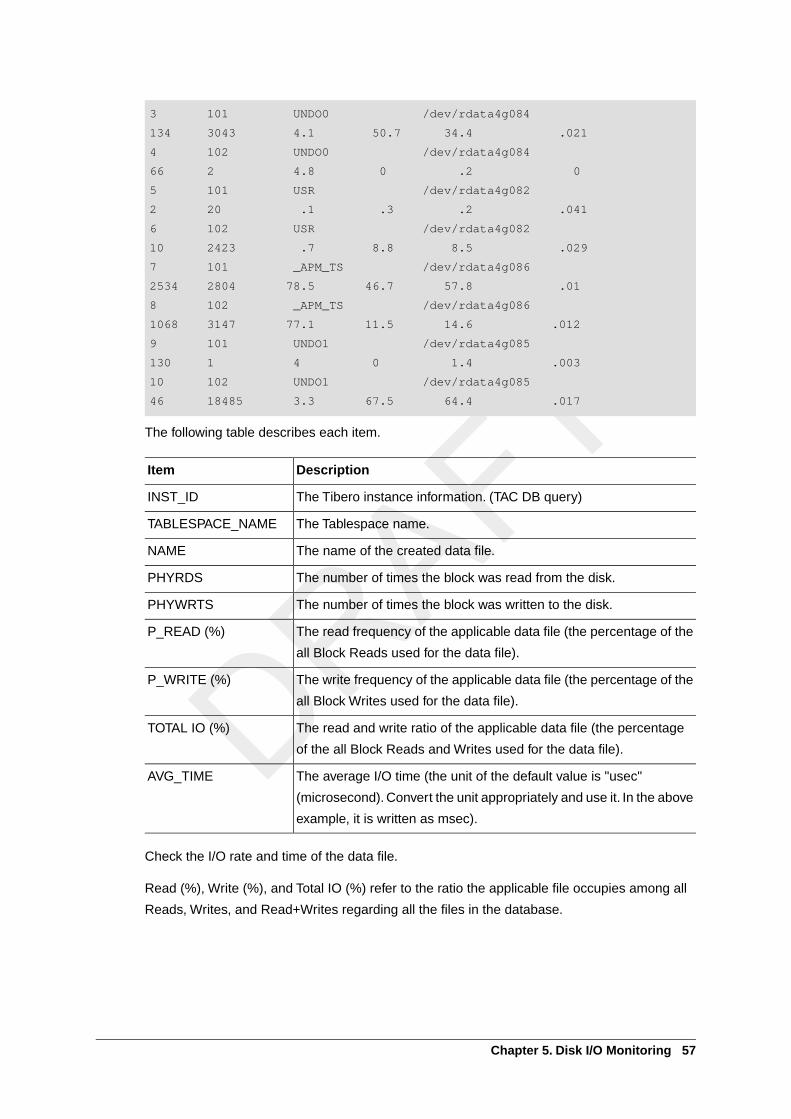
3 101 UNDO0 /dev/rdata4g084
134 3043 4.1 50.7 34.4 .021
4 102 UNDO0 /dev/rdata4g084
66 2 4.8 0 .2 0
5 101 USR /dev/rdata4g082
2 20 .1 .3 .2 .041
6 102 USR /dev/rdata4g082
10 2423 .7 8.8 8.5 .029
7 101 _APM_TS /dev/rdata4g086
2534 2804 78.5 46.7 57.8 .01
8 102 _APM_TS /dev/rdata4g086
1068 3147 77.1 11.5 14.6 .012
9 101 UNDO1 /dev/rdata4g085
130 1 4 0 1.4 .003
10 102 UNDO1 /dev/rdata4g085
46 18485 3.3 67.5 64.4 .017
The following table describes each item.
DescriptionItem
The Tibero instance information. (TAC DB query)INST_ID
The Tablespace name.TABLESPACE_NAME
The name of the created data file.NAME
The number of times the block was read from the disk.PHYRDS
The number of times the block was written to the disk.PHYWRTS
The read frequency of the applicable data file (the percentage of the
all Block Reads used for the data file).
P_READ (%)
The write frequency of the applicable data file (the percentage of the
all Block Writes used for the data file).
P_WRITE (%)
The read and write ratio of the applicable data file (the percentage
of the all Block Reads and Writes used for the data file).
TOTAL IO (%)
The average I/O time (the unit of the default value is "usec"
(microsecond). Convert the unit appropriately and use it. In the above
example, it is written as msec).
AVG_TIME
Check the I/O rate and time of the data file.
Read (%), Write (%), and Total IO (%) refer to the ratio the applicable file occupies among all
Reads, Writes, and Read+Writes regarding all the files in the database.
Chapter 5. Disk I/O Monitoring 57
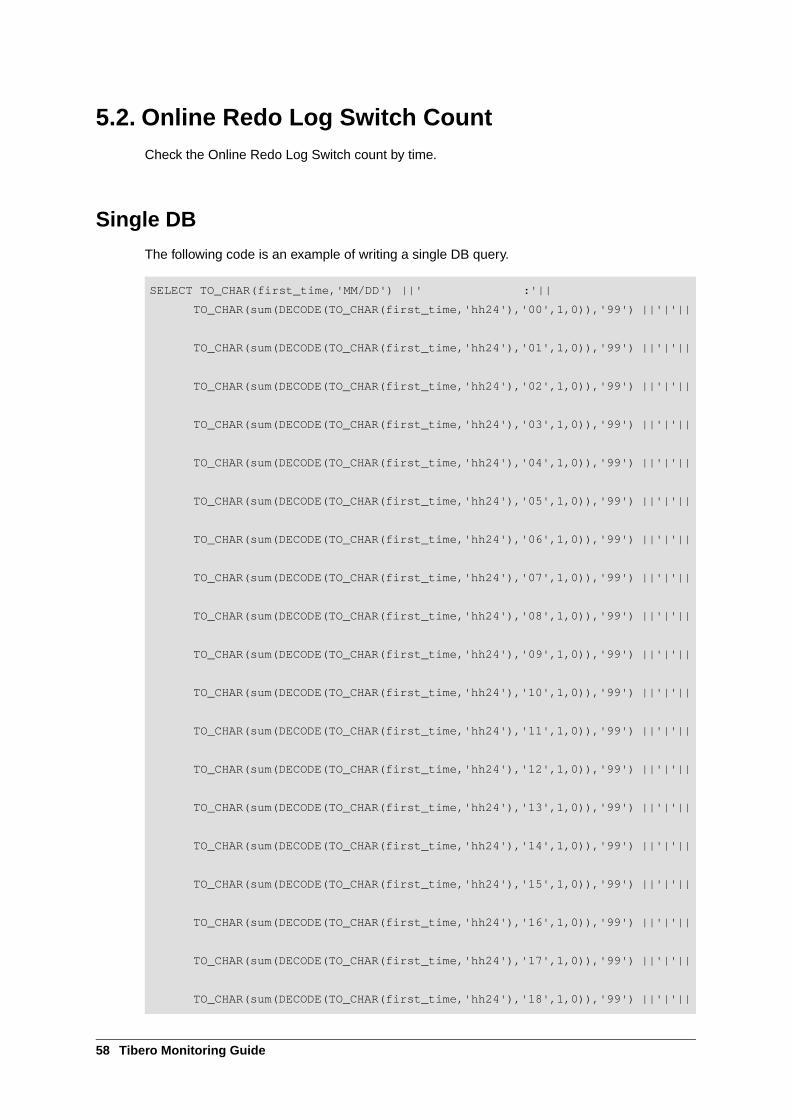
5.2. Online Redo Log Switch CountCheck the Online Redo Log Switch count by time.
Single DB
The following code is an example of writing a single DB query.
SELECT TO_CHAR(first_time,'MM/DD') ||' :'||
TO_CHAR(sum(DECODE(TO_CHAR(first_time,'hh24'),'00',1,0)),'99') ||'|'||
TO_CHAR(sum(DECODE(TO_CHAR(first_time,'hh24'),'01',1,0)),'99') ||'|'||
TO_CHAR(sum(DECODE(TO_CHAR(first_time,'hh24'),'02',1,0)),'99') ||'|'||
TO_CHAR(sum(DECODE(TO_CHAR(first_time,'hh24'),'03',1,0)),'99') ||'|'||
TO_CHAR(sum(DECODE(TO_CHAR(first_time,'hh24'),'04',1,0)),'99') ||'|'||
TO_CHAR(sum(DECODE(TO_CHAR(first_time,'hh24'),'05',1,0)),'99') ||'|'||
TO_CHAR(sum(DECODE(TO_CHAR(first_time,'hh24'),'06',1,0)),'99') ||'|'||
TO_CHAR(sum(DECODE(TO_CHAR(first_time,'hh24'),'07',1,0)),'99') ||'|'||
TO_CHAR(sum(DECODE(TO_CHAR(first_time,'hh24'),'08',1,0)),'99') ||'|'||
TO_CHAR(sum(DECODE(TO_CHAR(first_time,'hh24'),'09',1,0)),'99') ||'|'||
TO_CHAR(sum(DECODE(TO_CHAR(first_time,'hh24'),'10',1,0)),'99') ||'|'||
TO_CHAR(sum(DECODE(TO_CHAR(first_time,'hh24'),'11',1,0)),'99') ||'|'||
TO_CHAR(sum(DECODE(TO_CHAR(first_time,'hh24'),'12',1,0)),'99') ||'|'||
TO_CHAR(sum(DECODE(TO_CHAR(first_time,'hh24'),'13',1,0)),'99') ||'|'||
TO_CHAR(sum(DECODE(TO_CHAR(first_time,'hh24'),'14',1,0)),'99') ||'|'||
TO_CHAR(sum(DECODE(TO_CHAR(first_time,'hh24'),'15',1,0)),'99') ||'|'||
TO_CHAR(sum(DECODE(TO_CHAR(first_time,'hh24'),'16',1,0)),'99') ||'|'||
TO_CHAR(sum(DECODE(TO_CHAR(first_time,'hh24'),'17',1,0)),'99') ||'|'||
TO_CHAR(sum(DECODE(TO_CHAR(first_time,'hh24'),'18',1,0)),'99') ||'|'||
58 Tibero Monitoring Guide
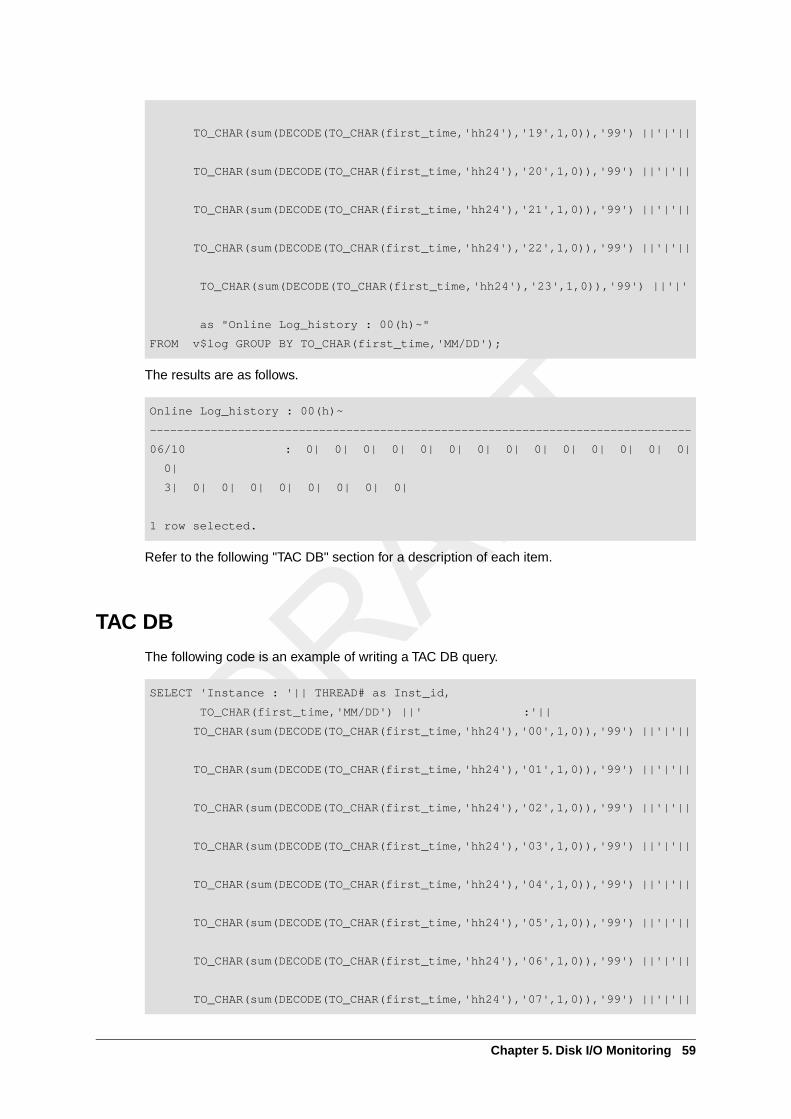
TO_CHAR(sum(DECODE(TO_CHAR(first_time,'hh24'),'19',1,0)),'99') ||'|'||
TO_CHAR(sum(DECODE(TO_CHAR(first_time,'hh24'),'20',1,0)),'99') ||'|'||
TO_CHAR(sum(DECODE(TO_CHAR(first_time,'hh24'),'21',1,0)),'99') ||'|'||
TO_CHAR(sum(DECODE(TO_CHAR(first_time,'hh24'),'22',1,0)),'99') ||'|'||
TO_CHAR(sum(DECODE(TO_CHAR(first_time,'hh24'),'23',1,0)),'99') ||'|'
as "Online Log_history : 00(h)~"
FROM v$log GROUP BY TO_CHAR(first_time,'MM/DD');
The results are as follows.
Online Log_history : 00(h)~
--------------------------------------------------------------------------------
06/10 : 0| 0| 0| 0| 0| 0| 0| 0| 0| 0| 0| 0| 0| 0|
0|
3| 0| 0| 0| 0| 0| 0| 0| 0|
1 row selected.
Refer to the following "TAC DB" section for a description of each item.
TAC DB
The following code is an example of writing a TAC DB query.
SELECT 'Instance : '|| THREAD# as Inst_id,
TO_CHAR(first_time,'MM/DD') ||' :'||
TO_CHAR(sum(DECODE(TO_CHAR(first_time,'hh24'),'00',1,0)),'99') ||'|'||
TO_CHAR(sum(DECODE(TO_CHAR(first_time,'hh24'),'01',1,0)),'99') ||'|'||
TO_CHAR(sum(DECODE(TO_CHAR(first_time,'hh24'),'02',1,0)),'99') ||'|'||
TO_CHAR(sum(DECODE(TO_CHAR(first_time,'hh24'),'03',1,0)),'99') ||'|'||
TO_CHAR(sum(DECODE(TO_CHAR(first_time,'hh24'),'04',1,0)),'99') ||'|'||
TO_CHAR(sum(DECODE(TO_CHAR(first_time,'hh24'),'05',1,0)),'99') ||'|'||
TO_CHAR(sum(DECODE(TO_CHAR(first_time,'hh24'),'06',1,0)),'99') ||'|'||
TO_CHAR(sum(DECODE(TO_CHAR(first_time,'hh24'),'07',1,0)),'99') ||'|'||
Chapter 5. Disk I/O Monitoring 59
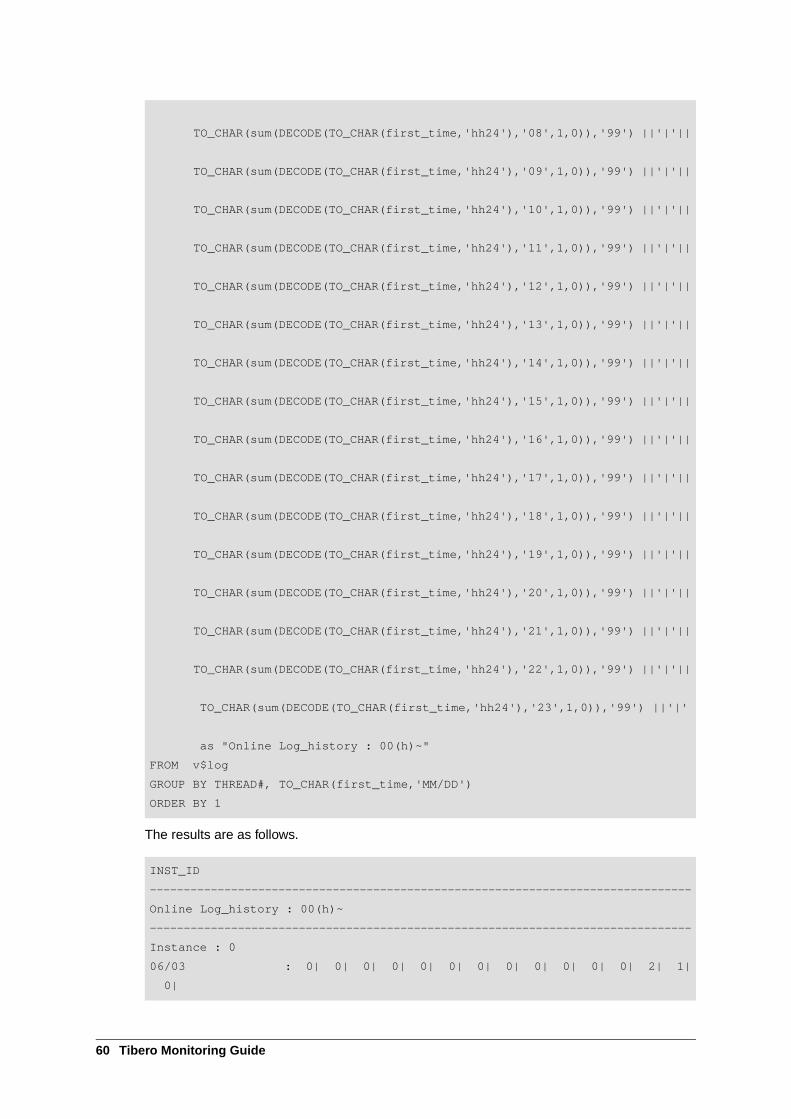
TO_CHAR(sum(DECODE(TO_CHAR(first_time,'hh24'),'08',1,0)),'99') ||'|'||
TO_CHAR(sum(DECODE(TO_CHAR(first_time,'hh24'),'09',1,0)),'99') ||'|'||
TO_CHAR(sum(DECODE(TO_CHAR(first_time,'hh24'),'10',1,0)),'99') ||'|'||
TO_CHAR(sum(DECODE(TO_CHAR(first_time,'hh24'),'11',1,0)),'99') ||'|'||
TO_CHAR(sum(DECODE(TO_CHAR(first_time,'hh24'),'12',1,0)),'99') ||'|'||
TO_CHAR(sum(DECODE(TO_CHAR(first_time,'hh24'),'13',1,0)),'99') ||'|'||
TO_CHAR(sum(DECODE(TO_CHAR(first_time,'hh24'),'14',1,0)),'99') ||'|'||
TO_CHAR(sum(DECODE(TO_CHAR(first_time,'hh24'),'15',1,0)),'99') ||'|'||
TO_CHAR(sum(DECODE(TO_CHAR(first_time,'hh24'),'16',1,0)),'99') ||'|'||
TO_CHAR(sum(DECODE(TO_CHAR(first_time,'hh24'),'17',1,0)),'99') ||'|'||
TO_CHAR(sum(DECODE(TO_CHAR(first_time,'hh24'),'18',1,0)),'99') ||'|'||
TO_CHAR(sum(DECODE(TO_CHAR(first_time,'hh24'),'19',1,0)),'99') ||'|'||
TO_CHAR(sum(DECODE(TO_CHAR(first_time,'hh24'),'20',1,0)),'99') ||'|'||
TO_CHAR(sum(DECODE(TO_CHAR(first_time,'hh24'),'21',1,0)),'99') ||'|'||
TO_CHAR(sum(DECODE(TO_CHAR(first_time,'hh24'),'22',1,0)),'99') ||'|'||
TO_CHAR(sum(DECODE(TO_CHAR(first_time,'hh24'),'23',1,0)),'99') ||'|'
as "Online Log_history : 00(h)~"
FROM v$log
GROUP BY THREAD#, TO_CHAR(first_time,'MM/DD')
ORDER BY 1
The results are as follows.
INST_ID
--------------------------------------------------------------------------------
Online Log_history : 00(h)~
--------------------------------------------------------------------------------
Instance : 0
06/03 : 0| 0| 0| 0| 0| 0| 0| 0| 0| 0| 0| 0| 2| 1|
0|
60 Tibero Monitoring Guide
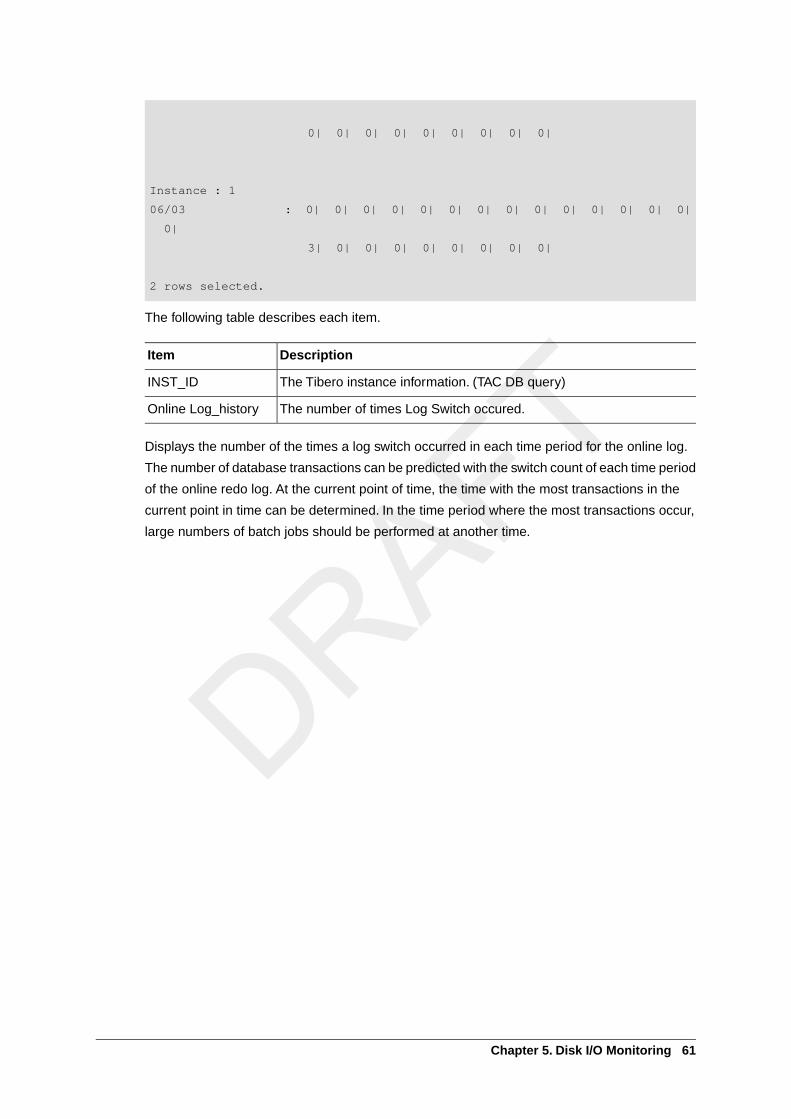
0| 0| 0| 0| 0| 0| 0| 0| 0|
Instance : 1
06/03 : 0| 0| 0| 0| 0| 0| 0| 0| 0| 0| 0| 0| 0| 0|
0|
3| 0| 0| 0| 0| 0| 0| 0| 0|
2 rows selected.
The following table describes each item.
DescriptionItem
The Tibero instance information. (TAC DB query)INST_ID
The number of times Log Switch occured.Online Log_history
Displays the number of the times a log switch occurred in each time period for the online log.
The number of database transactions can be predicted with the switch count of each time period
of the online redo log. At the current point of time, the time with the most transactions in the
current point in time can be determined. In the time period where the most transactions occur,
large numbers of batch jobs should be performed at another time.
Chapter 5. Disk I/O Monitoring 61

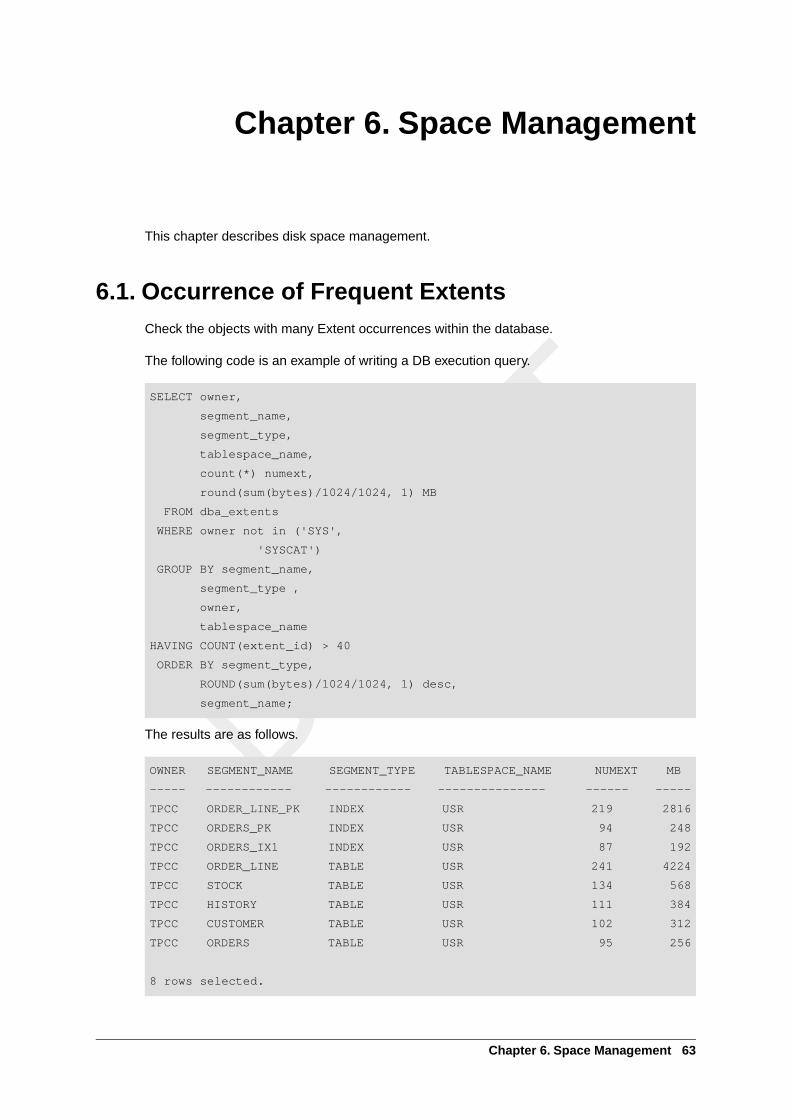
Chapter 6. Space Management
This chapter describes disk space management.
6.1. Occurrence of Frequent ExtentsCheck the objects with many Extent occurrences within the database.
The following code is an example of writing a DB execution query.
SELECT owner,
segment_name,
segment_type,
tablespace_name,
count(*) numext,
round(sum(bytes)/1024/1024, 1) MB
FROM dba_extents
WHERE owner not in ('SYS',
'SYSCAT')
GROUP BY segment_name,
segment_type ,
owner,
tablespace_name
HAVING COUNT(extent_id) > 40
ORDER BY segment_type,
ROUND(sum(bytes)/1024/1024, 1) desc,
segment_name;
The results are as follows.
OWNER SEGMENT_NAME SEGMENT_TYPE TABLESPACE_NAME NUMEXT MB
----- ------------ ------------ --------------- ------ -----
TPCC ORDER_LINE_PK INDEX USR 219 2816
TPCC ORDERS_PK INDEX USR 94 248
TPCC ORDERS_IX1 INDEX USR 87 192
TPCC ORDER_LINE TABLE USR 241 4224
TPCC STOCK TABLE USR 134 568
TPCC HISTORY TABLE USR 111 384
TPCC CUSTOMER TABLE USR 102 312
TPCC ORDERS TABLE USR 95 256
8 rows selected.
Chapter 6. Space Management 63
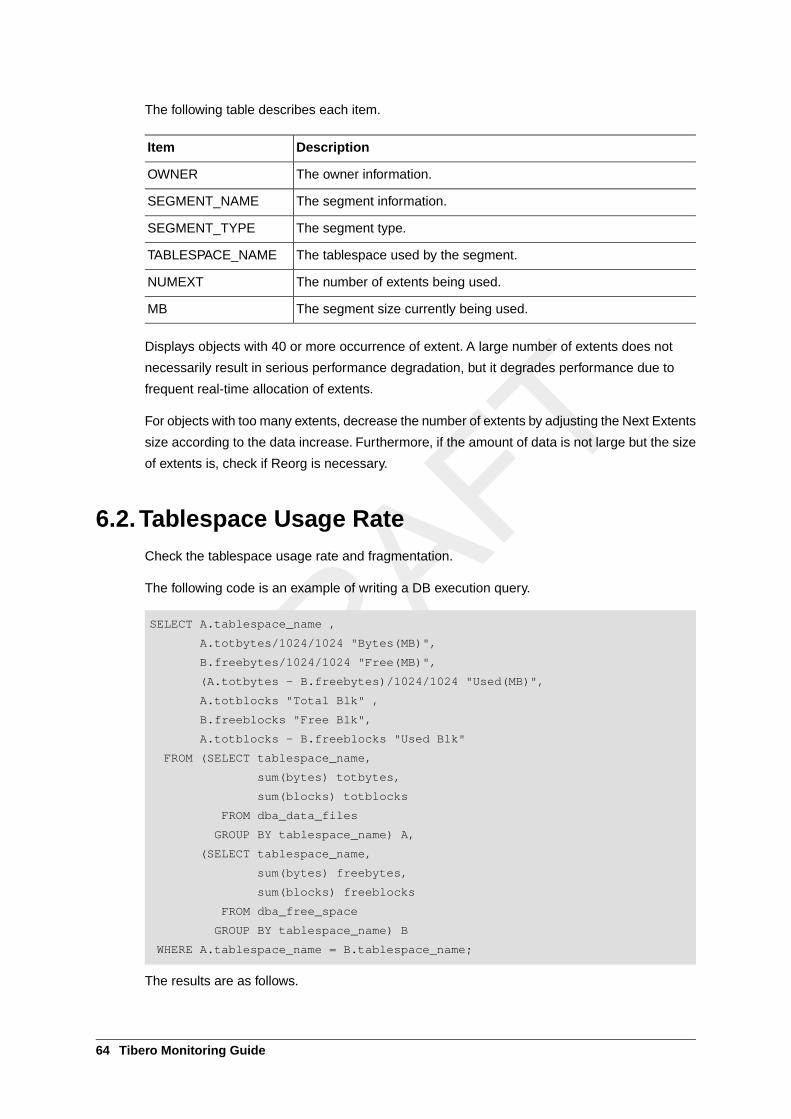
The following table describes each item.
DescriptionItem
The owner information.OWNER
The segment information.SEGMENT_NAME
The segment type.SEGMENT_TYPE
The tablespace used by the segment.TABLESPACE_NAME
The number of extents being used.NUMEXT
The segment size currently being used.MB
Displays objects with 40 or more occurrence of extent. A large number of extents does not
necessarily result in serious performance degradation, but it degrades performance due to
frequent real-time allocation of extents.
For objects with too many extents, decrease the number of extents by adjusting the Next Extents
size according to the data increase. Furthermore, if the amount of data is not large but the size
of extents is, check if Reorg is necessary.
6.2.Tablespace Usage RateCheck the tablespace usage rate and fragmentation.
The following code is an example of writing a DB execution query.
SELECT A.tablespace_name ,
A.totbytes/1024/1024 "Bytes(MB)",
B.freebytes/1024/1024 "Free(MB)",
(A.totbytes - B.freebytes)/1024/1024 "Used(MB)",
A.totblocks "Total Blk" ,
B.freeblocks "Free Blk",
A.totblocks - B.freeblocks "Used Blk"
FROM (SELECT tablespace_name,
sum(bytes) totbytes,
sum(blocks) totblocks
FROM dba_data_files
GROUP BY tablespace_name) A,
(SELECT tablespace_name,
sum(bytes) freebytes,
sum(blocks) freeblocks
FROM dba_free_space
GROUP BY tablespace_name) B
WHERE A.tablespace_name = B.tablespace_name;
The results are as follows.
64 Tibero Monitoring Guide
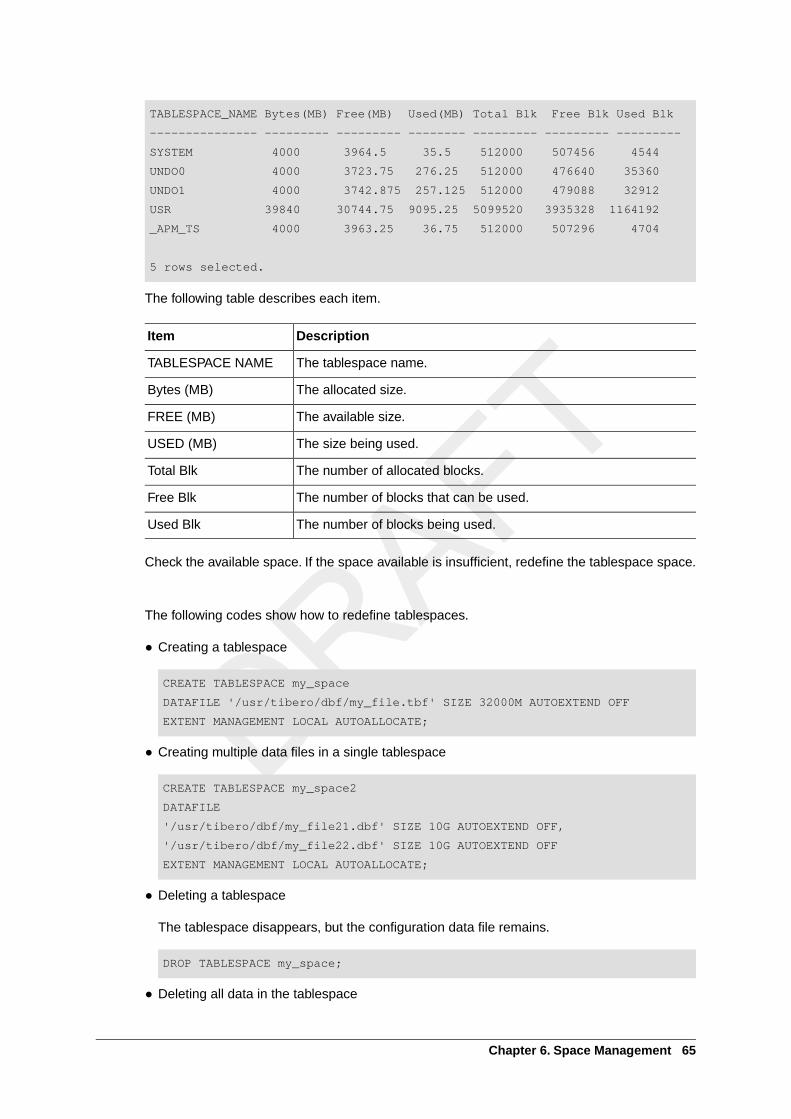
TABLESPACE_NAME Bytes(MB) Free(MB) Used(MB) Total Blk Free Blk Used Blk
--------------- --------- --------- -------- --------- --------- ---------
SYSTEM 4000 3964.5 35.5 512000 507456 4544
UNDO0 4000 3723.75 276.25 512000 476640 35360
UNDO1 4000 3742.875 257.125 512000 479088 32912
USR 39840 30744.75 9095.25 5099520 3935328 1164192
_APM_TS 4000 3963.25 36.75 512000 507296 4704
5 rows selected.
The following table describes each item.
DescriptionItem
The tablespace name.TABLESPACE NAME
The allocated size.Bytes (MB)
The available size.FREE (MB)
The size being used.USED (MB)
The number of allocated blocks.Total Blk
The number of blocks that can be used.Free Blk
The number of blocks being used.Used Blk
Check the available space. If the space available is insufficient, redefine the tablespace space.
The following codes show how to redefine tablespaces.
● Creating a tablespace
CREATE TABLESPACE my_space
DATAFILE '/usr/tibero/dbf/my_file.tbf' SIZE 32000M AUTOEXTEND OFF
EXTENT MANAGEMENT LOCAL AUTOALLOCATE;
● Creating multiple data files in a single tablespace
CREATE TABLESPACE my_space2
DATAFILE
'/usr/tibero/dbf/my_file21.dbf' SIZE 10G AUTOEXTEND OFF,
'/usr/tibero/dbf/my_file22.dbf' SIZE 10G AUTOEXTEND OFF
EXTENT MANAGEMENT LOCAL AUTOALLOCATE;
● Deleting a tablespace
The tablespace disappears, but the configuration data file remains.
DROP TABLESPACE my_space;
● Deleting all data in the tablespace
Chapter 6. Space Management 65
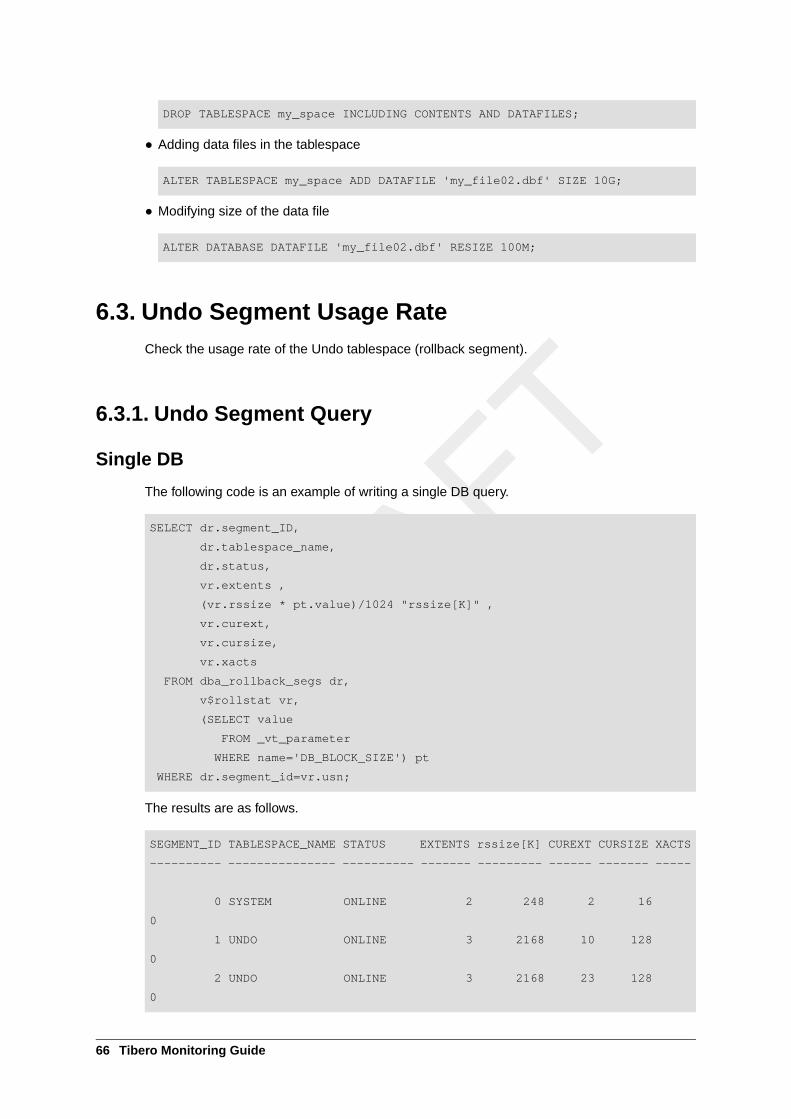
DROP TABLESPACE my_space INCLUDING CONTENTS AND DATAFILES;
● Adding data files in the tablespace
ALTER TABLESPACE my_space ADD DATAFILE 'my_file02.dbf' SIZE 10G;
● Modifying size of the data file
ALTER DATABASE DATAFILE 'my_file02.dbf' RESIZE 100M;
6.3. Undo Segment Usage RateCheck the usage rate of the Undo tablespace (rollback segment).
6.3.1. Undo Segment Query
Single DB
The following code is an example of writing a single DB query.
SELECT dr.segment_ID,
dr.tablespace_name,
dr.status,
vr.extents ,
(vr.rssize * pt.value)/1024 "rssize[K]" ,
vr.curext,
vr.cursize,
vr.xacts
FROM dba_rollback_segs dr,
v$rollstat vr,
(SELECT value
FROM _vt_parameter
WHERE name='DB_BLOCK_SIZE') pt
WHERE dr.segment_id=vr.usn;
The results are as follows.
SEGMENT_ID TABLESPACE_NAME STATUS EXTENTS rssize[K] CUREXT CURSIZE XACTS
---------- --------------- ---------- ------- --------- ------ ------- -----
0 SYSTEM ONLINE 2 248 2 16
0
1 UNDO ONLINE 3 2168 10 128
0
2 UNDO ONLINE 3 2168 23 128
0
66 Tibero Monitoring Guide
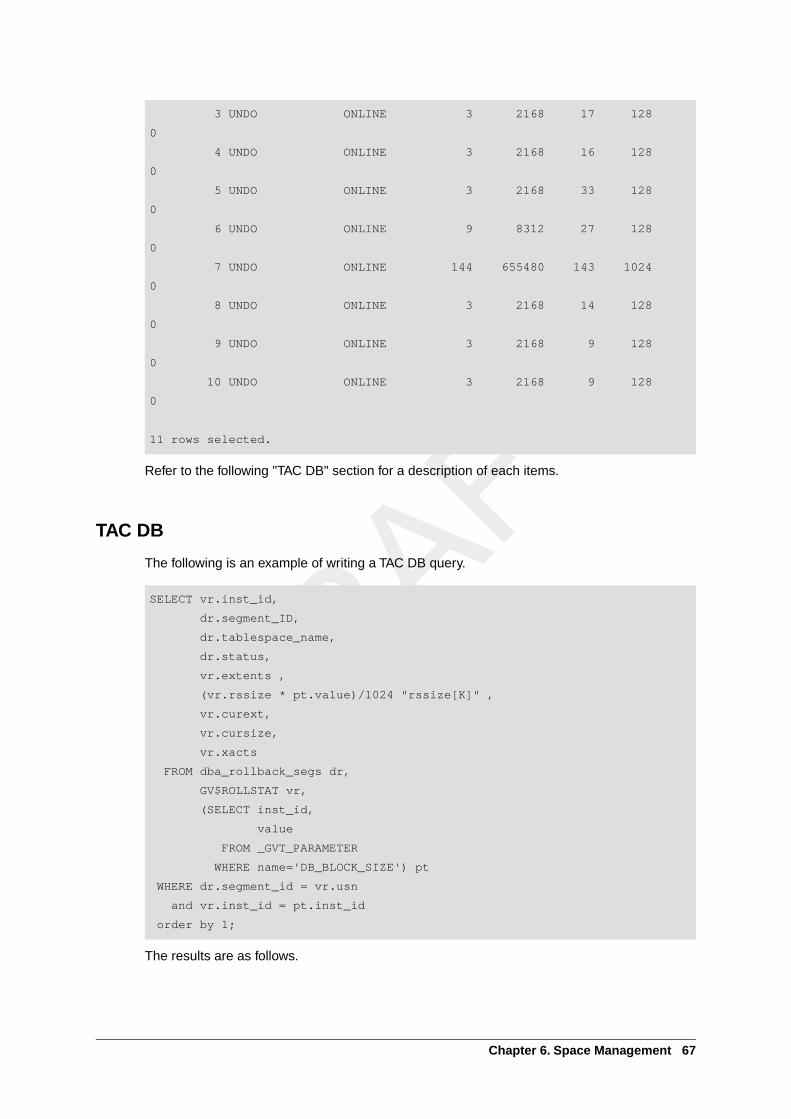
3 UNDO ONLINE 3 2168 17 128
0
4 UNDO ONLINE 3 2168 16 128
0
5 UNDO ONLINE 3 2168 33 128
0
6 UNDO ONLINE 9 8312 27 128
0
7 UNDO ONLINE 144 655480 143 1024
0
8 UNDO ONLINE 3 2168 14 128
0
9 UNDO ONLINE 3 2168 9 128
0
10 UNDO ONLINE 3 2168 9 128
0
11 rows selected.
Refer to the following "TAC DB" section for a description of each items.
TAC DB
The following is an example of writing a TAC DB query.
SELECT vr.inst_id,
dr.segment_ID,
dr.tablespace_name,
dr.status,
vr.extents ,
(vr.rssize * pt.value)/1024 "rssize[K]" ,
vr.curext,
vr.cursize,
vr.xacts
FROM dba_rollback_segs dr,
GV$ROLLSTAT vr,
(SELECT inst_id,
value
FROM _GVT_PARAMETER
WHERE name='DB_BLOCK_SIZE') pt
WHERE dr.segment_id = vr.usn
and vr.inst_id = pt.inst_id
order by 1;
The results are as follows.
Chapter 6. Space Management 67
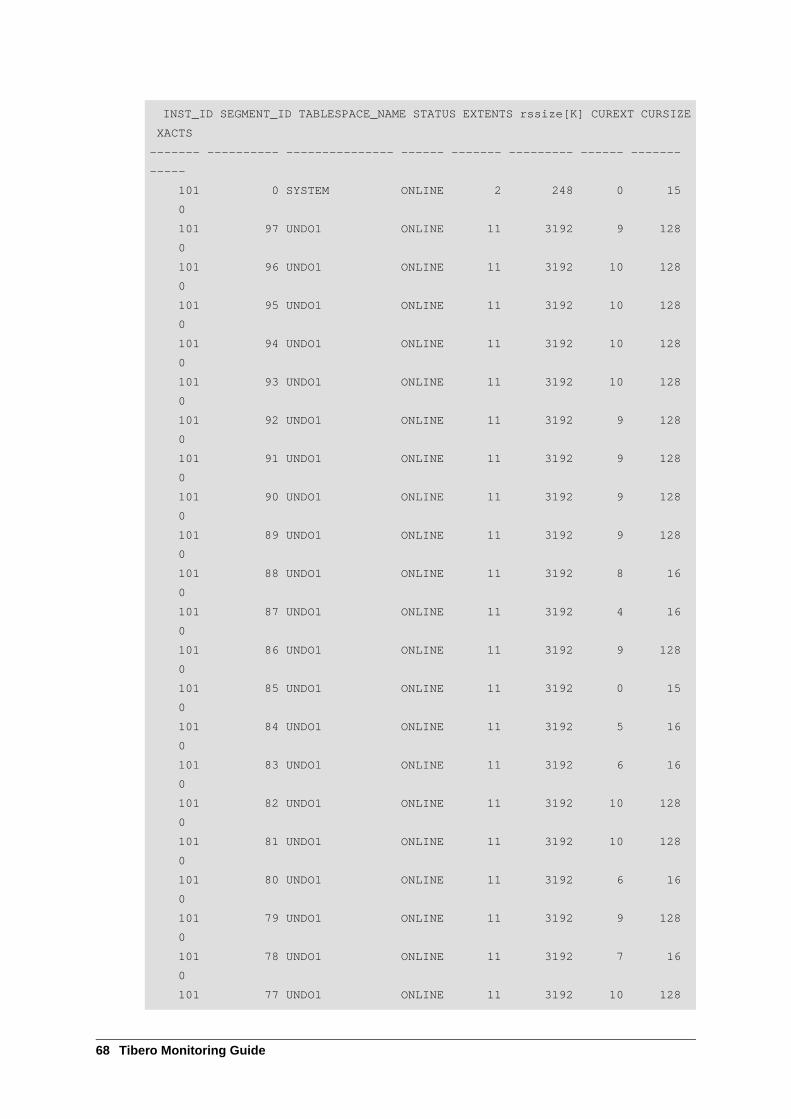
INST_ID SEGMENT_ID TABLESPACE_NAME STATUS EXTENTS rssize[K] CUREXT CURSIZE
XACTS
------- ---------- --------------- ------ ------- --------- ------ -------
-----
101 0 SYSTEM ONLINE 2 248 0 15
0
101 97 UNDO1 ONLINE 11 3192 9 128
0
101 96 UNDO1 ONLINE 11 3192 10 128
0
101 95 UNDO1 ONLINE 11 3192 10 128
0
101 94 UNDO1 ONLINE 11 3192 10 128
0
101 93 UNDO1 ONLINE 11 3192 10 128
0
101 92 UNDO1 ONLINE 11 3192 9 128
0
101 91 UNDO1 ONLINE 11 3192 9 128
0
101 90 UNDO1 ONLINE 11 3192 9 128
0
101 89 UNDO1 ONLINE 11 3192 9 128
0
101 88 UNDO1 ONLINE 11 3192 8 16
0
101 87 UNDO1 ONLINE 11 3192 4 16
0
101 86 UNDO1 ONLINE 11 3192 9 128
0
101 85 UNDO1 ONLINE 11 3192 0 15
0
101 84 UNDO1 ONLINE 11 3192 5 16
0
101 83 UNDO1 ONLINE 11 3192 6 16
0
101 82 UNDO1 ONLINE 11 3192 10 128
0
101 81 UNDO1 ONLINE 11 3192 10 128
0
101 80 UNDO1 ONLINE 11 3192 6 16
0
101 79 UNDO1 ONLINE 11 3192 9 128
0
101 78 UNDO1 ONLINE 11 3192 7 16
0
101 77 UNDO1 ONLINE 11 3192 10 128
68 Tibero Monitoring Guide
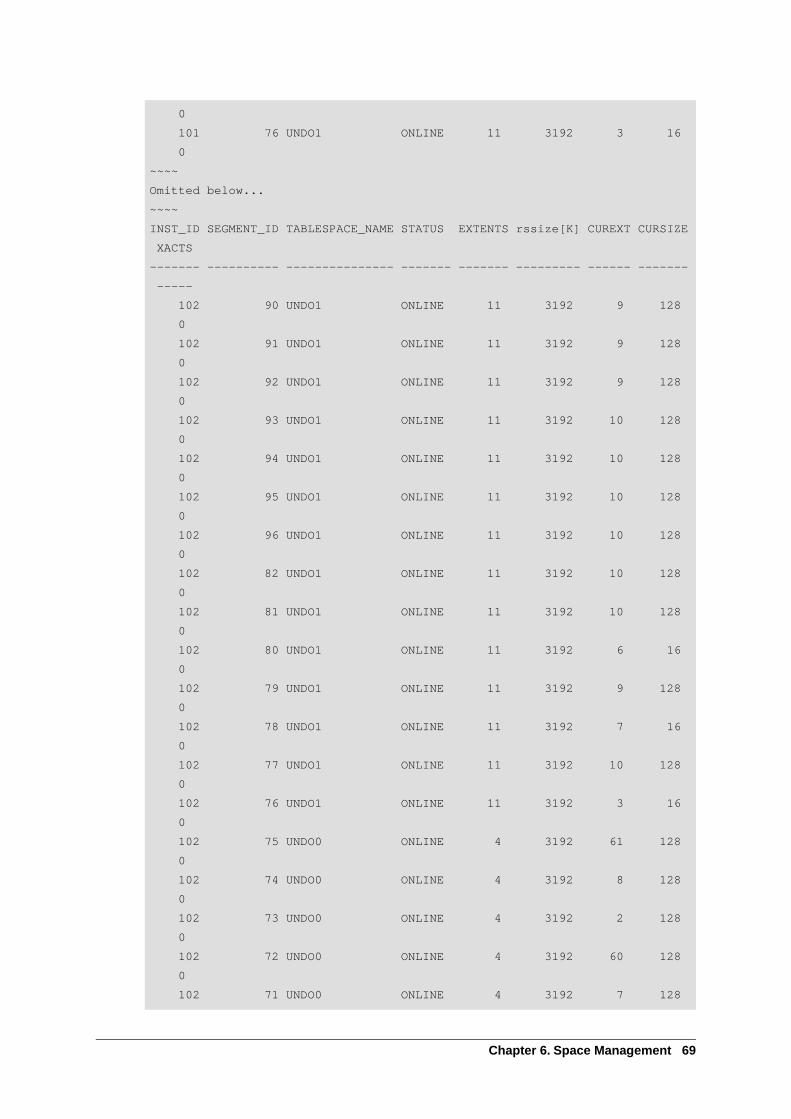
0
101 76 UNDO1 ONLINE 11 3192 3 16
0
~~~~
Omitted below...
~~~~
INST_ID SEGMENT_ID TABLESPACE_NAME STATUS EXTENTS rssize[K] CUREXT CURSIZE
XACTS
------- ---------- --------------- ------- ------- --------- ------ -------
-----
102 90 UNDO1 ONLINE 11 3192 9 128
0
102 91 UNDO1 ONLINE 11 3192 9 128
0
102 92 UNDO1 ONLINE 11 3192 9 128
0
102 93 UNDO1 ONLINE 11 3192 10 128
0
102 94 UNDO1 ONLINE 11 3192 10 128
0
102 95 UNDO1 ONLINE 11 3192 10 128
0
102 96 UNDO1 ONLINE 11 3192 10 128
0
102 82 UNDO1 ONLINE 11 3192 10 128
0
102 81 UNDO1 ONLINE 11 3192 10 128
0
102 80 UNDO1 ONLINE 11 3192 6 16
0
102 79 UNDO1 ONLINE 11 3192 9 128
0
102 78 UNDO1 ONLINE 11 3192 7 16
0
102 77 UNDO1 ONLINE 11 3192 10 128
0
102 76 UNDO1 ONLINE 11 3192 3 16
0
102 75 UNDO0 ONLINE 4 3192 61 128
0
102 74 UNDO0 ONLINE 4 3192 8 128
0
102 73 UNDO0 ONLINE 4 3192 2 128
0
102 72 UNDO0 ONLINE 4 3192 60 128
0
102 71 UNDO0 ONLINE 4 3192 7 128
Chapter 6. Space Management 69
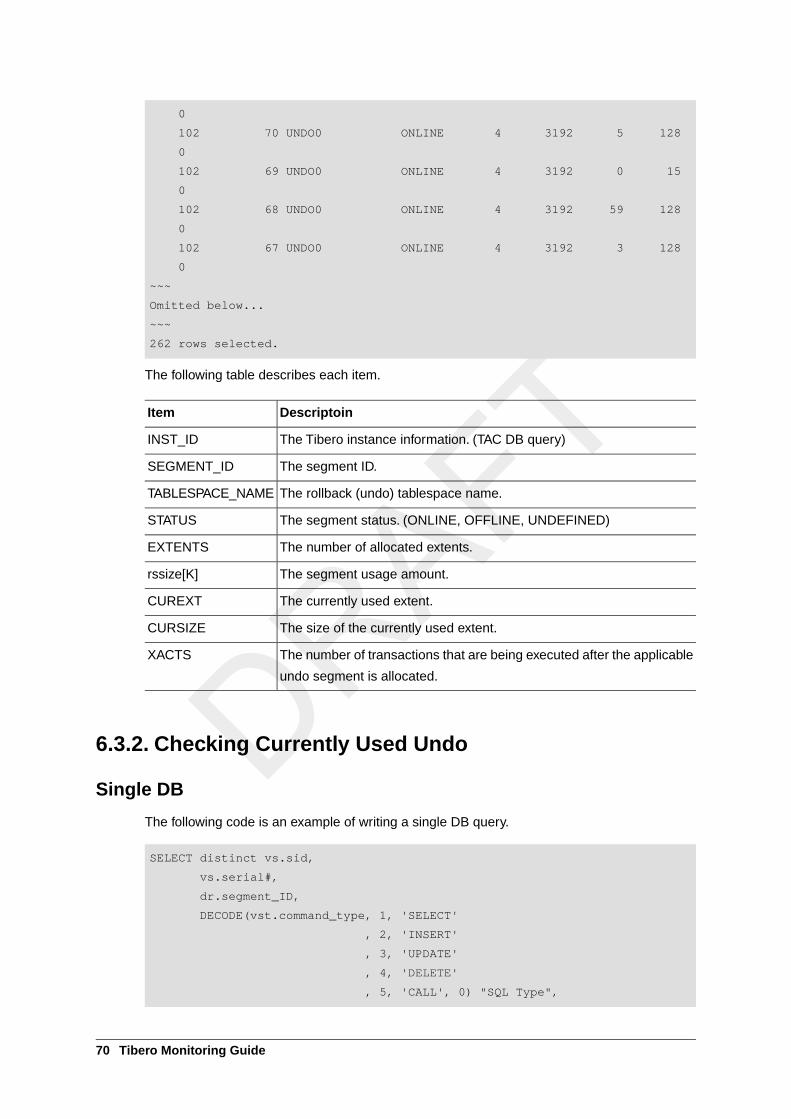
0
102 70 UNDO0 ONLINE 4 3192 5 128
0
102 69 UNDO0 ONLINE 4 3192 0 15
0
102 68 UNDO0 ONLINE 4 3192 59 128
0
102 67 UNDO0 ONLINE 4 3192 3 128
0
~~~
Omitted below...
~~~
262 rows selected.
The following table describes each item.
DescriptoinItem
The Tibero instance information. (TAC DB query)INST_ID
The segment ID.SEGMENT_ID
The rollback (undo) tablespace name.TABLESPACE_NAME
The segment status. (ONLINE, OFFLINE, UNDEFINED)STATUS
The number of allocated extents.EXTENTS
The segment usage amount.rssize[K]
The currently used extent.CUREXT
The size of the currently used extent.CURSIZE
The number of transactions that are being executed after the applicable
undo segment is allocated.
XACTS
6.3.2. Checking Currently Used Undo
Single DB
The following code is an example of writing a single DB query.
SELECT distinct vs.sid,
vs.serial#,
dr.segment_ID,
DECODE(vst.command_type, 1, 'SELECT'
, 2, 'INSERT'
, 3, 'UPDATE'
, 4, 'DELETE'
, 5, 'CALL', 0) "SQL Type",
70 Tibero Monitoring Guide
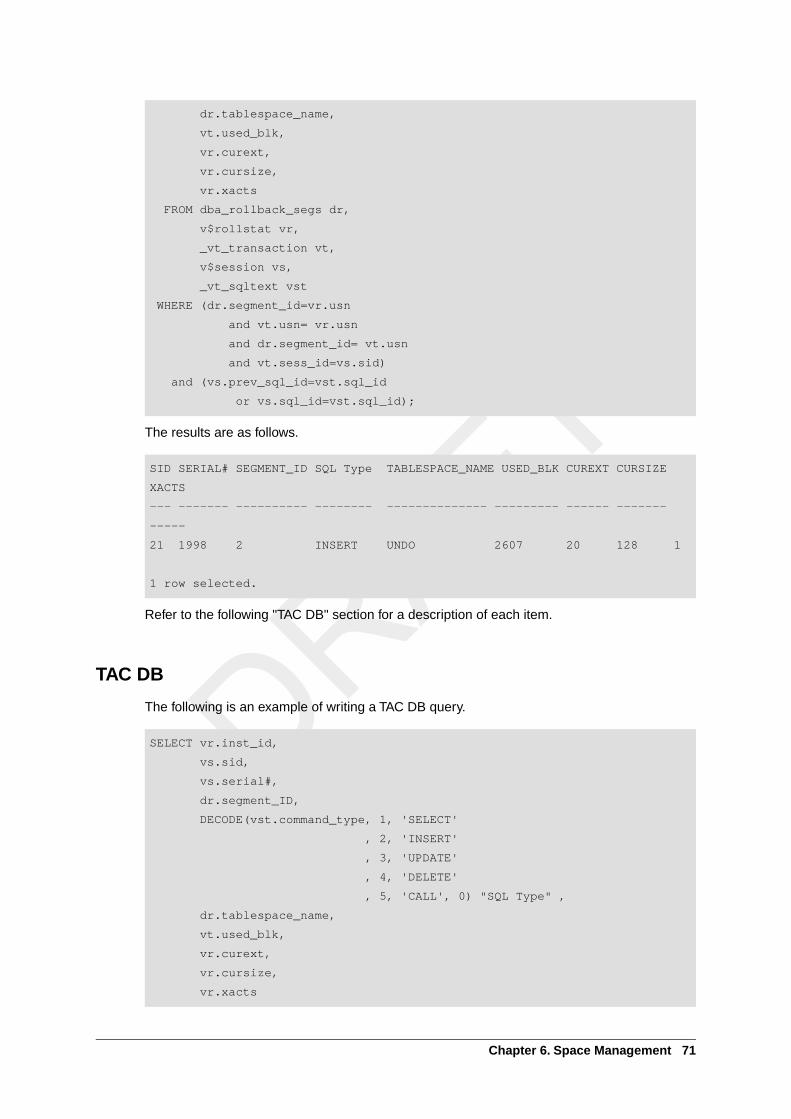
dr.tablespace_name,
vt.used_blk,
vr.curext,
vr.cursize,
vr.xacts
FROM dba_rollback_segs dr,
v$rollstat vr,
_vt_transaction vt,
v$session vs,
_vt_sqltext vst
WHERE (dr.segment_id=vr.usn
and vt.usn= vr.usn
and dr.segment_id= vt.usn
and vt.sess_id=vs.sid)
and (vs.prev_sql_id=vst.sql_id
or vs.sql_id=vst.sql_id);
The results are as follows.
SID SERIAL# SEGMENT_ID SQL Type TABLESPACE_NAME USED_BLK CUREXT CURSIZE
XACTS
--- ------- ---------- -------- -------------- --------- ------ -------
-----
21 1998 2 INSERT UNDO 2607 20 128 1
1 row selected.
Refer to the following "TAC DB" section for a description of each item.
TAC DB
The following is an example of writing a TAC DB query.
SELECT vr.inst_id,
vs.sid,
vs.serial#,
dr.segment_ID,
DECODE(vst.command_type, 1, 'SELECT'
, 2, 'INSERT'
, 3, 'UPDATE'
, 4, 'DELETE'
, 5, 'CALL', 0) "SQL Type" ,
dr.tablespace_name,
vt.used_blk,
vr.curext,
vr.cursize,
vr.xacts
Chapter 6. Space Management 71
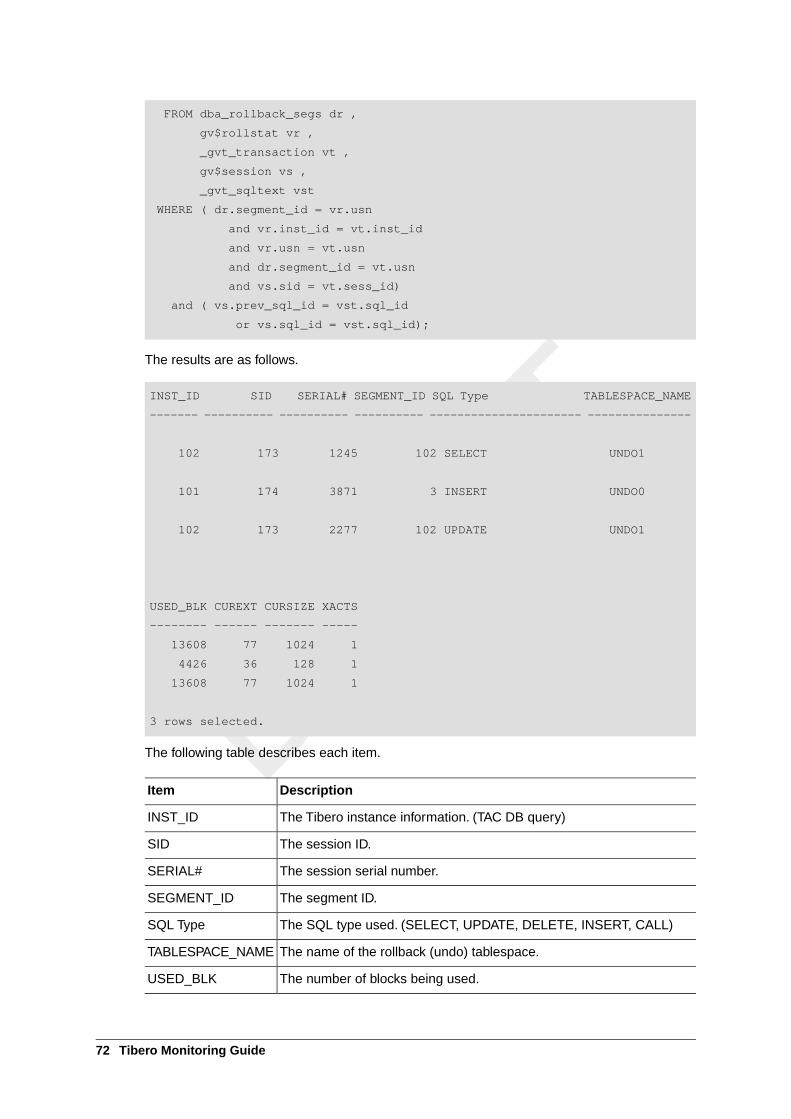
FROM dba_rollback_segs dr ,
gv$rollstat vr ,
_gvt_transaction vt ,
gv$session vs ,
_gvt_sqltext vst
WHERE ( dr.segment_id = vr.usn
and vr.inst_id = vt.inst_id
and vr.usn = vt.usn
and dr.segment_id = vt.usn
and vs.sid = vt.sess_id)
and ( vs.prev_sql_id = vst.sql_id
or vs.sql_id = vst.sql_id);
The results are as follows.
INST_ID SID SERIAL# SEGMENT_ID SQL Type TABLESPACE_NAME
------- ---------- ---------- ---------- ---------------------- ---------------
102 173 1245 102 SELECT UNDO1
101 174 3871 3 INSERT UNDO0
102 173 2277 102 UPDATE UNDO1
USED_BLK CUREXT CURSIZE XACTS
-------- ------ ------- -----
13608 77 1024 1
4426 36 128 1
13608 77 1024 1
3 rows selected.
The following table describes each item.
DescriptionItem
The Tibero instance information. (TAC DB query)INST_ID
The session ID.SID
The session serial number.SERIAL#
The segment ID.SEGMENT_ID
The SQL type used. (SELECT, UPDATE, DELETE, INSERT, CALL)SQL Type
The name of the rollback (undo) tablespace.TABLESPACE_NAME
The number of blocks being used.USED_BLK
72 Tibero Monitoring Guide
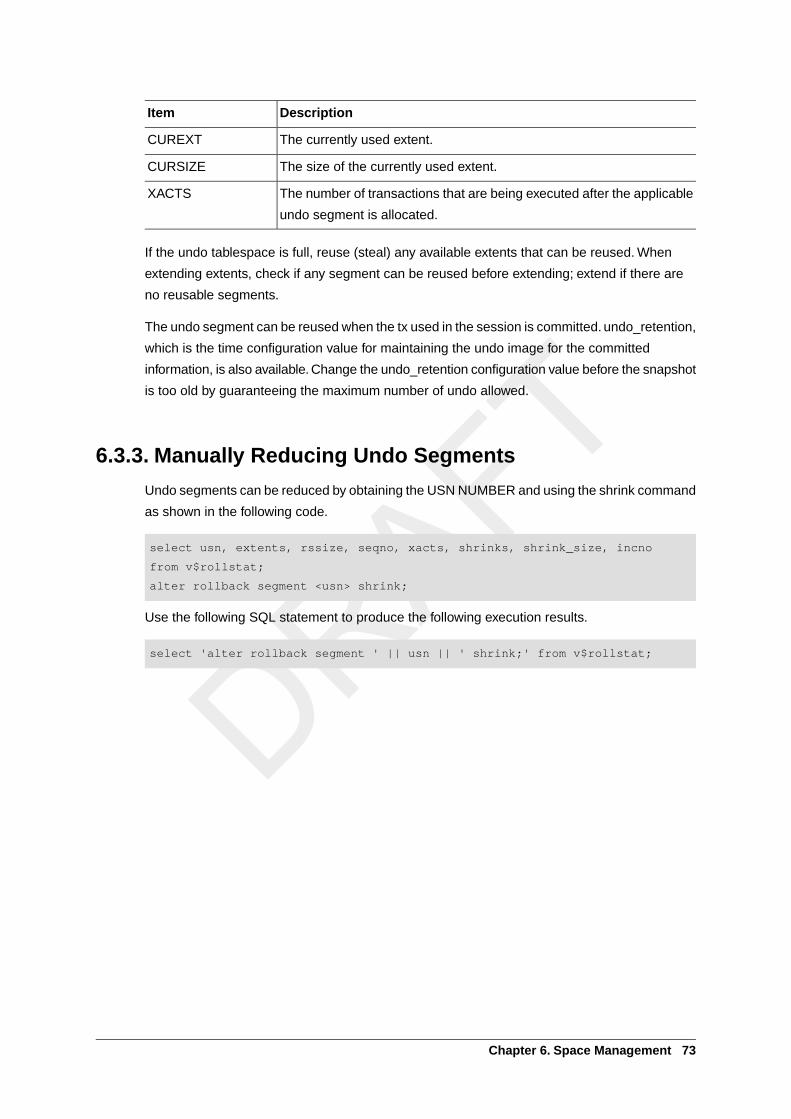
DescriptionItem
The currently used extent.CUREXT
The size of the currently used extent.CURSIZE
The number of transactions that are being executed after the applicable
undo segment is allocated.
XACTS
If the undo tablespace is full, reuse (steal) any available extents that can be reused. When
extending extents, check if any segment can be reused before extending; extend if there are
no reusable segments.
The undo segment can be reused when the tx used in the session is committed. undo_retention,
which is the time configuration value for maintaining the undo image for the committed
information, is also available. Change the undo_retention configuration value before the snapshot
is too old by guaranteeing the maximum number of undo allowed.
6.3.3. Manually Reducing Undo Segments
Undo segments can be reduced by obtaining the USN NUMBER and using the shrink command
as shown in the following code.
select usn, extents, rssize, seqno, xacts, shrinks, shrink_size, incno
from v$rollstat;
alter rollback segment <usn> shrink;
Use the following SQL statement to produce the following execution results.
select 'alter rollback segment ' || usn || ' shrink;' from v$rollstat;
Chapter 6. Space Management 73

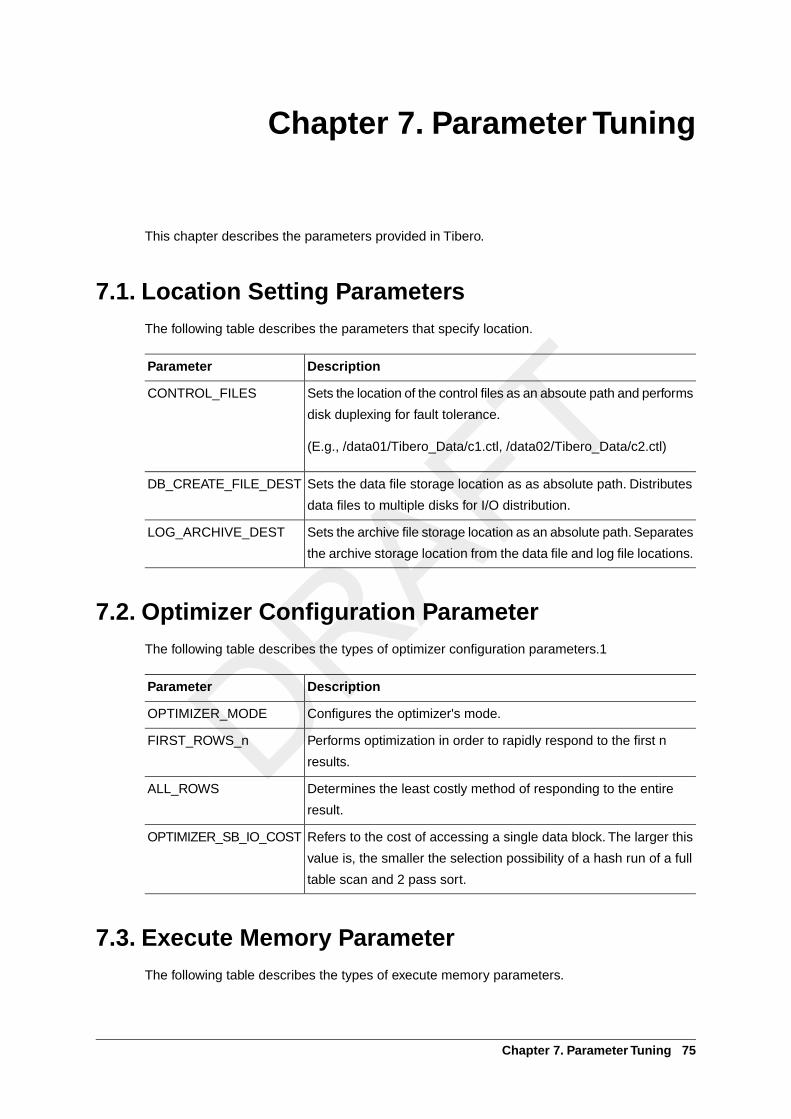
Chapter 7. Parameter Tuning
This chapter describes the parameters provided in Tibero.
7.1. Location Setting ParametersThe following table describes the parameters that specify location.
DescriptionParameter
Sets the location of the control files as an absoute path and performs
disk duplexing for fault tolerance.
(E.g., /data01/Tibero_Data/c1.ctl, /data02/Tibero_Data/c2.ctl)
CONTROL_FILES
Sets the data file storage location as as absolute path. Distributes
data files to multiple disks for I/O distribution.
DB_CREATE_FILE_DEST
Sets the archive file storage location as an absolute path. Separates
the archive storage location from the data file and log file locations.
LOG_ARCHIVE_DEST
7.2. Optimizer Configuration ParameterThe following table describes the types of optimizer configuration parameters.1
DescriptionParameter
Configures the optimizer's mode.OPTIMIZER_MODE
Performs optimization in order to rapidly respond to the first n
results.
FIRST_ROWS_n
Determines the least costly method of responding to the entire
result.
ALL_ROWS
Refers to the cost of accessing a single data block. The larger this
value is, the smaller the selection possibility of a hash run of a full
table scan and 2 pass sort.
OPTIMIZER_SB_IO_COST
7.3. Execute Memory ParameterThe following table describes the types of execute memory parameters.
Chapter 7. Parameter Tuning 75
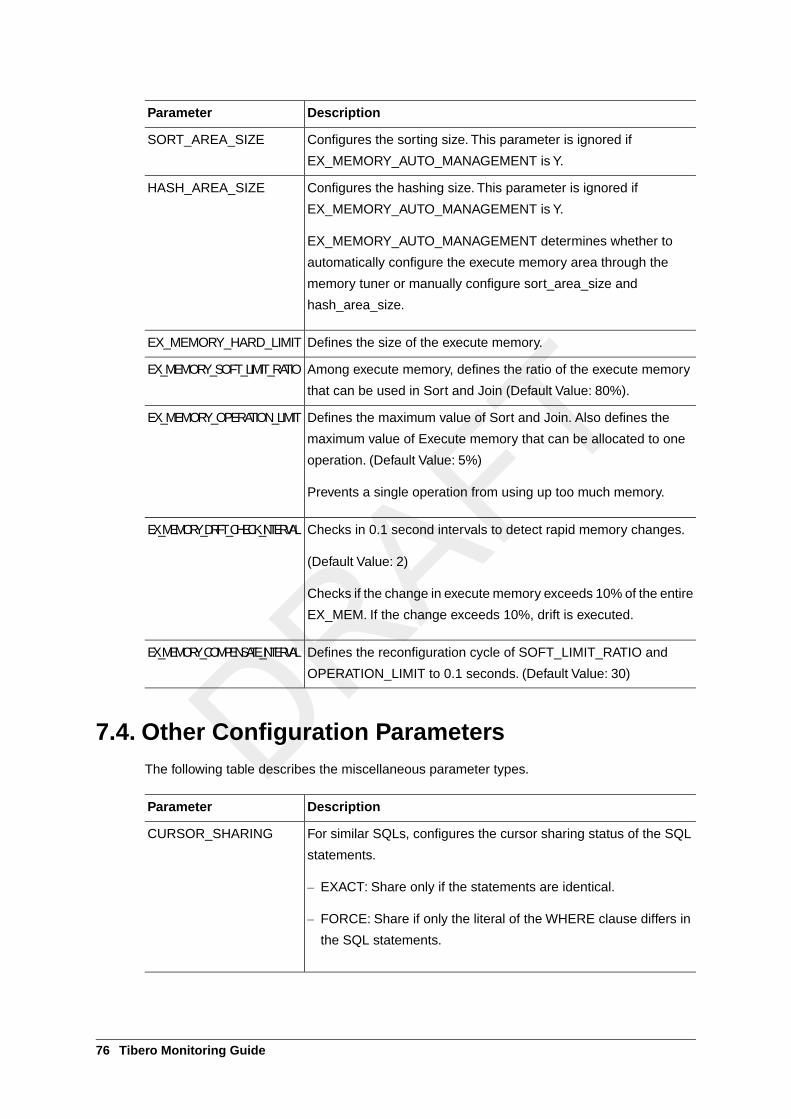
DescriptionParameter
Configures the sorting size. This parameter is ignored if
EX_MEMORY_AUTO_MANAGEMENT is Y.
SORT_AREA_SIZE
Configures the hashing size. This parameter is ignored if
EX_MEMORY_AUTO_MANAGEMENT is Y.
EX_MEMORY_AUTO_MANAGEMENT determines whether to
automatically configure the execute memory area through the
memory tuner or manually configure sort_area_size and
hash_area_size.
HASH_AREA_SIZE
Defines the size of the execute memory.EX_MEMORY_HARD_LIMIT
Among execute memory, defines the ratio of the execute memory
that can be used in Sort and Join (Default Value: 80%).
EX_MEMORY_SOFT_LIMIT_RATIO
Defines the maximum value of Sort and Join. Also defines the
maximum value of Execute memory that can be allocated to one
operation. (Default Value: 5%)
Prevents a single operation from using up too much memory.
EX_MEMORY_OPERATION_LIMIT
Checks in 0.1 second intervals to detect rapid memory changes.
(Default Value: 2)
Checks if the change in execute memory exceeds 10% of the entire
EX_MEM. If the change exceeds 10%, drift is executed.
EX_MEMORY_DRIFT_CHECK_INTERVAL
Defines the reconfiguration cycle of SOFT_LIMIT_RATIO and
OPERATION_LIMIT to 0.1 seconds. (Default Value: 30)
EX_MEMORY_COMPENSATE_INTERVAL
7.4. Other Configuration ParametersThe following table describes the miscellaneous parameter types.
DescriptionParameter
For similar SQLs, configures the cursor sharing status of the SQL
statements.
– EXACT: Share only if the statements are identical.
– FORCE: Share if only the literal of the WHERE clause differs in
the SQL statements.
CURSOR_SHARING
76 Tibero Monitoring Guide
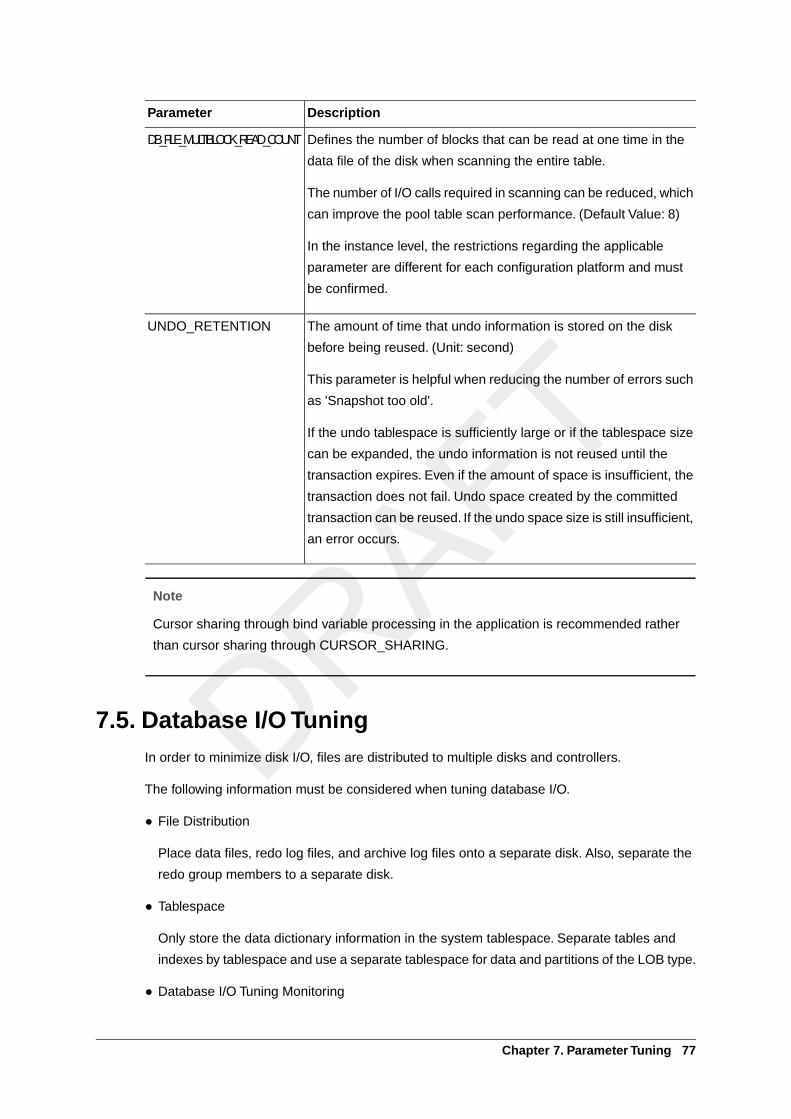
DescriptionParameter
Defines the number of blocks that can be read at one time in the
data file of the disk when scanning the entire table.
The number of I/O calls required in scanning can be reduced, which
can improve the pool table scan performance. (Default Value: 8)
In the instance level, the restrictions regarding the applicable
parameter are different for each configuration platform and must
be confirmed.
DB_FILE_MULTIBLOCK_READ_COUNT
The amount of time that undo information is stored on the disk
before being reused. (Unit: second)
This parameter is helpful when reducing the number of errors such
as 'Snapshot too old'.
If the undo tablespace is sufficiently large or if the tablespace size
can be expanded, the undo information is not reused until the
transaction expires. Even if the amount of space is insufficient, the
transaction does not fail. Undo space created by the committed
transaction can be reused. If the undo space size is still insufficient,
an error occurs.
UNDO_RETENTION
Note
Cursor sharing through bind variable processing in the application is recommended rather
than cursor sharing through CURSOR_SHARING.
7.5. Database I/O TuningIn order to minimize disk I/O, files are distributed to multiple disks and controllers.
The following information must be considered when tuning database I/O.
● File Distribution
Place data files, redo log files, and archive log files onto a separate disk. Also, separate the
redo group members to a separate disk.
● Tablespace
Only store the data dictionary information in the system tablespace. Separate tables and
indexes by tablespace and use a separate tablespace for data and partitions of the LOB type.
● Database I/O Tuning Monitoring
Chapter 7. Parameter Tuning 77
Use the V$FILESTAT dynamic performance view and separate the files with many I/O
occurrences onto multiple devices.
● Disk I/O Tuning
Disk I/O affects the performance of database the most.The following points must be considered
when tuning disk I/O.
– The interface between the host and the disk: EIDE, SCSI, and Ultra SCSI.
– RAID configuration: Can configure as RAID 0, RAID 1, RAID 5, RAID 0+1, RAID 1+0.
– File system: Consider improving the read performance.
– Raw Device: Consider improving the write performance.
● Tuning Factors.
Consider improving I/O performance by evenly distributing loads to multiple disks and disk
control devices. The disk bottleneck is reduced as the number of disks is increased. Many
small-capacity disks can have better performance than a few large-capacity disks.
78 Tibero Monitoring Guide


![[11]-TmaxData - Tibero RDBMS 4 SP1...제2장: TEXT 질의 Tibero TEXT 기능을 이용한 질의에 대해 기술한다. 제3장: TEXT Indexing Elements ... (따옴표) 다른 관련](https://img.pdfslide.net/doc/110x75/5e51d50de918e30e1f75b18c/11-tmaxdata-tibero-rdbms-4-sp1-oe2-text-tibero-text-ee.jpg)


![Sherpa Tibero 4 › download › Sherpa_Tibero 4.2...제품소개서 Contents 1. 회사개요 2. 셀파 특장점 - 아키텍처 - Real-time Monitoring - Log Analysis [별첨] - 수집서버](https://img.pdfslide.net/doc/110x75/5f0d65cd7e708231d43a2764/sherpa-tibero-4-a-download-a-sherpatibero-42-oeoeeoeoe-contents-1.jpg)