Embed Size (px)
Citation preview
Tiebout Sorting in Metropolitan Areas: Is it Services and Taxes, Race and Ethnicity, or Something Else?
by
Kenneth N. Bickers University of Colorado-Boulder
and
Richard Engstrom
University of Wyoming
© 2004 Kenneth N. Bickers and Richard Engstrom Prepared for the Workshop on the Workshop, Indiana University Workshop in Political Theory and Policy Analysis, June 1-3, 2004. An earlier version of this paper was presented at the annual meeting of the Midwest Political Science Association, Chicago, April 15-17, 2004.
Tiebout Sorting in Metropolitan Areas I. Introduction
For more than a generation, social scientists have argued about the appropriate scale for the organization and governance of metropolitan areas. On one side are advocates of metropolitan consolidation. On the other side are those who view local decentralization as the preferred policy objective. Both sides in this debate focus on the extent to which residents in metropolitan areas tend to sort themselves into homogeneous neighborhoods and communities. Advocates of consolidation view sorting as the source of social stratification, which is said to produce unequal government treatment of citizens in poorer jurisdictions relative to the treatment of citizens in wealthier jurisdictions. This position has come to be known as the Social Stratification-Government Inequality (SS-GI) thesis (Neiman, et al, 1976). Advocates of decentralization, by contrast, point to sorting as the mechanism by which people reveal their preferences for different tax and service bundles, thereby creating incentives for local jurisdictions in competition with one another to efficiently produce an optimal mix of services. This position is rooted in Tiebout’s public choice model of local government (Tiebout, 1956). Arguably, the issue that has generated most of the heat in this debate is the extent to which sorting of populations into homogeneous communities is a function of the knowledge that people have about service offerings and tax costs in particular jurisdictions (see, e.g., Lowery, et al, 1995; and Teske, et al., 1995).
Underlying this debate is a fundamentally important question: are people sorting
themselves into homogeneous communities based upon their preferences for the type of government that they want to have or based upon other types of considerations? It is the possibility of these other types of considerations that is the lightning rod in this debate. Are people sorting themselves based upon the desire to avoid living near others that are different from themselves? Put more pointedly, is sorting a mechanism of racial segregation and social stratification? If the latter is the case, then decentralization at the metropolitan level is the preferred institutional structure for advancing the cause of bigotry and social injustice. The issue could hardly be more important. A key problem with this debate, however, is that evidence on the extent of sorting, as well as the factors contributing to it, is far from conclusive. Survey research examining the information people have about tax and service bundles of local governments suggests that at best only a minority of people are well-informed about local governmental options (see Dowding, et al, 1994). Yet it appears that at least some people are able to identify and move to jurisdictions with services that are aligned with their preferences for collective goods (Teske, et al, 1993). It also appears that people with strong preferences for particular types of services, such as public education, utilize heuristics to correctly identify and move to jurisdictions with higher quality services, even when they are unable to accurately answer survey questions about the services (Bickers and Stein, 1998). This is consistent with the observation that people tend to live in neighborhoods that are populated by households with similar characteristics. The quandary, however, is that homogeneity at the level of neighborhoods, in and of itself, confirms neither the social stratification thesis nor the Tiebout thesis. Neighborhood homogeneity may or may not translate into homogeneity at the level of whole jurisdictions. The important questions are (one)
Tiebout Sorting, page 2
whether Tiebout sorting exists at the level of municipal jurisdictions; and (two) whether it is the result of variations in the mix of collective goods offered by local governments or is the result instead of non-governmental factors, such as the legacy of racist residential housing patterns. In this paper, we tackle the issue of sorting at the metropolitan area by utilizing an alternative methodological approach that permits us to avoid problems plaguing earlier studies. For this analysis, we take two metropolitan areas as our test cases: the Houston MSA and the Atlanta MSA. For each metropolitan area, we employ Monte Carlo computer simulations to randomly create a large number (approximately 500) of metropolitan “jurisdictional” groupings subject to three constraints: first, using census tracts as our basic building blocks we randomly group tracts together such that our hypothetical jurisdictions equal in number the existing number of general purpose jurisdictions in each MSA; second, the tracts are grouped so that each hypothetical jurisdiction is fully contiguous (i.e., no census tracts fail to touch at least one other tract in the jurisdiction; and third, the populations of each jurisdiction are within five percentage points (plus or minus) of existing jurisdictions within the metropolitan area. Based upon these Monte Carlos, we are able to estimate the level of jurisdictional homogeneity that is attributable to random chance. We can then compare observed levels of homogeneity to these expected value to assess the level of non-random sorting that may exist in an area. More importantly, we are able to assess homogeneity/heterogeneity of jurisdictions within each metropolitan area on the basis of multiple dimensions. Thus, we are able to determine the probability that the observed level of racial homogeneity is due to randomness, conditional on household income, household structure, and other dimensions of communities. The paper proceeds as follows. Section II, which follows this introduction, reviews much of the literature on sorting, including studies of racial segregation and social stratification, in order to highlight both the strengths and the weaknesses of this body of scholarship. Section III introduces the alternative methodology that we employ in this paper. This methodology relies on Monte Carlo simulations of jurisdictional sorting in order to engage in bootstrap hypothesis testing. Section IV describes the research design and data used in the analysis. In Section V, we discuss our findings. Finally, in Section VI, we discuss what these findings indicate about the debate between the advocates of consolidation and those of decentralization. II. Literature on Sorting The central premise in the Tiebout model is that mobility of citizens, if they are presented with a large number of governmental jurisdictions from which to select, is the motor-force behind the efficient provision of public goods. For Tiebout (1956: 420), “moving or failing to move replaces the usual market test of willingness to buy a good and reveals the consumer-voter’s demand for collective goods.” He goes on to say, “Thus each locality has a revenue and expenditure pattern that reflects the desires of its residents” (1956: 420). The Tiebout-based argument is that governmental efficiency is enhanced when citizen-consumers have sufficient choices in “shopping” for a jurisdictional home to impel local governments to produce desired services at the minimum cost possible (Ostrom, 1983). The result of this process of spatial mobility is that jurisdictions come to be populated, according to Tiebout, with citizens that are relatively homogeneous with respect to their preferences over service bundles and tax costs.
Tiebout Sorting, page 3
The empirical literature on sorting tends to cluster into several categories. One set of studies relates to the question of racial sorting. A second focuses on income and wealth distributions across different communities. A third extends the focus to sorting on the basis of a broader set of dimensions of demographic and ascriptive characteristics. Finally, a fourth utilizes multiple regression approaches, typically with survey data, to assess the relationship between service-tax bundles and the locational decisions of households. For reasons that we explore below, each of these approaches contributes to the debate over sorting, but none has yet assessed the issue of sorting in a fully adequate way. The issue of race runs throughout the debate between consolidationists and decentralizationists. This should surprise no one. The history of housing patterns in the United States is replete with segregationist policies – many de jure, more no doubt were, and perhaps are, de facto. Numerous studies have demonstrated that neighborhoods across America continue to evidence segregation along racial and income lines. Smith (1991), for example, focuses on data from a sample of 109 cities and finds that most of the integration that occurred during the period between 1970 and 1980 was the result of declines in the proportion of black residents of mostly black neighborhoods rather than through increases in the proportion of blacks relocating into mostly white neighborhoods. Fischer (2003) adds segregation by income into the mix. She explores trends in segregation by race/ethnicity, as well as by income, over the period of 1970 through 2000, and finds that racial segregation decreased, while income class segregation increased, over most of this period. At the same time, she finds that racial segregation is particularly prevalent among poor black families, though black families in general were more segregated from other groups than other racial/ethnic groups were from one other. St. John (2002) argues that much of the apparent racial segregation is instead spatial concentration of income groups. He suggests that a substantial portion of the differences in the concentration of racial groups in metropolitan areas is explained by income differences between racial groups, rather than by residential segregation. He shows that differences in the type and industry of employment available to blacks and others tend to influence the levels of income generated by racial groups.
These studies and others (e.g., Clark and Ware, 1997; Fong, 1994; Wood and Lee, 1991; Galster, 1991; Farley, 1991; Stahura, 1988), while documenting that racial sorting occurs at the neighborhood-level, do not directly address the question of whether people are sorting themselves into distinct governmental jurisdictions along racial lines. Homogeneous neighborhoods – measured on the basis of race – need not mean that the jurisdictions in which the neighborhoods are located are also homogeneous in this or other respects. To be sure, in the limiting case of a jurisdiction so small that it encompasses a single neighborhood, the level of neighborhood homogeneity and the level of jurisdictional homogeneity must be the same. As jurisdictions become increasingly large, it is conceivable that particular neighborhoods tend to be sorted by race, even though households in general are sorting themselves into jurisdictions in order to maximize their preferences for service bundles and tax burdens. If so, this would suggest that preferences over collective goods that are provided by governments, and not just desires to live in racially homogeneous neighborhoods, play an important role in the locational decisions of households. The methodology we describe below allows us to examine the relative role of race along with other types of factors in the selection of local jurisdictions.
Tiebout Sorting, page 4
A somewhat older body of literature dating to the late 1970s and early 1980s focused on sorting on the basis of income differentials (e.g., Pack and Pack, 1977; Miller, 1981; Grubb, 1982). The premise behind these studies was sound. They built on the premise that differences in income are correlated with differences in preferences. The expectation is thus that Tiebout-like mobility would lead to sorting of households into different jurisdictions as a function of income differentials. These studies, however, utilized summary measures of income inequality, such as the Gini index, to operationalize the core concept. As Pack and Pack (1977) and Stein (1987) point out, the use of the Gini index as a way of measuring income differentials confuses inequality with heterogeneity. The example Stein (1987: 158) uses is the situation in which 90% of the households in a jurisdiction have only 10% of the total income in the jurisdiction. A Gini index would show that this is highly unequal distribution of income. But it is not a heterogeneous distribution. In fact, it is exactly the opposite. The overwhelming majority of households in this hypothetical jurisdiction have similar incomes.
A more satisfactory alternative is to employ indices that measure similarity or
dissimilarity. One such measure is the coefficient of variation (Pack and Pack, 1977). This measure, which is computed by dividing the standard deviation of an indicator by the mean of that indicator, is a useful way of summarizing homogeneity. With the mean in the denominator, the extent of variability in the indicator is, in essence, normalized in units of the mean, such that different coefficients of variation can be directly compared. The downside of this measure for the purpose of examining the sorting hypothesis, as Stein (1987) argues, is that it is inherently unidimensional despite the fact that sorting is presumed to occur with reference to multiple preferences. Similarity or dissimilarity exists with reference not merely to income (or any other single measure), but with reference to many different aspects of people’s lives. A more satisfactory alternative is to utilize an index that summarizes similarity or dissimilarity within a population across any number of variables. Stein (1987) building on Lieberson’s (1968) earlier work on assessing diversity, quantifies the extent of sorting with an index that measures the probability that any two people drawn from a population will have identical pairs of traits from n-different categories of traits. It usefully captures homogeneity/heterogeneity across many different dimensions, taking on the value of 0 when everyone is identical on all traits and approaches the value of 1 when everyone differs on all traits. This same measure has been applied more broadly in the political science literature by John Sullivan (1973) and others that have followed Sullivan’s lead (e.g., Bond, 1983). The use of similarity/dissimilarity measures such as this has become fairly standard in studies of household sorting.
Dowding, et al (1994), raise an important critique of the way measures of homogeneity
have typically been applied to the study of Tiebout sorting. Many studies compare the level of homogeneity in individual jurisdictions (or neighborhoods) to the overall level of homogeneity in overlying metropolitan areas (for example, Hamilton et el., 1975; Eberts and Gronberg, 1981; Munley, 1982). At first blush, this seems entirely reasonable: if sorting occurs, then each jurisdiction should have relatively lower levels of heterogeneity than exists in the metropolitan level as a whole. A finding that individual jurisdictions are less heterogeneous than the metropolitan area has been taken as evidence of sorting. But a comparison of individual jurisdictions to the metropolitan area suffers from an extremely high likelihood of what Dowding, et al, call statistical sorting. This is the statistically inevitability (or virtual inevitability) that as the number of jurisdictions increases, the level of heterogeneity within any
Tiebout Sorting, page 5
particular jurisdiction is almost certainly going to be less than for the metropolitan area as a whole. The only exception is the situation in which every local jurisdiction exactly mirrors the overall level of heterogeneity of the metropolitan area, such as exists in single-jurisdiction metropolitan areas.
To date, the main option for working around this problem has been to employ a multiple
regression approach in which measures of heterogeneity are regressed on measures of government taxes or services as well as other demographic controls, including the overall level of heterogeneity of the metropolitan area (Ottensmann, 1982; Stein, 1987). This approach has much merit. It directly connects the question of household location to the choices made by local governments. What this approach cannot easily do is to examine the issue of sorting in a way that recognizes and accommodates the preferences of people to live in various sectors of a metropolitan area, while examining the extent to which they also sort themselves into specific governmental jurisdictions. This is a key point too often overlooked in studies of sorting. People move to parts of metropolitan areas for many reasons – of which only a subset are likely to be a function of publicly provided collective goods. Multiple regressions produce biased estimates of sorting if any of these other factors are correlated with measures of taxes or spending that are incorporated in the models. As a consequence, evidence of sorting will be overstated or understated.
Advice to include omitted variables is easy to suggest, but in the real world impossible to
implement. It requires knowing the unknowable. It requires access to the preference sets of each household for collective goods that are publicly provided, collective goods that are privately provided, and for private goods that are uniquely available in a particular section of a metropolitan area. It also requires that those preferences sets be quantifiable with valid measures.
To summarize, a satisfactory methodology for examining the empirical evidence of
Tiebout sorting in metropolitan areas must be capable of three things beyond that of existing approaches to the topic. First, the method needs to be able to differentiate between sorting at the neighborhood level and sorting at the level of local jurisdictions. Second, the indicator of homogeneity should be a measure of similarity/dissimilarity, and optimally should incorporate multiple dimensions on which households can differ, rather than just a single dimension. Third, and the greatest challenge, the method must measure the extent of sorting, without requiring knowledge of or the ability to operationalize preferences of households over the set of non-governmentally provided collective goods and private goods that may have been factors in the locational decisions of households. The method that we discuss in the following section accomplishes all three of these goals.
III. Spatial Boot-Strapping Methodology The methodology that we utilize below combines two statistical techniques, one that is well-known to scholars of epidemiology and geography but is relatively unfamiliar within the political science profession and one that has been receiving increasing attention in the political science profession in recent years. The first technique involves the use of spatial information to simulate the processes that generate patterns of observed behavior, such as the diffusion of

Tiebout Sorting, page 6
diseases throughout a region of the world (e.g., Loytonen, 1991; Gardner and Brundage, 1989; Pickering and Robbin, 1989). The goal in these studies is to model the extent of spatial correlation across increasingly distant geographic units. The second technique is known as bootstrapping. As explained by Mooney (1996), bootstrapping is a computationally-intense method for generating the distributional properties of statistics “where there are no or only weak statistical theory about the distribution of a statistic, and where the distributional assumptions necessary for valid parametric inference are violated” (p. 571). By combining these two techniques, we are to able to generate parameter estimates of household sorting within metropolitan areas and to calculate the probability that the observed pattern of sorting is due either to jurisdictional differences in service and tax bundles or to racial and/or ethnic housing preferences, as opposed to random chance. As with epidemiological studies that simulate the patterns of disease diffusion across geographic areas, one of our primary goals is to better understand the possible patterns of spatial behaviors represented by the locational choices of households. We use this approach to compute distributions of patterns of homogeneity/heterogeneity that can be used for bootstrapping.
The null hypothesis in this analysis is that jurisdictional boundaries are randomly drawn around sets of households without respect to any jurisdictionally-relevant factors – i.e., without respect to the tax and service bundles that differentiate one jurisdiction from another. The provisional assumption embedded in this null hypothesis is that households migrate to particular residential locations in order to maximize their preferences over private goods (e.g., proximity to employment, shopping, relatives, etc.), but not to maximize their consumption of the sets of collective goods that different municipalities provide. Our approach directly tests this assumption. A finding of an acceptably low probability of randomness in the homogeneity of households within municipalities would be taken as strong evidence that Tiebout sorting by households is occurring – that is to say, we would conclude that the locational decisions of households is a function, at least in part, of the distinctive patterns of collective goods offered by different municipalities.
Specifically, the method that we use involves Monte Carlo trials in which we randomly
generate internally contiguous clusters of census tracts into pseudo-municipalities that are equal in number and are equal (approximately) in population size to the observed number and populations of the municipalities in a metropolitan area. That is, for each observed municipality in the metropolitan area, we randomly generate approximately 500 pseudo-municipalities that are equal in size (actually within +/- five percent of the observed). As the number of Monte Carlo trials approaches infinity, the set of generated pseudo-municipalities reflects the distribution of physically contiguous combinations of census tracts that exist in a theoretical population of possible combinations of census tracts totaling a particular population within a given metropolitan area. Notice what this means. The extent of household heterogeneity that is captured in the distribution of pseudo-municipalities mirrors the degree of heterogeneity that exists within the metropolitan area, subject to the constraint that the heterogeneity in each pseudo-municipality is comprised of contiguous census tracts and thus the amount of heterogeneity that theoretically could be combined into a possible municipality of a particular size. Hence the potential range of heterogeneity in each pseudo-municipality is limited to that which can be constructed from the observable traits of census tracts that lie adjacent to one another.
Tiebout Sorting, page 7
The generation of pseudo-municipalities comprised of physically contiguous census
tracts allows us to model, at the limit, all possible observable combinations of household heterogeneity that theoretically might exist for municipalities of a given size within a metropolitan area. For each municipality size in each metropolitan area, a separate distribution must be computed. Relatively few census tracts will be required to equal the populations of small pseudo-municipalities, but these will tend not to have as much possible variation in heterogeneity due to the requirement of physical contiguity as will be the case in larger pseudo-municipalities, which potentially can stretch over a much larger expanse and thus can encompass neighborhoods of substantially different household traits. Yet the distribution of pseudo-municipalities of any given population size will incorporate the range of possibilities that actually exist among neighborhoods that are physically proximate in a particular metropolitan area.
These distributions – one for each municipality size in each metropolitan area – serve as
the theoretical distributions for statistical inference in standard bootstrap fashion. For each actual municipality in each metropolitan area, we calculate a multi-dimensional measure of homogeneity, as well as a one-dimensional measure of racial concentration.1 These observed test statistics are then compared to the distributions of computationally generated parameters for the comparable pseudo-municipalities in order to determine the probability that the test statistics are due to random chance, as opposed to Tiebout sorting or racial sorting into particular jurisdictions. In this way, we ask whether the observed level of homogeneity within actual municipalities departs from randomness, conditional on the overall level of spatially organized housing patterns within a metropolitan area.
Notice several things about this approach to the issue of sorting. First, by varying the
boundaries of hypothetical municipalities to generate a theoretical distribution of possible municipalities of a given size, we avoid the problem of “statistical sorting” as discussing by Dowding, et al (1994). We are not simultaneously comparing the level of heterogeneity in all municipalities to that in the metropolitan area. Instead, we are comparing the level of heterogeneity of each municipality in the metropolitan area to the possible distribution of similarly-sized physically contiguous hypothetical municipalities that might be drawn within the metropolitan area. Second, notice that this methodology treats as fixed the set of preferences over private-goods that lead households to select a particular location. The computational manipulation of municipality boundaries allows us to estimate the probability that the household selected that particular location in order to consume a set of municipally-provided collective goods, conditional on whatever the unobserved set of private goods that may also be factors in that locational choice. Third, and finally, by building pseudo-municipalities from adjacent and contiguous census tracts, this method keeps neighborhoods relatively intact (with the important exception of the boundaries that are drawn to carve out a pseudo-municipality, thereby excluding all other census tracts, whether nearby or distant). As a result, this method respects the level of homogeneity that may exist at a neighborhood level, while testing for heterogeneity at the level of political jurisdictions.
1 Specifics on the operationalization of these measures is provided in a later section of the paper.

Tiebout Sorting, page 8
IV. Research Design and Data One of the key questions to ask is, in what metropolitan area or areas could we set up a decisive test of the sorting issue – a critical test that would give unambiguous support to the claims of the consolidationists, on the one hand, or the decentralizationalists, on the other? In thinking about how to answer this question, two considerations stand out. The first consideration relates directly to the oft-mentioned concern in this body of literature with the question of whether sorting is less about tax and service bundles, ala Tiebout, and more about racially motivated efforts by households to locate in racially homogeneous neighborhoods. This has been one of the primary charges leveled by advocates of consolidation against the proponents of the Tiebout hypothesis. To date, however, satisfactory tests of racial versus Tiebout sorting have been elusive – not for lack of trying, but for lack of an adequate methodology. The methodology that we employ here allows us to assess the level of sorting on the basis of a multidimensional indicator, conditional on the level of racial sorting. Because this is such an important issue, the selection of metropolitan areas for analysis should give great weight to the presence of substantial minority populations. For this paper, we have selected metropolitan areas with minority populations that constitute between a third and half of the total population of the Metropolitan Statistical Areas (MSAs)
Second, if a crucial factor in permitting households to engage in Tiebout sorting is the extent of decentralization in a metropolitan area, then it would seem necessary to compare the extent of sorting at the municipal level across metropolitan areas that are characterized by varying levels of consolidation or decentralization. The best way to design such a test, albeit one that is beyond the confines of this paper, would utilize a measure of consolidation and decentralization of metropolitan areas as a regressor in a statistical test of the average level of homogeneity across a large number of metropolitan areas. Such an enterprise would require hundreds of thousands of pseudo-municipality boundaries to be drawn, and is simply not feasible at the present time. While a large-n study of this sort would be desirable, in this paper we focus on two relatively similarly sized metropolitan areas, one with a high degree of decentralization and one with a high degree of consolidation.
Even in a two metropolis analysis, we can make significant headway in the debate between consolidationists and decentralizationalists. The test we construct is that the extent of sorting within municipalities is a function of the degree of consolidation or decentralization of the metropolitan area. A finding that substantially more municipalities have statistically significant levels of sorting in the metropolitan area that is characterized by greater decentralization will be taken as support of the Tiebout hypothesis. Contrariwise, if the municipalities in both metropolitan areas have approximately the same level of sorting on the multidimensional measure, this will be taken as support of the claims made by consolidationists.
Table 1 contains a list of the largest 25 MSAs in the United States as of the year 2000.2 It also indicates the population of the center city within each MSA, the percentage of the total
2 In cases where the Census Bureau has designated an area as a Consolidated Metropolitan Statistical Area (CMSA), we use the CMSA as our geography of interest, rather than the smaller

Tiebout Sorting, page 9
MSA population that is comprised by the center city, and the number of counties and municipal governments that are nested within the MSA. For this analysis, we have selected the MSAs that surround Houston and Atlanta. These two MSAs are relatively equal in size: in the 2000 Census they ranked 8th and 11th in total MSA population, respectively. More important for our purposes, they differ greatly in the extent of consolidation and decentralization. Houston ranks 2nd among the largest 25 MSAs in the proportion of its population residing in a common jursisdiction, at 39.5% in the City of Houston. Only the San Diego MSA has a higher percentage living in the core city. By contrast, the Atlanta MSA is among the most decentralized of the large metropolitan areas in the country. It ranks fifth from the bottom among the largest 25 MSAs in terms of the proportion of the MSA population living in the center city with only 9.8% living in the City of Atlanta itself, which contains a mere 400 thousand people (less than a fourth the size of the City of Houston).
(Table 1 about here)
The comparability of the racial composition of the two MSAs, as discussed above, is a
crucial factor in selecting these areas for study. Overall, the percentage of minority persons is high in both metropolitan areas. Minorities constitute 48.6% in the Houston MSA and 32.3% in the Atlanta MSA (U.S. Census Burea, 2000: 36).3 The composition of the minority population differs somewhat between the two MSAs. The Houston minority population is more diverse. Of the total population in the Houston MSA, 18.3% are African American, 24.6% are Hispanic, and 5.2% are Asian American. By contrast, in the Atlanta MSA, most minority persons are African American. Of the total population in the Atlanta MSA, 25.9% are African American, a mere 3.4% are Hispanic, and 2.8% are Asian American. Despite these disparities, the Atlanta and Houston MSAs are relatively similar on the racial dimension, while being dissimilar on the consolidation/decentralization dimension, at least among comparably sized pairs of MSAs. In essence, the research design that we use here is an example of Przeworski and Teune’s (1966-67) most similar systems design. Developed in the context of comparative analysis, the idea is to select cases that are as similar as possible on all variables, except the variable of interest, which in our case is the level of consolidation/decentralization.
At the core of the analysis is the multidimensional measure of similarity/dissimilarity
based on those used by Stein (1987) and others (e.g., Sullivan, 1973). We construct three such measures for each municipality in the two MSAs. The first is an overall measure of dissimilarity (we use this term interchangeably with diversity in the text below). This measure taps seven dimensions of similarity and dissimilarity: age, education, income, housing structure, occupation, race, and ethnicity. We also construct two additional measures that separate out the race and ethnicity components from the other demographic components. The formula for these measures is the following:
Primary Statistical Areas that comprise the CMSA. For convenience, we refer to CMSAs as MSAs throughout the paper, except in cases where the distinction would otherwise be unclear. 3 These numbers represent the totals of Blacks, Asian and Pacific Islanders, Native Americans, and persons of Hispanic origin. Note, however, that these figures may overstate the total percentage of minorities because persons of Hispanic origin may also be Black.
Tiebout Sorting, page 10
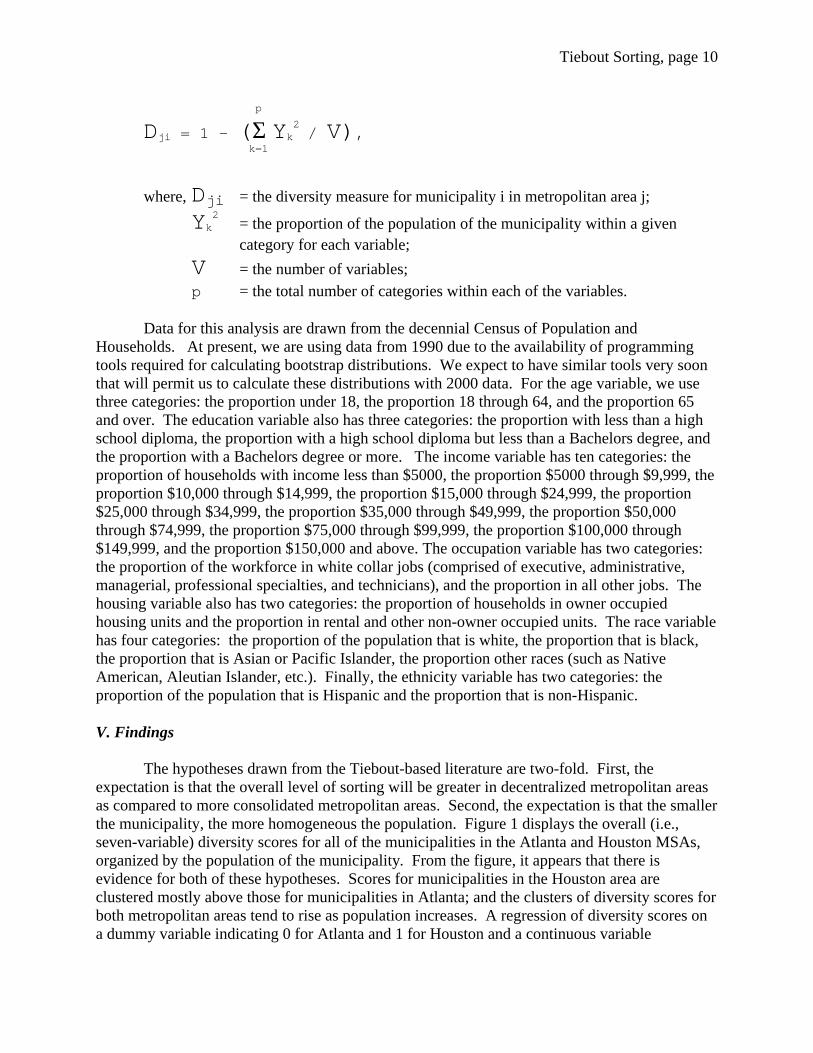
p
Dji = 1 – (Σ Yk2 / V),
k=1
where, Dji = the diversity measure for municipality i in metropolitan area j;
Yk2 = the proportion of the population of the municipality within a given
category for each variable;
V = the number of variables; p = the total number of categories within each of the variables.
Data for this analysis are drawn from the decennial Census of Population and Households. At present, we are using data from 1990 due to the availability of programming tools required for calculating bootstrap distributions. We expect to have similar tools very soon that will permit us to calculate these distributions with 2000 data. For the age variable, we use three categories: the proportion under 18, the proportion 18 through 64, and the proportion 65 and over. The education variable also has three categories: the proportion with less than a high school diploma, the proportion with a high school diploma but less than a Bachelors degree, and the proportion with a Bachelors degree or more. The income variable has ten categories: the proportion of households with income less than $5000, the proportion $5000 through $9,999, the proportion $10,000 through $14,999, the proportion $15,000 through $24,999, the proportion $25,000 through $34,999, the proportion $35,000 through $49,999, the proportion $50,000 through $74,999, the proportion $75,000 through $99,999, the proportion $100,000 through $149,999, and the proportion $150,000 and above. The occupation variable has two categories: the proportion of the workforce in white collar jobs (comprised of executive, administrative, managerial, professional specialties, and technicians), and the proportion in all other jobs. The housing variable also has two categories: the proportion of households in owner occupied housing units and the proportion in rental and other non-owner occupied units. The race variable has four categories: the proportion of the population that is white, the proportion that is black, the proportion that is Asian or Pacific Islander, the proportion other races (such as Native American, Aleutian Islander, etc.). Finally, the ethnicity variable has two categories: the proportion of the population that is Hispanic and the proportion that is non-Hispanic. V. Findings The hypotheses drawn from the Tiebout-based literature are two-fold. First, the expectation is that the overall level of sorting will be greater in decentralized metropolitan areas as compared to more consolidated metropolitan areas. Second, the expectation is that the smaller the municipality, the more homogeneous the population. Figure 1 displays the overall (i.e., seven-variable) diversity scores for all of the municipalities in the Atlanta and Houston MSAs, organized by the population of the municipality. From the figure, it appears that there is evidence for both of these hypotheses. Scores for municipalities in the Houston area are clustered mostly above those for municipalities in Atlanta; and the clusters of diversity scores for both metropolitan areas tend to rise as population increases. A regression of diversity scores on a dummy variable indicating 0 for Atlanta and 1 for Houston and a continuous variable
Tiebout Sorting, page 11
measuring the natural log of the population of each municipality corroborates the pattern that appears in Figure 1. This regression, results for which are shown in Table 2 (regression 2.1), indicates that the average increase in diversity among Houston municipalities, relative to those in the Atlanta MSA, is 0.024 (t-ratio=3.84). Also as population increases, diversity increases by 0.012 for each unit increase in the natural log of population (t-ratio=4.62).
(Figure 1 about here) The counter-hypothesis raised by advocates of consolidation is that sorting is principally a function of race and ethnicity, rather than a function of preferences for different bundles of collective goods. To test for this possibility, we have separated the diversity scores into two distinct components: demographic factors (age, education, income, housing, and occupation) and racial and ethnic factors. Figure 2 displays diversity scores based only on demographic (non-racial/ethnic factors) for municipalities in each of the two MSAs organized, as above, by population. From this visual display, it is apparent that there is little, if any, perceptible difference in diversity scores between Atlanta and Houston municipalities. Also difficult to perceive is visual evidence of an upward slope in diversity as population increases. Table 2 (regression 2.2) presents the results of a regression of these scores on an MSA dummy variable and population (logged). This regression confirms the lack of a difference in diversity scores between the two MSAs. However, there is a statistically significant, though substantively modest, impact of population on the demographic-only diversity scores. According to this regression, the expected increase in diversity for each unit increase in population (i.e., each population logged value) is 0.006 (t-ratio=3.387). This increase in diversity as population of municipalities increase can be viewed as supportive of the Tiebout model. The lack of a distinction, however, in diversity scores between the two MSAs supports the consolidationist position, which holds that sorting, if it exists at all, has little to do with non-race and ethnicity factors.
(Figure 2 about here) Stronger support for the consolidationist hypothesis can be found in Figure 3, which displays the diversity scores for racial and ethnic heterogeneity. As is clearly evident in this figure, there is a distinct difference in race and ethnicity across municipalities located in the two MSAs. Municipalities in the Atlanta MSA tend to be less diverse than those located in the Houston MSA. Also apparent in the figure is an easily perceived upward slope in diversity with increases in population. This pattern is borne out in a regression of race & ethnicity diversity scores on population and MSAs. These results are reported in regression 2.3 of Table 2. These results indicate that there is a difference of 0.092 in the average level of racial and ethnic diversity between Atlanta and Houston municipalities, an amount that substantively is equal to almost ten percent on the diversity scale. There is also an increase in diversity of 0.026 for each unit increase in the log of population across municipalities in the two MSAs. Notice that this amount of change is approximately double the average impact of population on the overall diversity measure and more than four times the average impact of population on the diversity measure that excludes race and ethnicity. This finding suggests that there is substantial merit in the argument made by consolidation proponents that race and ethnic factors lie behind much of the sorting that appears to exist in metropolitan areas. At the same time, however, there is still
Tiebout Sorting, page 12
ample support in all of these regressions for the arguments made by proponents of decentralization that households are more effective in sorting on the basis of their preferences for collective goods when there are large numbers of relatively small jurisdictions in a metropolitan area.
(Figure 3 about here) The key question that has been unanswered to this point in the analysis, however, is whether the amount of apparent sorting among the municipalities in the Atlanta and Houston metropolitan areas is significantly different than what might be expected due to random chance. To answer this question, we use the bootstrapping method to generate theoretical distributions of sorting of households in pseudo-municipalities of equal sizes to the observed municipalities in each of the two MSAs. To generate information about the distribution of possible municipal characteristics in the Atlanta and Houston metropolitan areas we assembled electronic boundary files of all the census tracts in the Atlanta and Houston MSAs. We then merged the relevant tract-level census data to the map files. We took the resulting map files and their associated data and established a procedure for aggregating tracts into pseudo-municipalities. Using Mapinfo geographic information system software, we had a computer select a random starting census tract, and then add adjacent tracts randomly until the underlying population associated with the collection of tracts reached a target population (with a buffer of plus or minus 5%). The procedure then repeated until 500 pseudo-cities of like size were generated.
The end result of the procedure is a file containing 500 pseudo-municipalities generated for each city size within a metropolitan area, along with each pseudo-municipality’s underlying demographics. The distribution of characteristics underlying the set of pseudo-cities allows us to plot the observed characteristics of cities in a metropolitan area on a distribution of randomly generated characteristics. In essence, we are able to determine how far from an expected value the real characteristics are, and thus how much non-random sorting is evident in particular municipalities. Table 3 reports the level of sorting, using both the overall diversity and diversity on the race and ethnicity dimensions, in observed municipalities with populations of 7500 persons and greater in each of the two MSAs, along with the probability that the observed levels of sorting are due to random chance. The table, though packed with information, indicates that sorting at a level that is unlikely to be due to random chance is relatively rare – at any conventional level of significance. If we use the conventional alpha level of a 0.05 probability of randomness in order to reject the null hypothesis, then there are four out of 44 municipalities larger than 7500 residents in the Houston MSA and none in the Atlanta MSA where we could conclude that the observed overall level of homogeneity is likely to be systematic.4 Even if we relax the test of significance to an alpha level of 0.10, we would still conclude that only six of the 44 Houston
4 The probability value scores for the City of Houston (population 1.6 million) are missing. The Monte Carlo program for building pseudo-municipalities for such a large city requires approximately half a day to run, more time than we could afford and still have this draft of the paper finished. These scores will be added at a later date.
Tiebout Sorting, page 13
municipalities and only one of the 42 Atlanta municipalities demonstrate strong evidence of sorting on the overall measure of diversity.
(Table 3 about here) The consolidationists hypothesis that, to the extent sorting occurs it is primarily along racial and ethnic dimensions, also fails to be borne out. At an alpha level of 0.05, the bootstrap methodology indicates that the racial and ethnic diversity score would be significantly different from random chance in only 3 of 44 cases in the Houston area and just one case out of 42 in the Atlanta area. Again, if we relax the alpha level to 0.10, we still arrive at essentially the same conclusion. There is evidence of systematic sorting on the basis of race and ethnicity in 6 of the 44 municipalities with populations larger than 7500 in the Houston area and in just one case among the 42 comparable municipalities in Atlanta. From the opposite vantage point, there is no evidence that racial or ethnic sorting, beyond what one might expect due to randomness, explains the housing patterns in 38 to 41 or 44 Houston area municipalities or in 41 to 42 of 42 Atlanta municipalities. One might still wonder, however, if there is a pattern, even if weak, to the probabilities of observing sorting across these municipalities. Is there, for example, a decreasing probability of randomness as city sizes decrease? Or is there a difference in the pattern of randomness between the two metropolitan areas, such that Atlanta municipalities, with the greater decentralization in that MSA, have a lower average probability of randomness compared to Houston, with its higher degree of consolidation? To address these questions, two figures have been included that display the probability values for each municipality of 7500 persons or more in each of the two metropolitan areas. Figure 4 displays probability values for the overall diversity scores. Figure 5 displays probability values for the race and ethnicity diversity scores. In both figures, the probabilities are arrayed along a population continuum with icons that differentiate between municipalities located in the Atlanta MSA and in the Houston MSA. As Figure 4 clearly shows, there is no obvious pattern to the probability values for overall diversity scores on the basis of population. There appears to be some pattern for the cluster of values across the two metropolitan areas. In general, the Houston MSA municipalities have somewhat lower probabilities of being random than do the Atlanta MSA municipalities. This apparent distinction is corroborated by a regression of these values on population (logged) and a dummy variable differentiating municipalities in the two metropolitan areas (regression results not reported here). The impact of population on these scores is nonexistent. There is a significant, though modest, impact for the MSA dummy variable. But the direction of this coefficient is in an unexpected direction. According to the Tiebout model, we would expect that the more decentralized MSA would permit households to more efficiently engage in sorting, which would lead to less randomness in the Atlanta diversity measures. In fact, we find that the probabilities of randomness in the overall diversity scores are actually lower in the Houston area than they are in the Atlanta area.
(Figure 4 about here)
Tiebout Sorting, page 14
The possibility that sorting is a function of racial and ethnic considerations is addressed with Figure 5 . As the discussion of Table 3 indicated, there is no corroboration for this possibility. While one can find a few municipalities where the level of racial and ethnic sorting is highly unlikely to be due to random chance, one finds far more where randomness seems to be the operative process. There is no affect of population size on the probability of randomness in these diversity measures. Moreover, the differences in probability values across municipalities in the two metropolitan areas appear to have no pattern at all. As before, a regression testing for these possibilities (not reported here) confirms the lack of any expected pattern. Population has no impact and the impact of the MSA dummy variable is weak and in the unexpected direction. In essence, Figure 5 shows that the levels of racial and ethnic sorting that are evident in different municipalities is unlikely to be greater than what one would expect through a purely random process.
(Figure 5 about here)
VI. Conclusion This analysis of household sorting leads us to two diametrically opposed conclusions. On the one hand, there appears at first to be some evidence that sorting occurs. Smaller municipalities have less diversity than do larger municipalities. Municipalities in more decentralized metropolitan areas have less diversity than do municipalities in more consolidated metropolitan areas. This pattern of decreasing diversity is even stronger when we consider racial and ethnic sorting. Smaller municipalities are substantially more homogeneous along these dimensions than are larger municipalities. Likewise, the level of racial and ethnic homogeneity tends to be greater in the more decentralized MSA than in the more consolidated MSA. On the other hand, the levels of sorting that we observe across these municipalities rarely are greater than what we would expect due to random chance. The bootstrap methodology that allows us to estimate the probability that a particular level of sorting within an observed municipality in a given metropolitan gives us unusually unambiguous results. The observed levels of sorting, including the increasing homogeneity as populations decrease, are entirely consistent with what one might find if households were randomly being grouped together into municipalities. How is this possible? Our answer for this apparent disagreement is both statistical and perceptual. The statistical answer is that homogeneity is partly a function of population sizes. Put simply, the larger the population the more likely it is that the population will include greater diversity. A small pond rarely holds lots of different kinds of fish. As ponds become lakes, which in turn become oceans, there is room for more species to coexist within the same ecosystem. The same is apparently true for municipalities. Our evidence indicates that there is undeniably less diversity in smaller municipalities and more diversity in larger municipalities. Our evidence also indicates that these differences in diversity are consistent with what might be expected due to random chance. One of the important conclusions of this paper is that much of the research on sorting has given misleading results by not asking whether observed levels of sorting may have been due to random chance. By generating statistics capable of addressing this question, we arrive a very different results than the received wisdom and academic debates would lead us to believe.
Tiebout Sorting, page 15
Our perceptual answer is perhaps more difficult to prove. Our hunch is that scholars
focusing on local population patterns have observed instances of municipalities where sorting has no doubt occurred. Sometimes this may have had much to do with race and ethnicity. That is, one can easily find examples of municipalities that have actively sought to attract some kinds of households and to repel others. Our findings are consistent with this possibility: we, too, find some municipalities where the level of homogeneity is likely to be systematic, rather than random. Generalizing from these cases to all municipalities, however, is a mistake. Most municipalities do not display patterns of sorting that depart from randomness. It is easy, perhaps too easy, to ignore anomalies, such as neighborhoods where large numbers of Hispanics and/or black families live in relative proximity to neighborhoods with large numbers of white families – all living within the same municipality. It is also easy to assume that one knows where the actual municipal boundaries lie when in fact one does not. In such cases, one may be mentally redistricting some neighborhoods out of a municipality in order to preserve a perceptual screen. We do not know, nor can we show, how important these perceptual processes may be. But we suspect that they have played a role in the persistent debate between the type of sorting (i.e., over preferences for collective goods versus over race and ethnicity) that obtains in local metropolitan areas.
What do our results say about the debate between the two camps – the advocates of
decentralization and the advocates of consolidation? Essentially, we conclude that both sides have been beating a dead horse. Decentralization and small municipality sizes do not lead to systematically high levels of sorting on the kinds of demographic factors typically associated with preferences for collective goods. Nor do decentralization and small municipality size lead to pernicious levels of racial and ethnic sorting. Observed levels of sorting racial and ethnic sorting are much more consistent with the idea that municipalities have mixes of racial and ethnic groups that are driven not by municipal policies but by factors that are unrelated to a particular set of municipally-driven collective choices. Our conclusion is thus that arguments about metropolitan structure should be driven not by unwarranted equity concerns related to household sorting, but by concerns with governmental efficiency and economies of scale.
Tiebout Sorting, page 16
References Bickers, Kenneth N. and Robert M. Stein. 1998. "The Micro Foundations of the Tiebout Model".
Urban Affairs Review 34: 1 (September): 76-93. Bond, Jon R. 1983. “The Influence of Constituency Diversity on Electoral Competition in
Voting for Congress, 1974-1978,” Legislative Studies Quarterly 8:2 (May), pp. 201-217. Clark, William A. V. and Julian Ware. 1997. “Trends in Residential Integration by
Socioeconomic Status in Southern California,” Urban Affairs Review v32 n6 (July), pp. 825-43.
Dowding, Keith, and Peter John. 1994. “Tiebout: A survey of the empirical literature,” Urban
Studies Vol. 31 Issue 4/5 (May), pp. 767-798. Eberts, R.W. and Gronberg, T.J. 1981. “Jurisdictional homogeneity and the Tiebout model,”
Journal of Urban Economics, 10, pp. 227-239. Farley, John E. 1991. “Black-White Housing Segregation in the City of St. Louis: A 1988
Update,” Urban Affairs Quarterly 26:3 (March), pp. 442-50. Fischer, Mary J. 2003. “The Relative Importance of Income and Race in Determining
Residential Outcomes in U.S. Urban Areas, 1970-2000,” Urban Affairs Review 38: 5 (May), pp. 669-96.
Fong, Eric. 1994. “Residential Proximity among Racial Groups in U.S. and Canadian
Neighborhoods,” Urban Affairs Quarterly 30: 2 (December), pp. 285-97. Galster, George C. 1991. “Black Suburbanization: Has It Changed the Relative Location of
Races?” Urban Affairs Quarterly 26: 4 (June), pp. 621-28. Gardner, L. I., Jr. and J.F. Brundage. 1989. “Spatial Diffusion of the Human Immunodeficiency
Virus Infection Epidemic in the United States, 1985-1987.” Annals of the Association of American Geographers 79: 1 (March), pp. 25-43.
Hamilton, B., Mills, E. and Puryear, D. 1975. “The Tiebout hypothesis and residential income
segregation,” in E. S. Mills and W. E. Oates (Eds.) Fiscal Zoning and Land Use Controls. Lexington: Lexington Books.
Lieberson, Stanley. 1969. “Measuring Population Diversity,” American Sociological Review 34,
pp. 850-862. Lowery, David, W. E. Lyons, and Ruth Hoogland DeHoog. 1995. “The Empirical Evidence for
Citizen Information and a Local Market for Public Goods,” American Political Science Review 89: 3. (September), pp. 705-707.
Tiebout Sorting, page 17
Loytonen, Markku. 1991. “The Spatial Diffusion of Human Immunodeficiency Virus Type 1 in Finland, 1982-1997,” Annals of the Association of American Geographers 81: 1 (March), pp. 127-151.
Lyons, W.E. and David Lowery. 1989. “Governmental Fragmentation Versus Consolidation:
Five Public Choice Myths about How to Create Informed, Involved and Happy Citizens,” Public Administration Review 49: 6, (Nov/Dec), pp. 533-543.
Margulis, Harry L. 2001. “Household Mobility, Housing Traits, Public Goods, and School
Quality in Cleveland's Metropolitan Statistical Area,” Urban Affairs Review 36: 5 (May), pp. 646-77.
Mooney, Christopher Z. 1996. “Bootstrap Statistical Inference: Examples and Evaluations for
Political Science,” American Journal of Political Science 40: 2 (May), pp. 570-602. Munley, V.G. 1982. “An alternative test of the Tiebout hypothesis,” Public Choice 38, pp. 211-
217. Neiman, Max, Richard Child Hill, William Lyons, David R. Morgan, John Wanat, Phillip W.
Roeder, Douglas D. Rose, Kazuhiko Okuda, and N. Patrick Peritore. 1976. "Communications," American Political Science Review 70: 1 (March), pp. 149-180.
Ostrom, Elinor. 1983. “The Social Stratification – Government Inequality thesis explored,”
Urban Affairs Quarterly 19: 1 (September), pp. 91-112. Ottensmann, J.R. 1982. “Neighbourhood heterogeneity within an urban area,” Urban Studies,
19, pp. 391-395. Pickering, J. and J.E. Robbin. 1989. “Geographical Information Systems, Census Data and
Forecasting in the United States.” Abstracts, 3d EC Workshop on Quantitative Analyses of AIDS Modeling and Scenario-Analysis. Bilthoven, p. 29.
Przeworski, Adam and Henry Teune. 1966-67. “Equivalence in Cross-National Research.”
Public Opinion Quarterly 30: 4 (Winter), pp. 551-568. Smith, Richard A. 1991. “The Measurement of Segregation Change through Integration and
Deconcentration, 1970-1980,” Urban Affairs Quarterly 26: 4 (June), pp. 477-96. St. John, Craig. 2002. “The Concentration of Affluence in the United States, 1990,” Urban
Affairs Review 37: 4 (March), pp. 500-20. Stein, Robert M. 1987. “Tiebout's sorting hypothesis,” Urban Affairs Quarterly 23, pp. 140-166 Sullivan, John L. 1973. “Political Correlates of Social, Economic, and Religious Diversity in the
American States,” Journal of Politics 35: 1 (February), pp. 70-84.
Tiebout Sorting, page 18
Teske, Paul, Mark Schneider, Michael Mintrom and Samuel Best. 1993. “Establishing the Micro Foundations of A Macro Theory: Information, Movers, and the Competitive Local Market for Public Goods,” American Political Science Review. 87:702-13.
Teske, Paul, Mark Schneider, Michael Mintrom, and Samuel Best. 1995. “Controversies,”
American Political Science Review, 89: 3. (September), pp. 707-709. Tiebout, Charles M. 1956. “A Pure Theory of Local Expenditures,” Journal of Political
Economy, 64: 5 (October), pp. 416 – 424. Wood, Peter B. and Barrett A. Lee. 1991. “Is Neighborhood Racial Succession Inevitable?
Forty Years of Evidence,” Urban Affairs Quarterly 26: 4 (June), pp. 610-20.
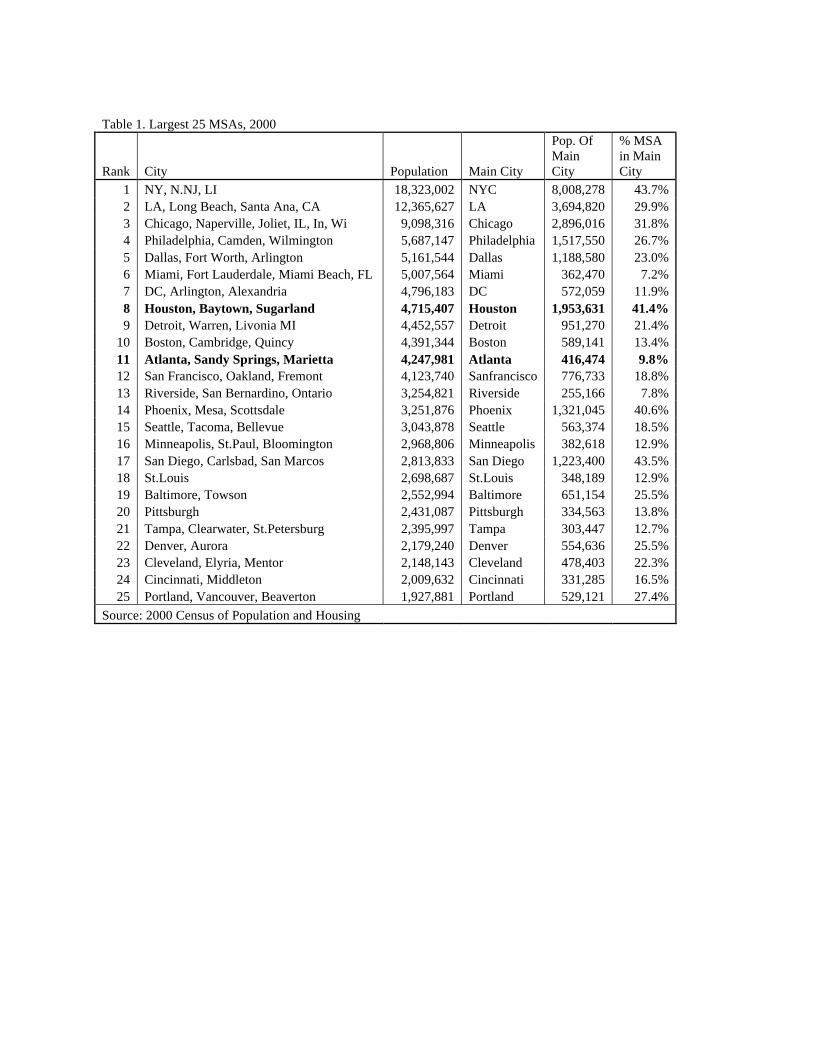
Table 1. Largest 25 MSAs, 2000
Rank City Population Main City
Pop. Of Main City
% MSA in Main City
1 NY, N.NJ, LI 18,323,002 NYC 8,008,278 43.7% 2 LA, Long Beach, Santa Ana, CA 12,365,627 LA 3,694,820 29.9% 3 Chicago, Naperville, Joliet, IL, In, Wi 9,098,316 Chicago 2,896,016 31.8% 4 Philadelphia, Camden, Wilmington 5,687,147 Philadelphia 1,517,550 26.7% 5 Dallas, Fort Worth, Arlington 5,161,544 Dallas 1,188,580 23.0% 6 Miami, Fort Lauderdale, Miami Beach, FL 5,007,564 Miami 362,470 7.2% 7 DC, Arlington, Alexandria 4,796,183 DC 572,059 11.9% 8 Houston, Baytown, Sugarland 4,715,407 Houston 1,953,631 41.4% 9 Detroit, Warren, Livonia MI 4,452,557 Detroit 951,270 21.4%
10 Boston, Cambridge, Quincy 4,391,344 Boston 589,141 13.4% 11 Atlanta, Sandy Springs, Marietta 4,247,981 Atlanta 416,474 9.8% 12 San Francisco, Oakland, Fremont 4,123,740 Sanfrancisco 776,733 18.8% 13 Riverside, San Bernardino, Ontario 3,254,821 Riverside 255,166 7.8% 14 Phoenix, Mesa, Scottsdale 3,251,876 Phoenix 1,321,045 40.6% 15 Seattle, Tacoma, Bellevue 3,043,878 Seattle 563,374 18.5% 16 Minneapolis, St.Paul, Bloomington 2,968,806 Minneapolis 382,618 12.9% 17 San Diego, Carlsbad, San Marcos 2,813,833 San Diego 1,223,400 43.5% 18 St.Louis 2,698,687 St.Louis 348,189 12.9% 19 Baltimore, Towson 2,552,994 Baltimore 651,154 25.5% 20 Pittsburgh 2,431,087 Pittsburgh 334,563 13.8% 21 Tampa, Clearwater, St.Petersburg 2,395,997 Tampa 303,447 12.7% 22 Denver, Aurora 2,179,240 Denver 554,636 25.5% 23 Cleveland, Elyria, Mentor 2,148,143 Cleveland 478,403 22.3% 24 Cincinnati, Middleton 2,009,632 Cincinnati 331,285 16.5% 25 Portland, Vancouver, Beaverton 1,927,881 Portland 529,121 27.4%
Source: 2000 Census of Population and Housing
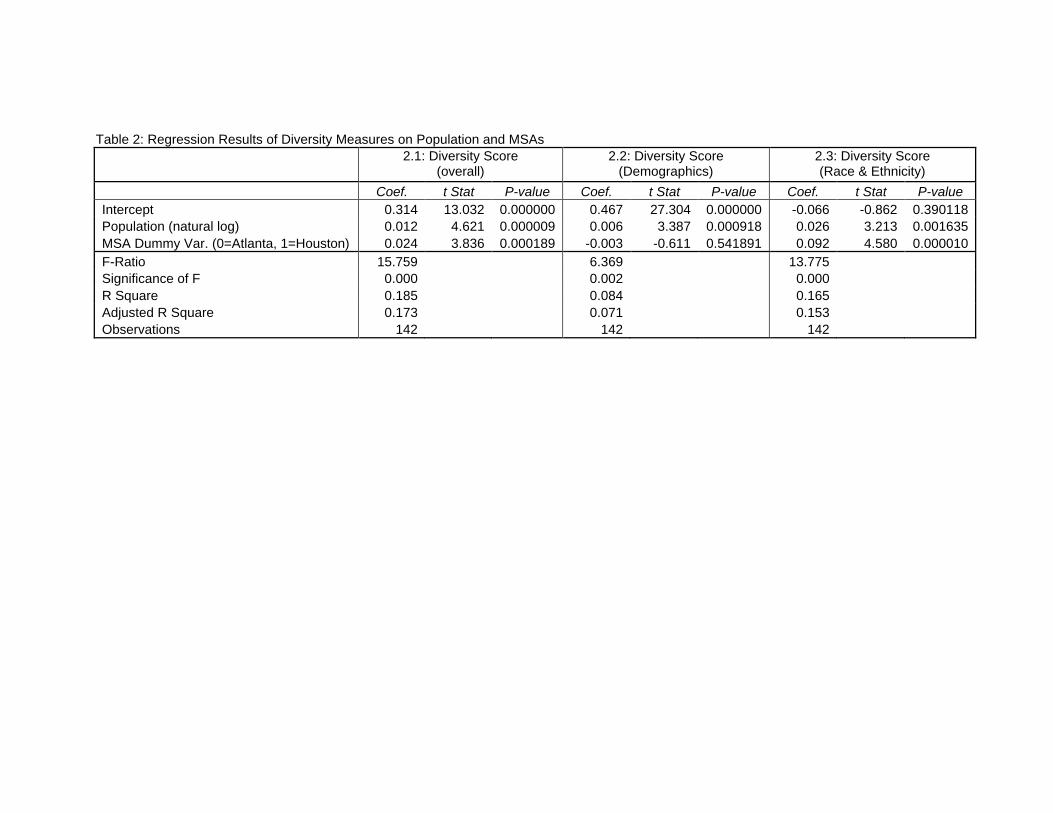
Table 2: Regression Results of Diversity Measures on Population and MSAs
2.1: Diversity Score (overall)
2.2: Diversity Score (Demographics)
2.3: Diversity Score (Race & Ethnicity)
Coef. t Stat P-value Coef. t Stat P-value Coef. t Stat P-value Intercept 0.314 13.032 0.000000 0.467 27.304 0.000000 -0.066 -0.862 0.390118 Population (natural log) 0.012 4.621 0.000009 0.006 3.387 0.000918 0.026 3.213 0.001635 MSA Dummy Var. (0=Atlanta, 1=Houston) 0.024 3.836 0.000189 -0.003 -0.611 0.541891 0.092 4.580 0.000010 F-Ratio 15.759 6.369 13.775 Significance of F 0.000 0.002 0.000 R Square 0.185 0.084 0.165 Adjusted R Square 0.173 0.071 0.153 Observations 142 142 142
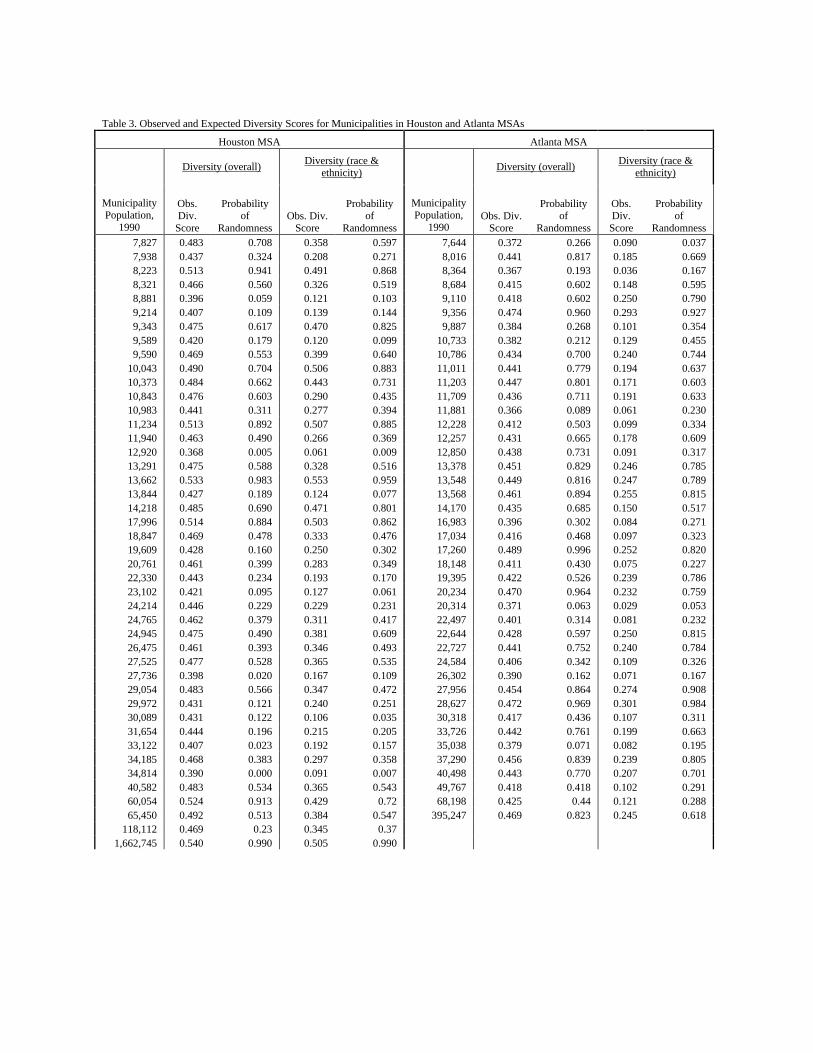
Table 3. Observed and Expected Diversity Scores for Municipalities in Houston and Atlanta MSAs
Houston MSA Atlanta MSA
Diversity (overall) Diversity (race & ethnicity) Diversity (overall) Diversity (race &
ethnicity)
Municipality Population,
1990
Obs. Div.
Score
Probability of
Randomness Obs. Div.
Score
Probability of
Randomness
Municipality Population,
1990 Obs. Div.
Score
Probability of
Randomness
Obs. Div.
Score
Probability of
Randomness 7,827 0.483 0.708 0.358 0.597 7,644 0.372 0.266 0.090 0.037 7,938 0.437 0.324 0.208 0.271 8,016 0.441 0.817 0.185 0.669 8,223 0.513 0.941 0.491 0.868 8,364 0.367 0.193 0.036 0.167 8,321 0.466 0.560 0.326 0.519 8,684 0.415 0.602 0.148 0.595 8,881 0.396 0.059 0.121 0.103 9,110 0.418 0.602 0.250 0.790 9,214 0.407 0.109 0.139 0.144 9,356 0.474 0.960 0.293 0.927 9,343 0.475 0.617 0.470 0.825 9,887 0.384 0.268 0.101 0.354 9,589 0.420 0.179 0.120 0.099 10,733 0.382 0.212 0.129 0.455 9,590 0.469 0.553 0.399 0.640 10,786 0.434 0.700 0.240 0.744
10,043 0.490 0.704 0.506 0.883 11,011 0.441 0.779 0.194 0.637 10,373 0.484 0.662 0.443 0.731 11,203 0.447 0.801 0.171 0.603 10,843 0.476 0.603 0.290 0.435 11,709 0.436 0.711 0.191 0.633 10,983 0.441 0.311 0.277 0.394 11,881 0.366 0.089 0.061 0.230 11,234 0.513 0.892 0.507 0.885 12,228 0.412 0.503 0.099 0.334 11,940 0.463 0.490 0.266 0.369 12,257 0.431 0.665 0.178 0.609 12,920 0.368 0.005 0.061 0.009 12,850 0.438 0.731 0.091 0.317 13,291 0.475 0.588 0.328 0.516 13,378 0.451 0.829 0.246 0.785 13,662 0.533 0.983 0.553 0.959 13,548 0.449 0.816 0.247 0.789 13,844 0.427 0.189 0.124 0.077 13,568 0.461 0.894 0.255 0.815 14,218 0.485 0.690 0.471 0.801 14,170 0.435 0.685 0.150 0.517 17,996 0.514 0.884 0.503 0.862 16,983 0.396 0.302 0.084 0.271 18,847 0.469 0.478 0.333 0.476 17,034 0.416 0.468 0.097 0.323 19,609 0.428 0.160 0.250 0.302 17,260 0.489 0.996 0.252 0.820 20,761 0.461 0.399 0.283 0.349 18,148 0.411 0.430 0.075 0.227 22,330 0.443 0.234 0.193 0.170 19,395 0.422 0.526 0.239 0.786 23,102 0.421 0.095 0.127 0.061 20,234 0.470 0.964 0.232 0.759 24,214 0.446 0.229 0.229 0.231 20,314 0.371 0.063 0.029 0.053 24,765 0.462 0.379 0.311 0.417 22,497 0.401 0.314 0.081 0.232 24,945 0.475 0.490 0.381 0.609 22,644 0.428 0.597 0.250 0.815 26,475 0.461 0.393 0.346 0.493 22,727 0.441 0.752 0.240 0.784 27,525 0.477 0.528 0.365 0.535 24,584 0.406 0.342 0.109 0.326 27,736 0.398 0.020 0.167 0.109 26,302 0.390 0.162 0.071 0.167 29,054 0.483 0.566 0.347 0.472 27,956 0.454 0.864 0.274 0.908 29,972 0.431 0.121 0.240 0.251 28,627 0.472 0.969 0.301 0.984 30,089 0.431 0.122 0.106 0.035 30,318 0.417 0.436 0.107 0.311 31,654 0.444 0.196 0.215 0.205 33,726 0.442 0.761 0.199 0.663 33,122 0.407 0.023 0.192 0.157 35,038 0.379 0.071 0.082 0.195 34,185 0.468 0.383 0.297 0.358 37,290 0.456 0.839 0.239 0.805 34,814 0.390 0.000 0.091 0.007 40,498 0.443 0.770 0.207 0.701 40,582 0.483 0.534 0.365 0.543 49,767 0.418 0.418 0.102 0.291 60,054 0.524 0.913 0.429 0.72 68,198 0.425 0.44 0.121 0.288 65,450 0.492 0.513 0.384 0.547 395,247 0.469 0.823 0.245 0.618
118,112 0.469 0.23 0.345 0.37 1,662,745 0.540 0.990 0.505 0.990
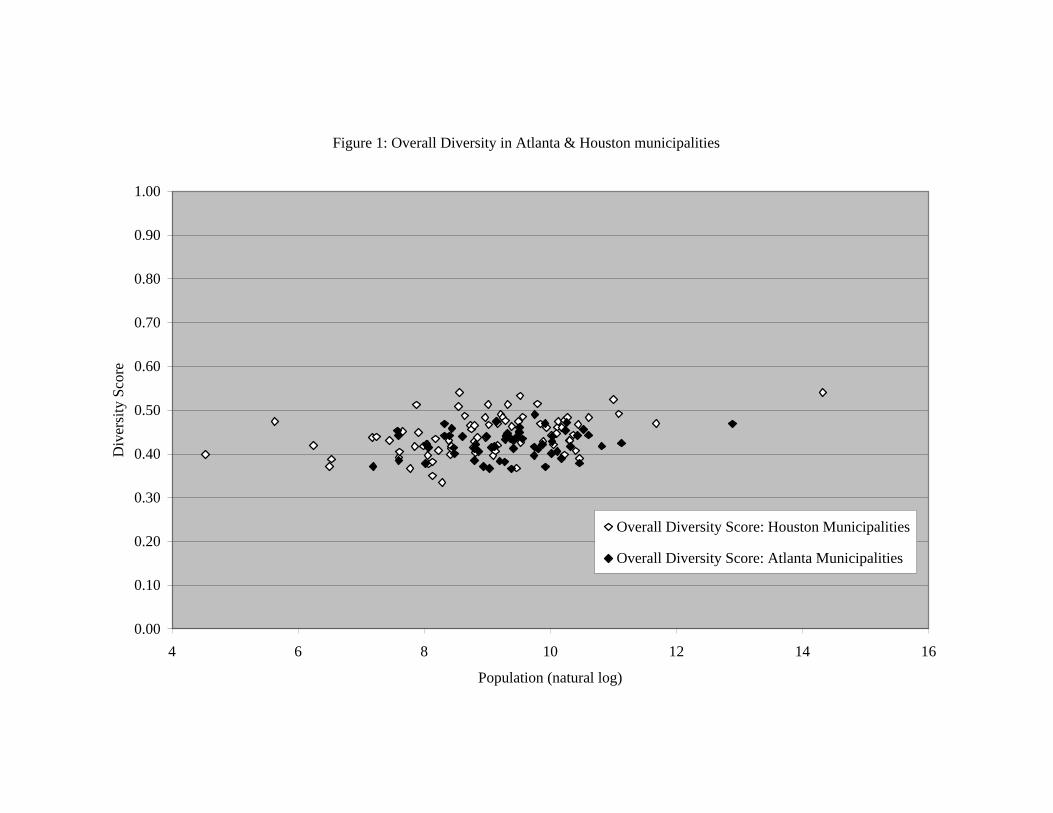
Figure 1: Overall Diversity in Atlanta & Houston municipalities
0.00
0.10
0.20
0.30
0.40
0.50
0.60
0.70
0.80
0.90
1.00
4 6 8 10 12 14 16
Population (natural log)
Div
ersi
ty S
core
Overall Diversity Score: Houston Municipalities
Overall Diversity Score: Atlanta Municipalities
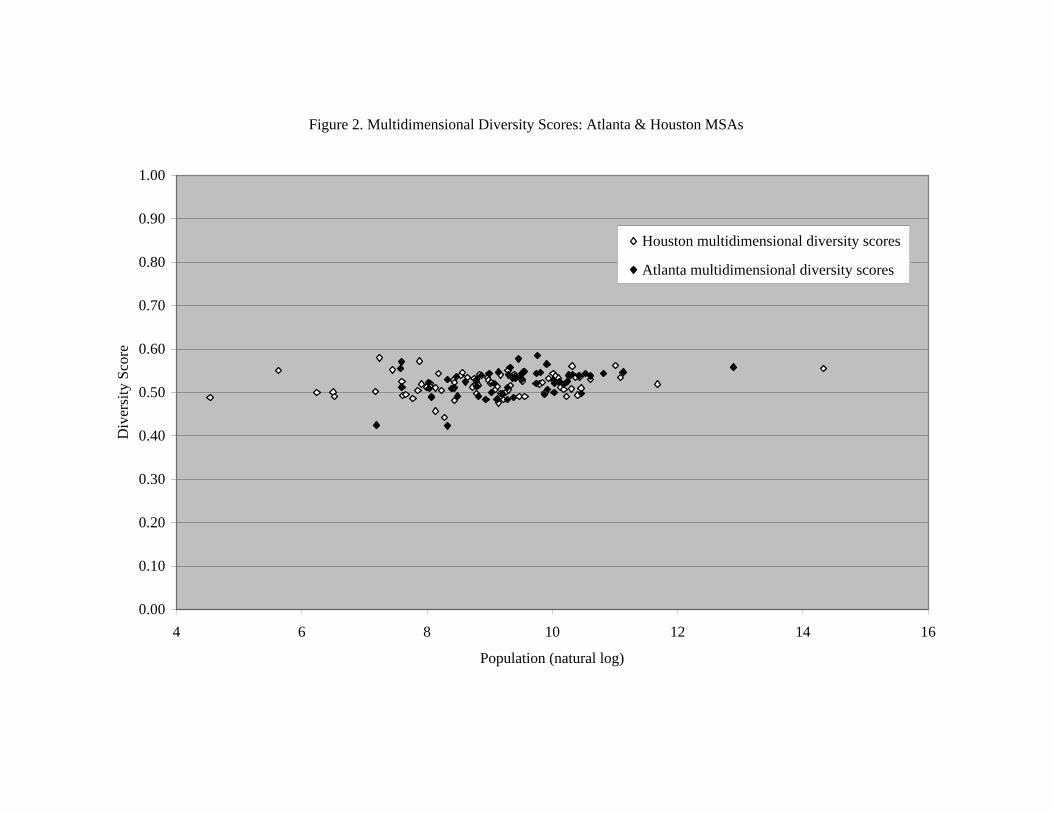
Figure 2. Multidimensional Diversity Scores: Atlanta & Houston MSAs
0.00
0.10
0.20
0.30
0.40
0.50
0.60
0.70
0.80
0.90
1.00
4 6 8 10 12 14 16
Population (natural log)
Div
ersi
ty S
core
Houston multidimensional diversity scores
Atlanta multidimensional diversity scores
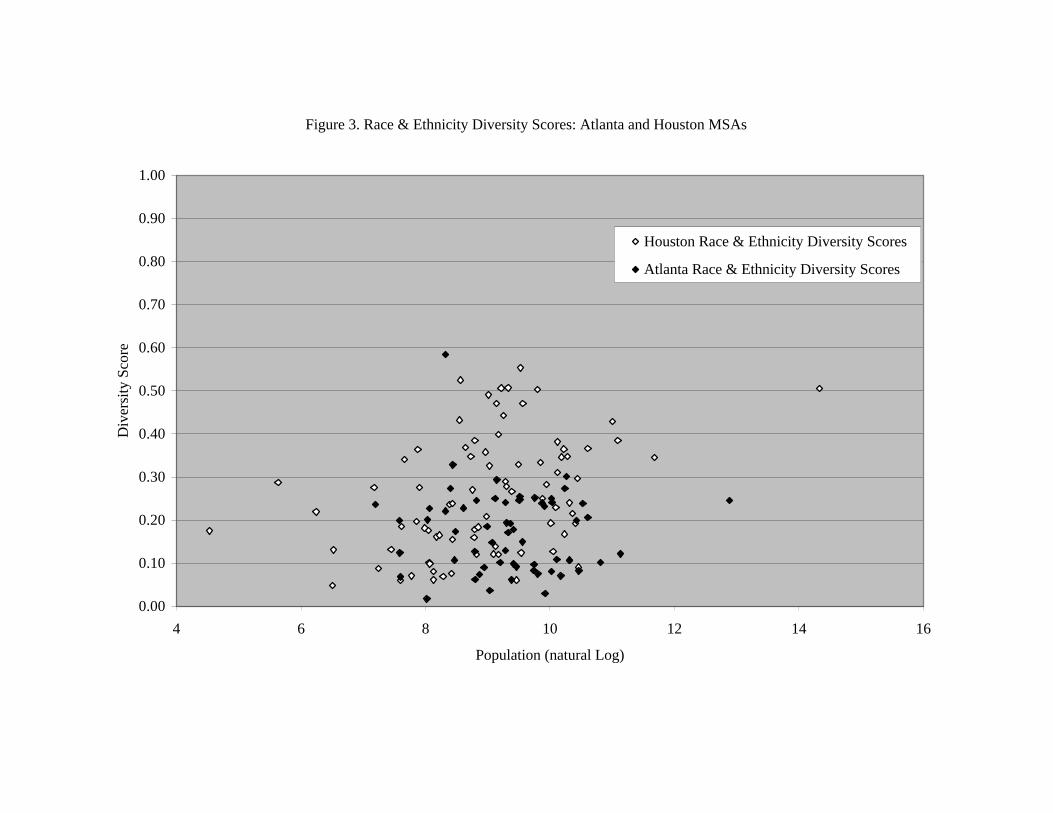
Figure 3. Race & Ethnicity Diversity Scores: Atlanta and Houston MSAs
0.00
0.10
0.20
0.30
0.40
0.50
0.60
0.70
0.80
0.90
1.00
4 6 8 10 12 14 16
Population (natural Log)
Div
ersi
ty S
core
Houston Race & Ethnicity Diversity Scores
Atlanta Race & Ethnicity Diversity Scores

Figure 4: Probability that Overall Divesity Scores are Due to Random Chance: Atlanta & Houston Municipalities by Population
0.000
0.100
0.200
0.300
0.400
0.500
0.600
0.700
0.800
0.900
1.000
8 9 10 11 12 13 14
Municipality Population (Logged)
Prob
abili
ty o
f Ran
dom
ness
Houston: Overall Div. Score Prob. of Randomness
Atlanta Overall Div. Score Prob. of Randomness

Figure 5: Probability that Race & Ethnicity Divesity Scores are Due to Random Chance: Atlanta & Houston Municipalities by Population
0.000
0.100
0.200
0.300
0.400
0.500
0.600
0.700
0.800
0.900
1.000
8 9 10 11 12 13 14
Municipality Population (Logged)
Prob
abili
ty o
f Ran
dom
ness
Houston: R&E Div. Score Prob. of Randomness
Atlanta: R&E Div. Score Prob. of Randomness