Embed Size (px)
Citation preview
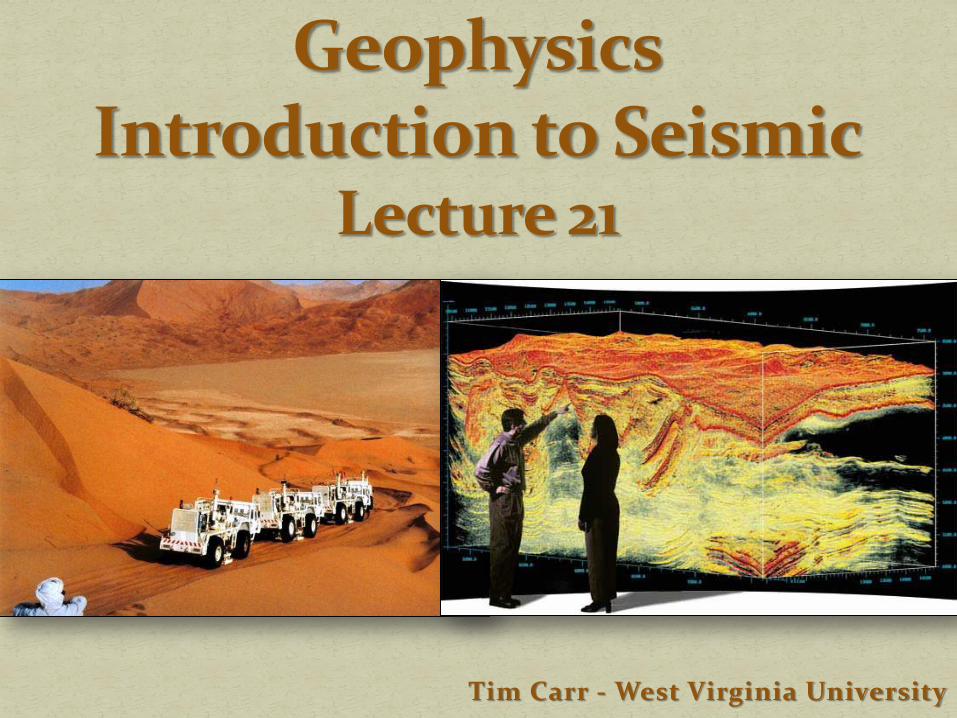
Tim Carr - West Virginia University
Basic Principles
What to Geophysicists Do?
Seismic Acquisition
Seismic Processing
Seismic Interpretation
2
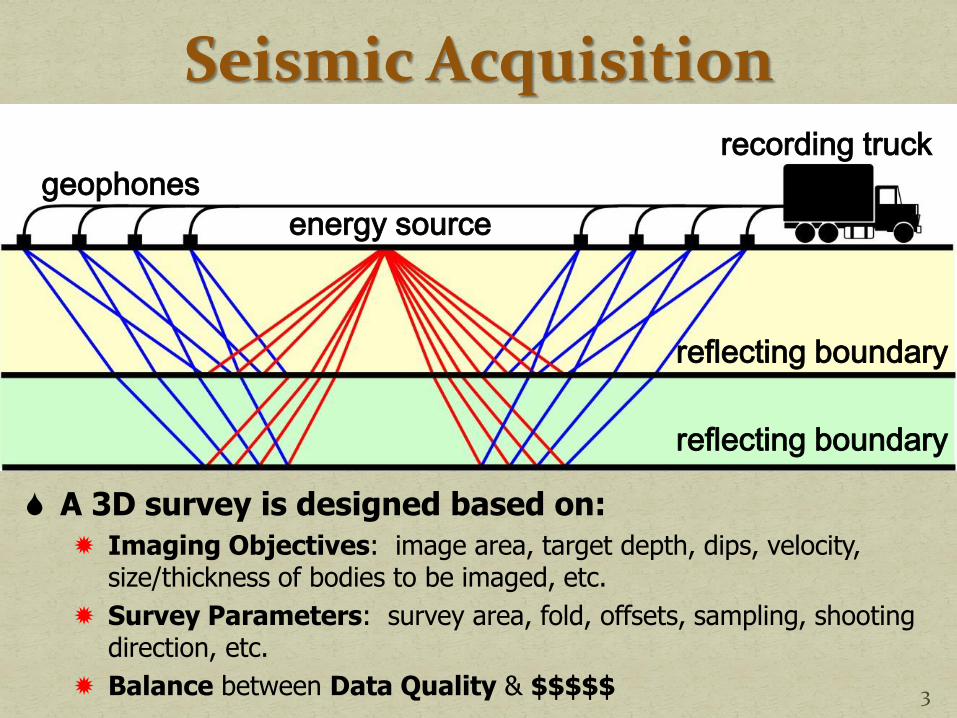
Seismic Acquisition
geophones
recording truck
reflecting boundary
reflecting boundary
energy source
3
A 3D survey is designed based on:
Imaging Objectives: image area, target depth, dips, velocity, size/thickness of bodies to be imaged, etc.
Survey Parameters: survey area, fold, offsets, sampling, shooting direction, etc.
Balance between Data Quality & $$$$$
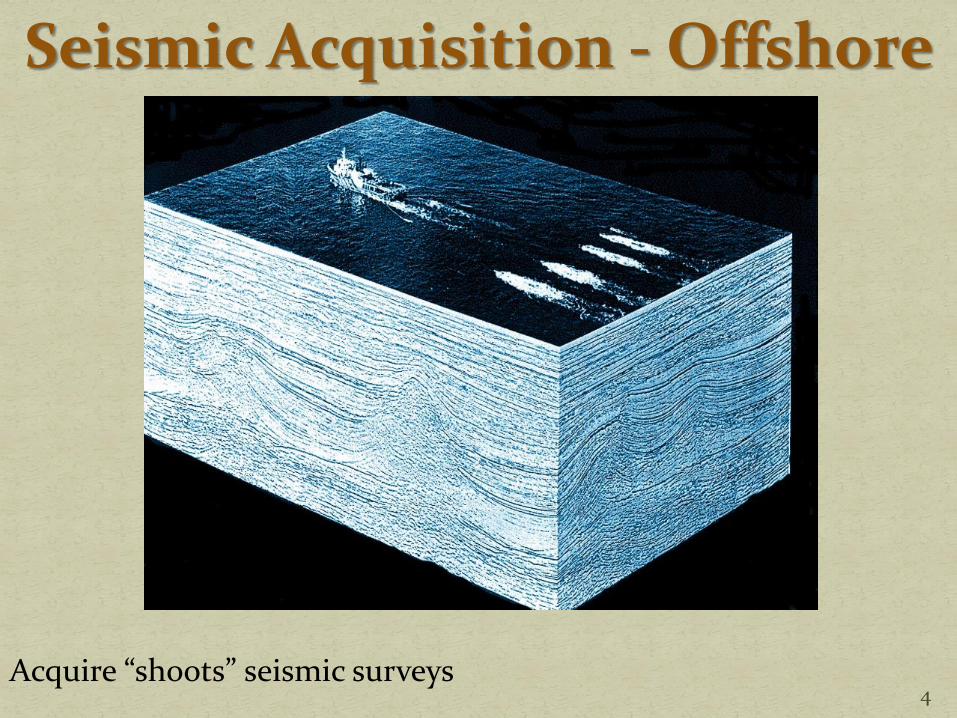
Acquire “shoots” seismic surveys
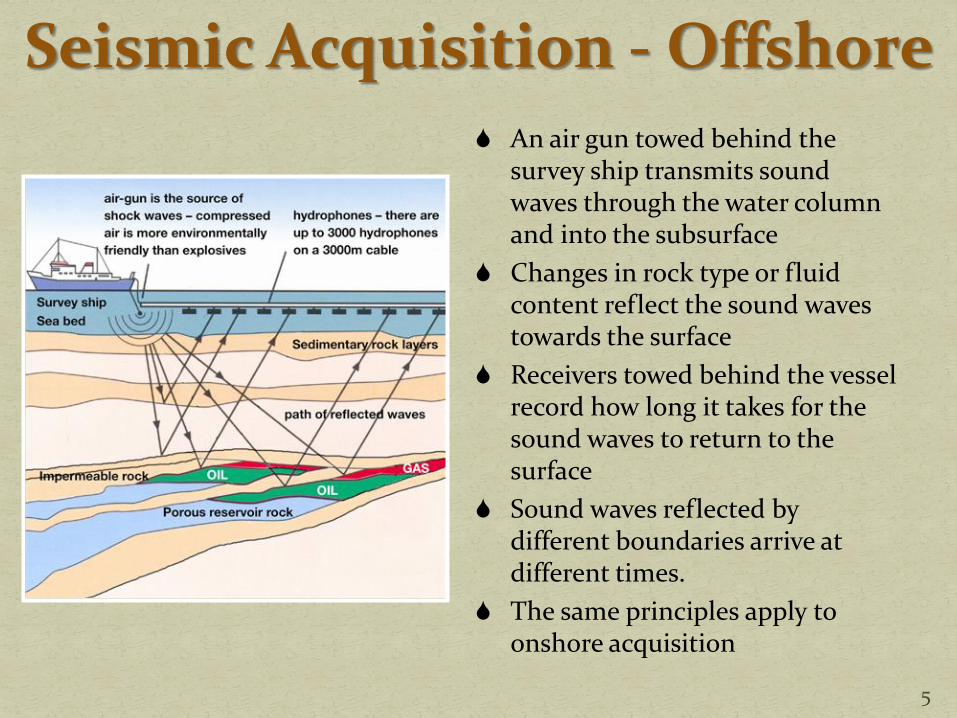
Seismic Acquisition - Offshore
4
•
An air gun towed behind the survey ship transmits sound waves through the water column and into the subsurface
Changes in rock type or fluid content reflect the sound waves towards the surface
Receivers towed behind the vessel record how long it takes for the sound waves to return to the surface
Sound waves reflected by different boundaries arrive at different times.
The same principles apply to onshore acquisition
Seismic Acquisition - Offshore
5
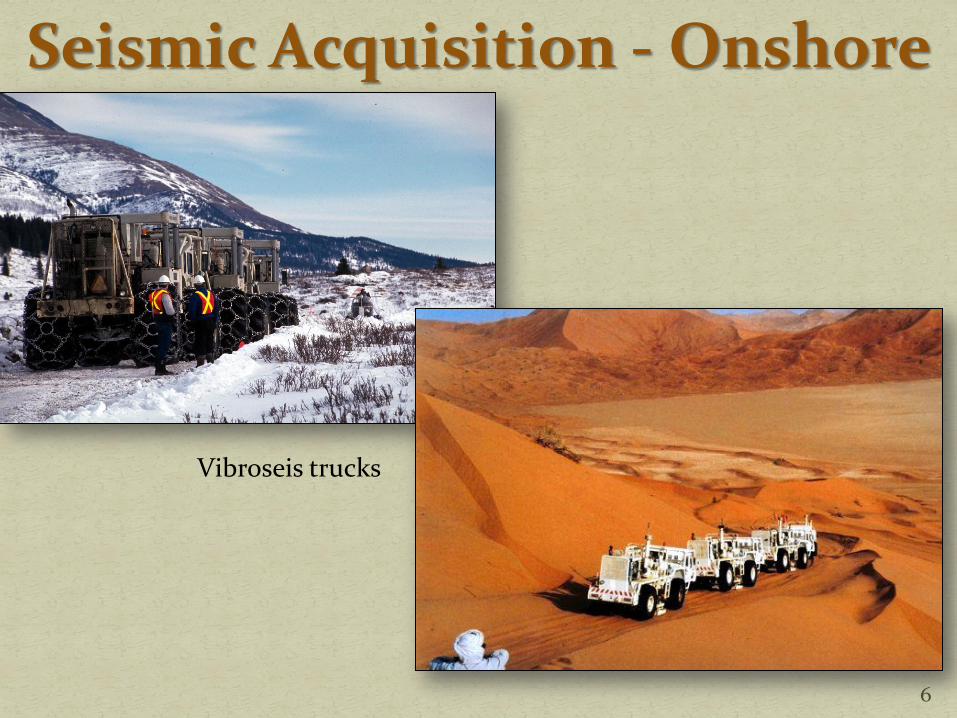
Vibroseis trucks
Seismic Acquisition - Onshore
6
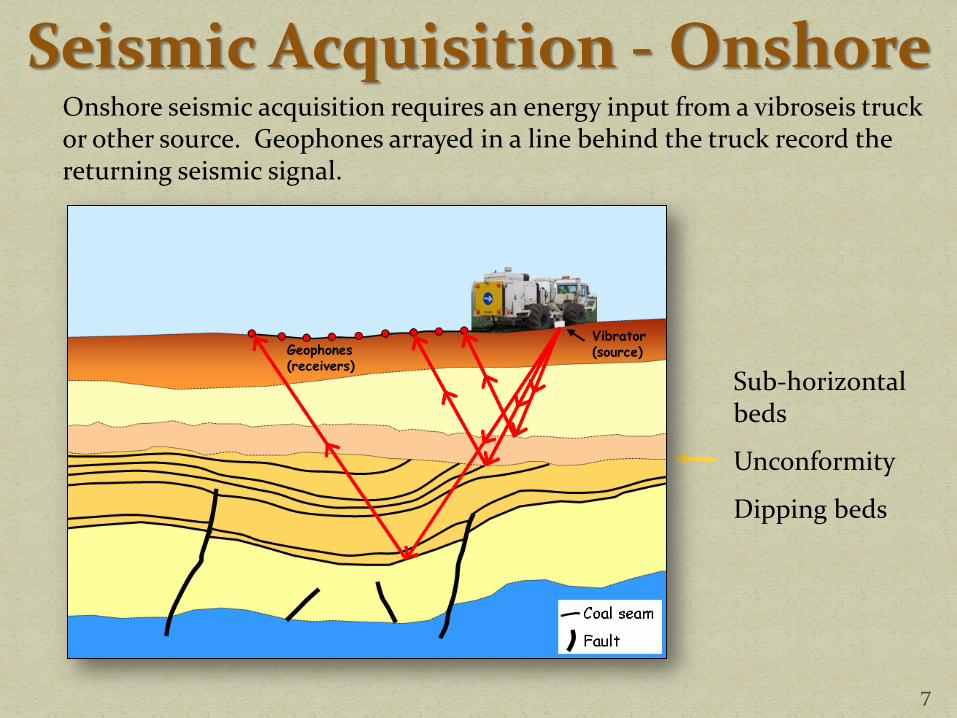
Onshore seismic acquisition requires an energy input from a vibroseis truck or other source. Geophones arrayed in a line behind the truck record the returning seismic signal.
Sub-horizontal beds
Unconformity
Dipping beds
Geophones (receivers)
Vibrator (source)
Seismic Acquisition - Onshore
7
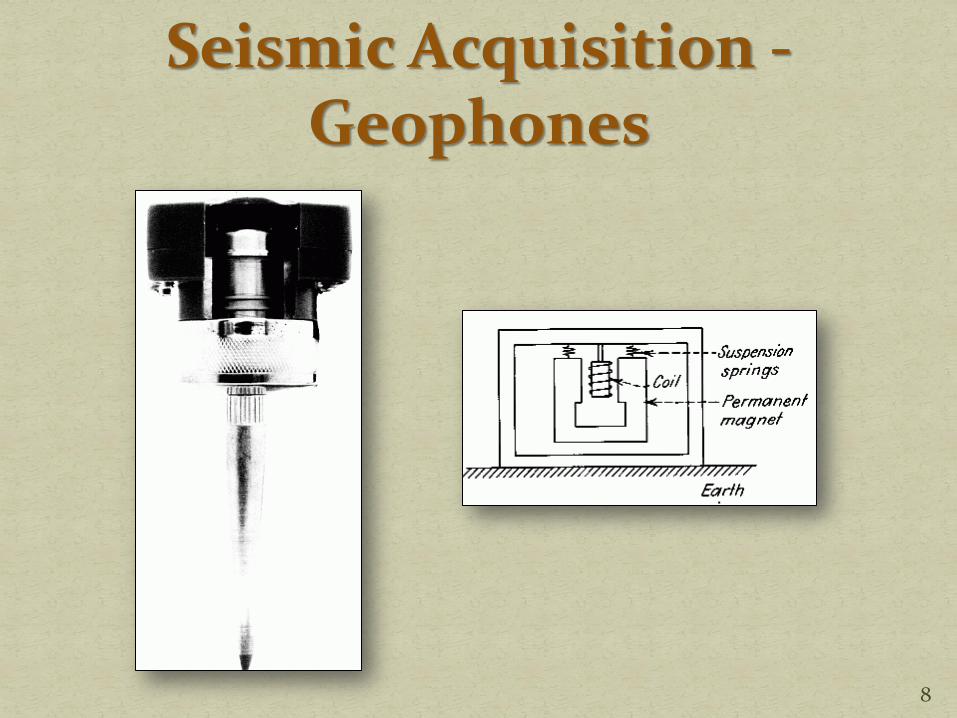
Seismic Acquisition - Geophones
8
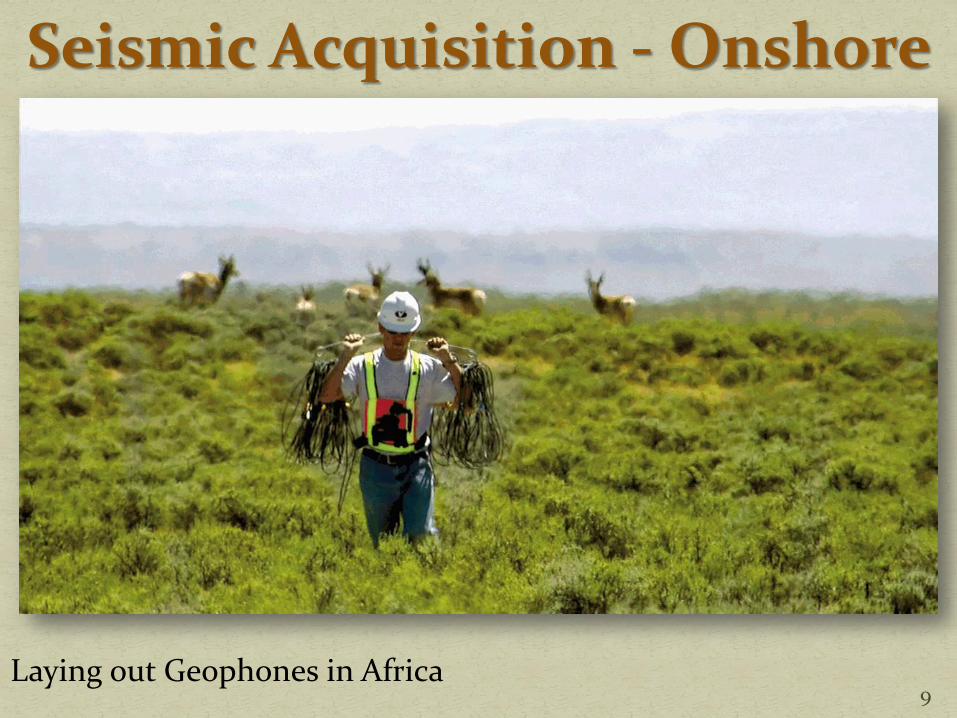
Laying out Geophones in Africa
Seismic Acquisition - Onshore
9
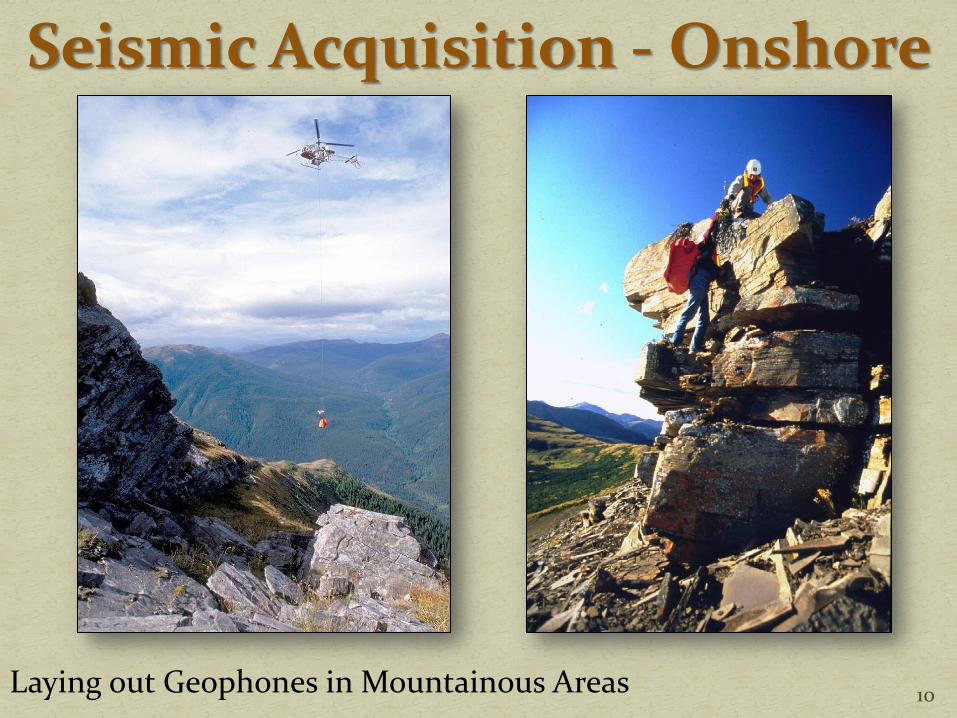
Seismic Acquisition - Onshore
Laying out Geophones in Mountainous Areas 10
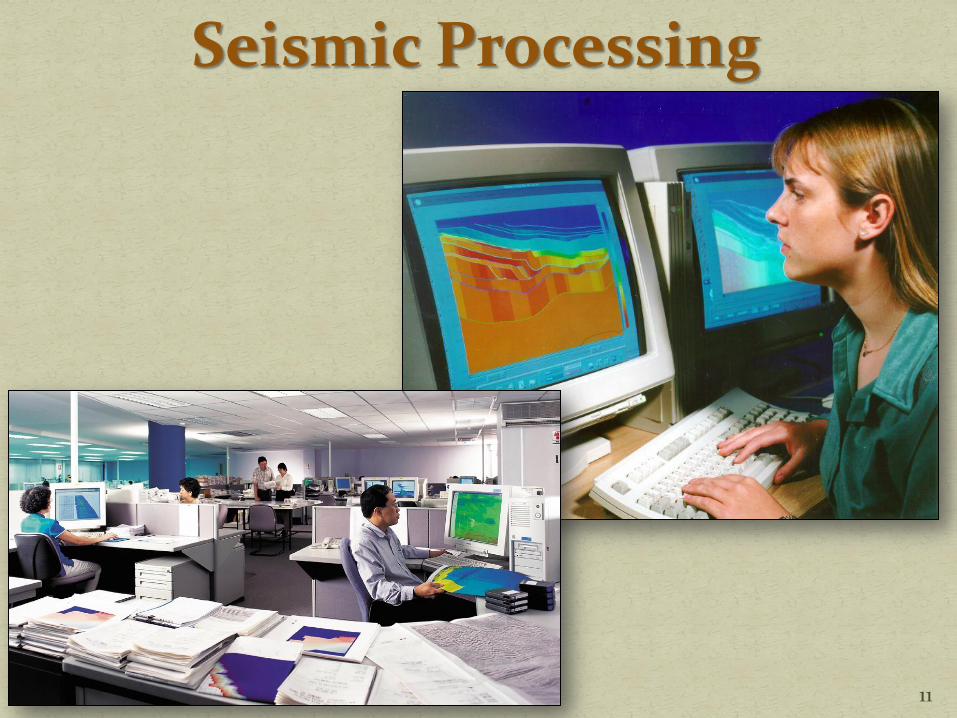
Seismic Processing
11
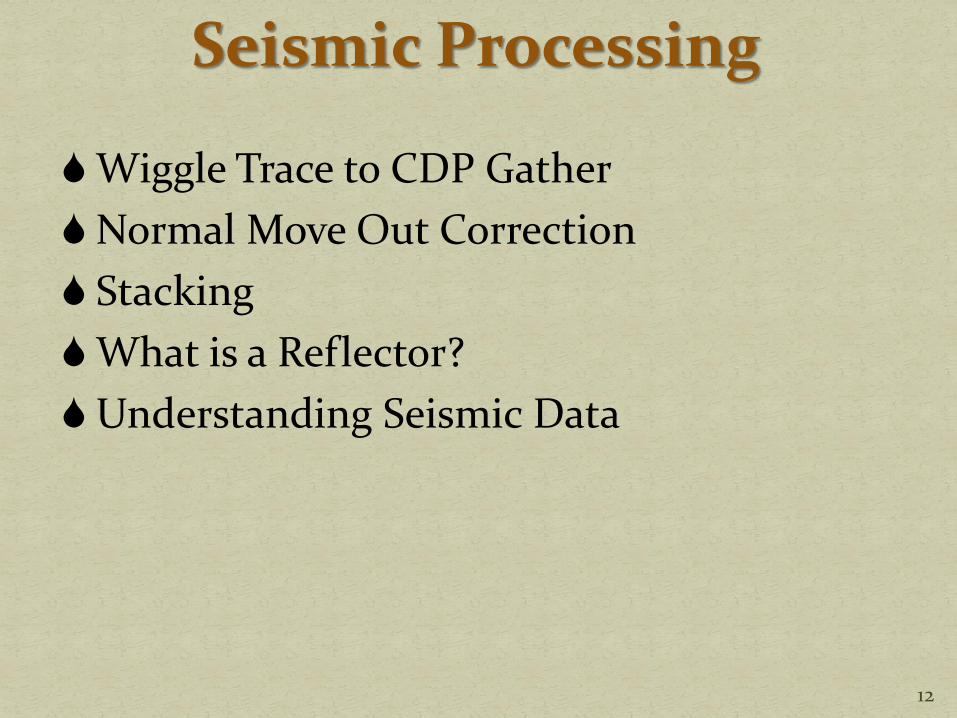
Wiggle Trace to CDP Gather
Normal Move Out Correction
Stacking
What is a Reflector?
Understanding Seismic Data
Seismic Processing
12
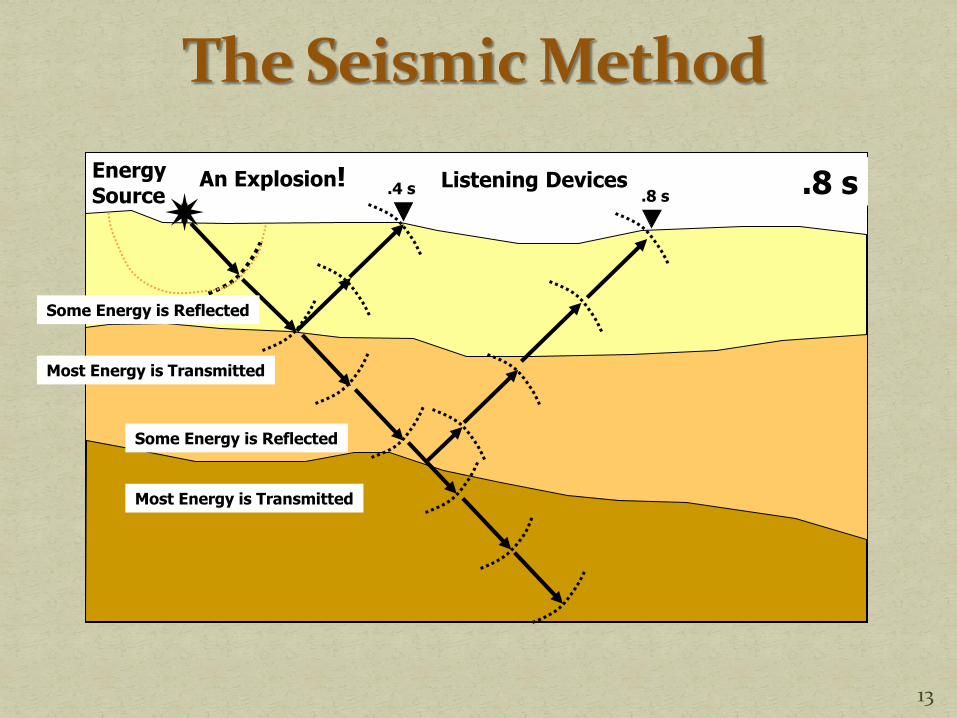
Listening Devices 0 s
An Explosion! 0 s Energy Source .1 s .2 s .3 s
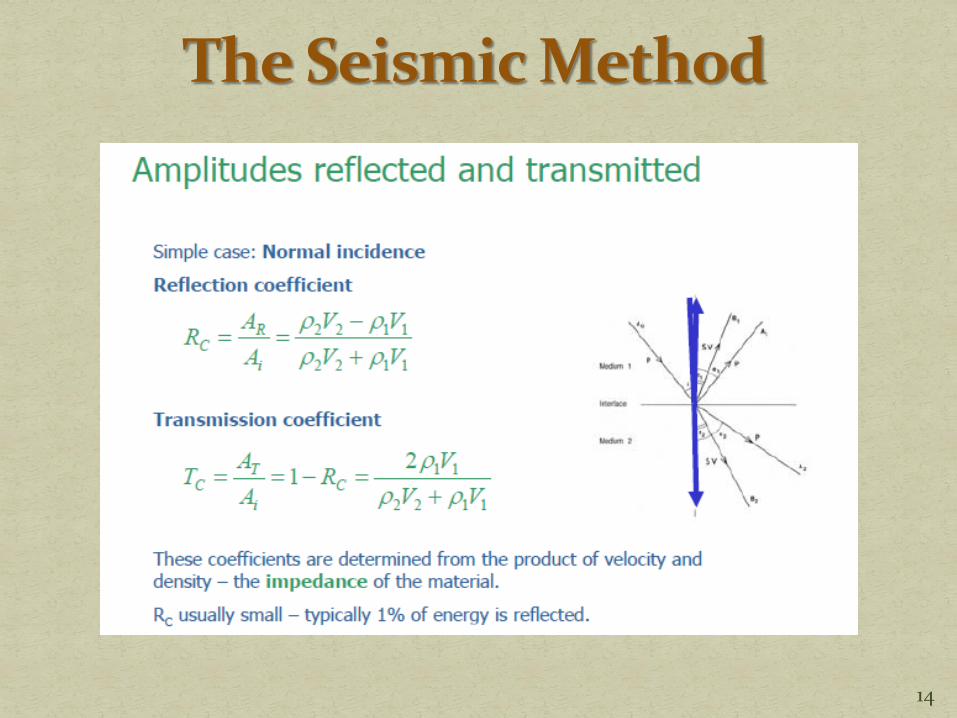
Some Energy is Reflected
Most Energy is Transmitted
.4 s .4 s .5 s
Some Energy is Reflected
Most Energy is Transmitted
.6 s .7 s .8 s .8 s
13
14
Device #1
Device #2
0.0
0.3
0.4
0.5
0.6
0.7
0.8
0.1
0.2
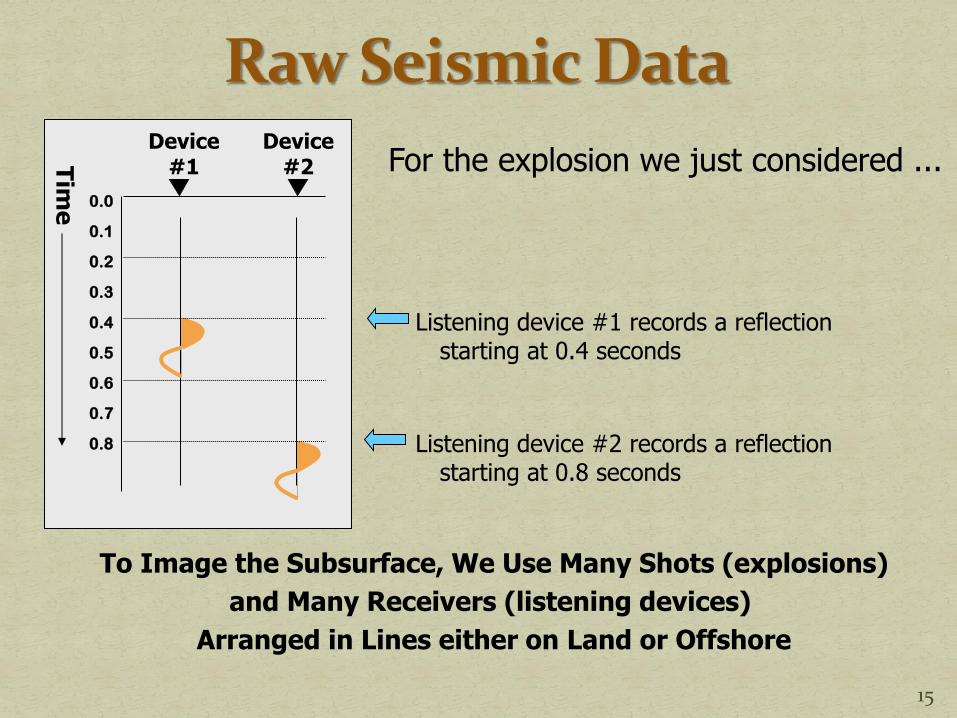
For the explosion we just considered ...
Listening device #1 records a reflection starting at 0.4 seconds
Listening device #2 records a reflection starting at 0.8 seconds
To Image the Subsurface, We Use Many Shots (explosions)
and Many Receivers (listening devices)
Arranged in Lines either on Land or Offshore
Tim
e
15
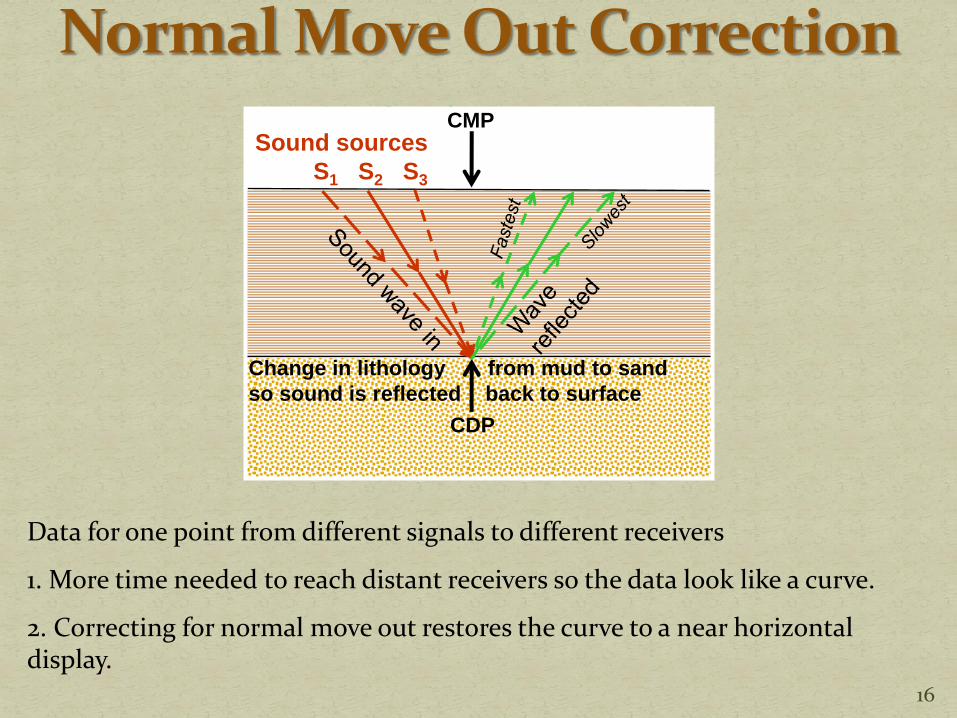
Data for one point from different signals to different receivers
1. More time needed to reach distant receivers so the data look like a curve.
2. Correcting for normal move out restores the curve to a near horizontal display.
Sound receivers
R3 R2 R1
Change in lithology from mud to sand
so sound is reflected back to surface
CDP
CMP Sound sources
S1 S2 S3
16
17
ExxonMobil
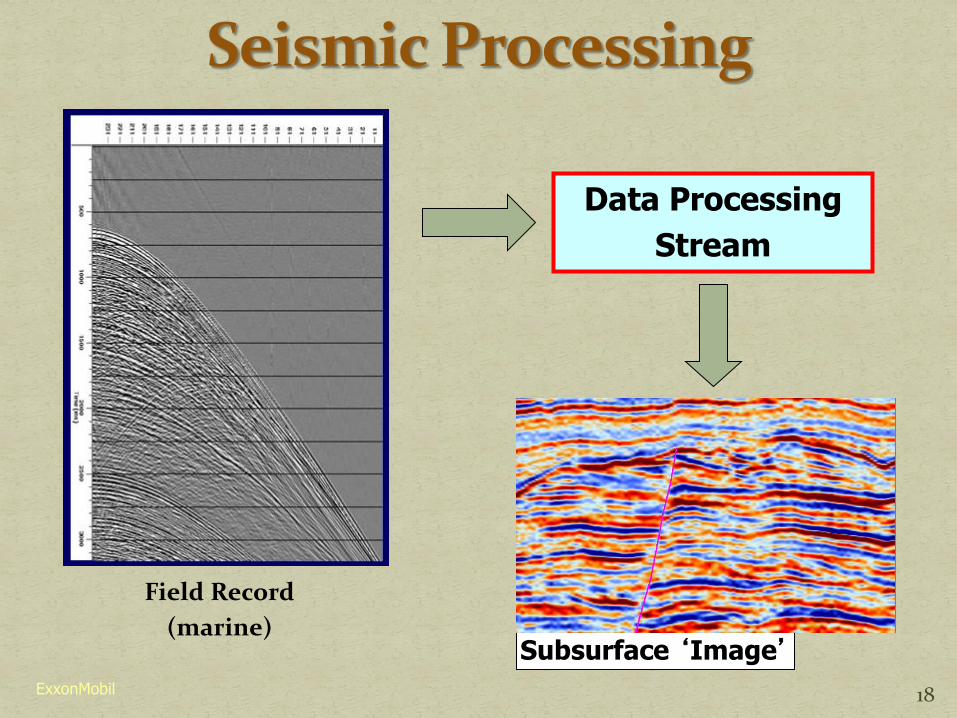
Field Record
(marine)
Data Processing
Stream
Subsurface ‘Image’
18
ExxonMobil
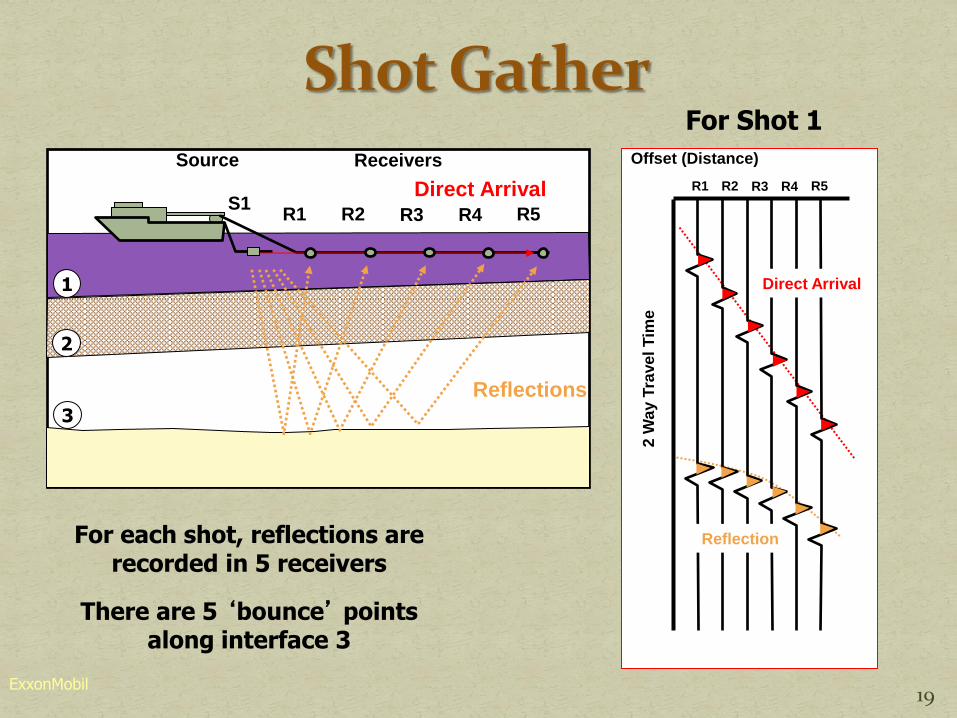
Source Receivers
R1 R2 R3 R4 R5 S1
Direct Arrival
Reflections
2 W
ay T
rave
l T
ime
Offset (Distance)
R1 R2 R3 R4 R5
Direct Arrival
Reflection For each shot, reflections are recorded in 5 receivers
There are 5 ‘bounce’ points along interface 3
1
2
3
For Shot 1
19
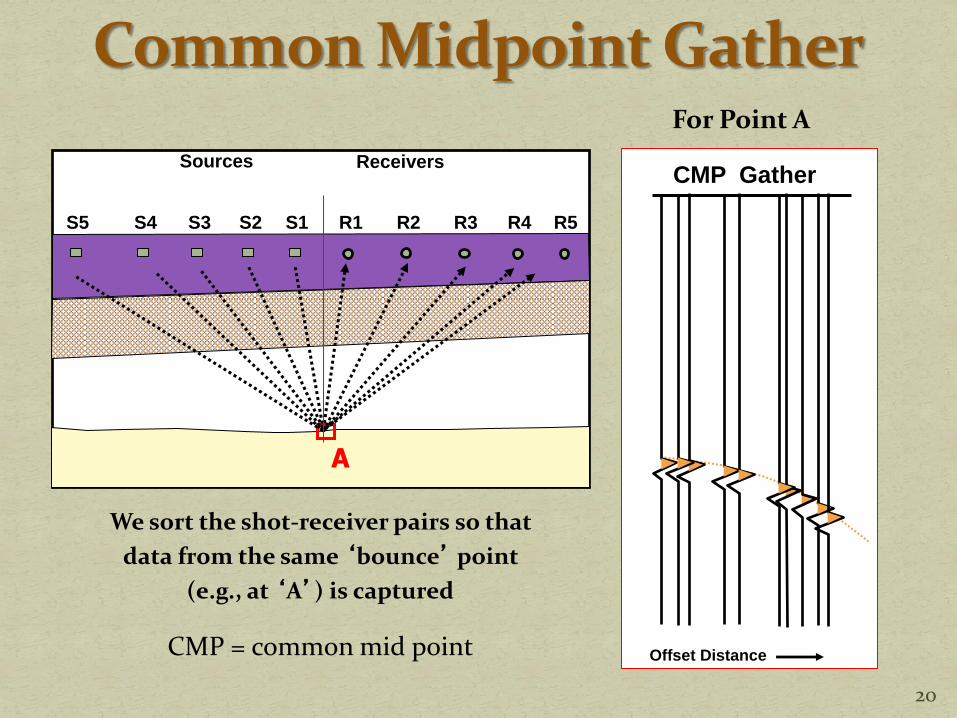
Sources Receivers
R1 R2 R3 R4 R5 S1 S2 S3 S4 S5
We sort the shot-receiver pairs so that
data from the same ‘bounce’ point
(e.g., at ‘A’) is captured
CMP = common mid point
For Point A
A
CMP Gather
Offset Distance
20
21
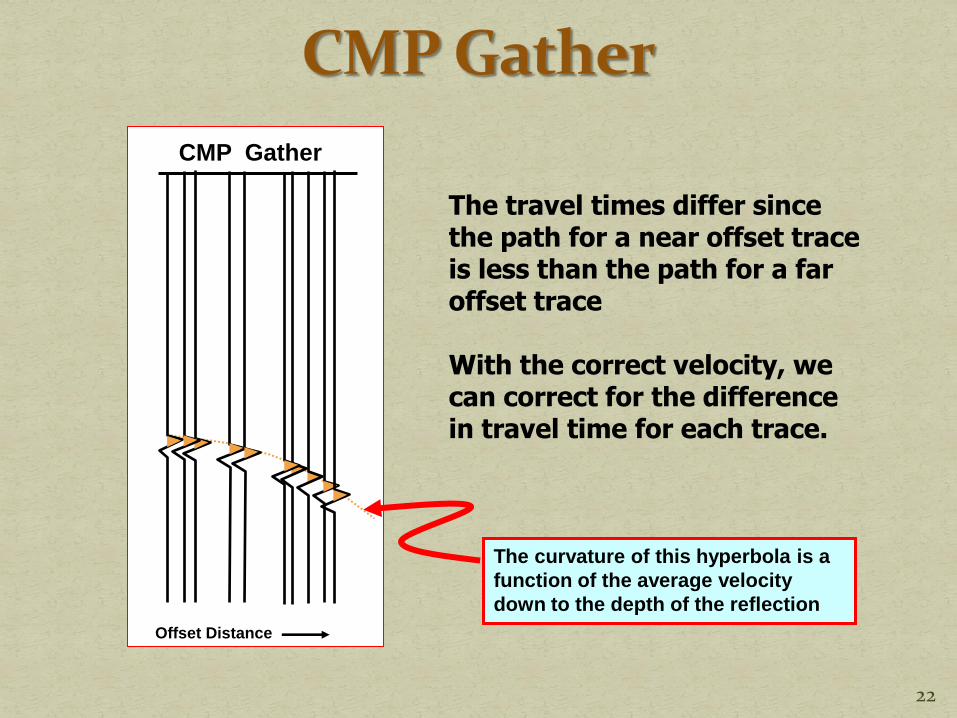
The travel times differ since the path for a near offset trace is less than the path for a far offset trace With the correct velocity, we can correct for the difference in travel time for each trace.
The curvature of this hyperbola is a
function of the average velocity
down to the depth of the reflection
CMP Gather
Offset Distance
22
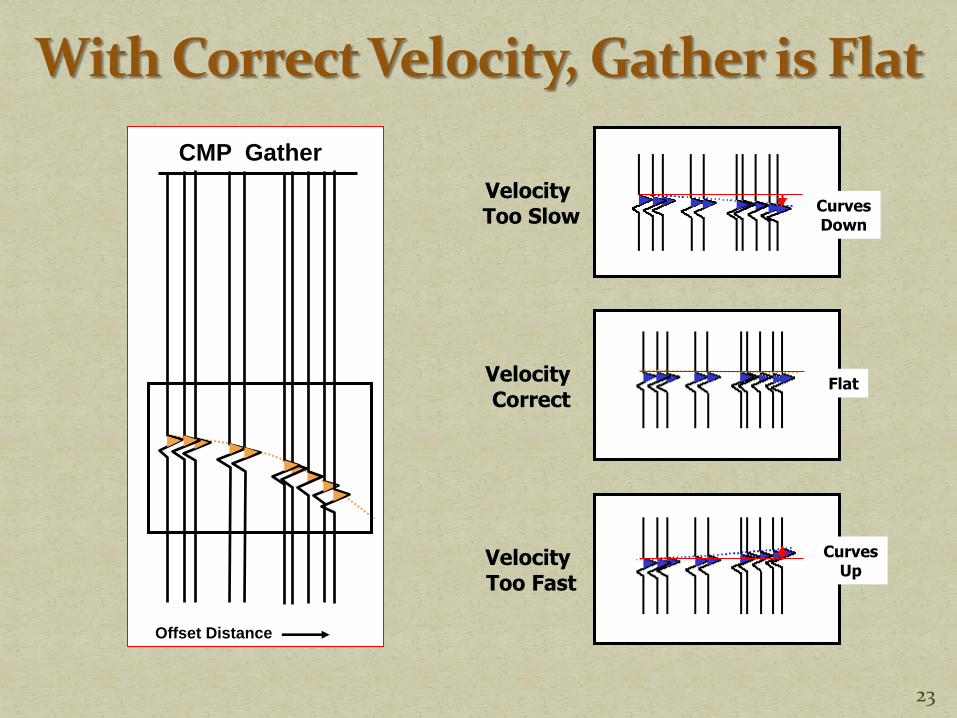
CMP Gather
Offset Distance
Velocity Too Slow
Velocity Correct
Velocity Too Fast
Flat
Curves Down
Curves Up
23
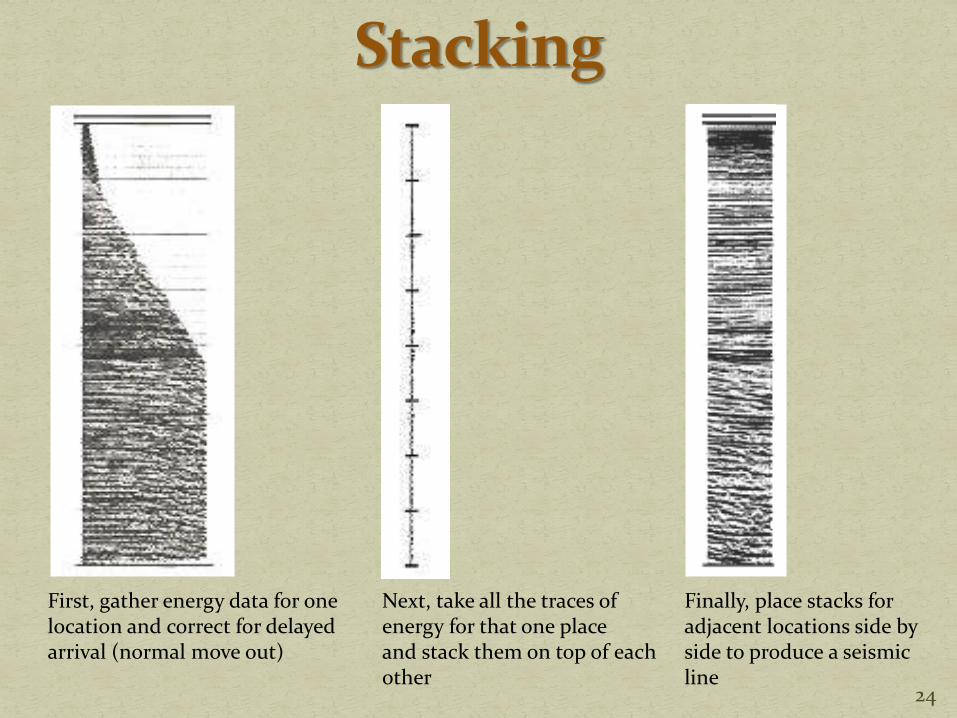
Next, take all the traces of energy for that one place and stack them on top of each other
First, gather energy data for one location and correct for delayed arrival (normal move out)
Finally, place stacks for adjacent locations side by side to produce a seismic line
24
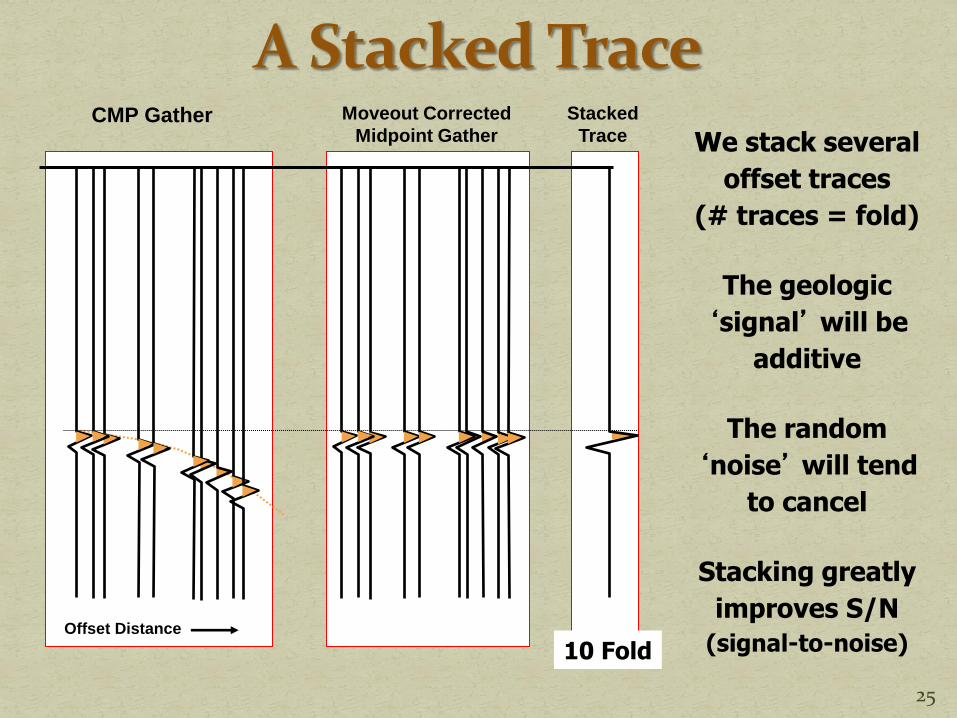
CMP Gather Moveout Corrected
Midpoint Gather
Stacked
Trace
Offset Distance
We stack several
offset traces
(# traces = fold)
The geologic
‘signal’ will be
additive
The random
‘noise’ will tend
to cancel
Stacking greatly
improves S/N
(signal-to-noise) 10 Fold
25
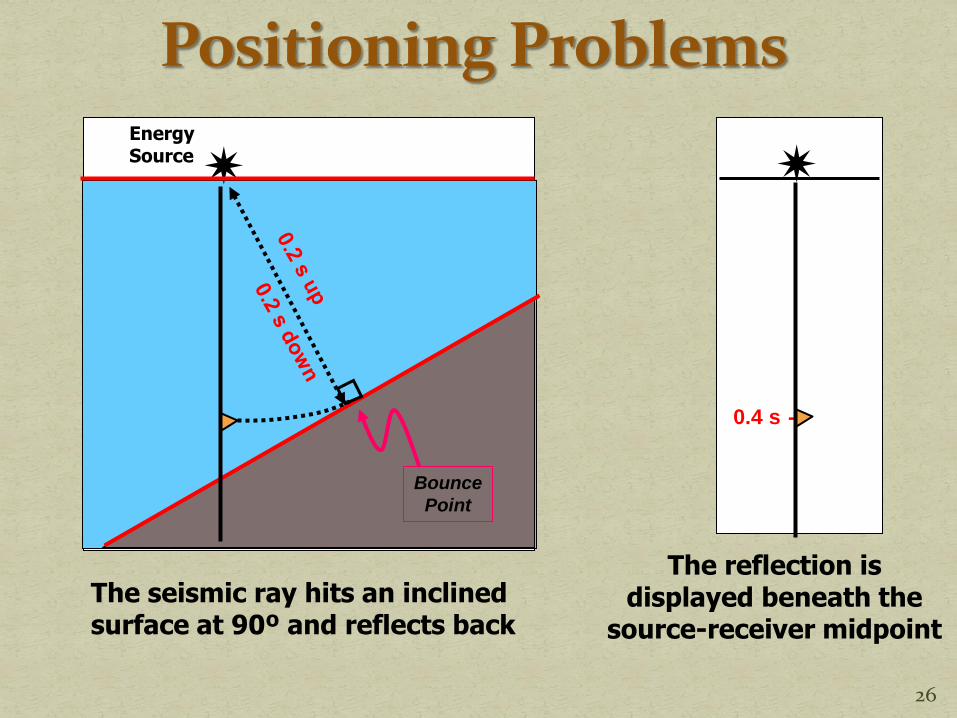
Energy Source
The seismic ray hits an inclined surface at 90º and reflects back
0.4 s -
The reflection is displayed beneath the
source-receiver midpoint
Bounce
Point
26
ExxonMobil
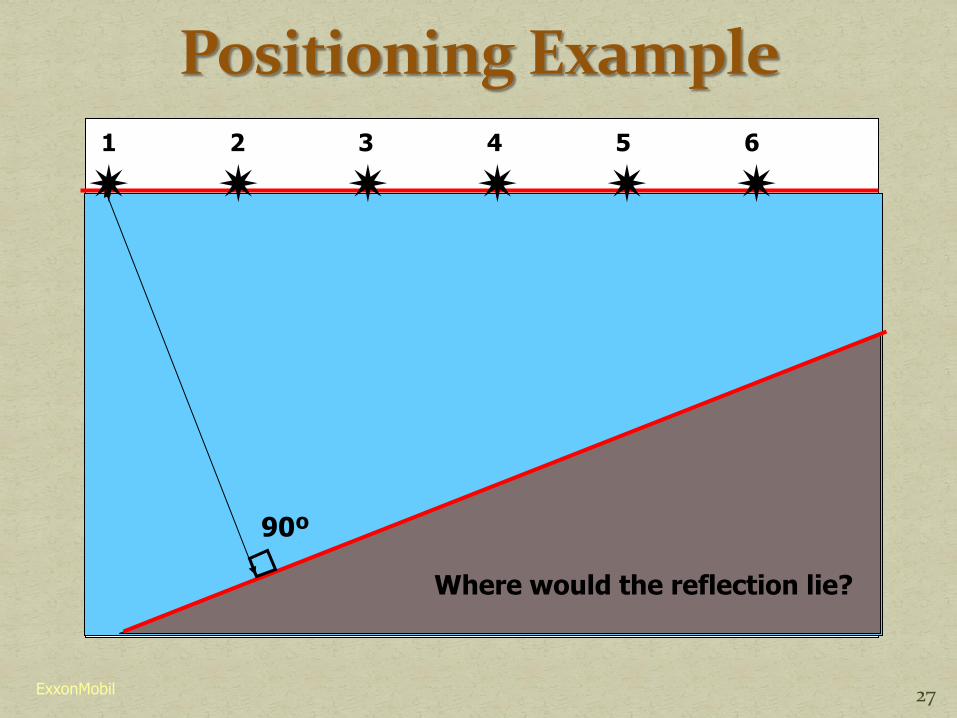
1
2 3 4 6 5
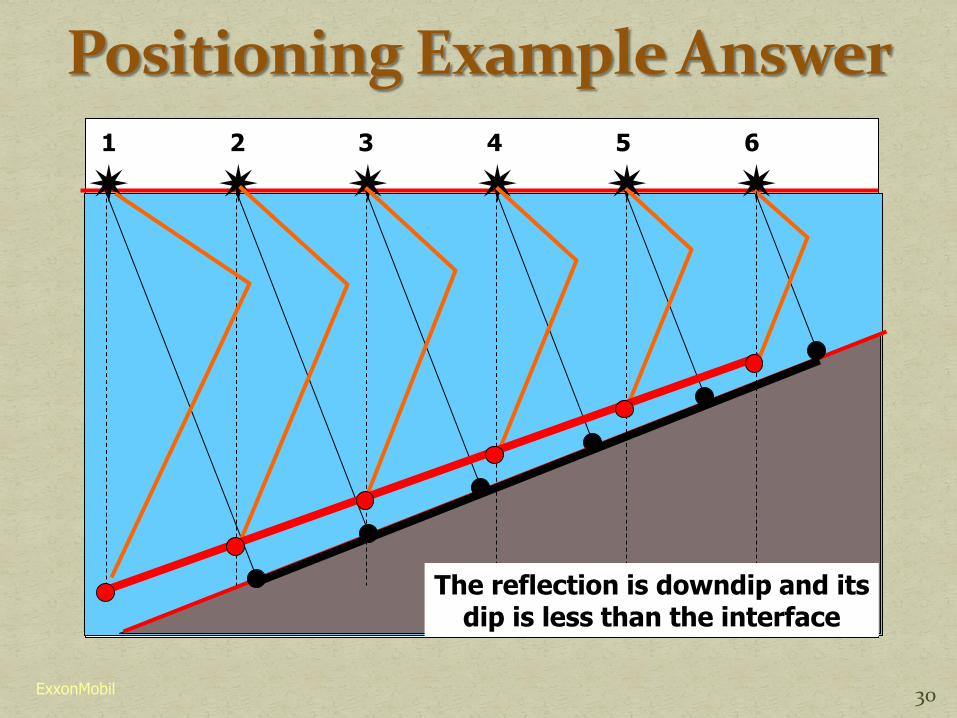
Where would the reflection lie?
90º
27
ExxonMobil
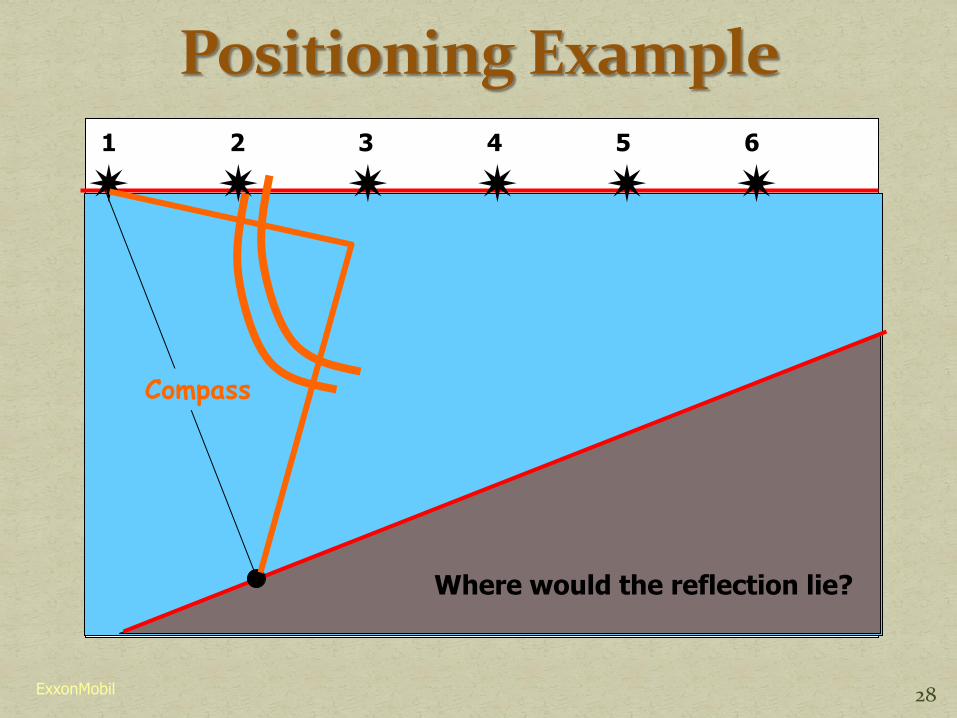
1
2 3 4 6 5
Where would the reflection lie?
Compass
28
ExxonMobil
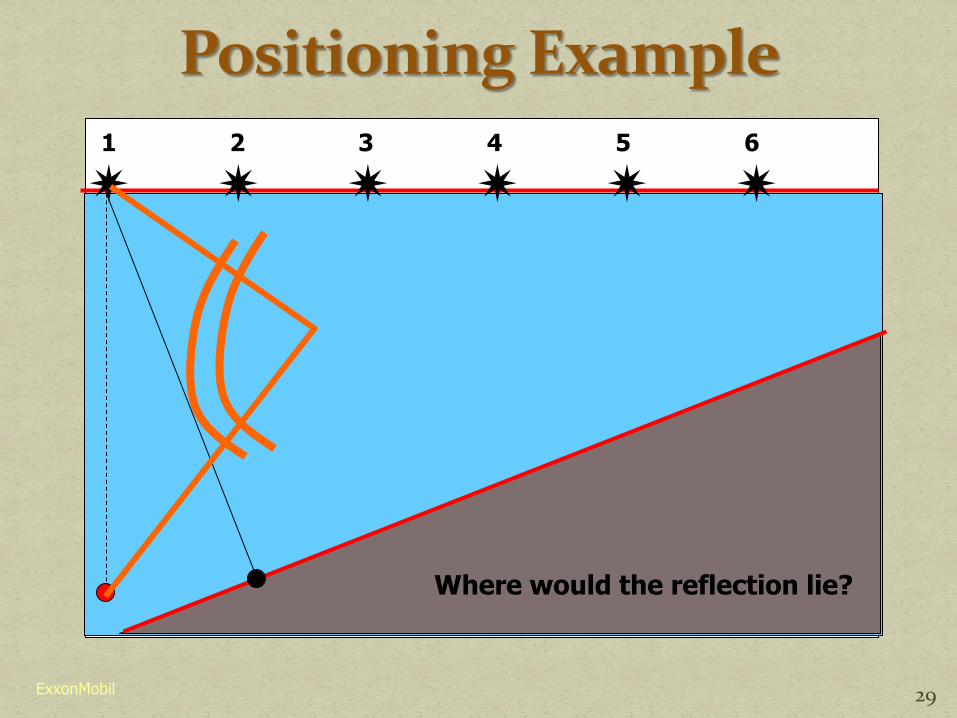
1
2 3 4 6 5
Where would the reflection lie?
29
ExxonMobil
1
2 3 4 6 5
The reflection is downdip and its dip is less than the interface
30
ExxonMobil
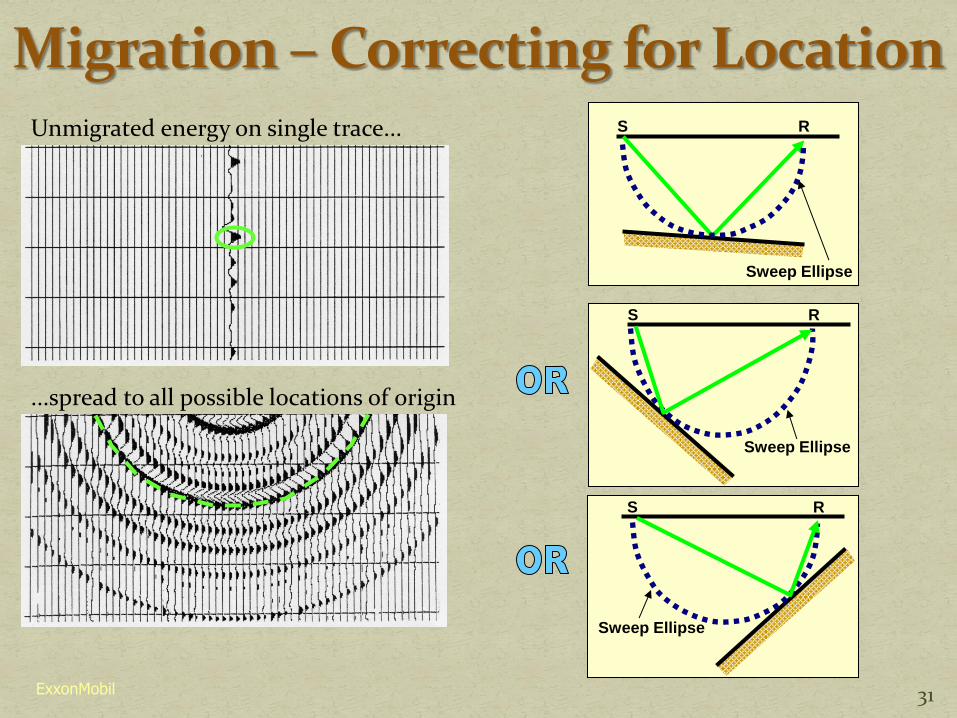
Sweep Ellipse
S R Unmigrated energy on single trace...
...spread to all possible locations of origin
S R
Sweep Ellipse
S R
Sweep Ellipse
31
ExxonMobil
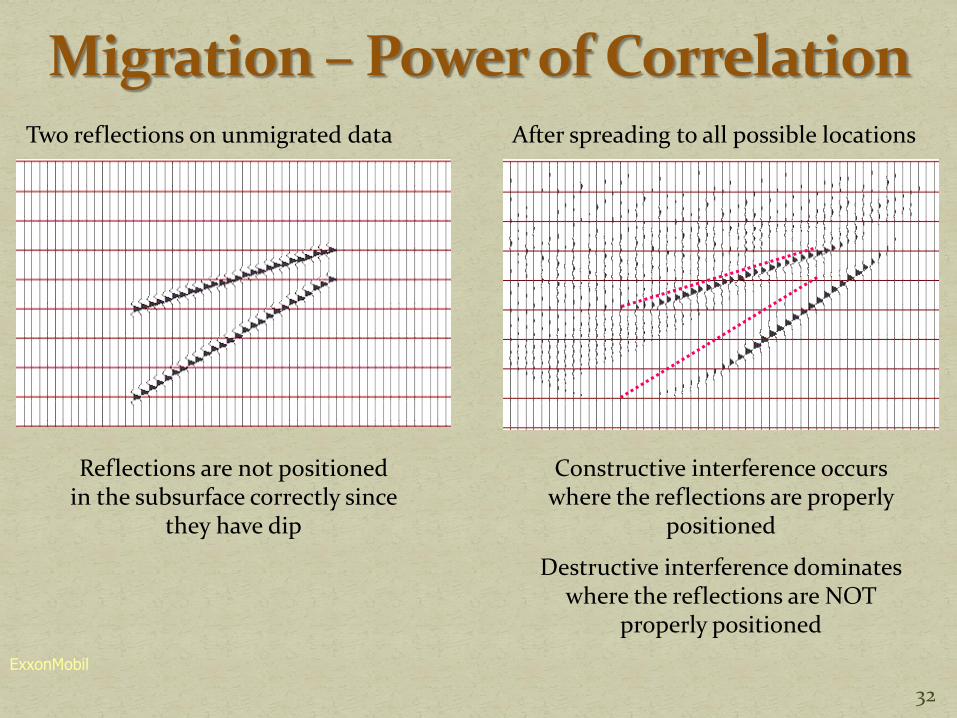
Two reflections on unmigrated data After spreading to all possible locations
Reflections are not positioned in the subsurface correctly since
they have dip
Constructive interference occurs where the reflections are properly
positioned
Destructive interference dominates where the reflections are NOT
properly positioned
32
L 5 – Seismic Method Courtesy of ExxonMobil
Seismic Migration
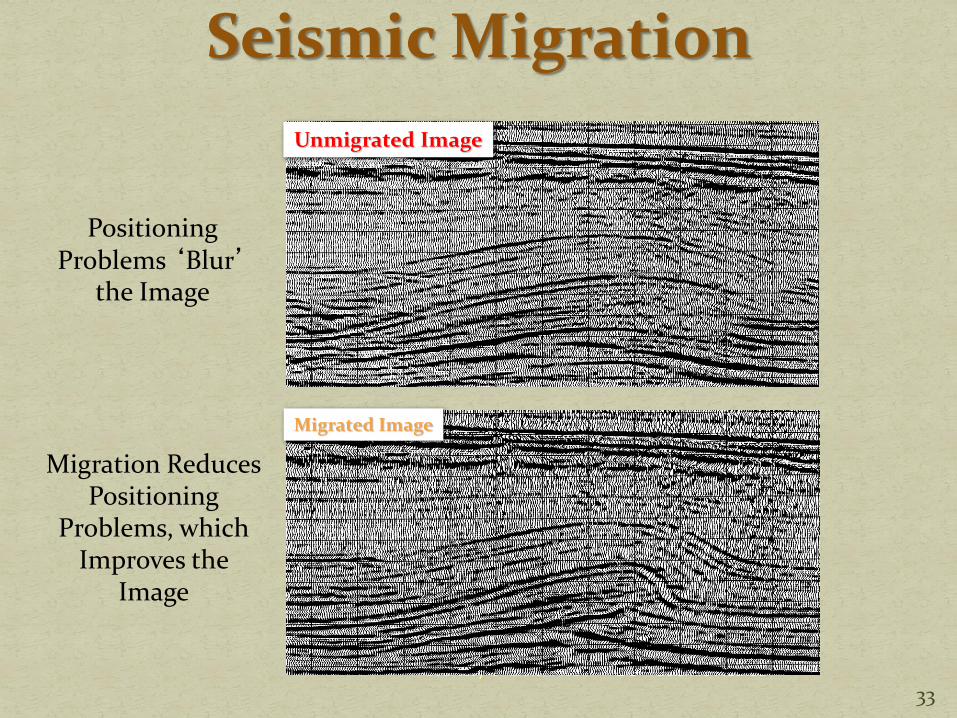
Unmigrated Image
Migrated Image
Positioning Problems ‘Blur’
the Image
Migration Reduces Positioning
Problems, which Improves the
Image
33
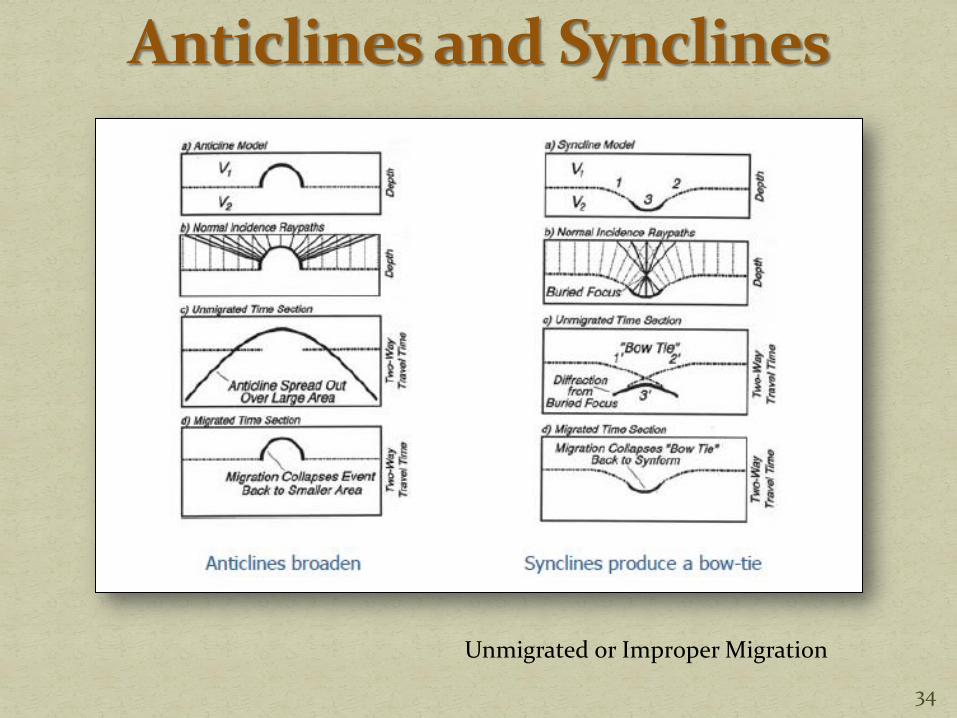
34
Unmigrated or Improper Migration
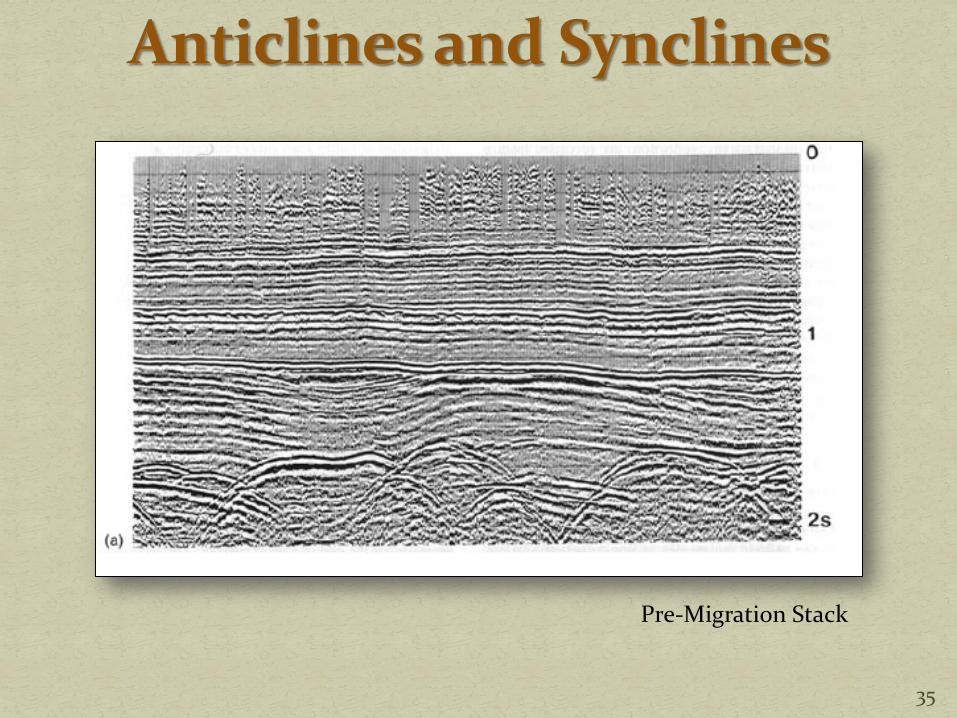
35
Pre-Migration Stack
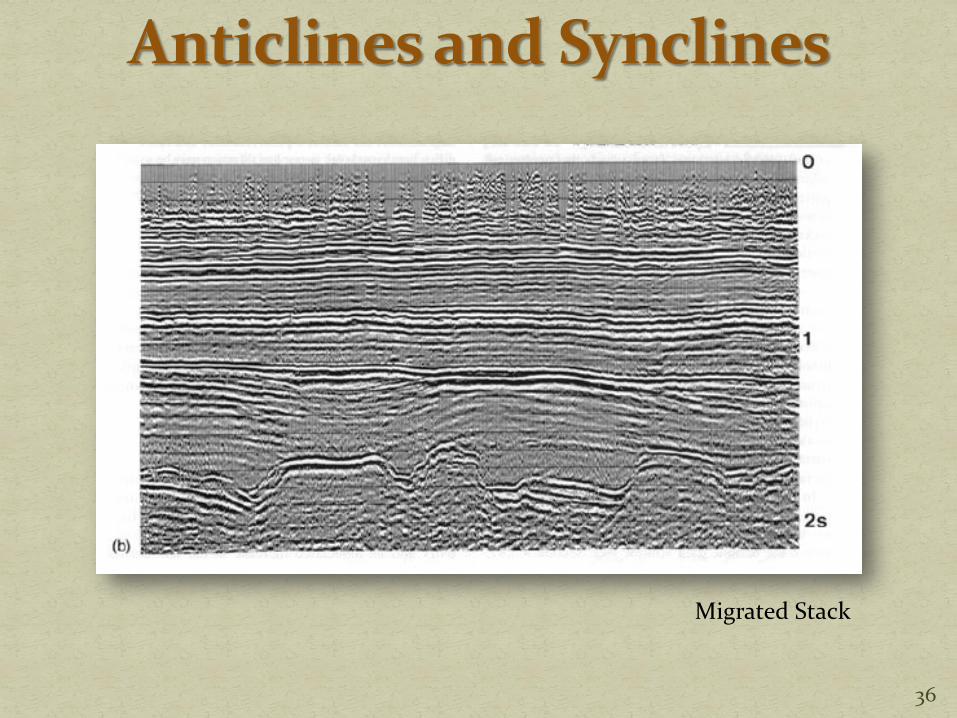
36
Migrated Stack
37
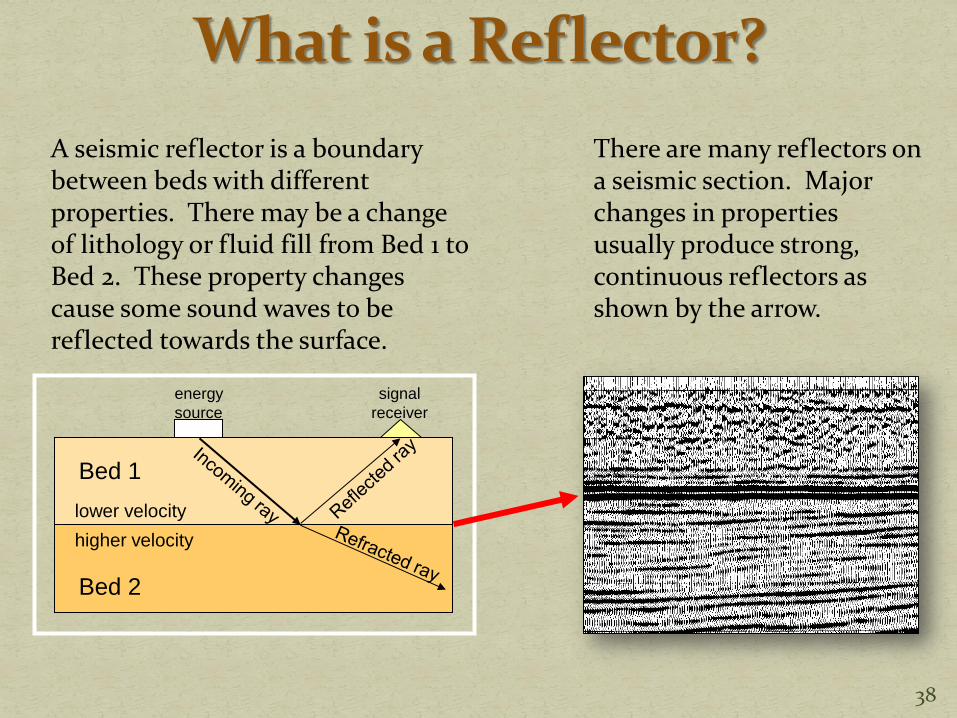
There are many reflectors on a seismic section. Major changes in properties usually produce strong, continuous reflectors as shown by the arrow.
A seismic reflector is a boundary between beds with different properties. There may be a change of lithology or fluid fill from Bed 1 to Bed 2. These property changes cause some sound waves to be reflected towards the surface.
Bed 1
Bed 2
lower velocity
higher velocity
energy
source
signal
receiver
38
Seismic Data Requires Careful Acquisition
Processing
Interpretation
Power of Stacking and Migration Improves Signal to Noise
Improves Resolution
A Seismic Reflector is Boundary Between Beds of Different Properties Relates to Lithology – Density and Velocity
39

40
Assignments Reading for this week
Stoker et al., 1997
Complete the Log Exercises by Wednesday (3/18) Archie
Correlation
Discuss Current Energy Events Read Today in Energy for Tuesday (3/17) at
http://www.eia.gov/
Be Prepared to Discuss in Class - Wednesday
Discussion Leader – Melissa Fahnestock
Quiz – Wednesday 3/18 1:00pm closes Friday 3/20 1:00pm Homework handed out on Wednesday (3/20) due Monday
(3/30)
No Class on Friday (3/20)