Embed Size (px)
Citation preview
1
TIME ALLOCATION AND WELL-BEING MEASUREMENT
Miroslava Knapková, Miriam Martinkovičová
1. Introduction
This text is an output from the online workshop organized by the Faculty of Economics,
Matej Bel University in Banská Bystrica, as part of the IVF project no. 22110433 „Does well-
being matter? Higher education teachers during Covid-19 pandemic“. The workshop took place
on September 24, 2021, through the MS TEAMS platform. This text is the first one from a set
of texts within the project. Its main goal is to present the main ideas that were presented at the
workshop, focusing mainly on the methodological aspects of determining and measuring time
allocation, linking time use and well-being in general, but also specifically during the Covid-
19 pandemic.
2. Quantitative and qualitative research
In this part, the basic principle of the scientific research are discussed. Research
methodology is the specific procedures or techniques used to identify, select, process, and
analyze information about a topic. In a research paper, the methodology section allows the
reader to critically evaluate a study’s overall validity and reliability. The methodology section
answers two main questions: How was the data collected or generated? How was it analyzed?
(Wilkinsan, 2002).
The scientific research can be divided in five main groups:
1. Basic research, called also primary or academic research. Its main aim is to recognize what
brings the evolution of the essence of science;
2
2. Applied research (called also commercial research). By it means one can recognize the use
and application of knowledge in practice, it examines practical issues, it's on-demand research;
3. Theoretical research is based on deduction, analysis of concepts and theories and does not
work with empirical data. The problem is processed theoretically, as part of „desk study“;
4. Empirical research works with specific empirical data about phenomena and processes
which was obtained in practice;
5. Survey or exploration is less complex and systematic, maps and helps to orientate in
problem, it does not build theory, it has not hypotheses.
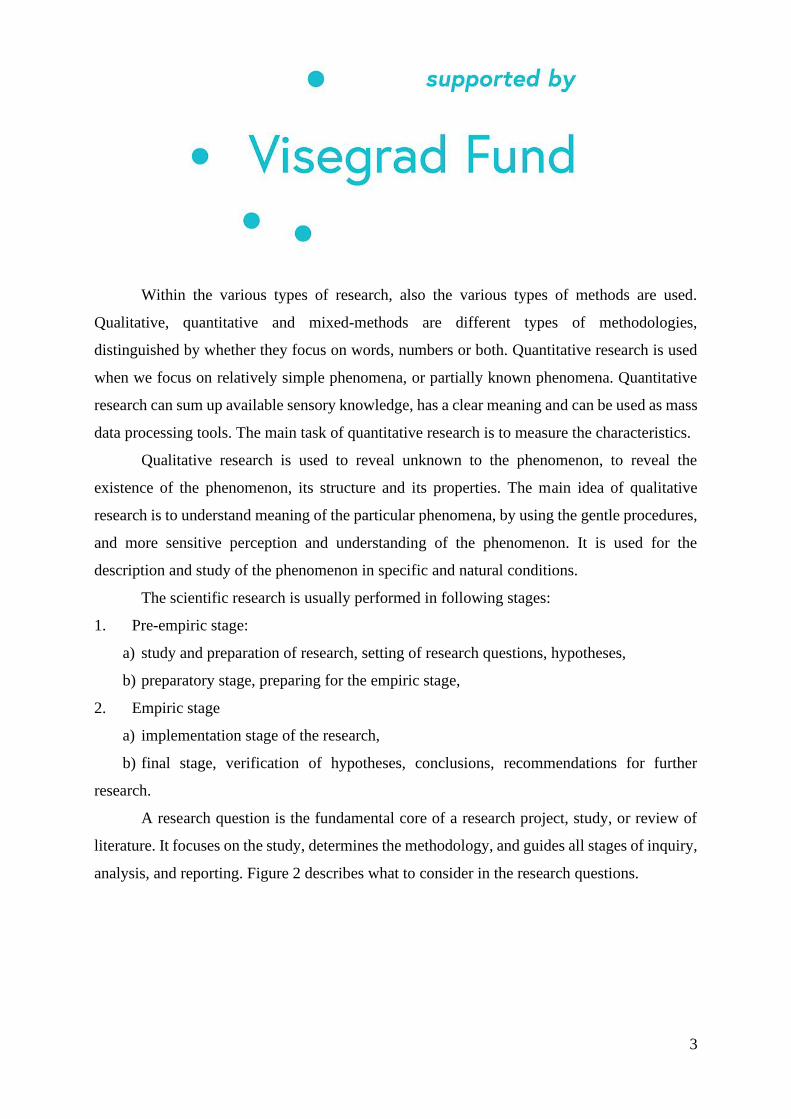
In general, one can describe research as a cognitive process which is deliberate,
organized and targeted. The research background is displayed in the Figure 1.
Figure 1 Background of the research
3
Within the various types of research, also the various types of methods are used.
Qualitative, quantitative and mixed-methods are different types of methodologies,
distinguished by whether they focus on words, numbers or both. Quantitative research is used
when we focus on relatively simple phenomena, or partially known phenomena. Quantitative
research can sum up available sensory knowledge, has a clear meaning and can be used as mass
data processing tools. The main task of quantitative research is to measure the characteristics.
Qualitative research is used to reveal unknown to the phenomenon, to reveal the
existence of the phenomenon, its structure and its properties. The main idea of qualitative
research is to understand meaning of the particular phenomena, by using the gentle procedures,
and more sensitive perception and understanding of the phenomenon. It is used for the
description and study of the phenomenon in specific and natural conditions.
The scientific research is usually performed in following stages:
1. Pre-empiric stage:
a) study and preparation of research, setting of research questions, hypotheses,
b) preparatory stage, preparing for the empiric stage,
2. Empiric stage
a) implementation stage of the research,
b) final stage, verification of hypotheses, conclusions, recommendations for further
research.
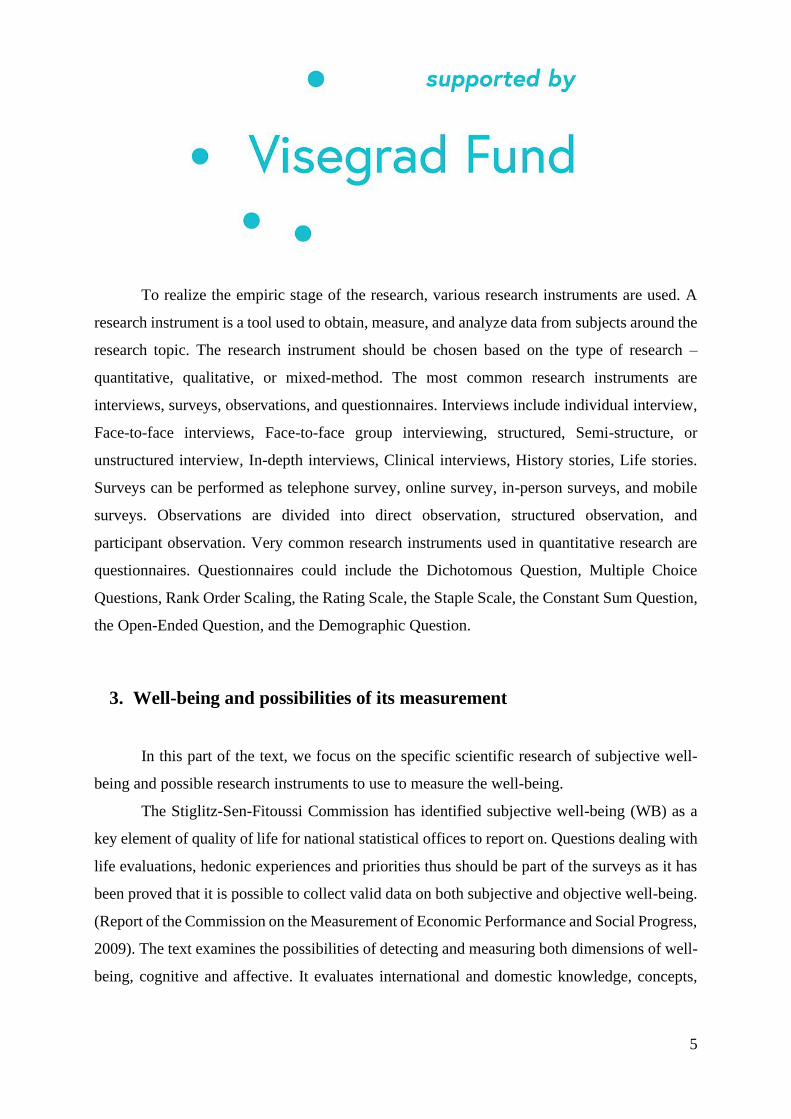
A research question is the fundamental core of a research project, study, or review of
literature. It focuses on the study, determines the methodology, and guides all stages of inquiry,
analysis, and reporting. Figure 2 describes what to consider in the research questions.
4
Figure 2 What to include in research question.
Effectively set research question can help to focus on that part of the research problem
which will be investigated ( causes, parts, context....). It can also help to identify variables.
There is not only one answer to research question, as the analysed problem has several
aspects. That is why it is necessary to identify, which aspect/s will be examined. All the aspect/s
should be real and probable.
Research questions are detailly elaborated by research hypotheses. To set a good
hypothesis, one should follow following golden rules:
1. Hypothesis is a statement. It is expressed with a notification sentence. At the end of the
research, we must accept or refuse this statement;
2. The hypothesis expresses the existence of a phenomenon/ problem, or/and attributes of
the phenomenon/problem, or/and the existence of a relationship between variables;
3. Hypotheses must be tested. Their variables must be measurable or testable.
5
To realize the empiric stage of the research, various research instruments are used. A
research instrument is a tool used to obtain, measure, and analyze data from subjects around the
research topic. The research instrument should be chosen based on the type of research –
quantitative, qualitative, or mixed-method. The most common research instruments are
interviews, surveys, observations, and questionnaires. Interviews include individual interview,
Face-to-face interviews, Face-to-face group interviewing, structured, Semi-structure, or
unstructured interview, In-depth interviews, Clinical interviews, History stories, Life stories.
Surveys can be performed as telephone survey, online survey, in-person surveys, and mobile
surveys. Observations are divided into direct observation, structured observation, and
participant observation. Very common research instruments used in quantitative research are
questionnaires. Questionnaires could include the Dichotomous Question, Multiple Choice
Questions, Rank Order Scaling, the Rating Scale, the Staple Scale, the Constant Sum Question,
the Open-Ended Question, and the Demographic Question.
3. Well-being and possibilities of its measurement
In this part of the text, we focus on the specific scientific research of subjective well-
being and possible research instruments to use to measure the well-being.
The Stiglitz-Sen-Fitoussi Commission has identified subjective well-being (WB) as a
key element of quality of life for national statistical offices to report on. Questions dealing with
life evaluations, hedonic experiences and priorities thus should be part of the surveys as it has
been proved that it is possible to collect valid data on both subjective and objective well-being.
(Report of the Commission on the Measurement of Economic Performance and Social Progress,
2009). The text examines the possibilities of detecting and measuring both dimensions of well-
being, cognitive and affective. It evaluates international and domestic knowledge, concepts,
6
methods and results of research in this field. Also summarizes the most widely used methods
for measuring well-being.
3.1 Problems with the approaches and measurement
The problem with measurement of WB is most visible when measuring the quality of
life using one question, such as: “If you reflect upon your life and personal situation, how
satisfied are you with your life as a whole?” (Cummins et al., 2003). This global assessment is
so global that it is impossible to identify the respective share of emotional evaluation and
cognitive judgement in it, and above all, it is not possible to determine, what part of life reality
a person reflected upon at the moment of responding to this question. Such measurement is
loaded with another undesirable characteristic – it is strongly determined by the current
emotional state of the respondent: how a person feels at the moment considerably determines
their response to the question of overall satisfaction.
While the concept of quality of life has been developed in the context of social sciences
and medicine, the subjective wellbeing is originally a psychological concept. Diener (1984,
2000) is the author of the most preferred theory of subjective wellbeing, in which the subjective
wellbeing consists of two components:
(1) emotional and affective component – hedonistic orientation,
(2) cognitive evaluation component – eudamonistic, wider social orientation.
The emotional component can be divided into two partial components – positive and
negative affect. Cognitive evaluation component includes global (general) life satisfaction and
satisfaction with various specific areas of life. For explanation of the emotional component and
as a theoretical background for its measurement we use circumplex model of affective reactions
(Watson, Clark a Tellegen, 1988) that can be reduced to two independent dimensions: positive
7
and negative affect. When measured, the positive affect is represented by positive adjectives
(for example joyful, active...), and the negative affect is represented by negative adjectives
(fearful, angry). In case of emotional subjective wellbeing the question is how often (not how
much) persons feel these affective reactions.
3.2 Approaches to measuring well-being
The multidimensionality of well-being can be studied in different ways, most often by
using indexes and empirical surveys using questionnaires. Some of index approaches represent
synthetic indicators relating to overall well-being situation, others relate to subjective level
only. The most famous of them are Human Development Index (HDI), introduced by the United
Nations Development Programme (UNDP), OECD Your Better Life index or Happy Planet
Index (HPI), which was introduced by the New Economics Foundation.
As for the measuring the subjective well-being through the extensive empirical studies,
there are significant differences among them resulting from the following factors:
• Scale of the study (international, national, local)
• The frequency of data collection (regular, irregular, one-time surveys)
• Form of survey (questionnaires, separate modules, question sets, diaries)
• Ways of data collection (eudaimonic, evaluative, affective)
• Timeliness of collected data (memory-based, real time)
• Technical support (printed records, telephone, SMS, website, on-line questionnaires).
The measurement of well-being is often viewed from the subjective point of view and
measured by an individual’s response to a survey question like, “All things considered, how
satisfied are you with your life as a whole these days?” The questions on subjective well-being
usually use the scale from 4 to 11 points. This type of research is represented by the European
8
Values Study (EVS), European Quality of Life Survey (EQLS), European Social Survey (ESS),
Eurbarometer and Time Use Survey (TUS).
It is the last type, the TUS, that is considered to be the most valuable. In 1972, it was
the first time it was incorporated as an indicator of well-being into the Gross National Happiness
Project of the kingdom of Bhutan (Galay, 2007). This type of research uses the questionnaire
survey (a questionnaire for the household and questionnaire for an individual) that represents
so called cognitive measuring of well-being. This is based on assessing the life satisfaction
either with the life as a whole or by individual life areas (health, family, work, income,
housing,...). The second form of the research is a diary. This enables monitoring the concurrent
feelings felt while doing specific activities in the time interval during which the activity takes
place.
The types of research that connect three basic variables, time – activity – feeling, use
the following methods:
• Systematic analyses of the relationships between time use and well-being by economists
were initiated by Thomas Juster, who used time diary data to assess levels of subjective
well-being (Juster et al. 1981). In Juster’s opinion, a summation of enjoyment ratings
(process benefits) associated with activities performed during a specified period of time
provides a more realistic valuation of subjective well-being than general questions about
life satisfaction or perceived happiness based on past recollections. Researchers
proposed to calculate process well-being benefits (PWB) as a weighted index of the
duration of activities and their level of enjoyment.
• In the 2000s, interest in using time use data for the assessment of subjective well-being
was revived by Kahneman and Krueger (2006). Kahneman and Krueger’s day
reconstruction method (DRM) used ‘experienced utility’ valuations of time diary
episodes to assess respondents’ well-being. It was more process sensitive and accurate
than Juster’s PWB, but shared with the latter the assumption that subjective well-being
9
can be calculated as a multiple of activities’ duration and their enjoyment ratings
(Zuzanek, J., Zuzanek, T. 2015).
• The truly concurrent valuation of well-being connotations of daily activities was made
possible by ESM surveys, where respondents were asked to record their feelings about
what they were doing at the very moment when they were signalled by the pager. It is,
generally, accepted that Experience sampling methods „are the gold standard for
assessing people’s affective experience. They can capture the experience in actual
moment, while the person has access to current feeling, and hence minimize problems
of recall and inference“ (Schwarz et al. 2009, p. 6).
• Another option is single question which is also intended to be used as part of a time-use
diary and is the so-called column of luck. This question should generally not be used in
conjunction with the DRM, as it is a substitute, and should be completed by the
respondent for all time-use diary activities. In the 2010 French time-use survey, the
French national statistical office, added the intensity of emotional experience as a
separate column in the time diary, asking the respondent to record "was that moment
pleasant or unpleasant” on a scale from minus 3 (unpleasant) to plus 3 (pleasant).
• The last method used for assessing well-being also uses the diary logs of the
respondents. It can be classified as an affective way of establishing the well-being
(hedonic orientation). At the end of the diary day, the respondent is asked to choose an
activity at which he experienced the most positive or most negative emotions. This
method monitors only extreme emotional states as part of the well-being.
3.3 Time diary measurement methods
One of the most use methodologies of the time-use measurement is time diary. Time-
use diaries, maintained continuously throughout a specified period, usually of 24 hours,
sometimes of two, five or seven days. There is now a substantial record of development and
10
collection of representative national, annual, time-use diary samples, by both academic
researchers and national statistical institutes
The special diaries designed for time-use studies involve the continuous registration of
an individual’s sequence of activities throughout a defined observation period. Within this
general description is a wide range of possible specifications. The approach to survey
administration itself depends in part on the answers to specific issues of instrument design:
• Does it cover the whole working day or paid work only?
• Does the diary rely on own words or on pre-coded responses?
• Does the diary use variable observation intervals (based on the start and finish times of
episodes of activity), or fixed intervals?
• Does the diary have single or multiple activity registration fields? And are these
hierarchical or parallel? The norm is to invite respondents to designate simultaneous
activities as “primary” or “secondary”
• Does the diary have additional “objective” fields registering location, co-presence and
purpose?
• Does the diary have additional “subjective” or “affect” fields registering enjoyment,
stress, rushed feelings etc?
3.4 Measuring positive and negative emotions (affect)
Time-use surveys are one of the primary vehicles for collecting information on
subjective well-being. Measures of overall happiness and life satisfaction generally capture the
evaluative component of subjective well-being. Such questions are a valuable addition to time-
use surveys, but have much wider applicability. The OECD has published a set of Guidelines
on the measurement of subjective Well-being (OECD 2013) that address how and where such
questions should be collected. While measures of life satisfaction are useful to include in a time-
11
use survey as part of the array of analytical variables, the most important output for measuring
well -being is information on positive and negative emotions (affect).
A common approach to collecting information on respondent’s subjective attitude to
different activities in time-use surveys has been to ask questions on the "most/least" preferred
activity at the end of a questionnaire. While these questions may be useful for some specific
purposes, they capture a different sort of information to questions on positive and negative
emotions in that they focus only on the activities provoking the most extreme responses. They
lack information on intensity of feeling, and they require a cognitive judgement by the
respondent that may result in responses that are different from those collected by questions
focusing more specifically on emotional state.
Broadly speaking, there are two approaches to measuring positive and negative
emotions (affect) in time-use surveys. Both of these make use of time-use diaries to link
particular emotional states to specific activities, which allows for analysis that is not possible
with more general survey questions.
The first approach is asking enjoyment questions as a field in the time use diary. For the
collection of positive and negative emotions, the respondent’s emotional state needs to be collected
alongside the event to which they relate and at the same time as the recording of the event rather
than in a separate questionnaire where the respondent is required to recall their feelings. This
approach dates back to the early 1980s. William Michelson collected a number of time use studies
in the city of Toronto, Canada, and Andrew Harvey collected a number of time use studies in
Halifax, Canada, where the diary included the fields: main activity; secondary activity; location /
mode of transport; who were you with; how much did you enjoy this activity; and how stressed did
you feel during this activity. In 1985, John Robinson and a wider USA team collected a random-
digit dialling national sample survey in the USA that included a field asking people how happy they
were during each activity. Also in the mid-1980s, Jonathan Gershuny was involved with a national
quota sample survey conducted by Unilever in the UK which also asked an enjoyment field in the
diary. One of the most recent such surveys is the French time use survey 2010.
12
Intensity of emotional experience has been added as a separate column in the time diary
which asks the respondent to record "was that moment pleasant or unpleasant” on a scale from
minus 3 (unpleasant) to plus 3 (pleasant). The scale was presented visually rather than allowing
respondents to write down their own interpretation. Sequencing may also be important in
analysing the positive or negative emotions attached to a particular event of an activity.
Emotions attached to an event may impact on the emotional response to following events or
activities; or indeed following events may occur in order to change the emotional state caused
or associated with the previous activity.
A second (alternative) approach to asking respondents to report the overall
positive/negative feelings about an activity on a single scale is to ask many questions on
different emotional states about each activity. To manage issues of respondent burden, this is
usually limited to a small number of randomly selected activities. For example, the United
States Bureau of Labor Statistics asked respondents in the American Time Use Survey (2010)
to record their emotions in three randomly selected activities. Respondents were asked about
the intensity of six emotions using a 0-6 scale: stressed, tired, happy, sad, interested, painful.
Information collected in this way is much richer with respect to each activity than a
single scale, but at the cost of collecting information on only a sample of activities. In analysing
data of this sort an episode can be considered as unpleasant if the respondent reported stronger
negative emotions than positive emotions. An “unpleasantness index” of an activity can then
be obtained as the percentage of time spent doing that activity categorized as unpleasant. This
allows for the respondent to have different "feelings" for separate episodes of the same event.
The research using well-being questions seeks to promote greater well-being, and also
to reduce harm and suffering. Negative daily experiences are associated with negative overall
outlook, but negative experiences have separate drivers and mitigators. Activity level affect
data inform understanding of what factors in the day make some experiences particularly
unpleasant for certain groups of people and how we can alter circumstances of daily experience
to reduce the negativity of these experiences.
13
4. Time diary and Well-being research during Covid-19 pandemic
Covid-19 pandemic is not only linked with health issues of world population (Douglas
et al., 2020; Tandon, 2020; Weerahandi et al., 2021), but also with crisis in various areas aspects
of the word, however, mostly with the economic crisis. Economic crisis associated with Covid-
19 includes, but is not limited to crisis/decline in tourism (Jones and Comfort, 2020; Radic et
al., 2020), negative effects on consumption (Martin et al., 2020; Piyapromdee and Spittal,
2020), households ‘income and wealth reduction (Hanspal et al., 2020; Zabai, 2020), decrease
of global and international trade, linked also with growing economic nationalism and
protectionism (Vidya and Prabheesh, 2020; Jackson et al., 2020; Gruszczynski, 2020; Albertoni
and Wise, 2021), entrepreneurial uncertainty (Brown and Rocha, A., 2020; Cowling et al.,
2020) leading to bankruptcies (Banerjee et al., 2020; Wang et al., 2020). Most of these negative
effects of Covid-19 pandemic are, in various aspects, linked with employment, labour markets
and relations between the employers and employees.
One of the areas influenced by the Covid-19 pandemic is also personal perception of
various aspects, that we can summon under the subjective well-being. Linking to the possible
methods of subjective well-being measurement, strengthening the interconnection of time –
activity – feelings, we focus on the research of well-being during the pandemic period by the
means of time diary.
4.1 So-far research of well-being under Covid-19 pandemic
Most of the research focusing on various aspects of SWB during the Covid-19 pandemic
were realised in China. Wang, et al. (2021) analysed well-being of adolescents. They asked
respondents to fill information for consecutive 14 days, from 5 morning to 12 midnight. To
record the information, respondents could use their cell phones, tablets, or computers. Emotions
14
of adolescent respondents were measured based on Positive and Negative Affect Scale for
Children (PANAS-C). Positive affect included four items (grateful, energetic, happy, hopeful);
negative affect included other three items (sad, anxious, depressed). Adolescents reported their
mood during the past 24 h on a 5-point scale from 1 (not at all) to 5 (extremely).
Jiang (2020) researched 231 Chinese participants, who were recruited through
advertisements posted on a university platform and on social media and with the assistance of
community volunteers. Participants were asked to fulfil an online survey, using the
Wenjuan.com online survey system. Participants fill in the data to daily diary for 14 consecutive
days. URL link to the online daily questionnaire was sent to the participants around 6 p.m. each
day to remind them to complete the daily questionnaire. Questionnaire included questions about
daily subjective health, daily actual affect, and daily stress related to COVID-19. To motivate
participants to fulfil data for all 14 days, participants get a remuneration - supermarket coupon
valued at US$25.
In European conditions, there are only few research focusing on well-being during the
Covid-19 pandemic. Schmidt, et al. (2020) analysed well-being of school-aged children in
Germany. Research took place between 28th of March and 27th of April 2020. Parents of
school-aged children fill in an online 21-day diary. Authors used specific methodology adjusted
to Covid pandemic (PACO study; Psychological Adjustment to the COVID-19 pandemic).
Online questionnaires were distributed via soscisurvey.de. To ensure the suitable research
sample, pre-research stage included recruitment of the potential participants. Enrolment for the
study was between March 27, 2020 and April 3, 2020. After the registration, participants were
asked to fulfil the daily questionnaires for the following 21 days. E-mails containing the link to
the daily questionnaire were sent out at 7 pm each day and participants were requested to
complete the survey before going to bed. As an remuneration for the participation in the
research participants were offered 50€ voucher. To measure the affective well-being,
researchers used eight emotional states during the day (afraid, angry, sad, worried, happy,
cheerful, balanced, and relaxed), on a 7-point Likert scale from 1 = “not at all” to 7 = “very”.
15
Daily parental positive affect was calculated as average of the four items – happy, cheerful,
balanced, and relaxed; daily parental negative affect was calculated as the average of the items
afraid, angry, sad, and worried.
As our project focusses on the well-being of university teachers, we describe also so far
researches linked with university environment. Hagedorn, et al. (2021) researched students at
the university in Appalachia, recruited via email through the university listserv. Each student
got an email with the description of the study and a link to the Qualtrics platform. The study
was realised from early March to late April 2020. Those students who had not completed the
survey receive three reminder emails. Within the research, they analysed wild areas
(questionnaire included 161-items), part of them focused also on SWB (affective such as
feelings of isolation, stress, fear of illness, and cognitive, such as loss of income, increased
expenses, access to lab and equipment, etc.).
The only so far research focusing at least partly on university teachers was research of
Wood, et al. (2021). Participants: UNI 1 - 784 responded (out of 3900 staff members, recruited
through a general email), UNI 2- 390 respondents (out of4950 staff members, recruited through
staff newsletter). The research included two four-week diary studies conducted in two English
universities (the first round in spring, the second round in autumn 2020). All staff of the
university (teachers as well as non-pedagogical staff) were involved in the study. The research
was based on a one-week interval for the diary as the pattern of employees’ work and non-work
activities reflect a seven-day cycle. The main goal of the research was to concentrate
specifically on the effects of the changing location of work and the issues of home working.
Within the research, both general mental well-being (covering eudemonic elements of well-
being, personal growth and the purposefulness of life), and hedonic well-being (expressed by
two dimensions: anxiety–contentment and depression–enthusiasm) were analysed.
16
4.2 Methods of data collecting during Covid-19 pandemic
Collecting data under Covid-19 pandemic is challenging. As it is recommended to keep
a social distance, the standard form of face-to-face interview is not possible (face-to-face
interview is one of the common instruments to collect time diary data). To find an inspiration
for our research and project, we checked the instruments that other researchers used for
collecting either time allocation or well-being information during Covid-19 pandemic.
We can divide the most common instruments for data collection during Covid-19 into
three groups:
1. Phone survey, with the support of state institutions
Asanov, I. et al. (2021) interviewed 2412 students in Ecuador. Each phone call took app.
20 min. The survey took 60 survey days. Students were asked to complete detailed 24-hour
time use questionnaire based on the American Time Use Survey. Interviewers recall students´
activities from 4 a.m. the previous day to 4 a.m. on the interview day, in half hour intervals.
Students could select from 24 pre-coded activities developed during pre-testing, plus a code for
other activities. Pre-coded activities included sleeping, working (which includes working in a
household business, working in another job for pay, and looking for work), household tasks
(meal preparation, cleaning, laundry, grocery shopping and looking after younger siblings),
educational activities (reading books and magazines, viewing educational content, learning
college options, and doing homework and teacher exercises), and leisure activities (watching
tv, playing musical instruments, practicing a hobby or sport, hanging out with friends in person
or online, and surfing the internet).
2. Online platform survey
Cellini et al. (2020) realised a research in Italy, using the anonymous online survey
shared via social media. The questionnaire was available on social media for 5 days period. In
total, they obtained responses from 1,310 young adults. Their questionnaire focused on the
17
frequency of particular activity (focused on digital media activities, in total 10 digital media
activities).
3. Through a well-reputed online survey company
Andrew et al. (2020) realised research in the UK, via the survey company. Survey
company collected data from 5582 participants (parents living with children). Survey was
realised in April – June 2020, by telephone call; median completion time was 22 minutes. To
motivate the participants to follow the instructions of interviewers and to provide required data,
participants got a small payment in compensation. Participants were asked to fulfil the Time
use diary, with a day divided by one-hour slot. Respondents could report multiple activities
during the hour. Activities were pred-defined (however, more broadly than they are in standard
TUS). By the means of survey company, it was possible to collect 3 types of diaries (for adults,
for children aged 4 – 11, and for children aged 12 – 15).
4.3 Innovative data collection method - CaDDI
The recent global pandemic has created an upsurge in interest in the ways in which
people are using their time under conditions of lockdown and social distancing. The
requirement is for a diary instrument with an online format that can be rapidly administered,
and in which respondent burden is not too onerous. The CTUR 9-Country Click-and-Drag Diary
Instrument (CaDDI) was originally designed for deployment among an international online
market research panel covering 9 different countries. The initial aim was to fill the gap in
national comparative data on the enjoyment of different activities (the UKTUS 2015 was among
the first national-level time use diary survey to include a field asking respondents how much
they were enjoying their time throughout the day). Nine nationally comparative populations in
Europe and the USA were covered: UK; USA; France; Germany; Netherlands; Sweden;
Finland; Italy and Spain. The data was collected between November 2015 and May 2016 using
18
quotas on socio-demographic factors such as age, gender, education and employment, with a
minimum number of respondents guaranteed according to nationally representative quotas.
Each country provided over 1,000 ‘diary days’ of data, with a total sample of more than 10,000
days of data across the 9 countries, based on interviews with 6,000 respondents, most of whom
completed 2 diary days. By using the same instrument and an identical visual demonstration
video in all countries, the 9-country data is uniquely well-placed for international comparisons.
An article by the CTUR team based on this data combines location and ‘who were you with at
the time’ information to identify baseline (pre-lockdown) prevalence of ‘risky’ behaviours
likely to be associated with transmission of the Covid-19 virus in different countries (Sullivan
et. al., 2020).
5. Possible problems of online time use and WB research
Based on the above text (methodology of quantitative and qualitative research, well—
being and its measurement, and time allocation and well-being research under Covid-19
pandemic), we identify following problems and questions to solve and answer in pre-empiric
stage of our project:
1. collecting data on time allocation and well-being of university teachers is quantitative
research, which requires choosing effective method of data collection,
2. how to secure random sampling (is it even necessary?),
3. Post-hoc weighting of gathered data (is it even necessary to have representative data in case
of 4 universities?),
4. how to avoid incomplete questionnaires and time diaries (respondents do not complete
diaries, missing periods – „hole“ in the diary, missing beginning or end of day)
5. selection of day/s to include in the data collection - equal probability of selection of day,
month (pre-set days, free choice of respondent, only working days or also free days, …)
19
6. should we ask for information/activities for the whole day, or only part of the day when
respondents focused on paid work? (in the second case, we will miss free time, unpaid work,
personal care data, as well as multitasking situations)
7. what are the specific activities performed by university teachers? (which activities to include
in the questionnaire/time diary)
8. focusing only on paid activities, or also multitasking?
9. reliability of data - people do not always do what they say they do (problem mostly in
memory-based surveys)
10. which Online survey platform to use?
ACKNOWLEDGEMENT
This text is an output of IVF project no. 22110433 „Does well-being matter? Higher
education teachers during Covid-19 pandemic“. The project is co-financed by the Governments
of Czechia, Hungary, Poland and Slovakia through Visegrad Grants from International
Visegrad Fund. The mission of the fund is to advance ideas for sustainable regional cooperation
in Central Europe.
REFERENCES
ALBERTONI, N. AND WISE, C. (2021). International Trade Norms in the Age of Covid-19
Nationalism on the Rise? Fudan Journal of the Humanities and Social Sciences, 14 (1),
41 – 66. DOI: 10.1007/s40647-020-00288-1
ANDREW, A., CATTAN, S., DIAS, M. C., FARQUHARSON, C., KRAFTMAN, L.,
KRUTIKOVA, S., ... & SEVILLA, A. (2020). Family time use and home learning
during the COVID-19 lockdown (No. R178). IFS Report.
ASANOV, I., FLORES, F., MCKENZIE, D., MENSMANN, M., & SCHULTE, M. (2021).
Remote-learning, time-use, and mental health of Ecuadorian high-school students
during the COVID-19 quarantine. World development, 138, 105225.
20
BANERJEE, R. N., KHARROUBI, E. AND LEWRICK, U. (2020). Bankruptcies,
unemployment and reallocation from Covid-19. Bank for International Settlements, No.
31. Retrieved from https://ideas.repec.org/p/bis/bisblt/31.html
BROWN, R. AND ROCHA, A. (2020). Entrepreneurial uncertainty during the Covid-19 crisis:
Mapping the temporal dynamics of entrepreneurial finance. Journal of Business
Venturing Insights, 14, e00174. DOI: 10. 1016/j.jbvi.2020.e00174
CELLINI, N., CANALE, N., MIONI, G., & COSTA, S. (2020). Changes in sleep pattern, sense
of time and digital media use during COVID‐19 lockdown in Italy. Journal of sleep
research, 29(4), e13074.
COWLING, M., BROWN, R. AND ROCHA, A. (2020). Did you save some cash for a rainy
COVID-19 day? The crisis and SMEs. International Small Business Journal, 38(7), 593
– 604. DOI: 10. 1177/0266242620945102
CUMMINS, R.A. et al., 2003. Development a national index of subjective wellbeing: The
Australian Unity Wellbeing Index. Social Indicators Research, 64, 159-190. Available
on: https://link.springer.com/content/pdf/10.1023%2FA%3A1024704320683.pdf
DIENER, E. 1984. Subjective well-being. Psychological Bulletin, 95, 542 – 575.
DIENER, E. 2000. Subjective well-being: the science of happiness, and a proposal for a national
index. American Psychologist, 55, 34 – 43.
DOUGLAS, M., KATIKIREDDI, S. V., TAULBUT, M., MCKEE, M. AND MCCARTNEY,
G. (2020). Mitigating the wider health effects of covid-19 pandemic response. BMJ,
2020, 369:m1557. DOI: 10. 1136/bmj.m1557
GALAY, K. 2007. Patterns of Time Use and Happiness in Bhutan: Is there a relationship
between the two? V.R.F series, No 432. Institute for Developing Economies. Japan.
Available on:: http://www.ide.go.jp/library/English/Publish/Download/Vrf/pdf/432.pdf
GRUSZCZYNSKI, L. (2020). The COVID-19 pandemic and international trade: Temporary
turbulence or paradigm shift? European Journal of Risk Regulation, 11(2), 337 – 342.
DOI: 10. 1017/err.2020.29
HAGEDORN, R. L., WATTICK, R. A., & OLFERT, M. D. (2021). “My Entire World
Stopped”: College Students’ Psychosocial and Academic Frustrations during the
COVID-19 Pandemic. Applied Research in Quality of Life, 1-22.
21
HANSPAL, T., WEBER, A. AND WOHLFART, J. (2020). Income and wealth shocks and
expectations during the COVID-19 pandemic. CEBI Working Paper Series, No. 13/20,
Retrieved from
https://click.endnote.com/viewer?doi=10.2139%2Fssrn.3578472&token=WzI0Mzc5M
TgsIjEwLjIxMzkvc3Nybi4zNTc4NDcyIl0.jlIBPhvQqTseoVsCAu6Nr8ytYYI
JACKSON, J. K., WEISS, M. A., SCHWARZENBERG, A. B. AND NELSON, R. M. (2020).
Global economic effects of COVID-19. Retrieved from
https://search.bvsalud.org/global-literature-on-novel-coronavirus-2019-
ncov/resource/en/grc-740379
JIANG, D. (2020). Feeling gratitude is associated with better well-being across the life span: a
daily diary study during the COVID-19 outbreak. The Journals of Gerontology: Series
B
JIANG, D. (2020). Perceived stress and daily well-being during the COVID-19 outbreak: The
moderating role of age. Frontiers in Psychology, 11
JONES, P. AND COMFORT, D. (2020). The COVID-19 crisis, tourism and sustainable
development. Athens Journal of Tourism, 7(2), 75 – 86. DOI: 10.30958/ajt/v7i2
JUSTER, F. T. et al. 1981. A theoretical framework for the measurement of wellbeing. The
Review of Income and Wealth, Series, 27(1), 1–31. Available on:
https://onlinelibrary.wiley.com/doi/abs/10.1111/j.1475-4991.1981.tb00190.x
KAHNEMAN, DANIEL, KRUEGER, ALAN, B. 2006. Developments in the Measurement of
Subjective Well-Being Journal of Economic Perspectives, Volume 20, Number 1, 2006,
pp 2–24. Available on:
https://inequality.stanford.edu/sites/default/files/media/_media/pdf/Reference%20Med
ia/Kahneman_2006_Measurement.pdf
MA, S., ZENG, W., BORGES, A., XU, Y., & ZHANG, J. (2021). Emotional well-being in
COVID-19 mass quarantine: the role of personal response and life activity: a 14-day
diary study in China. Psychology & Health, 1-23.
MARTIN, A., MARKHVIDA, M., HALLEGATTE, S. AND WALSH, B. (2020). Socio-
economic impacts of COVID-19 on household consumption and poverty. Economics of
disasters and climate change, 4(3), 453 – 479. DOI: 10.1007/s41885-020-00070-3
22
OECD 2013. OECD Guidelines on the Measurement of Subjective Well-being. OECD
Publishing. Available on: http://www.oecd.org/statistics/oecd-guidelines-on-
measuring-subjective-well-being-9789264191655-en.htm
PIYAPROMDEE, S. AND SPITTAL, P. (2020). The income and consumption effects of covid‐
19 and the role of public policy. Fiscal Studies, 41(4), 805 – 827. DOI: 10.1111/1475-
5890.12252
RADIC, A., LAW, R., LÜCK, M., KANG, H., ARIZA-MONTES, A., ARJONA-FUENTES,
J. M. AND HAN, H. (2020). Apocalypse now or overreaction to coronavirus: The global
cruise tourism industry crisis. Sustainability, 12(17), 6968. DOI: 10.3390/su12176968
REPORT BY THE COMMISSION ON THE MEASUREMENT OF ECONOMIC
PERFORMANCE AND SOCIAL PROGRESS. Stiglitz, Sen, Fitoussi et al (2009).
Available on:
http://ec.europa.eu/eurostat/documents/118025/118123/Fitoussi+Commission+report
SULLIVAN, O., GERSHUNY, J., SEVILLA, A., WALTHERY, P. AND VEGA-RAPUN, M.
2020. Time use diary design for our times - an overview, presenting a ‘Click-and-drag’
diary instrument for online application. Journal of Time Use Research, 2020.
SCHMIDT, A., KRAMER, A., BROSE, A., SCHMIEDEK, F., & NEUBAUER, A. (2020).
Homeschooling and affective well-being of parents and children during the COVID-19
pandemic: A daily diary study.
SCHWARZ, N. et al. 2009. Global and episodic reports of hedonic experience. In R. Belli, D.
Alwin, & F. Stafford (Eds.), Using Calendar and Diary Methods in Life Events Research
(pp. 157–174). Newbury Park, CA: Sage.
TANDON, R. (2020). COVID-19 and mental health: preserving humanity, maintaining sanity,
and promoting health. Asian journal of psychiatry, 51(102256), 1 – 3. DOI:
10.1016/j.ajp.2020.102256
VIDYA, C. T. AND PRABHEESH, K. P. (2020). Implications of COVID-19 pandemic on the
global trade networks. Emerging Markets Finance and Trade, 56(10), 2408 – 2421. DOI:
10.1080/1540496X.2020.1785426
WANG, J., YANG, J., IVERSON, B. C. AND KLUENDER, R. (2020). Bankruptcy and the
covid-19 crisis. Retrieved from
https://papers.ssrn.com/sol3/papers.cfm?abstract_id=3690398&download=yes
23
WANG, M. T., DEL TORO, J., SCANLON, C. L., SCHALL, J. D., ZHANG, A. L.,
BELMONT, A. M., ... & PLEVNIAK, K. A. (2021). The roles of stress, coping, and
parental support in adolescent psychological well-being in the context of COVID-19: A
daily-diary study. Journal of Affective Disorders, 294, 245-253.
WATSON, D., CLARK, L. A, TELLEGEN, A. (1988). Development and validation of brief
measures of positive and negative affect: The PANAS scales. Journal of Personality and
Social Psychology, 54, 1063 – 1070.
WEERAHANDI, H., HOCHMAN, K. A., SIMON, E., BLAUM, C., CHODOSH, J., DUAN,
E., ... AND HORWITZ, L. I. (2021). Post-discharge health status and symptoms in
patients with severe COVID-19. Journal of general internal medicine, 36, 738 – 745.
DOI: 10.1007/s11606-020-06338-4
WILKINSON, D. (Ed.). (2002). The researcher's toolkit: The complete guide to practitioner
research. Routledge, 2002, 156 p. ISBN 978-0415215664
ZABAI, A. (2020). How are household finances holding up against the Covid-19 shock? Bank
for International Settlements, No. 22. Retrieved from
https://ideas.repec.org/p/bis/bisblt/22.html
ZUZANEK, J., ZUZANEK, T. 2015. Of Happiness and of Despair, Is There a Measure? Time
Use and Subjective Well-being. Springer Science+Business Media Dordrecht 2014, pp.
839-856. Available on: https://uwaterloo.ca/canadian-index-
wellbeing/sites/ca.canadian-index-
wellbeing/files/uploads/files/of_happiness_and_of_despair_is_there_a_measure-
time_use_and_subjective_well-being.pdf